the influence promotion, place and price towards...
TRANSCRIPT

1
THE INFLUENCE PROMOTION, PLACE AND PRICE
TOWARDS CUSTOMERS’ SATISFACTION
(Case: Lotte Mart Wholesale Serpong)
By:
Muhammad Iqbal Almaududi
1111081200002
DEPARTMENT OF MANAGEMENT
INTERNATIONAL CLASS PROGRAM
FACULTY OF ECONOMICS AND BUSINESS
SYARIF HIDAYATULLAH STATE ISLAMIC UNIVERSITY
JAKARTA
1439 H/2018 M

2

3

4

5
CURRICULUM VITAE
Muhammad IqbalAlmaududi (Iqbal)
Date of birth : Tangerang, October 5th 1993
Nationality : Indonesia
Address : Jl. Tongkol Raya No. 124 Tangerang, Banten
Contact : [email protected]
+62856 9494 3651
Education
20013-
Present
Northern University of Malaysia, Sintok, Malaysia
Bachelor of International Business Management; GPA: 3.06/4.0
Concentration: International Business
Relevant Courses: Strategic Management, International Business, International
Management, Human Resource Management, International
Marketing
2011-2013 SyarifHidayatullah State Islamic University, Jakarta, Indonesia
Bachelor of Economics in Management (International Class), GPA; 3.10/4.0
Relevant Courses: Marketing Management, Principles of Management, Human
Resource Management
Work Experience
September
2012-June
2013
InsanSakinah Boarding School, Tangerang, Indonesia
• Teacher of Mathematic and Sociology
• Taught student with practical experience, going to nature

6
Leadership Roles
July
2012-July
2014
TangerangYouth Forum,Tangerang, Indonesia
President
• Held leadership training and team building for 30+Tangerangteenagers
• Consolidated some youth organization into a bigger united organization
Honors and Awards
May 2014 Essay Writing Contest– Global Business Transformation, Northern
University of Malaysia, Malaysia
• Champion –Honored forfavorite essay
October
2014
Entrepreneurial Action Us (Enactus), Beijing, China
• Semi-finalist of Enactus World Cup
Volunteer Work
July 2013-
January
2015
Enactus – Back2bag Project, Kedah, Malaysia
• Empowered disabled people to get personal income
Skills and Other Information
Languages • Fluent in English, Indonesia and Malay Language
Computer
Skills
• MS-Office literacy
• Time Management, Responsibility, Adaptability
Interest • Leadership, Entrepreneurship, Sustainability, Badminton

7
ABSTRACT
This research aims to analyze the influence of promotion, place and price
towards customer satisfaction of Lotte Mart Serpong. Convenience sampling method
has been selected in order to obtain data in this research. This study uses 50
respondents and all respondents are Lotte Mart Serpong customers who shop at Lotte
Mart Serpong. The analytical method used is multiple linier regressions. The results
of this research show that promotion, place and price simultaneously have significant
influence towards customer satisfaction. Partially, promotion, place and price have
significant influence towards customer satisfaction.
Keywords: Promotion, Place, Price, Lotte Mart
8
ABSTRAK
Penelitian ini bertujuan untuk menganalisis pengaruh promosi, tempat dan
harga terhadap kepuasan pelanggan Lotte Mart Serpong. Metode convenience
sampling telah dipilih untuk memperoleh data dalam penelitian ini. Penelitian ini
menggunakan 50 responden dan keseluruhan responden adalah pelanggan Lotte Mart
Serpong yang berbelanja di Lotte Mart Serpong. Metode analisis yang digunakan
adalah multiple linier regression. Hasil penelitian menunjukkan bahwa promotion,
place dan price berpengaruh secara simultan terhadap customer satisfaction. Secara
parsial promotion, place dan price berpengaruh signifikan terhadap customer
satisfaction.
Kata kunci: Promosi, Tempat, Harga, Lotte Mart

9
FOREWORD
Bismillahirahmaanirrahim,
Alhamdulillah, my praise and gratitude to Allah SWT, the almighty creator of
the universe who always gives his grace, guidance and blessing infinite, so that I able
to finish the paper with the title “The Influence of Promotion, Place and Price toward
Customers Satisfaction” as one of the requirement for completing my Bachelor
Degree, in Management Major Faculty of Economy and Business Islamic State
University Syarif Hidayatullah Jakarta.
In the process of the preparation of this thesis, the author realized that this
thesis is far from perfect. Therefore, in this moment the author apologizes for all
mistakes that exist in this paper. In order to complete this thesis, the author gets
valuable assistance in form of material and moral from various parties. On this
occasion, with all humility there is no better word to conveyed, except sincere thanks
to:
1. My Mother Ria Rosita and my father Alfian Tanjung, who have relentlessly
gives a beautiful prayer, passion and motivation for me, especially in order to
completing my degree and finishing this paper. Without full support from
both of you I would never be able to complete this thesis.
2. Dr. M. Arief mufraini, Lc., Msi., as the Dean of Faculty Economic and
Business of UIN Syarif Hidayatullah.
3. Leis Suzanawati, SE, M. Si as my thesis supervisor, thank you for your
advice, knowledge and time that you have shared to me.
4. All the lecturers who have taught me patiently, hopefully what they have
given to me are replaced with endless bless from Allah SWT almighty and all
staff UIN Syarif Hidayatullah Jakarta, a lot of thanks for Mr. Mardani Bonyx
and Mr. Sony that have provided me with a lot of information and all support
to complete my study.

10
5. All my friends from International Management 2011, Azmy Azizah,
Ayatullah Albanna, Fatimah Az-Zahra, Zainab Al-Ghazali, Zian, Rozi, Vidro,
Maulidan, Uji, Rendy, Ima and Balgis. To all of my friends from International
Accounting 2011, Natan, Siti, Dian, Depe, Ilma, Sinta, Maya, Arif, Taufik,
Erwin, Didit, Yusuf. Thanks for all memorable moment that cannot be
replaced.
Finally, the author expect for any critics as well as suggestion that could improve
the content of this thesis. Hopefully this thesis could be worthwhile for all of us.
Aamiin.
Jakarta, 25 Mei 2018
(Muhammad Iqbal Almaududi)

11
LIST OF CONTAINS
ACCEPTANCE LETTER………………………………………………………….i
CERTIFICATION OF THESIS EXAM…………………………………………..ii
CERTIFICATION OF COMPREHENSIVE EXAM…………………………….iii
AUTEHENTICITY SCIENTIFIC WORK STATEMENT………………………iv
CURRICULUM VITAE…………………………………………………………..v
ABSTRACT……………………………………………………………………...vii
ABSTRAK………………………………………………………………………viii
FOREWORD……………………………………………………………………..ix
LIST OF CONTAINS……………………………………………………………..x
LIST OF FIGURES…………………………………………………………………
CHAPTER I INTRODUCTION
A. Background………………………………………………..1
B. Problem Definition………………………………………...3
C. Research Objectives……………………………………….3
D. Benefit of Research………………………………………..3
CHAPTER II LITERATURE REVIEW
A. Theory Development
1. Promotion………………………………………….6
2. Place……………………………………………….8
3. Price………………………………………………10
4. Customer Satisfaction……………………………12
B. Previous Research………………………………………..13

12
C. Logical Framework………………………………………20
D. Hypothesis………………………………………………..21
CHAPTER III RESEARCH METHODOLOGY
A. Scope of Research………………………………………..22
B. Sampling Method………………………………………...22
1. Population………………………………………..22
2. Sample…………………………………………....23
C. Data Collection Method
1. Primary Data……………………………………..24
2. Secondary Data…………………………………..26
D. Data Quality Test
1. Validity Test……………………………………...27
2. Reliability Test…………………………………...27
E. Classic Assumption Test
1. Normality Test…………………………………...28
2. Multicollinearity Test…………………………….29
3. Heteroscedascity Test…………………………….30
F. Determination Coefficient………………………………..30
G. Hypothesis Test
1. F-test……………………………………………...31
2. T-test……………………………………………..32
H. Multiple Linier Regression Analysis………………….....34
I. Research Variable Operation…………………………….35
CHAPTER IV ANALYSIS
A. General Overview………………………………………..34
B. Lotte Mart Wholesale Logo……………………………...35
C. Lotte Mart Vision and Mission…………………………..35

13
D. Analysis and Discussion…………………………………37
1. Validity Test Result………………………………37
2. Reliability Test Result……………………………38
E. Descriptive Analysis Discussion…………………………40
F. Classical Assumption Test
1. Normality Test…………………………………...47
2. Multicollinearity Test…………………………….49
3. Heteroscedasticity Test…………………………..50
G. Multiple Linier Regression Analysis…………………….51
H. Coefficient of Determination…………………………….53
I. Hypothesis Test
1. T-test……………………………………………..54
2. F-test……………………………………………...56
J. Analysis…………………………………………………..57
CHAPTER V CONCLUSION AND RECOMMENDATION
A. Conclusion………………………………………………..59
B. Recommendation
1. For Company……………………………………..60
2. For future research……………………………….61
REFERENCES…………………………………………………………………...62
LIST OF APPENDICES…………………………………………………………63

14
CHAPTER I
INTRODUCTION
A. Background of the Study
Retail companies has recently become a hot topic in several media in
Indonesia. One of them reported by tribunnews.com, they mention the retail company
has begun to expand outside of Java. The rise of retail businesses enabled
entrepreneurs to expand outside of Java. It became a way to expand the distribution
channels for the company.
One of them is Lotte Mart Indonesia. One of the largest retail company in
Indonesia will open soon a new outlet in some areas on 2016. At the end of
December 2015, Lotte Mart Indonesia already has 41 outlets. 14 outlets Hypermarket
concept, 25 outlets Wholesale concept, and 2 outlets Supermarket concept.
In tribunenews.com also, M. Yudi (Marketing Director Lotte Mart) said that
the type of wholesale outlets still account for the largest contribution to this company,
that is 70 % of total sales. These numbers show thatoutlet Wholesale has a power
sales higher than other outlets. Plus, Wholesale outlets have so many business
partners. Business Partners who maintained a membership system to facilitate the
spread promotion by Lotte Mart.Usually, being customer Lotte Mart Wholesale is,
people who perform Business to Business (B2B).
One of Lotte Mart Wholesale is very well known in Java that is Lotte Mart
Wholesale in Alam Sutera Serpong.Lotte Mart Serpong is the seventh of outlet

15
wholesale in history of this company. Lotte Mart Serpong, has 40,000-50,000
potential members, ranging from merchant retail stores, hotels, restaurants, caterers,
cafes, as well as office supplies and other institutions. Lotte Mart Wholesale outlets is
very beneficial for business partners engaged in the B2B (Business to Business). In
order to fulfill business partners need, Lotte Mart Serpong provide quality products at
competitive prices. So that could help, serve, and to develop the small and medium
entrepreneurs (small and medium enterprise) in Serpong.
But, the authors need to explore further, regarding the existence of Lotte
Mart Serpong. Because the business world is very tight competition. Then the author
interviewed Mrs. Arlinawati as Admin Goods Receiving at Lotte Mart, producing
some things that need to be listened to. First, Lotte Mart feel very match, even felt
there was one level below Indogrosir for Tangerang area. Second, the cause of Lotte
Mart under Indogrosir is, because Lotte does not have a good pricing strategy, and
also a way of promotion unnoticeable even rare than Indogrosir. Then finally, about
Place. Lotte Mart serpong is in the middle of a residential, which they are the end
consumer. Unlike the Indogrosir which is close to the merchants who will sell the
goods back. The writer needs to investigate price, promotion and place is an obstacle
for Lotte Mart Serpong today.
Departing from the above description, the phenomenon of the outlet
Wholesale marketing mix, it becomes increasingly important to note. Therefore, the
title of this study is "The Influence of Promotion, Place and Price toward
Costumers' Satisfaction".

16
B. Problem Definition
Based on the background above, this research has the formulation of the
problem as follows:
1. Does promotion influence customer satisfaction?
2. Does place influence customer satisfaction?
3. Does price influence customer satisfaction?
4. Do promotion, place and price influence customer satisfaction
simultaneously?
C.Objectives of the Study
To be more specific, the study was undertaken in order to:
1. To analyze the influence of promotion to customer satisfaction.
2. To analyze the influence of place to customer satisfaction.
3. To analyze the influence of price to customer satisfaction.
4. To analyze the influence of promotion, place and price to customer
satisfaction simultaneously.
D. Benefits of the Study
This research will provide the following benefits:
1. For the Universities
Results of research for the University, could increase the library
collections of UIN Syarif Hidayatullah Jakarta as study materials as
well as a comparison of research in the future to similar problems.

17
2. For the Company
The results of this study are expected to be used as consideration for
the company's management in setting the company's policy for the
foreseeable future, so that the sales target is expected to be achieved
with the right strategy.
3. For the Research
The results of this study are expected to be useful for
researchers to increase knowledge about the factors that
influence customer satisfaction.
4. For further research
As additional reference materials in reviewing issues related to
promotion, place, price and customers’ satisfaction.

18
CHAPTER II
LITERATURE REVIEW
A. Theory Development
This chapter will be focusing on understanding the definition and theory
which are related with the research. And continue with the elaboration of the
influence of Promotion, Place and Price towards customer satisfaction.
1. Marketing Mix (4P’s)
Marketing is a set of steps that deliver value that could be remembered
by customers and can create a relationship with customers as well as
providing benefits to the organization (Armstrong & Kotler, 2011).
Marketing mix is part of an effective marketing strategy if a company
would like to market its products through 4 important elements which are
product, price, place, promotion (Kotler & Keller, 2009).
Bay, Petrizzi & Gill (2008) confirmed that when organizations apply
marketing mix in their business, it will help to increase sales and profits of
their organization, hence, achieving their marketing target. Elements in
marketing mix; namely, product, price, place, and promotion (4P's) are the
controllable tools that will contribute to customers’ satisfaction (Shankar &
Chin, 2011, Sable 2013).

19
a. Promotion
According to Kotler and Armstrong (2012:76), “promotion means
activities that communicate the merits of the product and persuade target
customers to buy it”
According to Rangkuti (2010), "promotion is the sales and marketing
activities in order to inform and encourage demand for products, services,
and ideas of the company by influencing consumers in order to purchase
the products and services produced by the company."
According to Rangkuti (2010), in general promotional activities must
base the following objectives:
1) Behavior modification
Promotional activities aimed at trying to change consumer
behavior by creating a good impression of the product and encourage
the purchase of products by consumers, so that consumers who do not
receive a product of would be loyal to the product.
2) To inform
Promotional activities are to provide information regarding
price, quality, and terms of buyers, usability and distinctive product to
the market that is intended to assist consumers in making the decision
to buy.

20
3) To persuade
Promotional activities that encourage and encourage consumers to
purchase a product offered. Companies prefer the creation of a positive
impression to consumers for a promotion may affect the behavior of
shoppers in a long time.
4) To remind
Promotional activities that are reminiscent of this is done to maintain
the brand product in the heart of the community, and retain buyers
who will make purchases on an ongoing basis.
In the promotion, there is promotional mix. According to Kotler
(2012: 432), Promotion mix is the specific blend of promotion tools that the
company uses to persuasively communicate customer value and build
customer relationships. The promotional mix consists of five (5) promotional
tools, namely:
1) Advertising, namely all forms of presentation, and promotion of non
personal paid by sponsors to present their ideas, goods or services.
Advertising is regarded as the image management that aims to create
and nurture creativity and meaning in the minds of consumers. Form
of promotion that are used include audio visual, brochures poster,
billboard, and other forms.

21
2) Sales promotion, short-term incentives to encourage the purchase or
sale of a product or service. Form of promotion that is used includes
discounts, coupons, displays, demonstrations, contests and events.
3) Personal selling, which is personal presentation by salesperson with
the aim of generating sales and building relationships with consumers.
Form of promotion that are used include presentations, trade shows,
and incentive programs.
4) Public relations, namely to build a good relationship with various
public companies in order to obtain favorable publicity, build a good
corporate image, and handling or straightening rumors, stories, and
events that are not profitable. Forms of promotion that are used
include press releases, sponsorships, special events, and web pages.
5) Direct marketing, which is direct connection with the target consumer
for the purpose of obtaining an immediate response and cultivate
lasting relationships with consumers. Forms of promotion that are used
include catalogs, telephone marketing, kiosks, internet, mobile
marketing, and more.
b. Place
According to Kotler & Armstrong (2006), defined place or distribution
as a set of interdependent organizations involved in the process of making
a product available for use or consumption by consumers. The concept of

22
place is related to the availability of a product to a customer (Armstrong &
Kotler, 2006).
According to Tjiptono (2008), defined place is where the company
operates or where the company to produce goods and services in terms of
economic importance. Affordability location and smoothness access
should be considered.
Distribution includes all activities by the company to create a product
may be obtained and made available to target consumers (Kotler, 2000).
There are three main aspects relating to the decisions of the distribution.
These aspects are:
1) Transportation systems, including in the transport system or
transport, among others, the decision on the selection tool (ships,
trucks), the determination of the delivery schedule, determining the
route that must be taken, and so on.
2)The storage system, the storage system, the marketing department
must determine the location of the warehouse, the type of equipment
used to handle material and other equipment.
3)Selection of distribution channels, regarding decisions about the use
of the distribution (wholesalers, retailers, agents) and how to establish
good cooperation with the dealer (Cravens, 1999).

23
Figure 2.1
Common Channels of Distribution
Source: Cravens (1999)
c. Price
Price is the value that is charged against the service or product
provided to a customer. Price impacts significantly on customer’s
psychology and helps to decide to repurchase a product (Kotler, 2008).
Price can be stated as the actual or rated value of a valuable product which
is up for exchange; some define it as amount of money paid for product
(Kotler, 2005).
Pricing objectives should be derived from overall marketing
objectives, which in turn should be derived from corporate objectives. The
most common pricing objectives include achieving a targeted return on
investment and market share, stabilizing of price and margin, and meeting

24
or preventing competition. In addition, the success or failure of a business
can hinge upon how pricing decisions integrate with the firm’s cost-
marketing strategy, business condition, demand, product variables,
channel distribution and general resources (Peter & Donnelly, 2008).
Price is a major factor behind satisfaction & product loyalty because a
customer carefully perceives if he is getting the most benefit from the
product against his spending (Peter & Donnely, 2007).
According to Kotler & Amstrong (2012) in research Rosvita Lembang
(2014: 36), indicators of price are:
1) Suitability prices with quality of products. Before buying,
consumers will see the price in advance. And at that moment,
consumers would think about the prices offered have compatibility
with the product to be purchased.
2) Price list is information regarding the price of the products offered
in order for consumers to consider buying.
3) Special discounts, provided by the company to the consumer at the
time of a particular event.
4) Perceived price, which is customers' perception of the price
received (whether high, low or fair).

25
d. Customer Satisfaction
Referring to Schiffman & Kanuk (2004), customer satisfaction, in
business term, is a measure of how products and services supplied by a
business organization meet or surpass customer expectation.
Hill (2007), describes the keywords of a customer satisfaction,
satisfaction is a label that is best suited to determine the level of feelings and
attitudes about a customer experience that happened to an organization. Thus,
customer satisfaction can be said to be a response or label owned by a
customer as an assessment of a product / service with a comparison between
expectations and experience.
Customer satisfaction is important for the company. Consumers who
are satisfied, is shown through his attitude, after consumers acquire and use
products and / or services (Mowen and Minor, 2002). Consumer satisfaction
can be attributed to consumer expectations. Consumer satisfaction is felt at
least give the same results or exceed consumer expectations. Therefore, it is
very important for companies to consider the factors that affect customer
satisfaction (Mowen and Minor, 2002).
According to Kotler (2009), customer satisfaction can be measured in
several ways, satisfaction can be measured by asking directly to consumers by
using a scale and the other way is to ask respondents to make a list of the

26
problems faced and make the suggested list for improvement. The indicators
used to measure customer satisfaction according to Kotler (2009) are:
1) Quality given according to the promise
2) Good service and give satisfaction for consumers.
According to Irawan (2008: 9), indicators of customer satisfaction are:
1) Overall service satisfaction
2) Recommending to another customer
3) Will buy / use the services again
B. Previous Research
The following description of previous research that became the foundation of
this research:
Table 2.1
Previous Research
Researcher Research Title Research Result
Sampurnaningtyas (2003) "Analysis of the influence
products, distribution
channels, promotion, and
price toward customer
satisfaction (Tobacco
The results of the study,
there was a strong influence
on the product, place,
promotion and price to
customer satisfaction.

27
Products Djarum)" That's why a lot of people
who bought cigarettes from
the Djarum company.
Lim (2005) “The Influence marketing
mix toward customer
satisfaction in XL Prepaid
cards”
The results of the research,
promotion and pricing in
the telecommunications
business is a variable that is
a strong influence on
customer satisfaction.
Darmayana (2005) "Analysis of marketing mix
factors that influence
consumer satisfaction
homebuyers upper-middle
type, in Ngaglik, Sleman"
Marketing mix factors
simultaneously and
partially have a significant
influence on customer
satisfaction homebuyers.
And also, the promotion
and the price variable is a
variable that has dominant
influence on customer
satisfaction.
Ferdinand (1999) "Analysis of Marketing Mix The result is variable

28
Influencing Purchasing
Decisions Automotive
Lubricants Brands
MesranPertamina Prima in
Yogyakarta"
product, price, distribution
channels, and promotional
influence purchasing
decisions automotive
lubricants brand
pertaminaMesran in D.I.Y
individually and together
are very significant and
have a positive direction
and variable products all
have the most dominant
influence in influencing
purchasing decisions.
Tony Wijaya and Lita
Irawati (2004)
“Research on influence
perceptions of service
quality and customer
satisfaction toward purchase
decision”
The result is obtained the
conclusion that Service
Quality perception and
satisfaction together
significantly influence to
purchase intention and
Service Quality Perception
are influential significant

29
to purchase intention.
Tugiono (2002) “Analysis of Influence
Marketing Mix Against
Decision to Purchase Fast
Food Products
Mcdonald's in Surakarta”
The result is product
variable, price, channel
distribution, and
promotion affect fast food
purchasing decisions
McDonald's in Surakarta
individually and
collectively significant and
have all positive direction
and promotion variable
has the most dominant
influence on purchasing
decisions and is
appropriate
with an early assumption
of the hypothesis
Mustikasari (2000) “Analysis of Marketing mix
PITI user satisfaction and
consumer focused
The result is research that
PITI and user satisfaction
consumer focused

30
Information” information is influenced
by product and factors
price.
Natalia (2005) “Analysis of Factors
Affecting Customer
Satisfaction of Membership
Card Kafe Excelso at Plaza
Tunjungan Surabaya”
The result is There are 5
(five) factors that influence
customer satisfaction card
holder of Excelso Card at
Plaza Tunjungan -
Surabaya. Among the five
factors, the dominant
factor affecting customer
satisfaction of card holder
of Excelso Card's café at
Plaza Tunjungan-Surabaya
is the situation factor,
because it gives the
biggest influence
(contribution) that is
14,182%. Conversely, the
factor that has the least
influence among the five

31
factors is the factor of
product quality with a
contribution of 8.644%.
Widya Budi (2006) "Analysis the influence
marketing mix towards
consumer satisfaction, Case
study Alfamart Serang"
Marketing mix factors
simultaneously and
partially have a significant
influence on customer
satisfaction. And also, the
promotion and the price
variable is a variable that
has dominant influence on
customer satisfaction.
Yuliarmi (2007) "Analysis factors that affect
customer satisfaction on
service PDAM Denpasar"
The result is customer
satisfaction of PDAM
Kota Depasar is measured
based on the continuity of
water is in the category of
low satisfaction level, the
water meter record is in
the category of medium

32
This research same goes to Sampurnaningtyas research on 2003, which different on
object and time of research. Where Sampurnaningtyas object is Tobacco Djarum on
2003, but this research on Lotte Mart Serpong on 2018.
satisfaction level, the
payment location is in the
category of high
satisfaction level and the
speed of complaint
handling is in the category
of low satisfaction level.

33
C. Logical Framework
Figure 2.2
Lotte mart
“The Influence Promotion, Place and Price towards
Customers’ Satisfaction”
Independent
Variable
X1: Promotion
X2: Place
X3: Price
Dependent Variable
Y: Customer
Satisfaction
Data Quality Test
1. Validity Test
2. Reliability Test
Classic Assumption
1. Normality Test 2. Multicollinearity Test
3. Heteroscedascity Test
Hypothesis Test
1. F – Test
2. T – Test
Multiple Linier Regressions
Coefficient of Determination
(Adjusted R2)
3. F – Test
4. T – Test Conclusion
Recommendation
5. F – Test 6. T – Test

34
D. Hypothesis
From the explanation concern with this research, hypothesis can be
formulated as follows:
Ha1 : Promotion doesn’t influence customer satisfaction.
H01 : Promotion influences customer satisfaction.
Ha2 : Place doesn’t influence customer satisfaction.
H02 : Place influences customer satisfaction.
Ha3 : Price doesn’t influence customer satisfaction.
H03 : Price influences customer satisfaction.
Ha4 : Promotion, Place and Price don’t influence customer
satisfaction.
H04 : Promotion, Place and Price influences customer satisfaction.

35
CHAPTER III
RESEARCH METHODOLOGY
A. Scope of Research
This research is empirical study of research testing to prove the
influence of promotion, place and price toward customers’ satisfaction. Scopes
of research for this study are as follows:
1. The focus of the author in this study is the influence of promotion,
place and price toward customers’ satisfaction.
2. The location and the objects to be examined are the customers of
Lotte Mart Serpong that located in Alam Sutera Serpong period
July 2016.
3. For the purpose of the study, researcher employs customers’
satisfaction (Y) and promotion (X1), place (X2) and price (X3)
B. Sampling Method
1. Population
The population of this study covers the customers of Lotte Mart
Serpong wholesale market. The reason why researcher chooses this population
because the researcher wants to know the influence of promotion, place and
price toward customers’ satisfaction of Lotte Mart Serpong.
A population is the aggregate of all the elements that share some
common set of characteristics and that comprise the universe for the purpose of

36
marketing research problem, (Maholtra, 2004). Population is the generalization
which consists of object and subject of a certain quantity and characteristics
applied by researchers to learn and then drawn the conclusion Population is
subject or object which have certain qualities and characteristics are
determined by researcher. Thus, the population is not only people but also
objects or other natural objects. Population also not only quantity, but includes
all of characteristics’ subject or object (Sugiyono, 2011).
This research taken the object to fill the questionnaire are the vendor
who purchase their goods from Lotte Mart Serpong.
2. Sample
Sample is a subgroup of the elements of the population selected for
participation in the study (Maholtra, 2009). According to Cooper (2007)
convenience sampling is non probability sampling where researcher use any
radial available individuals as participants.
Samples are selected using non probability convenience sampling by
means of sample units drawn easily be reached anywhere and anytime, is not
troublesome to measure and cooperative (Hamid, 2007).
Sample is a subject of the population that should represent that entire
group. Or the sample is a subset of the population, and the sample unit pertains
to the basic level of investigation (Burns, 2005).A sample is a member of the
selected population using a specific procedure that is expected to represent its

37
population (Sugiyono, 2007).
The researcher takes 50 samples respondent, because according to
Sugiyono (2010:74) guidelines to determining sample are as follows:
a. Sample size should be between 30-500 elements.
b. In the multivariate research (multiple linear regressions) the sample
size should be several times larger (10 times) than the number of
variables to be analyzed.
c. A simple experiment for research, with strict controls, sample size
between 10-20 elements.
C. Data Collection Method
Types of data being used in this research are both of primary and
secondary data.
1. Primary Data
Primary data are originated by a researcher for the specific purposes of
addressing the problem at hand (Malhotra, 2004). According to Sugiyono
(2007) Primary data is data collected by the individual / organization directly
from the object under study and for the sake of the study in question to the
form of questionnaires, interviews, observation.
Primary data was collected through questioner. According to Malhotra
(2004) questioner is a structured techniques for data collection that consist of a
series of questions, written or verbal, that a respondent answers. Questioner
method is technique data collections that had been done with give a set of

38
questions or written statement to the respondent to be answered (Sugiyono,
2007).
Beside questioner, there is other way to collecting primary data that is
interview. Interviewing is a technique of data collection conducted through
face to face and question and answer directly between the data collector and
researcher of the resource or data source (Sugiyono, 2007).
According to Sugiyono (2007), the interview is divided into structured
and unstructured interview.
a) Structured interviews means that researchers have to know exactly
what information that want to be extracted from the respondents that
the list of questions has been made systematically. Researchers can also
use tools tape recorder, camera pictures, and other materials that can
help smooth the interview.
b) Unstructured interviews are free interview, the researchers did not use
the interview guides which contain questions to be asked specifically,
and only contains the key points problem to be excavated from the
respondents.
This study used a Likert scale that is consists of five level. Likert scale
is widely used a rating scale that requires the respondents to indicate agreement
and disagreement with each of a series statement about the stimulus objects.
Typically, each scale item has five response categories, ranging from “strongly
disagree” to “strongly agree” (Maholtra, 2004).

39
Likert scale is to measure attitude, opinion, and perceptions of
individuals or groups social phenomena (Riduwan and Engkos, 2008). The
Likert Scale of five levels to express the attitude of the respondents’ answer is
as follows:
Table 3.1
Likert Scale of Five Levels
(Malhotra, 2004:258)
No Range Weight
1 Strongly Agree (SA) 5
2 Agree (A) 4
3 Neutral (N) 3
4 Disagree (D) 2
5 Strongly Disagree (SD) 1
2. Secondary Data
Secondary data is data that is not cultivated himself was collected by
researchers. Secondary data in this study are obtained from the literatures
books, scientific journals, internet and mass media research reports associated
with this research. Secondary data is the result of studies done by others and
for different purpose than the one for which the data are being reviewed
(Cooper, 2006:89).
According to Malhotra (2004) data is collected for some purpose other
than the problem at hand. In the development of this study research, techniques
of taking secondary data will be used are:

40
1) Library Study, done for collecting the data with information
through reference books, journals, and other information which
suitable according to this study.
2) Website of Lotte Mart Indonesia to take the information about
the company.
D. Data Quality Test
1. Validity Test
Validity is a characteristic of measurement concerned with the extent
that a test measures what the researcher actually wishes tool reflect true
differences among participants drawn from a population (Cooper, 2006).
According to Ghozali (2005) the validity of this research is used to measure the
legality of a questionnaire.
To get the primary data, the researcher distribute questionnaire to the
respondents. A question considered as valid if the value of each question or r-
count is positive and greater than r-table. In this research the researcher use 30
respondents as a sample to assess the validity of all the questions.
Regarding the formulation, researcher use formulation of df = n-2, so 30-2 =
28 and got the value of 0.361 as r-table.(Ghozali, 2013: 52-53)
2. Reliability Test
Reliability is a characteristic of measurement concerned with accuracy,
precision, and consistency; a necessary but not sufficient condition for validity

41
(if the measure is not reliable, it cannot be valid). Reliability is concerned with
estimates of the degree to which a measurement is free a random or unstable
error (Cooper, 2006).
Reliability refers to the extent to which a scale produces consistent
results if repeated measurements are made. Therefore, reliability can be
defined as the extent to which measures are free from random error (Maholtra,
2006).
Meanwhile, reliability test used to test the consistency of data in a
certain period of time and the extent to which a scale produces consistent result
if repeated measurements are made on the characteristic. The value of variable
reliability demonstrated by the Cronbach Alphacoefficient. A variable is said
to be the Alpha Cronbach coefficient of Reliability when > 0.70, means that
this instrument can be used as a reliable data collector with relative
measurement result if repeated measurements are made. In the other word, we
can say that this reliability test purposes to see the data consistency (Ghozali,
2013:48).
E. Classic Assumption Test
1. Normality Test
Normality test aims to test whether the regression model, the dependent
variable (customer satisfaction) and independent variables (promotion (X1),
place (X2) and price (X3)) both have a normal distribution or not. If the

42
distribution of the residual values cannot be considered to be normally
distributed, then it is said there are problems with the normality assumption.
According Ghozali (2006), the principle of normality can be detected
by looking at the spread of the data (dots) on the diagonal axis of the graph
probability plots or by looking at the histogram of the residual.
Basis for decision making as follows:
a. Detection of the histogram, if the normal curves in the graph
follow a bell shape, then the data are normally distributed.
b. While the detection of the normal probability plot on the graph, if
the data (dots) spread around the diagonal line, and follow the
direction of the diagonal line, then the regression model to meet
the assumption of normality. If the spread of the data (points) do
not follow the direction of the diagonal, then the regression model
did not meet the assumption of normality. This statistical test that
can be used to test the normality of the residuals is a statistical test
of non - parametric Kolmogorov-Smirnov (KS) (Ghozali, 2006).
Basis for decision making, when the value of the Kolmogorov
Smirnov significance greater than 0.05, it can be said to be
normally distributed data. If the valueof the significance of the KS
test is smaller than 0.05, it can be said the data was not normally
distributed.

43
2. Multicollinearity Test
According to Ghozali (2006), multicollinearity test aims to test whether
the regression model found a correlation among the independent variables
(promotion (X1), place (X2) andprice (X3)). Good regression model should not
happen correlation among the independent variables (promotion, place and
price), If among the independent variables correlated with each other, then
these variables are not orthogonal. To detect the presence or absence of
multicollinearity among the independent variables in regression model, it can
be seen from Tolerance and VIF value. Cutoff value commonly used to
indicate whether there is multicollinearity or not is Tolerance value >0.1and
VIF value< 10.
3. Heteroscedascity Test
Heteroscedasticity test aims to test whether the regression model of the
residual variance occurs inequality an observation to other observations. If the
variance of the residuals one observations to other observations stable, it is
called different homoscedasticity and if it is different called heteroscedasticity.
Good regression models is that happened when did not happen
heteroscedasticity (Priyatno, 2013).
Looking at the scatter plot graph, if forming certain patterns, such as
dots form a certain pattern regularly (wavy, widened then narrowed), then
heteroscedasticity indicates has occurred. If there is no clear pattern, and the
points spread above and below the 0 on the Y axis, then there is no

44
heteroscedasticity (Santoso, 2012).
F. Determination Coefficient (R2)
Determination coefficient (R2) aims to measure how far the
ability of independent variables (Promotion, Place and Price) in
explaining the variation of the dependent variable (customer
satisfaction). The coefficient of determination is between zero and one.
A value close to the mean of independent variables provide almost all
the information needed to predict the dependent variable (Imam Ghozali,
2013: 97).
G. Hypothesis Test
According Ghozali (2013: 97) the accuracy of the sample
regression function in assessing the actual value can be measured from
its Goodness of Fit. Statistically, at least this can be measured from the
value of Test Coefficient of Determination (R2), Statistic Test t, and
Statistics Test F.
1. Simultaneous test (F-test)
According to Ghozali (2013: 98) statistic Test F basically indicates
whether all the independent variables included in the model have an influence
simultaneously to dependent variable. Hypothesis used in this research is:

45
1) Ho:β1,2, 3= 0; there is no relationship between promotion (X1), place (X2)
and price (X3) simultaneously towards customer satisfaction (Y).
2) Ha:β1,2, 3≠ 0; there is relationship between promotion (X1), place (X2)
and price (X3) simultaneously towards customer satisfaction (Y).
The criteria of probability:
If the probability is smaller than 0.05, means Hais accepted and Ho
rejected, and
If the probability is greater than 0.05, means Hais rejected and Ho
accepted.
To test this hypothesis use F statistics with decision-making
criteria as follows:
a. When the F value is greater than 4, then Ho can be rejected at 5%
confidence level. In other words, accept the alternative
hypothesis, which states that all independent variables
simultaneously and significantly affect the dependent variable.
b. Compare score F test and F table. If score F test is higher than F table,
so Ho is rejected and then accept HA.
2. Partial Test (t-test)
According to Ghozali (2013: 98) statistics T test basically indicates
how much influence one independent variable partially in explaining variation

46
of dependent variable. The null hypothesis (Ho) to be tested is if a parameter
(bi) equals to zero, or:
Ho: β1 = 0
It implies if an independent variable is not significant explainer
towards dependent variable. The alternative hypothesis Ha would be
parameter of a variable does not equal to zero, or:
Ha: β1 ≠ 0
It indicates the variable is a significant explainer for dependent
variable.
Criterion of regression coefficient test from promotion variable to
customer satisfaction as follows
a) Ho : β1 = 0 ; there is no significant influence between promotion
(X1) towards customer satisfaction (Y)
b) Ha : β1 ≠ 0 ; there is significant influence between promotion (X1)
towards customer satisfaction (Y)
Criterion of regression coefficient test from place variable to customer
satisfaction as follows
a) Ho : β2 = 0 ; there is no significant influence between place (X2)
towards customer satisfaction (Y)
b) Ha : β2 ≠ 0 ; there is significant influence between place (X2)
towards customer satisfaction (Y)

47
Criterion of regression coefficient test from place variable to customer
satisfaction as follows
a) Ho : β3 = 0 ; there is no significant influence between price (X3)
towards customer satisfaction (Y)
b) Ha : β3 ≠ 0 ; there is significant influence between price (X3)
towards customer satisfaction (Y)
The criteria of probability:
a) If the probability is smaller than 0.05, means Ho rejected and Ha
accepted
b) If the probability is greater than 0.05, means Ho accepted and Ha
rejected
To do the T-test as follow:
With the criteria significant level 0.05 and degree of freedom (df) = n –
2 (number of respondent – exogenous variable).
Degrees of freedom provide a measure of how restricted the data are to reach a
certain level of prediction. If the number of degrees of freedom is small, the
resulting prediction may be less generalize able because all but a few
observations were incorporated in the prediction. Conversely, a large degrees-
of-freedom value indicates the prediction is fairly robust with regard to being
representative of the overall sample of respondents.

48
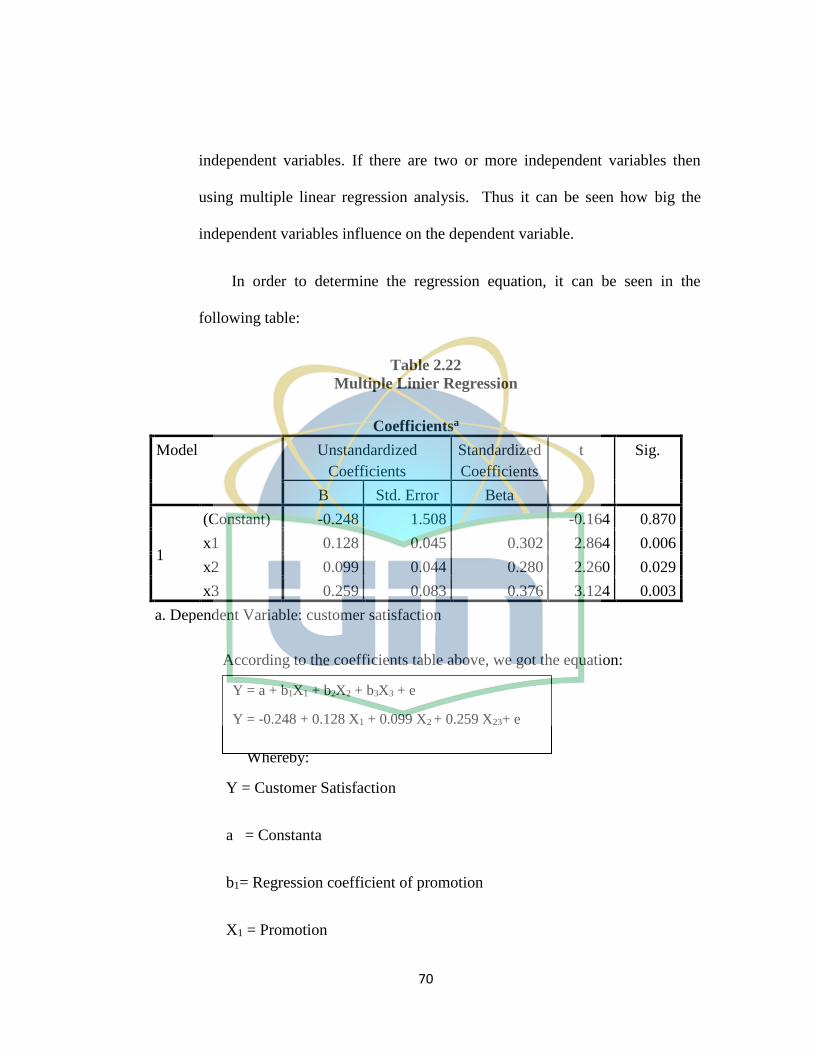
H. Multiple Linier Regression Analysis
According to Malhotra (2004), the regression analysis is a statistical
procedure to analyze the relationship between the dependent variable and the
independent variables. If there are two or more independent variables then
using multiple linear regression analysis. Thus it can be seen how big the
independent variables influence on the dependent variable.
According to Malhotra (2004:512) formulas that can be used as a multiple
linear regression analysis calculation is as follows:
Y = a + b1X1 + b2X2+ b3X3+ e
Description:
Y = customer satisfaction (dependent)
a = Constanta
X1 = promotion (independent)
X2 = place (independent)
X3 = price (independent)
b1 = regression coefficient of X1
b2 = regression coefficient of X2
b3 = regression coefficient of X3
e = error

49
I. Research Variable Operation
Variable in this research consist of:
1. Independent variable
According to Cooper (2007), independent variable is the variable
manipulated by the researcher, thereby causing an effect or change on the
dependent variable. In this research as independent variables are promotion
(X1), place (X2) and price (X3).
2. Dependent variable
According to Cooper (2007), dependent variable is thevariable
measured predicted, or otherwise monitored by researcher, expected to be
affected by manipulation of independent variable. In this Research as the
dependent variable is customers’ satisfaction (Y).

50
Table 3.2
Operational Variable
Variable Sub
Variable
Indicator Scale
Promotion (Kotler,
2007)
Advertising 1. Billboard
2. Brochures, Poster
Likert
Sales
Promotion
3. Coupons
4. Events
Place (Kotler &
Armstrong, 2006)&
(Tjiptono, 2008)
5. Availability
6. Affordability location
7. Smoothness access to the
location
Likert
Price (Rosvita
Lembang, 2014: 36)
8. Suitability prices with quality of
products
9. Price list
10. Special discount
11. Perceived price
Likert
Customer
Satisfaction
(Schiffman & Kanuk
,2004)&(Irawan,
2008)
12. Expectations fulfillment
13. Recommending to another
customer
14. Will buy/ use the services again
Likert

51
CHAPTER IV
ANALYSIS
A. General Overview
Lotte Mart is an East Asian hypermarket that sells a variety of
groceries, clothing, toys, electronics, and other goods, with headquarters
in South Korea. Lotte Mart is a division of the Lotte Co., Ltd. which sells
food and shopping services in South Korea and Japan. Lotte Mart, part of the
Korean conglomerate "Lotte", opened its first branch at Guui-dong, Gang
Byeon, Seoul, Korea on April 1, 1998. In 2006, Lotte Mart opened its first
overseas branch. As of August 8, 2011, Lotte Mart had 199 branches (92
branches in Korea, 82 branches in China, 23 branches in Indonesia, and 11
branches in Vietnam). Continuing their expansion plans, in October 2008,
Lotte bought PT Makro Indonesia. PT Makro Indonesia ran 19 stores in
Indonesia. This was also the first time Korean retail had entered the
Indonesian market.
One of Lotte Mart Wholesale is very well known in Java that is Lotte
Mart Wholesale in Alam Sutera Serpong. Lotte Mart Serpong is the seventh
of outlet wholesale in history of this company that build on 9 October 1996.
Lotte Mart Serpong, has 40,000-50,000 potential members, ranging from
merchant retail stores, hotels, restaurants, caterers, cafes, as well as office

52
Source: http://www.lottemart.co.id
supplies and other institutions. Lotte Mart Wholesale outlet is very beneficial
for business partners engaged in the B2B (Business to Business). In order to
fulfill business partners need, Lotte Mart Serpong provide quality products at
competitive prices. So that could help, serve, and to develop the small and
medium entrepreneurs (small and medium enterprise) in Serpong.
B. Lotte Mart Wholesale Logo
Figure 4.1
Lotte Mart Wholesale Logo
C. Lotte Mart Vision and Mission Statement
1. Vision
In order to make the leap to global business groups and enter
into the '10 largest global companies in Asia', Lotte voiced its
seriousness in 'Vision 2018'. Additionally been trying wholeheartedly
to advance and strengthen the company's core, Lotte also continue to
expand to the whole world and try to realize all these things in 2018.
In promoting the vision of the company, management
regulations as well as the core values have been established in
conjunction with the expansion of the selection and application tasks
to be used in the distribution sector, finance, confectionary,

53
construction, tourism, chemical industry, production, and other
support fields for the sake of the embodiment of his vision.
In addition, five major foundation in the implementation of the
vision has been established, namely the 'Vision 2018 system support,'
'a program that can foster a sense of pride within the employees,'
'human resource development of the future,' 'brand management,' and '
deep understanding of the customer. "By implementing all of these
goals, Lotte has strengthened management infrastructure suitable for a
global business group.
2. Mission
Lotte grown into a company that represents Korea in various
fields such as food distribution and recreation. Currently, the company
is expanding into a global company that enriches the lives of people
around the world.
Driven by the normalization of diplomatic relations between
Korea and Japan in 1965, Owner of Lotte, Shin Kyuk-ho, a Korean
businessman, the business unit operates mostly in Japan, made a bold
investment by establishing first business affiliation Group, Lotte
Confectionery in Korea. At that time, Korea was a developing country
because of the remnants of the Korean War. Investment Mr. Shin is a
first step toward large-scale modernization of the food industry.

54
D. Analysis and Discussion
1. Validity Test Result
Validity is a characteristic of measurement concerned with the
extent that a test measures what the researcher actually wishes tool
reflect true differences among participants drawn from a population
(Cooper, 2006). According to Ghozali (2005) the validity of this
research is used to measure the legality of a questionnaire.
To get the primary data, the researcher distribute questionnaire
to the respondents. A question considered as valid if the value of each
question or r-count is positive and greater than r-table. In this research the
researcher use 30 respondents as a sample to assess the validity of
all the questions. Regarding the formulation, researcher use
formulation of df = n-2, so 30-2 = 28 and got the value of 0.361 as r-
table(Ghozali, 2013: 52-53).
Table 4.1
Validity Test Result
Questions r-count r-table Result
Promotion
Promotion 1 0.908 0.3673 Valid
Promotion 2 0.965 0.3673 Valid
Promotion 3 0.977 0.3673 Valid
Promotion 4 0.965 0.3673 Valid
Place

55
Place 1 0.874 0.3673 Valid
Place 2 0.964 0.3673 Valid
Place 3 0.809 0.3673 Valid
Price Valid
Price 1 0.840 0.3673 Valid
Price 2 0.974 0.3673 Valid
Price 3 0.827 0.3673 Valid
Price 4 0.942 0.3673 Valid
Customer Satisfaction
Customer Satisfaction 1 0.943 0.3673 Valid
Customer Satisfaction 2 0.918 0.3673 Valid
Customer Satisfaction 3 0.968 0.3673 Valid
Source: Processed Primary Data by SPSS 20, 2017
Based on table 4.1, we can concluded that 14 questions that
given to the 30 respondents are valid, because the r-count > r-table.
Whereas, for the reliability test result can be seen as below:
2. Reliability Test Result
Reliability is a characteristic of measurement concerned with
accuracy, precision, and consistency; a necessary but not sufficient
condition for validity (if the measure is not reliable, it cannot be
valid). Reliability is concerned with estimates of the degree to which
a measurement is free a random or unstable error (Cooper, 2006).

56
Reliability refers to the extent to which a scale produces
consistent results if repeated measurements are made. Therefore,
reliability can be defined as the extent to which measures are free from
random error (Maholtra, 2006).
Meanwhile, reliability test used to test the consistency of data
in a certain period of time and the extent to which a scale produces
consistent result if repeated measurements are made on the
characteristic. The value of variable reliability demonstrated by the
Cronbach Alpha coefficient. A variable is said to be the Alpha
Cronbach coefficient of Reliability when > 0.70, means that this
instrument can be used as a reliable data collector with relative
measurement result if repeated measurements are made. In the other
word, we can say that this reliability test purposes to see the data
consistency (Ghozali, 2013:48).
Before the questionnaire distributes to 50 respondents,
researcher conducted pra-survey towards 30 respondents by giving the
14 questions to test the validity and reliability from the overall
questions given. The table below shows the output of validity and
reliability test of each variable of promotion (X1), price (X2), place
(X3) and customer satisfaction (Y).
Table 4.2
Reliability Test Result

57
Source: Processed Primary Data by SPSS 20, 2017
According to the table 4.2, noted that the value of Cronbach’s Alpha
of all variables are greater than (>) 0.70. So it can be summed up that all
variables used in this study are reliable.
E. Descriptive Analysis Discussion
Descriptive analysis of the answer of respondents is aim to identified the
frequency of each answer towards the variable instruments, which are
promotion, place, price and customer satisfaction. There are 50 respondents
with several characteristics such as the respondents according to sex, age,
income /month. The demographic classification characteristics of the
respondents can be described as follows:
1. Total of respondent based on gender
Table 4.3
Respondents Based on Gender
Variable Cronbach’s Alpha N of item Result
Promotion 0.933 4 Reliable
Place 0.840 3 Reliable
Price 0.902 4 Reliable
Customer Satisfaction 0. 934 4 Reliable
Gender Frequency Percentage(%)
Male 19 38%
Female 31 62%

58
Source: Primary data output from SPSS 20, 2017
From the table above, there are 50 respondents who are Lotte
Mart Serpong customers, consist of 19 people or 38% are males and
31 people or 62% are females respondents. So it is indicates that most
of Lotte Mart Serpong are females.
2. Total of respondents based on age
Table 4.4
Total of Respondents Based on Age
Age Frequency Percentage (%)
< 20 4 8%
20 – <35 44 88%
35 - < 50 2 4%
Total 50 100%
Source: Primary data output from SPSS 20, 2017
Table 4.4 above shows that 50 respondents consist of 4people
aged <20, 44 people aged between 20 - <35, and 2 person aged
between 35 - < 50. So it is indicates that most of Lotte Mart consumers
aged between 20 until under 35 years old.
3. Total of respondents based on income/month
Table 4.5
Total of respondents based on income/month
Income/month Total Percentage (%)
Total 50 100%

59
< Rp 5.000.000 20 40%
Rp 5.000.000 –
Rp 10.000.000
23 46%
> Rp. 10.000.000
– Rp 15.000.000
7 14%
Total 50 100%
Source: Primary data output from SPSS 20, 2017
Table 4.7 above shows that 50 respondents who has been
shopping at Lotte Mart Serpong consists of 20 people or 40% of
respondents income <Rp 5,000,000, 23 people or 46% of respondents
income is Rp 5,000,000 - 10,000,000 , 7 people or 14% of respondents
income is Rp> 10.000.000 - 15,000,000.
In order to know the feedback given by 50 respondents in each variable
of promotion, place, price, and customer satisfaction, so the percentage
description of respondent’ feedback then being analyzed. The respondents are
asks to answer 14 the following statement:
Table 4.6
Question 1
Lotte Mart Sales Promotion using Billboard
Frequency Percentage
Valid
Agree 6 12%
Strongly Agree 44 88%
Total 50 100%
Source: Primary data output from SPSS 20

60
Table 4.6 shows that 12% agrees and 88% strongly agrees. Then it can be
concluded that the majority of respondents agree that Lotte Mart Sales
Promotion using Billboard.
Table 4.7
Question 2
Lotte Mart Serpong provide clear information for sales promotion
(brochures, posters).
Frequency Percent
Valid
Agree 7 14%
Strongly Agree 43 86%
Total 50 100%
Table 4.7 shows that 14% agrees and 86% strongly agrees. Then it can be concluded
that the majority of respondents agree that Lotte Mart Serpong provide clear
information for sales promotion (brochures, posters).
Table 4.8
Question 3
Lotte Mart Serpong provides coupons as a media promotion against
customer
Frequency Percent
Valid
Neutral 2 4%
Agree 6 12%
Strongly Agree 42 84%
Total 50 100%
Table 4.8 shows that 4% neutral, 12% agrees and 84% strongly agrees. Then it can be
concluded that the majority of respondents agree that Lotte Mart Serpong provides
coupons as a media promotion against customer.

61
Table 4.9
Question 4
Lotte Mart Serpong organize interesting events for sales promotion
Frequency Percent
Valid
Agree 7 14%
Strongly Agree 43 86%
Total 50 100%
Table 4.9 shows that 14% agrees and 86% strongly agrees. Then it can be concluded
that the majority of respondents agree thatLotte Mart Serpong organize interesting
events for sales promotion.
Table 4.10
Question 5
Searchable product is always available at Lotte Mart Serpong
Frequency Percent
Valid
Agree 21 42%
Strongly Agree 29 58%
Total 50 100%
Table 4.10 shows that 42% agrees and 58% strongly agrees. Then it can be concluded
that the majority of respondents agree that Searchable product is always available at
Lotte Mart Serpong.
Table 4.11
Question 6
Lotte Mart Serpong close to public facilities
Frequency Percent
Valid
Neutral 2 4%
Agree 16 32%
Strongly Agree 32 64%
Total 50 100%

62
Table 4.11 shows that 4% neutral, 32% agrees and 64% strongly agrees. Then it can
be concluded that the majority of respondents agree that Lotte Mart Serpong close to
public facilities.
Table 4.13
Question 8
Lotte Mart Serpong position or location easy to reach
Frequency Percent
Valid
Neutral 3 6%
Agree 21 42%
Strogly Agree 26 52%
Total 50 100%
Table 4.13 shows that 6% neutral, 42% agrees and 52% strongly agrees. Then it can
be concluded that the majority of respondents agree that Lotte Mart Serpong position
or location easy to reach.
Table 4.14
Question 9
Lotte Mart serpong set their prices according to quality
Frequency Percent
Valid
Agree 19 38%
Strongly Agree 31 62%
Total 50 100%
Table 4.14 shows that 38% agrees and 62% strongly agrees. Then it can be concluded
that the majority of respondents agree that Lotte Mart serpong set their prices
according to quality.
Table 4.15
Question 10
Lotte Mart Serpong provides a clear price list
Frequency Percent

63
Valid
Neutral 1 2%
Agree 17 34%
Strongly Agree 32 64%
Total 50 100%
Table 4.15 shows that 2% neutral, 34% agrees and 64% strongly agrees. Then it can
be concluded that the majority of respondents agree that Lotte Mart Serpong provides
a clear price list.
Table 4.16
Question 11
Lotte Mart Serpong often gave discounts
Frequency Percent
Valid
Agree 16 32%
Strongly Agree 34 68%
Total 50 100%
Table 4.16 shows that 2% neutral, 34% agrees and 64% strongly agrees. Then it can
be concluded that the majority of respondents agree that Lotte Mart Serpong often
gave discounts.
Table 4.17
Question 12
Price of product in Lotte Mart fit with what I expected
Frequency Percent
Valid
Neutral 1 2%
Agree 11 22%
Strongly Agree 38 76%
Total 50 100%

64
Table 4.17 shows that 2% neutral, 22% agrees and 76% strongly agrees.
Then it can be concluded that the majority of respondents agree that
price of product in Lotte Mart fit with what I expected.
Table 4.18
Question 13
Services provided by Lotte Mart Serpong in accordance with my
expectations
Frequency Percent
Valid
Agree 18 36%
Strongly Agree 32 64%
Total 50 100%
Table 4.17 shows that 36% agrees and 64% strongly agrees. Then it can be concluded
that the majority of respondents agree that Services provided by Lotte Mart Serpong
in accordance with my expectations.
Table 4.19
Question 14
After shopping at Lotte Mart Serpong, I would recommend to
others for shopping here
Frequency Percent
Valid
Neutral 2 4%
Agree 13 26%
Strongly Agree 35 70%
Total 50 100%
Table 4.17 shows that 4% neutral, 26% agrees and 70% strongly agrees. Then it can
be concluded that the majority of respondents agree that after shopping at Lotte Mart
Serpong, I would recommend to others for shopping here.
F. Classical Assumption Test

65
1. Normality Test
Normality test aims to test whether the regression model, the
dependent variable (customer satisfaction) and independent variables
(promotion (X1), place (X2) and price (X3)) both have a normal
distribution or not. If the distribution of the residual values cannot be
considered to be normally distributed, then it is said there are
problems with the normality assumption.
According Ghozali (2006), the principle of normality can be
detected by looking at the spread of the data (dots) on the diagonal axis
of the graph probability plots or by looking at the histogram of the
residual.
Basis for decision making as follows:
c. Detection of the histogram, if the normal curves in the graph
follow a bell shape, then the data are normally distributed.
d. While the detection of the normal probability plot on the
graph, if the data (dots) spread around the diagonal line, and
follow the direction of the diagonal line, then the regression
model to meet the assumption of normality. If the spread of
the data (points) do not follow the direction of the diagonal,
then the regression model did not meet the assumption of
normality. This statistical test that can be used to test the

66
normality of the residuals is a statistical test of non -
parametric Kolmogorov-Smirnov (KS) (Ghozali, 2006). Basis
for decision making, when the value of the Kolmogorov
Smirnov significance greater than 0.05, it can be said to be
normally distributed data. If the value of the significance of
the KS test is smaller than 0.05, it can be said the data was not
normally distributed.
Table 4.20
One-Sample Kolmogorov-Smirnov Test
One-Sample Kolmogorov-Smirnov Test
Unstandardized
Residual
N 50
Normal Parametersa,b
Mean 0E-7
Std.
Deviation 0.70774375
Most Extreme
Differences
Absolute 0.163
Positive 0.076
Negative -0.163
Kolmogorov-Smirnov Z 1.150
Asymp. Sig. (2-tailed) 0.142
a. Test distribution is Normal.
b. Calculated from data.

67
According to table 4.20, the value of Kolmogrov-Smirnov is 1.150.
Whereas the unstandardized residual has the value of Asymp. Sig which is
greater than 0.05. So it is indicted that the data is distributed normally.
2. Multicollinearity Test
According to Ghozali (2006), multicollinearity test aims to
testwhether the regression model found a correlation among
theindependent variables (promotion (X1), place (X2) and price (X3)).
Good regression model shouldnot happen correlation among the
independent variables (promotion, place and price), If among the
independent variables correlated with eachother, then these variables
are not orthogonal. To detect thepresence or absence of
multicollinearity among the independentvariables in regression
model, it can be seen from Tolerance andVIF value. Cutoff value
commonly used to indicate whether there ismulticollinearity or not is
Tolerance value >0.1 and VIFvalue < 10. The multicollinearity test
result can be seen on the table below:
Table 4.21
Coefficientsa
Model Unstandardized
Coefficients
Standar
dized
Coeffici
ents
t Sig. Collinearity
Statistics

68
F
r
o
m
t
he table 4.21, we can see that each independent variable has tolerance value >
0.1 and the value of VIF is < 10. Independent variables (X1) has tolerance
value 0.618 and VIF value 1.618, (X2) has tolerance value 0.448 and VIF
value 2,231 and (X3) has tolerance value 0.473 and VIF value 2.113. So it can
be said there is no multicollinearity among independent variables in
regression model.
3. Heteroscedasticity Test
Heteroscedasticity test aims to test whether the regression
model ofthe residual variance occurs inequality an observation to
otherobservations. If the variance of the residuals one observations
toother observations stable, it is called different homoscedasticity and
if it is different called heteroscedasticity. Good regressionmodels is
that happened when did not happenheteroscedasticity (Priyatno,
2013).
Looking at the scatterplot graph, if forming certain patterns,
B Std.
Error
Beta Tolera
nce
VIF
1
(Constant) -
0.248 1.508
-
0.164 0.870
x1 0.128 0.045 0.302 2.864 0.006 0.618 1.618
x2 0.099 0.044 0.280 2.260 0.029 0.448 2.231
x3 0.259 0.083 0.376 3.124 0.003 0.473 2.113
a. Dependent Variable: customer satisfaction

69
such as dots form a certain pattern regularly (wavy, widened then
narrowed), then heteroscedasticity indicates has occurred. If there is
no clear pattern, and the points spread above and below the 0 on the Y
axis, then there is no heteroscedasticity (Santoso, 2012).
Figure 4.4
Graph of Heteroscedasticity
Source:Processed Primary Data by SPSS 20, 2017
Based on the graph above, there is no clear pattern and the
points spread above and below the 0 on the Y axis, then it can be said
there is no Heteroscedasticity in this regression model (Ghozali,
2013:139).
G. Multiple Linier Regression Analysis
According to Malhotra (2004), the regression analysis is a statistical
procedure to analyze the relationship between the dependent variable and the
70
independent variables. If there are two or more independent variables then
using multiple linear regression analysis. Thus it can be seen how big the
independent variables influence on the dependent variable.
In order to determine the regression equation, it can be seen in the
following table:
Table 2.22
Multiple Linier Regression
Coefficientsa
Model Unstandardized
Coefficients
Standardized
Coefficients
t Sig.
B Std. Error Beta
1
(Constant) -0.248 1.508 -0.164 0.870
x1 0.128 0.045 0.302 2.864 0.006
x2 0.099 0.044 0.280 2.260 0.029
x3 0.259 0.083 0.376 3.124 0.003
a. Dependent Variable: customer satisfaction
According to the coefficients table above, we got the equation:
Whereby:
Y = Customer Satisfaction
a = Constanta
b1= Regression coefficient of promotion
X1 = Promotion
Y = a + b1X1 + b2X2 + b3X3 + e
Y = -0.248 + 0.128 X1 + 0.099 X2 + 0.259 X23+ e

71
b2= Regression coefficient of Place
X2 = Place
B3= Regression coefficient of Price
X3= Price
e = Standard Error
H. Coefficient of Determination (R2)
Determination coefficient (R2) aims to measure how far the
ability of independent variables (Promotion, Place and Price) in
explaining the variation of the dependent variable (customer
satisfaction). The coefficient of determination is between zero and one.
A value close to the mean of independent variables provide almost all
the information needed to predict the dependent variable (Imam Ghozali,
2013: 97). The variables determination can be seen from the following table:
Table 2.23
Coefficient of Determination (R2) Table
Model Summaryb
Mode
l
R R Square Adjusted R
Square
Std. Error of
the Estimate
1 0.827a 0.684 0.663 0.730
a. Predictors: (Constant), price, promotion, place
b. Dependent Variable: cs
The table above shows that the coefficient value of R is 0.827. It means, the

72
relationship between promotion, place and price towards customer satisfaction is
0.827 or they have a strong relations. Whereas, the R2value is0.684. It indicates
that 68.4% customer satisfaction variable can be explained by the variation of
independent variables (promotion, place and price).
So, we can conclude that, 68.4% customer satisfaction can be explained by the
variables of promotion, place and price. And the remaining result, which is 31.6%
(100% - 68.4%) explained by another variables that do not be analyzed in this
research.
I. Hypothesis Test
1. Partial Test (t-test)
According to Ghozali (2013: 98) statistics T test basically indicates
how much influence one independent variable partially in explaining
variation of dependent variable.
The criteria of probability:
c) If the probability is smaller than 0.05, means Ho rejected and Ha
accepted = significant.
d) If the probability is greater than 0.05, means Ho accepted and Ha
rejected = not significant.

73
Table 2.24
The Result of T-test
Coefficientsa
Model Unstandardized
Coefficients
Standardized
Coefficients
t Sig.
B Std. Error Beta
1
(Constant) -0.248 1.508 -0.164 0.870
x1 0.128 0.045 0.302 2.864 0.006
x2 0.099 0.044 0.280 2.260 0.029
x3 0.259 0.083 0.376 3.124 0.003
a. Dependent Variable: y
T-test result in the coefficient table above indicates there is influence
between independent variable partially towards dependent variable,
with the elaboration as follow:
1) The influence of promotion (X1) towards customer satisfaction (Y)
c) Ho : β 1 = 0 ; there is no significant influence between promotion
(X1) towards customer satisfaction (Y)
d) Ha : β 1 ≠ 0 ; there is significant influence between promotion (X1)
towards customer satisfaction (Y)
According to the table 2.24 it can be seen thatthe significance
value of 0.006< sig. 0.05. Thus, we conclude Ho is rejected and Ha
is accepted, means promotion (X1) has significant influence
towards customer satisfaction (Y).
2) The influence of place (X2) towards customer satisfaction (Y)

74
a) Ho : β 2 = 0 ; there is no significant influence between place (X2)
towards customer satisfaction (Y)
b) Ha : β 2 ≠ 0 ; there is significant influence between place (X2)
towards customer satisfaction (Y)
According to the table 2.24 it can be seen that the significance
value of 0.028 < sig. 0.05. Thus, we conclude Ho is rejected and
Ha is accepted, means place (X2) has significant influence towards
customer satisfaction (Y).
3) The influence of price (X3) towards customer satisfaction (Y)
a) Ho : β 3 = 0 ; there is no significant influence between price (X3)
towards customer satisfaction (Y)
b) Ha : β 3 ≠ 0 ; there is significant influence between price (X3)
towards customer satisfaction (Y)
According to the table 2.24 it can be seen that the significance
value of 0.003 < sig. 0.05. Thus, we conclude Ho is rejected and
Ha is accepted, means price (X2) has significant influence towards
customer satisfaction (Y).
2. Simultaneous Test (F-test)
According to Ghozali (2013: 98) statistic Test F basically
indicates whether all the independent variables included in the model
have an influence simultaneously to dependent variable.
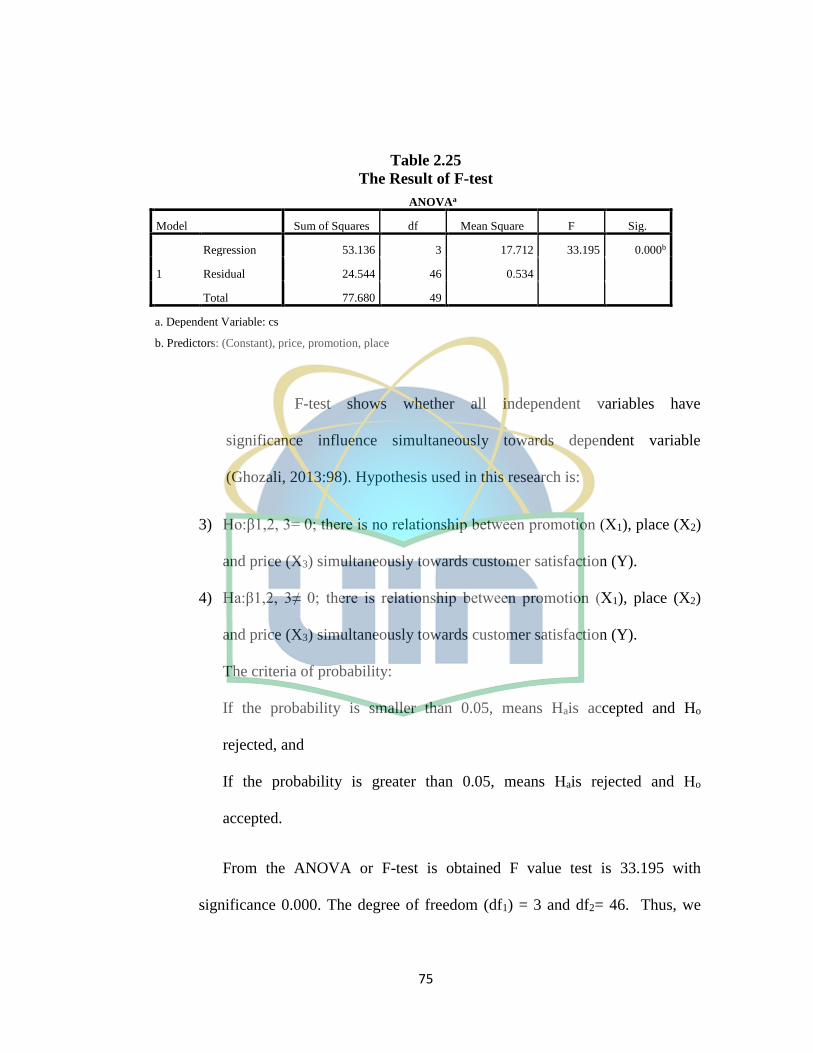
75
Table 2.25
The Result of F-test
ANOVAa
Model Sum of Squares df Mean Square F Sig.
1
Regression 53.136 3 17.712 33.195 0.000b
Residual 24.544 46 0.534
Total 77.680 49
a. Dependent Variable: cs
b. Predictors: (Constant), price, promotion, place
F-test shows whether all independent variables have
significance influence simultaneously towards dependent variable
(Ghozali, 2013:98). Hypothesis used in this research is:
3) Ho:β1,2, 3= 0; there is no relationship between promotion (X1), place (X2)
and price (X3) simultaneously towards customer satisfaction (Y).
4) Ha:β1,2, 3≠ 0; there is relationship between promotion (X1), place (X2)
and price (X3) simultaneously towards customer satisfaction (Y).
The criteria of probability:
If the probability is smaller than 0.05, means Hais accepted and Ho
rejected, and
If the probability is greater than 0.05, means Hais rejected and Ho
accepted.
From the ANOVA or F-test is obtained F value test is 33.195 with
significance 0.000. The degree of freedom (df1) = 3 and df2= 46. Thus, we

76
got the significance level = 0.05; because the probability is smaller than the
significance level(0.000 < 0.05). Therefore this means Ho is rejected and Ha
is accepted, and can be concluded that the independent variables such as
promotion (X1), place (X2) and price (X3) have significant influence towards
customer satisfaction (Y) simultaneously.
J. Analysis
1. The influence of promotion on customer Satisfaction
Khan (2012) there is a positive influence between promotion and
customer satisfaction. So the higher the promotion will have a positive
impact on customer satisfaction. Simplify the customer in terms of
knowing the product or service to be purchased. In addition, with the
Promotion can also make the customer remember what kind of product
or service they will buy.
2. The influence of place on customer Satisfaction
According to (Tjiptono, 2008), with affordability location and
smoothness access to location make customers easy to reach locations
that sell products and services.
3. The influence of price on customer Satisfaction
According to (Tjiptono, 2008) price can affect customer satisfaction to
build corporate image. The image of a company can be established

77
through a pricing strategy. Firms can set a high price to establish or
maintain a prestigious image. Meanwhile, low prices can be used to
form a certain value, for example by providing assurance that the price
is the lowest price in a particular area.

78
CHAPTER V
CONCLUSION AND RECOMMENDATION
A. Conclusion
The purpose of this research is to analyze the influence of promotion,
place and price towards customer satisfaction. Based on the statistical test
using the SPSS software with 50 samples to represent the amount of
population and also the research within the previous chapters, it can be
concluded as below:
1. Promotion (X1) has significant influence towards customer satisfaction
(Y) at Lotte Mart Serpong.
2. Place (X2) has significant influence towards customer satisfaction (Y)
at Lotte Mart Serpong.
3. Price (X3) has significant influence towards customer satisfaction (Y)
at Lotte Mart Serpong.
4. Promotion (X1), place (X2), and price (X3), have significant influence
towards Consumer satisfaction (Y) simultaneously at Lotte Mart
Serpong.
Based on the conclusion above, it explained that minor or major
changes in customer satisfaction (Y) is depends on how well the company
handle promotion (X1), place (X2),and price (X3).
B. Recommendation
After reviewing the results of the study, recommendations that the author

79
propose are as follows:
1. For Company
The result of this research shows, that promotion, place and
price have significant influence towards customer satisfaction and also
promotion, place and price simultaneously have significant influence
towards customer satisfaction. Based on the result, the researcher
recommends to the company as follows:
a. Promotion
Lotte Mart opens opportunities for those who want to start a
business. Such as creating a competition that was attended by
100 participants from several regions. Then, with certain terms
and criteria. Or Lotte Mart will judge, the most creative person
in processing their store, will be given a place to sell. From 100
people can be taken about 20 people to be given the business
opportunity.
For the next, there is an agreement, so for stock they buy it at
the Lotte Mart. And certainly, at the store they sell there is a
sign that the store is working with Lotte Mart.
b. Price
Lotte Mart Serpong held a company visit to a similar
company, to see directly the price comparison and how the
price could differ from other companies. It is useful to
rearrange the price at Lotte Mart Serpong to match customer's
expectation

80
c. Place
The problem for Lotte Mart is, from the entrance, into
the shopping location quite far for those who do not have a
vehicle. So, what needs to be done by Lotte Mart is to change
the position of the entrance. To get closer to the shopping
location. So, when entering Lotte Mart, the left of the shopping
and the right is a car park. In order to make it easier for those
who do not have a vehicle when they bring groceries to ride to
public transport.
2. For future research
a) Data collection in this study is by distributing the
questionnaire, in which by the distribution of questionnaire is
possible that the respondents are not serious in giving an
answer, therefore, the researcher suggestfurther research to
conduct an open interview with the respondent in order to
obtain more accurate information.
b) For future research, the researcher suggest to conduct deeper
and more integrated research. As compared Lotte Mart
Wholesale with Lotte Mart supermarket. Is Lotte Mart
supermarket may also be able to compete in the business
competition?.

81
References
A, Junio., Z, Nabila., A, Sheila., & K, Suresh. 2013.The Analysis of Product, Price,
Place, Promotion and Service Quality on Customers’ Buying Decision of
Convenience Store: A Survey of Young Adult in Bekasi, West Java, Indonesia.
International Journal of Advances in management and Economics, p. 72-78.
Akbar, A. (2014). The Influence of Service Quality and Brand Image toward
Customer Satisfaction that Impacts on Customer Loyalty.
Azhari, F. (2015). The Analysis of Retail Marketing Mix Effects toward Customer
Satisfaction.
Fandy. Tjiptono. 2008. Strategi Pemasaran. Penerbit Andi Edisi Kedua: Yogyakarta
G, Anders. 2006. The Effects of Customer Satisfaction, Relationship Commitment
Dimensions, and Triggers on Customer Retention. School of Hotel
Administration Collection.
Irawan, Handi, 2008. Membedah strategi Kepuasan pelanggan. Cetakan pertama.
Jakarta: Pradnya Paramitha, h. 45. Kelompok Gramedia.
Kotler, Philip dan A. B. Susanto. 2000. Manajemen Pemasaran di Indonesia. Edisi
Pertama. Jakarta: Salemba Empat.
Kotler, Phillip dan Kevin Keller. 2006. Marketing Management. 12th Edition. New
Jersey: Prentice-Hall, Inc.
M, Rahim., M, Osman., & Ramayah 2010. Service Quality, Customer Satisfaction
and Loyalty: A Test of Mediation. International Business Research.
Nuseir, M. T. & Madanat H. 2015. 4Ps: A strategy to secure Customers' loyalty via
customer satisfaction. International Journal of Marketing studies
Lembang, R. 2010. Analisis pengaruh marketing mix toward buying decision.
Rusmini. 2013. Strategi Promosi sebagai Dasar peningkatan Respons konsumen.
APPENDICES
Appendix 1: Research Questionnaire

82
RESEARCH QUESTIONAIRE
THE INFLUENCE OF PROMOTION, PLACE, PRICE TOWARDS
CUSTOMER SATISFACTION
(Case Study on Lotte Mart Serpong)
Regarding to finish the program of Bachelor Degree Faculty Economics and
Business Syarif Hidayatullah State Islamic University Jakarta, who is writing this
thesis as a requirement to get Bachelor Degree of Economic:
Name : Muhammad Iqbal Almaudud
NIM : 1111 0812 00002
Major : Management
Faculty: Economic and Business
I will do research about “THE INFLUENCE OF PROMOTION, PLACE,
PRICE TOWARDS CUSTOMER SATISFACTION (Case Study on Lotte Mart
Serpong)”. Therefore, I wish Mr/Mrs/Brother/Sister are willing to fill out this
questioner.

83
Screening
Sebelum menyelesaikan kuisioner, diharapkan kepada saudara/i untuk
melengkapi detail dibawah dengan membubuhkan tanda centang (√) pada kotak yang
sudah disediakan:
1. Apakah anda pernah berbelanja di Lotte Mart Serpong?
Jika Iya, mohon lanjutkan ke pernyataan selanjutnya.
Jika Tidak, mohon untuk tidak melanjutkan. Terima kasih atas partisipasi
anda.
Identitas Responden
Nama : …………………………................
Jenis Kelamin :
Umur :
Pendapatan/bulan :
Instruksi Pengisian
Iya Tidak
Pria
1. < Rp. 5.000.0000
Wanita
< 20 Tahun 50-65 Tahun
20-<35 Tahun >65 Tahun
35-<50 Tahun
2. Rp. 5.000.000 - Rp. 10.000.000
3. > Rp. 10.000.000 - Rp. 15.000.000

84
Tolong isi setiap pertanyaan sesuai dengan pendapat Saudara/i tentang
“THE INFLUENCE OF PROMOTION, PLACE, PRICE TOWARDS
CUSTOMER SATISFACTION (Case Study on Lotte Mart Serpong)”.
Pilih satu jawaban dari lima alternatif jawaban dengan memberikan
tanda centang (√) pada salah satu kolom yang disediakan.
1 2 3 4 5
Sangat
Tidak
Setuju (STS)
Tidak
Setuju (TS) Netral (N) Setuju (S)
Sangat
Setuju (SS)
No. Pernyataan STS TS N S SS
1. Promosi penjualan Lotte Mart
menggunakan Billboard.
2. Lotte Mart Serpong memberikan
informasi yang jelas untuk
promosi penjualan (brosur,
poster,dll).
3. Lotte Mart Serpong memberikan
kupon sebagai media promosi
terhadap pelanggan.
4. Lotte Mart Serpong mengadakan
acara menarik untuk promosi
penjualan.
Promotion (X1)
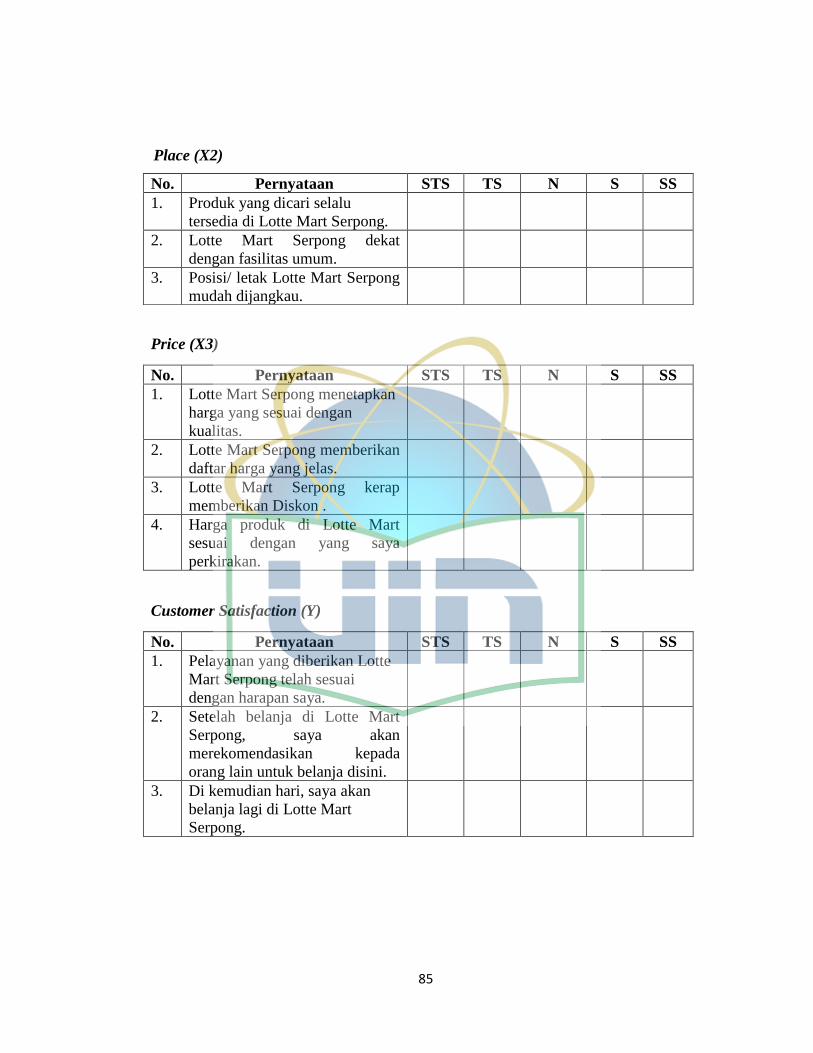
85
Price (X3)
No. Pernyataan STS TS N S SS
1. Lotte Mart Serpong menetapkan
harga yang sesuai dengan
kualitas.
2. Lotte Mart Serpong memberikan
daftar harga yang jelas.
3. Lotte Mart Serpong kerap
memberikan Diskon .
4. Harga produk di Lotte Mart
sesuai dengan yang saya
perkirakan.
Customer Satisfaction (Y)
No. Pernyataan STS TS N S SS
1. Pelayanan yang diberikan Lotte
Mart Serpong telah sesuai
dengan harapan saya.
2. Setelah belanja di Lotte Mart
Serpong, saya akan
merekomendasikan kepada
orang lain untuk belanja disini.
3. Di kemudian hari, saya akan
belanja lagi di Lotte Mart
Serpong.
No. Pernyataan STS TS N S SS
1. Produk yang dicari selalu
tersedia di Lotte Mart Serpong.
2. Lotte Mart Serpong dekat
dengan fasilitas umum.
3. Posisi/ letak Lotte Mart Serpong
mudah dijangkau.
Place (X2)

86
Appendix 2: Participants Responses
Variable X1 - Promotion
Q1 Q2 Q3 Q4
4 5 5 5
5 5 5 5
4 5 5 5
5 5 4 5
5 5 5 4
5 5 5 5
5 5 5 5
5 4 5 5
5 5 5 4
4 5 4 5
5 5 5 5
5 5 5 5
5 5 3 5
4 5 5 5
5 5 5 4
5 5 5 5
5 5 4 5
5 5 5 5
5 5 5 5
5 5 5 5
5 5 5 4
5 5 5 5

87
4 5 5 5
5 5 5 5
5 5 5 5
5 4 5 5
5 5 4 4
5 5 5 5
5 5 5 5
5 5 5 5
5 5 5 5
5 4 5 5
5 5 5 4
5 5 5 5
5 5 5 5
5 5 5 5
5 5 5 5
4 4 4 5
5 5 5 4
5 5 5 5
5 5 5 5
5 4 5 5
5 5 5 5
5 5 5 5
5 5 5 5
5 5 3 5
5 4 5 5

88
5 5 5 5
5 4 4 5
5 5 5 5
Variable X2 – Place
Q5 Q6 Q7
5 5 4
4 4 5
4 5 3
5 4 5
4 5 5
5 3 5
4 4 5
5 5 5
4 5 3
5 5 5
4 4 5
4 5 4
5 5 5
4 4 5
5 5 5
4 5 5
5 4 5
4 3 5
5 5 5

89
4 4 5
5 5 5
4 5 4
5 5 5
4 5 5
5 5 5
4 4 5
5 4 5
4 4 5
5 4 5
4 5 5
4 4 5
5 5 5
4 5 5
4 5 4
4 5 5
4 5 5
5 4 5
5 5 5
5 5 5
5 5 5
5 5 5
5 4 5
5 5 4
5 5 5

90
5 5 5
5 5 5
5 4 5
5 5 5
5 5 4
5 4 5
Variable X3 – Price
Q8 Q9 Q10 Q11
5 4 4 4
5 5 5 5
5 5 4 5
5 5 5 5
3 5 5 4
5 5 4 4
5 5 4 5
5 5 4 5
5 5 5 4
4 5 5 5
4 5 4 5
5 5 5 4
5 5 5 4
5 4 5 5
5 4 4 5
5 5 5 5

91
3 4 4 4
4 4 5 5
4 5 4 4
4 5 5 5
4 4 5 4
4 4 5 4
4 5 4 4
5 5 5 5
5 5 5 5
5 4 4 5
4 4 5 4
4 5 5 4
4 5 4 4
3 4 5 5
5 4 5 5
5 5 4 5
4 5 5 4
4 4 5 5
4 4 4 5
5 5 5 5
4 5 5 5
4 4 4 5
5 4 5 5
5 5 4 5
4 5 5 4
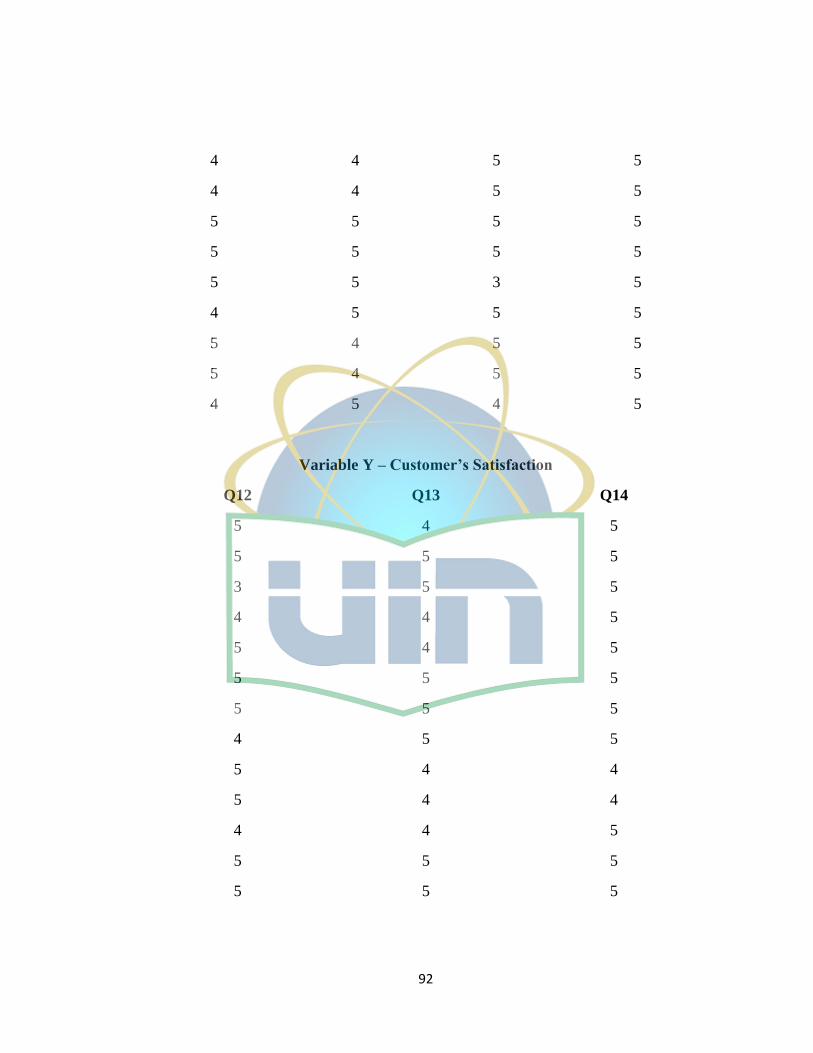
92
4 4 5 5
4 4 5 5
5 5 5 5
5 5 5 5
5 5 3 5
4 5 5 5
5 4 5 5
5 4 5 5
4 5 4 5
Variable Y – Customer’s Satisfaction
Q12 Q13 Q14
5 4 5
5 5 5
3 5 5
4 4 5
5 4 5
5 5 5
5 5 5
4 5 5
5 4 4
5 4 4
4 4 5
5 5 5
5 5 5

93
4 5 5
5 5 4
5 5 4
5 5 4
5 4 5
4 4 5
4 5 5
4 5 5
5 5 5
5 5 4
5 4 5
4 5 5
5 5 5
5 5 4
4 4 5
5 5 5
5 5 5
4 4 4
5 4 4
5 4 5
5 5 4
5 5 5
5 5 5
5 4 5
5 5 5

94
5 5 5
5 4 5
4 4 4
5 5 5
5 5 3
5 5 5
5 5 4
5 5 5
5 4 5
5 5 4
5 4 5
5 5 3
Appendix 3: Frequency of Respondents
Question 1
Frequency Percentage Valid
Percent
Cumulative
Percent
Valid
Agree 6 12% 12.0 12.0
Strongly Agree 44 88% 88.0 100.0
Total 50 100% 100.0
Question 2
Frequency Percent Valid
Percent
Cumulative
Percent
Valid Agree 7 14% 14.0 14.0
Strongly Agree 43 86% 86.0 100.0

95
Total 50 100% 100.0
Question 3
Frequency Percent Valid
Percent
Cumulative
Percent
Valid
Neutral 2 4% 4.0 4.0
Agree 6 12% 12.0 16.0
Strongly Agree 42 84% 84.0 100.0
Total 50 100% 100.0
Question 4
Frequency Percent Valid
Percent
Cumulative
Percent
Valid
Agree 7 14% 14.0 14.0
Strongly Agree 43 86% 86.0 100.0
Total 50 100% 100.0
Question 5
Frequency Percent Valid
Percent
Cumulative
Percent
Valid
Agree 21 42% 42.0 42.0
Strongly Agree 29 58% 58.0 100.0
Total 50 100% 100.0
Question 6
Frequency Percent Valid
Percent
Cumulative
Percent
Valid
Neutral 2 4% 4.0 4.0
Agree 16 32% 32.0 36.0
Strongly Agree 32 64% 64.0 100.0
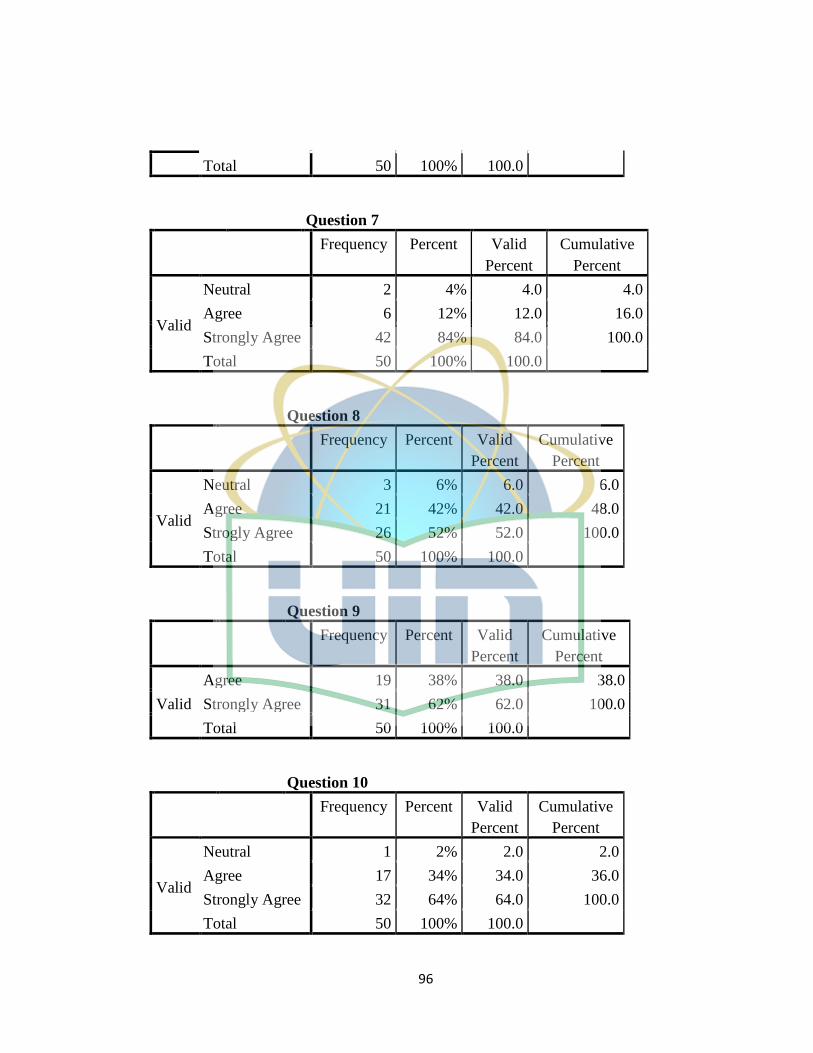
96
Total 50 100% 100.0
Question 7
Frequency Percent Valid
Percent
Cumulative
Percent
Valid
Neutral 2 4% 4.0 4.0
Agree 6 12% 12.0 16.0
Strongly Agree 42 84% 84.0 100.0
Total 50 100% 100.0
Question 8
Frequency Percent Valid
Percent
Cumulative
Percent
Valid
Neutral 3 6% 6.0 6.0
Agree 21 42% 42.0 48.0
Strogly Agree 26 52% 52.0 100.0
Total 50 100% 100.0
Question 9
Frequency Percent Valid
Percent
Cumulative
Percent
Valid
Agree 19 38% 38.0 38.0
Strongly Agree 31 62% 62.0 100.0
Total 50 100% 100.0
Question 10
Frequency Percent Valid
Percent
Cumulative
Percent
Valid
Neutral 1 2% 2.0 2.0
Agree 17 34% 34.0 36.0
Strongly Agree 32 64% 64.0 100.0
Total 50 100% 100.0

97
Question 11
Frequency Percent Valid
Percent
Cumulative
Percent
Valid
Agree 16 32% 32.0 32.0
Strongly Agree 34 68% 68.0 100.0
Total 50 100% 100.0
Question 12
Frequency Percent Valid
Percent
Cumulative
Percent
Valid
Neutral 1 2% 2.0 2.0
Agree 11 22% 22.0 24.0
Strongly Agree 38 76% 76.0 100.0
Total 50 100% 100.0
Question 13
Frequency Percent Valid
Percent
Cumulative
Percent
Valid
Agree 18 36% 36.0 36.0
Strongly Agree 32 64% 64.0 100.0
Total 50 100% 100.0
Question 14
Frequency Percent Valid
Percent
Cumulative
Percent
Valid
Neutral 2 4% 4.0 4.0
Agree 13 26% 26.0 30.0
Strongly Agree 35 70% 70.0 100.0
Total 50 100% 100.0

98
Appendix 4: Validity and Reliability Test
Questions r-count r-table Result
Promotion
Promotion 1 0.908 0.3673 Valid
Promotion 2 0.965 0.3673 Valid
Promotion 3 0.977 0.3673 Valid
Promotion 4 0.965 0.3673 Valid
Place
Place 1 0.874 0.3673 Valid
Place 2 0.964 0.3673 Valid
Place 3 0.809 0.3673 Valid
Price Valid
Price 1 0.840 0.3673 Valid
Price 2 0.974 0.3673 Valid
Price 3 0.827 0.3673 Valid
Price 4 0.942 0.3673 Valid
Customer Satisfaction
Customer Satisfaction 1 0.943 0.3673 Valid
Customer Satisfaction 2 0.918 0.3673 Valid
Customer Satisfaction 3 0.968 0.3673 Valid
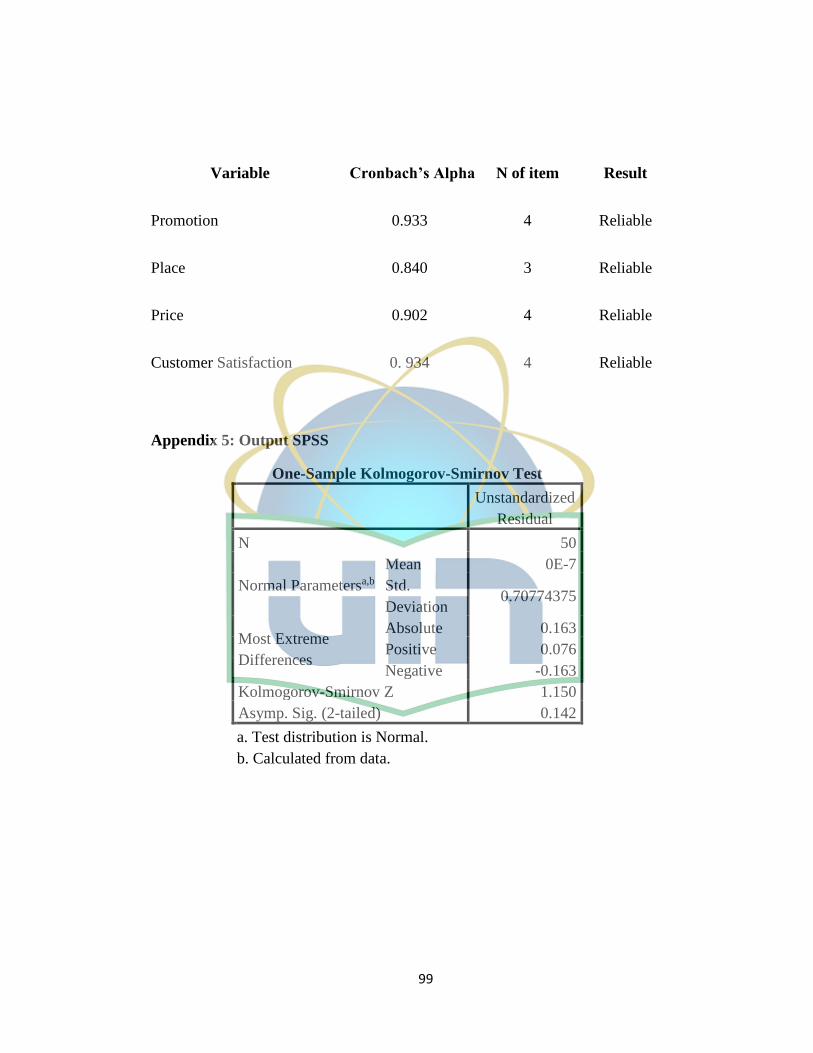
99
Appendix 5: Output SPSS
One-Sample Kolmogorov-Smirnov Test
Unstandardized
Residual
N 50
Normal Parametersa,b
Mean 0E-7
Std.
Deviation 0.70774375
Most Extreme
Differences
Absolute 0.163
Positive 0.076
Negative -0.163
Kolmogorov-Smirnov Z 1.150
Asymp. Sig. (2-tailed) 0.142
a. Test distribution is Normal.
b. Calculated from data.
Variable Cronbach’s Alpha N of item Result
Promotion 0.933 4 Reliable
Place 0.840 3 Reliable
Price 0.902 4 Reliable
Customer Satisfaction 0. 934 4 Reliable

100
Coefficientsa
Model Unstandardized
Coefficients
Standardized
Coefficients
t Sig.
B Std. Error Beta
1
(Constant) -0.248 1.508 -0.164 0.870
x1 0.128 0.045 0.302 2.864 0.006
x2 0.099 0.044 0.280 2.260 0.029
Coefficientsa
Model Unstandardized
Coefficients
Standar
dized
Coeffici
ents
t Sig. Collinearity
Statistics
B Std.
Error
Beta Tolera
nce
VIF
1
(Constant) -
0.248 1.508
-
0.164 0.870
x1 0.128 0.045 0.302 2.864 0.006 0.618 1.618
x2 0.099 0.044 0.280 2.260 0.029 0.448 2.231
x3 0.259 0.083 0.376 3.124 0.003 0.473 2.113
a. Dependent Variable: customer satisfaction

101
x3 0.259 0.083 0.376 3.124 0.003
a. Dependent Variable: customer satisfaction
ANOVAa
Model Sum of
Squares
df Mean
Square
F Sig.
1
Regression 53.136 3 17.712 33.195 0.000b
Residual 24.544 46 0.534
Total 77.680 49
a. Dependent Variable: cs
b. Predictors: (Constant), price, promotion, place