the influence of land use, zoogeographic history, and
TRANSCRIPT

THE INFLUENCE OF LAND USE, ZOOGEOGRAPHIC HISTORY, AND PHYSICAL
HABITAT ON FISH COMMUNITY DIVERSITY IN THE
LOWER BRAZOS WATERSHED
THESIS
Presented to the Graduate Council
of Texas State University-San Marcos
in Partial Fulfillment
of the Requirements
for the Degree
Master of SCIENCE
By
Benjamin J. Labay, B.S.
San Marcos, Texas
May 2010
THE INFLUENCE OF LAND USE, ZOOGEOGRAPHIC HISTORY, AND PHYSICAL
HABITAT ON FISH COMMUNITY DIVERSITY IN THE
LOWER BRAZOS WATERSHED
Committee Members Approved:
___________________________
Timothy H. Bonner, Chair
___________________________
Weston H. Nowlin
___________________________
Dean A. Hendrickson
Approved:
_____________________________
J. Michael Willoughby
Dean of the Graduate College

COPYRIGHT
by
Benjamin J. Labay
2010

iv
ACKNOWLEDGEMENTS
After more than a couple years working with Dr. Timothy Bonner, I have a massive
appreciation for not only the professional guidance and personal inspiration that he
offered, but the great depth of knowledge and endless patience he possesses. More than
anything, I couldn’t have asked for a better mentor in the field, where his passion and
work ethic cannot be matched. I thank Weston Nowlin for his guidance and never ending
stories and advice on all matters. I thank Dean Hendrickson for serving on my
committee, his dedication to fisheries ecology, and for his guidance with my student and
professional career. I also would like to thank Adam Cohen, without him, I would have
never discovered my love of seining, fish, and fish prints.
I thank many colleagues for their contribution to fieldwork, lab work, and
overall great experience I had at Texas State. First and foremost, thanks to the A-team in
the field, Robby Maxwell, Chad Thomas, Danielle Livingston, and Sarah McMillan.
Special thanks to Robby Maxwell who served as my right-hand man through thick and
thin and many dead animal carcasses. His fish knowledge, contagious persistence, and
unique sense of decency provided for fantastic field experiences. Thanks to Chad
Thomas for an unparalleled education in the field and the pleasure of working with a
legend. I thank Danielle Livingston and Sarah McMillan for their extensive help with
field work, their dedication to fisheries work, and putting up with my constant name
misspellings and indecision. I thank Chekka Lash, Jesse Becker, and Rodi Rodibaugh for

v
their help and spirit in the field and in class. I thank Nate Dammeyer for his persistence
to be contrarian (really), Zach Shattuck for his altruistic spirit and encouraging words,
Josh Perkin for his hard work and sarcastic sense of humor, Kristy Kollaus for her
guidance and integrity, and Clara Folb for her dedication to fisheries work. I thank many
other students, faculty, and staff at Texas State University-San Marcos that helped me
with through my time as a master's graduate student.
I would like to thank my family, with whom I wouldn't be where I am today. I
thank my mother, Kathy McCombs, my friend and biggest supporter. I thank my dad, Ed
Labay for his love and guidance. I thank my brother, Andy, for his friendship, love, and
for being my brother. I thank my sister, Amy, for her dedication to her family and for
being a great sister who gets to take the brunt of my joking jabs. I thank my grandfather
Ted Pancamo, my biggest hero. I thank my god-father, Bob Riegal, for his love and
inspiration. And I thank the rest of my family, for their love and support all these years.
This manuscript was submitted on March 16, 2010.
vi
TABLE OF CONTENTS
Page
ACKNOWLEDGEMENTS ............................................................................................... iv
LIST OF TABLES ............................................................................................................ vii
LIST OF FIGURES ......................................................................................................... viii
CHAPTER
I. THE INFLUENCE OF LAND USE, ZOOGEOGRAPHIC HISTORY, AND
PHYSICAL HABITAT ON FISH COMMUNITY DIVERSITY IN THE
LOWER BRAZOS WATERSHED
Introduction ...............................................................................................1
Methods .....................................................................................................4
Results .......................................................................................................11
Discussion .................................................................................................16
Tables and Figures ....................................................................................24
APPENDIX I. Abundances of fishes collected across sampling seasons for
sites within the Central Brazos, Lampasas, Yegua, Lower Brazos,
Little River, and Navasota subbasins ...................................................................34
APPENDIX II. Summary of the environmental parameters for Lower Brazos subbasin sites .......................................................................................................55
WORKS CITED ..................................................................................................61

vii
LIST OF TABLES
Table Page
1. Sampling site localities for the Brazos River watershed .............................................24
2. National Land Cover Data (NLCD 2001) categories with
reclassification scheme. ...............................................................................................25
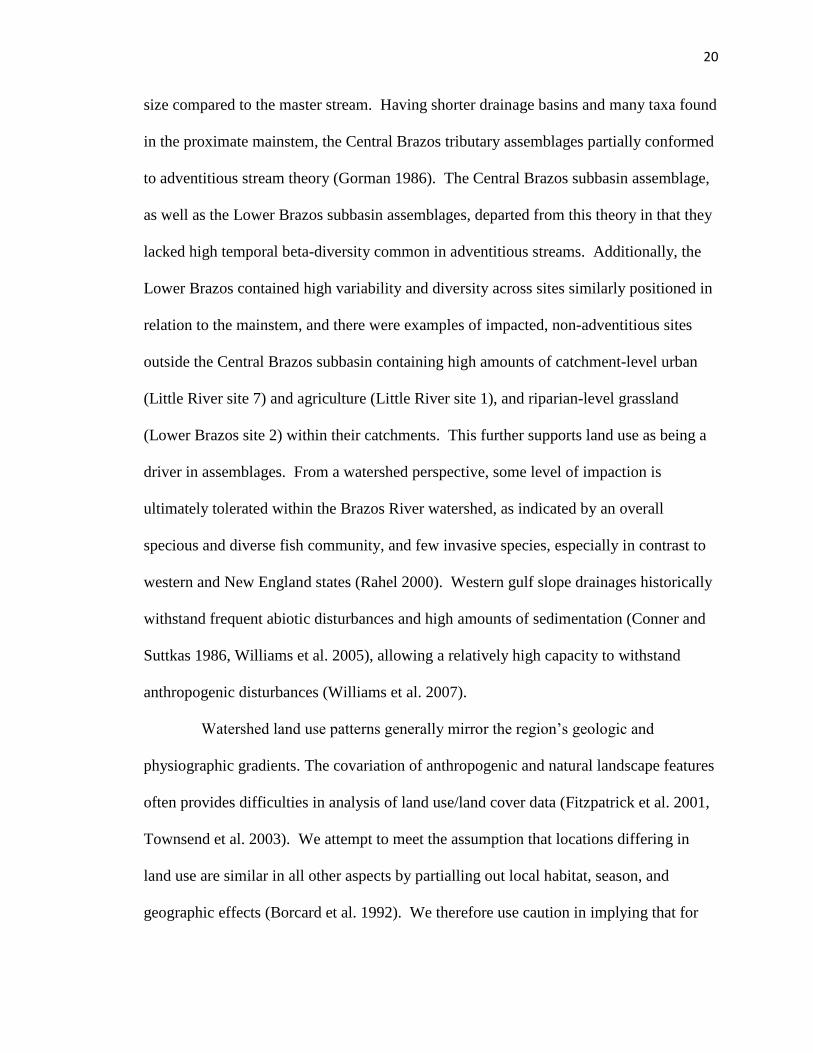
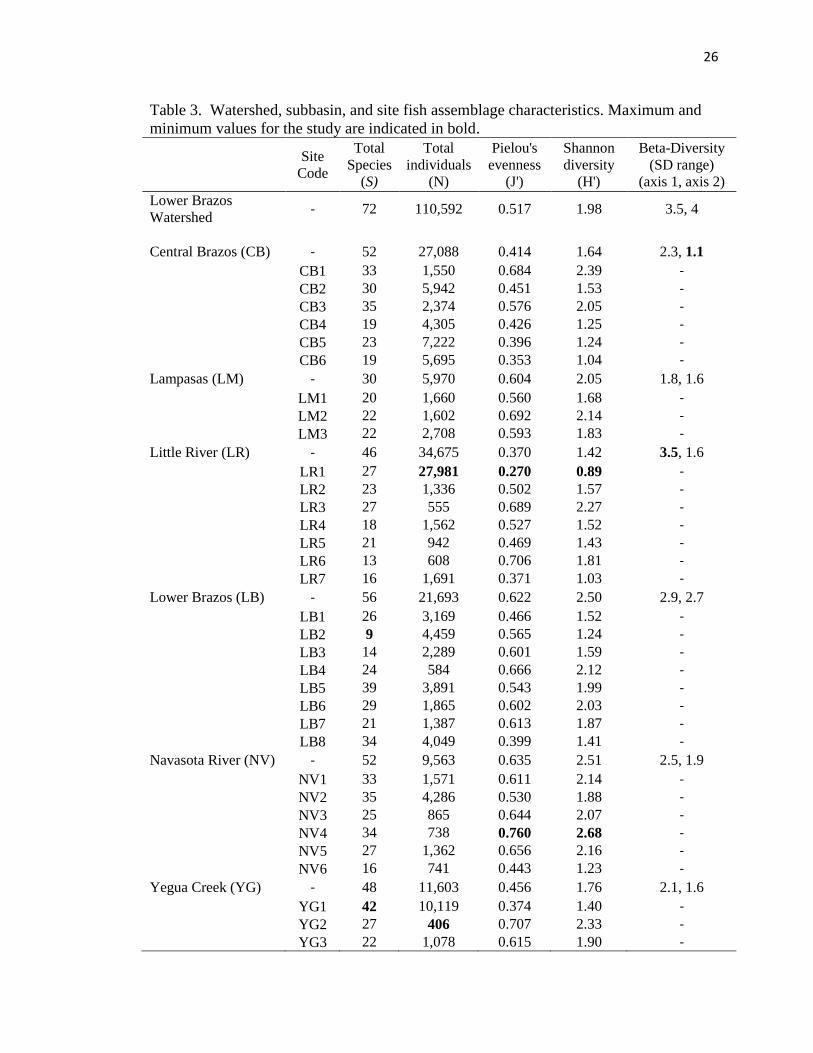
3. Watershed, subbasin, and site fish assemblage characteristics. ...................................26
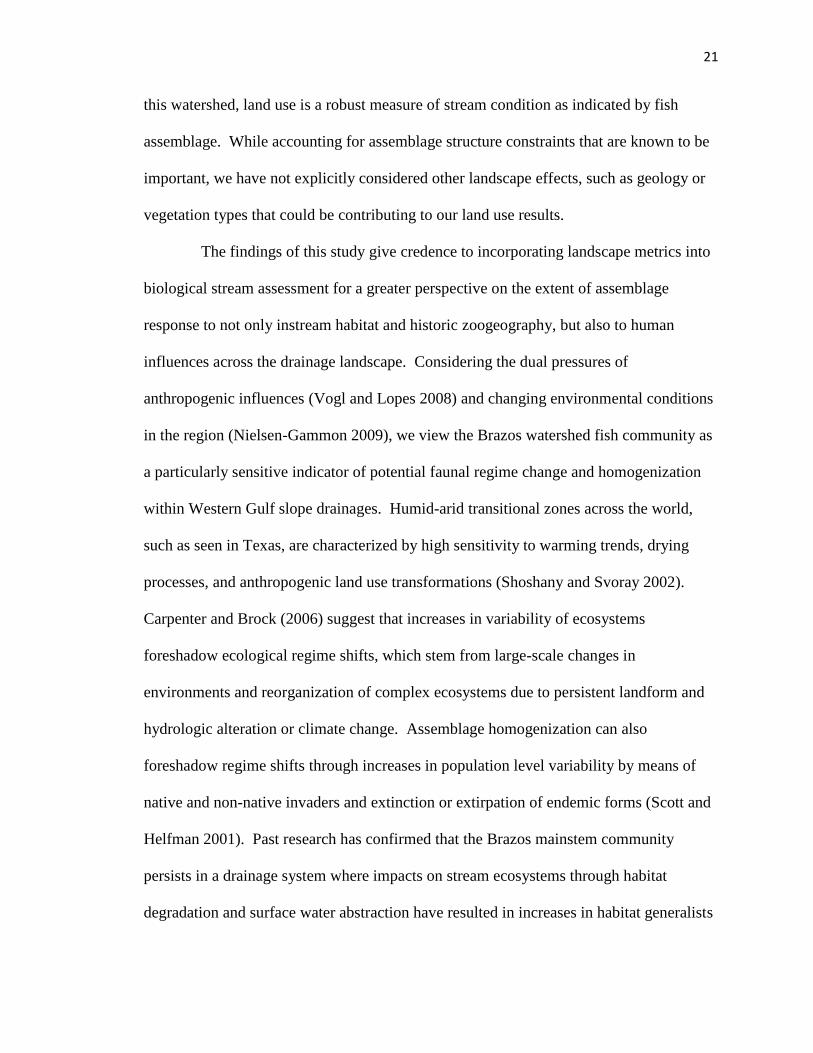
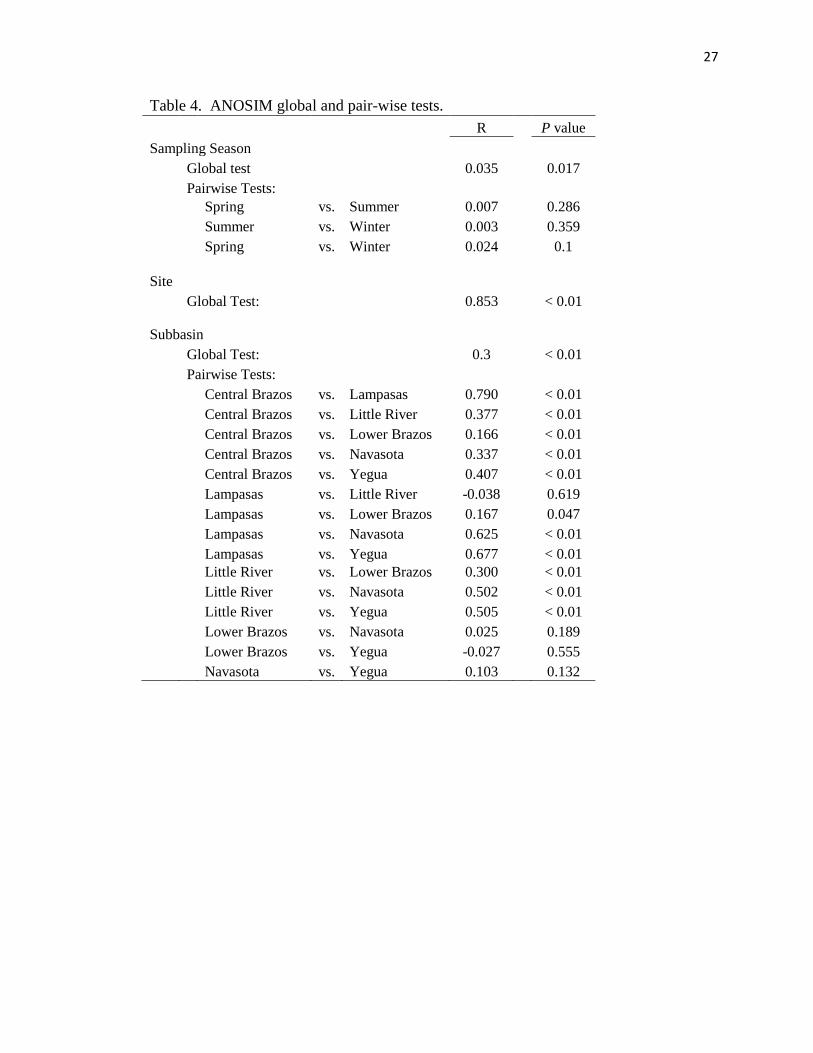
4. ANOSIM global and pair-wise tests ............................................................................27
viii
LIST OF FIGURES
Figure Page
1. Sampling sites and subbasins within the Lower Brazos River watershed ...................28
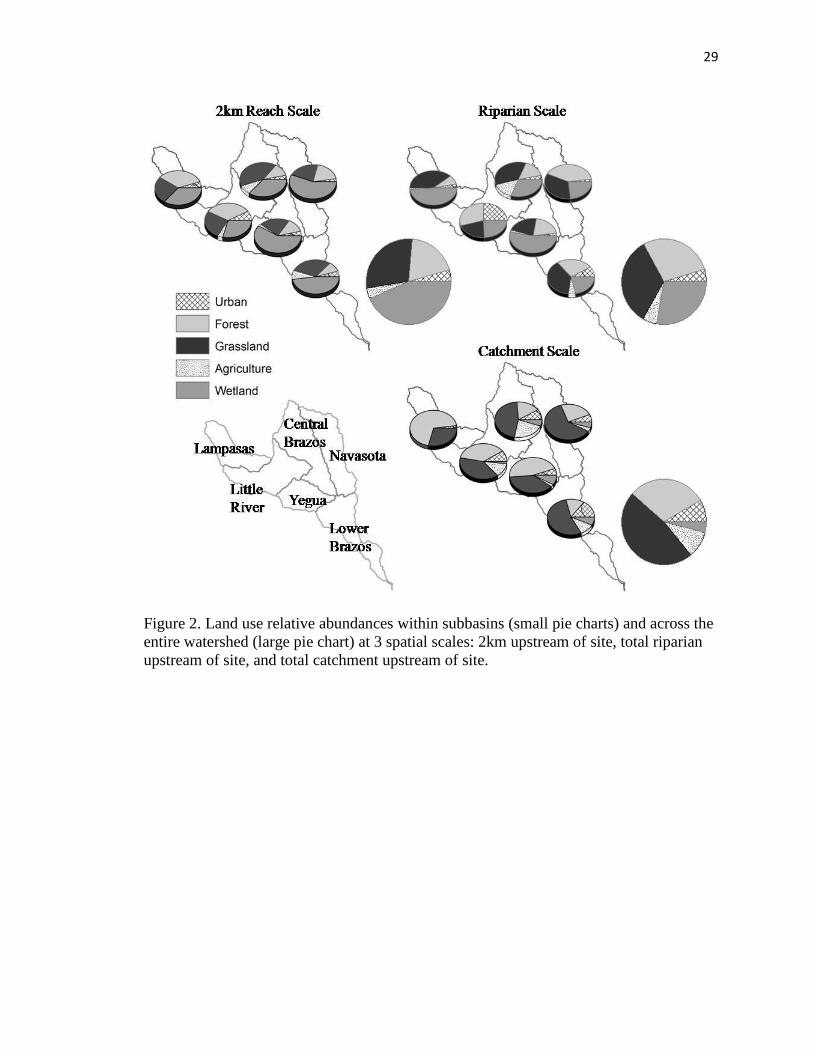
2. Land use relative abundances within subbasins (small pie charts) and across the
watershed (large pie charts) at 3 spatial scales: 2km upstream of site, total riparian
upstream of site, and total catchment upstream of site ................................................29
3. Sample Scores of Principal Component (PCA) axes I and II illustrating sample
scores............................................................................................................................30
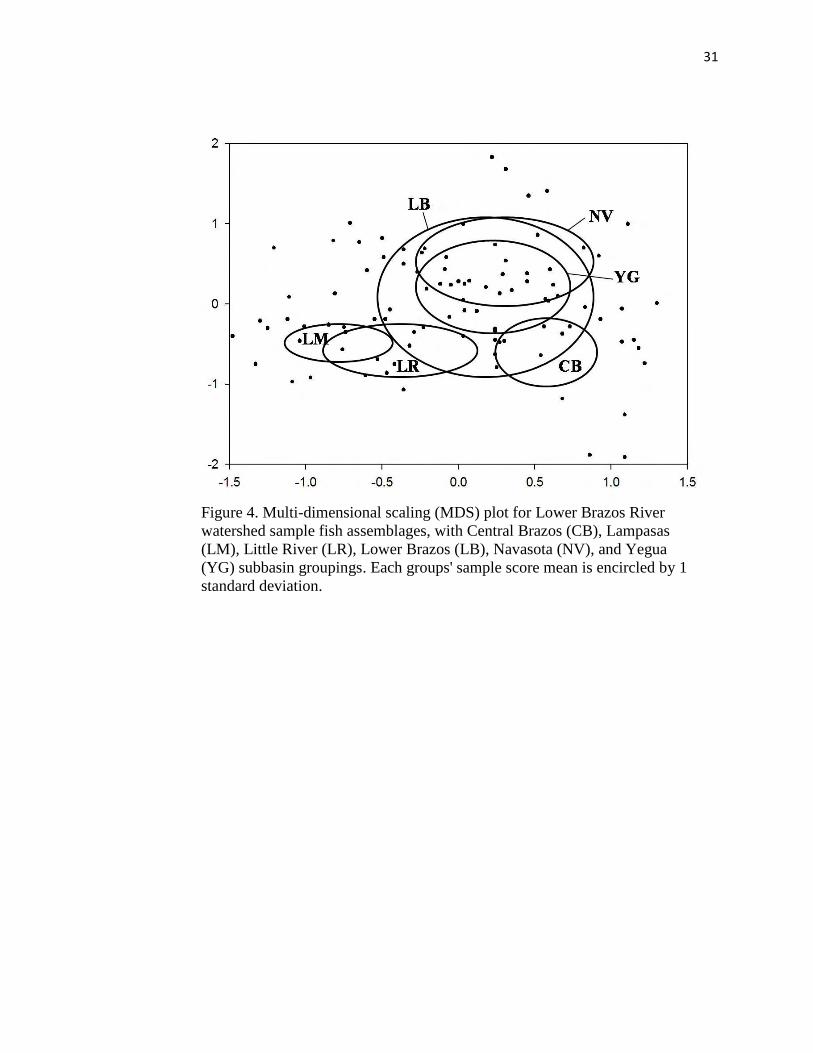
4. Multi-dimensional scaling (MDS) plot for Lower Brazos River watershed
sample fish assemblages, with Central Brazos (CB),Lampasas (LM), Little
River (LR), Lower Brazos (LB), Navasota (NV), and Yegua (YG)
subbasin groupings represented by the respective grouping’s sample score
means encircled by 1 standard deviation. ....................................................................31
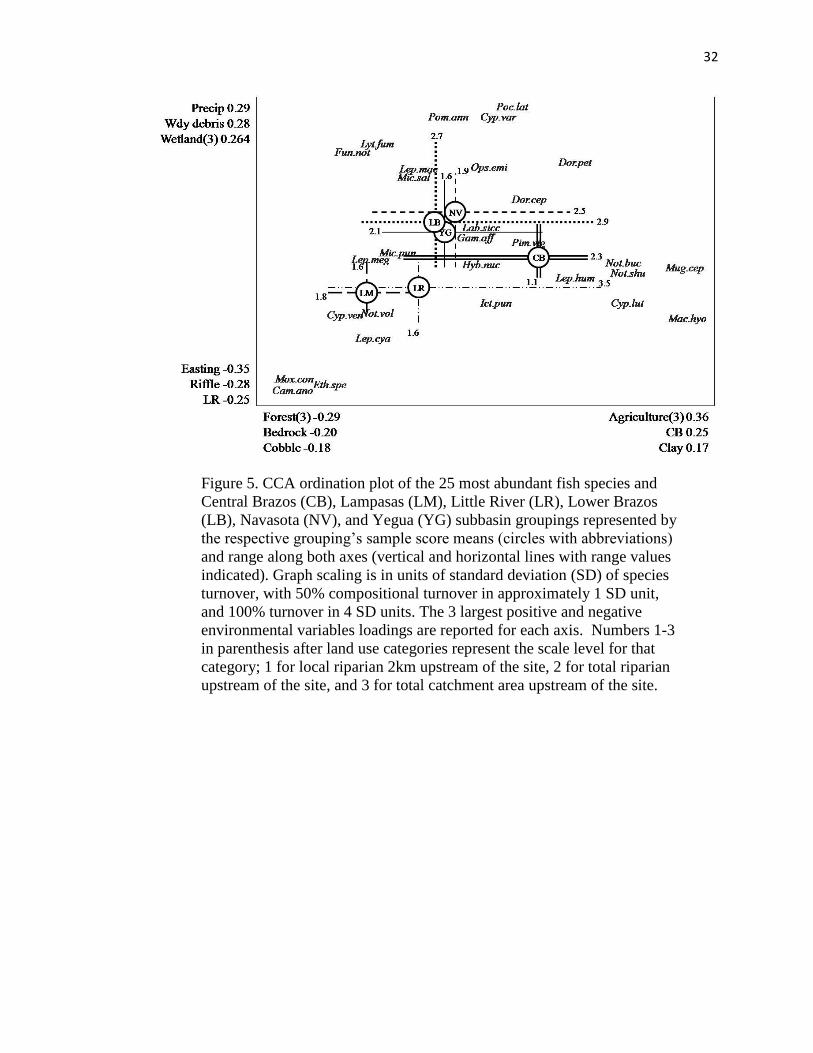
5. CCA ordination plot of top 25 most abundant fish species and Central
Brazos (CB), Lampasas (LM), Little River (LR), Lower Brazos (LB),
Navasota (NV), and Yegua (YG) subbasin groupings represented by the
respective grouping’s sample score means (circles with abbreviations) and
range along both axes (vertical and horizontal lines with range values
indicated)..........................................................................................................................32
6. CCA ordination plot with 10 land use category-scale combinations
as environmental variables and sample assemblage structure
characteristics as species. .................................................................................................33

1
CHAPTER I
THE INFLUENCE OF LAND USE, ZOOGEOGRAPHIC HISTORY, AND PHYSICAL
HABITAT ON FISH COMMUNITY DIVERSITY IN THE LOWER BRAZOS
WATERSHED
INTRODUCTION
River system communities are increasingly examined through the framework of
hierarchical networks of aquatic habitats interacting with the landscape (Strahler 1964,
Frissell et al. 1986, Ward et al. 2002). These “Riverscape” studies aim to investigate
riverine habitat, connectivity, and biotic gradient interactions in a multi-scale catchment
context (Allan et al. 2004). Stream researchers are increasing the scales by which they
interpret species-habitat relationships through advancement of ecological theory and
method concerning stream ecosystem functioning at larger watershed scales (Poff et al.
1997, Fausch et al. 2002, Benda et al. 2004, Ganio et al. 2005), through incorporation of
landscape ecology (Turner 2005), and through the increased use of high resolution cover
data combined with geographic information systems.
A large portion of riverscape studies have been conducted in response to
increased awareness of the degree to which anthropogenic actions threaten large
watershed health and community-level biodiversity (Folke et al. 1996, Angermeier and
Winston 1999). Habitat degradation is attributed by most to be the primary factor leading
to freshwater fish imperilment (Williams et al. 1989, Warren et al. 2000), and common

2
anthropogenic causal mechanisms include hydrologic alteration (Poff and Allan
1995, Ligon et al. 1995, Wang et al. 2001) and land use patterns (Allan et al. 1997,
Sponseller et al. 2001, Hascic 2006). Over the past decade, investigators have
increasingly succeeded in implicating landform and land use practices as substantial
influences on stream condition. Altered landscapes and their effects of sedimentation
(Henley et al. 2000), contamination (Woodward et al. 1997), riparian degradation
(Tabacchi et al. 1998), and altered flows (Winston et al. 1991), serve to mitigate natural
disturbance regimes, alter physiochemical conditions, and homogenize riverine habitat by
dampening environmental gradients. The partitioning and classification of habitat
stressor mechanisms related to biotic indicators and diversity patterns contributes to our
understanding of river health management, and is applicable to large watersheds when a
corresponding scale is utilized for interpretation and analysis.
Ward and Stanford (2006) stated that ecological integrity of floodplain rivers is
achieved through a diversity of water bodies with differing degrees of interaction with the
mainstem, allowing a wide range of successional stages and forming a mosaic of habitat
patches across the floodplain. This approach to river health can be applied to a large
drainage network (Billen et al. 2007). Different subbasins within a watershed form
habitat patches from which heterogeneity, thus community-level biodiversity, is gained.
The incremental loss of watershed biodiversity is a function of local and regional
extirpations that reflect populations sensitivities to decreasing habitat area and isolation
(Angermeier 1995). This concern is prevalent in Western Gulf slope (WGS) drainages
where diverse taxa includes many that experience the extent of their western or eastern
geographic ranges within a context of sharp environmental clines (Hubbs 1957), a long
3
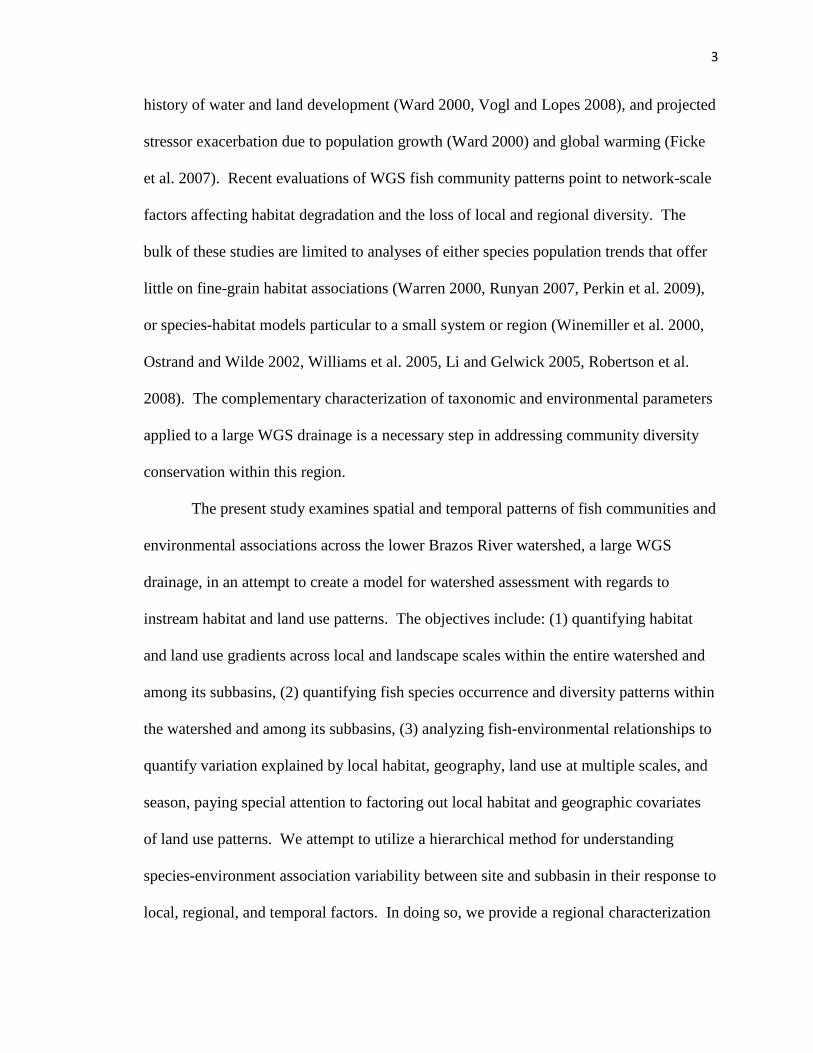
history of water and land development (Ward 2000, Vogl and Lopes 2008), and projected
stressor exacerbation due to population growth (Ward 2000) and global warming (Ficke
et al. 2007). Recent evaluations of WGS fish community patterns point to network-scale
factors affecting habitat degradation and the loss of local and regional diversity. The
bulk of these studies are limited to analyses of either species population trends that offer
little on fine-grain habitat associations (Warren 2000, Runyan 2007, Perkin et al. 2009),
or species-habitat models particular to a small system or region (Winemiller et al. 2000,
Ostrand and Wilde 2002, Williams et al. 2005, Li and Gelwick 2005, Robertson et al.
2008). The complementary characterization of taxonomic and environmental parameters
applied to a large WGS drainage is a necessary step in addressing community diversity
conservation within this region.
The present study examines spatial and temporal patterns of fish communities and
environmental associations across the lower Brazos River watershed, a large WGS
drainage, in an attempt to create a model for watershed assessment with regards to
instream habitat and land use patterns. The objectives include: (1) quantifying habitat
and land use gradients across local and landscape scales within the entire watershed and
among its subbasins, (2) quantifying fish species occurrence and diversity patterns within
the watershed and among its subbasins, (3) analyzing fish-environmental relationships to
quantify variation explained by local habitat, geography, land use at multiple scales, and
season, paying special attention to factoring out local habitat and geographic covariates
of land use patterns. We attempt to utilize a hierarchical method for understanding
species-environment association variability between site and subbasin in their response to
local, regional, and temporal factors. In doing so, we provide a regional characterization
4
of watershed diversity that emphasizes landscape-scale processes and allows insights
relevant to conservation across watershed communities.
METHODS
Study Area
The Brazos River is one Texas’ largest drainages, flowing 820 miles from its
origin near the Texas-New Mexico border to its mouth at Freeport. Draining 71,000 km2,
the Brazos watershed provides approximately 25.55 billion liters of water per year for
agriculture, industry, and consumption (Brazos River Authority, http://www.brazos.org/).
The Lower Brazos River Watershed experiences environmental conditions similar to
those of most major western Gulf slope drainages, in that it drains mostly range and
agriculture land into a warm-water, meandering floodplain river known for both high
turbidity and flow. The study area for this study encompasses 31,569 km2
and is defined
by the drainage area downstream of Waco, Texas excluding the Leon River watershed.
The major tributaries and subbasins of the study area drain a number of ecoregions
including the Central Texas Plateau, Texas Blackland Prairie, East Central Texas Plains,
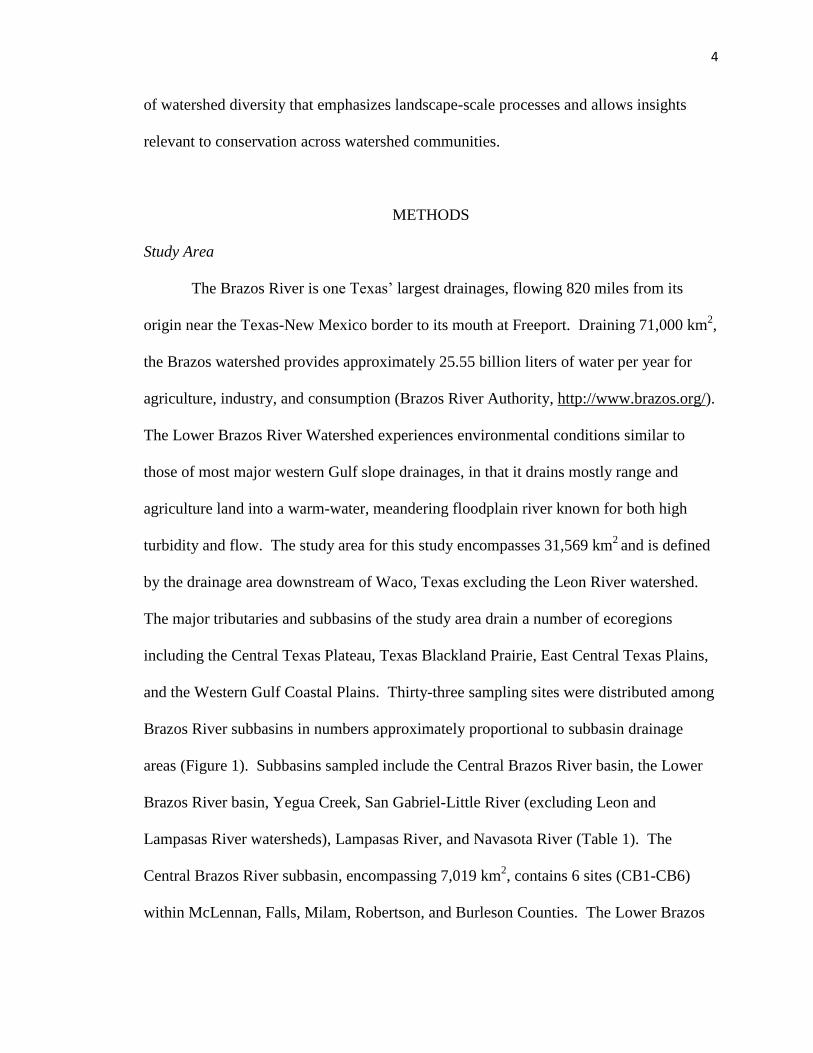
and the Western Gulf Coastal Plains. Thirty-three sampling sites were distributed among
Brazos River subbasins in numbers approximately proportional to subbasin drainage
areas (Figure 1). Subbasins sampled include the Central Brazos River basin, the Lower
Brazos River basin, Yegua Creek, San Gabriel-Little River (excluding Leon and
Lampasas River watersheds), Lampasas River, and Navasota River (Table 1). The
Central Brazos River subbasin, encompassing 7,019 km2, contains 6 sites (CB1-CB6)
within McLennan, Falls, Milam, Robertson, and Burleson Counties. The Lower Brazos
5
River subbasin, encompassing 5,379 km2, contains 8 sites (LB1-LB8) within
Washington, Austin, Waller, and Fort Bend Counties. Yegua Creek subbasin,
encompassing 3,408 km2, contains 3 sites (Y1-Y3) within Lee, Washington, and
Burleson Counties. San Gabriel-Little River subbasin, hereafter referred to as Little
River subbasin, encompassing 6,083 km2, contains 7 sites (LR1-LR7) within Williamson
and Milam Counties. Lampasas River subbasin, encompassing 3,890 km2, contains 3
sites (L1-L3) within Bell and Lampasas Counties. Navasota River subbasin,
encompassing 5,789 km2, contains 6 sites (N1-N6) within Grimes, Robertson, Madison,
and Limestone Counties. Hydrologic conditions during the study period were
characterized by mean daily, monthly, and annual discharge as recorded by the U.S.
Geological Service (USGS) gaging station #08105700 (San Gabriel River at Laneport),
#08106500 (Little River near Cameron), #08110800 (Navasota River near Bryan),
#08108700 (Brazos River near Bryan), and #08116650 (Brazos River near Rosharon).
Discharge data for the Brazos River near its mouth (USGS Station No. 08116650 at
Rosharon, TX) showed overall watershed low flow conditions with mean discharge for
the period of study of 126 m3/s (28
th percentile) compared to a mean of 229.7 m
3/s over
the period of record (1967-2008). During the sample period, the Brazos River’s daily
mean discharge at Rosharon ranged from 643 m3/s on May 20
th, 2008 to 5.1 m
3/s on
August 30th
, 2008.
Land use Data
Land use/land cover (LULC) data were available in the form of the multi-
resolution Land Characteristics Consortium (MRLC) National Land Cover Dataset
6
(NLCD 2001, Homer et al. 2007). The NCLD contains 15 categories of land cover for
the Brazos watershed. We utilized a simplified LULC scheme of five categories (urban,
agriculture, forest, grassland, and wetland) based on Anderson et al. (1976) level I
classification scheme created for natural resource applications. Utilizing ArcGIS
(ArcView 9.3, 2007) and ArcHydro (Maidment, 2002), LULC data were quantified at
local (100 meter buffer, extending 2km upstream of the site), riparian (100 meter buffer
of total reach upstream of site), and catchment (cumulative catchment area upstream of
site) spatial scales. These three scales are widely used in studies relating landscape
variables to biotic or abiotic measures of stream condition (Allan 2004). To reduce the
effects of multicollinearity in the 5 categories of land use among 3 nested spatial scales, a
Spearman rank correlation matrix was performed using the statistical package R (R
Development Core Team, http://www.R-project.org). Any significant (α ≤ 0.05)
correlation across spatial scales for each category resulted in the exclusion of the smaller
scale. By using this data reduction technique, we do not attempt to discover which scale
best explains fish community variation, rather which individual land use category-scale
combinations contribute most to explaining fish assemblage variation. The category
reclassification schemes as well as the category-scale combinations retained are listed in
Table 2.
Site habitat data
Sites were sampled in spring, summer, and winter from February 2008 to January
2009 representing 3 sampling seasons. Separate habitats (i.e., riffle, pool, and run) within
each site were sampled and processed independently to address physical habitat and fish

7
community geomorphic unit associations at the time of capture. Physical habitat
surveyed included habitat length, width, water depth, current velocity, percent substrate,
percent woody debris, percent aquatic vegetation, and percent canopy cover. Geomorphic
unit mean water depth and velocity were calculated from measurements at three
equidistant points along three equidistant transects perpendicular to flow. Water depths
were measured to the nearest centimeter using a graduated wading rod and current
velocity was measured to the nearest cm/s at 0.6 times the water depth above bottom
using a Marsh-McBirney Flowmate 2000 electromagnetic flow meter. Percent substrate
for each geomorphic unit was categorized along transects and classified as clay, silt, sand,
gravel, cobble, boulder, or bedrock using a modified Wentworth scale (Rosgen 1996).
Percent coverage of aquatic vegetation, percent woody debris, and overhanging riparian
cover for each geomorphic unit were visually estimated along transects (Williams et al.
2005). Physicochemical parameters including temperature (°C), dissolved oxygen
concentration (mg/L), conductivity (mS/cm), and pH were measured once on each site-
date using a YSI-Model 650 multiprobe meter. Mean annual flow and cumulative
drainage was determined for each site using the USGS National Hydrography Dataset
(http://nhd.usgs.gov/).
Fish data
Fishes were collected using a combination of seines (2.4 x 1.8 m straight seine
and 5 x 1.2 x 1.2 m bag seine with 3.2-mm mesh), a Smith-Root backpack electrofisher,
and a boat-mounted electrofisher. Sample effort for each geomorphic unit was
proportional to the amount of habitat found at the site. Fishes were collected from a
8
geomorphic unit until few individuals and no additional species were collected following
several successive seine hauls or electrofishing passes. Fishes were identified and
enumerated in the field according to Hubbs et al. (1991). Fishes not identified in the field
were preserved and identified in lab according to Hubbs et al. (1991). All fishes were
released with the exception of voucher specimens of each species from each site-date
combination. Vouchers were euthanized in tricane methanesulfonate (MS-222), and
preserved in 10% formalin for ~14 days, rinsed with water, and transferred to 70%
ethanol. Vouchers are catalogued and stored in the Texas Natural History Collection at
the Texas Natural Science Center at University of Texas at Austin. Fishes too large to
properly voucher were photographed, measured, and released at the capture site.
Statistical Analysis
Site specific physical habitat data were analyzed using the multivariate technique
of Principal Component Analysis (PCA; ter Braak 2002) to assess spatial and temporal
patterns of physical habitat variance (Rahel and Hubert 1991, Matthews and Marsh-
Matthews 2006). Qualitative variables (i.e., season) were represented by dummy
variables and quantitative variables (i.e., percent substrate, depth and velocity) were z-
score transformed (Krebs 1999, Williams et al. 2005, Williams and Bonner 2006).
Resulting component loadings and plots were used to illustrate habitat patterns seen
across sites, subbasins, and sampling season.
Site fish assemblage structure within sampling and among sampling seasons and
subbasins were characterized by species richness (S), species abundance (n), diversity
(H'), and evenness (J') indices calculated with PRIMER (version 6; Clarke and Gorley

9
2006). Diversity was calculated using Shannon-Wiener index (H’; Krebs, 1972), and
evenness was represented by Pielou’s evenness index (J'; Pielou, 1966). Bray-Curtis
similarity indices (Bray and Curtis 1957) were calculated for species abundance data
among samples. The resulting matrix was tested with analysis of similarities (ANOSIM
(within PRIMER); Clarke and Green 1988, Clarke 1993), after data were fourth-root
transformed to standardize the contributions of high and low abundant species (Warwick
1988). A one-way ANOSIM with sampling season as a factor was performed to assess
seasonal effects on assemblage structure (α = 0.05; 9,999 permutations), with site as a
factor to test fish assemblage similarity among sites within the Lower Brazos watershed
(α = 0.05; 9,999 permutations), and with site assemblages pooled over sampling season
with subbasin as a factor to test fish assemblage similarity among subbasins within the
Lower Brazos watershed (α = 0.05; 9,999 permutations). Multi-dimensional scaling
(MDS) was used to characterize differences in site communities within the watershed and
among subbasins by representing dissimilarity distances in a two-dimensional plane
(Clarke and Gorley 2006) (Figure 4).
Canonical Correspondence Analysis (CCA; ter Braak 2002) was applied to
identify: (1) species-environment relationships among site samples (n = 99) within the
Lower Brazos watershed, and (2) site assemblage structure (richness (S (total species, N)
& d ((S-1)/Log(N))), diversity (Shannon-Wiener (H') and Simpon's (1-λ')), evenness (J'),
and total abundance (n)) relationship with land use category-scale combinations retained
from the Spearman-rank correlation reduction technique. CCA is a direct gradient
analysis that uses multiple regression to find a linear combination of environmental
variables that maximizes the dispersion of species’ abundances using weighted averaging
10
to maximize the covariance among species’ sample scores (Jongman et al. 1995).
Utilizing a derivation of CCA with Hill’s scaling and focusing on inter-sample distances
gave two advantages for the species-environment analysis. The first was that the samples
scores are in standard deviation units (SD; Hill 1979, Hill and Gauch 1980) of species
turnover (beta-diversity), allowing compositional turnover gradient length values for
nominal environmental classes along axes to be interpreted and compared. A 50 percent
change in species composition occurs within 1 to 1.4 SD units while a complete turnover
in composition in approximately 4 SD units (Gauch, 1982). The second was that it
allowed for the use of the distance rule, an extension of the centroid principle for long
gradients (strong unimodal response), stating that samples that are close to a species'
point are more likely to contain the species than a sample that is far from the species'
point (ter Braak and Smilauer 2002). This allows one to interpret a joint plot of species-
samples with the perspective that the rank order of abundance can be inferred from the
distances of the samples to the species' point.
A variance partitioning method (pCCA)(Borcard et al. 1992) was used on the
species-environment dataset to assess pure local habitat, land use, geographic, seasonal,
and shared effects on fish community variation by producing a reduced CCA model for
each effect with the remaining effects as covariates. Local habitat included the 14
variables with the highest loadings from the PCA performed on site habitat data,
geographic variables included 6 subbasin dummy variables as well as site northing and
easting, land use variables included the reduced set of 10 categories, and sampling season
included dummy variables for spring, summer, and winter sampling season. To minimize
the influence of highly skewed distributions of species abundances, data were log (x+1)

11
transformed. Rare species were down-weighted using CANOCO as they can be
misleading outliers in ordination plots (Gauch 1982). To test significance (P < 0.05) of
variation explained, a Monte Carlo randomization test (1000 permutations) was
performed on each CCA model (ter Braak and Smilauer 2002).
RESULTS
Land Use and Habitat Characterization
Relative abundance of land use categories varied among spatial scales and
among major tributary subbasins of the Lower Brazos watershed (Figure 2). For the
entire watershed, wetlands (43%) and grassland (29%) were the predominate land use at
the local (2 km) scale, grassland (34%) and forest (28%) at the riparian scale, and
grassland (47%) and forest (30%) at the catchment scale. Among subbasins, Western
drainages contained high percentages of forest, drainages along the mainstem contained
the highest proportions of agriculture land use, and eastern drainages contained the
highest proportions of grassland and wetlands. Ten category-scale combinations were
retained after collinear combinations were evaluated and the smaller of any two
significantly correlated within-category scales were eliminated (Table 2).
Physical habitat parameters (Appendix I) varied within the watershed across a
north to south substrate and precipitation gradient. Northwestern sites were associated
with larger proportions of coarse sediment, riffles, and higher current velocities.
Southeastern sites were associated with greater percentages of fine sediments, runs,
pools, and woody debris. Principal Component axes I and II together explained 37.7% of
the variation in habitat data among site samples within the Lower Brazos watershed
(Figure 3). PC I (23.6 % of total variation) represented a woody debris-substrate gradient

12
with strong positive loadings for riffle (0.75), cobble (0.71), and bedrock (0.62) and
strong negative loadings for woody debris (-0.60), run (-0.55) and silt (-0.54). PC II
(14.1 %) represented a geomorphic unit-substrate-velocity gradient. Samples with strong
positive loadings for PCII were characterized by high proportions of pools (0.86), clay
substrates (0.44), and woody debris (0.22), whereas those with strong negative loadings
were characterized by high proportions of runs (-0.61), higher velocities (-0.44), and sand
substrates (-0.42). Samples within the Lampasas subbasin and the uplifted Edwards
Plateau portions of the Little River subbasin segregated from other subbasins with coarser
substrates and higher proportions of riffle habitat, whereas Yegua Creek, Navasota, and
Lower Brazos subbasin samples overlapped in habitat dominated by runs, silt, and woody
debris. The Central Brazos subbasin samples scored intermediate between the former
two groupings.
Fish Community Characterization
A total of 110,592 individuals representing 20 families and 72 species were
collected from the Lower Brazos watershed (Appendix I-V). The most abundant families
were Cyprinidae (75% in relative abundance), followed by Poeciliidae (11%),
Centrarchidae (7%), and Fundulidae, Clupeidae, Atherinopsidae, and Percidae each
comprising about 1% of the total fish assemblage. Cyprinidae and Centrachidae with 16
species each were the most species-rich families. Cyprinella lutrensis (41%), Pimephales
vigilax (15%), Cyprinella venusta (12%), Gambusia affinis (10%), Lepomis megalotis
(3%), and Lythurus fumeus (3%) were the most abundant species. Introduced species
Cyprinus carpio (Common Carp), Pterygoplichthys disjunctivus (Vermiculated Sailfin

13
Catfish), and Lepomis auritus (Redbreast Sunfish) collectively represented 4.3% of the
total lower Brazos watershed assemblage.
Among fishes with small geographic ranges or considered rare in Texas or this
study area, one specimen of Etheostoma parvipinne (Goldstrip Darter) was collected at
Yegua Creek site 3, and one specimen of Macrhybopsis storerinana (Silver Chub) was
collected at Central Brazos site 3. Six Lepomis marginatus (Dollar Sunfish) and 15
Elassoma zonatum (Pygmy Sunfish) were collected at Lower Brazos site 6. Eight
Lepomis symmetricus (Bantam Sunfish) were collected from Lower Brazos site 4.
Moxostoma congestum (Gray Redhorse) was common in the Lampasas drainage (2.4%
subbasin abundance), with only 13 specimens found in the Little River subbasin, and one
at Central Brazos site 5. Micropterus treculii (Guadalupe Bass) was found in the
Lampasas (57 individuals, < 1%), and Little River (66 individuals, < 1%) subbasins.
Fish abundance across all sampling seasons was highest at Little River Site 1 (n
= 27,981) and Yegua Site 1 (n = 10,119) and lowest at Yegua Site 2 (n = 406) and Little
River Site 3 (n = 555). Species richness (S) for sites among sampling seasons ranged
from 5 (Lower Brazos Site 2, winter) to 33 (Yegua Site 1, winter), and 9 (Lower Brazos
Site 2) to 42 (Yegua Site 1) for site assemblage data pooled over sampling season. Site
evenness (Pielou’s, J’) ranged from 0.146 (Little River Site 1, summer) to 0.855 (Yegua
Site 2, spring) for all samples, and 0.270 (Little River Site 1) to 0.760 (Navasota Site 4)
for site assemblage data pooled over sampling season. Shannon diversity (H’) ranged
from 0.43 (Little River Site 1, summer) to 2.50 (Navasota Site 4, spring) for all samples,
and 0.89 (Little River Site 1) to 2.68 (Navasota Site 4) for site assemblage data pooled

14
over sampling season. Watershed, subbasin, and site fish assemblage characteristics are
shown in Table 3.
Fish assemblage similarity among sampling seasons differed overall (ANOSIM
global R = 0.012, P = 0.018), but no pair-wise test was significant (Table 4). Small
differences in seasonal assemblage structure can be attributed to increased abundances of
C. lutrensis and P. vigilax during winter sampling. Site fish assemblages pooled across
seasons (ANOSIM global R = 0.853, P < 0.01), and subbasin groupings of site fish
assemblages (ANOSIM global R = 0.3, P < 0.01) differed across the Lower Brazos
watershed. Pair-wise tests indicate three groupings of similar fish assemblages (P <
0.05): (1) Lampasas and Little River, (2) Navasota, Lower Brazos, and Yegua, and (3)
the Central Brazos subbasin. The multi-dimensional scaling plot for sites pooled across
seasons further substantiates this finding with high overlap in assemblages groupings
listed above (Figure 4). The Lower Brazos watershed shows the largest spread of sample
values, indicating high variance in assemblage structure within the subbasin. Conversely,
the Lampasas River subbasin sample values are tightly clustered, indicating low
assemblage structure variance relative to the other subbasins.
Fish-Environment Relationships
Physical habitat, land use, geography, and sampling season together accounted
for 54.1% (P < 0.01) of the variation in the Lower Brazos watershed fish assemblage.
Pure effects of physical habitat parameters accounted for 15.4% (P < 0.01), land use
14.8% (P < 0.01), geography 9.6% (P < 0.01), and sampling season 2.4% (P < 0.01) of
fish assemblage variation. Shared effects among local habitat, geography, land use and
15
sampling season accounted for 11.9% of fish assemblage variation. CCA I, explaining
21.1% of variation, described a substrate and land use gradient, and CCA axis II (16%)
described a land use, geographic, and woody debris gradient. Habitat parameters with the
strongest negative loadings (biplot scores) on CCA axis I were forest land use at
catchment scale (-0.29), bedrock (-0.20), and cobble (-0.18). The strongest positive
loadings for CCA axis I include agriculture land use at catchment scale (0.36), Central
Brazos subbasin (0.25), and clay (0.17). The strongest loadings for CCA axis II include
site easting (-0.35), riffle (-0.28), and Little River subbasin (-0.25) as negative values,
and percent woody debris (0.28), wetland land use at catchment scale (0.26) and
grassland land use at catchment scale (0.26) as positive values. Species with strong
loadings for CCA axis I include P. carbonaria (-3.09), C. anamolum (-2.37), and M.
congestum (-2.30) for negative values, and M. hyostoma (3.40), M. cephalus (3.40) and
P. disjunctivis (3.29) for positive values. Fish species expressing a strong interaction
with CCA axis II include L. auritus (-3.38), C. anomalum (-2.78), and A. monticola (-
2.76) with negative values, and L. symmetricus (5.17), F. chrysotus (4.63), and L. gulosus
(3.30) with positive values. The species compositional turnover gradient length for
samples among the Lower Brazos watershed was 3.5 SD units between Little River site 1
(summer) and Lampasas site 2 (winter) on axis 1, and 4 SD units between Lower Brazos
site 4 (summer) and Lampasas 2 (winter) on axis 2 (Figure 5), indicating an
approximately 100% compositional turnover between these two samples.
Patterns of land use category-scale combinations explained 20% of site
assemblage structure characteristics (Figure 6). CCA axis I illustrated a land cover
impaction gradient with positive loadings associated with catchment scale urban (0.66)
16
and agriculture (0.59), and local scale grassland (0.36), and negative loadings associated
with catchment scale wetland (-0.46), forest (-0.41) and grassland (-0.30). Samples with
positive loadings on axis II were associated with forest at the riparian (0.61) and local
(0.38) scale, and urban at the catchment scale (0.23), whereas samples resulting in
negative loadings on axis II had high proportions of catchment scale wetland (-0.41) and
agriculture (-0.34), and riparian scale urban (-0.34). Site assemblage characteristics of
evenness (Peilou’s J), diversity (Shannon and Simpson), and richness (S and d) grouped
together on the opposite end of the primary axis from assemblage total abundance (N) as
well as the impaction land use metrics of catchment agriculture and urban, and local
grassland.
DISCUSSION
Comparison of the six subbasins within the Lower Brazos subbasin illustrated
three assemblage groupings, which can be described as western, mainstem, and eastern
affiliated fish communities. Western drainages within the Lampasas and Little River
subbasins had high abundances of fluvial specialists such as Central Stoneroller (C.
anamolum), and Orangethroat Darter (E. spectabile). The Central Brazos subbasin is an
intermediate between the western upland region and the eastern and coastal drainages, by
having a fish assemblage that closely mirrors what we know to be a mainstem Brazos
River community (Bonner and Runyan 2007); including high abundances of Ghost
Shiner (Notropis buchanani), Silverband Shiner (Notropis shumardi), and Shoal Chub
(Macrhybopsis hyostoma). The eastern assemblage grouping within Yegua, Navasota,
and Lower Brazos subbasins include high abundances of fluvial generalists and slack-

17
water-associated taxa including Ribbon Shiner (Lythurus fumeus), Blackstripe
Topminnow (F. notatus), and White Crappie (P. annularis). The distinctiveness of these
three assemblage groupings is primarily related to a combination of habitat availability,
zoogeographic history, and land use patterns.
Local physical habitat was the primary factor explaining patterns of assemblage
variation among samples. Physical habitats within and among subbasins are directly
related to the geological history of the region. Western catchments within the uplifted,
limestone dominated Edwards Plateau region have higher gradients, swifter currents, and
more shallow-water riffle habitat. The Little River subbasin for example, has instream
habitat transitions from high gradient to low gradient streams, and not surprisingly, had
the highest beta diversity for both physical environment and fish taxa. This faunal cline
approaches a full compositional turnover within a relatively short geographic distance as
the western and headwater assemblages transition into a mainstem assemblage near the
confluence with the Brazos River, conforming to longitudinal gradient models for warm-
water streams (Schlosser 1987). The central and eastern subbasin drainages, with
Cenozoic alluvium deposits, have lower gradient streams with higher amounts of clay
and fine substrates, greater depths, greater amounts of woody debris, and slower currents.
The interconnected, avulsion-prone drainages within the southeastern portion of the
watershed provide a wide range of physical habitat and relatively unimpeded fish
dispersion. This has lead to eastern fishes moving westward into suitable low-gradient
habitats such as Yegua Creek, where despite its orientation and proximity to the western
assemblages of the hill country, the eastern affiliated fishes found there persist in habitats
similar to the Navasota and Lower Brazos subbasins. This example reflects the role
18
multi-scale environmental and geographic filters play on the structure of assemblages
such that a local community is composed of species from the larger species pool that are
able to persist through all filters (Smith and Powell 1971, Poff 1997).
Geologic histories of the subbasins not only influence physical habitat, and
indirectly fish occurrences, but also directly influence contemporary fish diversity. The
Lower Brazos River drainage captures at least two distinct fish faunal elements: the
western, Edwards Plateau fishes, with high abundances of northern-derived taxa, and
eastern fishes, consisting of many taxa of southeastern US origin. Stream captures
(Wooddruff 1977) and preferred habitats (Fausch and Bestgen 1997) have allowed
northern taxa to disperse and persist throughout Central Texas; examples include
Guadalupe Bass (M. treculii), Central Stoneroller (C. anamolum), Orangethroat Darter
(E. spectabile), Bigscale Logperch (P. macrolepida), and Texas Logperch (P.
carbonaria). Eastern drainages are in closer proximity to the species pool in the
southeast US, and various stream captures and sea level changes have allowed a number
of eastern species to reach the lower Brazos drainage. Examples of fishes of SE origin
reaching their natural westward extent in the Brazos River drainage include Redfin
Pickeral (E. americanus), Goldstripe Darter (E. parvipinne), Pygmy Sunfish (E.
zonatum), Blackspot Topminnow (F. olivaceaus), and Dollar Sunfish (L. marginatus).
Knapp (1953), and then Conner and Suttkus (1986) proposed that high sediment load and
high turbidity of the Brazos River mainstream was a major barrier to southwest
expansion of SE-origin fishes. However, this assertion was based on the claim that the
western extents of the eastern taxa listed above were limited to the Navasota River, yet
were found herein to extend westward into other Brazos drainages. An alternative

19
explanation maybe that the paleoclimate after the last glacial maximum had extreme
drought conditions, possibly leading to the extirpation of SE forms in west and central
Texas (Horne and Kahn 1997, Al-Rabab’ah and Williams 2002, Johnson and Hill 2008).
Adjacent western drainages such as the Colorado and Guadalupe Rivers are generally
depauperate of southeastern forms except in lower reaches (e.g., L. fumeus, N. texanus,
O. emiliae, E. chlorosomum, and E. gracile) and spring refugia (e.g., E. fonticola, N.
chalybaeus, E. parvipinne, and M. melanops).
After local instream habitat, land use contributed the most to site assemblage
variation. Catchment spatial scales were the primary contributors, supporting the concept
that management at larger landscape scales offers greater influence to stream conditions
(Doppelt et al., 1993, Allan et al., 1997). Catchment-scale agriculture, and urban and
local-scale grassland are supporting impacted fish assemblages within the watershed, as
indicated by low diversity, low evenness, and high abundances of habitat generalists and
tolerant forms (Karr 1981). Numerous studies document declines in water quality,
habitat, and biological assemblages due to the landscape metrics of agriculture (Richards
et al. 1996, Wang et al. 1997, Roth et al. 1996, Sponseller et al. 2001), urban or
impervious area (Walsh et al. 2005), and lack of an intact riparian corridor (Gregory et al.
1991, Stauffer et al. 2000). Many of the impacted sites fall within or near the Central
Brazos subbasin, where gentle hills and rich soil of the Blackland prairies lend to
agriculture. Over time, the conversion to cropland in this region has resulted in a near
total replacement of original prairie habitat, and to the distinction of this large ecoregion
being the most endangered in North America (Samson et al. 2004). Alternatively, high
abundances of tolerant forms could be a response to the stream’s position and relative
20
size compared to the master stream. Having shorter drainage basins and many taxa found
in the proximate mainstem, the Central Brazos tributary assemblages partially conformed
to adventitious stream theory (Gorman 1986). The Central Brazos subbasin assemblage,
as well as the Lower Brazos subbasin assemblages, departed from this theory in that they
lacked high temporal beta-diversity common in adventitious streams. Additionally, the
Lower Brazos contained high variability and diversity across sites similarly positioned in
relation to the mainstem, and there were examples of impacted, non-adventitious sites
outside the Central Brazos subbasin containing high amounts of catchment-level urban
(Little River site 7) and agriculture (Little River site 1), and riparian-level grassland
(Lower Brazos site 2) within their catchments. This further supports land use as being a
driver in assemblages. From a watershed perspective, some level of impaction is
ultimately tolerated within the Brazos River watershed, as indicated by an overall
specious and diverse fish community, and few invasive species, especially in contrast to
western and New England states (Rahel 2000). Western gulf slope drainages historically
withstand frequent abiotic disturbances and high amounts of sedimentation (Conner and
Suttkas 1986, Williams et al. 2005), allowing a relatively high capacity to withstand
anthropogenic disturbances (Williams et al. 2007).
Watershed land use patterns generally mirror the region’s geologic and
physiographic gradients. The covariation of anthropogenic and natural landscape features
often provides difficulties in analysis of land use/land cover data (Fitzpatrick et al. 2001,
Townsend et al. 2003). We attempt to meet the assumption that locations differing in
land use are similar in all other aspects by partialling out local habitat, season, and
geographic effects (Borcard et al. 1992). We therefore use caution in implying that for
21
this watershed, land use is a robust measure of stream condition as indicated by fish
assemblage. While accounting for assemblage structure constraints that are known to be
important, we have not explicitly considered other landscape effects, such as geology or
vegetation types that could be contributing to our land use results.
The findings of this study give credence to incorporating landscape metrics into
biological stream assessment for a greater perspective on the extent of assemblage
response to not only instream habitat and historic zoogeography, but also to human
influences across the drainage landscape. Considering the dual pressures of
anthropogenic influences (Vogl and Lopes 2008) and changing environmental conditions
in the region (Nielsen-Gammon 2009), we view the Brazos watershed fish community as
a particularly sensitive indicator of potential faunal regime change and homogenization
within Western Gulf slope drainages. Humid-arid transitional zones across the world,
such as seen in Texas, are characterized by high sensitivity to warming trends, drying
processes, and anthropogenic land use transformations (Shoshany and Svoray 2002).
Carpenter and Brock (2006) suggest that increases in variability of ecosystems
foreshadow ecological regime shifts, which stem from large-scale changes in
environments and reorganization of complex ecosystems due to persistent landform and
hydrologic alteration or climate change. Assemblage homogenization can also
foreshadow regime shifts through increases in population level variability by means of
native and non-native invaders and extinction or extirpation of endemic forms (Scott and
Helfman 2001). Past research has confirmed that the Brazos mainstem community
persists in a drainage system where impacts on stream ecosystems through habitat
degradation and surface water abstraction have resulted in increases in habitat generalists

22
(Bonner and Runyan 2007), decreases in native obligate riverine taxa (Perkin et al. 2010),
and extirpations of some endemic forms such as N. buccula (Smalleye Shiner) and N.
oxyrhynchus (Sharpnose Shiner) (Warren et al. 2000). The results of this analysis
complement previous mainstem work by applying a hierarchical, landscape approach to
identifying how the basin’s fish communities exploit multi-scale environmental
heterogeneity and at the same time detecting and correlating probable landscape-scale
risk factors. Our results suggest opportunities for restorative conservation in impacted
regions, such as riparian and land use management within the Central Brazos subbasin
tributaries, and the identification and proactive protection of the least impacted and
unique aquatic networks, such as the most western extent of the eastern-affiliated
community in the Yegua Creek subbasin. Additionally, the riverscape interpretation
herein supports a landscape model of stream fishes presented by Ward (1998), and
emphasizes the connectivity, and heterogeneous and hierarchical nature of aquatic
habitats.
Conservation of watershed biodiversity necessitates an appropriate scale of
interpretation and management application, derived from understanding variation in
assemblage composition across landscape gradients. Much work has been done to
develop systematic protocols for characterizing community diversity, and to successfully
recognize distinct communities through multi-scale combinations of drainage and
physiography (Pflieger 1989, Moyle and Ellison 1991, Angermeier and Winston 1999).
Aquatic community classification studies provide a framework for assessing community
diversity, but lack specific recommendations or perspectives on which biotic and
drainage elements warrant protection and which management practices warrant

23
application. Conversely, past research within the Western Gulf Slope region have
indicated assemblage impacts due to hydrologic alteration (Durham and Wilde 2006,
Bonner and Runyan 2007, Perkin 2010), and increasing urban development (Shattock
2010, unpublished thesis), while lacking a community diversity perspective crucial for
setting priorities of watershed biodiversity conservation. This riverscape analysis
characterizes lower Brazos watershed community diversity patterns that reflect habitat
patch dynamics resulting from differential ecosystem response to geology,
zoogeographical history, and landform practices. This analysis can help conservation
practitioners improve watershed health and biodiversity through a multi-scale riverscape
perspective, placing emphasis on landscape-river linkages and ecosystem processes of
connectivity and heterogeneity (Allan et al. 1997, Fausch et al. 2002, Allan 2004).
Success or failure in applying models that link biological responses to mechanistic
drivers hinges, in part, on paying attention to the appropriate ecological context in which
the models are derived (Frissell and Bayles 1996).

24
Table 1. Sampling site localities for the Brazos River watershed.
Subbasin Site Latitude °N Longitude °W County
Central Brazos
1 Old River at FM444 30.4040264 -96.3140678 Burleson
2 Thompsons Creek at 1688 30.6008885 -96.4435228 Brazos
3 Little Brazos River at SH21 30.6409039 -96.5206297 Brazos
4 Big Creek at SH6 31.2567854 -96.8597668 Falls
5 Deer Creek at SH935 31.2648098 -97.0320237 Falls
6 Tehuacana Creek at FM2491 31.5639615 -97.0481453 McLennan
Lampasas
1 Lampasas River at IH35 31.0018555 -97.4918558 Bell
2 Lampasas River at SH195 30.9723781 -97.7782011 Bell
3 Lampasas River at US190 31.0794292 -98.0158551 Lampasas
Little River
1 Little River at CR264 30.8254215 -96.7435651 Milam
2 Big Elm Creek at US77 30.9030406 -96.9790851 Milam
3 San Gabriel at CR428 30.6943662 -97.2787716 Williamson
4 San Gabriel at ShadyRVcamp 30.6373391 -97.5724726 Williamson
5 North San Gabriel at US183 30.7031423 -97.8773021 Williamson
6 South San Gabriel at US183 30.6207162 -97.8609248 Williamson
7 Brushy Creek at CR685 30.5261307 -97.5664998 Williamson
Lower Brazos
1 Big Creek at Brazos Bend State Park 29.378439 -95.6024479 Fort Bend
2 Bullhead Bayou at SH99 29.6066179 -95.6866399 Fort Bend
3 Allens Creek at Mixville Rd 29.7039007 -96.1289913 Austin
4 Irons Creek at CR1458 29.8267771 -96.0363805 Waller
5 Mill Creek at CR331 29.869463 -96.155018 Austin
6 Clear Creek at CR3346 30.0544433 -96.0580244 Waller
7 Caney Creek at CR1456 30.0621125 -96.2090383 Austin
8 New Year Creek at CR2447 30.1657452 -96.22327 Washington
Navasota River
1 Navasota River at SH6 30.4183477 -96.106475 Grimes
2 Navasota River at Sulphur Springs Rd. 30.5707004 -96.1664846 Grimes
3 Navasota River at CR162 30.7203727 -96.1676675 Grimes
4 Navasota River at US79 31.1694968 -96.2986485 Leon
5 Navasota River at SH164 31.512466 -96.4510747 Limestone
6 Navasota River at SH73 31.7018385 -96.7223061 Limestone
Yegua Creek
1 Yegua Creek at SH50 30.3681099 -96.3431751 Washington
2 Yegua Creek at SH36 30.3215025 -96.5073441 Washington
3 West Yegua Creek at SH21 30.2912744 -96.9604991 Lee

25
Table 2. National Land Cover Data (NLCD 2001) categories with reclassification
scheme. Category-scale combinations retained from Spearman rank correlation test are
indicated by .
Spatial scales
Original categories Reclassified
categories
Local (100m
buffer, 2km
upstream)
Riparian
(100m
buffer, total
upstream)
Catchment
(cumulative area
upstream)
Developed, Open Space
Urban
Developed, Low Intensity
Developed, Medium
Intensity
High Intensity, Residential
Deciduous Forest
Forest Evergreen Forest
Mixed Forest
Shrub/Scrub
Grasslands/Herbaceous Grassland
Pasture/Hay
Cultivated Crops Agriculture
Woody Wetlands
Wetland
Emergent Herbaceous
Wetlands
26
Table 3. Watershed, subbasin, and site fish assemblage characteristics. Maximum and
minimum values for the study are indicated in bold.
Site
Code
Total
Species
(S)
Total
individuals
(N)
Pielou's
evenness
(J')
Shannon
diversity
(H')
Beta-Diversity
(SD range)
(axis 1, axis 2)
Lower Brazos
Watershed - 72 110,592 0.517 1.98 3.5, 4
Central Brazos (CB) - 52 27,088 0.414 1.64 2.3, 1.1
CB1 33 1,550 0.684 2.39 -
CB2 30 5,942 0.451 1.53 -
CB3 35 2,374 0.576 2.05 -
CB4 19 4,305 0.426 1.25 -
CB5 23 7,222 0.396 1.24 -
CB6 19 5,695 0.353 1.04 -
Lampasas (LM) - 30 5,970 0.604 2.05 1.8, 1.6
LM1 20 1,660 0.560 1.68 -
LM2 22 1,602 0.692 2.14 -
LM3 22 2,708 0.593 1.83 -
Little River (LR) - 46 34,675 0.370 1.42 3.5, 1.6
LR1 27 27,981 0.270 0.89 -
LR2 23 1,336 0.502 1.57 -
LR3 27 555 0.689 2.27 -
LR4 18 1,562 0.527 1.52 -
LR5 21 942 0.469 1.43 -
LR6 13 608 0.706 1.81 -
LR7 16 1,691 0.371 1.03 -
Lower Brazos (LB) - 56 21,693 0.622 2.50 2.9, 2.7
LB1 26 3,169 0.466 1.52 -
LB2 9 4,459 0.565 1.24 -
LB3 14 2,289 0.601 1.59 -
LB4 24 584 0.666 2.12 -
LB5 39 3,891 0.543 1.99 -
LB6 29 1,865 0.602 2.03 -
LB7 21 1,387 0.613 1.87 -
LB8 34 4,049 0.399 1.41 -
Navasota River (NV) - 52 9,563 0.635 2.51 2.5, 1.9
NV1 33 1,571 0.611 2.14 -
NV2 35 4,286 0.530 1.88 -
NV3 25 865 0.644 2.07 -
NV4 34 738 0.760 2.68 -
NV5 27 1,362 0.656 2.16 -
NV6 16 741 0.443 1.23 -
Yegua Creek (YG) - 48 11,603 0.456 1.76 2.1, 1.6
YG1 42 10,119 0.374 1.40 -
YG2 27 406 0.707 2.33 -
YG3 22 1,078 0.615 1.90 -
27
Table 4. ANOSIM global and pair-wise tests.
R P value
Sampling Season
Global test
0.035
0.017
Pairwise Tests:
Spring vs. Summer 0.007
0.286
Summer vs. Winter 0.003
0.359
Spring vs. Winter 0.024
0.1
Site
Global Test:
0.853
< 0.01
Subbasin
Global Test:
0.3
< 0.01
Pairwise Tests:
Central Brazos vs. Lampasas 0.790
< 0.01
Central Brazos vs. Little River 0.377
< 0.01
Central Brazos vs. Lower Brazos 0.166
< 0.01
Central Brazos vs. Navasota 0.337
< 0.01
Central Brazos vs. Yegua 0.407
< 0.01
Lampasas vs. Little River -0.038
0.619
Lampasas vs. Lower Brazos 0.167
0.047
Lampasas vs. Navasota 0.625
< 0.01
Lampasas vs. Yegua 0.677
< 0.01
Little River vs. Lower Brazos 0.300
< 0.01
Little River vs. Navasota 0.502
< 0.01
Little River vs. Yegua 0.505
< 0.01
Lower Brazos vs. Navasota 0.025
0.189
Lower Brazos vs. Yegua -0.027
0.555
Navasota vs. Yegua 0.103 0.132

28
Figure 1. Sampling sites and subbasins within the Lower Brazos River watershed.
29
Figure 2. Land use relative abundances within subbasins (small pie charts) and across the
entire watershed (large pie chart) at 3 spatial scales: 2km upstream of site, total riparian
upstream of site, and total catchment upstream of site.

30
Figure 3. Sample scores of Principal Component (PCA) axes I and derived from physical
habitat parameters (see text). Central Brazos (CB), Lampasas (LM), Little River (LR),
Lower Brazos (LB), Navasota (NV), and Yegua (YG) subbasin groupings enclose 1
standard deviation of each group’s mean sample score. Seasonal polygons envelope all
samples within respective sampling seasons.
31
Figure 4. Multi-dimensional scaling (MDS) plot for Lower Brazos River
watershed sample fish assemblages, with Central Brazos (CB), Lampasas
(LM), Little River (LR), Lower Brazos (LB), Navasota (NV), and Yegua
(YG) subbasin groupings. Each groups' sample score mean is encircled by 1
standard deviation.
32
Figure 5. CCA ordination plot of the 25 most abundant fish species and
Central Brazos (CB), Lampasas (LM), Little River (LR), Lower Brazos
(LB), Navasota (NV), and Yegua (YG) subbasin groupings represented by
the respective grouping’s sample score means (circles with abbreviations)
and range along both axes (vertical and horizontal lines with range values
indicated). Graph scaling is in units of standard deviation (SD) of species
turnover, with 50% compositional turnover in approximately 1 SD unit,
and 100% turnover in 4 SD units. The 3 largest positive and negative
environmental variables loadings are reported for each axis. Numbers 1-3
in parenthesis after land use categories represent the scale level for that
category; 1 for local riparian 2km upstream of the site, 2 for total riparian
upstream of the site, and 3 for total catchment area upstream of the site.

33
Figure 6. CCA ordination plot with 10 land use category-scale combinations as
environmental variables and sample assemblage structure characteristics as species.
Numbers 1-3 in parenthesis after land use categories represent the scale level for that
category; 1 for local riparian 2km upstream of the site, 2 for total riparian upstream of the
site, and 3 for total catchment area upstream of the site.

34
APPENDIX I
ABUNDANCES OF FISHES COLLECTED ACROSS SAMPLING SEASONS FOR
SITES WITHIN THE CENTRAL BRAZOS, LAMPASAS, YEGUA, LOWER
BRAZOS, LITTLE RIVER, AND NAVASOTA SUBBASINS

Appendix I: Abundance of fish collected across sampling seasons for sites within the Central Brazos subbasin
Family Genus Species Common name Central
CB1 CB2 CB3 CB4 CB5 CB6
Lepisosteidae
Atractosteus spatula Alligator Gar 0 0 0 0 0 0
Lepisosteus oculatus Spotted Gar 4 0 1 0 0 1
Lepisosteus osseus Longnose gar 1 0 0 0 0 0
Amiidae
Amia calva Bowfin 0 0 0 0 0 0
Cluepidae
Dorosoma cepedianum Gizzard Shad 82 14 1 51 31 0
Dorosoma petenense Threadfin Shad 0 75 5 0 0 1
Cyprinidae
Campostoma anomalum Central Stoneroller 1 0 1 0 4 0
Cyprinella lutrensis Red Shiner 428 3169 844 2553 4856 4169
Cyprinella venusta Blacktail Shiner 6 109 348 0 46 170
Cyprinus carpio Common Carp 1 0 0 0 1 0
Hybognathus nuchalis Mississippi Silvery Minnow 11 3 3 0 0 0
Lythrurus fumeus Ribbon Shiner 18 167 334 0 0 0
Macrhybopsis hyostoma Shoal Chub 0 41 3 0 0 0
Macrhybopsis storeriana Silver Chub 0 0 1 0 0 0
Notemigonus crysoleucas Golden Shiner 4 1 0 0 0 0
Notropis buchanani Ghost Shiner 33 233 0 25 191 0
Notropis shumardi Silverband Shiner 10 297 0 0 0 0
Notropis texanus Weed Shiner 0 0 0 0 0 0
Notropis volucellus Mimic Shiner 28 65 7 0 4 61
Opsopoeodus emiliae Pugnose Minnow 10 14 1 2 0 0
Pimephales promelas Fathead Minnow 0 0 1 0 0 0
Pimephales vigilax Bullhead Minnow 102 1505 234 117 799 655
35

Catostomidae
Carpiodes carpio River Carpsucker 5 16 6 2 3 0
Ictiobus bubalus Smallmouth Buffalo 0 0 0 0 0 0
Minytrema melanops Spotted Sucker 0 2 1 0 0 0
Moxostoma congestum Grey Redhorse 0 0 0 0 1 0
Characidae
Astyanax mexicanus Mexican Tetra 0 0 0 0 0 0
Ictaluridae
Ameiurus melas Black Bullhead 0 0 1 0 1 0
Ameiurus natalis Yellow Bullhead 1 0 0 0 0 0
Ictalurus punctatus Channel Catfish 33 18 95 11 49 39
Ictalurus furcatus Blue Catfish 0 3 2 0 0 0
Noturus gyrinus Tadpole Madtom 11 0 9 3 0 0
Pylodictis olivaris Flathead Catfish 2 0 7 0 1 0
Loricariidae
Pterygoplichthys disjunctivus Vermiculated sailfin catfish 0 0 0 0 0 0
Esocidae
Esox americanus Chain Pickerel 0 0 0 0 0 0
Aphredoderidae
Aphredoderus sayanus Pirate Perch 12 0 0 0 0 0
Mugilidae
Agonostomus monticola Mountain Mullet 0 0 1 0 0 0
Mugil cephalus Stripped Mullet 0 0 3 0 0 0
Atherinidae
Labidesthes sicculus Brook Silverside 1 31 199 0 0 2
Menidia beryllina Inland Silverside 0 0 3 0 0 2
Fundulidae
Fundulus chrysotus Golden Topminnow 0 0 0 3 0 0
Fundulus notatus Blackstripe Topminnow 0 25 39 0 0 28
36

Fundulus olivaceus Blackspotted Topminnow 0 0 0 0 0 0
Poecilidae
Gambusia affinis Western Mosquitofish 324 85 153 1081 656 330
Poecilia latipinna Sailfin Molly 0 0 0 0 0 0
Cyprinidontidae
Cyprinodon variegatus Sheepshead Minnow 0 0 0 0 0 0
Moronidae
Morone chrysops White Bass 0 0 0 0 0 0
Centrarchidae
Lepomis auritus Redbreast Sunfish 0 0 0 0 0 0
Lepomis cyanellus Green Sunfish 3 2 12 10 44 29
Lepomis gulosus Warmouth 17 1 0 3 0 0
Lepomis humilis Orangespotted Sunfish 147 9 0 241 124 1
Lepomis macrochirus Bluegill 72 7 7 24 76 32
Lepomis marginatus Dollar Sunfish 0 0 0 0 0 0
Lepomis megalotis Longear Sunfish 113 24 13 30 295 161
Lepomis microlophus Redear Sunfish 0 0 0 0 0 0
Lepomis miniatus Redspotted Sunfish 0 0 0 0 1 0
Lepomis symmetricus Bantom Sunfish 0 0 0 0 0 0
Micropterus dolomieu Smallmouth Bass 0 0 0 0 0 0
Micropterus punctulatus Spotted Bass 0 6 7 0 0 1
Micropterus salmoides Largemouth Bass 1 2 15 1 30 9
Micropterus treculii Guadalupe Bass 0 0 0 0 0 0
Pomoxis annularis White Crappie 19 4 0 110 0 3
Pomoxis nigromaculatus Black Crappie 0 0 0 0 0 0
Percidae
Etheostoma chlorosoma Bluntnose Darter 38 0 0 34 0 0
Etheostoma gracile Slough Darter 8 7 2 4 0 1
Etheostoma parvipinne Goldstripped Darter 0 0 0 0 0 0
37

Etheostoma spectabile Orangethroat Darter 0 0 0 0 1 0
Percina carbonaria Texas Logperch 0 0 0 0 0 0
Percina macrolepida Bigscale Logperch 0 0 0 0 7 0
Percina sciera Dusky Darter 0 7 14 0 0 0
Sciaenidae
Aplodinotus grunniens Freshwater Drum 4 0 0 0 1 0
Elassomatidae
Elassoma zonatum Pygmy Sunfish 0 0 0 0 0 0
38
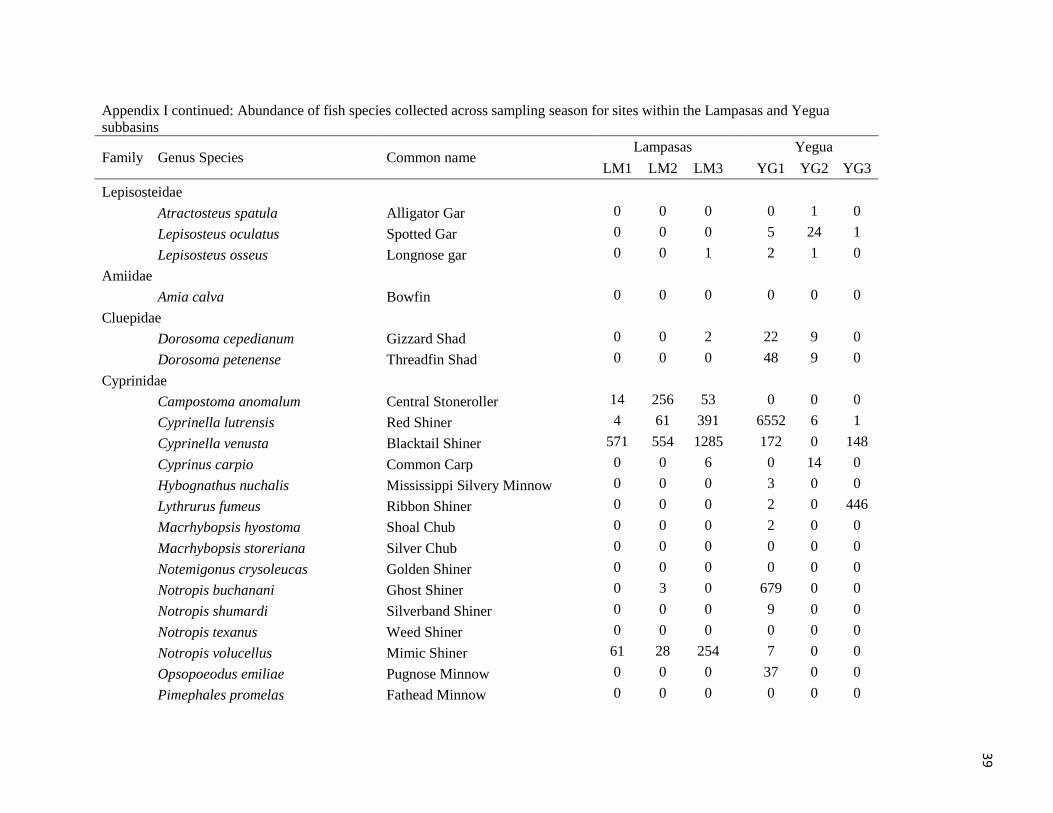
Appendix I continued: Abundance of fish species collected across sampling season for sites within the Lampasas and Yegua
subbasins
Family Genus Species Common name Lampasas Yegua
LM1 LM2 LM3 YG1 YG2 YG3
Lepisosteidae
Atractosteus spatula Alligator Gar 0 0 0
0 1 0
Lepisosteus oculatus Spotted Gar 0 0 0
5 24 1
Lepisosteus osseus Longnose gar 0 0 1
2 1 0
Amiidae
Amia calva Bowfin 0 0 0
0 0 0
Cluepidae
Dorosoma cepedianum Gizzard Shad 0 0 2
22 9 0
Dorosoma petenense Threadfin Shad 0 0 0
48 9 0
Cyprinidae
Campostoma anomalum Central Stoneroller 14 256 53
0 0 0
Cyprinella lutrensis Red Shiner 4 61 391
6552 6 1
Cyprinella venusta Blacktail Shiner 571 554 1285
172 0 148
Cyprinus carpio Common Carp 0 0 6
0 14 0
Hybognathus nuchalis Mississippi Silvery Minnow 0 0 0
3 0 0
Lythrurus fumeus Ribbon Shiner 0 0 0
2 0 446
Macrhybopsis hyostoma Shoal Chub 0 0 0
2 0 0
Macrhybopsis storeriana Silver Chub 0 0 0
0 0 0
Notemigonus crysoleucas Golden Shiner 0 0 0
0 0 0
Notropis buchanani Ghost Shiner 0 3 0
679 0 0
Notropis shumardi Silverband Shiner 0 0 0
9 0 0
Notropis texanus Weed Shiner 0 0 0
0 0 0
Notropis volucellus Mimic Shiner 61 28 254
7 0 0
Opsopoeodus emiliae Pugnose Minnow 0 0 0
37 0 0
Pimephales promelas Fathead Minnow 0 0 0
0 0 0
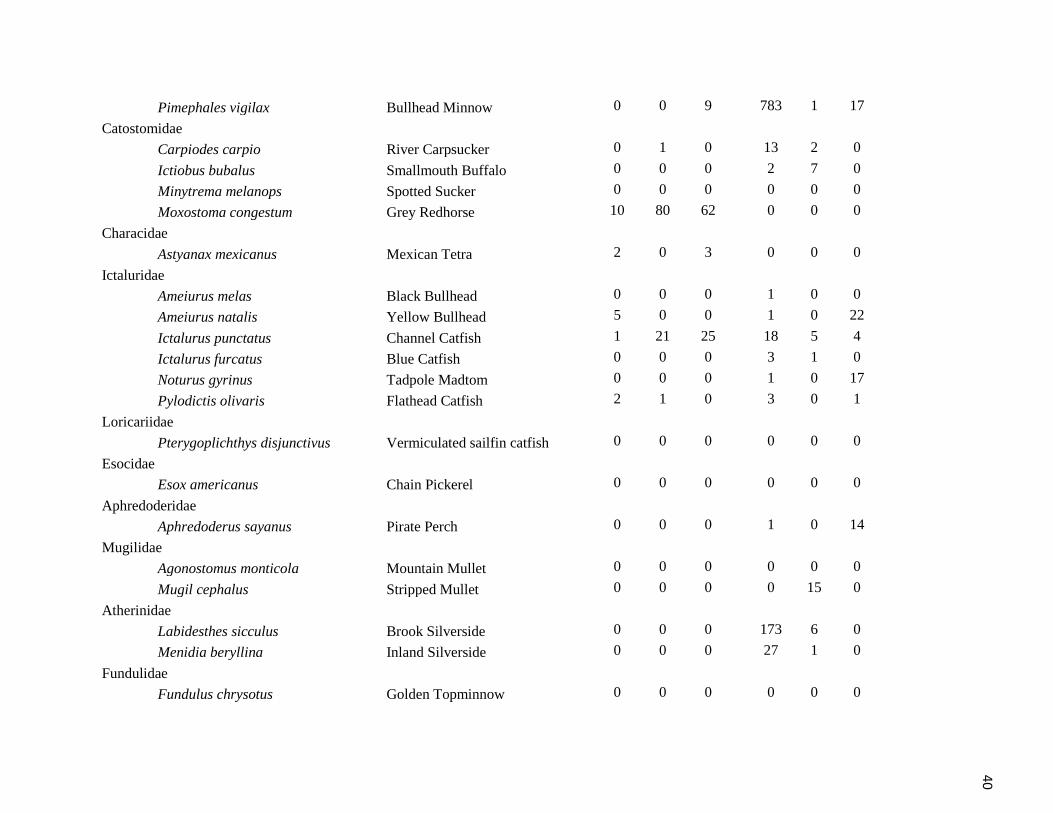
39
Pimephales vigilax Bullhead Minnow 0 0 9
783 1 17
Catostomidae
Carpiodes carpio River Carpsucker 0 1 0
13 2 0
Ictiobus bubalus Smallmouth Buffalo 0 0 0
2 7 0
Minytrema melanops Spotted Sucker 0 0 0
0 0 0
Moxostoma congestum Grey Redhorse 10 80 62
0 0 0
Characidae
Astyanax mexicanus Mexican Tetra 2 0 3
0 0 0
Ictaluridae
Ameiurus melas Black Bullhead 0 0 0
1 0 0
Ameiurus natalis Yellow Bullhead 5 0 0
1 0 22
Ictalurus punctatus Channel Catfish 1 21 25
18 5 4
Ictalurus furcatus Blue Catfish 0 0 0
3 1 0
Noturus gyrinus Tadpole Madtom 0 0 0
1 0 17
Pylodictis olivaris Flathead Catfish 2 1 0
3 0 1
Loricariidae
Pterygoplichthys disjunctivus Vermiculated sailfin catfish 0 0 0
0 0 0
Esocidae
Esox americanus Chain Pickerel 0 0 0
0 0 0
Aphredoderidae
Aphredoderus sayanus Pirate Perch 0 0 0
1 0 14
Mugilidae
Agonostomus monticola Mountain Mullet 0 0 0
0 0 0
Mugil cephalus Stripped Mullet 0 0 0
0 15 0
Atherinidae
Labidesthes sicculus Brook Silverside 0 0 0
173 6 0
Menidia beryllina Inland Silverside 0 0 0
27 1 0
Fundulidae
Fundulus chrysotus Golden Topminnow 0 0 0
0 0 0
40

Fundulus notatus Blackstripe Topminnow 6 37 81
4 1 5
Fundulus olivaceus Blackspotted Topminnow 0 0 0
1 0 0
Poecilidae
Gambusia affinis Western Mosquitofish 181 165 237
1060 28 197
Poecilia latipinna Sailfin Molly 0 0 0
0 4 0
Cyprinidontidae
Cyprinodon variegatus Sheepshead Minnow 0 0 0
0 0 0
Moronidae
Morone chrysops White Bass 0 0 0
1 0 0
Centrarchidae
Lepomis auritus Redbreast Sunfish 0 0 0
0 0 0
Lepomis cyanellus Green Sunfish 6 7 6
10 0 8
Lepomis gulosus Warmouth 3 0 1
13 22 14
Lepomis humilis Orangespotted Sunfish 0 0 0
112 16 0
Lepomis macrochirus Bluegill 36 6 38
66 162 107
Lepomis marginatus Dollar Sunfish 0 0 0
0 0 0
Lepomis megalotis Longear Sunfish 546 101 157
199 44 35
Lepomis microlophus Redear Sunfish 2 0 0
0 0 9
Lepomis miniatus Redspotted Sunfish 0 0 0
0 0 0
Lepomis symmetricus Bantom Sunfish 0 0 0
0 0 0
Micropterus dolomieu Smallmouth Bass 0 3 0
0 0 0
Micropterus punctulatus Spotted Bass 17 17 6
5 0 0
Micropterus salmoides Largemouth Bass 0 15 38
15 6 7
Micropterus treculii Guadalupe Bass 3 42 12
0 0 0
Pomoxis annularis White Crappie 0 0 0
17 3 0
Pomoxis nigromaculatus Black Crappie 0 0 0
1 13 0
Percidae
Etheostoma chlorosoma Bluntnose Darter 0 0 0
14 0 11
Etheostoma gracile Slough Darter 0 0 0
32 1 7
41
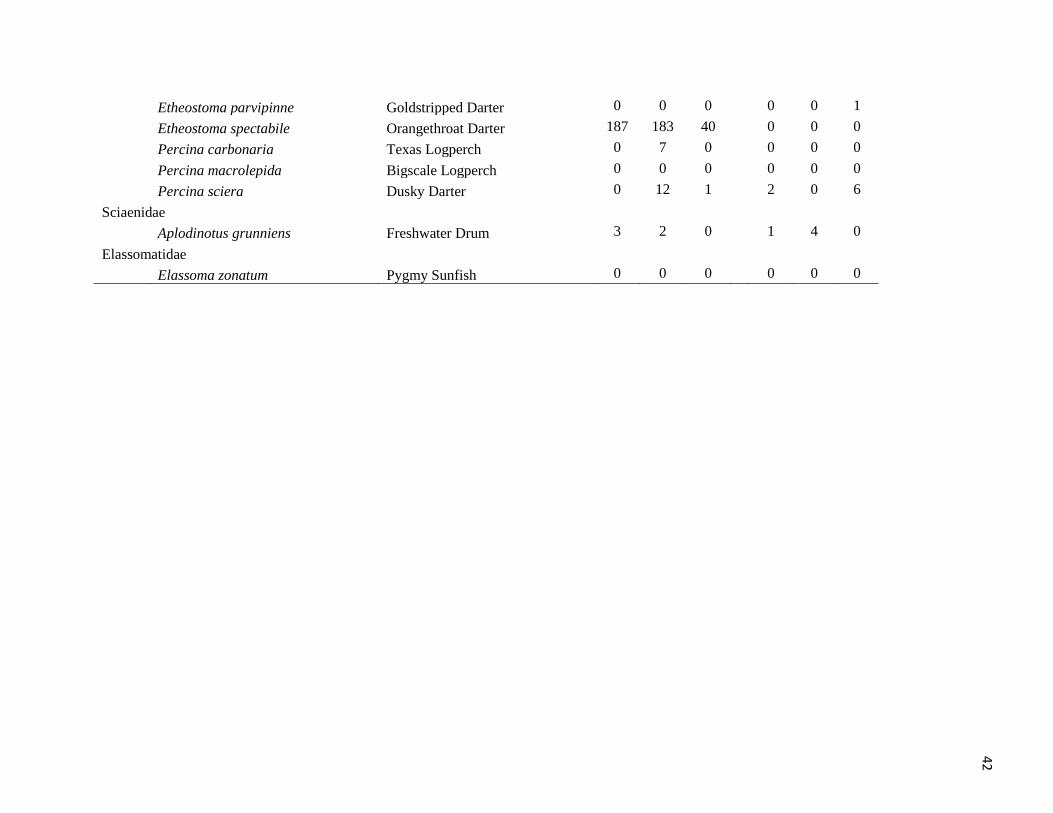
Etheostoma parvipinne Goldstripped Darter 0 0 0
0 0 1
Etheostoma spectabile Orangethroat Darter 187 183 40
0 0 0
Percina carbonaria Texas Logperch 0 7 0
0 0 0
Percina macrolepida Bigscale Logperch 0 0 0
0 0 0
Percina sciera Dusky Darter 0 12 1
2 0 6
Sciaenidae
Aplodinotus grunniens Freshwater Drum 3 2 0
1 4 0
Elassomatidae
Elassoma zonatum Pygmy Sunfish 0 0 0 0 0 0
42

Appendix I continued: Abundance of fish species collected across sampling season for sites within the Little River subbasin
Family Genus Species Common name Little River
LR1 LR2 LR3 LR4 LR5 LR6 LR7
Lepisosteidae
Atractosteus spatula Alligator Gar 0 0 0 0 0 0 0
Lepisosteus oculatus Spotted Gar 2 0 1 0 1 0 1
Lepisosteus osseus Longnose gar 5 0 1 0 3 0 0
Amiidae
Amia calva Bowfin 0 0 0 0 0 0 0
Cluepidae
Dorosoma cepedianum Gizzard Shad 1 0 0 0 1 0 0
Dorosoma petenense Threadfin Shad 116 0 1 0 0 0 0
Cyprinidae
Campostoma anomalum Central Stoneroller 4 5 1 109 49 140 19
Cyprinella lutrensis Red Shiner 16521 757 39 125 1 0 6
Cyprinella venusta Blacktail Shiner 7 183 167 955 608 222 1176
Cyprinus carpio Common Carp 2 0 0 3 0 0 0
Hybognathus nuchalis Mississippi Silvery Minnow 2 2 0 0 0 0 0
Lythrurus fumeus Ribbon Shiner 0 1 0 0 0 0 0
Macrhybopsis hyostoma Shoal Chub 128 0 0 0 0 0 0
Macrhybopsis storeriana Silver Chub 0 0 0 0 0 0 0
Notemigonus crysoleucas Golden Shiner 0 0 1 0 0 0 0
Notropis buchanani Ghost Shiner 574 2 0 0 0 0 0
Notropis shumardi Silverband Shiner 0 0 0 0 0 0 0
Notropis texanus Weed Shiner 0 0 0 0 0 0 0
Notropis volucellus Mimic Shiner 3 10 60 27 13 0 32
Opsopoeodus emiliae Pugnose Minnow 1 0 0 0 0 0 0
Pimephales promelas Fathead Minnow 0 0 0 0 0 0 0
43

Pimephales vigilax Bullhead Minnow 10240 133 28 13 0 0 1
Catostomidae
Carpiodes carpio River Carpsucker 1 0 1 0 0 0 0
Ictiobus bubalus Smallmouth Buffalo 0 0 0 0 0 0 0
Minytrema melanops Spotted Sucker 0 0 0 0 0 0 0
Moxostoma congestum Grey Redhorse 0 1 4 0 0 0 8
Characidae
Astyanax mexicanus Mexican Tetra 0 0 0 0 0 0 0
Ictaluridae
Ameiurus melas Black Bullhead 0 0 0 0 0 0 0
Ameiurus natalis Yellow Bullhead 0 0 0 0 1 0 0
Ictalurus punctatus Channel Catfish 76 8 9 11 4 3 13
Ictalurus furcatus Blue Catfish 8 0 1 0 0 0 0
Noturus gyrinus Tadpole Madtom 0 1 1 0 0 0 0
Pylodictis olivaris Flathead Catfish 0 2 2 1 0 1 0
Loricariidae
Pterygoplichthys disjunctivus Vermiculated sailfin catfish 0 0 0 0 0 0 0
Esocidae
Esox americanus Chain Pickerel 0 0 0 0 0 0 0
Aphredoderidae
Aphredoderus sayanus Pirate Perch 0 0 0 0 0 0 0
Mugilidae
Agonostomus monticola Mountain Mullet 0 0 0 0 0 0 8
Mugil cephalus Stripped Mullet 0 0 0 0 0 0 0
Atherinidae
Labidesthes sicculus Brook Silverside 1 53 0 0 0 0 0
Menidia beryllina Inland Silverside 0 0 1 0 0 0 0
Fundulidae
Fundulus chrysotus Golden Topminnow 0 0 0 0 0 0 0
44

Fundulus notatus Blackstripe Topminnow 0 0 0 0 0 0 0
Fundulus olivaceus Blackspotted Topminnow 0 0 0 0 0 0 0
Poecilidae
Gambusia affinis Western Mosquitofish 207 59 45 49 44 8 352
Poecilia latipinna Sailfin Molly 0 0 0 0 0 0 5
Cyprinidontidae
Cyprinodon variegatus Sheepshead Minnow 0 0 0 0 0 0 0
Moronidae
Morone chrysops White Bass 0 1 0 0 0 0 0
Centrarchidae
Lepomis auritus Redbreast Sunfish 0 0 0 0 3 16 0
Lepomis cyanellus Green Sunfish 1 21 31 63 11 76 12
Lepomis gulosus Warmouth 1 0 1 0 0 0 0
Lepomis humilis Orangespotted Sunfish 6 2 0 1 0 0 0
Lepomis macrochirus Bluegill 2 10 10 23 73 23 0
Lepomis marginatus Dollar Sunfish 0 0 0 0 0 0 0
Lepomis megalotis Longear Sunfish 67 61 87 120 84 70 22
Lepomis microlophus Redear Sunfish 0 0 0 0 10 4 0
Lepomis miniatus Redspotted Sunfish 0 0 0 0 0 0 0
Lepomis symmetricus Bantom Sunfish 0 0 0 0 0 0 0
Micropterus dolomieu Smallmouth Bass 0 0 0 0 0 0 0
Micropterus punctulatus Spotted Bass 0 1 2 1 1 0 0
Micropterus salmoides Largemouth Bass 3 0 0 6 5 9 1
Micropterus treculii Guadalupe Bass 0 0 7 25 11 4 19
Pomoxis annularis White Crappie 1 3 3 0 0 0 0
Pomoxis nigromaculatus Black Crappie 0 0 0 0 0 0 0
Percidae
Etheostoma chlorosoma Bluntnose Darter 0 0 0 0 0 0 0
Etheostoma gracile Slough Darter 0 6 2 0 0 0 0
45

Etheostoma parvipinne Goldstripped Darter 0 0 0 0 0 0 0
Etheostoma spectabile Orangethroat Darter 0 0 44 29 10 32 16
Percina carbonaria Texas Logperch 0 0 0 0 4 0 0
Percina macrolepida Bigscale Logperch 0 0 0 0 5 0 0
Percina sciera Dusky Darter 0 14 5 1 0 0 0
Sciaenidae
Aplodinotus grunniens Freshwater Drum 1 0 0 0 0 0 0
Elassomatidae
Elassoma zonatum Pygmy Sunfish 0 0 0 0 0 0 0
46
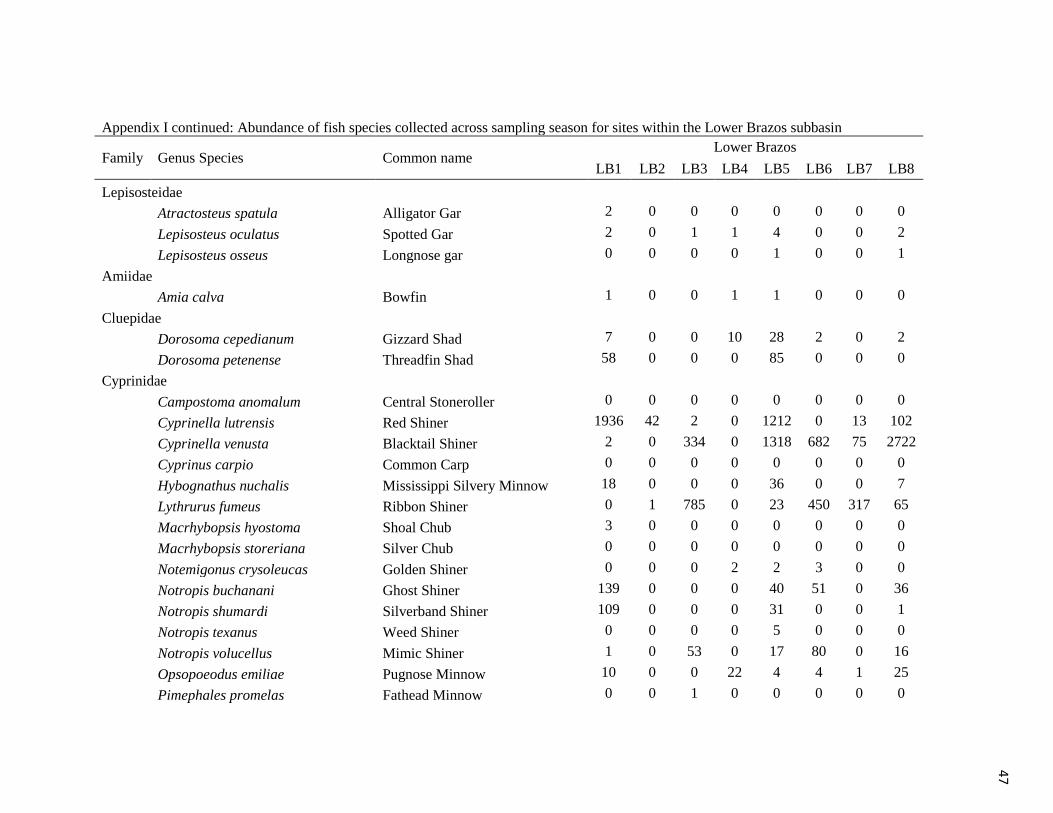
Appendix I continued: Abundance of fish species collected across sampling season for sites within the Lower Brazos subbasin
Family Genus Species Common name Lower Brazos
LB1 LB2 LB3 LB4 LB5 LB6 LB7 LB8
Lepisosteidae
Atractosteus spatula Alligator Gar 2 0 0 0 0 0 0 0
Lepisosteus oculatus Spotted Gar 2 0 1 1 4 0 0 2
Lepisosteus osseus Longnose gar 0 0 0 0 1 0 0 1
Amiidae
Amia calva Bowfin 1 0 0 1 1 0 0 0
Cluepidae
Dorosoma cepedianum Gizzard Shad 7 0 0 10 28 2 0 2
Dorosoma petenense Threadfin Shad 58 0 0 0 85 0 0 0
Cyprinidae
Campostoma anomalum Central Stoneroller 0 0 0 0 0 0 0 0
Cyprinella lutrensis Red Shiner 1936 42 2 0 1212 0 13 102
Cyprinella venusta Blacktail Shiner 2 0 334 0 1318 682 75 2722
Cyprinus carpio Common Carp 0 0 0 0 0 0 0 0
Hybognathus nuchalis Mississippi Silvery Minnow 18 0 0 0 36 0 0 7
Lythrurus fumeus Ribbon Shiner 0 1 785 0 23 450 317 65
Macrhybopsis hyostoma Shoal Chub 3 0 0 0 0 0 0 0
Macrhybopsis storeriana Silver Chub 0 0 0 0 0 0 0 0
Notemigonus crysoleucas Golden Shiner 0 0 0 2 2 3 0 0
Notropis buchanani Ghost Shiner 139 0 0 0 40 51 0 36
Notropis shumardi Silverband Shiner 109 0 0 0 31 0 0 1
Notropis texanus Weed Shiner 0 0 0 0 5 0 0 0
Notropis volucellus Mimic Shiner 1 0 53 0 17 80 0 16
Opsopoeodus emiliae Pugnose Minnow 10 0 0 22 4 4 1 25
Pimephales promelas Fathead Minnow 0 0 1 0 0 0 0 0
47
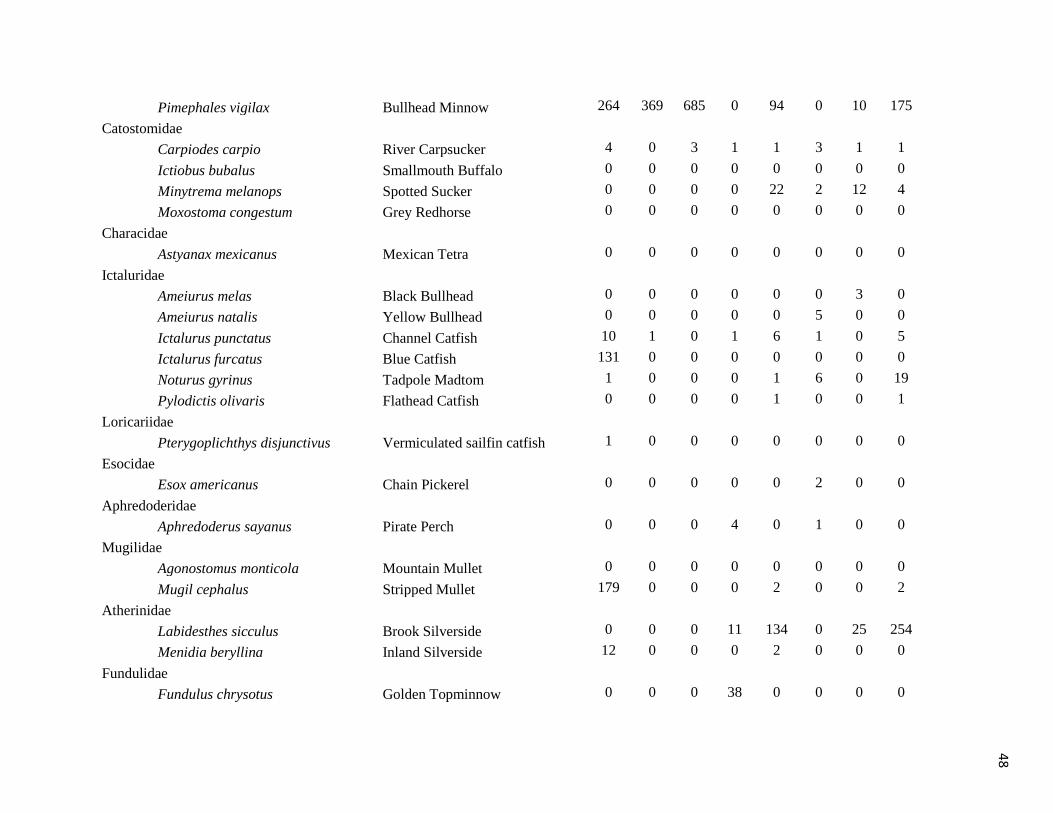
Pimephales vigilax Bullhead Minnow 264 369 685 0 94 0 10 175
Catostomidae
Carpiodes carpio River Carpsucker 4 0 3 1 1 3 1 1
Ictiobus bubalus Smallmouth Buffalo 0 0 0 0 0 0 0 0
Minytrema melanops Spotted Sucker 0 0 0 0 22 2 12 4
Moxostoma congestum Grey Redhorse 0 0 0 0 0 0 0 0
Characidae
Astyanax mexicanus Mexican Tetra 0 0 0 0 0 0 0 0
Ictaluridae
Ameiurus melas Black Bullhead 0 0 0 0 0 0 3 0
Ameiurus natalis Yellow Bullhead 0 0 0 0 0 5 0 0
Ictalurus punctatus Channel Catfish 10 1 0 1 6 1 0 5
Ictalurus furcatus Blue Catfish 131 0 0 0 0 0 0 0
Noturus gyrinus Tadpole Madtom 1 0 0 0 1 6 0 19
Pylodictis olivaris Flathead Catfish 0 0 0 0 1 0 0 1
Loricariidae
Pterygoplichthys disjunctivus Vermiculated sailfin catfish 1 0 0 0 0 0 0 0
Esocidae
Esox americanus Chain Pickerel 0 0 0 0 0 2 0 0
Aphredoderidae
Aphredoderus sayanus Pirate Perch 0 0 0 4 0 1 0 0
Mugilidae
Agonostomus monticola Mountain Mullet 0 0 0 0 0 0 0 0
Mugil cephalus Stripped Mullet 179 0 0 0 2 0 0 2
Atherinidae
Labidesthes sicculus Brook Silverside 0 0 0 11 134 0 25 254
Menidia beryllina Inland Silverside 12 0 0 0 2 0 0 0
Fundulidae
Fundulus chrysotus Golden Topminnow 0 0 0 38 0 0 0 0
48

Fundulus notatus Blackstripe Topminnow 0 0 0 14 119 166 532 202
Fundulus olivaceus Blackspotted Topminnow 0 0 0 0 0 0 0 0
Poecilidae
Gambusia affinis Western Mosquitofish 254 2283 236 26 404 62 176 94
Poecilia latipinna Sailfin Molly 3 875 0 0 0 0 0 0
Cyprinidontidae
Cyprinodon variegatus Sheepshead Minnow 0 886 0 4 0 0 0 0
Moronidae
Morone chrysops White Bass 0 0 0 0 0 0 0 0
Centrarchidae
Lepomis auritus Redbreast Sunfish 0 0 0 0 0 0 0 0
Lepomis cyanellus Green Sunfish 0 1 6 0 2 0 5 1
Lepomis gulosus Warmouth 4 0 0 105 1 21 20 1
Lepomis humilis Orangespotted Sunfish 0 0 0 3 6 0 0 3
Lepomis macrochirus Bluegill 7 1 1 186 45 155 47 32
Lepomis marginatus Dollar Sunfish 0 0 0 0 0 6 0 0
Lepomis megalotis Longear Sunfish 11 0 176 1 116 58 118 245
Lepomis microlophus Redear Sunfish 0 0 0 6 1 1 5 1
Lepomis miniatus Redspotted Sunfish 0 0 0 0 0 17 0 0
Lepomis symmetricus Bantom Sunfish 0 0 0 8 0 0 0 0
Micropterus dolomieu Smallmouth Bass 0 0 0 0 0 0 0 0
Micropterus punctulatus Spotted Bass 0 0 0 1 79 27 2 13
Micropterus salmoides Largemouth Bass 0 0 4 16 25 5 16 8
Micropterus treculii Guadalupe Bass 0 0 0 0 5 0 0 0
Pomoxis annularis White Crappie 0 0 0 115 1 14 1 2
Pomoxis nigromaculatus Black Crappie 0 0 0 6 3 10 0 1
Percidae
Etheostoma chlorosoma Bluntnose Darter 0 0 0 2 0 0 2 2
Etheostoma gracile Slough Darter 0 0 2 0 2 3 6 1
49

Etheostoma parvipinne Goldstripped Darter 0 0 0 0 0 0 0 0
Etheostoma spectabile Orangethroat Darter 0 0 0 0 0 0 0 0
Percina carbonaria Texas Logperch 0 0 0 0 0 0 0 0
Percina macrolepida Bigscale Logperch 0 0 0 0 0 0 0 0
Percina sciera Dusky Darter 0 0 0 0 12 13 0 3
Sciaenidae
Aplodinotus grunniens Freshwater Drum 1 0 0 0 0 0 0 0
Elassomatidae
Elassoma zonatum Pygmy Sunfish 0 0 0 0 0 15 0 0
50

Appendix I continued: Abundance of fish species collected across sampling season for sites within the Navasota subbasin
Family Genus Species Common name Navasota
NV1 NV2 NV3 NV4 NV5 NV6
Lepisosteidae
Atractosteus spatula Alligator Gar 0 0 0 0 0 0
Lepisosteus oculatus Spotted Gar 2 10 0 1 1 0
Lepisosteus osseus Longnose gar 1 0 0 1 0 0
Amiidae
Amia calva Bowfin 0 0 0 0 0 0
Cluepidae
Dorosoma cepedianum Gizzard Shad 0 6 8 5 37 0
Dorosoma petenense Threadfin Shad 0 2 0 3 503 0
Cyprinidae
Campostoma anomalum Central Stoneroller 0 0 0 0 0 0
Cyprinella lutrensis Red Shiner 492 226 37 8 121 173
Cyprinella venusta Blacktail Shiner 205 380 337 71 0 0
Cyprinus carpio Common Carp 0 0 0 1 1 0
Hybognathus nuchalis Mississippi Silvery Minnow 325 544 0 1 0 0
Lythrurus fumeus Ribbon Shiner 34 280 40 35 55 0
Macrhybopsis hyostoma Shoal Chub 0 0 0 0 0 0
Macrhybopsis storeriana Silver Chub 0 0 0 0 0 0
Notemigonus crysoleucas Golden Shiner 1 0 0 1 2 2
Notropis buchanani Ghost Shiner 1 2 0 0 0 0
Notropis shumardi Silverband Shiner 55 0 0 0 0 0
Notropis texanus Weed Shiner 0 0 0 0 0 0
Notropis volucellus Mimic Shiner 1 1 0 0 0 0
Opsopoeodus emiliae Pugnose Minnow 1 12 1 0 11 0
Pimephales promelas Fathead Minnow 0 0 0 0 0 0
51
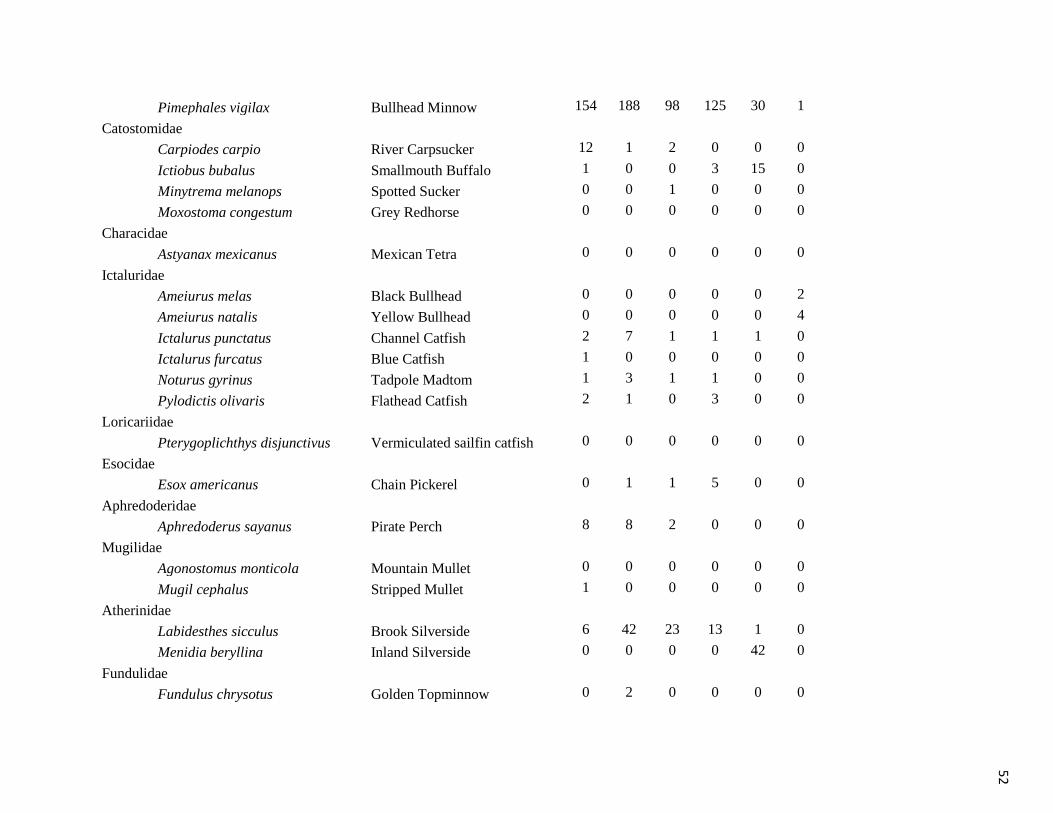
Pimephales vigilax Bullhead Minnow 154 188 98 125 30 1
Catostomidae
Carpiodes carpio River Carpsucker 12 1 2 0 0 0
Ictiobus bubalus Smallmouth Buffalo 1 0 0 3 15 0
Minytrema melanops Spotted Sucker 0 0 1 0 0 0
Moxostoma congestum Grey Redhorse 0 0 0 0 0 0
Characidae
Astyanax mexicanus Mexican Tetra 0 0 0 0 0 0
Ictaluridae
Ameiurus melas Black Bullhead 0 0 0 0 0 2
Ameiurus natalis Yellow Bullhead 0 0 0 0 0 4
Ictalurus punctatus Channel Catfish 2 7 1 1 1 0
Ictalurus furcatus Blue Catfish 1 0 0 0 0 0
Noturus gyrinus Tadpole Madtom 1 3 1 1 0 0
Pylodictis olivaris Flathead Catfish 2 1 0 3 0 0
Loricariidae
Pterygoplichthys disjunctivus Vermiculated sailfin catfish 0 0 0 0 0 0
Esocidae
Esox americanus Chain Pickerel 0 1 1 5 0 0
Aphredoderidae
Aphredoderus sayanus Pirate Perch 8 8 2 0 0 0
Mugilidae
Agonostomus monticola Mountain Mullet 0 0 0 0 0 0
Mugil cephalus Stripped Mullet 1 0 0 0 0 0
Atherinidae
Labidesthes sicculus Brook Silverside 6 42 23 13 1 0
Menidia beryllina Inland Silverside 0 0 0 0 42 0
Fundulidae
Fundulus chrysotus Golden Topminnow 0 2 0 0 0 0
52
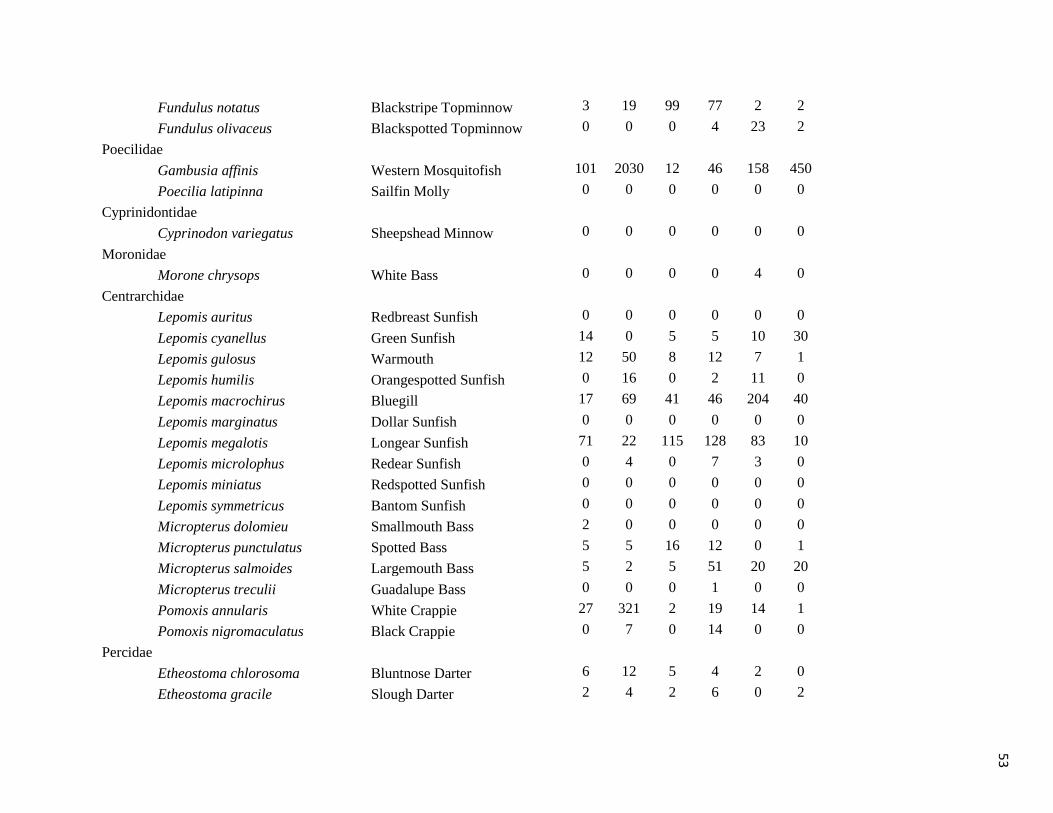
Fundulus notatus Blackstripe Topminnow 3 19 99 77 2 2
Fundulus olivaceus Blackspotted Topminnow 0 0 0 4 23 2
Poecilidae
Gambusia affinis Western Mosquitofish 101 2030 12 46 158 450
Poecilia latipinna Sailfin Molly 0 0 0 0 0 0
Cyprinidontidae
Cyprinodon variegatus Sheepshead Minnow 0 0 0 0 0 0
Moronidae
Morone chrysops White Bass 0 0 0 0 4 0
Centrarchidae
Lepomis auritus Redbreast Sunfish 0 0 0 0 0 0
Lepomis cyanellus Green Sunfish 14 0 5 5 10 30
Lepomis gulosus Warmouth 12 50 8 12 7 1
Lepomis humilis Orangespotted Sunfish 0 16 0 2 11 0
Lepomis macrochirus Bluegill 17 69 41 46 204 40
Lepomis marginatus Dollar Sunfish 0 0 0 0 0 0
Lepomis megalotis Longear Sunfish 71 22 115 128 83 10
Lepomis microlophus Redear Sunfish 0 4 0 7 3 0
Lepomis miniatus Redspotted Sunfish 0 0 0 0 0 0
Lepomis symmetricus Bantom Sunfish 0 0 0 0 0 0
Micropterus dolomieu Smallmouth Bass 2 0 0 0 0 0
Micropterus punctulatus Spotted Bass 5 5 16 12 0 1
Micropterus salmoides Largemouth Bass 5 2 5 51 20 20
Micropterus treculii Guadalupe Bass 0 0 0 1 0 0
Pomoxis annularis White Crappie 27 321 2 19 14 1
Pomoxis nigromaculatus Black Crappie 0 7 0 14 0 0
Percidae
Etheostoma chlorosoma Bluntnose Darter 6 12 5 4 2 0
Etheostoma gracile Slough Darter 2 4 2 6 0 2
53

Etheostoma parvipinne Goldstripped Darter 0 0 0 0 0 0
Etheostoma spectabile Orangethroat Darter 0 1 0 0 0 0
Percina carbonaria Texas Logperch 0 1 0 0 0 0
Percina macrolepida Bigscale Logperch 0 0 0 0 1 0
Percina sciera Dusky Darter 0 7 3 26 0 0
Sciaenidae
Aplodinotus grunniens Freshwater Drum 0 0 0 0 0 0
Elassomatidae
Elassoma zonatum Pygmy Sunfish 0 0 0 0 0 0
54
55
APPENDIX II
SUMMARY OF THE ENVIRONMENTAL PARAMETERS FOR LOWER BRAZOS
SUBBASIN SITES

Appendix VI. Summary of the environmental parameters for Lower Brazos subbasin sites.
Central Brazos Subbasin Sites
CB1 CB2 CB3 CB4 CB5 CB6
Mean Annual Flow¹ 46.24 21.81 174.14 122.02 34.90 47.85
Drainage size (km²) 306.24 144.44 1153.27 808.07 231.12 482.98
Habitat parameters - mean (Standard Error) Depth (cm) 46.72 (1.12) 46.43 (3.68) 44.18 (2.75) 25.77 (2.53) 40.30 (4.30) 39.99 (2.01)
Velocity (m/s) 0.06 (0.02) 0.19 (0.02) 0.28 (0.05) 0.08 (0.04) 0.04 (0.01) 0.15 (0.01)
Conductivity (mS/cm) 0.86 (0.20) 1.40 (0.18) 0.90 (0.24) 0.68 (0.08) 1.37 (0.39) 1.34 (0.27)
Temperature (°C) 18.56 (6.27) 19.34 (5.76) 20.11 (5.61) 18.20 (7.01) 19.88 (7.48) 19.33 (6.87)
Dissolved Oxygen (mg/l) 4.30 (0.26) 7.84 (1.60) 8.42 (1.49) 7.27 (1.04) 10.28 (2.73) 10.80 (1.38)
pH 7.55 (0.12) 8.31 (0.12) 8.07 (0.13) 8.15 (0.04) 8.29 (0.12) 8.26 (0.22)
Width:Depth 18.68 (0.69) 21.69 (1.04) 30.99 (3.72) 54.16 (15.21) 23.57 (3.03) 20.46 (0.80)
Habitat parameters - % Clay 25.83 - 26.11 77.78 26.11 50.00
Silt 11.11 4.72 5.00 1.11 18.22 22.50
Sand 6.67 38.06 8.33 1.11 10.67 0.83
Gravel 21.67 47.22 5.56 8.89 18.89 23.33
Cobble 8.89 4.44 10.83 10.00 8.33 3.33
Boulder 24.72 3.33 3.61 1.11 - -
Bedrock 1.11 - 40.56 - 16.67 -
Woody Debris 23.33 11.39 3.89 20.00 2.89 10.83
Aquatic vegetation - 4.17 5.28 - 2.22 4.17
Cover 51.39 23.61 20.56 8.89 5.33 37.50
56
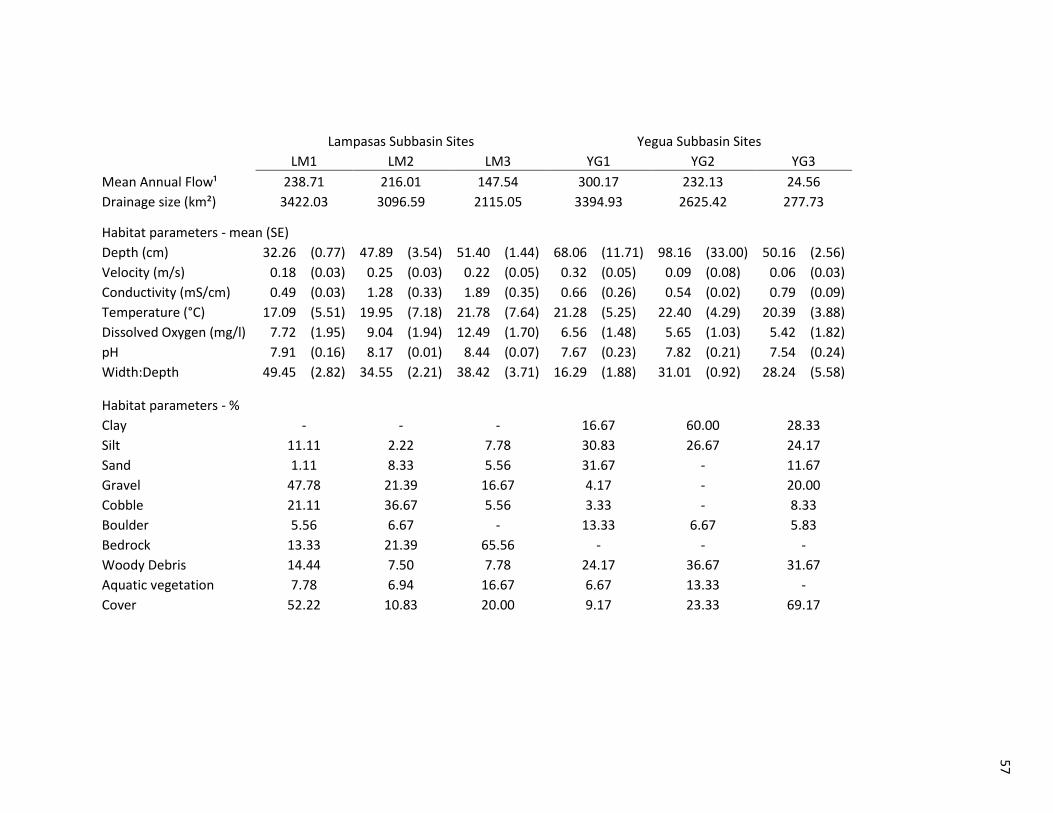
Lampasas Subbasin Sites Yegua Subbasin Sites
LM1 LM2 LM3 YG1 YG2 YG3
Mean Annual Flow¹ 238.71 216.01 147.54 300.17 232.13 24.56
Drainage size (km²) 3422.03 3096.59 2115.05 3394.93 2625.42 277.73
Habitat parameters - mean (SE) Depth (cm) 32.26 (0.77) 47.89 (3.54) 51.40 (1.44) 68.06 (11.71) 98.16 (33.00) 50.16 (2.56)
Velocity (m/s) 0.18 (0.03) 0.25 (0.03) 0.22 (0.05) 0.32 (0.05) 0.09 (0.08) 0.06 (0.03)
Conductivity (mS/cm) 0.49 (0.03) 1.28 (0.33) 1.89 (0.35) 0.66 (0.26) 0.54 (0.02) 0.79 (0.09)
Temperature (°C) 17.09 (5.51) 19.95 (7.18) 21.78 (7.64) 21.28 (5.25) 22.40 (4.29) 20.39 (3.88)
Dissolved Oxygen (mg/l) 7.72 (1.95) 9.04 (1.94) 12.49 (1.70) 6.56 (1.48) 5.65 (1.03) 5.42 (1.82)
pH 7.91 (0.16) 8.17 (0.01) 8.44 (0.07) 7.67 (0.23) 7.82 (0.21) 7.54 (0.24)
Width:Depth 49.45 (2.82) 34.55 (2.21) 38.42 (3.71) 16.29 (1.88) 31.01 (0.92) 28.24 (5.58)
Habitat parameters - % Clay - - - 16.67 60.00 28.33
Silt 11.11 2.22 7.78 30.83 26.67 24.17
Sand 1.11 8.33 5.56 31.67 - 11.67
Gravel 47.78 21.39 16.67 4.17 - 20.00
Cobble 21.11 36.67 5.56 3.33 - 8.33
Boulder 5.56 6.67 - 13.33 6.67 5.83
Bedrock 13.33 21.39 65.56 - - -
Woody Debris 14.44 7.50 7.78 24.17 36.67 31.67
Aquatic vegetation 7.78 6.94 16.67 6.67 13.33 -
Cover 52.22 10.83 20.00 9.17 23.33 69.17
57

Lower Brazos Subbasin Sites
LB1 LB2 LB3 LB4 LB5 LB6 LB7 LB8
Mean Annual Flow¹ 77.03 4.04 11.34 25.52 191.09 27.24 22.80 65.51
Drainage size (km²) 415.67 55.11 61.18 137.69 1031.16 147.02 123.03 433.84
Habitat parameters - mean (SE) Depth (cm) 77.70 (19.26) 16.12 (0.94) 29.57 (11.32) 80.63 (1.73) 34.78 (1.31) 43.72 (1.52) 34.72 (7.37) 60.63 (6.38)
Velocity (m/s) 0.20 (0.05) 0.01 (0.00) 0.08 (0.03) 0.01 (0.00) 0.24 (0.01) 0.09 (0.02) 0.07 (0.03) 0.09 (0.04)
Conductivity (mS/cm) 1.55 (0.44) 0.99 (0.22) 0.60 (0.05) 0.80 (0.26) 0.45 (0.05) 0.38 (0.02) 0.53 (0.11) 0.64 (0.12)
Temperature (°C) 21.58 (6.28) 22.56 (5.67) 19.40 (6.26) 22.21 (4.89) 25.67 (6.20) 19.95 (4.75) 19.01 (5.87) 20.53 (5.89)
Dissolved Oxygen (mg/l) 7.76 (1.20) 7.04 (2.47) 7.46 (1.57) 10.20 (3.90) 11.62 (2.62) 8.61 (2.16) 6.52 (2.29) 7.99 (2.53)
pH 8.16 (0.21) 7.88 (0.24) 7.68 (0.27) 7.76 (0.50) 8.35 (0.19) 7.48 (0.09) 7.81 (0.21) 7.90 (0.18)
Width:Depth 17.65 (0.35) 28.92 (2.87) 16.20 (4.15) 23.18 (0.59) 35.47 (2.30) 18.44 (0.34) 29.19 (7.81) 21.29 (0.45)
Habitat parameters - % Clay 71.11 - - 40.00 11.11 16.33 57.78 48.33
Silt 15.56 50.00 10.00 50.00 8.17 4.67 13.33 10.00
Sand 10.00 50.00 65.00 3.33 62.67 54.33 16.67 20.00
Gravel 3.33 - 21.67 6.67 4.17 7.50 5.56 21.67
Cobble - - 3.33 - - 1.50 3.33 -
Boulder - - - - - 17.17 3.33 -
Bedrock - - - - 13.89 - - -
Woody Debris 20.00 - 26.67 33.33 6.61 10.67 30.00 15.83
Aquatic vegetation 16.67 30.00 10.00 40.00 7.22 11.33 5.00 10.00
Cover 23.33 - 58.33 56.67 7.72 53.33 66.67 45.00
58

Little River Subbasin Sites
LR1 LR2 LR3 LR4 LR5 LR6 LR7
Mean Annual Flow¹ 1849.51 91.29 237.80 186.81 65.18 34.03 54.48
Drainage size (km²) 19688.32 818.48 1917.25 1506.12 525.52 274.34 439.24
Habitat parameters - mean (SE) Depth (cm) 74.51 (5.82) 50.14 (6.70) 32.16 (0.57) 16.56 (4.10) 26.49 (2.70) 32.74 (2.58) 25.23 (2.07)
Velocity (m/s) 0.34 (0.05) 0.14 (0.03) 0.30 (0.08) 0.20 (0.02) 0.10 (0.04) 0.10 (0.04) 0.39 (0.05)
Conductivity (mS/cm) 0.64 (0.07) 0.79 (0.12) 0.45 (0.02) 0.81 (0.19) 0.50 (0.13) 0.39 (0.07) 0.77 (0.09)
Temperature (°C) 17.92 (5.83) 16.72 (6.06) 18.02 (5.23) 20.77 (5.99) 18.86 (4.26) 19.61 (6.52) 20.19 (3.96)
Dissolved Oxygen (mg/l) 9.30 (1.54) 8.17 (1.54) 8.99 (1.03) 14.49 (3.51) 7.94 (1.32) 11.63 (1.78) 8.46 (1.45)
pH 7.83 (0.11) 7.79 (0.04) 7.78 (0.20) 8.81 (0.44) 8.51 (0.20) 8.15 (0.03) 7.69 (0.34)
Width:Depth 36.31 (1.67) 12.84 (0.44) 39.67 (1.92) 146.72 (38.59) 52.36 (6.93) 27.17 (1.82) 54.34 (2.39)
Habitat parameters - % Clay 10.83 63.89 - - - - -
Silt 25.28 - 4.44 - 0.83 2.83 2.50
Sand 24.44 12.22 10.83 - 1.67 - 5.83
Gravel 36.94 15.56 65.56 17.22 12.33 9.00 29.17
Cobble 2.50 2.78 15.83 12.78 24.33 27.00 17.17
Boulder - 5.56 - 15.00 7.50 10.33 3.33
Bedrock - - 3.33 53.89 53.33 50.83 42.00
Woody Debris 8.89 16.67 22.50 - 9.17 4.83 7.17
Aquatic vegetation 2.78 1.11 1.11 3.89 - 1.67 7.50
Cover 1.94 39.44 53.33 28.89 19.17 9.67 56.17
59

Navasota Subbasin Sites
NV1 NV2 NV3 NV4 NV5 NV6
Mean Annual Flow¹ 1131.46 964.14 860.88 486.12 160.57 30.86
Drainage size (km²) 5680.97 4840.86 4322.42 2440.75 806.21 154.96
Habitat parameters - mean (SE) Depth (cm) 51.07 (2.34) 69.01 (6.76) 107.10 (14.36) 89.05 (18.96) 86.30 (25.08) 42.43 (17.69)
Velocity (m/s) 0.13 (0.03) 0.06 (0.01) 0.03 (0.00) 0.21 (0.03) 0.03 (0.01) 0.11 (0.11)
Conductivity (mS/cm) 0.54 (0.03) 0.47 (0.04) 0.37 (0.06) 0.26 (0.05) 0.91 (0.46) 0.32 (0.08)
Temperature (°C) 21.76 (5.59) 21.07 (5.71) 21.43 (5.83) 19.89 (4.99) 22.49 (5.97) 17.93 (6.11)
Dissolved Oxygen (mg/l) 7.16 (1.69) 7.59 (1.85) 8.24 (2.02) 8.30 (1.57) 9.44 (3.33) 4.37 (1.85)
pH 8.02 (0.14) 7.81 (0.07) 7.63 (0.07) 7.55 (0.13) 8.24 (0.28) 7.60 (0.18)
Width:Depth 35.98 (6.67) 17.66 (5.34) 25.67 (2.86) 29.93 (6.70) 34.11 (14.76) 24.85 (7.38)
Habitat parameters - % Clay 5.56 - 23.33 - - -
Silt 40.00 52.78 30.00 44.44 - 10.00
Sand 27.78 47.22 30.00 30.56 100.00 43.33
Gravel 7.78 1.67 13.33 4.44 - 46.67
Cobble 3.33 - - 10.56 - -
Boulder 15.56 - 3.33 10.00 - -
Bedrock - - - - - -
Woody Debris 10.00 23.89 33.33 19.44 15.00 10.00
Aquatic vegetation 2.22 2.78 - 7.78 - 3.33
Cover 10.00 31.11 46.67 57.78 56.67 96.67
¹National Hydrography Dataset Plus, (http://www.horizon-systems.com/nhdplus/)
60
61
WORKS CITED
Al-Rabab’ah, M.A., and C.G. Williams. 2002. Population dynamics of Pinus taeda L.
based on nuclear microsatellites. Forest Ecology and Management. 163(1-
3):263-271.
Alberti, M., D. Booth, K. Hill, B. Coburn, C. Avolio, S. Coe, and D. Spirandelli. 2007.
The impact of urban patterns on aquatic ecosystems: An empirical analysis in
Puget lowland sub-basins. Landscape and Urban Planning. 80(4):345-361.
Allan, J.D., D.L. Erickson, and J. Fay. 1997. The influence of catchment land use on
stream integrity across multiple spatial scales. Freshwater Biology. 37:149-
161.
Allan, J.D. 2004. Landscapes and riverscapes: The influence of land use on stream
ecosystems. Annual Review of Ecology, Evolution, and Systematics. 35:257-284.
Anderson, J. R., E.E. Hardy, J.T. Roach, and R.E. Witmer. 1976. A land use and land
cover classification system for use with remote sensor data. U.S. Geological
SurveyProfessional Paper 964 (Washington, DC: US Government Printing
Office).
Angermeier, P.L. 1995. Ecological attributes of extinction-prone species: Loss of
freshwater fishes of Virginia. Conservation Biology. 9: 143-158.
Angermeier, P.L. and M.R. Winston. 1999. Characterizing fish community diversity
across Virginia landscapes: Prerequisite for conservation. Ecological
Applications. 9(1):335-349.
Benda, L., N.L. Poff, D. Miller, T. Dunne, G. Reeves, G. Pess, and M. Pollock. 2004.
The network dynamics hypothesis: How channel networks structure riverine
habitats. BioScience. 54(5):413-427.
Billen, G., J. Garnier, J.M. Mouchel, and M. Silvestre, 2007. The Seine system:
Introduction to a multidisciplinary approach of the functioning of a regional
river system. Science of the Total Environment. 375(1-3):1-12.
Blanck, A., and N. Lamouroux. 2006. Large-scale intraspecific variation in life-history
traits of European freshwater fish. Journal of Biogeography. 35(5): 862-875.
62
Bledsoe, B.P., and C.C. Watson. 2001. Effects of urbanization on channel instability.
Journal of American Water Resources Association. 37:255–70.
Bonner, T.H. and D.T. Runyan. 2007. Fish assemblage changes in three Western Gulf
slope drainages. Report submitted to Texas Water Development Board.
Borcard, D., P. Legendre, and P. Drapeau. 1992. Partialling out the spatial component of
ecological variation. Ecology. 73:1045–1055.
Bray, J.R., and J.T. Curtis. 1957. An ordination of the upland forest communities of
southern Wisconsin. Ecological Monographs. 27:325-349.
Clarke, K.R. 1993. Non-parametric multivariate analyses of changes in community
structure. Australian Journal of Ecology. 18:117-143.
Clarke, K.R., and R.H. Green. 1988. Statistical design and analysis of changes in
community structure. Australian Journal of Ecology. 18:117-143.
Clarke, K.R. and R.N. Gorley. 2006. Primer v6: User Manual, Tutorial. Primer-E Ltd,
Plymouth, U.K.
Conner, J.V. and R.D. Suttkus. 1986. “Zoogeography of freshwater fishes of the western
Gulf slope”. In Hocutt, C.H.a.E.O.W. (Ed.). The zoogeography of North
American freshwater fishes. (pp. 413-456) New York, NY: John Wiley & Sons.
Di Castri, F. 1981. Mediterranean-type shrublands of the world. In F. Di dall, W.
Goodall, & R.I. Specht (Eds.), Ecosystems of the world: II. Mediterranean-type
shrublands. 1 – 52. New York: Elsevier.
Doppelt, B., M. Scurlock, C. Frissell, and J. Karr. 1993. Entering the Watershed: A new
approach to save America’s river ecosystems. Island Press, Covelo, CA.
Edwards, R. J. 1978. The effect of hypolimnion reservoir releases on fish distribution
and species diversity. Transactions of the American Fisheries Society. 107:71-
77.
Fausch, K.D. and K.R. Bestgen. 1997. Ecology of fishes indigenous to the central and
southwestern Great Plains. pp. 131-166. In Ecology and conservation of Great
Plains vertebrates. Ecological studies 125. Springer-Verlag, New York.
Fausch, K.D., C.E. Torgersen, C.V. Baxter, and H.W. Li. 2002. Landscapes to
riverscapes: bridging the gap between research and conservation of stream
fishes. BioScience. 52:483–98.
63
Fiske, A.D., C.A. Myrick, and L.J. Hansen. 2007. Potential impacts of global climate
change on freshwater fisheries. Reviews in Fish Biology and Fisheries.
17(4):581-613.
Fitzpatrick, F.A., B.C. Scudder, B.N. Lenz, and D.J. Sullivan. 2001. Effects of multi-
scale environmental characteristics on agricultural stream biota in eastern
Wisconsin. Journal of American Water Resources Association. 37:1489–
507.
Frissell, C.A. and D. Bayles. 1996. Ecosystem Management and the conservation of
aquatic biodiversity and ecological integrity. Water Resources Bulletin;
American Water Resources Association. 32(2):229-240
Frissell, C.A., W.J. Liss, C.E. Warren, and M.D. Hurley. 1986. A Hierarchical approach
to stream habitat classification: Viewing streams in a watershed context.
Environmental Management. 10:199-214.
Folke, C., C.S. Holling, and C. Perrings. 1996. Biological diversity, ecosystems, and the
human scale. Ecological Applications. 6:1018–1024.
Ganio, L.M., C.E. Torgersen, and R.E. Gresswell. 2005. A geostatistical approach for
describing spatial pattern in stream networks. Frontiers in Ecology and the
Environment. 3(3):138-144.
Gauch, H.G., Jr. 1982. Multivariate analysis in assemblage ecology. Cambridge Univ.
Press, Cambridge. 298 pp.
Gorman, O.T. 1986. Assemblage organization of stream fishes: The effect of rivers on
adventitious streams. The American Naturalist. 128(4):611-616.
Gregory, S.V., F.J. Swanson, W.A. McKee, and K.W. Cummins. 1991. An ecosystem
perspective of riparian zones: focus on links between land and water.
BioScience. 41:540–51.
Hascic, I., and J. Wu. 2006. Land use and watershed health in the United States. Land
Economics. 82(2):214-239.
Henley, W.F., M.A. Patterson, R.J. Neves, and A.D. Lemly. 2000. Effects of
sedimentation and turbidity on lotic food webs: a concise review for natural
resource managers. Reviews in Fisheries Science. 8:125–139.
Hill, M.O. 1979. Decorana – A Fortran: Program for detrended correspondence analysis
and reciprocal averaging. Cornell University Press, Ithaca.
Hill, M.O., and H.G. Gauch. 1980. Detrended correspondence analysis, an improved
ordination technique. Vegetatio. 42:47-58.
64
Homer C., Dewitz, J., Fry, J., Coan, M., Hossain, N., Larson, C., Herold, N., McKerrow,
A., VanDriel, J.N., Wickham, J.D., 2007. Completion of the 2001 National Land
Cover Database for the conterminous United States. Photogrammetric
Engineering & Remote Sensing. 73:337-341.
Hubbs, C. 1957. Distributional patterns of Texas freshwater fishes. The Southwestern
Naturalist. 2(2-3):89-104.
Hubbs, C., R.J. Edwards, G.P. Garret. 1991. An Annotated Checklist of the Freshwater
Fishes of Texas, with Keys to Identification of Species. Texas Journal of
Science. 43(4):1-56.
Iwata, T., S. Nakano, and M. Inoue. 2003. Impacts of past riparian deforestation on
stream communities in a tropical rain forest in Borneo. Ecological Applications.
13(2):461-473.
Jongman, R.H.G., ter Braak, C.F.J. and van Tongeren, O.F.R. 1995. Data Analysis in
Community and Landscape Ecology. Cambridge University Press, Cambridge,
UK.
Karr, J. R. 1981. Assessment of biotic integrity using fish communities. Fisheries.
6(6):21–27.
Karr, J.R., and E.W. Chu. 2000. Sustaining living rivers. Hydrobiologia. 422/423:1–14.
Knapp, F.T. 1953. Fishes found in the freshwaters of Texas. Ragland Studio and Litho
Printing Co., Brunswick, Georgia, 166pp.
Krebbs, C.J. 1972. Ecology: The Experimental Analysis of Distributions and Abundance.
Harper and Row, New York.
Krebs, C. J. 1999. Ecological methodology, 2nd edition. Benjamin/Cummings, Menlo
Park, California.
Lammert, M., and J.D. Allan. 1999. Assessing biotic integrity of streams: effects of scale
in measuring the influence of land use/cover and habitat structure on fish and
macroinvertebrates. Environmental Management. 23:257–70.
Li, R.Y. and F.P. Gelwick. 2005. The relationship of environmental factors to spatial and
temporal variation of fish assemblages in a floodplain river in Texas, USA.
Ecology of Freshwater Fish. 14:319-330.
Ligon, F.K., W.E. Dietrich, and W.J. Trush. 1995. Downstream ecological effects of
dams. BioScience. 45(3):183-192.

65
Lowe, W.H., G.E. Likens, and M.E. Power. 2006. Linking scales in stream ecology.
BioScience. 56(7):591-597.
Maidment, D. R., 2002. Arc Hydro GIS for water resources. ESRI Press, Redlands CA.
Matthews, W.J. 1987. Community and evolutionary ecology of North American stream
fishes. University of Oklahoma Press, Norman, OK.
Matthews, W.J., and E. Marsh-Matthews. 2006. Temporal changes in replicated
experimental stream fish assemblages: predictable or not? Freshwater Biology.
51(9):1605-1622.
Moyle, P.B. and J.P. Ellison.. 1991. A conservation-oriented classification system for the
inland waters of California. California Fish and Game. 77:161-180.
Nielsen-Gammon, J.W. 2009. The changing climate of Texas. In. The Impact of Global
Warming on Texas. University of Texas Press. Austin.
Nilsson, C. and K. Berggren. 2000. Alterations of riparian ecosystems caused by river
regulation. BioScience. 50:783-92.
Noss, R.F., E.T. LaRoe III, and J.M. Scott. 1995. Endangered ecosystems of the United
States: a preliminary assessment of loss and degradation. National Biological
Service Biological Report 28, Washington D.C., USA.
Ostrand, K.G. and G.R. Wilde. 2002. Seasonal and spatial variation in a prairie stream-
fish assemblage. Ecology of Freshwater Fish. 11(3):137-149.
Perkin, J.S., C.S. Williams, and T.H. Bonner. 2009. Aspects of chub shiner Notropis
potteri life history with comments on native distribution and conservation
status. American Midland Naturalist. 162:276-288.
Perkin, J.S., Z.R. Shattuck, P.T. Bean, and T.H. Bonner. 2010. Movement and
microhabitat associations of Guadalupe Bass in two Texas rivers. North
American Journal of Fisheries Management. 30:33-46.
Pielou, E.C. (1966). The measurement of diversity in different types of biological
collections. Journal of Theoretical Biology. 13:131-144.
Pflieger, W.L. Aquatic community classification systems for Missouri. Aquatic Series
No. 19, Missouri Department of Conservation. Jefferson City, Missouri, USA.
Phillips, J.D. 2007. Geomorphic equilibrium in Southeast Texas Rivers. Report to Texas
Water Development Board. Contract number 0605830636.

66
Poff, N.L. 1997. Landscape filters and species traits: towards mechanistic understanding
and prediction in stream ecology. Journal of North American Benthological
Society 16:391–409.
Poff, N.L., and D.J. Allan. 1995. Functional organization of stream fish assemblages in
relation to hydrologic variability. Ecology. 76:606–627.
Poff, N.L., J.D. Allan, M.B. Bain, J.R. Karr, K.L. Prestegaard, B.D. Richter, R.E. Sparks,
and J.C. Stromberg, 1997. The Natural Flow Regime. BioScience. 47(11):769-
784.
R Development Core Team (2008). R: A language and environment for statistical
computing. R Foundation for Statistical Computing, Vienna, Austria. ISBN 3-
900051-07-0, URL: http://www.R-project.org.
Rahel, F.J., and W.A. Hubert. 1991, Fish Assemblages and Habitat Gradients in a Rocky
Mountain–Great Plains Stream: Biotic Zonation and Additive Patterns of
Community Change. Transactions of the American Fisheries Society. 120:319-
332.
Rahel, F.J. 2000. Homogenization of fish faunas across the United States. Science.
288:854-856.
Richards, C., L.B. Johnson, and G.E. Host. 1996. Landscape-scale influences on stream
habitats and biota. Canadian Journal of Fisheries and Aquatic Sciences.
53:295–311.
Robertson, C.R., S.C. Zeug, and K.O. Winemiller. 2008. Associations between
hydrological connectivity and resource partitioning among sympatric gar species
(Lepisosteidae) in a Texas river and associated oxbows. Ecology of Freshwater
Fish. 17:119-129.
Rosgen, D., 1996. Applied River Morphology. Pagosa Springs, CO. Wildland Hydrology.
390pp.
Ross, S.T., W.J. Matthews, and A.A. Echelle. 1985. Persistence of stream fish
assemblages: Effects of environmental change. The American Naturalist.
126(1):24-40.
Roth, N.E., D. Allan, and D.L. Erickson, 1996. Landscape influences on stream biotic
integrity assessed at multiple spatial scales. Landscape Ecology. 11(3):141-156.
Runyan, D.T. 2007. Fish assemblage changes in Western Gulf Slope drainages: an
historical perspective and distribution and diet of larval and juvenile fishes in the
Rio Grande, Texas. Unpublished M.S. thesis, Texas State University-San
Marcos. 96p.
67
Samson, F.B., F.L. Knopf, and W. Ostlie. 2004. Great plains ecosystems: Past, present,
and future. Wildlife Society Bulletin. 32(1):6-15.
Schlosser, I. J. 1982. Fish community structure and function along two habitat gradients
in a headwater stream. Ecological Monographs. 52(4):395-414.
Schlosser, I.J. 1987. A conceptual framework for fish communities in small warmwater
streams. Community and evolutionary ecology of North American stream fishes.
ed. By W.J. Matthews and D.C. Heins, pp. 17–24. University of Oklahoma
Press, Norman, OK.
Schlosser, I.J. 1991. Stream fish ecology: a landscape perspective. BioScience. 41:704–
12.
Scott, M.C., 2006. Winners and losers among stream fishes in relation to land use
legacies and urban development in the southeastern US. Biological
Conservation. 127(3):301-309.
Scott, M.C. and G.S. Helfman. 2001. Native invasions, homogenization, and the
mismeasure of integrity of fish assemblages. Fisheries. 26:6-15.
Shoshany, M. and T. Svoray. 2002. Multidate adaptive unimixing and its application to
analysis of ecosystem transitions along a climatic gradient. Remote Sensing of
the Environment. 82:5-20.
Smith, C.L. and Powell, C.R. 1971. The summer fish communities of Brier Creek,
Marshall County, Oklahoma. American Museum Novitates, 2458:1–30.
Snyder, C.D., J.A. Young, R. Villella, and D.P. Lemarie. 2003. Influences of upland and
riparian land use patterns on stream biotic integrity. Landscape Ecology.
18(7):647-664.
Sponseller, R.A., E.F. Benfield, and H.M. Valett. 2001. Relationships between land use,
spatial scale and stream macroinvertebrate communities. Freshwater Biology.
46:1409–24.
Stauffer, J.C., Goldstein R.M., and Newman R.M. 2000. Relationship of wooded riparian
zones and runoff potential to fish community composition in agricultural
streams. Canadian Journal of Fisheries and Aquatic Sciences. 57:307–16.
Strahler, A.N., 1964. Quantitative geomorphology of drainage basins and channel
networks. In Handbook of applied hydrology, McGraw-Hill Book Co., New
York.

68
Tabacchi, E., D.L. Correll, R. Hauer, G. Pinay, A.M. Planty-Tabacchi, and R.C.
Wissmar. 1998. Development, maintenance and role of riparian vegetation in the
river landscape. Freshwater Biology. 40(3):497-516.
ter Braak, C. J. F. 1986. Canonical correspondence analysis: a new eigenvector technique
for multivariate direct gradient analysis in ecology. Ecology. 67:1167–1179.
ter Braak, C. J. F. and P. Smilauer. 2002. Canoco for windows, version 4.5. Biometris–
Plant Research International, Wageningin, The Netherlands.
Townsend C.R., S. Doledec, R. Norris, K. Peacock, and C. Arbuckle. 2003. The
influence of scale and geography on relationships between stream community
composition and landscape variables: description and prediction. Freshwater
Biology. 48:768–85.
Turner, M.G., 2005. Landscape ecology in North America: Past, present, and future.
Ecology. 86(8):1967-1974.
Vannote, R.L., W.G. Minshall, K.W. Cummins, J.R. Sedell, and C.E. Cushing. 1980. The
river continuum concept. Canadian Journal of Fisheries and Aquatic Sciences.
37:130–37.
Vogl, A.L., and V.L. Lopes. 2008. Impacts of water resources development on flow
regimes in the Brazos River. Environmental Monitoring and Assessment. 157(1-
4):331-345.
Walsh, C.J., A.H. Roy, J.W. Feminella, P.D. Cottingham, P.M. Groffman, R.P. Morgan
II. 2005. The urban stream syndrome: current knowledge and the search for a
cure. Journal of the North American Benthological Society. 24(3):706-723.
Wang, L., J. Lyons, P. Kanehl, R. Gatti. 1997. Influences of watershed land use on
habitat quality and biotic integrity in Wisconsin streams. Fisheries. 22:6–12.
Wang, L., J. Lyons, and P. Kanehl. 2001. Impacts of urbanization on stream habitat and
fish across multiple spatial scales. Environmental Management. 28:255–66.
Ward, J.V. 1998. Riverine landscapes: Biodiversity patterns, disturbance regimes, and
aquatic conservation. Biological Conservation. 83(3): 269-278.
Ward, G.H. 2000. Texas Water at the century’s turn – perspectives, reflections and a
comfort bag. In Water for Texas: 2000 and beyond. 17-43. College Station:
Texas A&M University Press.
Ward, J.V., K. Tockner, and F. Schiemer. 1999. Biodiversity of floodplain river
ecosystems: ecotones and connectivity. Regulated Rivers: Research and
Management. 15(1-3):125-139.
69
Ward, J.V., K.Tochner, D.B. Arscott, and C. Claret. 2002. Riverine landscape diversity.
Freshwater Biology. 47:517-539.
Ward, J.V. and J.A. Stanford, 2006. Ecological connectivity in alluvial river ecosystems
and its disruption by flow regulation. Regulated Rivers: Research &
Management. 11(1):105-119.
Warren, M.L., Jr., B.M. Burr, S.J. Walsh, H.L. Bart, JR., R.C. Cashner, D.A. Etnier, B.J.
Freeman, B.R. Kuhajda, R.L. Mayden, H.W. Robison, S.T. Ross and W.C.
Starnes. 2000. Diversity, Distribution, and Conservation status of the native
freshwater fishes of the southern United States. Fisheries, Conservation.
25(10):7-29.
Warwick, R.M. 1988. Analysis of community attributes of the macrobenthos of
Frierfjord/Langesundfjord at taxonomic levels higher than species. Marine
Ecology Progress Series. 46:167-170.
Starnes. 2000. Diversity, distribution, and conservation status of the native
freshwater fishes of the Southern Unites States. Fisheries. 25:7–31.
Williams, C.S., and T.H. Bonner. 2006. Habitat associations, life history and diet of the
Sabine shiner Notropis sabinae in an east Texas drainage. The American
Midland Naturalist. 155(1):84-102.
Williams, J.E., J.E. Johnson, D.A. Hendrickson, S. Contreras-Balderas, J.D. Willaims, M.
Navarro-Mendoza, D.E. McAllister, and J.E. Deacon. 1989. Fishes of North
America endangered, threatened, or of special concern: Fisheries.14(6):3-20.
Williams, L.R., T.H. Bonner, J.D. Hudson III, M.G. Williams, T.R. Leavy, and C.S.
Williams. 2005. Interactive effects of environmental variability and military
training on stream biota of three headwater drainages in western Louisiana.
Transactions of the American Fisheries Society. 134:192-206.
Williams, L.R., J.D. Hudson, III, M.G. Williams, V. Campbell-Arvai, and T.H. Bonner.
2007. Journal of Freshwater Ecology. 22(1):119-133.
Winemiller, K.O., S. Tarim, D. Shorman, and J.B. Cotner, 2000. Fish Assemblage
Structure in Relation to Environmental Variation among Brazos River Oxbow
Lakes. Transactions of the American Fisheries Society. 129:451-468.
Winston, M.R., C.M. Taylor and J. Pigg. 1991. Upstream expiration of four minnow
species due to damming of a prairie stream. Transactions of the American
Fisheries Society. 120:98–105.
Woodruff, C.M. Jr. 1977. Stream piracy near the Balcones fault zone, Central Texas.
Journal of Geology. 85:483-490.

70
Woodward, D.F., J.N. Goldstein, A.M. Farag, and W.G. Brumbaugh.1997. Cutthroat
trout avoidance of metals and conditions characteristic of a mining waste site:
Coeur d’Alene River, Idaho. Transactions of the American Fisheries Society.
126:699–706.
VITA
Ben Labay was born in Richmond, Texas, on January 1, 1981, the son of Ed
Labay and Kathy McCombs. After completing work at Clark High School, San Antonio,
Texas, in 1999, he entered University of Texas at Austin. He received the degree of
Bachelor of Science from UT in August 2002. During the following years he worked in
Austin and Alaska as a naturalist guide and biological technician. In September 2008, he
entered the Graduate College of Texas State University-San Marcos.
Permanent Address: 2209 New York Ave
Austin, Texas 78702
This thesis was typed by Ben J. Labay
