the influence of accounting records on the financial
TRANSCRIPT

THE INFLUENCE OF ACCOUNTING RECORDS ON THE FINANCIAL
PERFORMANCE OF SMALL AND MEDIUM ENTERPRISES IN CENTRAL
BUSINESS DISTRICT IN NAIROBI COUNTY
ROBERT MWANGI KAMAU
D61/65221/2011
A RESEARCH PROJECT SUBMITTED IN PARTIAL FULFILMENT OF THE
REQUIREMENTS FOR THE AWARD OF A MASTER OF BUSINESS
ADMINISTRATION DEGREE OF THE UNIVERSITY OF NAIROBI.
NOVEMBER, 2015

i
DECLARATION
This research is my original work and has not been presented for any academic award in
any other university
Signed………………………….. Date……………………….
Name: Robert Mwangi Kamau
Reg. No: D61/65221/2011
This research has been submitted for examination with my approval as the University
Supervisor.
Signed………………………… Date ……………………………….
Mr. Abdulatif Essajee
Lecturer
Department of Finance and Accounting
School of Business
University of Nairobi

ii
DEDICATION
This project is dedicated to my family members for their financial and moral support
throughout my time in school and during my study of this research project.

iii
ACKNOWLEDGEMENT
I wish to acknowledge the following for their assistance and support in ensuring that this
project is complete. My supervisor and lecturer, Mr. Abdulatif Essajee for his timely
professional guidance and support throughout this project, the respondents who
provided information in my field work. I would also wish to acknowledge the immense
wealth of knowledge and research facilities available at the University of Nairobi.

iv
TABLE OF CONTENTS
DECLARATION................................................................................................................ i
DEDICATION................................................................................................................... ii
ACKNOWLEDGEMENT ............................................................................................... iii
LIST OF TABLES ......................................................................................................... viii
LIST OF FIGURES ......................................................................................................... ix
ACRONYMS AND ABBREVIATIONS ......................................................................... x
ABSTRACT ...................................................................................................................... xi
CHAPTER ONE: INTRODUCTION ............................................................................. 1
1.1 Background of the Study .............................................................................................. 1
1.1.1 Accounting Records ............................................................................................... 2
1.1.2 Financial Performance............................................................................................ 3
1.1.3 Small and Medium Enterprises (SMEs) ................................................................. 5
1.1.4 Accounting Records, Accounting Systems and Financial Performance ................ 6
1.2 Research Problem ......................................................................................................... 8
1.3 Objectives of the Study ................................................................................................. 9
1.4 Value of the Study ........................................................................................................ 9
CHAPTER TWO: LITERATURE REVIEW .............................................................. 10
2.1 Introduction ................................................................................................................. 10
2.2 Theoretical Framework ............................................................................................... 10
v
2.2.1 Decision Usefulness Theory................................................................................. 10
2.2.2 Positive Accounting Theory (PAT)...................................................................... 11
2.2.3 Resource Based View .......................................................................................... 12
2.3 Determinants of Financial Performance ..................................................................... 12
2.4 Empirical Review........................................................................................................ 14
2.4.1 International Studies ............................................................................................. 14
2.4.2 Local Studies ........................................................................................................ 16
2.5 Summary of Literature Review ................................................................................... 18
CHAPTER THREE: RESEARCH METHODOLOGY ............................................. 19
3.1 Introduction ................................................................................................................. 19
3.2 Research Design.......................................................................................................... 19
3.3 Population ................................................................................................................... 19
3.4 Sample Design ............................................................................................................ 20
3.5 Data Collection ........................................................................................................... 21
3.6 Validity and Reliability ............................................................................................... 21
3.7 Data Analysis .............................................................................................................. 21
CHAPTER FOUR: DATA ANALYSIS, FINDINGS AND DISCUSSION ............... 23
4.1 Introduction ................................................................................................................. 23
4.2 Response Rate ............................................................................................................. 23
4.3 General Information .................................................................................................... 24

vi
4.3.1 Gender of the Respondents .................................................................................. 24
4.3.2 Level of Education ............................................................................................... 25
4.3.3 Age of the Respondents........................................................................................ 26
4.4 Information about the Enterprise ................................................................................ 27
4.4.1 Form of Business Organization ............................................................................ 27
4.4.2 Classification of the Business .............................................................................. 28
4.4.3 Length of Business Operation .............................................................................. 29
4.4.4 Start Capital .......................................................................................................... 30
4.4.5 Record Keeping .................................................................................................... 30
4.5 Information on Purchases and Sales Ledgers ............................................................. 31
4.5.1 Purchases and Sales Control Ledger .................................................................... 31
4.5.2 Statements on Purchases and Sales Control Ledger............................................. 31
4.6 Information on Cashbook ........................................................................................... 32
4.6.1 Cash Book Ownership .......................................................................................... 32
4.6.2 Statements on Cash Book ..................................................................................... 32
4.7 Information on Revenue and Expenditure Accounts .................................................. 34
4.7.1 Revenue and Expenditure Accounts .................................................................... 34
4.7.2 Statements on Business Revenue and Expenditure Accounts .............................. 35
4.8 Information on Statement of Income .......................................................................... 36
4.8.1 Statement of Income Preparation ......................................................................... 36

vii
4.8.2 Agreement on Statement of income ..................................................................... 37
4.9 Information on Balance Sheet ..................................................................................... 38
4.9.1 Balance Sheet Preparation .................................................................................... 38
4.9.2 Statements about the Balance Sheet ..................................................................... 39
4.10 Inferential Statistics .................................................................................................. 40
4.10.1 Correlation Analysis ........................................................................................... 40
4.10.2 Regression Analysis ........................................................................................... 41
4.11 Discussion of Findings .............................................................................................. 44
CHAPTER FIVE: SUMMARY OF FINDINGS, CONCLUSIONS AND
RECOMMENDATIONS ............................................................... 46
5.1 Introduction ................................................................................................................. 46
5.2 Summary of Findings .................................................................................................. 46
5.3 Conclusions ................................................................................................................. 47
5.4 Recommendations ....................................................................................................... 48
5.6 Suggestions for further Research ................................................................................ 48
5.7 Limitations of the Study.............................................................................................. 49
REFERENCES ................................................................................................................ 50
APPENDICES ................................................................................................................. 57
APPENDIX I: QUESTIONNAIRE ........................................................................... 57

viii
LIST OF TABLES
Table 4.1: Response Rate .................................................................................................. 23
Table 4.2: Statements on Purchases and Sales Control Ledger ........................................ 31
Table 4.3: Statements on Cash Book ................................................................................ 33
Table 4.4: Business Revenue and Expenditure Accounts ................................................. 35
Table 4.5: Agreement on Statement of income ................................................................ 37
Table 4.6: Statements about the Balance Sheet ................................................................ 39
Table 4.7: Correlation Analysis ........................................................................................ 40
Table 4.8: Regression Model Summary............................................................................ 41
Table 4.9: Analysis of Variance (ANOVA) ..................................................................... 42
Table 4.10: Regression Model Coefficients...................................................................... 43

ix
LIST OF FIGURES
Figure 4.1: Gender of the Respondents............................................................................. 24
Figure 4.2: Level of Education ......................................................................................... 25
Figure 4.3: Age of the Respondents .................................................................................. 26
Figure 4.4: Form of Business Organization ...................................................................... 27
Figure 4.5: Classification of the Business......................................................................... 28
Figure 4.6: Length of Business Operation ........................................................................ 29
Figure 4.7: Start Capital .................................................................................................... 30
Figure 4.8: Revenue and Expenditure Accounts ............................................................... 34
Figure 4.9: Preparation of Statement of Income ............................................................... 36
Figure 4.10: Preparation of Balance Sheet ....................................................................... 38

x
ACRONYMS AND ABBREVIATIONS
CBD Central Business District
GAAP General Accepted Accounting Principles
GDP Gross Domestic product
KACE Kenya Agricultural Commodity Exchange
PAT Positive Accounting Theory
RBV Resource Based View
SASRA Sacco Societies Regulatory Authority
SMEs Small and Medium Enterprises
U.S.A United States of America

xi
ABSTRACT
Small and medium scale enterprises are gaining wide spread acceptance as viable drivers
of economic growth. A sound accounting and internal control system in any business
irrespective of its scale is crucial. Audits of small scale enterprises have proven to be
worrisome for professional accountants because of the inadequacy of the internal
controls. The study sought to establish whether a relationship exists between accounting
systems, the manner in which accounting records were maintained by SMEs and their
financial performance. The study adopted a descriptive research design on SMEs in
Nairobi Central Business District. The study sampled 391 SMEs in Nairobi Central
Business District. Systematic sampling technique was used to sample SMEs. Descriptive
statistics and regression analysis was used to analyse the findings. The study found that
revenue and expenditure accounts play a major role in ledger accounts. For ledger
accounts to be effective, revenue and expenditure accounts must be well prepared to limit
chances of negative financial performance of SMEs in Nairobi County. It found that an
improvement in keeping and preparing purchases and sales ledgers can result in improved
financial performance. It also found that all the SMEs in Nairobi CBD keep purchases
and sales ledger, cash book, revenue and expenditure accounts, statement of income and
balance sheet. It found that most SMEs neutrally agree that purchases ledger shows all
purchases returns of the business, sales ledger shows all returns to the business and sales
ledger shows all the receivables of the business. Finally, the study found that a large
number of SMEs prepare balance sheets as they convey substantial information about the
financial strength and current performance of an enterprise.

1
CHAPTER ONE: INTRODUCTION
1.1 Background of the Study
Small and medium scale enterprises are gaining wide spread acceptance as viable drivers
of economic growth. They have tremendous impact on employment generation.
However, several of these enterprises demise without fulfilling expectations due to poor
management arising from weak accounting structure (Olatunji, 2013).
A sound accounting and internal control system in any business irrespective of its scale is
crucial. Audits of small scale enterprises have proven to be worrisome for professional
accountants because of the inadequacy of the internal controls. Except for statutory
demands, small and medium enterprises hardly give serious thoughts to the process of
sound accounting yet the adequacy and ineffectiveness of accounting processes have
been responsible for the ultimate collapse of a host of them (Mukaila and Adeyami,
2011).
The uniqueness of small and medium enterprises calls for a careful consideration in the
design of an accounting system (Olantunji, 2013).Peacock (2000) argues that, failure by
Small and Medium Enterprises (SMEs) to manage cash flows results in illiquidity and
finally the demise of SMEs. He advocated for the engagement of a qualified accountant
who can be instrumental in advising on strategic response to turbulent and competitive
business environment. There is need to support these small enterprises so that they can
grow to maturity and meet their intended purposes.
Accounting systems processes data and transactions to provide users with information
they need to plan, control and operate their business. In this definition, accounting
information systems are considered as tools that help management in planning and
controlling processes by providing the relevant and reliable information for decision
making (Romney & Steinbart, 2000). Accounting system functions are not solely for
purpose of producing financial reports rather the role goes beyond this traditional view
and can also be used as a controlling mechanism such as budgeting. Full adoption of the
system will essentially require attainment of all the benefits of the system. Evidence from
a number of studies reveals that SMEs financial accounting has remained the principle

2
source of information for their managers. The problem of poor adoption of accounting
systems can be attributed to the initial objective of adoption of information technology
(IT) that was essentially to replace manual accounting process that has now hindered
further usage and exploration on the system benefits (Mauldin & Ruchala, 1999). Marriot
and Marriot (2000) argue that financial awareness amongst SMEs varies considerably
and the use of computers for the preparation of management information is not fully
utilized to its potential.
1.1.1 Accounting Records
Romney (2003) defined record keeping systems as set of components that collects,
records, classifies, analyses, and processes and summarizes business transactions in the
books of accounts. A system should be simple to use, easy to understand, reliable,
accurate consistent and designed to provide information on a timely basis.
According to Parker (2002) record keeping involves identification, classification, storage
and protection, receipt and transmission, retention and disposal of records for preparation
of financial statements. He also adds that record keeping also includes policies, systems,
procedures, operations and personnel required to administer records. Mc Lean (1999)
points out that good record management helps in controlling the creation and growth of
records to reduce operating costs, assimilation of new records management technologies
and in ensuring regulatory compliance. Poor record keeping, inefficient use of accounting
information to support financial decision- making and low quality and reliability of
financial data are part of the main problems in financial management concerns of SMEs
(Karunananda and Jayamaha ,2011).
Accounting records are the products of an accounting system. Accounting system is an
orderly, efficient, scheme for providing accurate financial information and controls.
Accounting systems show the books, records, vouchers, files and related supporting data
resulting from application of accounting process that has observed regulatory
requirements and internal administration policies (Olatunji, 2013). Accounting system
must comply with the Generally Accepted Accounting Principles (GAAP). According to
GAAP, any event that has a determinable monetary impact on the organization must be

3
recognized as an accounting transaction. A vast majority of small scale businesses cannot
afford the complexity of a detailed accounting system, hence the existence of single
entries in their books and in some cases incomplete records (Wood, 1979).
Success of a business enterprise is the establishment and application of controls by the
owners or management in addition to the systematic record keeping of business
transactions, which at the end of the period keeps the owner well informed about the
performance of the business (Mbroh and Attom, 2013). A good accounting system is not
judged by how well records are kept but by how well it’s able to meet the information
needs of both internal and external decision makers (Hussein, 1983).
According to Caruthers and Espeland (1991) accounts constitute part of the conceptual
toolkit that people in business use in reflecting results or effects of their past decisions in
considering present alternatives by providing technical information on the outcomes of
previous business actions. They further state that accounting dates back to 2300 BC in
Egypt and 1000BC in pre-Mesopotamia. Over time, accounting has become increasingly
important and has become a primary source of information for businesses. New
accounting standards are gradually developed to cope with the new developments in
accounting and financial management in the world as a result of changing business
environments.
1.1.2 Financial Performance
Performance refers to an ongoing process that involves managing the criteria for which
an institution, agency or project can be held accountable (Duranti and Thibodeau, 2001).
These criteria are represented as components parts of an internal system and cover the
institutions ability to; control financial expenses, satisfy staff, deliver timely interventions
and respond to target group reactions to interventions.
Performance of a business refers to the ability of business to meet the required standards,
increase market share, improve facilities, ensuring returns on profitability and total cost
reduction and once this is achieved, a business is believed to be performing effectively
(Fitzgerald, 2006).The need for an effective accounting system in promoting good
performance in small and medium enterprises cannot be overlooked. SMEs may not be

4
able to adopt elaborate systems but should be encouraged to use customized adaptive
systems for a profound impact on their corporate performance (Olatunji2013). Indeed
Lybaert (1998) asserts that the quality of accounting information utilized within the
SMEs sector has a positive relationship with an entity’s financial performance. The
financial crisis Advisory Group (www:ifrs.org/news.press) identifies “Effective Financial
Reporting’’ as one of the key principles that “plays an integral role in the financial
systems by striving to provide unbiased transparent and relevant information about
economic performance and condition of business”.
Performance measures are quantitative and qualitative ways that characterize and define
performance. They provide a tool for organization to manage progress towards achieving
pre-determined goals, defining key indicators of organizational performance and
customer satisfaction. Guest, Michie and Conway (2003) defined performance as
outcomes, end results and achievements (negatives and positives) arising out of
organizational activities. They argued that it is essential to measure strategic practices in
terms of outcomes. Those outcomes vary along a continuum of categories such as:
financial measures (ROA, ROE, turnover, PBT); measures of output of goods and
services such as number of units produced, number of clients attended to, number of
errors in the process, customer satisfaction indexes or measure of employee satisfaction (
Locke & Latham, 1990,Guest , 2003).
According to Kaplan and Norton (1992) consideration to traditional financial measure
alone is inadequate; attention should be given to people, processes and customers. This is
important because performance indicators (KPI) vary across firms.
Evaluation of performance is a complex process that involves assessing interaction
between environment, internal operations and external activities. Internal performance
involves analyzing accounting data. Generally financial ratios are used to evaluate a
firm’s performance. The four basic categories of ratios include: liquidity ratios, debt
ratios, activity ratios and profitability & investment ratios. Pandey (2009) notes that
financial statements are important tools for diagnosis of a company’s performance.
Operating performance of a firm shapes its financial situation. Financial ratios are based
on financial statements.

5
1.1.3 Small and Medium Enterprises (SMEs)
What constitutes “small” in terms of government support and tax policy varies by country
and by industry. Karlibbala (1994) and Ngobo (1995) state that in Kenya businesses with
10 or fewer workers are called micro-enterprises. Those with 11-50 people are small
enterprises and 51-100 are medium. However, the number of people may not be a good
indicator especially if the industry is labor intensive. This is true for countries like India
where there is labor intensive approach to industrialization policy. In some cases it is
possible for a trading organization to transact huge sums of business worth transactions
and yet employ few people.
Millichamp (1984) observed that in most small and medium scale enterprises accounting
and financial management are carried out by just one person, making segregation of
duties impracticable and irrelevant. Controls have to depend on owners in management
and it is fair to expect that small and medium enterprises incur costs to justified limits
since accounting is not an end in itself. This calls for adoption of accounting systems to
the needs of those businesses (Abeygunasekera and Fonseka, 2013).
In many developing countries, the role of these industries is crucial as they provide
employment to a large number of people (Gamage, 2001). In countries like India and
China, a large number of goods such as clothes, toys, furniture, edible oil and leather
goods are produced by small scale traders. The SMEs sector in Kenya contributes an
estimated 18% of Gross Domestic product (GDP) thereby contributing to economic
growth. SMEs in Kenya employ up to 80% of Kenya’s workforce. Considering such
significant contribution towards employment creation and growth of country’s economy,
one of the goals outlined in Kenya’s vision 2030 is how this sector can attain its potential
of contributing up to 40% or more to the country’s economic growth www.africog.org.
National bodies have been formed to provide assistance to players in the private and
public sectors. One such body is the Kenya Agricultural Commodity Exchange (KACE)
that links small scale farmers with the markets, enhances their capabilities, provide
business training and technical assistance. KACE reaches one million farmers a day and
allows an estimated 250,000 small scale traders in agricultural commodities to access
their services on daily basis (Karugu, 2010).

6
In Kenya, Nairobi County has the largest number of registered SMES in the country
spanning across various sectors of the economy. The county offers a wide range of
licenses for businesses depending on the floor space per square foot and the number of
employees. There were recent attempts by the government of Kenya to spur growth
through creation of employment for the youth which constitutes about 65% of the
population. This has been done through creation of the Youth, Uwezo and the Women
Funds as well as allocation of 30% of government tenders to the youth. This has seen the
number of registered SMES in various sectors increase tremendously in the county as the
youth increasingly set up enterprises to take advantage of these opportunities (Karugu,
2010).
Increase in accounting systems and accounting records lead to a considerable benefit that
will accrue to an entity as a whole in the long run as it will lead to increased processing
power, timely generation of reports and general reduction of associated operating costs.
The need to reduce direct human interface in record management as well as reporting
enhances credibility of reports generated to aid decision making and hence reliability by
the end users due to minimization of biases. According to Damanpour and
Gopalakvishnan (2001), companies achieve a high performance when they can afford the
implementation of certain technological developments however there are other firms that
have shown that performance drops immediately after the implementation by taking
several years to realize the full benefits of IT adoption. Wah (2000) also indicates that
many firms have invested in accounting systems and accounting records but do not
succeed in attaining the established performance goals. Most research works have been
concentrated on large firms however, the analysis on the impact on the smaller firms
would be particularly important because it creates a competitive hedge for the firm and
even enhances market positioning in achieving better results.
1.1.4 Accounting Records, Accounting Systems and Financial Performance
Accounting systems provide a source of information to owners and managers of SMEs
operating in any industry for use in the measurement of financial performance. Reported
profits reflect changes in wealth of owners and this explains why major economic

7
decisions in business are cantered on financial performance as measured by profitability
(Maseko and Manyani, 2011).
Record keeping plays a key role in management of knowledge necessary for good
business performance. Modern organizations are concerned with the capture, use and
storage of knowledge. Record keeping provides evidence of how the transaction was
handled and substantiates the steps that were taken in order to comply with business
standards. Record keeping is the foundation on which compliance program should be
built upon. Measures should be put in place to capture the documentation and events that
takes place throughout transaction commencing from delivery and payment (Reed, 2010).
Record keeping conveys substantial information about the financial strength and current
performance of an enterprise. Mangers find organizational statements useful in making
decisions. As managers develop operating plans, they think how those plans will affect
the performance of the organization (Onaolapo, 2014).
According to Ikechukwu (1993) keeping records is crucial for the successful performance
of a business. Records helps entrepreneur to develop accurate and timely financial reports
that show the progress and current condition of the business. Accurate record of the
business financial performance is a vehicle to monitor performance in specific areas.
Regarding accounting control procedures for small and medium enterprises
Sathyamoorthi (2001) observed that it is important to have systems of control over all
business activities that are well implemented to help ensure: protection of resources
against waste and fraud, accuracy and reliability in accounting data and success in the
evaluation of the performance of the business. Relying on professional accountant, small
firms can get the competencies that they need (Curley, 2005).
In the context of SMEs, accounting information is important as it helps firms manage
their short term problems in critical areas like costing, expenditure and cash flow by
providing information to support monitoring and control (Mitchell, 2000). Thus financial
reporting systems are necessary to ensure that SMEs economic resources are used
effectively and efficiently in pursuit of its goals. It also follows that there is a particular
need in growing SMEs for the skills of financial analysis which will allow financial

8
statements to be read and understood, whether they contain historical or forecast
information (Mcmahon, 1995).
1.2 Research Problem
A lot of emphases have been made on the protection of informal and small business
sector in creating employment and generating income for majority of Kenyan people.
Questions on SME’s management of finances and book keeping practices continue to be
asked. Earlier studies on SMEs reveal their predicaments and suggest solutions to the
problems they face. Businei (2012) studied the factors influencing the use of accounting
services by small and medium enterprises in Kenya. He found low levels of compliance
with accounting legislation and low growth of SMEs.
Osongo (2010) investigated the use of accounting services by SMEs in Kisii. The results
showed that bookkeeping practice in this region as not adequate and seriously affected
financial performance.
Back (1978, 1981 & 1985) investigated the role of a practicing accountant in Queensland
as an advisor of small firms. He concluded that small firms that seek the services of a
qualified accountant have significantly less incidences of illiquidity, failure, business
stagnation and lack of credit compared to those that don’t.
Katwei (2009) conducted a study on the constraints faced by small scale enterprises in
accessing formal financing and concluded that poor record keeping was a significant
contributor of the challenges of SME financial access. Information available on
comprehensiveness of financial practices adapted by SMEs is limited. The government
has adopted strategies and made policy changes in an effort to streamline and promote
small scale traders. The traders on the other hand, need to keep their records of accounts
straight in order to determine their trend in performance with regard to industry, time,
level of investment and applied strategies in business operations. Consequently the study
sought to answer the question as to whether there is a relationship between the keeping of
accounting records by small scale and medium size enterprises and their financial
performance.

9
1.3 Objectives of the Study
To establish whether a relationship exists between accounting records maintained by
SMEs and their financial performance.
1.4 Value of the Study
The finding of this research can assist in identifying the grey areas if any in the way
SMEs keep their business records in order to offer relevant advice. It also can create an
opportunity for SMEs to appreciate the role played by accountants in a business entity.
The tax authority through this study can determine the extent of reliance of financial
statements prepared from SMEs available records. Lenders can gain a general overview
of the reliability of information made available from SMEs financial records. Finally this
research established if SMEs financial performance is in any way linked to record
keeping.

10
CHAPTER TWO: LITERATURE REVIEW
2.1 Introduction
This chapter presents literature on relevant theories of accounting and performance as
well as their application to SMEs. It discusses performance determinants and also
presents empirical reviews related to area under study.
2.2 Theoretical Framework
The basic motive behind any investment is to earn profit. It is among the goals of any
enterprise to maximize shareholders wealth by employing relevant resources
appropriately as shall be explained by theory of resources based view. Effectiveness of
company managers and resources efficiency directly affects the development of the state
in which a business operates. Positive financial performance results from decisions made
in the course of business as articulated by decision usefulness theory (Decision
Usefulness Approach 2009).According to accounting theory transactions data requires
precise measurement and consistency in classification. Accounting systems are also
needed to ensure that all transactions of an entity are entered (Schrader, 1962).
Watts and Zimmerman (1978) helped generate positive accounting literature which offers
an explanation of accounting practice. The extent to which accounting choice affects the
contracting parties’ wealth depends on the relative magnitudes of the contracting costs.
Positive Accounting Theory (PAT) has been referred an as important aspect in
accounting practice.
2.2.1 Decision Usefulness Theory
Decision usefulness is an approach to the preparation of financial accounting information
that emphasizes on theory of investor decision making in order to infer the nature and
types of information that investors need (Decision Usefulness Approach 2009).It is an
approach usually adopted to satisfy the information needs of primary users of the
financial reports. Decision usefulness accounting theory emphasizes the recording of
business transaction for the purpose of effective decision making in business. Decision

11
usefulness recognizes that usefulness is defined contingent upon the user. The nature of
information and designated relevance is the primary standard to be used in selecting
among accounting alternatives because it reduces “uncertainty about the actual state of
affairs of concern to the user”. Revenue authorities’ in-charge of tax collection in a
country and financiers of SMEs demand to inspect the records of accounts and financial
statements in order to make informed decision. Accounting professionals retain the
responsibility of determining which information provides the most utility to accounting
users because users often are not competent to determine what information is most useful
to them or at least not articulate in stating their needs.
According to Wild (2008) accounting is viewed as the measurement activity that provides
financial reports in support of decision makers and their business decisions. Financial
reporting is the communication of financial information useful for making investment,
credit and other business decisions (Chiappetta, Show and Wild, 2009).Williams (2009)
states that accounting research for the past four decades has focused heavily on the
concept of decision usefulness which has become the agreed guide for judging the
effectiveness of accounting and financial reporting.
2.2.2 Positive Accounting Theory (PAT)
PAT is an expression of neoclassical economic theory. Fundamental to it is a belief in
rational choice theory. In PAT, self-interest is the reason for the choice of accounting
methods and techniques and policy decisions. In PAT the firm (organization, company,
etc) is described in terms of collection of contracts – a nexus of contracts between
managers, suppliers of capital and employees who must cooperate to maximize the
wealth of the business owner. Wall and Zimmerman (1978) claimed that PAT sought to
“explain the world in which we live’’. As such it attempts to provide answers as to why
certain accounting methods are chosen over others and why regulation of accounting was
left in the hands of accounting professionals rather than direct government involvement.
Watts (1995) claimed that PAT research was designed to explain (provide reasons for
why accounting takes the form it does) and predict (how accounting changes across time
and place).SMEs can therefore be able to keep books of accounts in a manner that is
justified and based on the nature of their business.

12
2.2.3 Resource Based View
Pearce and Robinson (2011) defined the Resource Based View (RBV) as a method of
analyzing and identifying a firm’s strategic advantage based on examining its distinct
combination of assets, skills, capacities, and intangibles as an organization. This theory is
concerned with internal firm specific factors and their effect on performance. It views the
firm as a bundle of resources which are combined to create organizational capabilities
which it can use to earn above average profitability (Grant 1991). Each firm develops
competencies from these resources and when they are well developed, these become the
source of the firm’s competitive advantage. SMEs accounting systems, staffs’ degree of
qualification and organization of physical resources may have a bearing on their
performance. Penrose (1959) explains the importance of unique bundles of resources that
are controlled by a firm and crucial for its performance. Such resources include all
tangible and intangible assets, capabilities, organizational processes, firm’s attributes,
information and knowledge controlled by a firm in order to improve efficiency and
effectiveness that will lead to higher financial performance (Daft 1985). This theory helps
in explaining performance variations.
2.3 Determinants of Financial Performance
Performance can be defined as an approach determining the extent to which set
objectives of an organization are achieved in a particular period of time. The objectives
or goals can be in financial or non-financial terms. Performance may be determined by
macro and micro-factors. According to Oliver (2000) macro-economic factors are those
pertinent to a broad economy at the regional or national level and affect a large
population rather than a few select individuals. Macro factors include GDP growth,
inflation, unemployment, interest rates, exchange rate and level of competition. Micro
factors include individual risk exposure, operating strategies and degree of management
strategies.
According to cooper (1992) factors which influence business performance are
experience, education, occupation of parents, gender, race, age and entrepreneurial goals.
Lerner and Hisrich (1997) conducted a study on Israel women entrepreneurs and found

13
that their performance was influenced by factors that he grouped in 5 perspectives:
motivation and goals, social learning theory (entrepreneurial socialization), network
affiliation (contacts and membership in organization); human capital (level of education
and skills) and environmental influences (location, sectored participation and social
political variables).
Thibault, Wicock and Kanetkar (2002) attributes business performance to demographic
variables and business factors such as amounts of financing, use of technology, age of
business operating location, business structure and number of full time employees as
important factors in examining performance of a small scale business.
A company financial performance is directly influenced by its market position.
Profitability can be split into its main components; net turnover and net profit margin.
Ross, Westerfield and Jatte (1996) argue that both components influence profitability.
High turnover means better use of assets owned by the company and therefore better
efficiency while a higher profit margin means that the entity has a substantial market
power.
Risk and growth influences a firm’s financial performance. Since market value is
conditioned by company’s results, the level of risk exposure can cause changes in its
market value. High risk business should have high returns. Economic growth helps a firm
to achieve a better position on the financial markets, because market value also takes into
consideration expected future profits.
According to reputation perspective, an organizations communication with external
parties about its levels of corporate social responsibility may help build a positive image
with customers, investors, bankers and suppliers for better business performance
(Fombrun and Shanley, 1990).
Technical and strategic human resource management is an important determinant of a
firm’s performance. It involves designing and implementing a set of internally consistent
policies and practices that ensures a firm’s human capital (employees’ collective
knowledge, skills and abilities) contributes to its business objectives (Mark and Susan,
1997).

14
According to Costea (2011) another factor that influences financial performance is the
size of the firm. Large firms have easier access to resources but SMEs have to struggle to
win the trust of financial institutions.
2.4 Empirical Review
2.4.1 International Studies
Karunananda and Jayamaha (2011) researched on the financial practices among small &
medium enterprises (SMEs) in Sri – Lanka and their impact upon business performance.
A total of 100 firms were used to determine the extent of their compliance to five
identified reporting practice. Data was collected through structured questionnaires. In
their research an attempt was made to ascertain the comprehensiveness of financial
practices of SMEs. In their review they considered the SMEs financial systems, financial
audits, historical and future oriented financial reporting practices and analysis of
historical financial statements .Through using correlation coefficients, they were able to
establish that there exists a significant connection between the comprehensiveness of
financial practices adopted by SMEs and their performance. SMEs with appropriate
financial systems were found to be performing better than those with inferior systems.
Their findings revealed poor record keeping by SMEs, inefficient use of accounting
information to support their financial decisions, low quality and unreliable financial data.
They recommended that SMEs should engage proper financial practices for better
performance. Sri Lanka recognizes the need to accelerate the growth of SMEs for
sustainable development.
Amoako (2013) investigated the record keeping strategies utilized by SMES in Kumasi
(Ghana). Data was based on responses to a structured questionnaire from 210 SMES in
Kumasi that were conveniently selected. This was done on wide range of retail businesses
including pharmaceuticals, hard wares, hotels, general merchants, printing and stationary
enterprises, workshops (motor and furniture) amongst others. The questionnaire had three
parts that covered business demographic profile, categorization of business that keep and
those that do not keep proper records and finally categorization of responses based on
reasons why a business maintains or do not maintain accounting records. Data was

15
analyzed through descriptive statistics. This study revealed that SMEs in Ghana do not
keep proper records due to lack of necessary accounting knowledge and high cost of
hiring accounting professionals. Application of financial information to support
assessment of financial performance by SMEs in Ghana was found to be inefficient. He
recommended accounting training programmes for SMEs in order to formalize their
operations and to tell the state of affairs of their business. He also recommended that
authorities design specific guidelines for SMEs accounting and provision of templates for
accounting practices by SMEs. This should be done in effort to simplify technicalities
involved in maintaining accounting records.
Kurniawati (2013) carried a study on the impact of accounting information for business
decision making and performance assessment of SMEs in Indonesia. A sample of seventy
five SMEs was conveniently selected from Central Java, Indonesia. Data was gathered
through interviews and questionnaires then analyzed through quantitative technique .The
results showed that SMEs only kept records of cash inflows and outflows. However
scanty records were kept to assist in decision making .She recommended that SMEs be
motivated to keep accounting records.
Onaolapo (2014) investigated the effect of keeping accounting records on the
performance of small scale enterprises in Oyo state in Nigeria. A combination of
descriptive and cross sectional research design was used. He used a stratified method of
sampling and had 113 respondents in his sample who were then grouped on the basis of
type of their business. Data was collected through personal interview and questionnaires
and then analyzed through descriptive statistics. The independent variables incorporated
in his model showed that 86% of an enterprise’s performance depended on accounting
records. His findings revealed that majority of respondents did not keep comprehensive
accounting records. However these enterprises measured their profitability vaguely but
lacked budgets and failed to prepare annual financial statements. He recommended that
owners and managers of small scale enterprises should embrace proper accounting
practices in record keeping for effective financial performance.

16
2.4.2 Local Studies
Okwena (2011) assessed the effects of proper book keeping practices on financial
performance of SMEs in Kisii Municipality. His study employed a cross-sectional survey
research design. The target population consisted of 3528 owners/managers of SMEs.
Stratified and simple random sampling techniques were used in the study to select a
sample of 97 SMEs. Structured questionnaire were used to collect quantitative data from
the primary sources. Descriptive statistics such as frequency distribution and percentages
were used to facilitate the change of raw data into a form that is easy to understand and
interpret. Pearson correlation coefficient and simple linear regression model were used to
analyze quantitative data.
He found that about 63.9% of SMEs in Kisii practice single entry book keeping. Pearson
correlation analysis showed that financial performance has a very strong positive
relationship to effective book keeping at a coefficient of 0.944. He however found little
knowledge of book keeping among SMEs and this highly contributed to SMEs failure.
He recommended for sensitization programmes to equip SMEs owners with book
keeping knowledge
Muchira (2012) investigated the relationship between record keeping and growth of
micro and small enterprises in Thika Municipality. The study used an exploratory
approach and the target population included owners and managers of micro and small
enterprises in Thika Municipality. The sample was purposively selected and data was
collected through questionnaires. Quantitative and qualitative techniques were used to
obtain required data from a sample of eighty four selected micro and small enterprises.
This study revealed that most micro and small enterprises do not keep complete
accounting records and as a result, there is insufficient accounting information to support
firms’ performance. She recommended training programs for entrepreneurs and
suggested that record keeping be made mandatory to improve the survival chances of
micro and small enterprises.
Waweru (2012) investigated the challenges of financial management that affect
performance of SMEs. A descriptive research design on a target population of six

17
hundred SMEs in Nairobi Central Business District was used. A sample was selected by
simple random method from a stratified population. Questionnaires were used to collect
required data. Data was then analyzed using descriptive statistics to establish the
correlation between the variables. According to this study, SMEs in Nairobi Central
Business District keep accounting records and prepare simple financial statements. She
however recommended training for SMEs and integration of information technology in
keeping of accounting records.
Muiru (2013), researched on the influence of innovativeness on the growth of SMEs in
Kenya. He adopted descriptive survey in his research. The study targeted 4560 SMEs in
Nairobi County who were registered by the ministry by the year 2013. A sample of 456
respondents was randomly selected. Data was collected from the primary source by
questionnaire and by interview. Analyses were done with the help of SSPS software
program. A regression model was also developed and the results indicated that
innovativeness influence the growth of SMEs in Kenya. The tendency by owner/manager
to engage in and support new ideas, novelty, experimentation and creative processes
results in new products, services or technological processes which has a great influence
on the performance of SMEs. He recommended that managers should be time efficient
and should use appropriate systems of control in management and provide a working
schedule, set competitive prices and meet clients’ costs.
Lesirma (2014) investigated the relationship between accounting functions and financial
performance of SACCOs in Nairobi County. Nairobi County has twenty six deposit
taking SACCOs out of the total ninety six that are registered with Sacco Societies
Regulatory Authority (SASRA) in the country. The target population was the twenty six
deposit taking SACCOs in Nairobi. The study was based on both primary and secondary
data. Questionnaires were used as data collection instrument and analyses were done
using both qualitative and quantitative techniques. A regression model was used to
establish the relationship between accounting functions and performance .The study
found a positive relationship between return on assets and budgeting, balance sheet
review, working capital management and credit management functions of accounting.
The study however found that a negative relationship exists between return on assets and

18
all the accounting functions under study. He recommended that managers of deposit
taking SACCOs in Nairobi need to review their emphasis on expenditures in
strengthening accounting functions since they do not influence financial performance of
SACCO’s significantly.
2.5 Summary of Literature Review
Financial statements are most meaningful if they reflect the true position of a business.
These statements are a reference to the owners of the business and other third parties
provided they are not manipulated towards impressing a targeted person or group. Above
reviews indicates that most SMEs keep records of accounts but incomprehensively. The
question that lingers is how reliable are such statements to users who may base their
decisions on them. Adopting an appropriate accounting system and in-depth scrutiny by
users of financial statements may compel SMEs owners to be more thorough in keeping
of accounting records. This study shall look into accounting systems adopted by SMEs in
recording keeping and their influence on performance.

19
CHAPTER THREE: RESEARCH METHODOLOGY
3.1 Introduction
This chapter outlines the research methodology that was used to carry out the study. It
includes the research design, study population targeted, sampling technique used, data
collection procedures, analyses and presentation methods.
3.2 Research Design
Research design is a conceptual framework within which research is conducted. A
descriptive research design was used in this study. The object of descriptive research was
to portray an accurate profile of persons, events or situations’ (Sauders, Lewis and
ThornHill, 2007). Descriptive research design gave a description of phenomenon’s
characteristics and association of variables, in this case, the relationship between
accounting systems, record keeping and financial performance. Descriptive research was
appropriate since it enabled high level of analysis such as correlation and regression
analysis between the variables and reduces data to a manageable form. Accounting
records kept were the independent variables and were measured by presence and use of
cashbooks, purchases and sales ledgers, revenue and expenditure accounts and statements
of income within the SMEs. The dependent variable was financial performance and was
represented by Return on Equity (ROE).
3.3 Population
According to Sekaran and Boungie (2010), population refers to the entire group of
people, events or things of interest on which the researcher wishes to investigate. The
population can have the observable characteristics from which the researcher intends to
draw generalizations. There were an estimated 50,000 registered SMEs in Nairobi
County of which an estimated 19,000 were in the Central Business District (Nairobi City
Council, 2014). This made a target population of 19,000 SMEs in Nairobi Central
Business District.
20
3.4 Sample Design
A research sample is a group of cases, participants, events, or records consisting of a
portion of the target population, carefully selected to represent the population, while
sampling is the process of selecting individuals for a study (Cooper and schindler, 2003).
According to Israel (1992), a sample size can be determined by a scientific formula when
the population is large or more than 10000. The sample size is then determined
scientifically by the formula:
n=N/ (1+Ne2)
Where
n= desired sample size for the study area
N= total no. of house-holds in the study area
e= desired margin error
Source: (Israel, 1992)
A margin error of 0.05 is selected since it is logistically difficult to deal with a larger
sample size (Mugenda et al., 2003)
Thus n=19,000 / (1+19,000*0.052)
n=391
A sample of 391 SMEs was drawn from the population of the study.
The study used major streets in Nairobi Central Business District (CBD) to group the
town into blocks for the purposes of the study. The study therefore sampled 10 blocks in
Nairobi Central Business District (CBD) namely Kimathi street, Moi avenue, Biashara
street, Konange street, Kenyatta avenue, Harambee avenue, Mama Ngina street, Haile
Selassie avenue, Muindi Mbingu street and Tom Mboya street.

21
Systematic sampling technique was used to sample SMEs from each block. Systematic
sampling is a method of polling that separates the population into groups with
commonalities and then polls members of each group. As a result of separating the
groups it is then possible to obtain a more accurate poll and to identify specific target
groups (Babbie, 2001). The researcher sampled every Tenth SME that was found in each
block until the sample size of 39 SMEs was reached in each block. The researcher used
the same sampling techniques in the 10 blocks which made a total sample size of 391
SMEs in Nairobi Central Business District (CBD).
3.5 Data Collection
Primary data was collected from owners/ managers of the SMEs. Data required was
quantitative and qualitative in nature. A structured questionnaire was used for data
collection and a short interview in order to get direct and true picture of the SMEs
selected and to help overcome any bias.
3.6 Validity and Reliability
The accuracy of data largely depends on the data collection instruments (Mugenda and
Mugenda 2003). Validity is the degree to which results obtained from analysis of data
actually represents the phenomenon under study (Robinson, 2002). Reliability is the
measure of the degree to which research instruments yields consistent results after every
repeated trial. Validity and reliability were ensured by pre-testing the sample to establish
the reliability of coefficients. The information from sample selected was tested for
accuracy and comparisons were made to conventional record keeping.
3.7 Data Analysis
Simple descriptive statistics was used in the analysis of data. According to Borg (1996),
the commonly used methods in reporting descriptive surveys include frequency
distributions, calculating the percentages and tabulating them appropriately.
The data collected was coded, classified and systematically analysed. Descriptive
statistics such as mean, mode, standard deviation and frequency distribution were used to

22
analyze the data. Data was coded and entered into the Statistical Package for Social
Sciences (SPSS) for analysis. Mugenda et al (2003) asserts that it is advisable to use
computer for any kind of data analysis in order to save time and increase the accuracy of
the results. Data presentation was done by the use of pie charts, bar graphs, percentages
and frequency tables.
Regression analysis was also used to determine the relationship between variables (the
dependent and independent variables). The dependent variable were maintenance and
preparation of purchases and sales ledgers, cashbook, revenue and expenditure accounts
and statements of income within SMEs while the dependent variable was financial
performance measured by return on equity. Likert scale questions were computed to
determine means for all the variables and then regression analysis was done. The
algebraic expression of the regression model which consists of the constant term
coefficient and error term took the format below;
Y = α + β1X1 + β2X2 + β3X3 + β4X4+ β5X5 + ẹ
Where
Y= Financial performance measured by Return on Equity
α = Constant term
β1-5 = Beta coefficients
X1 = Purchases and sales ledgers
X2 = Cashbook
X3 = Revenue and expenditure accounts
X4 = Statements of income
X5 = Balance sheet
e= Error term

23
CHAPTER FOUR: DATA ANALYSIS, FINDINGS AND DISCUSSION
4.1 Introduction
This chapter is organized as follows: the first section provides a detailed analysis of the
influence of accounting records on the financial performance of SMEs in Nairobi County.
Further, the relationship between the various variables and financial performance of
SMEs are discussed. Descriptive and inferential statistics have been used to discuss the
findings of the study.
4.2 Response Rate
The study sought to gather information from individuals working on selected SMEs in
Nairobi Central Business District (CBD). A total of 391 questionnaires were distributed
to selected SMEs and 313 were collected having been filled completely. This made a
response rate of 80% which was sufficient for data analysis. According to Mugenda and
Mugenda (1999) this response rate was excellent since a response rate of 50% is adequate
for analysis and reporting; a rate of 60% is good and a response rate of 70% and over is
excellent.
Table 4.1: Response Rate
Frequency Percentage
Responded 313 80%
Not Responded 78 20%
Total 391 100%

24
4.3 General Information
The study sought to find out the general characteristics of the respondents that included
their gender, level of education and age bracket.
4.3.1 Gender of the Respondents
The study sought to find out the gender of the respondents. The findings are shown in
Figure 4.1.
Figure 4.1: Gender of the Respondents
The findings indicate that 54% of the respondents were male while 46% of the
respondents were female. This indicates the number of males involved in filling the
questionnaires for the study was higher than that of females.

25
4.3.2 Level of Education
The study sought to find out the level of education of the respondents. The findings are
shown in Figure 4.2.
Figure 4.2: Level of Education
From the findings, majority of the respondents (45.7%) had middle college education,
38.7% had university level education, and 9.9% had secondary education while 5.8% had
primary education. In view of the above, the study concludes that most of the SMEs were
in a position to make informed choices in regard to the questions posed in the
questionnaire.
26
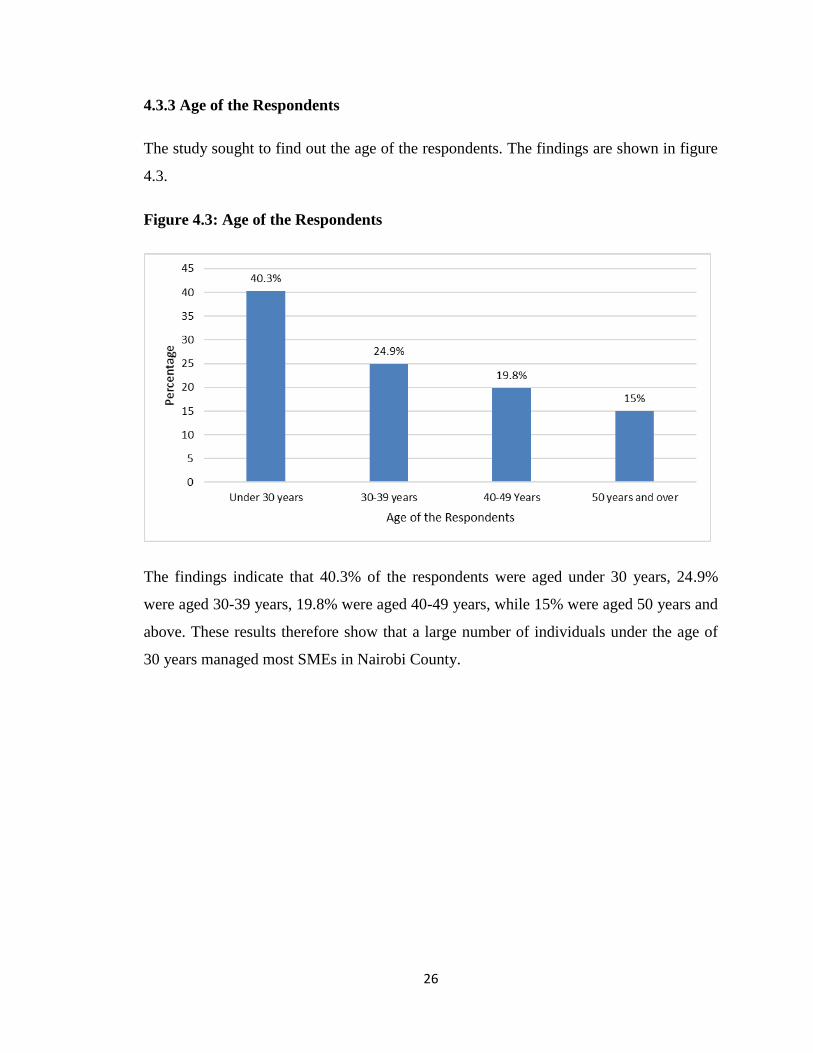
4.3.3 Age of the Respondents
The study sought to find out the age of the respondents. The findings are shown in figure
4.3.
Figure 4.3: Age of the Respondents
The findings indicate that 40.3% of the respondents were aged under 30 years, 24.9%
were aged 30-39 years, 19.8% were aged 40-49 years, while 15% were aged 50 years and
above. These results therefore show that a large number of individuals under the age of
30 years managed most SMEs in Nairobi County.

27
4.4 Information about the Enterprise
4.4.1 Form of Business Organization
The respondents were requested to provide information about the form of their business
organization. The results are shown in figure 4.4.
Figure 4.4: Form of Business Organization
As shown in figure 4.4, majority of the respondents (33.9%) indicated sole proprietor as
their form of business organization, 246% of the respondents indicated cooperative as
their form of business organization and 22% of the respondents indicated public company
as their form of business organization while 19. 5% of the respondents indicated
partnership as their form of business organization. From the study data most of the
respondents in the selected SMEs in Nairobi County were operating as sole proprietors.

28
4.4.2 Classification of the Business
The questionnaire asked the respondents to indicate classification of their business. The
responses are illustrated in figure 4.5.
Figure 4.5: Classification of the Business
From the findings, most of the respondents (65%) were medium sized enterprises while
35% of the respondents were small enterprises. The findings therefore show that medium
scale enterprises have a large percentage in Nairobi County.

29
4.4.3 Length of Business Operation
The study sought to find out how long the business had operated. The results are
presented in figure 4.6 below.
Figure 4.6: Length of Business Operation
From the findings, majority of the businesses (32.3%) had been in business for over 10
years, 25.2% had been in business for between 2 to 5 years, 24% had been in business for
6-10 years while 18.5% had been in business for less than 1 year. Based on the study
results, the SMEs had the desired experience to furnish the study with information on the
accounting records maintained by SMEs and their financial performance.

30
4.4.4 Start Capital
The study further asked the respondents to indicate how they funded their initial capital to
start business. Figure 4.7 indicates the responses.
Figure 4.7: Start Capital
From the findings, most respondents (55.6%) and (35.5%) identified credit and
savings/self as the source of starting capital respectively. A small percentage of the
respondents (8.9%) identified friends/relative as the source of starting capital for their
business. The findings therefore show that SMEs in Nairobi County started their business
with credit as their source of starting capital.
4.4.5 Record Keeping
The study asked the respondents to state if they kept records of their business
transactions. From the findings, all the respondents (100%) indicated that they keep
records of their business transactions. This finding shows that most SMEs in Nairobi
County keep the records of their businesses.
A vast majority of small scale businesses cannot afford the complexity of a detailed
accounting system, hence the existence of single entries in their books and in some cases
31
incomplete records (Wood, 1979). Most SMEs prefer record books which are simple to
use, easy to understand, reliable, accurate consistent and designed to provide information
on a timely basis.
4.5 Information on Purchases and Sales Ledgers
4.5.1 Purchases and Sales Control Ledger
The study asked the respondents to indicate if they keep purchases and sales control
ledger. All the respondents (100%) indicated that they keep purchases and sales control
ledger. The findings show that all small enterprises in Nairobi County keep purchases and
sales control records due to their effectiveness in SMEs’ management of short term
problems in critical areas like costing, expenditure and cash flow by providing
information to support monitoring and control.
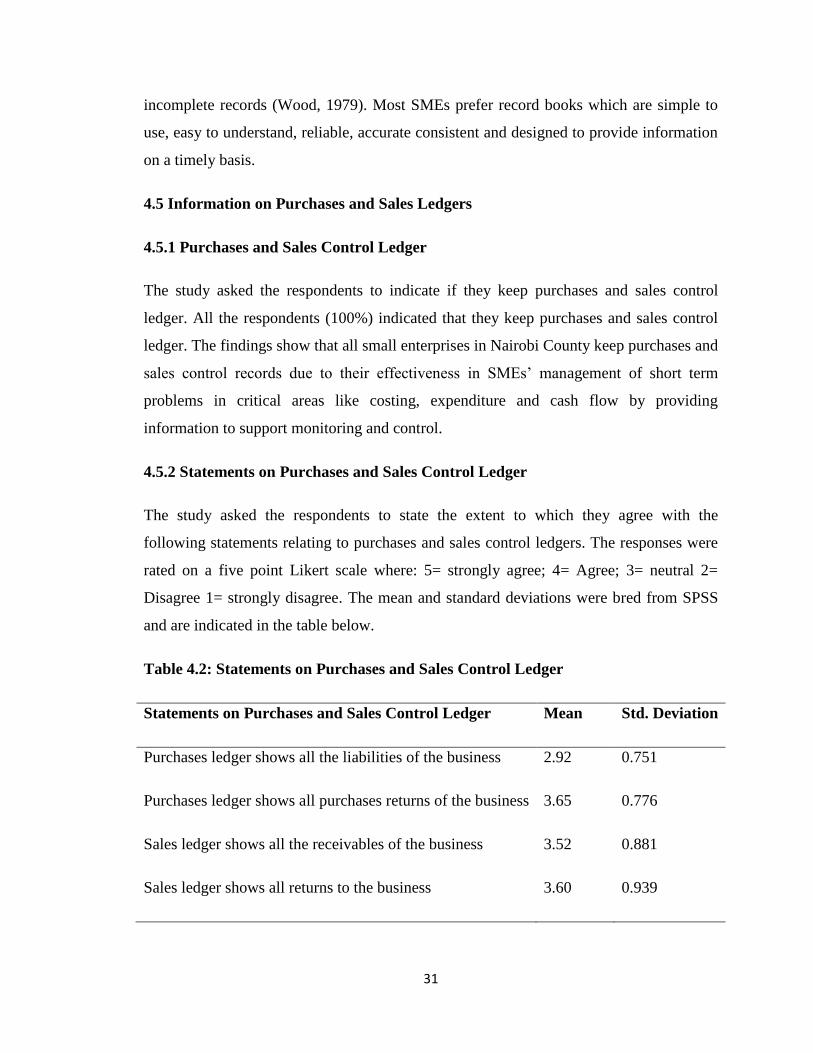
4.5.2 Statements on Purchases and Sales Control Ledger
The study asked the respondents to state the extent to which they agree with the
following statements relating to purchases and sales control ledgers. The responses were
rated on a five point Likert scale where: 5= strongly agree; 4= Agree; 3= neutral 2=
Disagree 1= strongly disagree. The mean and standard deviations were bred from SPSS
and are indicated in the table below.
Table 4.2: Statements on Purchases and Sales Control Ledger
Statements on Purchases and Sales Control Ledger Mean Std. Deviation
Purchases ledger shows all the liabilities of the business 2.92 0.751
Purchases ledger shows all purchases returns of the business 3.65 0.776
Sales ledger shows all the receivables of the business 3.52 0.881
Sales ledger shows all returns to the business 3.60 0.939

32
The findings in Table 4.2 show that majority of the respondents neutrally agreed with the
statements that purchases ledger shows all purchases returns of the business, sales ledger
shows all returns to the business and sales ledger shows all the receivables of the business
with mean scores of 3.62, 3.60 and 3.52 respectively. However, some of the respondents
disagreed with the statement that purchases ledger shows all the liabilities of the business
with a mean score of 2.92. The findings therefore insinuate that most SMEs neutrally
agree that purchases ledger shows all purchases returns of the business, sales ledger
shows all returns to the business and sales ledger shows all the receivables of the
business.
4.6 Information on Cashbook
4.6.1 Cash Book Ownership
The respondents were requested to indicate whether they had cash books. From the
findings, all the respondents (100%) indicated that they have cash books. The findings
therefore indicate that all SMEs have cash books that can help in providing evidence of
how the transaction is handled thus substantiating financial performance.
4.6.2 Statements on Cash Book
The study also asked the respondents to state their level of agreement with the following
statements about cash book in the business. The responses were rated on a five point
Likert scale where: 5= strongly agree; 4= Agree; 3= neutral 2= Disagree 1= strongly
disagree. The mean and standard deviations were bred from SPSS and are indicated in the
table below.

33
Table 4.3: Statements on Cash Book
Statements on Cash Book
Mea
n
Std.
Deviation
Only valid cash payments are made 3.84 0.832
All cash payments that occurred are recorded 2.91 0.965
Cash payments are correctly recorded in the ledger 3.54 0.816
Cash payments posted to correct payable accounts and to the
general ledger 4.27 0.445
Cash payments are recorded in the correct accounting period 4.08 0.864
Cash payments are charged to the correct accounts 3.56 1.300
From the findings, majority of the respondents were in agreement with the statements that
cash payments posted to correct payable accounts and to the general ledger and cash
payments are recorded in the correct accounting period with mean scores of 4.27 and 4.08
respectively. Some respondents neutrally agreed with the statements that only valid cash
payments are made, cash payments are charged to the correct accounts and cash
payments are correctly recorded in the ledger with mean scores of 3.84, 3.56 and 3.54
respectively. However, some of the respondents disagreed with the statement that all cash
payments that occurred are recorded with a mean score of 2.91. The findings shows that
cash payments posted to correct payable accounts and to the general ledger and cash
payments are recorded in the correct accounting period.

34
4.7 Information on Revenue and Expenditure Accounts
4.7.1 Revenue and Expenditure Accounts
The study requested the respondents to indicate whether they keep revenue and
expenditure accounts. The findings are indicated in figure 4.8.
Figure 4.8: Revenue and Expenditure Accounts
From the findings, a large percentage of the respondents (98.4%) indicated that they keep
revenue and expenditure accounts while 1.6% of the respondents indicated that they do
not keep revenue and expenditure accounts. From these findings, it is clear that most
SMEs keep revenues and expenditure accounts.

35
4.7.2 Statements on Business Revenue and Expenditure Accounts
Furthermore, the study requested the respondents to state their level of agreement with
the following statements about their business revenue and expenditure accounts. The
responses were rated on a five point Likert scale where: 5= strongly agree; 4= Agree; 3=
neutral 2= Disagree 1= strongly disagree. The mean and standard deviations were bred
from SPSS and are indicated in the table 4.4.
Table 4.4: Business Revenue and Expenditure Accounts
Business Revenue and Expenditure Accounts Mean Std. Deviation
All revenues are recorded in this account 3.06 1.305
All expenditures are recorded in this accounts 3.19 1.030
From the findings, most of the respondents neutrally agreed that all expenditures and all
revenues are recorded in this account with mean scores of 3.19 and 3.06. From these
findings, most SMEs neutrally agreed that all expenditures and all revenues are recorded
in this account.
36
4.8 Information on Statement of Income
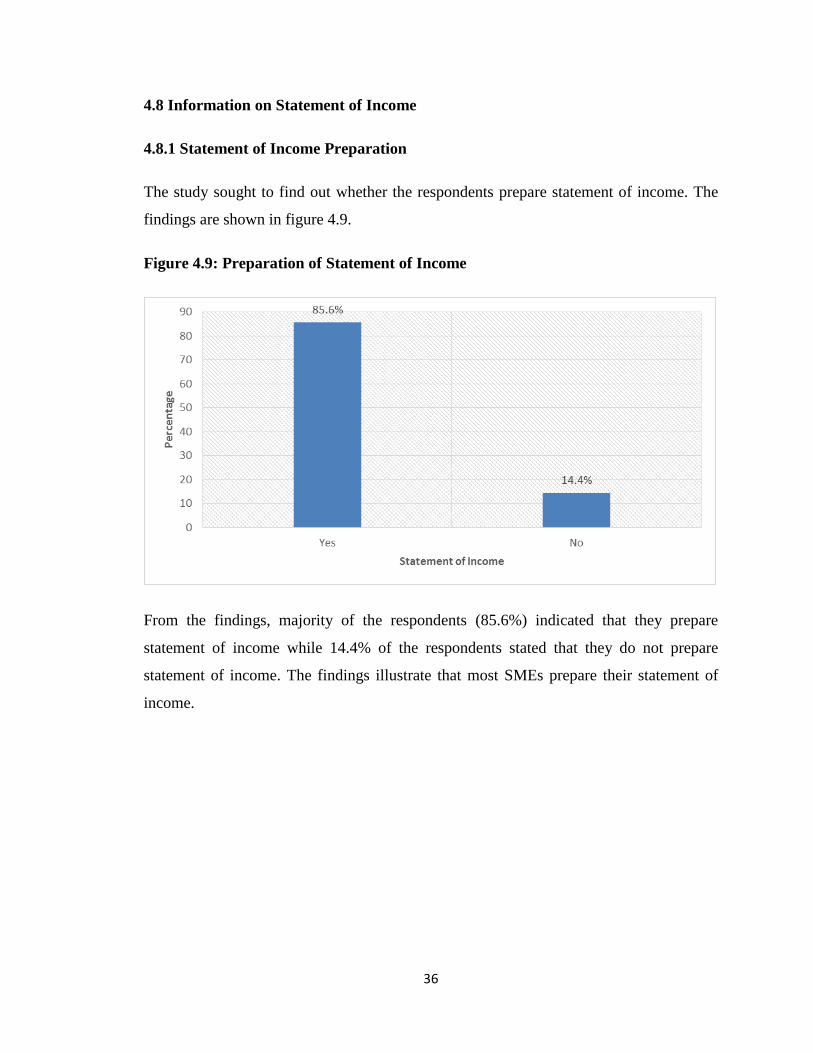
4.8.1 Statement of Income Preparation
The study sought to find out whether the respondents prepare statement of income. The
findings are shown in figure 4.9.
Figure 4.9: Preparation of Statement of Income
From the findings, majority of the respondents (85.6%) indicated that they prepare
statement of income while 14.4% of the respondents stated that they do not prepare
statement of income. The findings illustrate that most SMEs prepare their statement of
income.

37
4.8.2 Agreement on Statement of income
Furthermore, the study requested the respondents to state their level of agreement with
the following statements about their statement of income. The responses were rated on a
five point Likert scale where: 5= strongly agree; 4= Agree; 3= neutral 2= Disagree 1=
strongly disagree. The mean and standard deviations are indicated in the table 4.5.
Table 4.5: Agreement on Statement of income
Statement of income Mean
Std.
Deviation
Statement of income is prepared regularly 3.04 1.188
All revenues are presented in the statement of income 3.05 0.920
All expenditures are presented in the statement of income 4.11 0.975
Earnings per share is complete and presented on the statement of
income 3.03 0.681
Profit margin is regularly computed. 2.32 0.556
From the findings, majority of the respondents were in agreement with the statement that
all expenditures are presented in the statement of income with a mean of 4.11. Some
respondents were neutral with the statements that all revenues are presented in the
statement of income, statement of income is prepared regularly and earnings per share is
calculated and presented on the statement of income with mean scores of 3.05, 3.04 and
3.03 respectively. However, some respondents disagreed with the statement that profit
margin is regularly computed with a mean score of 2.32. The findings therefore suggest
that majority of SMEs in Nairobi County were in agreement with the statement that all
expenditures are presented in the statement of income.

38
4.9 Information on Balance Sheet
4.9.1 Balance Sheet Preparation
The study requested the respondents to indicate whether they prepare balance sheets. The
findings are indicated in figure 4.10.
Figure 4.10: Preparation of Balance Sheet
From the findings, majority of the respondents (78%) stated that they prepare balance
sheets while 22% of the respondents indicated that they do not prepare balance sheets.
The findings therefore show that a large number of SMEs prepare balance sheets.

39
4.9.2 Statements about the Balance Sheet
The study requested the respondents to state their level of agreement with the following
statements about the balance Sheet. The responses were rated on a five point Likert scale
where: 5= strongly agree; 4= Agree; 3= neutral 2= Disagree 1= strongly disagree. The
mean and standard deviations were bred from SPSS and are indicated in the table 4.6.
Table 4.6: Statements about the Balance Sheet
Balance Sheet Mean Std. Deviation
All fixed assets are presented at net in the
balance
3.55 1.109
All current assets are presented in the balance
sheet
3.16 0.771
All short term liabilities are captured in the
balance sheet
3.22 0.785
All long term liabilities are computed and
presented in the balance sheet
2.53 1.041
From the findings, most of the respondents neutrally agreed with the statements that all
fixed assets are presented at net in the balance sheet, all short term liabilities and all
current assets are presented in the balance sheet with mean scores of 3.55, 3.22 and 3.16
respectively. Some respondents disagreed with the statement that all long term liabilities
are computed and presented in the balance sheet with a mean score of 2.53. From the
above findings, most SMEs in Nairobi County neutrally agreed that all fixed assets are
presented at net in the balance sheet, all short term liabilities are captured in the balance
sheet and all current assets are presented in the balance sheet.

40
4.10 Inferential Statistics
4.10.1 Correlation Analysis
Pearson correlation coefficient was used to examine correlation between purchases and
sales ledgers, cashbook, revenue and expenditure accounts, statements of income and
balance sheet and their effect on the financial performance measured by return on equity
in Nairobi County. The analysis is shown in the table below.
Table 4.7: Correlation Analysis
Purchases And
Sales Ledgers Cashbook
Revenue
And
Expenditure
Accounts
Statements
Of Income
Balance
Sheet
Purchases and
sales ledgers 1
Cashbook 0.311 1
Revenue and
expenditure
accounts
0.341 0.100 1
Statements of
income
0.24 0.305 0.105
1
Balance Sheet .044 .201 .104 .301 1
According to findings in table 4.7, there was a strong positive relationship between
revenue and expenditure accounts and purchases and sales ledgers having a correlation
coefficient of 0.341. This implies that revenue and expenditure accounts play a major role
in purchases and ledger accounts in that for purchases and ledger accounts to be effective,

41
revenue and expenditure accounts must be well prepared to limit chances of negative
financial performance of SMEs in Nairobi county.
The results revealed that cashbook is strongly related to purchases and sales ledgers with
a correlation coefficient of 0.311. This implies that effective preparation of cashbooks
influences purchases and sales ledgers keeping.
Furthermore, there was a positive relationship between statements of income and
cashbooks with a correlation coefficient of 0.305. This result indicates that better
preparation and keeping of statements of income lead to better preparation of cashbooks
since in the context of SMEs, statements of income is important in solving problems in
critical areas like cashbooks, expenditure and cash flow by providing information to
support monitoring and control.
The results further indicated that there was a positive relationship between statement of
income and balance sheet with a correlation coefficient of 0.301. These results suggested
that better preparation of income statement result to effective preparation of balance
sheets
4.10.2 Regression Analysis
Regression model was used during the study to test the magnitude to which purchases
and sales ledgers, cashbook, revenue and expenditure accounts, statements of income and
balance sheet influence financial performance of SMEs in Nairobi County, Kenya. The
table below presents the results of the regression models.
Table 4.8: Regression Model Summary
Model R R Square Adjusted R Square Std. Error of the
Estimate
1 0.777(a) 0.604 0.369 5.234
a Predictors: (Constant), Financial performance measured by
Return on Equity

42
The results from the table above designated that a combination of purchases and sales
ledgers, cashbook, revenue and expenditure accounts, statements of income and balance
sheet had 60.4% (R square= 0.604) predictive likelihood of financial performance
measured by return on equity. R2=60.4% means that the predicator variable explains
60.4% of the variation in financial performance measured by return on equity which was
attributed to purchases and sales ledgers, cashbook, revenue and expenditure accounts,
statements of income and balance sheet. From the findings, 39.6% of the variance is
unexplained.
Table 4.9: Analysis of Variance (ANOVA)
Model Sum of
Squares
df Mean
Square
F Sig.
1 Regression 9.887 50 2.187 3.174 .000b
Residual 80.987 263 1.114
Total 90.874 313
a) Dependent Variable: Financial performance measured by Return on Equity
b) Predictors: (Constant) Purchases and Sales Ledgers, Cashbook, Revenue and
Expenditure Accounts, Statements of Income and Balance Sheet.
The P value in the study is less than 5% level of significance as indicated by sign < 000.
Therefore, the study model accounts significantly more variance in financial performance
measured by return on equity than would be expected by chance. The study has
established variables of purchases and sales ledgers, cashbook, revenue and expenditure
accounts, statements of income and balance sheet as factors that influence financial
performance in Nairobi County. Significance of the study means that the regression
model was also significant and therefore fit for the study.

43
The coefficients of the regression model are illustrated in the table below.
Table 4.10: Regression Model Coefficients
Model Unstandardized
Coefficients
Standardized
Coefficients
t Sig.
B Std.
Error
Beta
1 (Constant) .287 .014 0.187 .000a
X1 .214 .211 .255 1.117 0.002
X2 .367 .413 .188 1.987 0.004
X3 .345 .222 .077 1.134 0.001
X4 .266 .002 .232 1.647 0.000
X5 .311
a Dependent Variable: Financial performance measured by return
on equity
The regression equation is:
Y=0.287+0.214X1+0.367X2+ 0.345X3 + 0.266X4 + 0.311X5
The equation above inferred that financial performance was highly influenced by better
preparation and keeping of purchases and sales ledgers, cashbook, revenue and
expenditure accounts, statements of income and balance sheet. Given all the predictor
variables constant at zero (0), financial performance will be 0.287.
The regression coefficient for purchases and sales ledgers is 0.214. This means that the
relationship between purchases and sales ledgers and financial performance is positive.

44
This implies that an improvement in keeping and preparation of purchases and sales
ledgers can result to an improved financial performance and vice versa.
The regression coefficient for cash book is 0.367. This means that the relationship
between cash book and financial performance is positive. This denotes that reliable and
well equipped cash books influences financial performance and vice versa.
The regression coefficient for revenue and expenditure accounts is 0.345. This means that
the relationship between revenue and expenditure accounts and financial performance is
positive. This indicates that effective revenue and expenditure accounts in regard to easy
of use result to an increase in financial performance of SMEs and vice versa.
The regression coefficient for statements of income is 0.266. This means that the
relationship between statements of income and financial performance is positive. This
infers that well-arranged statements of income are likely to significantly alter
performance of SMEs, leading to an increase financial performance.
Finally, the regression coefficient for balance sheet is 0.311. This means that the
relationship between balance sheet and financial performance is positive. This indicates
that balance sheet positively influences financial performance.
4.11 Discussion of Findings
The study found that keeping of purchases and sales ledgers is strongly related to
financial performance. It found that an improvement in keeping and preparing of
purchases and sales ledgers can result to better financial performance. This coincides
with Mukherji (2002) who argues that purchases and sales ledgers lead to changes in
business environment that lead to an increasing number of information to be processed,
generated and delivered. Thus, the critical part is the quality of information produced by
the business itself which will be used in making business decisions. Purchases and sales
ledgers provide a source of information to owners and managers of SMEs operating in
any industry for use in the measurement of financial performance. For businesses with a
sizeable number of transactions, it is impossible to scan the primary books or journal
every time to know the exact position of any account. It is, therefore, very important to

45
maintain a ledger. In any sense, profit can analogously be viewed as the life-blood of a
business and hence the accounting bases, concepts and principles adopted ought to
capture and report all the relevant accounting information to ensure reliability in its
measurement (Mukherji, 2002).
The study also found that cash book is strongly related to financial performance. It found
that reliable and well equipped cash books influences financial performance. According
to Sathyamoorthi (2001), it is extremely important to have the cash book to indicate what
is happening in business as it helps in taking appropriate and timely action. Bookkeeping
helps in maintaining and providing the latest financial position of the business and,
therefore, assumes great significance. It is advisable to maintain books of accounts for the
following reasons as well provide up-to-date information about the business.
The study also found that revenue and expenditure accounts and financial performance is
strongly related. It found that revenue and expenditure accounts that were easy to use
results to an increase in financial performance of SMEs. Regarding accounting control
procedures for small and medium enterprises, Curley (2005) agrees with this statement
by indicating that it is important to have systems of control over all business activities
that are well implemented to help ensure: protection of resources against waste and fraud,
accuracy and reliability in accounting data and success in the evaluation of the
performance of the business. Relying on professional accountant, small firms can get the
competencies that they need (Curley, 2005).
Furthermore, the study found that statements of income and financial performance are
positively related. It found that well prepared statements of income are likely to
significantly alter performance of SMEs, leading to an increase in financial performance.
Statements of income is important as it helps firms manage their short term problems in
critical areas like costing, expenditure and cash flow by providing information to support
monitoring and control (Mitchell, 2000). Thus statements of income are necessary to
ensure that SMEs economic resources are used effectively and efficiently in pursuit of its
goals. It also follows that there is a particular need in growing SMEs for the skills of
financial analysis which will allow financial statements to be read and understood,
whether they contain historical or forecast information (Mcmahon, 1995).

46
CHAPTER FIVE: SUMMARY OF FINDINGS, CONCLUSIONS AND
RECOMMENDATIONS
5.1 Introduction
This chapter presents a summary of the study findings, conclusions and
recommendations.
5.2 Summary of Findings
The study found that most of the respondents in the selected SMEs in Nairobi County
were operating as sole proprietors. It found that medium scale enterprises had a large
percentage in Nairobi County. It also found that the SMEs had the desired experience to
furnish the study with information on accounting systems, the manner in which
accounting records are maintained by SMEs and their financial performance. Most SMEs
in Nairobi County started their business with credit as their source of starting capital. It
further found that most SMEs in Nairobi County keep records of their businesses as it is
the gateway to better financial performance.
It found that most SMEs in Nairobi County keep purchases and sales control records due
to their effectiveness in SMEs’ management of short term problems in critical areas like
costing, expenditure and cash flow by providing information to support monitoring and
control. It also found that most SMEs neutrally agree that purchases ledger shows all
purchases returns of the business, sales ledger shows all returns to the business and sales
ledger shows all the receivables of the business.
In regard to cash book, the study found that most SMEs have cash books that can help in
providing evidence of how the transaction is handled thus substantiating financial
performance. It found that that cash payments posted to correct payable accounts and to
the general ledger and cash payments are recorded in the correct accounting period.
The study further found that most SMEs keep their revenues and expenditure accounts as
they help in improved financial performance. Most SMEs neutrally agreed that all

47
expenditures are recorded in this accounts and all revenues are recorded in this account
thus leading to improved financial performance.
The study found that most SMEs prepare their statement of income as it helps with
crucial information for the successful performance of a business. Majority of SMEs in
Nairobi County were in agreement with the statement that all expenditures are presented
in the statement of income.
Finally, the study found that a large number of SMEs prepare balance sheets as they
convey substantial information about the financial strength and current performance of an
enterprise. Most SMEs in Nairobi County neutrally agreed that all fixed assets are
presented at net in the balance, all short term liabilities are captured in the balance sheet
and all current assets are presented in the balance sheet.
5.3 Conclusions
The study concluded that most of the respondents in the selected SMEs in Nairobi
County were operating as sole proprietors. Medium scale enterprises had a large
percentage in Nairobi County. It also concluded that the SMEs had the desired experience
to furnish the study with information on accounting systems, the manner in which
accounting records are maintained by SMEs and their financial performance. Most SMEs
in Nairobi County started their business with credit as their source of starting capital. It
further concluded that most SMEs in Nairobi County keep the records of their businesses
as it is the gateway to better financial performance. Record keeping plays a key role in
management of knowledge necessary for good business performance. Record keeping
also provides evidence of how the transaction was handled and substantiates the steps
that were taken in order to comply with business standards.
The study concluded that SMEs in Nairobi County keep purchases and sales control
records. A large number of SMEs neutrally agree that purchases ledger shows all
purchases returns of the business, sales ledger shows all returns to the business and sales
ledger shows all the receivables of the business.

48
The study further revealed that most SMEs have cash books that can help in providing
evidence of how the transaction is handled thus substantiating financial performance. It
determined that that cash payments posted to correct payable accounts and to the general
ledger and cash payments are recorded in the correct accounting period.
Furthermore, it concluded that most SMEs keep their revenues and expenditure accounts
as they help in improved financial performance. Most SMEs neutrally agreed that all
expenditures are recorded in this accounts and all revenues are recorded in this account
thus leading to improved financial performance.
The study revealed that most SMEs prepare their statement of income. Majority of SMEs
in Nairobi County were in agreement with the statement that all expenditures are
presented in the statement of income.
The study concluded that a large number of SMEs prepare balance sheets. Most SMEs in
Nairobi County neutrally agreed that all fixed assets are presented at net in the balance,
all short term liabilities are captured in the balance sheet and all current assets are
presented in the balance sheet.
5.4 Recommendations
Based on the study’s findings, the following recommendations were made on the
influence accounting records on the financial performance of SMEs in Nairobi County.
The study recommended creation of reforms that can promote effective performance of
SMEs. Managers should work together with professionals like Institute of Certified
Public Accountants of Kenya among others in encouraging good accounting practices.
5.6 Suggestions for further Research
The study recommended further research in the following areas:
1. Since this study covered the influence of accounting records on the financial
performance of SMEs, further studies are recommended on other factors
influencing financial performance among SMEs.

49
2. The study focused on SMEs only whereas financial performance is essential for
all business. Arising thereof, the study recommends further studies on financial
performance by large enterprises in Kenya
5.7 Limitations of the Study
Nairobi County is an expansive county and populous hence coverage of the all the
constituencies in the county is difficult. In addition the empirical documented data on
small enterprises is still scanty especially on accounting records and financial
performance of small and medium enterprises since only a few studies have been carried
out in the area.

50
REFERENCES
Abeygunasekera, A. W. and Fonseka, A. T. (2013).Non-Compliance with Standard
Accounting Practice by Small and Small Scale Enterprises in Sri Lanka.
Africog, (2012).Small and Medium Enterprise in Kenyan and Corruption
www.africog.org
Amoako G. K. (2013). Accounting Practices of SMES: A Case Study of Kumasi
Metropolis in Ghana. Accounting Department Kumasi polytechnic, Ghana.
Bradshaw T. M. and Miller, G. S. (2007), Will harmonize Accounting Standards Really
Harmonize Accounting? Havard Business School.
Busnei, S. K. (2012). Factors Influencing the Use of Accounting Services by Small and
Medium Enterprises in Kenya, University of Nairobi.
Caruthers, B. S. &Espeland W.N. (1991).Accounting for Rationality: Double – Entry
Book iKeeping and the Rhetoric of Economic Rationality, The University of
Chicago Press. The American Journal of Sociology Vol. 97 No. 1
Chiapetta, B. K. show and wild, J.(2009). Principles of Financial Accounting 19th
edition,
New York:McGraw-Hill Irwin.
Cooper, A. C. (1998). Find on Predictors of Performance from Large Scale Research
Program, Small Enterprise Research. The Journal of SEAANC, 6 (1) pp 3-9
Costae, V.(2011). Determinants of Corporate Financial Performance.
Covin, J.G. &Slevin, D.P.(1989). Strategic Management of Small Firms in Hostile and
Benign Environments, Strategic Management Journal, 10:75-87
Curley,D. &Flynn,A.(2005).Is Bank Finance the Achilles’ Heel Irish SMEs? Journal of
European Industrial Training 29,712-729
Daft, R, L. (1995). Organization Theory and Design,(5th
edition). Minneapolis, st.paul:
MN West Publishing Company.

51
Duranti, L.&Thibodeau, K. (2001). The inter PARES International Research Project.
Information Management Journal, Vol. 35 No. 1 pp 44 – 50
Fitzgerald, L., Johnson, R., Brignall, S., Silversro, R. and Voss, C.(2006).Performance
Measurement in Service Business, London (CIMA).
Fombrun, C; Mark &Shanley(1990). “What is in a Name” Reputation Building and
Corporate Strategy. Academy of Management Journal 33: 233 – 258
Gamage A.S (2001).Effectiveness of Entrepreneur Development Program in the Creation
and Growth of SME’s in Sri-Lanka, M.Sc. Research Paper, University of Sri-
lanka Jayewardenepura, Colombo
Grant, R. M. (1991). The Resource Based Theory of Competitive Advantage:
Implications for Strategy Formulation. California Management Review, 33, 144
– 135.
Guest, D. E, Michie, T; Conway, N, and Sheehan, M.(2003).Human Resource
Management and Corporate Performance. British Journal of Industrial Relations,
United Kingdom vol. 41 (2); 291 – 314.
Hassan, M. K. and Bashir, A.(2003), “Determinants of Islamic banking profitability”.
Paper presented at the Economic Research Forum (ERF), 10th
Annual
Conference, Marrakesh, Morocco, 16th
– 18th December
http://www./frs/org/news/press+ release/financialcrisis.htm.
http://www./smallbusinessindia.intuit in/starting business/government support for small
business.
Hussein, M. E. (1983). Accounting and Control Systems for Small Businesses,
ToucheRoss Foundation.
Ikechukwu C. (1993).Success Key Point, Book Keeping and Accounts, Onitosha, Hybrid
publisher Limited.

52
Kaitibie, S.Omore, K. Rich B. Salasya a, N. Hottton, D Mwero and P Krisjan son,(2008).
Influence Pathways and Economic Impacts of Policy Change in the Kenya Dairy
Sector. Research Report 15.International livestock Research Institute,Nairobi ,
Kenya.
Kalibbala(1995).Staff appraisal Report of Uganda Private Sector
Competitiveness.www.wds.worldbank.org/serlet/WDSp11B11995111/06
Kaplan, R. S. & Norton, D. P.(1997). The Balanced Scorecard: Measure that Drives
Performance. Harvard Business Review 70 (1): 71-79
Karugu , W. (2010).”Kenya Agricultural commodity exchange (KACE) - linking Small
Scale Farmers to National and Regional Markets” Case study No. B068 , United
Nations Development Program, New York.
Karunananda, A. &Jayamaha A.(2011), Financial Practices and Performance of Small
and Medium Sized Enterprises Sri - lanka.
Kurniawati,E.P.(2013).Accounting Information for Business Decision Making and
Performance Assessment in Small and Medium Enterprises. The Journal of Social
Science 76 Pp 67-95.
Learners, M; Brush, C. and Hisrich, R.(1997). Israel Women Entrepreneur, an
Examination of Factors Affecting Performance. Journal of Business Venturing 12
(4) pp 315 – 339
Lesirma, D. L. (2014), The Relationship between Effectiveness of the Accounting
Functions and Financial Performance of SACCOS in Nairobi County, Masters of
Business Administration University of Nairobi.
Locke, E. A. & Latham, G.P.(1990). What should we do about Motivation Theory? Six
Recommendations for the Twenty first Century, Academy of Management
Review, 29 (3) 388 – 403
Lybaert, N (1998). The Information use in an SME: Its Importance and Some Elements
of Influence, Small Business Economics, 10(2), pp 171 – 191

53
Mark, A. H. and Susan, E. J.(1997).Technical & strategic Human Resource Management.
Academy of Management Journal vol. 40 No. 1 171 – 188.
Mark, T. B. (2007). Will Harmonization of Accounting Standards really Harmonize
Accounting.
Maseko, N, &Manyani,O. (2011).Accounting Practices of SMEs in Zimbambwe, Journal
of Accounting and Taxation vol. 3 (8) pp 171 – 181.
Mbroh, J.K &Attom, B.E (2013), Accounting and Control Systems Practiced by Small
and Micro Enterprise Owners within the Cape Coast Metropolitan Area of Ghana,
Asian journal of Business and Management Sciences Vol. 1 No. 9, pp 28 – 47.
MC – Lean, R. J (1999), “Records management’’ “The Business case” Records
Management Bulletin, 90, 3 – 9
Mcmahon, R., & Holmes,.(1995).Small Business Financial Management Practices in
North America, Journal of Small Business Management,29pp 19-29
Millichamp, A. H. (1984) Auditing: An Instruction Manual For Accounting Students
Third Edition, Hampshire D.P. Publication p 235
Mintzberg, H. (1979). The Structure of Organizations, Englewood Cliffs, NJ: Prentice
Hall.
Mitchell, F. (2000). A case For Researching Management Accounting in SME’s,
Management Accounting: Magazine for Chartered Management Accounts, 76,
30-33
Muchira, B. W. (2012). Record Keeping and Growth of Micro and Small Enterprises, A
Case Study Municipally in Kenya Masters of Business Administration of
Kenyatta University.
Mugenda, O.M. &Mugenda A.G. (2003). Research Methods: Quantitative and
Qualitative Approaches. Acts Press, Nairobi
54
Muiru, J. M.(2013).The Influence of Innovativeness on the Growth of SMES in Kenya.
Masters in Business Administration, Jomo Kenyatta University of Science and
Agriculture, Kenya International Journal Of Business And Social Research
(IJBSR) Volume - 3 No. 1
Mukaila, A.A. &Adeyemi, S.L.(2011). Small and Medium Scale Enterprises as a
Survival Strategy for Employment Generation in Nigeria, Journal of Sustainable
Development Vol. 4 No. 1
Mukherji, A. (2002). The evolution of information systems: their impact on organizations
and structures. Management Decision, 40 (5), 497-507.
Nelson M., & Onias, M. (2011). Accounting practices of SMEs in Zimbabwe: An
investigative study of record keeping for performance measurement (A case
study of Bindura). Journal of Accounting and Taxation Vol. 3(8), pp. 171-181,
December 2011.Available online at http://www.academicjournals.org/JAT.
Okwena, D.K. (2011).An Assessment of Proper Book Keeping Practices on the Financial
Performance Perspectives from SMEs in Kisii Municipality, MBA Student,
Egerton University.
Olatunji (2013).The Impact of Accounting System on the Performance of Small and
Medium Scale Enterprises in Nigeria – A Survey of SME’s in Oyo state – Nigeria
Department of Management Accounting ladoke University of Technology.
International Journal of Business and Management Invention vol. 21 pp 13-17.
Olatunji, T.E (2013).The Impact of Accounting System on the Performance of Small and
Medium Enterprises in Nigeria, A Survey of SME’s in Oyo State – Nigeria,
International Journal of Business and Management Invention Vol. 2 (issue 9) pp
13 – 17.
Oliver, B. (2000).Macro Economics, 2nd
edition Practice Hall New York

55
Onaolapo, A. A.(2014).-The Analysis of the Impact of Accounting Records Keeping on
the Performance of Small Scale Enterprises, International Journal of Academic
Research in Business and Social Sciences vol.4
Onaolopo A. &Adegbite T.A. (2014).The Analysis of the Impact of Accounting Records
Keeping on the Performance of the Small Scale Enterprises, International Journal
of Academic Research in Business and Social Sciences vol, 4 No. 1
Pandey, I. M.(2009). Financial Management (9th edition) Delhi: Vikas Purchasing House
(pp 16 – 18, 325 – 329)
Parker, S. (2002), “Strategic Management Techniques for Record Managers “Record
management bulletin 109, 17 – 21
Peacock, R.W (2000). Find the Causes of Small Business Failure, Management Forum,
11 (2) pp 77-89
Pearce, T. A. & Robinson, R. B.(2011).Strategic Managements: Formulation,
Implementation and Control. (12th
edition) New York. McGraw Till/ Irwin.
Penrose, E.T. (1959). The Theory of Growth of the Firm, Oxford: Basil Blackwell.
Reed, R. (2010). Good Small Business Guide, How to start and Grow Your Own
business, 2nd
Edition, A & C Black Publishers Ltd, London.
Robinson, S. (2002), Research Methodology. National Academics Press Washing, D.C.
Romney, W. (2003).Managing Records in Private Companies in China. Record
Management Journal Volume 13, No. 3 pp 123 – 129.
Ross, S.A; Wester field K. W; Jatte, J.(1996). “Corporate Finance’’
Sathyamoorthi, C.R. (2001).Accounting and Control Systems in Selected Small and
Microenterprise in Botswana, Africa Journal of Finance and Management, vol.10,
No.1, pp96-109.

56
Sauders, M. Lewis, P. &Thornhills, A.(2007). Research Methods for Business
Students,(4th
Ed.) London Pitman.
Schindler, P. S. & Cooper, D. R.(2003). Business Research Methods ( 8th
Ed) McGraw
Hill.
Schrader, W. J. (1962). An inductive approach to Accounting Theory The accounting
Review, American Accounting Association publisher vol. 37 No. 4 pp 645 –
649.Sekaran, U. And Boungie, R.(2014). Research Methods For Business. (5th
Ed) : John & Sons Ltd.
Thibault, M; Wicock, A. and Kanetkar, V.(2002). An Explanatory Study of Factors
Influencing Sales Performance of Small and Medium Sized Enterprises,
Proceedings of the Administrative Science Association of Cananda, Winnipeg,
Manitoba.
Watts, R. & Zimmerman, J.(1978). Towards a Positive Theory of the Determination of
Accounting Standards, the Accounting Review .Vol. 53, pp 112 – 134
Watts, R.(1995). Development in Positive Accounting Theory in Jones at al pp 297 – 353
Waweru E. W. (2012), Challenges of Financial Management Affecting Performance of
Small and Medium Enterprises in Nairobi, Masters of Business Administration,
Kenya College of Accounting.
Wild J.J 2008 Financial Accounting information for decisions, Boston : Mc Grow-Hill
Irwin.
Williams, P.(2009).Rethinking Decision Usefulness. A Paper read at the 9th
Interdisciplinary Perspectives on Accounting Conference held in Innsbruck.
Austria.
Wood, F. (1979) Business Accounting I Third Ed. Essex: EIBS and Longman pg 25
Yoshika, T, & Mitchell, F.,(1995). Japanese Management Accounting, Management
Accounting Research, 67, pp 20-29

57
APPENDICES
APPENDIX I: QUESTIONNAIRE
SECTION ONE: GENERAL INFORMATION OF THE RESPONDENT
1. What is your Gender
Male [ ]
Female [ ]
2. What is your level of education?
Primary School [ ]
Secondary School [ ]
Middle College [ ]
University Level [ ]
3. In what category is your age?
Under 30 years [ ]
30-39 years [ ]
40-49 Years [ ]
50 years and over [ ]
SECTION TWO: INFORMATION ABOUT THE ENTERPRISE
4. What form of organization is your business?
Sole proprietor [ ]
Partnership [ ]
Cooperative [ ]
Public company [ ]
Other (specify) ________________
5. What is the classification of the business?
Small [ ] Medium [ ]
6. How long has the business operated?
Less than 1 year [ ]
2 – 5 years [ ]
6 – 10 years [ ]
Over 10 years [ ]

58
7. How did you fund your initial capital to start this business?
Credit [ ]
Savings/Self [ ]
Friends / Relative [ ]
Others (Specify) _________________________
8. Do you keep records of your business transactions?
Yes [ ] No [ ]
Why?
__________________________________________________________________
__________________________________________________________________
9. What type of books do you keep in your business?
__________________________________________________________________
__________________________________________________________________
SECTION THREE: PURCHASES AND SALES LEDGERS
10. Do you keep purchases and sales control ledger?
Yes [ ] No [ ]
11. Do you agree about the following statements relating to your purchases and sales
control ledgers?
Strongly
agree
Agree Neutral Disagree Strongly
disagree
Purchases ledger shows all the
liabilities of the business
Purchases ledger shows all
purchases returns of the business
Sales ledger shows all the
receivables of the business.
Sales ledger shows all returns to the
business
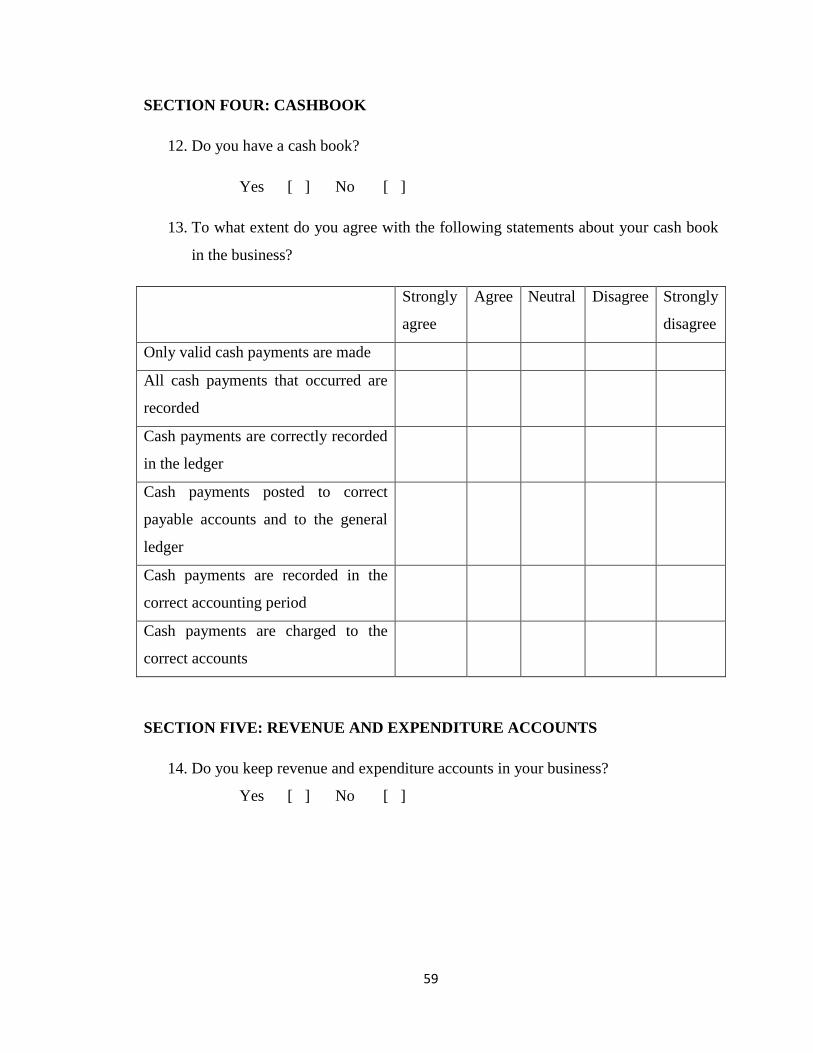
59
SECTION FOUR: CASHBOOK
12. Do you have a cash book?
Yes [ ] No [ ]
13. To what extent do you agree with the following statements about your cash book
in the business?
Strongly
agree
Agree Neutral Disagree Strongly
disagree
Only valid cash payments are made
All cash payments that occurred are
recorded
Cash payments are correctly recorded
in the ledger
Cash payments posted to correct
payable accounts and to the general
ledger
Cash payments are recorded in the
correct accounting period
Cash payments are charged to the
correct accounts
SECTION FIVE: REVENUE AND EXPENDITURE ACCOUNTS
14. Do you keep revenue and expenditure accounts in your business?
Yes [ ] No [ ]
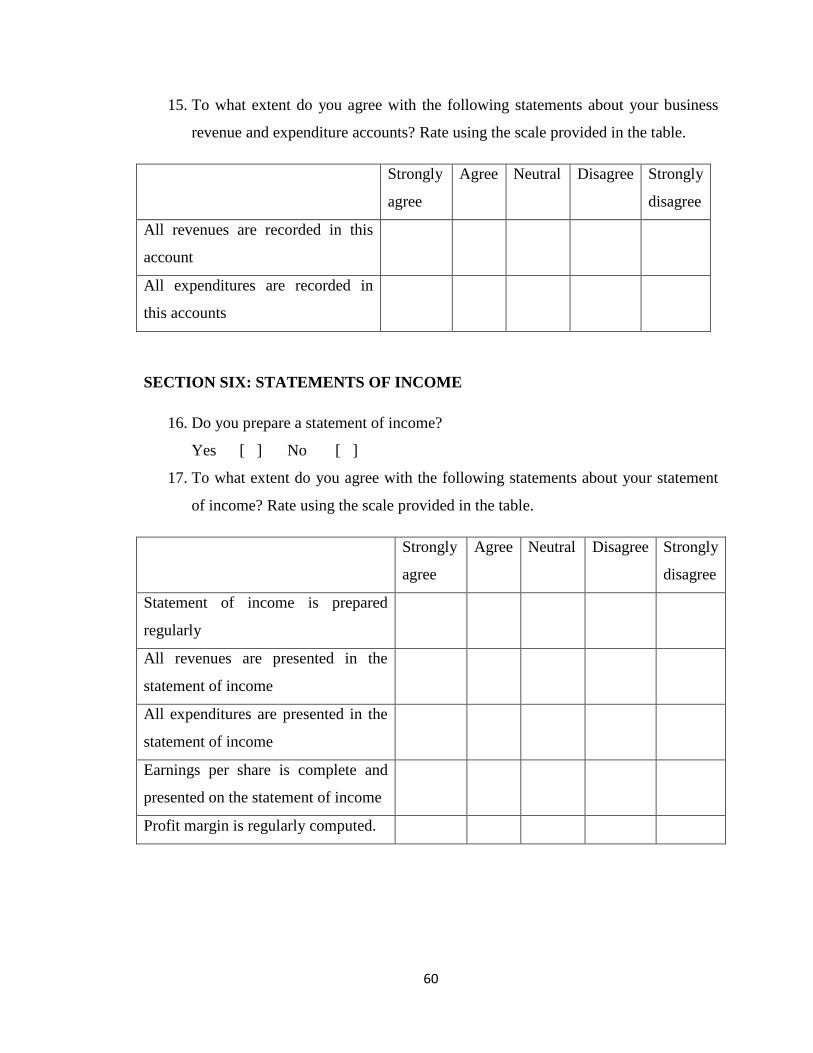
60
15. To what extent do you agree with the following statements about your business
revenue and expenditure accounts? Rate using the scale provided in the table.
Strongly
agree
Agree Neutral Disagree Strongly
disagree
All revenues are recorded in this
account
All expenditures are recorded in
this accounts
SECTION SIX: STATEMENTS OF INCOME
16. Do you prepare a statement of income?
Yes [ ] No [ ]
17. To what extent do you agree with the following statements about your statement
of income? Rate using the scale provided in the table.
Strongly
agree
Agree Neutral Disagree Strongly
disagree
Statement of income is prepared
regularly
All revenues are presented in the
statement of income
All expenditures are presented in the
statement of income
Earnings per share is complete and
presented on the statement of income
Profit margin is regularly computed.

61
SECTION SEVEN: BALANCE SHEET
18. Do you prepare a balance sheet?
Yes [ ] No [ ]
19. To what extent do you agree with the following statements about your Balance
Sheet? Rate using the scale provided in the table.
Strongly
agree
Agree Neutral Disagree Strongly
disagree
All fixed assets are presented at net
in the balance.
All current assets are presented in
the balance sheet
All short term liabilities are
captured in the balance sheet
All long term liabilities are
computed and presented in the
balance sheet