the importance of the earned income tax credit and its
TRANSCRIPT
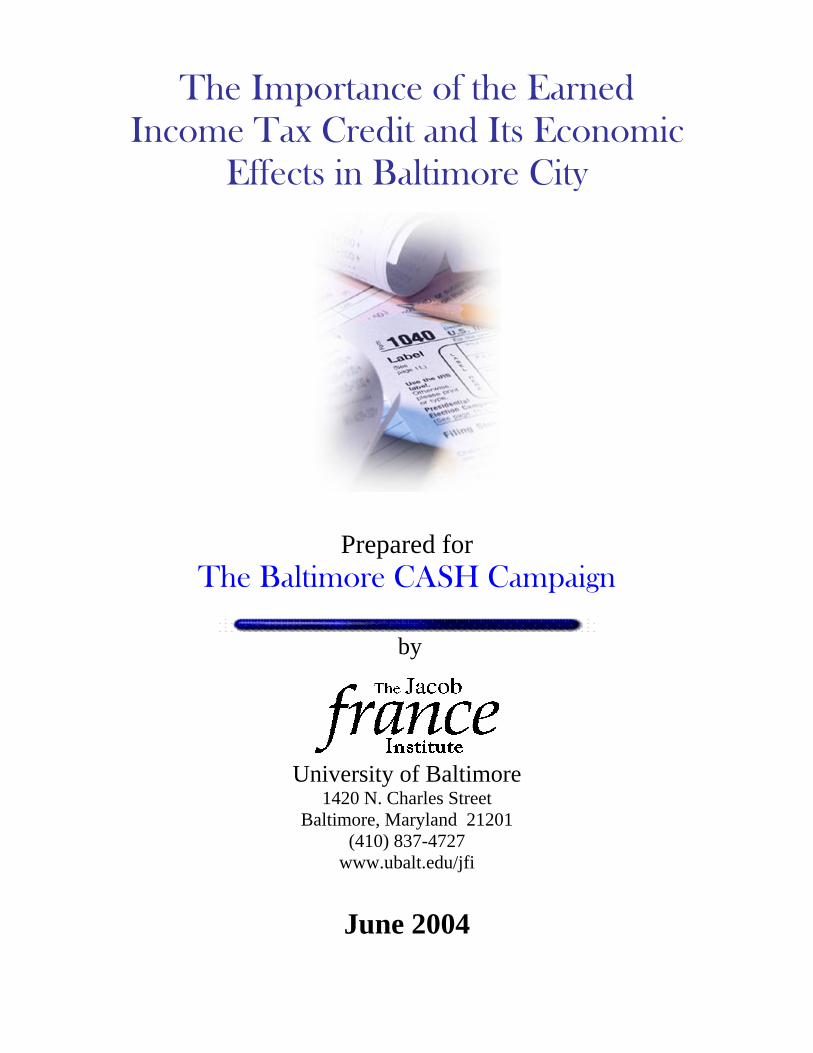
The Importance of the Earned Income Tax Credit and Its Economic
Effects in Baltimore City
Prepared for The Baltimore CASH Campaign
by
University of Baltimore
1420 N. Charles Street Baltimore, Maryland 21201
(410) 837-4727 www.ubalt.edu/jfi
June 2004
Executive Summary The Jacob France Institute of the University of Baltimore was retained by the Baltimore
Cash Campaign to analyze the impact of the payments received by City residents through the Earned Income Tax Credit on the economy of Baltimore City. The France Institute also computed the amount of the credit “left on the table”, that is the amount of the credit that remains unclaimed by eligible City residents. The impact of these unclaimed tax credit payments was also analyzed for the potential impact on the City’s economy. Efforts to “capture” these unclaimed tax dollars would lead to the creation of jobs, wages, and tax revenue for Baltimore City.
• In Baltimore City, of nearly a quarter of a million Federal tax returns filed, 30% claimed the EITC for nearly $131 million. For the Maryland EITC, 29% of City residents filing a tax return claimed the credit for a total of $24.4 million.
• In Baltimore City, an estimated additional 18,337 persons could claim the federal EITC for a total of $24,546,127 and an estimated 18,382 persons could claim the State EITC for a total of $4,579,356.
• The Federal and State unclaimed EITC payments by Baltimore City residents total over $29 million.
• The Federal and State EITC creates over $102 million in economic output, over 1,000 jobs, and over $30 million in wages in Baltimore City. If the EITC did not exist (and no other federal assistance program(s) replaced the EITC), none of these impacts within the City would occur.
• If full EITC program participation occurred, the unclaimed federal and State EITC would create an estimated additional $19 million in economic output, nearly 200 jobs, and almost $6 million in wages.
• Earned Income Tax Credit payments to City residents resulted in an estimated $599,986 in tax revenue ($225,918 in City Income tax revenue and $374,068 in City property tax revenue).
• If full program participation in the EITC at both the federal and State level occurred, the City would have received an estimated additional $112,497 in City income and property tax revenue.
Table of Contents Introduction………………………………………………………………………………… 1 1.0 History……..………………………………………………………………………. 1 2.0 The Importance of the Earned Income Tax Credit………………………………… 3
2.1 Poverty………………………………………….………………………….. 4
2.2 Welfare……………...……………………………………………………… 4
2.3 Employment…………...…………………………………………………… 5
2.4 Examples of Local EITC Promotion Efforts……………………………….. 6
3.0 The Impact of the EITC on Baltimore City………………………………………… 8
3.1 The Economic, Employment, and Earnings Impact of the EITC in Baltimore City…………………………………………………………… 11
3.2 The Fiscal Impact of the EITC in Baltimore City………………………….. 15
4.0 Summary…………………………………………………………………………… 15 Methodology……………………………………………………………………………….. 16 Data Limitations.…………………………………………………………………………… 17 Appendix…………………………………………………………………………………..A-1
List of Graphs and Tables
Graph 1 Structure of EITC in TY 2003, Single Head of Household Filers…………. 2
Graph 2 Structure of EITC in TY 2003, Married Filing Jointly…..………………… 2
Table 1 Number of Persons Claiming Federal & State EITC & Amount of EITC Payments in Maryland and Baltimore City, TY 2002……………………... 9
Table 2 Federal EITC Payments Made to Baltimore City Residents And Estimated Unclaimed EITC Payments, By Zip Code……………………… 10
Table 3 Maryland State EITC Claimed And Estimated Unclaimed Amount to Baltimore City Residents……....…….……..……………..…………….. 11
Table 4 Estimated Unclaimed EITC Returns and Payments to Baltimore City Residents…………………………………………………………………… 11
Table 5 Estimated Baltimore City Spending Attributable To Federal and State EITC Payments And Estimated Unclaimed Federal and State EITC Payments…. 12

Table 6 Economic Impact Summary: Total Economic Impacts of Federal and State EITC Payments And Estimated Unclaimed Federal and State EITC Payments…………………………………….………………………. 13
Table 7 Economic Impacts of Total Economic Impacts of Federal and State EITC Payments And Estimated Unclaimed Federal and State EITC Payments, By Type of Impact………………………………….……………………… 13
Table 8 EITC Spending and Economic Impact of Federal EITC Payments And Estimated Unclaimed Federal and State EITC Payments, By Zip Code of Recipient………………………..………………………… 14
Table 9 Selected Fiscal Impacts of the Federal and State EITC Payments And Estimated Unclaimed Federal and State EITC Payments…..……………… 15
List of Appendix Tables Table 1 Economic Output Impact of Federal EITC Payments on
Baltimore City (Dollars)…………………………………………………… A-1
Table 2 Employment Impact of Federal EITC Payments on Baltimore City (Jobs).. A-2
Table 3 Employment Compensation Impact of Federal EITC Payments on Baltimore City (Dollars)…………………………………………………… A-3
Table 4 Economic Output Impact of Unclaimed Federal EITC Payments on Baltimore City (Dollars)…………………………………………………… A-4
Table 5 Employment Impact of Unclaimed Federal EITC Payments on Baltimore City (Jobs)………………………………………..…...………… A-5
Table 6 Employment Compensation Impact of Unclaimed Federal EITC Payments on Baltimore City (Dollars)………………………………………...……… A-6
Table 7 Economic Output Impact of State EITC Payments on Baltimore City (Dollars)…………………………………………………… A-7
Table 8 Employment Impact of State EITC Payments on Baltimore City (Jobs).….. A-8
Table 9 Employment Compensation Impact of State EITC Payments on Baltimore City (Dollars)…………………………………………………… A-9
Table 10 Economic Output Impact of Unclaimed State EITC Payments on Baltimore City (Dollars)…………………………………………………… A-10
Table 11 Employment Impact of Unclaimed State EITC Payments on Baltimore City (Jobs)……………………………………….……………… A-11
Table 12 Employment Compensation Impact of Unclaimed State EITC Payments on Baltimore City (Dollars)…………………………………………………… A-12

Introduction The Jacob France Institute of the University of Baltimore was retained by the Baltimore Cash Campaign to analyze the impact of the payments received by City residents through the Earned Income Tax Credit on the economy of Baltimore City. The France Institute also computed the amount of the credit “left on the table”, that is the amount of the credit that remains unclaimed by eligible City residents. The impact of these unclaimed tax credit payments was also analyzed for the potential impact on the City’s economy. Section 1 of this report reviews the history of the EITC and Section 2 discusses the impact that the EITC has in reducing poverty, reducing welfare, and promoting work. Section 3 looks at the impact that both the claimed and unclaimed EITC payments have on the Baltimore City economy with regard to economic output, jobs, wages, and selected Baltimore City tax revenue.
1.0 History The EITC was created in 1975 by Congress to offset payroll taxes for low-income working families. With several expansions of the tax credit in the 1980’s and 1990’s, the EITC has become the largest federal aid program targeted to the working poor. Along with food stamps and TANF (Temporary Assistance for Needy Families), the EITC is one of the three largest federal income support programs. In addition to the federal EITC, 16 states and the District of Columbia have added their own state EITC programs. Denver, Colorado and Montgomery County, Maryland are the only local governments that have their own EITC programs in addition to the federal and state programs.
When it was originally designed, the EITC applied only to low-income working families with children. Since then, it has been expanded to include persons with no children that earn low incomes.1 Similar to other tax credits, the EITC reduces the amount of the income tax owed, but unlike other tax credits, the EITC is refundable. This means that if the amount of the tax credit exceeds the tax liability, the remaining credit is returned to the taxpayer. If a taxpayer has no tax liability, the entire EITC can still be claimed in the form of a tax refund. It is estimated that roughly 87% of all EITC dollars are refunded to taxpayers.2 The EITC was designed to have three stages. At the phase in stage, the amount of the credit increases as income earned increases. At the plateau stage, as income increases the credit remains the same. During the phase out stage, the amount of the credit decreases as the amount of income earned increases. The marital status, number of children claimed, and income of the taxpayer determine the overall amount of the credit. Graph 1 shows the structure of the EITC in tax year 2003 for single head of household filers and Graph 2 shows the structure of the EITC for married persons filing jointly.
1 Persons who are married and filing a tax return as a single individual cannot claim the EITC. 2 Berube, Alan. January 2003. Rewarding Work Through the Tax Code: The Power and Potential of the EITC in 27 Cities and Rural Areas. The Brookings Institution.
1

Graph 1Structure of EITC in TY 2003, Single Head of Household Filers
$0
$500
$1,000
$1,500
$2,000
$2,500
$3,000
$3,500
$4,000
$4,500
$0 $4,000 $8,000 $12,000 $17,000 $21,000 $25,000 $29,000 $33,000
No Children1 Child2 Children
Graph 2Structure of EITC in TY 2003, Married Filing Jointly
$0
$500
$1,000
$1,500
$2,000
$2,500
$3,000
$3,500
$4,000
$4,500
$0 $4,000 $8,000 $12,000 $17,000 $21,000 $25,000 $29,000 $33,000
No Children1 Child2 Children
The EITC was originally proposed by President Nixon and supported and expanded by both Democrats and Republicans. President Reagan called it “the best anti-poverty, best pro-family, best job-creation measure to come out of Congress”.3 The EITC program is a politically
3 Levinson, Mark. The War on Work. Newsweek, Volume 126, Issue 14.
2
acceptable program for several reasons. The first reason is that it is not a traditional entitlement program. The EITC is for families and individuals earning low incomes. Thus, in order to claim the credit, the person claiming the credit must be working. The second reason is that the EITC is seen as a targeted program that reduces taxes but raises pay. An argument against the minimum wage is that it is not well targeted, and provides higher wages to teenage workers, second-income earners, and workers in non-poor households, whereas the EITC raises the wages of working families. A third reason that the EITC is supported is that the refund that taxpayers receive is re-spent into the economy providing an additional spending stream. Finally, the program is so widely accepted and supported by both businesses and by social service advocates that there exist few complaints against the EITC program.
Unlike other federal assistance programs, the EITC is implemented through the Internal Revenue Service (IRS). This creates several important benefits. The first benefit is that of low administrative costs. Administrative costs for traditional cash assistance programs and food stamps can run as high as 15%, whereas the administrative cost of the EITC is roughly 1%.4 A second benefit is that the EITC program is an efficient program. According to a General Accounting Office study, the EITC has an estimated overall participation rate of 75% nationwide, with an even greater rate of participation among families with one or two children.5 A third benefit that arises from the IRS administering the EITC is that it does not raise employer costs. An employer does not have to file any documentation for an employee claiming the tax credit. State EITC programs, with the exception of Minnesota, calculate their tax credit as a percentage of the federal credit, making state EITC programs easy to administer.
Studies have shown that the effect of the EITC has been mitigated by several factors. Due to the overall complexity of the tax code and families hoping to maximize their tax deductions, the use of paid tax preparation services can reduce the tax benefit that the EITC can provide. In 1999, the percentage of families that claimed the EITC and used a professional tax preparation service was 68%.6 The amount of the credit received by persons and families claiming the EITC are also decreased through the use of “rapid refund” loans to consumers. While this places the refund in the pocket of the individual quicker, the fees associated with this option can be substantial. The fees associated with paid tax preparation and rapid refunds decreases the benefits that the EITC provides to the working poor. In 1999, it was estimated that $1.75 billion in EITC payments went toward paying for tax preparation, electronic filing, and high-cost refund loans.7
2.0 The Importance of the Earned Income Tax Credit The tax credit’s importance is best seen through its greatest impacts. The EITC is widely lauded because of its effects on poverty, welfare, and work. This section briefly reviews research compiled on the beneficial effects of the EITC.
4 Wirtz, Ronald. June 2003. Anti-Poverty Design: The Cash-Out Option. Federal Reserve Bank of Minneapolis. 5 United States General Accounting Office. 2001. Earned Income Tax Credit Participation. GAO-02-290R. 6 Internal Revenue Service. 2002. “Earned Income Tax Effectiveness and Program Management FY1998 – FY2002. 7 Berube, Alan. January 2003. Rewarding Work Through the Tax Code: The Power and Potential of the EITC in 27 Cities and Rural Areas. The Brookings Institution.
3
2.1 Poverty The EITC is an effective tool for reducing the number of persons, both adults and
children, living in poverty. A Brookings Institution study in 2003 found that in 27 urban and rural areas nationwide the EITC boosted the annual incomes of families an average of $1,700 or 13%.8 This boost in income pushes both individuals, many whom are children, and families above the poverty line. In 1998, Current Population Survey data showed that the EITC lifted 4.8 million persons, of which 2.6 million were children, above the poverty line.9 No government program lifts more children out of poverty than the EITC. With the addition of state EITC programs, the number of persons, families, and children raised above the poverty line increases markedly.
While workers earning low incomes are exempt from paying taxes, the refundable nature of the EITC allows for these persons to collect the tax credit thus boosting their income. There are two ways to receive the tax credit. The first is through receiving the EITC as an annual tax refund. The second is to receive a portion of the credit in each paycheck. Nearly all EITC recipients have the credit applied to their tax return. This lump payment allows for flexibility in how the credit is used. There exists a perception that this lump sum is used for non-necessities, but a study conducted in 2000 found that the highest priorities for EITC spending was for paying bills, followed by larger purchases.10 Other research has found that the tax credit has been used for paying tuition, purchasing a home or upgrading a residence, purchasing a vehicle, or for purchasing entertainment.
2.2 Welfare Another important role that the EITC plays is that it is an effective means of reducing the
number of individuals receiving welfare. Only those persons working are eligible for the EITC, therefore the tax credit encourages work, and provides an incentive for an individual to move from welfare to work. It has been estimated that the EITC is responsible for as much as one-third of the decrease in the welfare rolls from 1993 to 1999.11 Research conducted by Dickert, Hauser, and Scholtz estimated that the 1993 expansion of the federal EITC decreased participation in the Food Stamp and AFDC programs by over 7%. This meant that the expansion of the tax credit induced more than 500,000 families nationally to leave welfare.12 Another feature of the EITC that reduces the number of persons receiving welfare is that it is a program that is available to both individuals with and without children and families as well. Most welfare programs are available only to single mothers.
An added feature of the EITC is that it mitigates the reduction in benefits that welfare recipients experience as they earn higher incomes. By claiming the tax credit a person is not disallowed from receiving welfare assistance programs. There is a high benefit reduction in welfare assistance as earnings increase. Robert Moffitt of Johns Hopkins University has found
8 Berube, Alan. January 2003. Rewarding Work Through the Tax Code. The Brookings Institution. 9 Maryland Budget and Tax Policy Institute. February 2000. The Earned Income Credit: Does it Work? 10 Smeeding, Phillips, O’Connor. The EITC: Expectation, Knowledge, Use, and Economic and Social Mobility. National Tax Journal. Volume LIII, No. 4, Part 2. 11 Grogger, Jeffery. 2003. Welfare Transitions in the 1990’s; The Economy, Welfare Policy, and the EITC. National Bureau of Economic Research. 12 Maryland Budget and Tax Policy Institute. February 2000. The Earned Income Credit: Does it Work?
4
that net wages matter in the work decisions of welfare recipients.13 By allowing welfare recipients to additionally claim the EITC, there is no disincentive for work.
The EITC is also simpler to claim than applying for assistance from traditional welfare programs. The EITC is administered through the IRS, meaning that it is a single form that is filled out and submitted with a person’s tax return. Traditional welfare programs typically require a person to visit a welfare office, meet with a caseworker, and fill out an application for assistance. Then the application must be approved and is reexamined periodically, usually every six months. The EITC requires no travel or process of application and approval. If a person qualifies as being eligible for the EITC, it is calculated into their yearly tax return. This easy process means that there is a higher participation rate for the EITC and that persons who might be eligible for welfare might prefer the ease at which they can claim the EITC as opposed to other assistance programs.14
2.3 Employment As previously mentioned, only persons who have a job and are earning an income are
eligible for the EITC. This is another important feature of the EITC. The tax credit encourages work, unlike other assistance programs. Additionally, as mentioned before, claiming the EITC does not limit the ability to claim assistance from other welfare programs, such as TANF, SSI, Medicaid, Food Stamps, or low-income housing. So, while a person makes the transition to work and income rises, the EITC provides a tax credit of up to 40 cents per dollar earned, while other assistance from entitlement programs declines.
The EITC has been found to have a positive effect upon labor force participation. The EITC provides additional incentives for non-workers to enter the labor force, thereby having lasting effects like limiting long-term unemployment and building human capital. Research completed by Jeffery Leibman noted that from 1984 to 1996 the labor force participation rate of single women with children increased from 73% to 82% and that the EITC was responsible for 60% of this increase. In other words, the EITC induced 20% of single women with children not previously working to begin working.15 The EITC expansion of 1993 is estimated to have increased the labor force participation rate of single parent families by over 3% due to the EITC impact on net wages.16 The expansion of the credit in 1993 increased the net wages of low-income, single parents by a total of 15%. These effects are magnified by the addition of state and local EITC programs.
Economic theory suggests that the number of hours worked by persons claiming the credit would decrease for two reasons. First, the credit provides a higher income so there is a disincentive to work the number of hours that translate to the highest amount of the credit. Second, the phase-out stage of the credit reduces the amount of the credit earned acting like a “tax” on earnings. The few studies that have looked into this issue have found that the EITC has a negligible effect on the number of hours worked.
13 Moffitt, Robert. March 1992. Incentive Effects of the U.S. Welfare System: A Review. Journal of Economic Literature. 14 The Internal Revenue Service is moving towards pre-certification of EITC claimants. 15 Leibman, Jeffery. October 1997. The Impact of the Earned Income Credit on Incentives and Income Distribution. 16 Dickert, Hauser, Scholz. 1995. The Earned Income Credit and Transfer Programs: A Study of Labor Market and Program Participation. Tax Policy and the Economy, Vol. 9, MIT Press.
5

2.4 Examples of Local EITC Promotion Efforts Communities nationwide have begun to realize the positive impacts that the EITC
promotes. The Annie E. Casey foundation established the National Tax Assistance for Working Families Campaign to build the capacity and efforts of local EITC promotion and tax assistance campaigns. There are currently 34 local sites involved with the National Tax Assistance for Working Families Campaign. Below are several examples of efforts by cities and organizations to promote awareness of the EITC among residents.
Baltimore, Maryland
• The Baltimore CASH Campaign is designed to help low- to moderate-income families benefit from substantial tax credits, such as the Earned Income Tax Credit (EITC), as well as free tax preparation through Volunteer Income Tax Assistance (VITA) sites. It is also working to connect more families to economic opportunities centered around financial education, free savings accounts, housing counseling, and Individual Development Accounts (IDAs; matched savings accounts) that can help them use tax credits to achieve family economic success.
• The Baltimore CASH Campaign was started in the 2000-2001 tax season, and is the work of a group comprised of non-profits, businesses, the Office of the Mayor and other city agencies, local foundations, and the Internal Revenue Service, in coordination with the Maryland EIC Campaign (www.mdchildcare.org/eic) and the National Tax Assistance for Working Families Campaign.
• For the tax season 2003-04, the Baltimore CASH Campaign prepared approximately 3,875 tax returns at 14 sites, bringing over $6.5 million in Federal tax refunds to Baltimore communities, of which $2.6 million was Earned Income Tax Credit (EITC), and saving clients an estimated $580,000 in tax preparation fees.
Boston, Massachusetts
• Boston Earned Income Tax Credit (EITC) Campaign was a tremendous success this season, returning more than $5 million in Federal and State refunds to Boston residents.
• Boston’s EITC Campaign officially kicked off in February 2003 with the opening of 16 free tax prep sites throughout the city. These free tax prep sites served almost 4,000 residents who qualified for the EITC, returning more than $2.2 million in tax credits and more than $5 million in federal and state refunds.
• The EITC now generates more than $1 billion per year for the New England economy. According to early estimates from the IRS, Suffolk County will see a 10% increase in EITC participation and a 13% increase in dollars returned from the previous year. That means that this year in Suffolk County almost 50,000 EITC claims will be processed and approximately $75 million will be returned to working individuals and families.
Des Moines, Iowa
• The Des Moines Coalition launched the Earned Income Tax Credit 2003 campaign in January for Volunteer Tax Assistance and Asset Building. Over $1 million was returned to the community.
6
• 125 bank accounts were opened through the tax sites saving $29,120 in check cashing fees.
• Filers saved more than $700,000 in tax preparation fees and services.
• The minimum credit claimed was $1,402 and the maximum credit claimed was $5,374.
• 175 filers planned to use all or part of their 2002 refunds to reduce their debt load; they planned to use a total of more than $76,000 for this purpose.
• Nearly 300 filers planned to save or invest all or part of their 2002 refunds; the total amount these filers planned to save was more than $248,000.
Philadelphia, Pennsylvania
• Now in its second year, The Campaign for Working Families promotes free filing of EITC at 19 free tax-filing sites throughout Philadelphia.
• In its first year, in 2003, Philadelphia's Campaign for Working Families brought in more than $10 million ($10,244,000) went to low and moderate income working families in Philadelphia. This amount includes the Earned Income Tax Credit (EITC), child tax credit and dependent care credit. One hundred percent of the refunds went directly to the tax filers.
• Volunteer tax preparers filed for the EITC for 2,708 individuals; total EITC dollars brought in was $3,924,622.
• The preparation of tax returns by 325 Campaign volunteers resulted in a savings of $1.5 million for low and moderate income working families, who did not have to pay commercial tax preparers an average of $165 per tax return.
• Citizens, PNC and First Union Banks adopted a total of 11 tax filing sites, providing information to filers about banking services and credit repair. This resulted in more than 160 filers opening new bank accounts, and directly depositing their tax credits. Also, 280 people received six hours of training on the basics of financial literacy.
• The Campaign received 11,515 calls through its city-supported 24-hour Interactive Voice Response (IVR) telephone information line. The phone line provided information to callers about EITC eligibility and tax filing sites, in Spanish and English.
Tulsa, Oklahoma
• With the help of the Internal Revenue Service (IRS) VITA Program, community partners supplying in-kind services, facilities, and equipment, and local volunteers serving as tax preparers, the Community Action Project (CAP) EITC Program prepared a record 12,667 returns during 10 weeks of the 2001 tax season and brought almost $14 million back into the economy of Tulsa.
Chicago, Illinois
• The Brookings study found that 264,063 Chicago households--one-quarter of the city's taxpayers--received $462 million in earned income tax credits in 2000 - those funds are usually recycled directly back into the local economy.
7
• In 2003, this program helped 16,500 families obtain approximately $21.5 million in tax returns, a more than 20 percent increase over 2002. The average EITC refund was $1,880 and the city had 25 free tax preparation sites. In addition, for the first time, many of the free tax preparation sites had bank representatives on hand, making it possible for a low income taxpayer to open a bank account while getting his or her taxes prepared free of charge.
• In 2004, the city has expanded the number of free tax preparation sites to 28.
New York City, New York
• The Earned Income Tax Credit (EITC) Project can be worth up to $5,000 a year for working families, but 230,000 eligible New Yorkers each year don’t get the benefit, leaving nearly half a billion dollars unclaimed.
• In 2002, Community Food Resource Center (CFRC) launched the EITC campaign to help low-income, working New Yorkers access federal and state tax credits. As a result, CFRC completed and electronically filed federal and state tax returns for 2,200 people free of charge at sites in Manhattan, Brooklyn, and the Bronx, resulting in tax refunds of over $3.2 million dollars.
• In 2003, CFRC continued its campaign to inform New Yorkers about EITC and provided free tax-filing assistance to eligible workers. Community volunteers, working at nine sites including partnership with four unions, completed almost 10,000 federal and state tax returns, resulting in refunds of $18 million. In addition, more than 15,000 New Yorkers received information through our English and Spanish toll-free hotlines.
3.0 The Impact of the EITC on Baltimore City The preceding section documents the importance of the EITC in reducing poverty, and welfare, and promoting work. The France Institute used federal EITC payments data for Baltimore City provided by the Brookings Institution, and State EITC payments data provided by the Maryland Office of the Comptroller, to calculate the impacts that the EITC has on the Baltimore City economy. What is not known though, is the amount of the tax credit that remains unclaimed by City residents and the effects that these tax credit dollars would have on the City’s economy. This report attempts to estimate these unclaimed resources and their effects in Baltimore City. There are several reasons why there is not full participation among City residents in claiming the EITC. Some of these reasons may include a lack of knowledge about the EITC, failure to file a tax return, or being unsure if a family or person is eligible for the EITC. Efforts to “capture” these unclaimed tax dollars would lead to the creation of jobs, wages, and tax revenue for Baltimore City.
Table 1 provides information as to the number of persons claiming the Federal and State EITC and the amounts of these EITC payments in Maryland and Baltimore City. Both for the Federal and State EITC, Baltimore City is over one-fifth of the number of persons that claim the credit and the amount of payments in Maryland. For the Federal EITC, 23% of the persons claiming the credit in Maryland reside in the City and 21% of the payments are in Baltimore City. For the State EITC, 23% of the persons claiming the credit reside in Baltimore City and 24% of the payments are in Baltimore City. The total amount of federal EITC payments in Baltimore City totaled $131 million and the State EITC payments totaled $24.4 million.
8

Baltimore City as aMaryland Baltimore City % of Maryland
Federal EITCNumber of Persons Claiming EITC 321,110 73,348 23%Amount of Payments $536,989,865 $130,912,678 24%
State EITCNumber of Persons Claiming EITC 319,770 73,529 23%Amount of Payments $116,080,247 $24,423,234 21%
and The Jacob France InstituteSource: Brookings Institution, Maryland Office of the Comptroller,
Table 1Number of Persons Claiming Federal & State EITC & Amount of EITC Payments
in Maryland and Baltimore City, TY 2002
Table 2 presents the federal EITC payments made to City residents for tax year 2002 by zip code. Of nearly a quarter of a million tax returns filed, 30% claimed the EITC for nearly $131 million. Using the GAO estimate that the EITC participation rate nationwide is approximately 75%17 and that unclaimed payments are estimated to be 75% of the payments that have already been claimed18, it is possible to estimate the amount of unclaimed EITC payments in Baltimore City. The unclaimed payments are estimated to be smaller than claimed payments on the basis that the persons who would receive the greatest benefit would already be claiming the credit, or that they do not feel that the refund provided by the EITC would be worth claiming. An estimated $24.5 million in additional EITC payments could be paid to Baltimore City households if full participation in the EITC program occurred, given the GAO and Brookings Institution estimations. Table 3 shows that for the Maryland EITC, 29% of City residents filing a tax return claimed the credit for a total of $24.4 million. The estimated amount of unclaimed payments totaled $4.6 million. In Baltimore City, an estimated additional 18,337 persons could claim the federal EITC for a total of $24,546,127 and an estimated 18,382 persons could claim the State EITC for a total of $4,579,356 (see Table 4). The Federal and State unclaimed EITC payments by Baltimore City residents total over $29 million.
17 United States General Accounting Office. 2001. Earned Income Tax Credit Participation. GAO-02-290R 18 The Brookings Institution. Using EITC Data – A Guide.
9

EITC Federal EstimatedTotal EITC as a % EITC Unclaimed
Zipcode Returns Returns of Total Payments EITC Payments
Total 248,460 73,348 30% $130,912,678 $24,546,127
21201 5,595 1,588 28% $2,834,933 $531,55021202 5,989 2,267 38% $3,970,413 $744,45221203 727 169 23% $270,437 $50,70721205 5,938 3,037 51% $5,919,381 $1,109,88421206 22,036 5,886 27% $10,287,283 $1,928,86621209 10,580 591 6% $771,431 $144,64321210 5,133 129 3% $102,424 $19,20521211 7,502 1,260 17% $1,942,382 $364,19721212 13,821 2,339 17% $3,899,264 $731,11221213 13,332 5,822 44% $10,578,790 $1,983,52321214 8,992 1,646 18% $2,676,634 $501,86921215 23,312 8,314 36% $14,941,936 $2,801,61321216 12,538 5,109 41% $9,561,776 $1,792,83321217 12,529 6,119 49% $11,460,591 $2,148,86121218 18,495 5,778 31% $10,368,306 $1,944,05721223 9,364 4,631 49% $8,763,264 $1,643,11221224 20,030 5,042 25% $8,794,546 $1,648,97721229 20,060 5,955 30% $10,596,718 $1,986,88521230 13,772 3,003 22% $5,339,063 $1,001,07421231 5,635 1,488 26% $2,591,424 $485,89221233 12 12 100% $24,584 $4,61021235 10 1 10% $1,464 $27521239 12,968 3,136 24% $5,175,091 $970,33021270 35 12 34% $18,799 $3,52521281 32 6 19% $9,952 $1,86621287 23 8 35% $11,792 $2,21121297 0 0 0% $0 $0
Source: Brookings and The Jacob France Institute
By Zip CodeAnd Estimated Unclaimed EITC Payments
Federal EITC Payments Made to Baltimore City ResidentsTable 2
10

EITC State EstimatedTotal EITC as a % EITC Unclaimed
Returns Returns of Total Payments EITC Payments
Total 254,329 73,529 29% $24,423,234 $4,579,356
Source: MD Comptrollers Office and The Jacob France Institute
Table 3Maryland State EITC Claimed
And Estimated Unclaimed Amount to Baltimore City Residents
Number of Amount ofUnclaimed Unclaimed
Returns Payments
Total $29,125,483
Federal EITC 18,337 $24,546,127Maryland EITC 18,382 $4,579,356
Source: The Jacob France Institute
Table 4Estimated Unclaimed EITC Returns and Payments
to Baltimore City Residents
3.1 The Economic, Employment, and Earnings Impact of the EITC in Baltimore City The expenditures associated with EITC payments to City residents are circulated within the City’s economy and become income for both residents and businesses. This creates “spin-off” or “multiplier” effects as this money is spent and re-spent within the economy. Thus each dollar of new spending creates more than one dollar in economic impact, as that spending is earned and, in-turn, spent by others within the City. It was assumed that two-thirds of the payments made to City residents were re-spent within the City’s economy.19 Once the level of spending in the economy is known, it is entered into an economic model to determine the change in economic output, employment, and earnings attributable to the EITC.20
Table 5 shows the amount of spending attributable to both the claimed and unclaimed EITC payments in Baltimore City. The largest amount of spending occurs in the real estate sector followed by the retail sector. Table 6 and Table 7 shows the economic impacts due to the local spending that occurs from City households receiving EITC payments. Spending resulting 19 In addition to this assumption, retail expenditures within the City’s economy were margined. 20 The Jacob France Institute used the IMPLAN input-output model. See the methodology section for a more complete description of economic modeling.
11
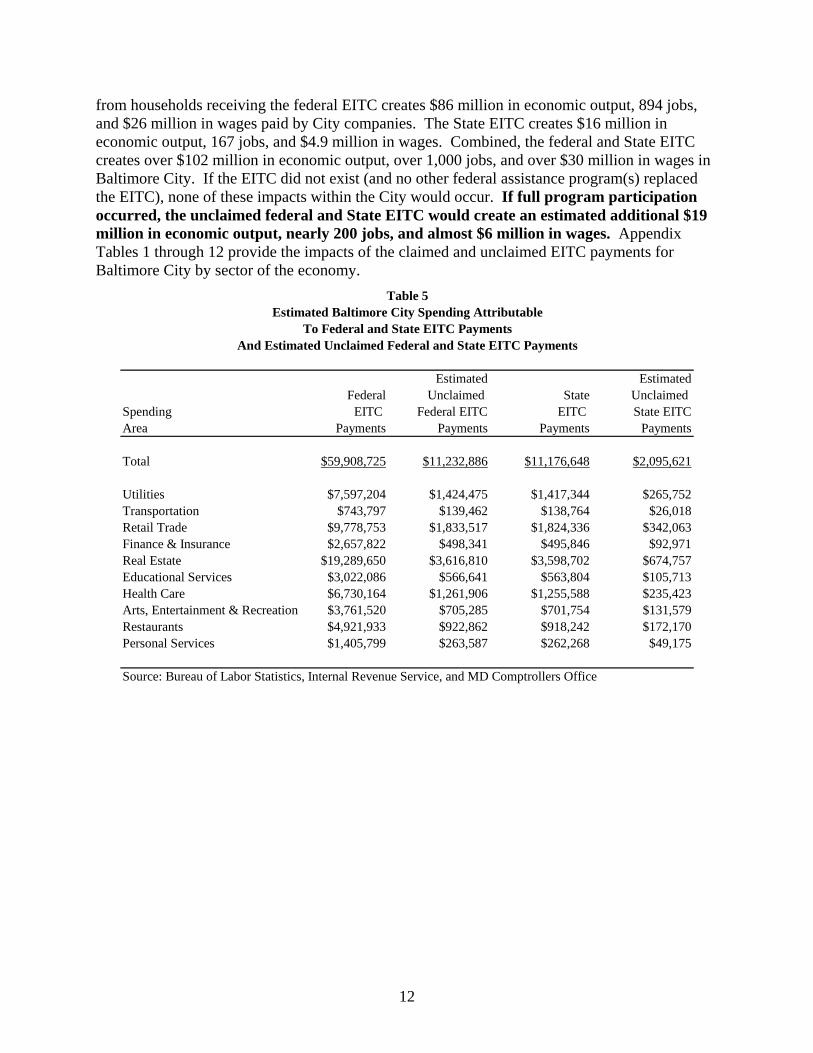
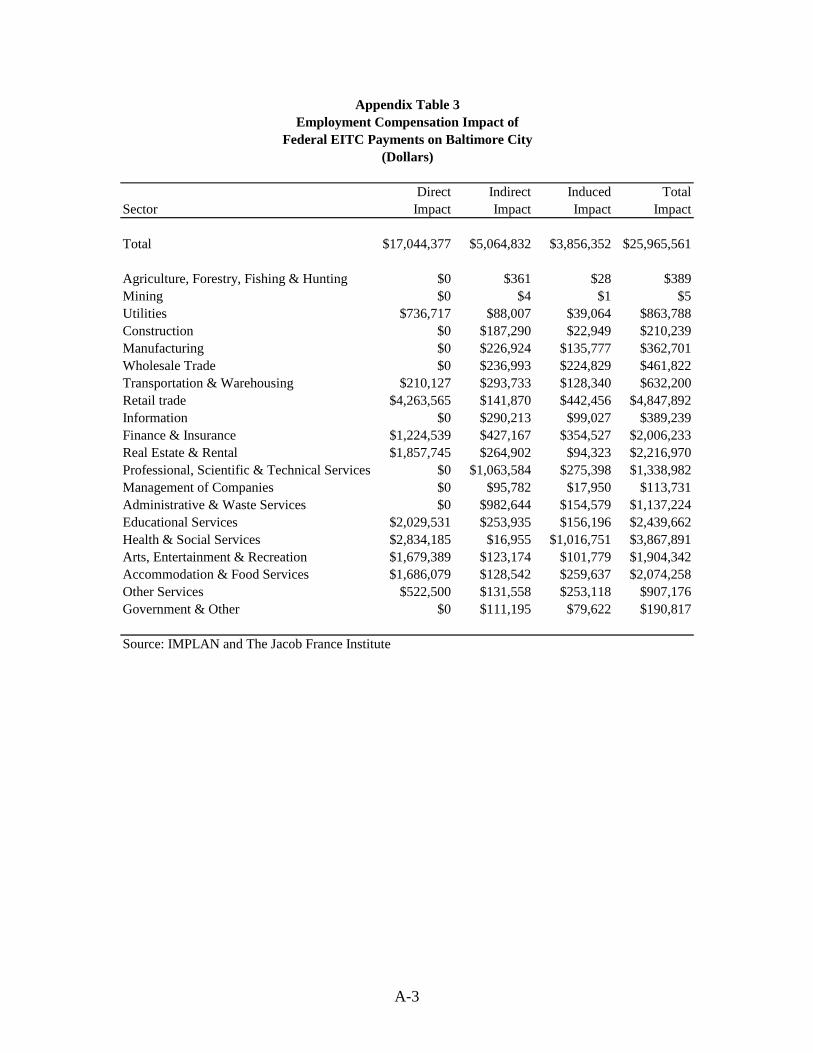
from households receiving the federal EITC creates $86 million in economic output, 894 jobs, and $26 million in wages paid by City companies. The State EITC creates $16 million in economic output, 167 jobs, and $4.9 million in wages. Combined, the federal and State EITC creates over $102 million in economic output, over 1,000 jobs, and over $30 million in wages in Baltimore City. If the EITC did not exist (and no other federal assistance program(s) replaced the EITC), none of these impacts within the City would occur. If full program participation occurred, the unclaimed federal and State EITC would create an estimated additional $19 million in economic output, nearly 200 jobs, and almost $6 million in wages. Appendix Tables 1 through 12 provide the impacts of the claimed and unclaimed EITC payments for Baltimore City by sector of the economy.
Estimated EstimatedFederal Unclaimed State Unclaimed
Spending EITC Federal EITC EITC State EITCArea Payments Payments Payments Payments
Total $59,908,725
$11,232,886 $11,176,648 $2,095,621
Utilities $7,597,204 $1,424,475 $1,417,344 $265,752Transportation $743,797 $139,462 $138,764 $26,018Retail Trade $9,778,753 $1,833,517 $1,824,336 $342,063Finance & Insurance $2,657,822 $498,341 $495,846 $92,971Real Estate $19,289,650 $3,616,810 $3,598,702 $674,757Educational Services $3,022,086 $566,641 $563,804 $105,713Health Care $6,730,164 $1,261,906 $1,255,588 $235,423Arts, Entertainment & Recreation $3,761,520 $705,285 $701,754 $131,579Restaurants $4,921,933 $922,862 $918,242 $172,170Personal Services $1,405,799 $263,587 $262,268 $49,175
Source: Bureau of Labor Statistics, Internal Revenue Service, and MD Comptrollers Office
And Estimated Unclaimed Federal and State EITC PaymentsTo Federal and State EITC Payments
Estimated Baltimore City Spending AttributableTable 5
12
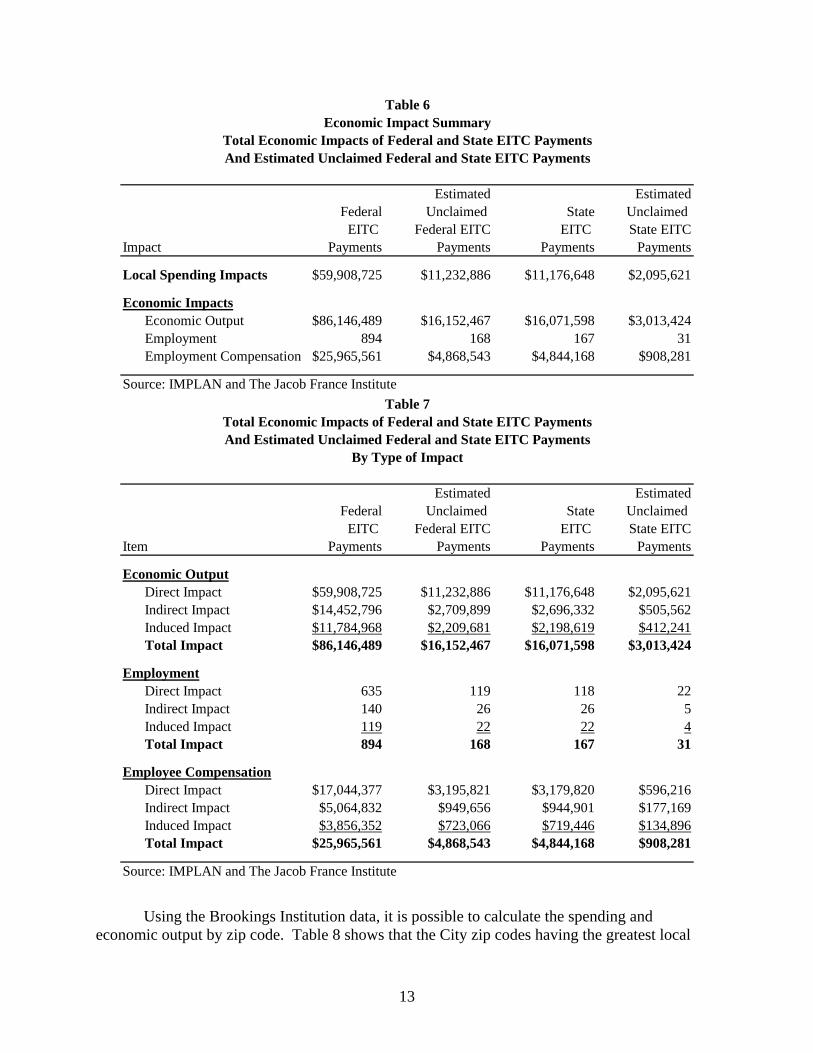
Estimated EstimatedFederal Unclaimed State Unclaimed
EITC Federal EITC EITC State EITCImpact Payments Payments Payments Payments
Local Spending Impacts $59,908,725 $11,232,886 $11,176,648 $2,095,621
Economic Impacts
Economic Output $86,146,489 $16,152,467 $16,071,598 $3,013,424Employment 894 168 167 31Employment Compensation $25,965,561 $4,868,543 $4,844,168 $908,281
Source: IMPLAN and The Jacob France Institute
And Estimated Unclaimed Federal and State EITC PaymentsTotal Economic Impacts of Federal and State EITC Payments
Economic Impact SummaryTable 6
Estimated EstimatedFederal Unclaimed State Unclaimed
EITC Federal EITC EITC State EITCItem Payments Payments Payments Payments
Economic Output
Direct Impact $59,908,725 $11,232,886 $11,176,648 $2,095,621Indirect Impact $14,452,796 $2,709,899 $2,696,332 $505,562Induced Impact $11,784,968 $2,209,681 $2,198,619 $412,241Total Impact $86,146,489 $16,152,467 $16,071,598 $3,013,424
EmploymentDirect Impact 635 119 118 22Indirect Impact 140 26 26 5Induced Impact 119 22 22 4Total Impact 894 168 167 31
Employee CompensationDirect Impact $17,044,377 $3,195,821 $3,179,820 $596,216Indirect Impact $5,064,832 $949,656 $944,901 $177,169Induced Impact $3,856,352 $723,066 $719,446 $134,896Total Impact $25,965,561 $4,868,543 $4,844,168 $908,281
Source: IMPLAN and The Jacob France Institute
Table 7
By Type of ImpactAnd Estimated Unclaimed Federal and State EITC PaymentsTotal Economic Impacts of Federal and State EITC Payments
Using the Brookings Institution data, it is possible to calculate the spending and economic output by zip code. Table 8 shows that the City zip codes having the greatest local
13
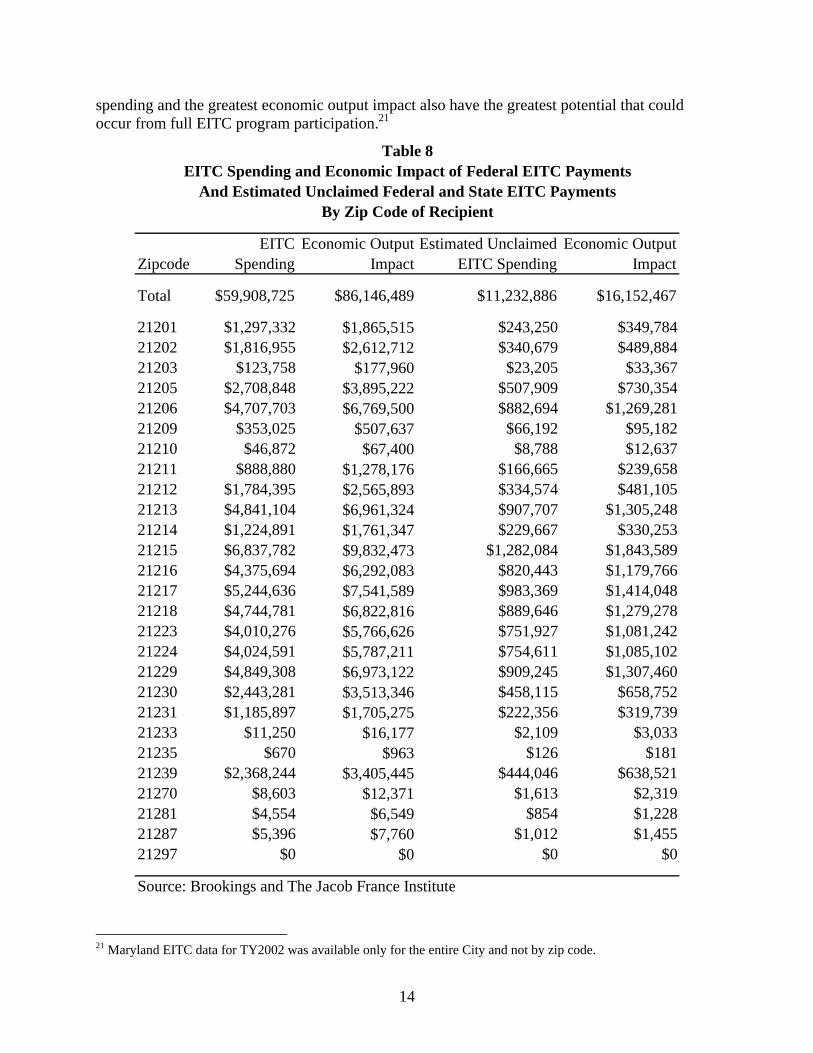
spending and the greatest economic output impact also have the greatest potential that could occur from full EITC program participation.21
EITC Economic Output Estimated Unclaimed Economic OutputZipcode Spending Impact EITC Spending Impact
Total $59,908,725 $86,146,489 $11,232,886 $16,152,467
21201 $1,297,332 $1,865,515 $243,250 $349,78421202 $1,816,955 $2,612,712 $340,679 $489,88421203 $123,758 $177,960 $23,205 $33,36721205 $2,708,848 $3,895,222 $507,909 $730,35421206 $4,707,703 $6,769,500 $882,694 $1,269,28121209 $353,025 $507,637 $66,192 $95,18221210 $46,872 $67,400 $8,788 $12,63721211 $888,880 $1,278,176 $166,665 $239,65821212 $1,784,395 $2,565,893 $334,574 $481,10521213 $4,841,104 $6,961,324 $907,707 $1,305,24821214 $1,224,891 $1,761,347 $229,667 $330,25321215 $6,837,782 $9,832,473 $1,282,084 $1,843,58921216 $4,375,694 $6,292,083 $820,443 $1,179,76621217 $5,244,636 $7,541,589 $983,369 $1,414,04821218 $4,744,781 $6,822,816 $889,646 $1,279,27821223 $4,010,276 $5,766,626 $751,927 $1,081,24221224 $4,024,591 $5,787,211 $754,611 $1,085,10221229 $4,849,308 $6,973,122 $909,245 $1,307,46021230 $2,443,281 $3,513,346 $458,115 $658,75221231 $1,185,897 $1,705,275 $222,356 $319,73921233 $11,250 $16,177 $2,109 $3,03321235 $670 $963 $126 $18121239 $2,368,244 $3,405,445 $444,046 $638,52121270 $8,603 $12,371 $1,613 $2,31921281 $4,554 $6,549 $854 $1,22821287 $5,396 $7,760 $1,012 $1,45521297 $0 $0 $0 $0
Source: Brookings and The Jacob France Institute
Table 8
By Zip Code of RecipientAnd Estimated Unclaimed Federal and State EITC Payments
EITC Spending and Economic Impact of Federal EITC Payments
21 Maryland EITC data for TY2002 was available only for the entire City and not by zip code.
14

3.2 The Fiscal Impact of the EITC in Baltimore City The tax credit also impacts the fiscal vitality of the City. The EITC creates jobs within the City. When Baltimore City residents fill these jobs, the City gains income and property tax revenues. Table 9 lists the estimated City income tax and property tax revenue based on EITC payments received by City residents for TY2002. Earned Income Tax Credit payments to City residents resulted in an estimated $599,986 in tax revenue ($225,918 in City Income tax revenue and $374,068 in City property tax revenue). If full program participation in the EITC at both the federal and State level occurred, the City would have received an estimated additional $112,497 in City income and property tax revenue.
4.0 Summary The EITC plays a significant role in the lives and well being of low-income individuals. The EITC has been a successful means of reducing poverty, especially for poor children, and for reducing welfare, and promoting work. This success is evident in Baltimore City, where the $155 million in TY2002 EITC payments in Baltimore City created $102 million in economic output, 1,061 jobs, nearly $31 million in wages, and almost $600,000 in City tax revenue. By capturing the unclaimed EITC payments, Baltimore City would create an estimated additional $19 million in economic output, 199 jobs, $5.8 million in wages for Baltimore City residents, and collect an estimated additional $112,497 in tax revenue. These additional unclaimed payments could be translated into claimed payments through outreach programs focused on promoting and informing City residents about the benefits of the EITC program.
Estimated EstimatedFederal Unclaimed State Unclaimed
EITC Federal EITC EITC State EITCImpact Payments Payments Payments Payments
Total Selected Taxes $505,651 $94,809 $94,335 $17,688Estimated City Income Tax $190,397 $35,699 $35,521 $6,660Estimated City Property Tax $315,254 $59,110 $58,814 $11,028
Source: IMPLAN, The Jacob France Institute, MD Comptrollers Office, and The Baltimore Development Corporation
And Estimated Unclaimed Federal and State EITC PaymentsSelected Fiscal Impacts of the Federal and State EITC Payments
Table 9
15

Methodology This analysis used the IMPLAN model to estimate the economic impacts associated with
Federal and State Earned Income Tax Credits (EITC) on the Baltimore City economy.22 The primary input to this effort was data on the level of Federal EITC payments made to Baltimore City residents from the Brookings Institution23 and State EITC payments from the Comptroller of Maryland.24 The level of unclaimed EITC payments due to non-participation by qualified Baltimore City residents were estimated based on the United States General Accounting Office’s analysis of national Current Population Survey data and Internal Revenue Service data. The GAO analysis estimated a national EITC participation and non-participation rate. The rate of non-participation EITC payments were further reduced to reflect the level of payments likely to be spent locally – rather than saved – and distributed into key areas of spending, such as rent or groceries, based on the personal consumption expenditures of lower income persons nationally.25
An economic impact analysis examines the effects of an economic activity using input-output analysis. Input-output analysis is based on the use of multipliers, which describe the response of an economy to a change in demand or production. Multiplier effects occur as an initial round of spending is spent and re-spent in the region’s economy. For example, an industry pays a worker a salary, a portion of which is then spent on goods and services from local companies, which in turn becomes income for other workers and supplier firms. Thus, each dollar of spending creates more than one dollar in economic impacts, as that spending is earned and, in turn, spent by others in the regional economy.
An input-output analysis examines the relationships among businesses and among usinesses and final consumers. The IMPLAN model allows the estimation of three effects:
ts, which represent the changes in economic activity, in this case the increase
e e
lier -- indirect and induced – effects. All financial figures are expressed in constant year 2002 dollars.
An input-output model allows the estimation of several different economic impacts. This nalysis estimated the total, direct, indirect, and induced economic output, employment, and
ployee compensation impacts of the modeled Federal and State EITC spending.
b
• Direct effecin Baltimore City resident incomes and resulting spending attributable to the EITC and estimated potential increase in resident incomes from full participation, in the industries to which a final demand change was made.
• Indirect effects, which represent the changes in inter-industry purchases, for example thpurchase of raw materials from a local supplier, in response to the new demands from thdirectly affected industries; and
• Induced effects that reflect changes in spending from households as income and population increases (or decreases) due to changes in production.
• The total effects shown in this report are the direct impacts plus the multip
aem
22 For a description of the IMPLAN model, please reference: The Minnesota IMPLAN Group, Inc., IMPLAN Pro Users Guide, (Stillwater, MN: MIG, Inc, 1997). 23 http://apps89.brookings.edu:89/EITC/ 24 http://individuals.marylandtaxes.com/incometax/gtpitc/eitc.asp 25 http://www.bls.gov/cex/
16
• Economic output represents the value of production by a particular industry in an
availab
eated
ity residents and by the effective City income able to
eld
Dat L
Credit pact the magnitude of the estimated impacts. It is im
made:
the This is a more
Several key assumptions were made in estimating the amount of the potential EITC left unclaimed. Based on an analysis conducted by the United States General Accounting Office in 200128, it was assumed that the number of eligible persons not claiming the EITC was 25% of
economy over a given period of time.
• Employment is the total number of wage and salary earning employees and self-employed individuals in a region.
• Employee compensation consists of wage and salary payments paid to employees by employers. Employee compensation includes all benefits and non-cash compensation paid to employees.
Per the IMPLAN modeling instructions, the direct output impact of any retail activity isonly the gross margin associated with the retail sale. Gross margin equals sales less the cost of goods sold. The gross margin for retail purchases was obtained from the U.S. Census Bureau 1997 Economic Census Business Expenses report.26 These 1997 figures are the most recent
le from the U.S. Census Bureau – but retail margins are unlikely to exhibit significant changes over time.
It was outside of the scope of this project to conduct a full fiscal impact analysis. The fiscal analysis in this report is instead based on available income and property tax data. For both Baltimore City personal income and property taxes it was assumed that 45% of the jobs crwould be held by City residents (based on the 2000 Census). Income taxes were estimated based on the increase in incomes attributable to the economic activity supported by the EITC multiplied by the 45% of jobs estimated to be held by C
tax rate. Property taxes were calculated by multiplying the number of jobs attributthe economic activity supported by the EITC multiplied by the 45% of jobs estimated to be hby City residents and then by the per capita property tax rate.
a imitations The Jacob France Institute’s analysis of the economic impact of the Earned Income Tax was based on a series of assumptions that important to understand these assumptions and their impact on the impact estimates.
In estimating the economic impact of EITC spending, two critical assumptions were
1) it was assumed that only two-thirds of the tax credit was spent locally – with remaining one-third either saved or spent outside of the region.conservative estimate than other modeling techniques -- such as adjusting for the disposable personal income.
2) it was assumed that the tax credit was spent similar to the general personal consumption expenditures of lower income individuals based on data from the United States Bureau of Labor Statistics Consumer Expenditure Survey27.
26 http://www.Census .gov/prod/ec97/e97cs-8.pdf
counting Office. Earned Income Tax Credit Participation. GAO-02-290R. 27 http://www.bls.gov/cex/ 28 United States General Ac
17
tho reInstitut EITC were likely to have a lower EITC amount – esti t t unc m ved in Baltim on the Jacob France Institute’s review of the ava b al EITC l
itially intended to use U.S. Bureau of the Census data to estimate the numbe
e
)
ho had no income (and are not likely to be eligible); and 3) no data were availab
se ceiving the credit. It was further assumed, based on research by the Brookings ion29, eligible persons not claiming the
ma ed at 75% of the average credit received. Thus, the amount of potential EITC leflai ed was estimated at 18.75% (25% times 75%) of the EITC amount actually recei
ore City. This calculation was basedila le literature on the EITC but may under or over estimate the actual level of the potenti
eft unclaimed.
This analysis had inr of potentially eligible persons not receiving the EITC and the level of unclaimed EITC
payments. This proved to be impossible without a special run of Census data, which was outsidof both the budget and time available for this project. Some factors that made this impossible include: 1) EITC receipt data and Census data were not available for all potential zip codes; 2Census earnings data combined those with low income (and are presumably eligible for the EITC) with those w
le combining income and family size. In fact, there are so many potential factors that influence EITC eligibility that it the opinion of the France Center research staff involved in this project that a highly detailed, and therefore costly and time consuming, analysis of Census data would be necessary to examine the issue of EITC eligibility at the sub-City level.
It is the opinion of the Jacob France Institute staff and management involved in this project that the assumptions of this report are: a) reasonable and based on our review of the national literature on the EITC; and b) conservative and err on the side of undercounting the actual impact of the EITC.
29 The Brookings Institution. Using EITC Data – A Guide.
18

Direct Indirect Induced TotalSector Impact Impact Impact Impact
Total $59,908,725 $14,452,796 $11,784,968 $86,146,489
Agriculture, Forestry, Fishing & Hunting $0 $898 $70 $967Mining $0 $12 $3 $15Utilities $7,597,204 $907,545 $402,841 $8,907,589Construction $0 $444,033 $56,554 $500,587Manufacturing $0 $988,893 $766,591 $1,755,484Wholesale Trade $0 $629,876 $597,546 $1,227,423Transportation & Warehousing $743,797 $738,288 $372,953 $1,855,038Retail trade $9,778,753 $315,834 $1,022,862 $11,117,448Information $0 $890,139 $347,770 $1,237,909Finance & Insurance $2,657,822 $1,130,672 $1,077,348 $4,865,842Real Estate & Rental $19,289,650 $2,517,948 $761,059 $22,568,658Professional, Scientific & Technical Services $0 $2,031,874 $527,219 $2,559,093Management of Companies $0 $144,613 $27,101 $171,714Administrative & Waste Services $0 $1,869,040 $295,579 $2,164,620Educational Services $3,022,086 $378,123 $232,585 $3,632,795Health & Social Services $6,730,164 $40,190 $2,380,811 $9,151,164Arts, Entertainment & Recreation $3,761,520 $275,886 $227,965 $4,265,371Accommodation & Food Services $4,921,933 $390,948 $769,982 $6,082,864Other Services $1,405,799 $472,051 $760,431 $2,638,280Government & Other $0 $285,932 $1,157,699 $1,443,631
Source: IMPLAN and The Jacob France Institute
Federal EITC Payments on Baltimore City(Dollars)
Economic Output Impact ofAppendix Table 1
A-1

Direct Indirect Induced TotalSector Impact Impact Impact Impact
Total 635 140 119 894
Agriculture, Forestry, Fishing & Hunting 0 0 0 0Mining 0 0 0Utilities 3 0 0 4Construction 0 5 1 5Manufacturing 0 5 3Wholesale Trade 0 4 4 7Transportation & Warehousing 25 11 4 40Retail trade 164 6 19 188Information 0 5 2 7Finance & Insurance 16 5 5 26Real Estate & Rental 87 11 4 101Professional, Scientific & Technical Service
0
8
s 0 18 5Management of Companies 0 1 0 1Administrative & Waste Services 0 41 6 47Educational Services 50 6 4 60Health & Social Services 67 0 27 94Arts, Entertainment & Recreation 65 5 4 73Accommodation & Food Services 126 8 19 153Other Services 33 6 12 51Government & Other 0 2 2 4
Source: IMPLAN and The Jacob France Institute
(Jobs)Federal EITC Payments on Baltimore City
Employment Impact ofAppendix Table 2
23
A-2
Direct Indirect Induced TotalSector Impact Impact Impact Impact
Total $17,044,377 $5,064,832 $3,856,352 $25,965,561
Agriculture, Forestry, Fishing & Hunting $0 $361 $28 $389Mining $0 $4 $1 $5Utilities $736,717 $88,007 $39,064 $863,788Construction $0 $187,290 $22,949 $210,239Manufacturing $0 $226,924 $135,777 $362,701Wholesale Trade $0 $236,993 $224,829 $461,822Transportation & Warehousing $210,127 $293,733 $128,340 $632,200Retail trade $4,263,565 $141,870 $442,456 $4,847,892Information $0 $290,213 $99,027 $389,239Finance & Insurance $1,224,539 $427,167 $354,527 $2,006,233Real Estate & Rental $1,857,745 $264,902 $94,323 $2,216,970Professional, Scientific & Technical Services $0 $1,063,584 $275,398 $1,338,982Management of Companies $0 $95,782 $17,950 $113,731Administrative & Waste Services $0 $982,644 $154,579 $1,137,224Educational Services $2,029,531 $253,935 $156,196 $2,439,662Health & Social Services $2,834,185 $16,955 $1,016,751 $3,867,891Arts, Entertainment & Recreation $1,679,389 $123,174 $101,779 $1,904,342Accommodation & Food Services $1,686,079 $128,542 $259,637 $2,074,258Other Services $522,500 $131,558 $253,118 $907,176Government & Other $0 $111,195 $79,622 $190,817
Source: IMPLAN and The Jacob France Institute
(Dollars)Federal EITC Payments on Baltimore City
Employment Compensation Impact ofAppendix Table 3
A-3
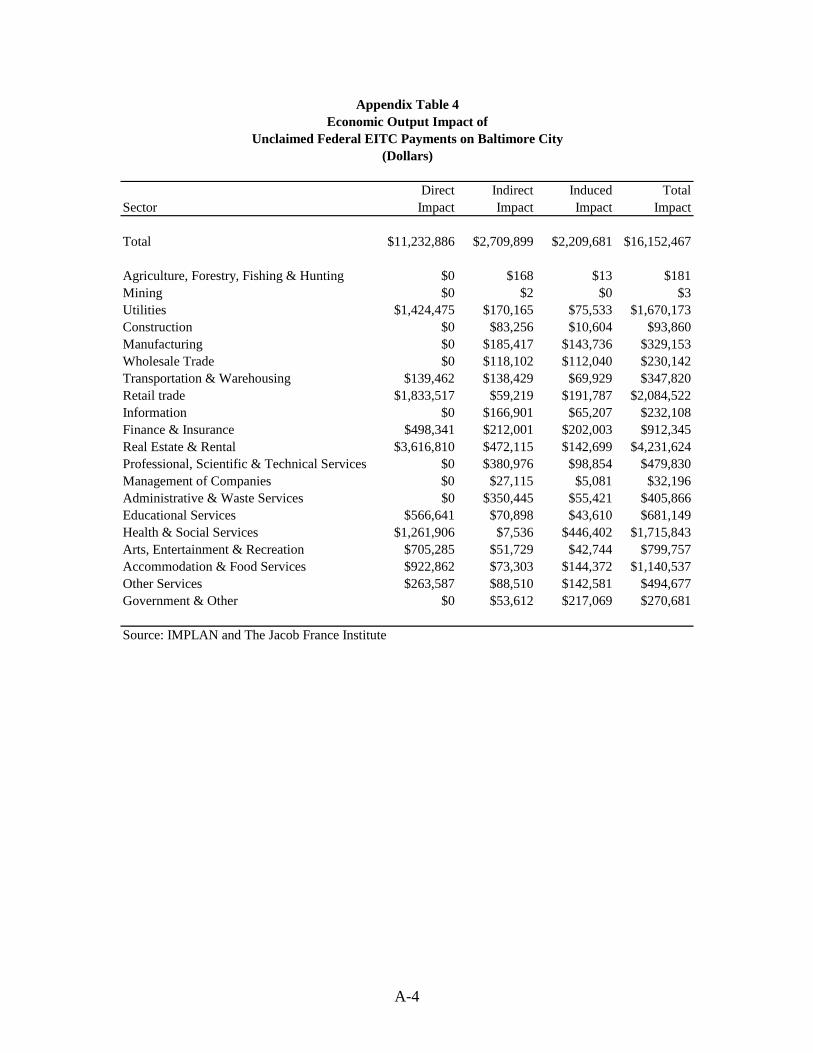
Direct Indirect Induced TotalSector Impact Impact Impact Impact
Total $11,232,886 $2,709,899 $2,209,681 $16,152,467
Agriculture, Forestry, Fishing & Hunting $0 $168 $13 $181Mining $0 $2 $0 $3Utilities $1,424,475 $170,165 $75,533 $1,670,173Construction $0 $83,256 $10,604 $93,860Manufacturing $0 $185,417 $143,736 $329,153Wholesale Trade $0 $118,102 $112,040 $230,142Transportation & Warehousing $139,462 $138,429 $69,929 $347,820Retail trade $1,833,517 $59,219 $191,787 $2,084,522Information $0 $166,901 $65,207 $232,108Finance & Insurance $498,341 $212,001 $202,003 $912,345Real Estate & Rental $3,616,810 $472,115 $142,699 $4,231,624Professional, Scientific & Technical Services $0 $380,976 $98,854 $479,830Management of Companies $0 $27,115 $5,081 $32,196Administrative & Waste Services $0 $350,445 $55,421 $405,866Educational Services $566,641 $70,898 $43,610 $681,149Health & Social Services $1,261,906 $7,536 $446,402 $1,715,843Arts, Entertainment & Recreation $705,285 $51,729 $42,744 $799,757Accommodation & Food Services $922,862 $73,303 $144,372 $1,140,537Other Services $263,587 $88,510 $142,581 $494,677Government & Other $0 $53,612 $217,069 $270,681
Source: IMPLAN and The Jacob France Institute
(Dollars)Unclaimed Federal EITC Payments on Baltimore City
Economic Output Impact ofAppendix Table 4
A-4

Direct Indirect Induced TotalSector Impact Impact Impact Impact
Total 119 26 22 168
Agriculture, Forestry, Fishing & Hunting 0 0 0 0Mining 0 0 0 0Utilities 1 0 0 1Construction 0 1 0 1Manufacturing 0 1 1 1Wholesale Trade 0 1 1 1Transportation & Warehousing 5 2 1 8Retail trade 31 1 4 35Information 0 1 0 1Finance & Insurance 3 1 1 5Real Estate & Rental 16 2 1 19Professional, Scientific & Technical Service 0 3 1 4Management of Companies 0 0 0 0Administrative & Waste Services 0 8 1 9Educational Services 9 1 1 11Health & Social Services 13 0 5 18Arts, Entertainment & Recreation 12 1 1 14Accommodation & Food Services 24 2 4 29Other Services 6 1 2 10Government & Other 0 0 0 1
Fractional jobs allowed. Totals may not sum due to rounding.Source: IMPLAN and The Jacob France Institute
Appendix Table 5Employment Impact of
Unclaimed Federal EITC Payments on Baltimore City(Jobs)
A-5

Direct Indirect Induced TotalSector Impact Impact Impact Impact
Total $3,195,821 $949,656 $723,066 $4,868,543
Agriculture, Forestry, Fishing & Hunting $0 $68 $5 $73Mining $0 $1 $0 $1Utilities $138,134 $16,501 $7,325 $161,960Construction $0 $35,117 $4,303 $39,420Manufacturing $0 $42,548 $25,458 $68,006Wholesale Trade $0 $44,436 $42,155 $86,592Transportation & Warehousing $39,399 $55,075 $24,064 $118,538Retail trade $799,419 $26,601 $82,961 $908,980Information $0 $54,415 $18,568 $72,982Finance & Insurance $229,601 $80,094 $66,474 $376,169Real Estate & Rental $348,327 $49,669 $17,685 $415,682Professional, Scientific & Technical Services $0 $199,422 $51,637 $251,059Management of Companies $0 $17,959 $3,366 $21,325Administrative & Waste Services $0 $184,246 $28,984 $213,229Educational Services $380,537 $47,613 $29,287 $457,437Health & Social Services $531,410 $3,179 $190,641 $725,230Arts, Entertainment & Recreation $314,885 $23,095 $19,084 $357,064Accommodation & Food Services $316,140 $24,102 $48,682 $388,923Other Services $97,969 $24,667 $47,460 $170,095Government & Other $0 $20,849 $14,929 $35,778
Source: IMPLAN and The Jacob France Institute
(Dollars)Unclaimed Federal EITC Payments on Baltimore City
Employment Compensation Impact ofAppendix Table 6
A-6

Direct Indirect Induced TotalSector Impact Impact Impact Impact
Total $11,176,648 $2,696,332 $2,198,619 $16,071,598
Agriculture, Forestry, Fishing & Hunting $0 $167 $13 $180Mining $0 $2 $0 $3Utilities $1,417,344 $169,313 $75,154 $1,661,812Construction $0 $82,839 $10,551 $93,390Manufacturing $0 $184,489 $143,016 $327,505Wholesale Trade $0 $117,511 $111,479 $228,990Transportation & Warehousing $138,764 $137,736 $69,579 $346,079Retail trade $1,824,336 $58,922 $190,826 $2,074,085Information $0 $166,066 $64,880 $230,946Finance & Insurance $495,846 $210,940 $200,991 $907,777Real Estate & Rental $3,598,702 $469,752 $141,984 $4,210,437Professional, Scientific & Technical Services $0 $379,069 $98,359 $477,428Management of Companies $0 $26,979 $5,056 $32,035Administrative & Waste Services $0 $348,691 $55,144 $403,834Educational Services $563,804 $70,543 $43,391 $677,739Health & Social Services $1,255,588 $7,498 $444,167 $1,707,253Arts, Entertainment & Recreation $701,754 $51,470 $42,530 $795,753Accommodation & Food Services $918,242 $72,936 $143,649 $1,134,827Other Services $262,268 $88,066 $141,867 $492,201Government & Other $0 $53,344 $215,982 $269,326
Source: IMPLAN and The Jacob France Institute
(Dollars)State EITC Payments on Baltimore City
Economic Output Impact ofAppendix Table 7
A-7

Direct Indirect Induced TotalSector Impact Impact Impact Impact
Total 118 26 22 167
Agriculture, Forestry, Fishing & Hunting 0 0 0 0Mining 0 0 0 0Utilities 1 0 0 1Construction 0 1 0 1Manufacturing 0 1 1 1Wholesale Trade 0 1 1 1Transportation & Warehousing 5 2 1 8Retail trade 31 1 4 35Information 0 1 0 1Finance & Insurance 3 1 1 5Real Estate & Rental 16 2 1 19Professional, Scientific & Technical Service 0 3 1 4Management of Companies 0 0 0 0Administrative & Waste Services 0 8 1 9Educational Services 9 1 1 11Health & Social Services 12 0 5 18Arts, Entertainment & Recreation 12 1 1 14Accommodation & Food Services 23 2 3 29Other Services 6 1 2 10Government & Other 0 0 0 1
Fractional jobs allowed. Totals may not sum due to rounding.Source: IMPLAN and The Jacob France Institute
Appendix Table 8Employment Impact of
State EITC Payments on Baltimore City(Jobs)
A-8

Direct Indirect Induced TotalSector Impact Impact Impact Impact
Total $3,179,820 $944,901 $719,446 $4,844,168
Agriculture, Forestry, Fishing & Hunting $0 $67 $5 $73Mining $0 $1 $0 $1Utilities $137,443 $16,419 $7,288 $161,149Construction $0 $34,941 $4,281 $39,222Manufacturing $0 $42,335 $25,331 $67,666Wholesale Trade $0 $44,214 $41,944 $86,158Transportation & Warehousing $39,202 $54,799 $23,943 $117,944Retail trade $795,416 $26,467 $82,545 $904,429Information $0 $54,142 $18,475 $72,617Finance & Insurance $228,451 $79,693 $66,141 $374,285Real Estate & Rental $346,583 $49,421 $17,597 $413,601Professional, Scientific & Technical Services $0 $198,424 $51,379 $249,802Management of Companies $0 $17,869 $3,349 $21,218Administrative & Waste Services $0 $183,323 $28,839 $212,162Educational Services $378,632 $47,374 $29,140 $455,146Health & Social Services $528,749 $3,163 $189,686 $721,599Arts, Entertainment & Recreation $313,309 $22,979 $18,988 $355,276Accommodation & Food Services $314,557 $23,981 $48,438 $386,976Other Services $97,478 $24,544 $47,222 $169,244Government & Other $0 $20,745 $14,854 $35,599
Source: IMPLAN and The Jacob France Institute
(Dollars)State EITC Payments on Baltimore CityEmployment Compensation Impact of
Appendix Table 9
A-9
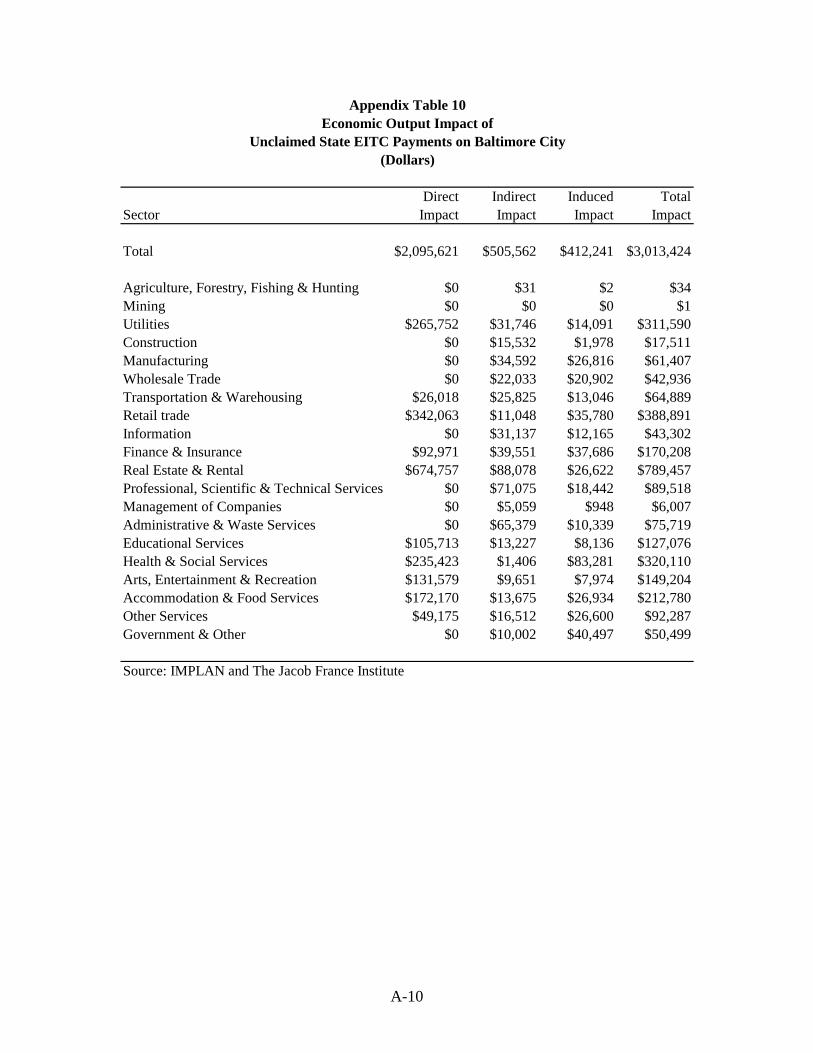
Direct Indirect Induced TotalSector Impact Impact Impact Impact
Total $2,095,621 $505,562 $412,241 $3,013,424
Agriculture, Forestry, Fishing & Hunting $0 $31 $2 $34Mining $0 $0 $0 $1Utilities $265,752 $31,746 $14,091 $311,590Construction $0 $15,532 $1,978 $17,511Manufacturing $0 $34,592 $26,816 $61,407Wholesale Trade $0 $22,033 $20,902 $42,936Transportation & Warehousing $26,018 $25,825 $13,046 $64,889Retail trade $342,063 $11,048 $35,780 $388,891Information $0 $31,137 $12,165 $43,302Finance & Insurance $92,971 $39,551 $37,686 $170,208Real Estate & Rental $674,757 $88,078 $26,622 $789,457Professional, Scientific & Technical Services $0 $71,075 $18,442 $89,518Management of Companies $0 $5,059 $948 $6,007Administrative & Waste Services $0 $65,379 $10,339 $75,719Educational Services $105,713 $13,227 $8,136 $127,076Health & Social Services $235,423 $1,406 $83,281 $320,110Arts, Entertainment & Recreation $131,579 $9,651 $7,974 $149,204Accommodation & Food Services $172,170 $13,675 $26,934 $212,780Other Services $49,175 $16,512 $26,600 $92,287Government & Other $0 $10,002 $40,497 $50,499
Source: IMPLAN and The Jacob France Institute
(Dollars)Unclaimed State EITC Payments on Baltimore City
Economic Output Impact ofAppendix Table 10
A-10
Direct Indirect Induced TotalSector Impact Impact Impact Impact
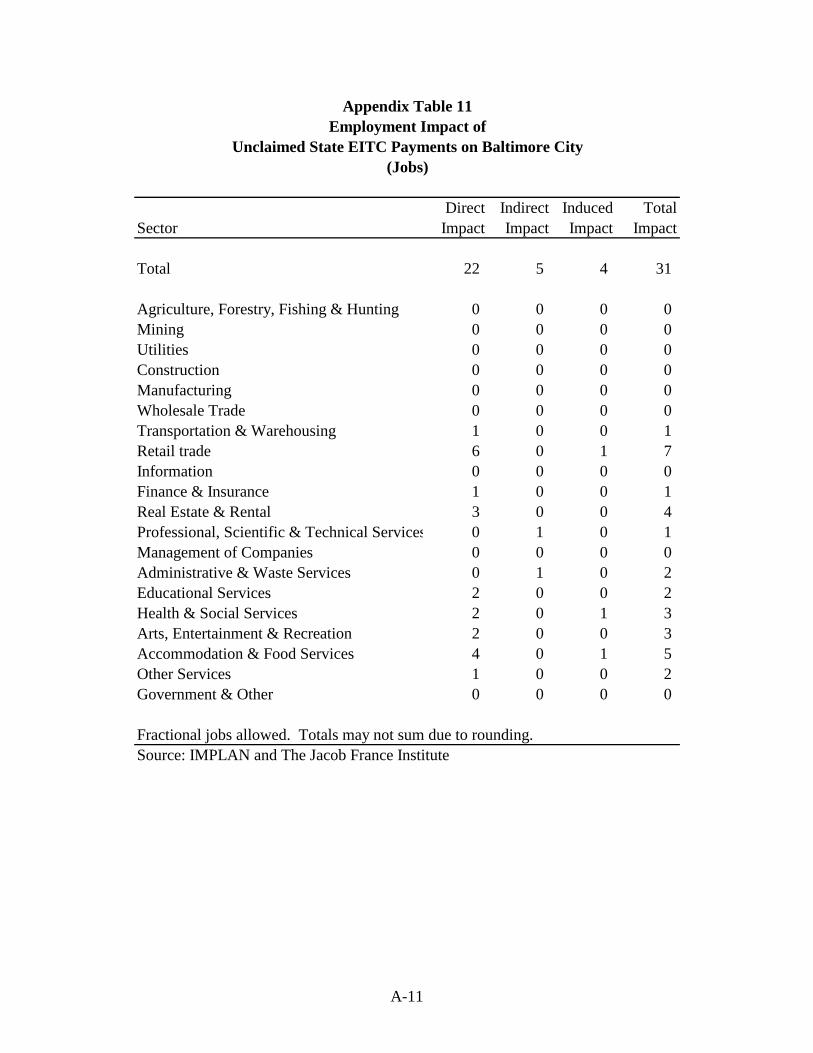
Total 22 5 4 31
Agriculture, Forestry, Fishing & Hunting 0 0 0 0Mining 0 0 0 0Utilities 0 0 0 0Construction 0 0 0 0Manufacturing 0 0 0 0Wholesale Trade 0 0 0 0Transportation & Warehousing 1 0 0 1Retail trade 6 0 1 7Information 0 0 0 0Finance & Insurance 1 0 0 1Real Estate & Rental 3 0 0 4Professional, Scientific & Technical Services 0 1 0 1Management of Companies 0 0 0 0Administrative & Waste Services 0 1 0 2Educational Services 2 0 0 2Health & Social Services 2 0 1 3Arts, Entertainment & Recreation 2 0 0 3Accommodation & Food Services 4 0 1 5Other Services 1 0 0 2Government & Other 0 0 0 0
Fractional jobs allowed. Totals may not sum due to rounding.Source: IMPLAN and The Jacob France Institute
(Jobs)
Employment Impact ofAppendix Table 11
Unclaimed State EITC Payments on Baltimore City
A-11

Direct Indirect Induced TotalSector Impact Impact Impact Impact
Total $596,216 $177,169 $134,896 $908,281
Agriculture, Forestry, Fishing & Hunting $0 $13 $1 $14Mining $0 $0 $0 $0Utilities $25,771 $3,078 $1,366 $30,216Construction $0 $6,551 $803 $7,354Manufacturing $0 $7,938 $4,750 $12,687Wholesale Trade $0 $8,290 $7,865 $16,155Transportation & Warehousing $7,350 $10,275 $4,489 $22,114Retail trade $149,141 $4,963 $15,477 $169,580Information $0 $10,152 $3,464 $13,616Finance & Insurance $42,835 $14,942 $12,401 $70,178Real Estate & Rental $64,984 $9,266 $3,299 $77,550Professional, Scientific & Technical Services $0 $37,204 $9,633 $46,838Management of Companies $0 $3,350 $628 $3,978Administrative & Waste Services $0 $34,373 $5,407 $39,780Educational Services $70,993 $8,883 $5,464 $85,340Health & Social Services $99,141 $593 $35,566 $135,300Arts, Entertainment & Recreation $58,745 $4,309 $3,560 $66,614Accommodation & Food Services $58,979 $4,496 $9,082 $72,558Other Services $18,277 $4,602 $8,854 $31,733Government & Other $0 $3,890 $2,785 $6,675
Source: IMPLAN and The Jacob France Institute
(Dollars)Unclaimed State EITC Payments on Baltimore City
Employment Compensation Impact ofAppendix Table 12
A-12

For more information contact:
Merrick School of Business The University of Baltimore
1420 N. Charles Street Baltimore, Maryland 21201
www.ubalt.edu/jfi (410) 837-4727