the importance of ship log data: reconstructing north atlantic
TRANSCRIPT

The importance of ship log data: reconstructing North Atlantic,European and Mediterranean sea level pressure fieldsback to 1750
M. Kuttel Æ E. Xoplaki Æ D. Gallego Æ J. Luterbacher ÆR. Garcıa-Herrera Æ R. Allan Æ M. Barriendos ÆP. D. Jones Æ D. Wheeler Æ H. Wanner
Received: 5 November 2008 / Accepted: 28 January 2009 / Published online: 28 April 2009
� Springer-Verlag 2009
Abstract Local to regional climate anomalies are to a
large extent determined by the state of the atmospheric
circulation. The knowledge of large-scale sea level pressure
(SLP) variations in former times is therefore crucial when
addressing past climate changes across Europe and the
Mediterranean. However, currently available SLP recon-
structions lack data from the ocean, particularly in the pre-
1850 period. Here we present a new statistically-derived
5� 9 5� resolved gridded seasonal SLP dataset covering the
eastern North Atlantic, Europe and the Mediterranean area
(40�W–50�E; 20�N–70�N) back to 1750 using terrestrial
instrumental pressure series and marine wind information
from ship logbooks. For the period 1750–1850, the new
SLP reconstruction provides a more accurate representation
of the strength of the winter westerlies as well as the
location and variability of the Azores High than currently
available multiproxy pressure field reconstructions. These
findings strongly support the potential of ship logbooks as
an important source to determine past circulation variations
especially for the pre-1850 period. This new dataset can be
further used for dynamical studies relating large-scale
atmospheric circulation to temperature and precipitation
variability over the Mediterranean and Eurasia, for the
comparison with outputs from GCMs as well as for detec-
tion and attribution studies.
Keywords Sea level pressure � Climate field
reconstructions � Logbooks � Instrumental pressure series �Europe � Principal component regressionElectronic supplementary material The online version of this
article (doi:10.1007/s00382-009-0577-9) contains supplementarymaterial, which is available to authorized users.
M. Kuttel (&) � E. Xoplaki � J. Luterbacher � H. Wanner
Oeschger Centre for Climate Change Research (OCCR),
and Institute of Geography, Climatology and Meteorology,
University of Bern, Hallerstrasse 12, 3012 Bern, Switzerland
e-mail: [email protected]
E. Xoplaki
The Cyprus Institute, EEWRC, Nicosia, Cyprus
D. Gallego
Departamento de Sistemas Fısicos, Quımicos y Naturales,
Universidad Pablo de Olavide de Sevilla, 41013 Sevilla, Spain
J. Luterbacher
Department of Geography, Climatology, Climate Dynamics
and Climate Change, Justus-Liebig University of Giessen,
Giessen, Germany
R. Garcıa-Herrera
Departamento de Fısica de la Tierra II, Facultad de CC Fısicas,
Universidad Complutense de Madrid, 28040 Madrid, Spain
R. Allan
Met Office Hadley Centre, Exeter EX1 3PB, UK
M. Barriendos
Department of Modern History, University of Barcelona,
08001 Barcelona, Spain
P. D. Jones
Climatic Research Unit, School of Environmental Sciences,
University of East Anglia, Norwich NR4 7TJ, UK
D. Wheeler
Faculty of Applied Sciences, University of Sunderland,
Sunderland SR1 3PZ, UK
123
Clim Dyn (2010) 34:1115–1128
DOI 10.1007/s00382-009-0577-9

1 Introduction
Climate variability at local to regional scales is to a large
extent driven by advective and convective processes
exerted by the atmospheric circulation (e.g. Namias 1948;
Trenberth 1990, 1995; Xu 1993; Hurrell 1995; Jacobeit
et al. 2001; Slonosky et al. 2001; Slonosky and Yiou 2002;
Xoplaki et al. 2004; Matti et al. 2009). These atmospheric
processes are connected with quasi-stationary patterns of
climate variability such as the North Atlantic Oscillation
(NAO) related to typical temperature and precipitation
patterns in Europe (e.g. Hurrell 1995; Hurrell and van Loon
1997; Wanner et al. 2001). However, these modes explain
only parts of the climate variability over a defined region
because they are also affected by spatial and temporal non-
stationary behaviour (e.g. Casty et al. 2005a; Raible et al.
2006). For example, the pronounced European cold period
of the Late Maunder Minimum (LMM, 1675–1715) coin-
cided with a strong and persistent negative NAO phase
(e.g. Luterbacher et al. 1999, 2001; Raible et al. 2006) as
well as recurrent blocking conditions over Europe (e.g.
Luterbacher et al. 2001; Shindell et al. 2001; Xoplaki et al.
2001). More recently, the prolonged winter drought in the
Mediterranean region since the early 1960s has been
attributed to different circulation states and can only partly
be explained by single teleconnection patterns (e.g.
Dunkeloh and Jacobeit 2003; Xoplaki et al. 2004; Paredes
et al. 2006).
Gridded data sets of the atmospheric circulation over
larger geographical areas provide more internally consis-
tent and spatially coherent insights into climatic variability
than (univariate) circulation indices (e.g. the NAO).
Moreover, these spatial reconstructions can be compared
with model-generated sea level pressure (SLP) fields of
forced (external and internal) and natural variability over
the last centuries. Additionally, large-scale gridded SLP
fields are necessary to study both, low- and high-frequency
variability of the atmospheric circulation (Jones et al. 1999;
Luterbacher et al. 2002). Efforts to explore, digitize, and
homogenize instrumental pressure records covering the last
few centuries (e.g. Jones et al. 1999; Slonosky et al. 1999;
Rodrıguez et al. 2001; Barriendos et al. 2002, 2009;
Bergstrom and Moberg 2002; Maugeri et al. 2002a, b,
2004; Moberg et al. 2002; Allan and Ansell 2006; Ansell
et al. 2006) have recently culminated in two papers pro-
ducing 5� 9 5� gridded SLP reanalyses of daily resolution
for Europe (Ansell et al. 2006) and on a monthly basis for
the entire globe (Allan and Ansell 2006), going back to
1850 using both terrestrial and marine observations. Other
gridded data sets of atmospheric circulation covering the
North Atlantic, Europe and the Mediterranean are generally
based on terrestrial pressure observations (e.g. Jones et al.
1999; Luterbacher et al. 2002; Casty et al. 2007). Only a
small number of stations from islands in the North Atlantic
have been included such as Ponta Delgada and Funchal,
both starting in the mid-nineteenth century and Reykjavık,
starting in 1821 (Jones et al. 1999). Although, and parti-
cularly for Europe, some very long terrestrial pressure
series reaching back to the early eighteenth century have
recently become available, indirect information from proxy
data are mostly used to obtain gridded data sets of the
large-scale atmospheric circulation further back in time
(e.g. Gordon et al. 1985; Briffa et al. 1986, 1987; Villalba
et al. 1997; Luterbacher et al. 2000, 2002). However, cir-
culation variability can only be estimated indirectly from
proxy data by parameters influenced by climate. For
example, the commonly used documentary data either
describe a weather phenomenon (e.g. the freezing of lakes),
impacts of climate on societies (e.g. famines, rogation
ceremonies) or the environment (e.g. historical harvest
dates, phenological records; Brazdil et al. 2005 and refer-
ences therein). Other proxy information stem from natural
sources such as tree rings, whose growth is determined
primarily by temperature and/or precipitation. Since the
climate signal of interest (commonly temperature or pre-
cipitation) is therefore only recorded indirectly in the
various proxies, and the available proxy networks rapidly
reduce back in time, there are major noise and reduced
variance problems, adding uncertainty to reconstructions of
past climate (e.g. von Storch and Zorita 2005; Ammann
and Wahl 2007; Kuttel et al. 2007; Mann et al. 2007;
Riedwyl et al. 2009; von Storch et al. 2009).
Currently available SLP reconstructions covering the
last few centuries suffer from either, or both, of two major
limitations: first, they represent the marine regions poorly,
as they miss information from the open ocean, particularly
in the pre-1850 period. Therefore, the ability to adequately
represent the position and strength of the Azores High and
the Icelandic Low and, by interference, to interpret their
control over the weather and climate downstream is rather
limited. Second, they usually share common predictors
with temperature and precipitation reconstructions from the
same areas. This leads to circular reasoning in dynamical
studies relating past and current changes in temperature
and precipitation to the state of the atmosphere (e.g. Casty
et al. 2007). Thus, there is a necessity to construct longer
gridded data sets combining (instrumental) data from the
continent and the ocean to better understand the inter-
annual-to-multidecadal circulation variability over the
Northern Atlantic and Eurasia.
Recently, the CLIWOC project (e.g. Garcıa-Herrera
et al. 2005a) made significant efforts to improve the
available database over the ocean by exploring and digi-
tizing a large number of ship logbooks from the colonial
powers of Europe. This new marine database draws almost
exclusively on non-instrumental observations and contains
1116 M. Kuttel et al.: The importance of ship log data
123
the wind direction as well as written descriptions of the
wind force concentrated mostly along the trading routes of
the European colonial powers. Apart from pressure series,
wind information provides the most direct information of
large-scale atmospheric circulation and is therefore supe-
rior to indirect information from other proxy data described
above. Wind information derived from CLIWOC has
demonstrated its potential to improve the reconstruction
skill over the open sea, overcoming one of the major
limitations of existing SLP reconstructions (e.g. Gallego
et al. 2005; Jones and Salmon 2005). In addition, CLIWOC
wind data have not been used in any temperature or pre-
cipitation reconstructions, therefore also overcoming the
issue of circular reasoning in dynamical studies.
For the first time this study uses terrestrial, instrumental
pressure series and maritime wind information derived
from ship logbook data to reconstruct 5� 9 5� resolved
seasonal large-scale atmospheric circulation fields over the
North Atlantic, European and Mediterranean region for the
period 1750–2002. These two complementary predictor
datasets provide the possibility of capturing more ade-
quately than previously the SLP variability over the North
Atlantic during the period before the instrumental pressure
measurements in Iceland (Reykjavık, 1821) and Madeira
(Funchal, 1850) became available. Furthermore, the inde-
pendence of this new SLP reconstruction to European
temperature (Luterbacher et al. 2004, 2007; Xoplaki et al.
2005) and precipitation (Pauling et al. 2006) reconstruc-
tions, allows the assessment of the driving atmospheric
patterns behind recent and past European climate anoma-
lies (Xoplaki et al., in preparation).
This study is structured as follows: Section 2 describes
the data used with particular focus on its spatial and tem-
poral availability. It also presents the data pre-processing
and the applied reconstruction methodology. Section 3
highlights the importance of ship logbook data for the
reconstruction of past SLP fields over the North Atlantic/
European area by focusing on the SLP reconstructions
obtained for three sample years with distinctively different
climatic settings and data availabilities. Furthermore, the
new SLP reconstruction data set is compared with an
existing multiproxy dataset by Luterbacher et al. (2002)
and single instrumental pressure series not included in the
reconstruction. Finally, Sect. 4 summarizes the major
points and provides an outlook on the potential value of the
data preserved within the many thousands of yet-to-be-
digitised log and remark books.
2 Data and methods
Combined information from long terrestrial instrumental
pressure series with wind direction and wind strength
derived from ship logbook data were used to statistically
reconstruct seasonal SLP fields covering the North Atlan-
tic, Europe and the Mediterranean area back to 1750.
2.1 Data
2.1.1 Instrumental pressure series
Instrumental pressure series from continental Europe, Ice-
land, the Faroe Islands, the Azores, Madeira, Greenland
and North America were used and averaged to seasonal
mean values. These are basically those used by Jones et al.
(1999) and Luterbacher et al. (2002) with a few additional
records (see supplementary online Table 1 for a detailed
overview). Terrestrial instrumental pressure series from the
North Atlantic only become available from 1821 (Rey-
kjavık, Iceland), 1850 (Funchal, Madeira), 1865 (Ponta
Delgada, Azores), and 1867 (Torshavn, Faroe Islands). All
records have been quality-checked and homogenized if
necessary, using the methodology described in Caussinus
and Mestre (2004).
2.1.2 Wind information derived from ship logbooks
The keeping of logbooks was a duty of the ship officers
from the early days of naval exploration and trading.
Besides the importance of having a logbook to keep track
of the sailing route, the crew, and food on board, the proper
maintenance of logbooks was in some nations of financial
importance. For example in the UK, only when handing in
these logbooks to the Admiralty were the officers usually
rewarded with their earnings (Wilkinson 2005). It is
therefore of no surprise that the libraries and archives of the
former colonial powers of Europe are filled with numerous
logbooks containing the records of the travels to the col-
onies in the Indies, the Americas and Africa (e.g. Garcıa-
Herrera et al. 2005b). The exploration of logbooks as a
socio- as well as climate-historical source has a long tra-
dition (e.g. Wheeler 1987; Woodruff et al. 1987; Cheno-
weth 1996; Wilkinson 2005; Worley et al. 2005; Wheeler
and Suarez-Dominguez 2006; Wheeler and Garcıa-Herrera
2008; Wheeler et al. 2009). However, only the CLIWOC
project (http://www.knmi.nl/cliwoc/) has successfully
combined the efforts of European countries (UK, Spain,
Netherlands) to obtain a climatological database for the
world’s oceans for the period 1750–1855 with some very
sparse additional data from as early as 1662 (Garcıa-Her-
rera et al. 2005a).
The CLIWOC records used in this study, usually taken
at local noon, contain besides a variety of other information
(see Garcıa-Herrera et al. 2005b; Wilkinson 2005 for
more details) the date and the ship’s geographical position.
The longitudes, in those days usually determined by
M. Kuttel et al.: The importance of ship log data 1117
123
dead-reckoning, were corrected by CLIWOC to present-
day coordinates, i.e. to deviations from the Greenwich
meridian (Konnen and Koek 2005). Furthermore, and of
most interest for climatological studies, the logbooks also
contain information on the wind direction (usually mea-
sured on a 16- or 32-point compass; Wheeler 2005) as well
as descriptions of the effects of wind speed on either the
sails (primarily Dutch records; Koek and Konnen 2005) or
the sea. The descriptive wind speed terms of 99% of all
records could be matched with the descriptions of the
numerical Beaufort scale, which was formally adopted in
the UK only in 1836 (Garcıa-Herrera et al. 2005a; Koek
and Konnen 2005; Prieto et al. 2005; Wheeler and Wil-
kinson 2005). Therefore, the CLIWOC dataset includes
numerical values for the wind direction as well as for wind
speed. For more details on the data pre-processing per-
formed within CLIWOC we refer to Garcıa-Herrera et al.
(2005a) and references therein. Wheeler (2005) investi-
gated the quality of these wind data by comparing records
from vessels sailing in convoys and found them to be very
reliable.
The current version 2.1 of the CLIWOC dataset contains
a total of 281,920 records with a particularly high coverage
in the North and South Atlantic and along the trading
routes to the West Indies. The database covers the years
1662–1855 with 1750–1855 representing 99.6% of all
available data. Therefore, only the latter period was con-
sidered here. Furthermore, we focused solely on the wider
North Atlantic area (100�W–50�E and 0�–90�N) where the
highest data density is found, since all routes to the colo-
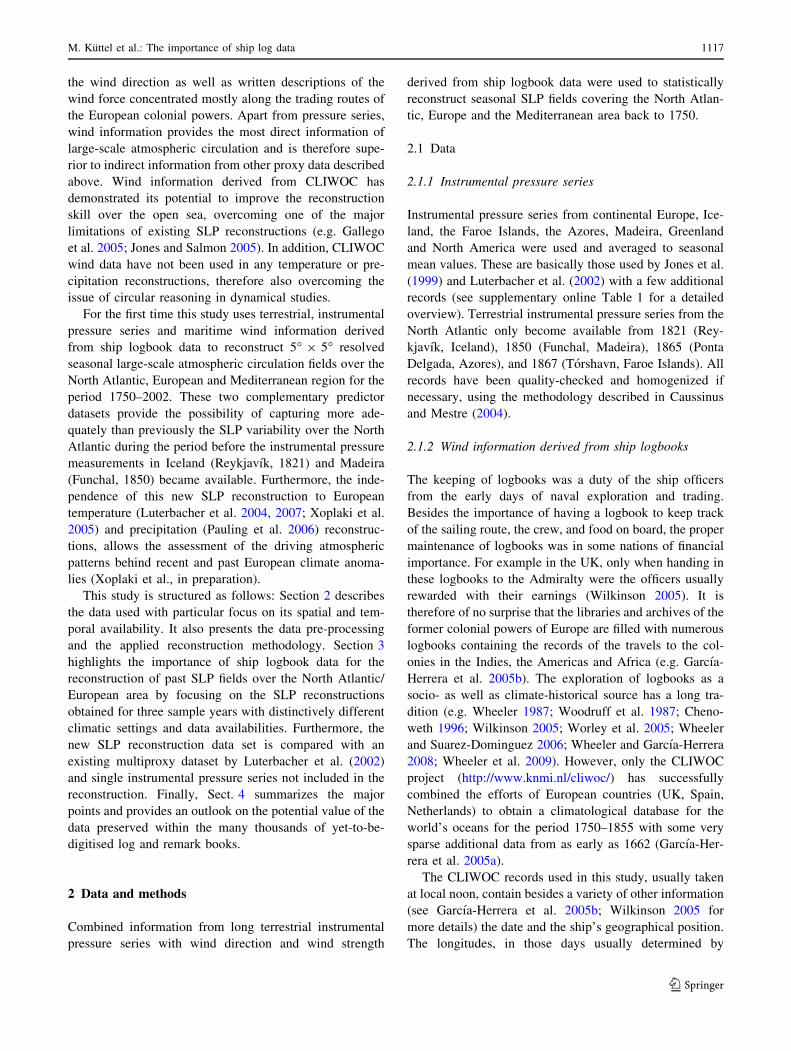
nies passed through this region (Fig. 1, left panel). A total
of 161,726 records are available for this area covering the
period 1750–1855. Only records providing complete
information on date, location, wind direction, and wind
speed were used, reducing the total to 119,118 records.
Similar to Gallego et al. (2005) and Jones and Salmon
(2005) the data were aggregated and averaged over sea-
sonally resolved 8� 9 8� grid boxes in order to ensure a
high enough data density containing meaningful wind
information (see Fig. 1, left panel).
CLIWOC data are only available until 1855. To establish
regression models with the gridded instrumental SLP fields
by Allan and Ansell (2006), wind information up to the year
2002 is necessary (see Sect. 2.3 for methodical details). For
this purpose, the marine wind information from the ICO-
ADS database version 2.4 (Worley et al. 2005) that spans
the period 1784–2007, was used. As shown in Fig. 1 (right
panel), ICOADS contains a larger number of records over
the greater North Atlantic area only after 1850, then how-
ever significantly by a factor of up to more than 100 (note
the logarithmic scale). Therefore, CLIWOC (1750–1849)
and ICOADS (1850–2002), were aggregated and averaged
over 8� 9 8� grid boxes and transformed into the u and v
vector components of the wind. These were then combined
with the instrumental pressure series and used as predictor
data (independent variable).
2.2 Data pre-processing
Using the spatially sparsely and temporally highly variable
distributed wind information from CLIWOC and combi-
ning these data with the more widely available ICOADS
dataset yields some methodical challenges which are
addressed next.
Figure 1 (right panel) depicts the large inter-annual
variability in the number of CLIWOC records with a
minimum availability in the early nineteenth century dur-
ing the Napoleonic Wars. Additionally, the number of
Fig. 1 Left location of CLIWOC records (black dots) for the period
1750–1855. The grey dashed grid indicates the 8� 9 8� grid boxes
over which the CLIWOC data were averaged. Right annual number of
records from CLIWOC (black columns) and ICOADS (grey columns)
1662–2002 over the North Atlantic (100�W–50�E and 0�–90�N).
Note the logarithmic scale of the number of records
1118 M. Kuttel et al.: The importance of ship log data
123

records aggregated over 8� 9 8� grid boxes is spatially
variable with few records north of 60�N but many records
in the English Channel and along the Northwestern African
and the Iberian coasts (see also Fig. 1 in the supplementary
online material). This means that the true wind conditions
may be assumed to be well captured by the available
records at a specific grid box during a particular year, while
the noise component due to undersampling might be
important at other locations and times. In order to address
this issue, we included of each 8� 9 8� grid box and season
only the years where at least three records were available.
This somewhat subjective criterion is a compromise
between including as many grid boxes as possible and
increasing the signal-to-noise ratio of the wind information
as much as possible. Other thresholds were also tested,
however, this did not improve the final results in terms of
resolved variance in the reconstruction (not shown). As can
be seen in Figure 2 in the supplementary online material,
the true temporal evolution—but not the variability—of the
wind vectors can be well captured by as few as three
records.
Combining CLIWOC and ICOADS data yielded another
methodical challenge. As shown in Fig. 1 (right panel),
there are many more records available over the North
Atlantic during the ICOADS period (1850–2002) than
during the CLIWOC period (1750–1849). Therefore, the
noise component at an 8� 9 8� grid box might be assumed
to be lower during the ICOADS than the CLIWOC period,
i.e. the time series of wind direction and wind speed at a
particular 8� 9 8� grid box would probably have the same
expectation value but not the same standard deviation at all
time steps over the period 1750–2002, violating the sta-
tionarity assumption (e.g. Wilks 2005). In the reconstruc-
tion methodology used in this study (multivariate principal
component regression, see Sect. 2.3), stationarity of the
data is however required, since the regression models were
derived during the 1887–2002 ICOADS period (when all
instrumental pressure series are available, see Sect. 2.3),
and thereafter applied to the CLIWOC/ICOADS data in the
1750–1886 period. Failure to address this problem would
firstly lead to a reconstruction with an increased variability
during the period 1750–1886 (since the applied transfer
functions are based on data with a lower variability than the
pre-instrumental data on which the functions are applied
to), and secondly to inflated skill values (in this case
Reduction of Error; Cook et al. 1994), since they are
determined within the 1887–2002 calibration period using
the ICOADS data of much better coverage than CLIWOC
(see Sect. 2.3 for methodical details). To overcome this
problem, we degraded the ICOADS data by randomly
sampling the full ICOADS dataset available for each
8� 9 8� grid box according to the average number of
records making up the seasonal mean of a particular grid
box during the CLIWOC period (see Fig. 1 in the supple-
mentary online material for details). To reduce the
dependence on the sampling itself, and thus preventing
adding further noise to the reconstruction, the median of
five sampling iterations was calculated (see Fig. 2 in the
supplementary online material).
Figure 2 presents the combined seasonal predictor net-
work along with the ratio of the number of CLIWOC/I-
COADS grid boxes and instrumental pressure series
available over time. Prior to 1800, the majority of predic-
tors stems from logbooks, while the number of instru-
mental series rapidly increases afterwards.
2.3 Reconstruction methodology
Multivariate principal component regression was used to
reconstruct 5� 9 5� resolved seasonal mean SLP fields for
1750 1800 1850 1900 1950 2000
0.0
0.2
0.4
0.6
0.8
WINTERSPRINGSUMMERAUTUMN
Year
90W 70W 50W 30W 10W 10E 30E 50E 70E 90E
0
10N
20N
30N
40N
50N
60N
70N
80N
< 1750< 1800< 1850> 1850 R
AT
IO C
LIW
OC
/ICO
AD
S T
O
INS
TR
UM
EN
TA
L P
RE
DIC
TO
RS
Fig. 2 Left complete predictor network used to reconstruct seasonal
North Atlantic, European and Mediterranean SLP fields 1750–2002.
The blue shaded grid boxes are the 8� 9 8� aggregated and averaged
wind information derived from ship logbooks while the dots represent
the terrestrial instrumental pressure series with the colours giving the
starting years of the series. Right ratio of the seasonal number of
CLIWOC/ICOADS grid boxes and instrumental predictors, 1750–
2002
M. Kuttel et al.: The importance of ship log data 1119
123
the North Atlantic, European and Mediterranean area back
to 1750. The same approach was used in various recent
atmospheric circulation field reconstructions (e.g. Jones
et al. 1999; Luterbacher et al. 2002; Gallego et al. 2005;
Casty et al. 2007). For a detailed description of the
reconstruction methodology we refer to Luterbacher et al.
(2002). As predictand the seasonally averaged, 5� 9 5�gridded instrumental SLP dataset HadSLP2 by Allan and
Ansell (2006) was used, covering the period 1850–2004.
To separate the dominant spatial patterns of variability
from unnecessary details and noise, empirical orthogonal
functions (EOFs) of the predictors as well as the predict-
ands were calculated. We tested different levels of EOF
truncations, finally considering the n EOFs accounting for
75% (90%) of the total variance of the predictor (predict-
and) data, yielding in terms of reconstructed mean, stan-
dard deviation and skill scores the best results (not shown).
Compared to other SLP reconstructions (e.g. Luterbacher
et al. 2002), the truncation level of 75% for the predictor
data is rather low. However, the truncation level is known
to depend strongly on the nature of the input data (e.g.
Livezey and Smith 1999; von Storch and Zwiers 1999;
Schmutz et al. 2001). We suggest that the truncation level
is in our case strongly influenced by the noise component
in the ship logbook based 8� 9 8� grid boxes (due to the
partly low number of available records), as well as by the
large number of predictors (see Sect. 2.2). The calibration
with the predictor data (ship logbook and instrumental
records) was performed over the period 1887–2002 where
all instrumental series are available. The performance of
the statistical reconstruction was determined by calculating
the commonly used Reduction of Error (RE) skill scores
(Cook et al. 1994) using two-thirds (1887–1964) of the
overlapping period 1887-2002 for calibration and the
remaining one-third of the data (1965–2002) for verifica-
tion. RE ranges from -? to ?1, with 1 indicating that the
reconstruction agrees perfectly with the independent SLP
field of the predictand during the verification period. A
value of 0 means that the reconstruction is as good as
climatology, while negative RE scores denote that the
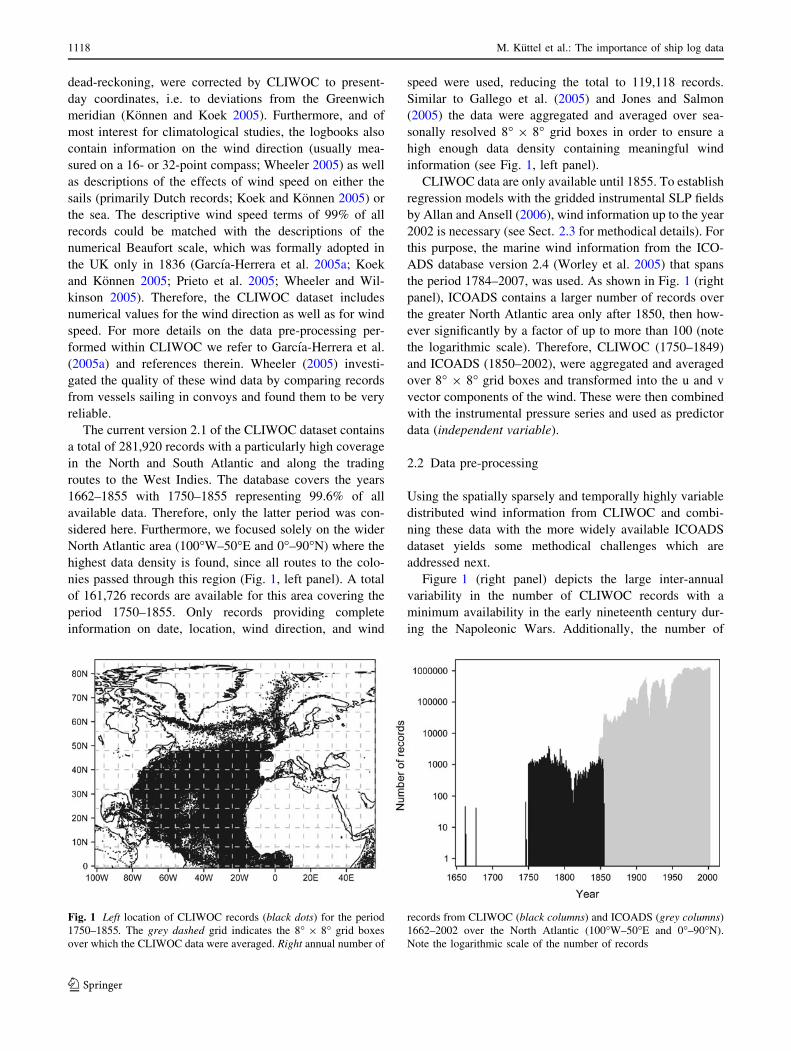
reconstruction contains no meaningful information. Fig-
ure 3 gives an overview of the data pre-processing and
reconstruction methodology applied in this study.
3 Results and discussion
The overall quality of the reconstructions is first assessed
by RE skill measurements. The SLP reconstructions for
three selected winters are then presented and discussed.
CLIWOC 2.11750 - 1849
ICOADS1850 - 2002
INSTRUMENTALS1750 - 2002
quality checkand homogenize
if necessary
select only yearswith at least
three records
sample accordingto the number of
records in CLIWOC
combine to predictor
1750 - 2002
RAW DATA QUALITY ADJUSTMENT
HadSLP21887 - 2002
PR
ED
ICTO
R D
ATA
PR
ED
ICTA
ND
Wind Information
Air Pressure
PC regression 1887-2002
RECONSTRUCTIONCALIBRATION
apply models to predictors 1750-1886
Fig. 3 Scheme for the data pre-processing and reconstruction
methodology applied to reconstruct seasonal North Atlantic, Euro-
pean and Mediterranean SLP fields back to 1750. The predictor data
(wind information derived from logbooks, blue and instrumental
pressure series, red) were pre-processed to assure reliable recon-
structions. For details on the pre-processing refer to the text. The
predictor and predictand (HadSLP2, Allan and Ansell 2006) were
related to each other during the calibration period 1887–2002 using
ordinary least square regression of the leading EOFs, with the derived
transfer functions later applied to the predictor data in the period
1750–1886
1120 M. Kuttel et al.: The importance of ship log data
123
In order to detect whether the reconstructions capture the
variability of the major centres of atmospheric circulation,
the reconstructed time series of SLP near the Azores as
well as Iceland along with the RE skill scores are shown.
Finally, this reconstruction is compared to the one by
Luterbacher et al. (2002) and independent pressure series.
3.1 Overall model performance
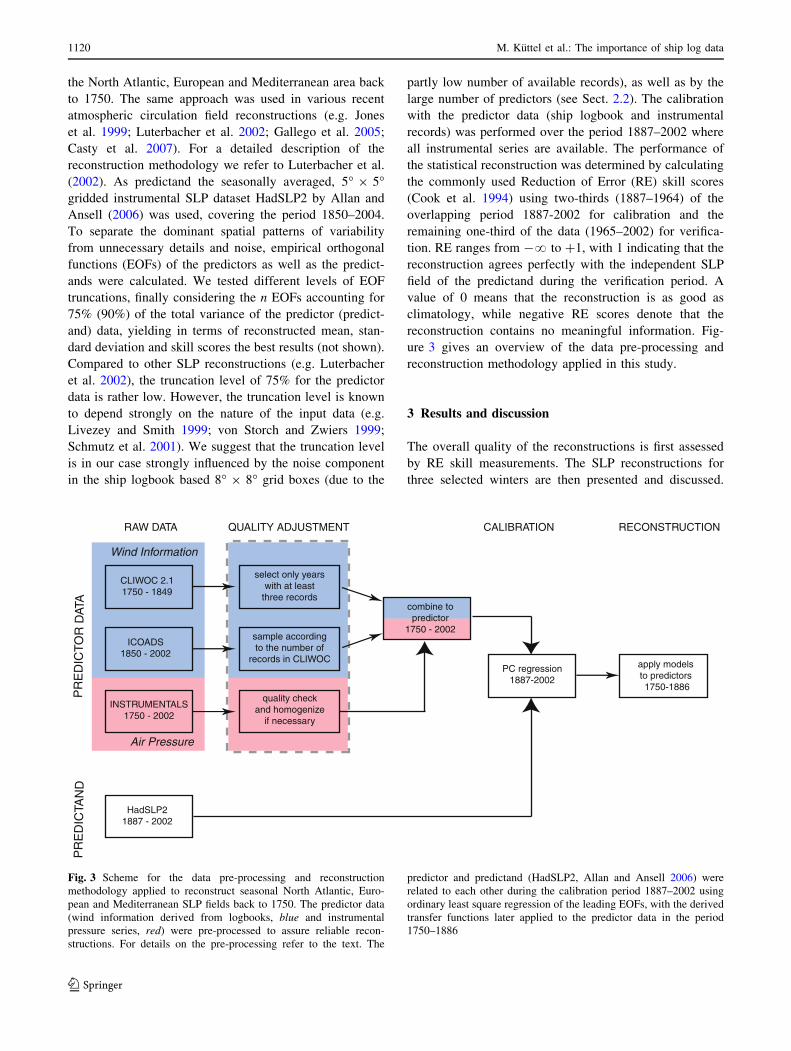
Figure 4 presents the performance of the seasonal recon-
structions expressed as RE scores averaged over three sub-
regions (northeastern and southeastern North Atlantic and
continental Europe) as well as over the entire grid (40�W–
50�E and 20�N–70�N) covering the full 1750–2002 period.
The RE values generally increase from 1750 onwards
except for the early nineteenth century which can be
accounted for the low quantity of CLIWOC data abstracted
from logbooks from the time of the Napoleonic Wars.
Over continental Europe and all seasons very good
reconstruction skill is found. For the other regions, large
interseasonal differences are prevalent. Winter (DJF) SLP
is generally well captured while summer (JJA) SLP, par-
ticularly over the southeastern North Atlantic shows low
skill with some negative RE values. Summer is generally
the least well reconstructed season of the year (see also
Jones et al. 1999; Luterbacher et al. 2002; Gallego et al.
2005). The poor spatial performance during summer could
be attributed to the large-scale synoptic situation, which is
characterized by a generally dispersed circulation pattern
and small pressure gradients that cannot be explained by
the marine wind information available from the CLIWOC/
ICOADS data. In fact, the summer SLP reconstructions
over the southeasternmost North Atlantic are slightly better
when only terrestrial instrumental pressure series were used
as predictors (not shown). For the other seasons and
regions, the skill is always higher when CLIWOC data are
included. The transition seasons autumn (SON) and spring
(MAM) show intermediate skill, with RE skill scores well
above 0 (i.e. better than climatology) for all regions. As
shown in Fig. 4, the overall highest skill is found during
winter. This is mainly due to the well organized atmo-
spheric circulation during this season, allowing a good
1750
−0.5
0.0
0.5
1.0
Continental Europe Northeastern North Atlantic
Southeastern North Atlantic
Year
Entire Reconstruction Area
WinterSpringSummerAutumn
Red
uctio
n of
Err
or [R
E]
−0.5
0.0
0.5
1.0
−0.5
0.0
0.5
1.0
−0.5
0.0
0.5
1.0
1800 1850 1900 1950 2000
1750 1800 1850 1900 1950 2000 1750 1800 1850 1900 1950 2000
1750 1800 1850 1900 1950 2000
WinterSpringSummerAutumn
WinterSpringSummerAutumn
WinterSpringSummerAutumn
Fig. 4 Seasonal evolution of RE skill scores 1750–2002 averaged
over continental Europe (10�W–25�E and 40�N–60�N; top left panel),
the marine region of the northeastern North Atlantic (40�W–0� and
50�N–70�N; top right panel), the marine region of the southeastern
North Atlantic (40�W–0� and 20�N–45�N; bottom left panel), and for
the entire reconstruction area (40�W–50�E and 20�N–70�N; bottomright panel). Positive values indicate higher skill than climatology
M. Kuttel et al.: The importance of ship log data 1121
123
representation of the SLP field over the reconstruction area
even with a spatially and temporally limited predictor
network. We subsequently focus only on winter.
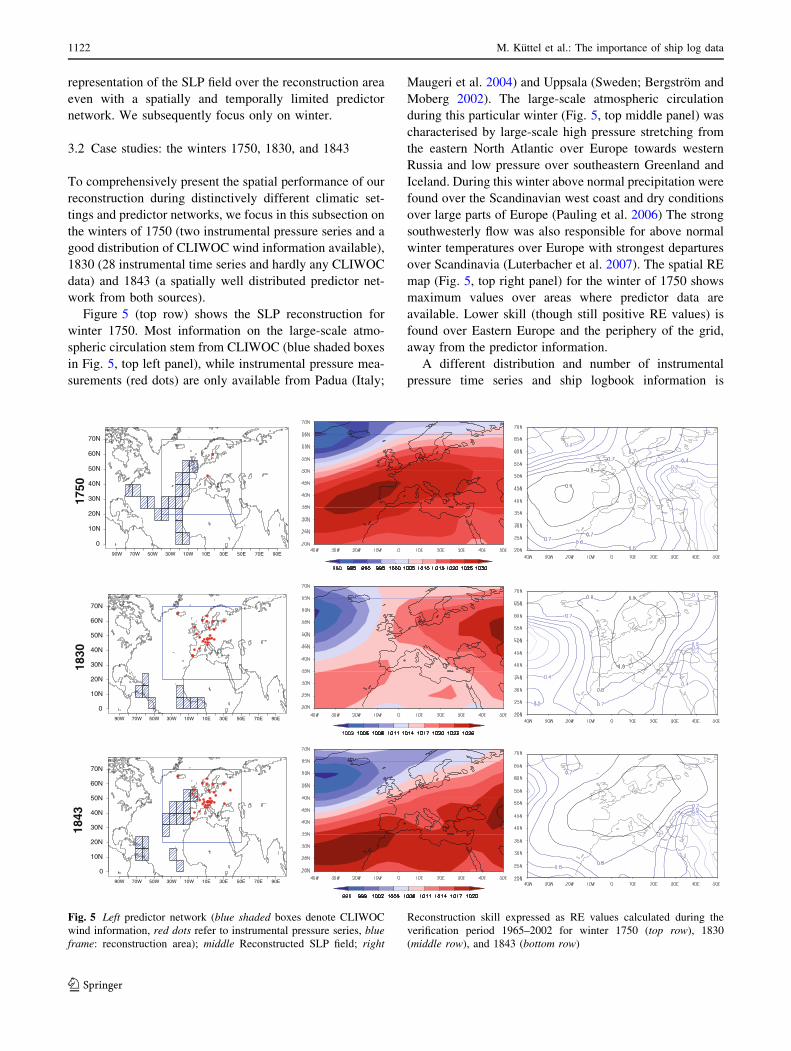
3.2 Case studies: the winters 1750, 1830, and 1843
To comprehensively present the spatial performance of our
reconstruction during distinctively different climatic set-
tings and predictor networks, we focus in this subsection on
the winters of 1750 (two instrumental pressure series and a
good distribution of CLIWOC wind information available),
1830 (28 instrumental time series and hardly any CLIWOC
data) and 1843 (a spatially well distributed predictor net-
work from both sources).
Figure 5 (top row) shows the SLP reconstruction for
winter 1750. Most information on the large-scale atmo-
spheric circulation stem from CLIWOC (blue shaded boxes
in Fig. 5, top left panel), while instrumental pressure mea-
surements (red dots) are only available from Padua (Italy;
Maugeri et al. 2004) and Uppsala (Sweden; Bergstrom and
Moberg 2002). The large-scale atmospheric circulation
during this particular winter (Fig. 5, top middle panel) was
characterised by large-scale high pressure stretching from
the eastern North Atlantic over Europe towards western
Russia and low pressure over southeastern Greenland and
Iceland. During this winter above normal precipitation were
found over the Scandinavian west coast and dry conditions
over large parts of Europe (Pauling et al. 2006) The strong
southwesterly flow was also responsible for above normal
winter temperatures over Europe with strongest departures
over Scandinavia (Luterbacher et al. 2007). The spatial RE
map (Fig. 5, top right panel) for the winter of 1750 shows
maximum values over areas where predictor data are
available. Lower skill (though still positive RE values) is
found over Eastern Europe and the periphery of the grid,
away from the predictor information.
A different distribution and number of instrumental
pressure time series and ship logbook information is
90W 70W 50W 30W 10W 10E 30E 50E 70E 90E
0
10N
20N
30N
40N
50N
60N
70N
90W 70W 50W 30W 10W 10E 30E 50E 70E 90E
0
10N
20N
30N
40N
50N
60N
70N
90W 70W 50W 30W 10W 10E 30E 50E 70E 90E
0
10N
20N
30N
40N
50N
60N
70N
1750
1830
1843
Fig. 5 Left predictor network (blue shaded boxes denote CLIWOC
wind information, red dots refer to instrumental pressure series, blueframe: reconstruction area); middle Reconstructed SLP field; right
Reconstruction skill expressed as RE values calculated during the
verification period 1965–2002 for winter 1750 (top row), 1830
(middle row), and 1843 (bottom row)
1122 M. Kuttel et al.: The importance of ship log data
123
available for the winter of 1830 (Fig. 5, middle row). The
reconstruction for this winter mostly relies on instrumental
pressure time series but hardly any information from
CLIWOC (Fig. 5, middle left panel). It shows a strong
Western Russian high (Fig. 5, centre). This strong blocking
was also found by Luterbacher et al. (2002). On the
southern flank of this continental anticyclone, cold air
advection led to a widespread European cooling (Luterb-
acher et al. 2007). This winter is well known as one of the
coldest European winters since 1500 (Luterbacher et al.
2004, 2007) and was likely the coldest alpine winter since
1500 (Casty et al. 2005b). Except for the northern part of
the Mediterranean this winter was very dry (Pauling et al.
2006). The lack of information from the North Atlantic is
reflected in the reduced skill values (Fig. 5, middle right)
with RE values in the range of 0.2–0.6. The correct rep-
resentation of the position and strength of the Azores High
and Icelandic Low is therefore limited. The skill over the
continent is generally very good.
As an example of a spatially well-distributed predictor
network over the sea and the continent, Fig. 5 (bottom row)
shows the SLP reconstruction and the spatial performance
for the winter of 1843. A strong gradient between the
Azores High and the Icelandic Low is found bringing warm
and humid southwesterly winds towards Europe. Indeed
the winter of 1843 was among the warmest European
winters in the period 1500–1900 (Luterbacher et al. 2004,
2007). Interestingly, this winter was one of the coldest in
the Midwest and Northeast US with a strong and persistent
blocking situation (Ludlum 1968; Rosendal 1970). The
spatially well distributed predictor network is clearly
reflected in the RE values (Fig. 5, bottom right) with values
well above 0.7 over almost the entire reconstruction area.
Lower values, though still positive, are found over the
southeastern part. This example, particularly in comparison
with the winter of 1830 (Fig. 5, middle row), where few
marine data are available, strongly underlines the com-
plementary nature of the marine (quasi-instrumental)
CLIWOC/ICOADS and terrestrial (instrumental) informa-
tion for past large-scale atmospheric circulation.
3.3 The reconstruction skill over the Azores
and Iceland
A key objective of this study is to improve the recon-
struction skill over the eastern North Atlantic, thereby
providing more reliable representations of the Azores High
and the Icelandic Low. Figure 5 indicated that the use of
CLIWOC information does indeed improve the recon-
struction skill over the entire North Atlantic. To emphasise
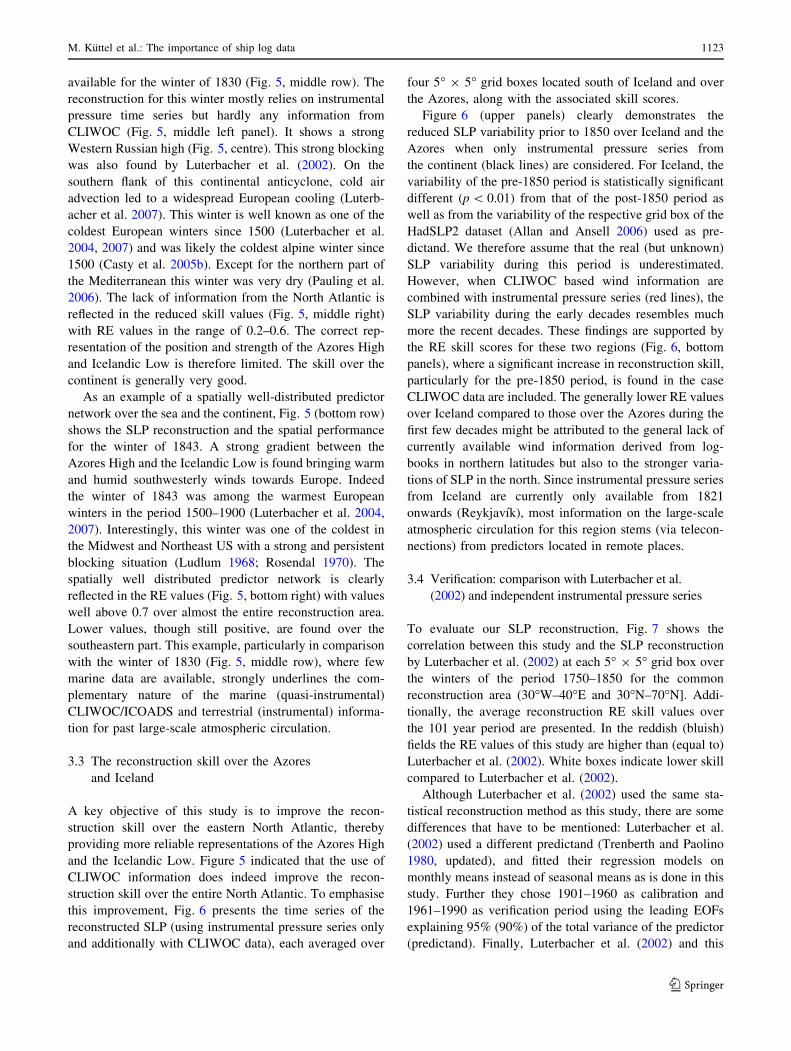
this improvement, Fig. 6 presents the time series of the
reconstructed SLP (using instrumental pressure series only
and additionally with CLIWOC data), each averaged over
four 5� 9 5� grid boxes located south of Iceland and over
the Azores, along with the associated skill scores.
Figure 6 (upper panels) clearly demonstrates the
reduced SLP variability prior to 1850 over Iceland and the
Azores when only instrumental pressure series from
the continent (black lines) are considered. For Iceland, the
variability of the pre-1850 period is statistically significant
different (p \ 0.01) from that of the post-1850 period as
well as from the variability of the respective grid box of the
HadSLP2 dataset (Allan and Ansell 2006) used as pre-
dictand. We therefore assume that the real (but unknown)
SLP variability during this period is underestimated.
However, when CLIWOC based wind information are
combined with instrumental pressure series (red lines), the
SLP variability during the early decades resembles much
more the recent decades. These findings are supported by
the RE skill scores for these two regions (Fig. 6, bottom
panels), where a significant increase in reconstruction skill,
particularly for the pre-1850 period, is found in the case
CLIWOC data are included. The generally lower RE values
over Iceland compared to those over the Azores during the
first few decades might be attributed to the general lack of
currently available wind information derived from log-
books in northern latitudes but also to the stronger varia-
tions of SLP in the north. Since instrumental pressure series
from Iceland are currently only available from 1821
onwards (Reykjavık), most information on the large-scale
atmospheric circulation for this region stems (via telecon-
nections) from predictors located in remote places.
3.4 Verification: comparison with Luterbacher et al.
(2002) and independent instrumental pressure series
To evaluate our SLP reconstruction, Fig. 7 shows the
correlation between this study and the SLP reconstruction
by Luterbacher et al. (2002) at each 5� 9 5� grid box over
the winters of the period 1750–1850 for the common
reconstruction area (30�W–40�E and 30�N–70�N]. Addi-
tionally, the average reconstruction RE skill values over
the 101 year period are presented. In the reddish (bluish)
fields the RE values of this study are higher than (equal to)
Luterbacher et al. (2002). White boxes indicate lower skill
compared to Luterbacher et al. (2002).
Although Luterbacher et al. (2002) used the same sta-
tistical reconstruction method as this study, there are some
differences that have to be mentioned: Luterbacher et al.
(2002) used a different predictand (Trenberth and Paolino
1980, updated), and fitted their regression models on
monthly means instead of seasonal means as is done in this
study. Further they chose 1901–1960 as calibration and
1961–1990 as verification period using the leading EOFs
explaining 95% (90%) of the total variance of the predictor
(predictand). Finally, Luterbacher et al. (2002) and this
M. Kuttel et al.: The importance of ship log data 1123
123
study are not completely independent since they share
some common information from terrestrial pressure series.
It might therefore not be surprising that the two recon-
structions share some common signals with correlation
values being mostly above 0.5, i.e. being statistically
highly significant (p \ 0.01). Focusing on the reconstruc-
tion skill (RE values in Fig. 7) over the period 1750–1850,
clear spatial differences are found: while the skill over
continental Europe is comparable, the new SLP recon-
struction clearly reveals higher RE values over the south-
eastern North Atlantic. This improved skill over the marine
region is not surprising, since Luterbacher et al. (2002) and
other North Atlantic SLP reconstructions lack data from
this area. Obviously, this limitation could partly be over-
come with the CLIWOC data used in this study. However,
the reconstruction skill of Luterbacher et al. (2002) is
higher over the northeastern North Atlantic. This might be
attributed to their inclusion of documentary data from
continental Europe (primarily Western Baltic Sea Ice Index
by Koslowski and Glaser 1999 and the reconstructed pre-
cipitation from Andalusia by Rodrigo et al. 1999) which
were found to contain very valuable information for the
entire reconstruction area (Luterbacher et al. 2002).
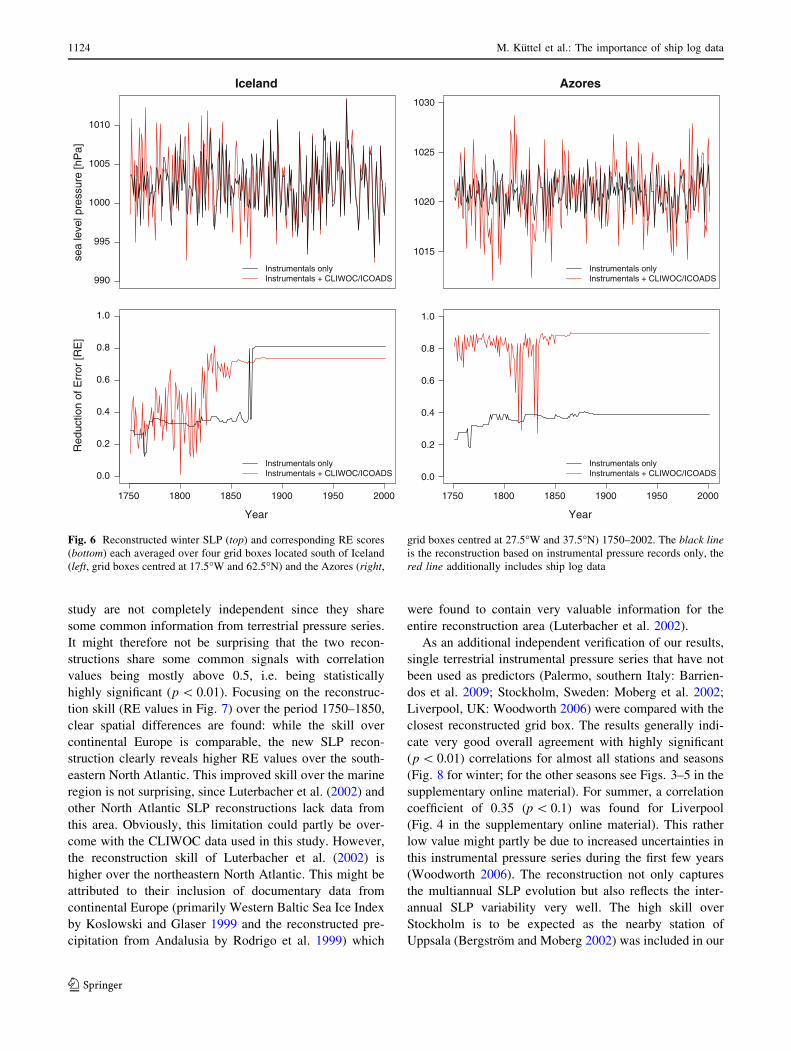
As an additional independent verification of our results,
single terrestrial instrumental pressure series that have not
been used as predictors (Palermo, southern Italy: Barrien-
dos et al. 2009; Stockholm, Sweden: Moberg et al. 2002;
Liverpool, UK: Woodworth 2006) were compared with the
closest reconstructed grid box. The results generally indi-
cate very good overall agreement with highly significant
(p \ 0.01) correlations for almost all stations and seasons
(Fig. 8 for winter; for the other seasons see Figs. 3–5 in the
supplementary online material). For summer, a correlation
coefficient of 0.35 (p \ 0.1) was found for Liverpool
(Fig. 4 in the supplementary online material). This rather
low value might partly be due to increased uncertainties in
this instrumental pressure series during the first few years
(Woodworth 2006). The reconstruction not only captures
the multiannual SLP evolution but also reflects the inter-
annual SLP variability very well. The high skill over
Stockholm is to be expected as the nearby station of
Uppsala (Bergstrom and Moberg 2002) was included in our
990
995
1000
1005
1010
Iceland
Instrumentals onlyInstrumentals + CLIWOC/ICOADS
1015
1020
1025
1030
Azores
Instrumentals onlyInstrumentals + CLIWOC/ICOADS
1750 1800 1850 1900 1950 2000
0.0
0.2
0.4
0.6
0.8
1.0
Year
Instrumentals onlyInstrumentals + CLIWOC/ICOADS
1750 1800 1850 1900 1950 2000
0.0
0.2
0.4
0.6
0.8
1.0
Year
Instrumentals onlyInstrumentals + CLIWOC/ICOADS
sea
leve
l pre
ssur
e [h
Pa]
Red
uctio
n of
Err
or [R
E]
Fig. 6 Reconstructed winter SLP (top) and corresponding RE scores
(bottom) each averaged over four grid boxes located south of Iceland
(left, grid boxes centred at 17.5�W and 62.5�N) and the Azores (right,
grid boxes centred at 27.5�W and 37.5�N) 1750–2002. The black lineis the reconstruction based on instrumental pressure records only, the
red line additionally includes ship log data
1124 M. Kuttel et al.: The importance of ship log data
123

reconstruction. The very good agreement for Liverpool
(Woodworth 2006) and Palermo (Barriendos et al. 2009)
however strongly confirms the high RE skill values
obtained for these regions over the entire 250-year period
(Fig. 4). The agreement over southern Italy is remarkable,
considering the fact that terrestrial instrumental pressure
measurements from this region only become available in
1852 with the series from Malta.
4 Conclusions and outlook
Combining North Atlantic wind information derived from
logbooks and instrumental pressure series from continental
Europe and adjacent regions, a 5� 9 5� gridded seasonally
resolved reconstruction of eastern North Atlantic, Euro-
pean and Mediterranean SLP fields back to 1750 has been
developed. The combined information from marine log-
books and terrestrial instrumental pressure series is sig-
nificantly improving previous SLP reconstructions, mainly
in winter over the southeastern North Atlantic. This is an
important finding as the location and strength of the Azores
High can now be estimated with higher precision. There-
fore, the influence of the Atlantic large-scale circulation on
European climate can be addressed more accurately. Since
this new reconstruction does not share any common pre-
dictors with existing temperature and precipitation recon-
structions, dynamical studies relating changes of European
and Mediterranean temperature and precipitation over
the past 250 years to the state of the atmosphere can be
performed without circular reasoning (Xoplaki et al., in
preparation).
The major challenge of using wind information derived
from logbooks as a source of past atmospheric circulation
is the high variability in their spatial and temporal avail-
ability. However, it was shown, that with appropriate data
pre-processing, this direct and marine source of the large-
scale atmospheric circulation contains very reliable infor-
mation, clearly superior to commonly used (terrestrial)
proxies as e.g. tree rings or ice cores. Most of the logbooks
in libraries and archives of the European colonial powers
and elsewhere have yet to be fully explored and digitised.
Only 5% of all British logbooks were included in the
CLIWOC project (Garcıa-Herrera et al. 2005a). Recover-
ing these data would have the potential to extend the quasi-
instrumental period of knowledge on the state of the
atmosphere to the early eighteenth century or even further
back in time, as was recently demonstrated by Wheeler
30W 20W 10W 0 10E 20E 30E 40E
30N
40N
50N
60N
70N 0.6 0.5/0.4
0.61 0.5/0.5
0.62 0.5/0.6
0.63 0.5/0.6
0.65 0.5/0.7
0.68 0.5/0.7
0.71 0.5/0.8
0.75 0.6/0.8
0.77 0.6/0.8
0.79 0.8/0.8
0.79 0.8/0.7
0.8 0.8/0.6
0.8 0.8/0.6
0.8 0.8/0.5
0.79 0.8/0.4
0.58 0.4/0.5
0.58 0.4/0.6
0.59 0.5/0.7
0.6 0.5/0.7
0.62 0.4/0.8
0.65 0.4/0.8
0.69 0.5/0.9
0.75 0.6/0.9
0.78 0.7/0.9
0.79 0.8/0.8
0.79 0.8/0.7
0.8 0.8/0.7
0.8 0.8/0.6
0.78 0.8/0.5
0.76 0.8/0.4
0.49 0.3/0.6
0.48 0.3/0.7
0.49 0.4/0.7
0.51 0.5/0.8
0.55 0.5/0.8
0.59 0.5/0.9
0.65 0.6/0.9
0.72 0.6/0.9
0.75 0.7/0.9
0.77 0.8/0.9
0.79 0.9/0.8
0.79 0.9/0.7
0.77 0.8/0.6
0.75 0.8/0.5
0.73 0.7/0.4
0.32 0.3/0.6
0.32 0.5/0.6
0.36 0.6/0.7
0.41 0.6/0.7
0.47 0.7/0.8
0.53 0.7/0.9
0.62 0.8/0.9
0.69 0.8/0.9
0.73 0.9/0.9
0.75 0.9/0.9
0.76 0.9/0.9
0.74 0.8/0.8
0.72 0.8/0.6
0.7 0.7/0.5
0.66 0.6/0.3
0.25 0.6/0.5
0.28 0.7/0.5
0.33 0.7/0.6
0.39 0.8/0.7
0.47 0.8/0.8
0.55 0.9/0.8
0.65 0.9/0.9
0.72 0.9/0.9
0.76 0.9/0.9
0.77 0.9/0.9
0.75 0.9/0.9
0.71 0.9/0.9
0.65 0.8/0.7
0.61 0.7/0.6
0.58 0.5/0.4
0.28 0.7/0.4
0.31 0.8/0.5
0.36 0.8/0.5
0.42 0.9/0.6
0.5 0.9/0.7
0.59 0.9/0.8
0.68 0.9/0.9
0.74 0.9/0.9
0.75 0.9/0.9
0.77 0.9/0.9
0.74 0.9/0.9
0.69 0.9/0.8
0.66 0.8/0.8
0.62 0.7/0.7
0.56 0.6/0.7
0.33 0.7/0.3
0.35 0.7/0.4
0.39 0.8/0.5
0.44 0.8/0.6
0.5 0.9/0.7
0.58 0.9/0.8
0.67 0.9/0.9
0.73 0.9/0.9
0.74 0.9/0.9
0.74 0.9/0.8
0.72 0.9/0.8
0.68 0.9/0.7
0.66 0.8/0.7
0.62 0.7/0.6
0.54 0.6/0.5
0.4 0.7/0.3
0.4 0.7/0.4
0.41 0.8/0.4
0.44 0.8/0.5
0.49 0.8/0.6
0.56 0.8/0.7
0.64 0.8/0.8
0.7 0.8/0.8
0.73 0.9/0.8
0.7 0.9/0.7
0.69 0.9/0.5
0.66 0.8/0.4
0.6 0.8/0.1
0.49 0.7/0.1
0.4 0.6/0.2
0.45 0.6/0.3
0.43 0.7/0.3
0.42 0.7/0.4
0.44 0.7/0.5
0.47 0.7/0.6
0.52 0.7/0.7
0.58 0.8/0.7
0.65 0.8/0.7
0.7 0.8/0.7
0.71 0.8/0.7
0.71 0.8/0.5
0.68 0.8/0.3
0.63 0.7/0.2
0.54 0.6/0.2
0.45 0.6/0.3
Fig. 7 Comparison of the
spatial skill of the
reconstruction from this study
and Luterbacher et al. (2002)
during the winters of the
overlapping period 1750–1850.
Each 5� 9 5� grid box shows at
the top line the correlation
values and at the bottom line the
mean RE skill of this study (left)and Luterbacher et al. (2002;
right). The RE skill value in the
reddish (bluish) highlighted
fields of this study is higher than
(equal to) Luterbacher et al.
(2002), the white boxes indicate
lower skill
M. Kuttel et al.: The importance of ship log data 1125
123
et al. (2009) for the English Channel region. Exploring
Danish data from voyages to Iceland and Greenland (e.g.
Frydendahl et al. 1992) has similarly great potential to
improve the availability of data over the northern North
Atlantic allowing a more appropriate representation of the
Icelandic Low. Furthermore there are also many yet to be
recovered terrestrial as well as marine instrumental pres-
sure series which would be particularly useful for
improving the SLP field reconstructions during summer
and over the southeastern North Atlantic. The international
ACRE (Atmospheric Circulation Reconstructions over the
Earth) initiative has now taken up this challenge and is
recovering global terrestrial and marine instrumental daily
to sub-daily weather observations from as far back in time
as possible. Within ACRE, several hundred ship log and
remark books from e.g. the English East India Company
containing instrumental data have been imaged by the
British Library and are currently being digitised by the
Climate Data Modernization Program (CDMP) in the US.
Details of ACRE’s activities and links to pioneering sur-
face observations only historical reanalyses can be found
on its WWW site (http://www.met-acre.org/).
Acknowledgments We are grateful for accessing instrumental
pressure series as well as information from the CLIWOC project.
A. Moberg and P. Woodworth kindly provided the instrumental
pressure series from Stockholm and Liverpool. The authors thank
Franz Kuglitsch for homogenizing the instrumental pressure series.
MK, JL, and EX have been supported by the Swiss National Science
Foundation (SNSF) through its National Center of Competence in
Research on Climate (NCCR Climate) project PALVAREX2. MK
and DG were also supported by the European Science Foundation
(ESF) activity entitled Mediterranean Climate Variability and
Predictability (MedCLIVAR). EX has also been supported by the EU/
FP6 project CIRCE (grant 036961), JL by the EU/FP7 project
ACQWA (grant 212250), MB and DW by the MILLENNIUM Project
(IP 017008-2), PDJ by the U.S. Department of Energy (grant DE-
FG02-98ER62601). RA was supported by the international ACRE
(atmospheric circulation reconstructions over the Earth) initiative.
ACRE is an international collaborative project led by a consortium of
the Queensland Climate Change Centre of Excellence (QCCCE) in
Australia, the Met Office Hadley Centre in the UK, and the US
National Oceanic and Atmospheric Administration (NOAA) Earth
System Research Laboratory (ESRL) and Cooperative Institute for
Research in Environmental Sciences (CIRES) at the University of
Colorado. This publication was financially supported by the Foun-
dation Marchese Francesco Medici del Vascello. Finally, we thank the
reviewers for the constructive comments that improved the quality of the
paper. The SLP reconstruction is available from the World Data Center
for Paleoclimatology: http://www.ncdc.noaa.gov/paleo/paleo.html.
References
Allan R, Ansell T (2006) A new globally complete monthly historical
gridded mean sea level pressure dataset (HadSLP2): 1850–2004.
J Clim 19:5816–5842
Ammann CM, Wahl ER (2007) The importance of the geophysical
context in statistical evaluations of climate reconstruction
procedures. Clim Change 85:71–88
Ansell TJ, Jones PD, Allan RJ, Lister D, Parker DE, Brunet M,
Moberg A, Jacobeit J, Brohan P, Rayner NA, Aguilar E,
Alexandersson H, Barriendos M, Brandsma T, Cox NJ, Della-
Marta PM, Drebs A, Founda D, Gerstengarbe F, Hickey K,
Jonsson T, Luterbacher J, Nordli O, Oesterle H, Petrakis M,
Philipp A, Rodwell MJ, Saladie O, Sigro J, Slonosky V, Srnec L,
Swail V, Garcia-Suarez AM, Tuomenvirta H, Wang X, Wanner
H, Werner P, Wheeler D, Xoplaki E (2006) Daily mean sea level
pressure reconstructions for the European-North Atlantic region
for the period 1850–2003. J Clim 19:2717–2742
Barriendos M, Martın-Vide J, Pena JC, Rodrıguez R (2002) Daily
meteorological observations in Cadiz–San Fernando. Analysis of
the documentary sources and the instrumental data content
(1786–1996). Clim Change 53:151–170
PALERMO
Sea
leve
l pre
ssur
e [h
Pa]
an
omal
ous
to 1
791−
1852
1790
1800
1810
1820
1830
1840
1850
−6
−4
−2
0
2
4
6
RECONSTRUCTIONINSTRUMENTAL SERIES
LIVERPOOL
Sea
leve
l pre
ssur
e [h
Pa]
an
omal
ous
to 1
768−
1793
1770
1775
1780
1785
1790
−15
−10
−5
0
5
10
RECONSTRUCTIONINSTRUMENTAL SERIES
Sea
leve
l pre
ssur
e [h
Pa]
an
omal
ous
to 1
756−
2001
STOCKHOLM
1750
1800
1850
1900
1950
2000
−15
−10
−5
0
5
10
RECONSTRUCTIONINSTRUMENTAL SERIES
Fig. 8 Winter mean SLP from
independent instrumental
pressure series (red lines) and as
reconstructed at the
corresponding 5� 9 5� grid box
(black lines) for Palermo (1791–
1852; Barriendos et al. 2009),
Liverpool (1768–1793;
Woodworth 2006), and
Stockholm (1756–2001;
Moberg et al. 2002). The
correlation coefficients are 0.87
(Palermo), 0.76 (Liverpool), and
0.92 (Stockholm), all significant
at the 99% significance level
1126 M. Kuttel et al.: The importance of ship log data
123

Barriendos M et al. (2009) Recuperation of old sea level pressure
series for the study of extreme weather events: Palermo, Paris,
Armagh & Edinburgh (1780–1880). Int J Climatol (submitted)
Bergstrom H, Moberg A (2002) Daily air temperature and pressure
series for Uppsala (1722–1998). Clim Change 53:213–252
Brazdil R, Pfister C, Wanner H, von Storch H, Luterbacher J (2005)
Historical climatology in Europe—the state of the art. Clim
Change 70:363–430
Briffa KR, Jones PD, Wigley TML, Pilcher JR, Baillie MGL (1986)
Climate reconstruction from tree rings: part 2, spatial recon-
struction of summer mean sea-level pressure patterns over great-
britain. J Clim 6:1–15
Briffa KR, Wigley TML, Jones PD, Pilcher JR, Hughes MK (1987)
Patterns of tree-growth and related pressure variability in
Europe. Dendrochronologia 5:35–59
Casty C, Handorf D, Sempf M (2005a) Combined winter climate
regimes over the North Atlantic/European sector 1766–2000.
Geophys Res Lett 32:L13801. doi:10.1029/2005GL022431
Casty C, Wanner H, Luterbacher J, Esper J, Bohm R (2005b)
Temperature and precipitation variability in the European alps
since 1500. Int J Climatol 25:1855–1880
Casty C, Raible CC, Stocker TF, Wanner H, Luterbacher J (2007) A
European pattern climatology 1766–2000. Clim Dyn 29:791–805
Caussinus H, Mestre O (2004) Detection and correction of artificial
shifts in climate series. J R Stat Soc C App 53:405–425
Chenoweth M (1996) Ship’s logbooks and ‘‘the year without a
summer’’. Bull Am Meteorol Soc 85:1689–1697
Cook E, Briffa K, Jones PD (1994) Spatial regression methods in
dendroclimatology. A review and comparison of two techniques.
Int J Climatol 14:379–402
Dunkeloh A, Jacobeit J (2003) Circulation dynamics of Mediterra-
nean precipitation variability 1948–1998. Int J Climatol
23:1843–1866
Frydendahl K, Frich P, Hansen C (1992) Danish weather observations
1675–1715. Danish Meteorological Institute, Technical Report
92–3
Gallego D, Garcıa-Herrera R, Ribera P, Jones PD (2005) Seasonal
mean pressure reconstruction for the North Atlantic (1750–1850)
based on early marine data. Clim Past 1:19–33
Garcıa-Herrera R, Konnen GP, Wheeler D, Prieto MR, Jones PD,
Koek FB (2005a) CLIWOC: a climatological database for the
world’s oceans 1750–1854. Clim Change 73:1–12
Garcıa-Herrera R, Wilkinson C, Koek FB, Prieto MR, Calvo N,
Hernandez E (2005b) Description and general background to
ships’ logbooks as a source of climatic data. Clim Change
73:13–36
Gordon GA, Lough JM, Fritts HC, Kelly PM (1985) Comparison of
sea level pressure reconstructions from Western North American
tree rings with proxy record of winter severity in Japan. J App
Meteorol 24:1219–1224
Hurrell JW (1995) Decadal trends in the North Atlantic Oscillation.
Regional temperatures and precipitation. Science 269:676–679
Hurrell JW, Van Loon H (1997) Decadal variations in climate
associated with the North Atlantic Oscillation. Clim Change
36:301–326
Jacobeit J, Jonsson P, Barring L, Beck C, Ekstrom M (2001) Zonal
indices for Europe 1780–1995 and running correlations with
temperature. Clim Change 48:219–241
Jones PD, Salmon M (2005) Preliminary reconstructions of the North
Atlantic Oscillation and the Southern Oscillation Index from
measures of wind strength and direction taken during the cliwoc
period. Clim Change 73:131–154
Jones PD, Davies TD, Lister DH, Slonosky V, Jonsson T, Barring L,
Jonsson P, Maheras P, Kolyva-Machera F, Barriendos M,
Martin-Vide J, Rodriguez R, Alcoforado MJ, Wanner H, Pfister
C, Luterbacher J, Rickli R, Schuepbach E, Kaas E, Schmith T,
Jacobeit J, Beck C (1999) Monthly mean pressure reconstructions
for Europe for the 1780–1995 period. Int J Climatol 19:347–364
Koek FB, Konnen GP (2005) Determination of wind force and
present weather terms: the Dutch case. Clim Change 73:79–95
Konnen GP, Koek FB (2005) Description of the cliwoc database.
Clim Change 73:117–130
Koslowski G, Glaser R (1999) Variations in reconstructed ice winter
severity in the western Baltic from 1501 to 1995, and their
implications for the North Atlantic Oscillation. Clim Change
41:175–191
Kuttel M, Luterbacher J, Zorita E, Xoplaki E, Riedwyl N, Wanner H
(2007) Testing a European winter surface temperature recon-
struction in a surrogate climate. Geophys Res Lett 34:L07710.
doi:10.1029/2006GL027,907
Livezey RE, Smith TM (1999) Considerations for use of the Barnett
and Preisendorfer (1987) algorithm for canonical correlationanalysis of climate variations. J Clim 12:303–305
Ludlum DM (1968) Early American Winters II 1821–1870. American
Meteorological Society, Boston
Luterbacher J, Schmutz C, Gyalistras D, Xoplaki E, Wanner H (1999)
Reconstruction of monthly NAO and EU indices back to ad
1675. Geophys Res Lett 26:2745–2748
Luterbacher J, Rickli R, Tinguely C, Xoplaki E, Schupbach E,
Dietrich D, Husler J, Ambuhl Pfister C, Beeli P, Dietrich U,
Dannecker A, Davies TD, Jones PD, Slonosky V, Ogilvie AEJ,
Maheras P, Kolyva-Machera F, Martin-Vide J, Barriendos M,
Alcoforado MJ, Nunes MF, Jonsson T, Glaser R, Jacobeit J,
Beck C, Philipp A, Beyer U, Kaas E, Schmith T, Barring L,
Jonsson P, Racz L, Wanner H (2000) Monthly mean pressure
reconstruction for the Late Maunder Minimum period (ad 1675–
1715). Int J Climatol 20:1049–1066
Luterbacher J, Rickli R, Xoplaki E, Tinguely C, Beck C, Pfister C,
Wanner H (2001) The Late Maunder Minimum (1675–1715): a
key period for studying decadal scale climatic change in Europe.
Clim Change 49:441–462
Luterbacher J, Xoplaki E, Dietrich D, Rickli R, Jacobeit J, Beck C,
Gyalistras D, Schmutz C, Wanner H (2002) Reconstruction of
sea level pressure fields over the eastern North Atlantic and
Europe back to 1500. Clim Dyn 18:545–561
Luterbacher J, Dietrich D, Xoplaki E, Grosjean M, Wanner H (2004)
European seasonal and annual temperature variability, trends and
extremes since 1500. Science 303:1499–1503
Luterbacher J, Liniger MA, Menzel A, Estrella N, Della-Marta PM,
Pfister C, Rutishauser T, Xoplaki E (2007) The exceptional
European warmth of autumn 2006 and winter 2007: historical
context, the underlying dynamics and its phenological impacts.
Geophys Res Lett 34:L12704. doi:10.1029/2007GL029951
Mann ME, Rutherford S, Wahl E, Ammann C (2007) Robustness of
proxy-based climate field reconstruction methods. J Geophys
Res 12:D12109
Matti C, Pauling A, Kuttel M, Wanner H (2009) Winter precipitation
trends for two selected European regions over the last 500 years
and their possible dynamical background. Theor App Climatol
95:9–26. doi:10.1007/s00,704–007–0361–x
Maugeri M, Buffoni L, Chlistovsky F (2002a) Daily Milan temper-
ature and pressure series (1763–1998): history of the observa-
tions and data and metadata recovery. Clim Change 53:101–117
Maugeri M, Buffoni L, Delmonte B, Fassina A (2002b) Daily Milan
temperature and pressure series (1763–1998): completing and
homogenising the data. Clim Change 53:119–149
Maugeri M, Brunetti M, Monti F, Nanni T (2004) Sea-level pressure
variability in the Po Plain (1765–2000) from homogenized daily
secular records. Int J Climatol 24:437–455
Moberg A, Bergstrom H, Ruiz Krigsman J, Svanered O (2002) Daily
air temperature and pressure series for Stockholm (1756–1998).
Clim Change 53:171–212
M. Kuttel et al.: The importance of ship log data 1127
123
Namias J (1948) Evolution of monthly mean circulation and weather
patterns. Trans Am Geophys U29:777–788
Paredes D, Trigo RM, Garcıa-Herrera R, Trigo IF (2006) Under-
standing precipitation changes in Iberia in early spring: weather
typing and storm-tracking approaches. J Hydrometeor 7:101–113
Pauling A, Luterbacher J, Casty C, Wanner H (2006) Five hundred
years of gridded high-resolution precipitation reconstructions
over Europe and the connection to large-scale circulation. Clim
Dyn 26:387–405
Prieto MR, Gallego D, Garcıa-Herrera R, Calvo N (2005) Deriving
wind force terms from nautical reports through content analysis,
the Spanish and French cases. Clim Change 73:37–55
Raible CC, Casty C, Luterbacher J, Pauling A, Esper J, Frank DC,
Buntgen U, Roesch AC, Tschuck P, Wild M, Vidale PL, Schar
C, Wanner H (2006) Climate variability-observations, recon-
structions, and model simulations for the Atlantic-European and
Alpine region from 1500–2100 ad. Clim Change 79:9–29
Riedwyl N, Kuttel M, Luterbacher J, Wanner H (2009) Comparison
of climate field reconstruction techniques: application to Europe.
Clim Dyn 32:381–395
Rodrigo FS, Esteban-Parra MJ, Pozo-Vazquez D, Castro-Diez Y
(1999) A 500-year precipitation record in Southern Spain. Int J
Climatol 19:1233–1253
Rodrıguez R, Barriendos M, Jones PD, Martın-Vide J, Pena JC (2001)
Long pressure series for Barcelona (Spain). Daily reconstruction
and monthly homogenization. Int J Climatol 21:1693–1704
Rosendal HE (1970) Unusual general circulation pattern of early
1843. Mon Wea Rev 98:266–270
Schmutz C, Gyalistras D, Luterbacher J, Wanner H (2001) Recon-
struction of monthly 700, 500 and 300 hPa geopotential height
fields in the European and Eastern North Atlantic region for the
period 1901–1947. Clim Res 18:181–193
Shindell DT, Schmidt GA, Mann ME, Rind D, Waple A (2001) Solar
forcing of regional climate change during the Maunder Mini-
mum. Science 294:2149–2152
Slonosky VC, Yiou P (2002) Does the NAO index represent zonal
flow? The influence of the NAO on North Atlantic surface
temperature. Clim Dyn 19:17–30
Slonosky VC, Jones PD, Davies TD (1999) Homogenization
techniques for European monthly mean surface pressure series.
J Clim 12:2658–2672
Slonosky VC, Jones PD, Davies TD (2001) Atmospheric circulation
and surface temperature in Europe from the 18th century to
1995. Int J Climatol 21:63–75
Trenberth KE (1990) Recent observed interdecadal climate changes
in the Northern Hemisphere. Bull Am Meteorol Soc 71:989–993
Trenberth KE (1995) Atmospheric circulation climate changes. Clim
Change 31:427–453
Trenberth K, Paolino DA (1980) The Northern Hemisphere sea level
pressure data set: trends, errors and discontinuities. Mon
Weather Rev 108:855–872
Villalba R, Cook ER, D’Arrigo RD, Jacoby GC, Jones PD, Salinger
MJ, Palmer J (1997) Sea-level pressure variability around
Antarctica since ad 1750 inferred from subantarctic tree-ring
records. Clim Dyn 13:375–390
von Storch H, Zorita E (2005) Comment on ‘‘hockey sticks, principal
components, and spurious significance’’ by S. McIntyre and
R. McKitrick. Geophys Res Lett 32:L20701. doi:10.1029/
2005GL022753
von Storch H, Zwiers FW (1999) Statistical analysis in climate
research. Cambridge University Press, Cambridge, p 513
von Storch H, Zorita E, Gonzalez-Rouco F (2009) Assessement of
three temperature reconstruction methods in the virtual reality of
a climate simulation. Int J Earth Sci 98:67–82
Wanner H, Bronnimann S, Casty C, Gyalistras D, Luterbacher J,
Stephenson D, Xoplaki E (2001) North Atlantic Oscillation.
Concepts and studies. Surv Geophys 22:321–381
Wheeler DA (1987) The Trafalgar storm 22–29 October 1805.
Meteorol Mag 116:197–205
Wheeler D (2005) An examination of the accuracy and consistency of
ships’ logbook weather observations and records. Clim Change
73:97–116
Wheeler D, Garcıa-Herrera R (2008) Ships’ logbooks in climatolog-
ical research: reflections and prospects. Ann N Y Acad Sci
1146:1–15
Wheeler D, Suarez-Dominguez J (2006) Climatic reconstructions for
the northeast Atlantic region ad 1685–1700: a new source of
evidence from naval logbooks. Holocene 16:39–49
Wheeler D, Wilkinson C (2005) The determination of logbook wind
force and weather terms: the English case. Clim Change 73:57–
77
Wheeler D, Garcıa-Herrera R, Wilkinson CW, Ward C (2009) Air
circulation and storminess in the Atlantic-European region
derived from logbooks: 1658 to 1750. Clim Change (in review)
Wilkinson C (2005) The non-climatic research potential of ships’
logbooks and journals. Clim Change 73:155–167
Wilks DS (2005) Statistical methods in the atmospheric sciences.
Academic Press, San Diego
Woodruff SD, Slutz RJ, Jenne RL, Steurer PM (1987) A compre-
hensive ocean-atmosphere data set. Bull Am Meteorol Soc
68:1239–1250
Woodworth PL (2006) The meteorological data of William Hutch-
inson and a Liverpool air pressure time series spanning 1768–
1999. Int J Climatol 26:1713–1726
Worley SJ, Woodruff SD, Reynolds RW, Lubker SJ, Lott N (2005)
ICOADS release 2.1 data and products. Int J Climatol 25:823–
842
Xoplaki E, Maheras P, Luterbacher J (2001) Variability of climate in
meridional Balkans during the periods 1675–1715 and 1780–
1830 and its impact on human life. Clim Change 48:581–615
Xoplaki E, Gonzalez-Rouco FJ, Luterbacher J, Wanner H (2004) Wet
season Mediterranean precipitation variability, influence of
large-scale dynamics. Clim Dyn 23:63–78
Xoplaki E, Luterbacher J, Paeth H, Dietrich D, Steiner N, Grosjean
M, Wanner H (2005) European spring and autumn temperature
variability and change of extremes over the last half millennium.
Geophys Res Lett 32:L15713. doi:10.1029/2005GL023424
Xu JS (1993) The joint modes of the coupled atmosphere–ocean
system observed from 1967 to 1987. J Clim 6:816–838
1128 M. Kuttel et al.: The importance of ship log data
123