the implicit market for family friendly work practices · the implicit market for family friendly...
TRANSCRIPT
The Implicit Market for Family Friendly Work Practices
John S. Heywooda, W.S. Siebert,b Xiangdong Weic
January 2003
The observation that a worker has a family friendly job reflects both the worker's decision to search for such a job and employer's decision to provide it to that worker. Previous research estimating the determinants of family friendly work practices has been severely limited by the inability to distinguish between these two decisions. Using linked employer-employee data and partial observability probit models, this paper provides the first empirical identification of the determinants of these two decisions. In addition to confirming the role of many worker and firm characteristics, the results are consistent with a theoretical model in which family friendly work practices are valuable to workers but costly to employers. Specifically, as predicted by a hedonic model of the labour market, firms providing such practices offer lower wages, all else equal.
aProfessor of Economics and Director of the graduate program in Human Resources and Labour Relations, University of Wisconsin-Milwaukee bProfessor of Labour Economics, Department of Commerce, University of Birmingham cAssociate Professor of Economics, Lingnan University The authors acknowledge the Department of Trade and industry, the Economic and Social Research Council, the Advisors, Conciliation and Arbitration Service and the Policy Studies Institute as the originators of the 1998 Workplace Employee Relations Survey data, and the Data Achieve at the University of Essex as the distributors of the data. None of these organizations bears any responsibility for the authors’ analysis and interpretation of the data. Corresponding author: J.S. Heywood, Department of Economics, University of Wisconsin-Milwaukee, P.O. Box 413, Milwaukee, WI 53201 USA; [email protected]

2
Introduction The last decade has seen an enormous increase in both popular and academic interest in family
friendly work practices. These practices include parental leaves, provision for childcare,
flexible hours and job sharing among many others. Advocates for workers and unions claim
firms must “do more to help families handle the mounting conflict between work and family
responsibilities" and emphasize that Australia, continental Europe and Japan have done a better
job of providing this assistance (Appelbaum et al. 2002; see also DTI, 2000). The business
press suggests that firms are unsure whether or not this provision is in their interest and point to
the expense and uncertainty of doing so (Schrage 1999). In the UK, a government Commission
(Bain, 2001) has recommended giving working parents with young children the right to require
their employer to provide them a flexible working pattern. The government (DTI, 2001, 3) has
accepted this recommendation, believing it will be “historic in bringing about a transformation
in the culture of the workplace”. Such a right is to be implemented in the UK in April, 2003
(see below). Using UK data, the 1998 Workplace Employment Relations Survey (WERS), our
paper investigates the extent to which this requirement for family friendly work practices may
have the unanticipated consequence of reduced wages.
Economists might well view the prevalence of family friendly work practices as part of
a broader process in which implicit markets allocate job characteristics valued by workers but
costly to firms (Rosen 1974).1 Surprisingly, little of the insights from this view have permeated
the empirical testing by social scientists to date (as will be discussed in the next section).
Despite many attempts to determine which workers receive family friendly benefits and which
firms provide such benefits, the fact that two sets of decisions are being made has not been
empirically modeled. A worker observed in a family friendly job is the result of that worker
searching for such a job and the firm deciding to both provide those benefits to that worker.
The characteristics associated with searching (demanding a family friendly job) may be the very
characteristics associated with firms not hiring (or supplying such a job). To take a single
illustration, female workers with dependents might find family friendly practices most valuable
and use them most heavily. This, in turn, may well make these workers the most expensive
workers to hire into a family friendly job. Thus, in typical reduced form estimates, it is unclear
what partial correlation one would expect between women with dependents and family friendly

3
work practices, a confusion born out in empirical testing to date. This, and related, examples
are drawn out in more detail in the next section.
Making use of linked employee-employer data and modeling partial observability
probits, this is the first study to analytically distinguish and estimate the determinants of the
desire for family friendly practices and the determinants of their provision. Using the WERS,
we jointly identify worker characteristics associated with desiring family friendly practices and
firm characteristics associated with their provision. The estimates confirm a hedonic model of
the labour market in which workers with greater earnings demand more family friendly
practices but in which firms reduce the earnings they pay when providing family friendly
practices.
In what follows, the next section reviews past evidence emphasizing the importance of
distinguishing the association of characteristics with the demand for family friendly practices
from the association of characteristics with the provision of those practices. The third section
introduces our methodology and testing framework. The fourth section describes our data while
the fifth section illustrates which specific practices are of value to workers and identifies which
workers have more nearly family friendly jobs. The sixth section presents our partial
observability estimates of each side of the implicit market in family friendly practices. The
seventh section applies the results to the UK’s current policy debate, and the final section
concludes.
The Determinants of Family Friendly Practices
Much of the literature on work and family suggests that the provision of family friendly
practices is routinely in the interest of employers (as an extreme, see Vanderkolk and Young
1991). These arguments often amount to the contention that happy employees make more
profitable companies. Thus, recent estimates from Australia identify work-family conflict as a
major source of employee turnover and that these turnover costs are as high as A$75,000 per
employee (Abbott et al. 1998). Family friendly practices are seen as a method that might
reduce turnover costs as well as help families. Similarly, greater worker satisfaction may be
associated with family friendly practices (Saltzstein et al. 2001) with the implication that more
satisfied workers are more productive. Although such lines of argument are logical, the direct

4
evidence is far less compelling. Lanoie et al. (2001) follow a firm as it adopts a particular
family friendly practice, the availability of job sharing. By comparing workers' productivity
before and after the job sharing programme, they observe a significant decrease in labour
productivity. Shepard et al. (1996) summarize the studies examining the productivity effect of
flexible work schedules as “inconclusive” while going on to find a positive effect on
productivity within the US pharmaceutical industry. Yet, Haines et al. (1999) studied paired
workers showing that a flexible work schedule does not reduce either the rate of turnover or the
use of sick leave among employees who have family responsibilities even as such flexibility is
expensive to employers.
The point is not to suggest that firms can never benefit from the provision of family
friendly practices. Instead, firms have differing ability (cost) in providing such practices and
workers will value them to differing degrees.2 This is nicely illustrated by the theoretical work
by Deardorf and Stafford (1976) who contend that flexibility should be thought of as a practice
over which both the firm and workers have preferences. Just as the employee would most
desire the flexibility to work when it suits his or her schedule (yields the highest utility), the
firm would like the flexibility to have the employee work when it suits the firm (is most
profitable). The chance that the worker’s utility maximizing extent of flexibility and the firm’s
profit maximizing flexibility are identical is essentially zero.3 The result is that the wage is
higher as the agreed upon flexibility moves closer to the firm’s preferred choice and is lower as
it moves toward the worker’s preferred choice. Given the heterogeneity in firm’s ability to
offer flexibility (Duncan and Stafford 1980), a hedonic equilibrium should arise with those
firms most able to give the workers a flexible schedule paying the least and those firms least
able to provide flexibility, paying the most. It is interesting to note that the very term “flexible
work” is used in the literature in two fashions paralleling the notion of Deardorff and Stafford.
Thus, when the worker has flexibility the practice is family friendly and when the firm has the
flexibility it is the opposite of family friendly such as when the firm uses on-call workers,
makes short-term intensive hires and so on (see Houseman 2001 and Gramm and Schnell 2001).
Several studies have tested the hypothesis that the compensating wage reflecting family
friendly practices should be lower. Johnson and Provan (1995) use a relatively small data set of
individual workers drawn from a single state in the US. The estimated wage equations find that
the use of family friendly practices is associated with an increased wage holding constant a

5
typical set of wage determinants. Gariety and Shaffer (2001) expand on this using the
nationally representative and far larger sample size of the US Current Population Survey.
Despite extensive controls for industry, occupation, human capital and even for the reason
workers desire family friendly practices, they found that formalized “flextime” is associated
with a significantly higher wage. The two studies agree, we think incorrectly, on the cause of
this positive association claiming that while there might be a hedonic penalty for family friendly
practices, this is outweighed by the productivity benefits of the practices, benefits reflected in
higher wages.
Viscusi (1979) and more recently Gunderson and Hyatt (2001) emphasize the critical
role played by the income effect when estimating compensating wage differentials.
Unmeasured determinants associated with higher earnings are also associated with the desire to
purchase all normal workplace characteristics including family friendly practices. In the case of
workplace risk, this has been identified as the “endogenous risk model” and a variety of
estimation techniques attempt to account for the endogeneity (Gunderson and Hyatt). The
failure of past examination of the differential for family friendly practices to account for this
endogeneity means that the positive association between those practices and wages might have
nothing to do with productivity but instead reflect the income effect. Those with higher wages
will purchase more family friendly practices. This point is drawn out analytically in Appendix
1.
While we are not directly estimating a compensating differential for family friendly
practices, we wish to incorporate this insight into our estimates of who demands such practices
and what firms supply such practices. In typical cross-section attempts to determine who has
family friendly practices, individual data sources such as labour force surveys are used to
estimate simple probit probability models. Thus, Golden (2001) finds that in a large nationally
representative US survey, women, racial minorities, the less educated and the unmarried are less
likely to have family friendly jobs. Yet, this finding may well reflect endogeneity, as each of
these variables are associated with earnings (and wealth) and, through the income effect, with
demand for family friendly practices. While Golden examines flexible schedules, Cowling
(2000) examines the determinants of the ability to work at home. Estimating simple probits on
data for individuals across 15 European countries, gender does not have a significant
association with this ability to work at home while education, age and professional status are all

6
positively associated. Again, women may have greater demand for such ability if the
determinants of earnings are all measured but without such measurement this demand is
unlikely to be captured and may be swamped by the income effect. Caputo (2000) examines a
sample of young women in the US showing that minorities in lower paying jobs were less likely
to have a range of family friendly practices at work. Indeed, some researchers have even
suggested that leave policies, in particular, may actually “reinforce inequality based on gender,
race and family status.” Gerstel and McGonagle (1999) draw this conclusion from US data
showing that respondent identified “need for a leave” is greatest for women, single parents,
racial minorities and those with little income but that the actual taking of leaves is more likely
among the married, white and those with more income. Rather than identifying this as a
“disjunction” between need and use, it would again seem to be the income effect at work
suggesting that those with higher earnings (and earnings potential) purchase more family
friendly practices in the implicit market. The distribution of family friendly policies would
reinforce inequality only if those receiving them do not pay an implicit wage price through their
purchase.
This sets the stage for our contribution which is to separate the determinants of the
desire for family friendly practices, including the income effect, from the determinants of
supply which we hypothesis will reflect the cost implicit in provision. The next section outlines
our empirical methodology.
An Empirical Model of Family Friendly Practices
We start with the firm’s decision to offer a family friendly practices for a given job, FF=1. This
depends on the expected profit from doing so which may well be a function of the anticipated
characteristics of who might apply but, critically, it is also a function of the technology and cost
structure of the firm. A firm will offer family friendly practices for a given job only if the
anticipated benefits minus costs of doing so are positive, UT = Yα - µT > 0, where Y is a vector
of firm characteristics which influence the costs and benefits of providing family friendly
practices, α is a vector of parameters and µT is a normal random error. Thus, the probability
that the firm provides family friendly practices for a given job is
7
Prob(FF=1) = Prob(µT < Yα). (1)
Following convention we anticipate that individuals will apply for a job with family friendly
practices when the expected utility from doing so is positive. The main determinants of that
include wealth (proxied by human capital and earnings), the implicit price of such practices and
demographic characteristics influencing the value of those practices, such as gender and
dependents. Let UI = Xβ - µI be the worker’s gain from having family friendly practices, where
X is a vector of the individual’s characteristics (including earnings), β is a vector of parameters
and µI is a normal random error. The individual worker will apply for a job with family
friendly practices (S=1FF=1) if UI = Xβ - µI > 0. The probability that the worker will search
for such practices is given by
Prob(S=1FF=1) = Prob(µI < Xβ ). (2)
Given that the firm has decided to provide family friendly practices for a given job and
that an individual has applied for that job, firms maximize profit, in part, through the selection
of workers for that job. In particular, if the firm has decided to provide family friendly
practices, an individual worker will add to profits based on the characteristics associated with
their productivity and their expected use (and the associated expense) of the practices. Thus,
given family friendly practices, the worker’s net addition to profit (or loss) can be identified as
US = Zθ - µS where Z is a vector of both firm characteristics and job applicant characteristics,
including the wage reduction they would be willing to accept to obtain family friendly
practices.4 Thus, the probability of hiring an individual applicant given the firm provides
family friendly practices is given by
Prob[(H=1S=1) FF=1] = Prob(µH < Zθ). (3)
Thus, equations (1), (2) and (3) are the structural equations describing the desire for and
provision of family friendly practices in an implicit market. If S, H and FF were observed
independently we could theoretically estimate all parameters. Rare, or nonexistent, is the data

8
source with these variables. Instead, what is typically observed is a particular worker in a job
with family friendly practices (G=1). Thus,
Prob (G=1) = Prob (H=1& S=1 & FF=1)
= Prob[(H=1S=1) FF=1] Prob(S=1FF=1) Prob(FF=1) (4)
Recognizing that two of the decisions are those of the firm and one of the worker these
may be rearranged into two probabilities allowing estimation by bivariate probit models with
partial observability. The first probability is that the worker applies for a job with family
friendly practices. The second is that the firm provides such practices to the worker. Thus,
equation (4) is rewritten
Prob(G=1) = Prob(H=1 & FF=1)Prob(S=1FF=1)
= Prob[µH < Zθ & µT < Yα] Prob(µI < Xβ ) (5)
For estimation purposes this may be thought of two decisions rather than three. A worker
applies for a family friendly position at the firm (S=1) and the firm decides whether to hire the
worker into a family friendly position. In other words, the decision to hire the worker into a
family friendly position is a single decision as the worker will not be hired by the firm
otherwise, given the applicant’s decision to search for family friendly jobs. Thought of this
way,
Prob(G=1) = Prob(H=1 & FF=1)Prob(S=1FF=1)
= Prob[µL < Yα + Zθ] Prob(µI < Xβ ) , (6)
where µ L = µH + µT. This model consists of two probabilities, the probability a worker applies
to the firm for a family friendly job and the probability, given that application, that the firm
hires that worker into a family friendly job. Note that particular characteristics may well have
different influences in determining these two probabilities. In particular, the hedonic model of
the implicit market for family friendly practices would suggest that the observed wage should

9
be a positive determinant of worker's probability of applying but negatively associated with the
firm's probability of provision.
Estimation
When µL and µI are uncorrelated, the two structural equations from eq. (6) can be estimated as a
sequential partial observability model (Abowd and Farber 1982 and Maddala 1993). The
parameters are identified as long as there is identification (non-overlapping variables) between
the combination (Y, Z) and X. This model has been used to examine the separate application
and hiring decisions into union jobs and into government jobs as well as the decision to apply
for insurance and be granted coverage (Abowd and Farber, 1982; Heywood and Mohanty, 1995
on unions and government jobs and Reschovsky, 1996 and Schmuli, 2001 on insurance).
In practice, the assumption of zero correlation between the error terms is often
inappropriate. Information not accounted for in the estimation may well influence the decisions
of both the job applicant and the firm. Moreover, the sequential decision model does not
account for the fact that there may be potential workers that do not apply for a family friendly
job but which the firm with such jobs would like to hire. Finally, the sequential model does not
account for the fact that there may be workers who do not apply for a family friendly job
because they anticipate (correctly or incorrectly) being rejected. These issues are all accounted
for by estimating the joint decision partial observability model (Porier 1980, Maddala 1983)
which breaks the sequential assumption and allows for correlated errors, ρ. In this case G
(employment in a family friendly job) is assumed to have a bivariate normal distribution with
parameters: Xβ, Yα+ Zθ, ρ.
In our estimations, the distinction is not crucial to the general point but both models are
used to estimate the structural equations for comparison. We emphasize that either model
improves substantially on the testing to date which estimates a single reduced form equation of
the determinants of G=1, confounding the decisions of the applicants and of the firm.
The Data

10
The data is taken from the linked employee-employer portion of the UK 1998 Workplace
Employment Relations Survey (WERS). WERS is a nationally representative sample of 2191
establishments with ten or more employees in Great Britain. Within each of the establishments
a random sample of twenty-five individuals were surveyed. In those establishments with less
than twenty-five employees, all workers were surveyed. The data were collected by the UK
Department of Trade and Industry, with an overall response rate of 81 percent (Cully et al. 1999
pp. 303 ff). Such linked records are uniquely appropriate for our estimation. They provide data
on characteristics of the individual workers, which influence their decision to search for family
friendly practices, as well as data on firm characteristics which influence the decision to provide
such practices. Table 1 details the definitions of the variables we use and their descriptive
statistics.
The critical independent variable, whether or not the worker’s current job is family
friendly, is built up from a series of underlying indicators. As Table 1 shows, 32.2 percent of
workers in the sample have family friendly jobs, according to our index. Our index is based on
a k-mean cluster analysis, in which two categories of jobs are identified based on differences in
seven relevant job characteristics.5 We anticipate that family friendly jobs are more likely to
provide flexible hours, job sharing, parental leave, working-at-home, workplace nursery and the
ability to take time off and make it up latter. On the other hand, we anticipate that family
friendly jobs are less likely to be those that do not allow time to be taken off. The cluster
analysis confirms these expectations and shows that family friendly job characteristics tend to
go together. As Table 2 shows, the jobs identified as family friendly are 2.5 times more likely
to provide flexible hours, 8 times more likely to provide job sharing, consist of 100 percent of
all jobs providing parental leave, are at least 2 times more likely to provide a workplace nursery
and allow work at home and 15 times more likely to provide time off and only 1/3 as likely to
prohibit time off. Moreover, each of these differences between the clusters are statistically
significant6.
Results
To illustrate the importance of the estimation approach, we start with a benchmark estimating
the determinants of a family friendly job with a simple (reduced form) probit.7 We have chosen

11
individual variables which include gender, age, disability status, race, marital status, the
presence of young children, whether or not there are dependent children, union status and a
series of occupational dummies. The establishment variables include the number of employees,
the extent of unionization within the plant, the percent female within the plant, whether or not
the firm uses workplace teams, the share of non-managerial supervisors in the plant, the share of
managers in the plant, whether or not the establishment is in the private sector, an attitudinal
indicator of whether or not managers feel it is workers responsibility alone to balance work and
family and a series of industrial dummies. The two sets of variables are used individually and
jointly, together with the measure of earnings in three separate probit estimates.
Table 3 shows the estimates using individual data in the first column. The results show
that women, younger workers, the disabled and those with children are more likely to have a
family friendly job. They also indicate a very strong positive relationship between earnings and
such jobs. The second column uses just the firm variables, showing that workers in larger
establishments, and those in establishments with more women, or using teams, or with greater
unionization are more likely to have family friendly jobs. Again, earnings are a strong positive
determinant of having a family friendly job. Finally, using both sets of variables reinforces the
results already presented. Women, younger workers, the disabled and those with children
remain more likely to have family jobs while those working for large establishments and with
large shares of women, unionization and teams are also more likely to have family friendly
jobs. In particular, the strong positive role of wages remains.
Thus, the simple probit estimates confirm previous studies showing a positive
relationship between earnings and family friendly jobs. Yet, as we have suggested, this positive
relationship likely confounds a positive income effect on the part of workers with a negative
relationship on the firm side generated because family friendly benefits are costly. To examine
this aspect, we next use the specification from equation (6), the bivariate probit with partial
observability. We place the establishment-level variables in the firm equation and the
individual-level variables in the worker equation. The exception is the variable of interest,
earnings, which we have argued, belongs in both equations and should show separate
correlations of opposite directions in the two.
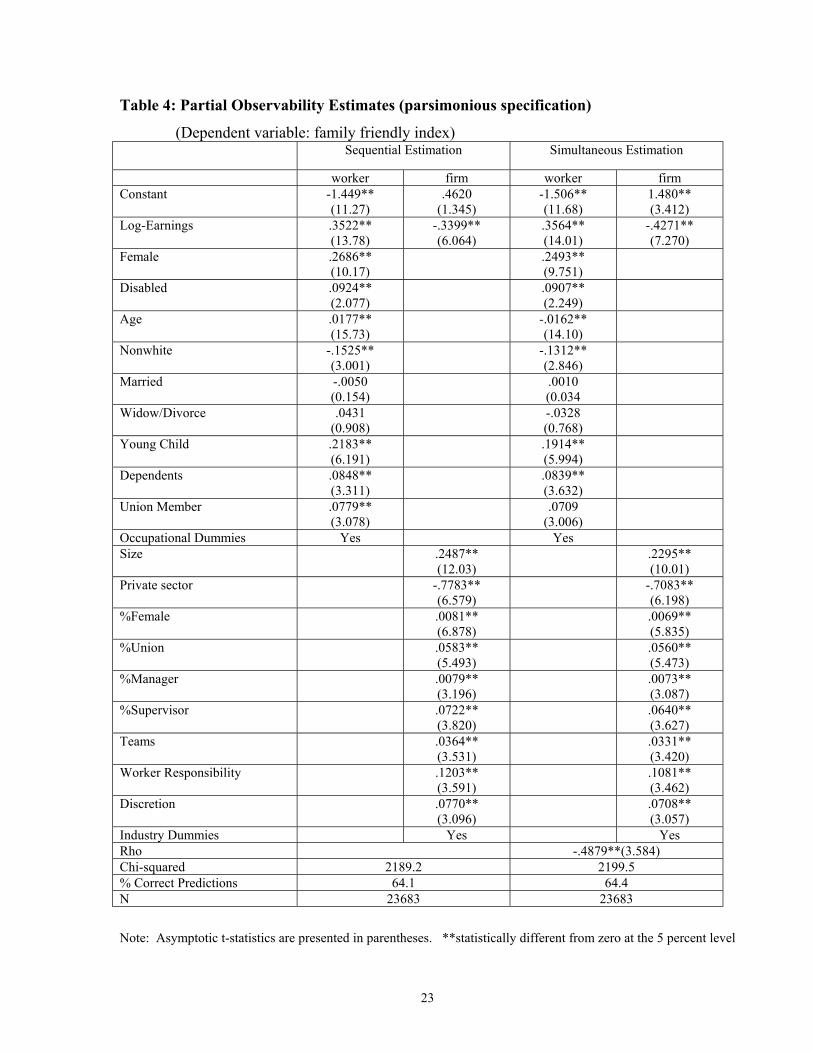
Table 4 shows the estimation of both the sequential and simultaneous estimates using an
initial set of controls. As column 1 shows, the results for the control variables in the reduced

12
form (column 3 of Table 3) carry over largely unchanged. Yet, the role we expected for
earnings emerges very clearly. In the worker equation, earnings are a strong positive
determinant of having a family friendly job. This is the income effect as those workers with
greater earning power are more likely to purchase family friendly practices. On the other hand,
earnings emerge as a very strong negative determinant of providing family friendly practices.
These practices are expensive and the labor market creates an implicit price in form of foregone
earnings.
The estimation results of the two models are very similar and the log-likelihoods from
either can be used to reject the assumption that the reduced form is a sufficient estimation. In
the simultaneous estimation, the correlation between the errors in the firm and worker equations
is statistically significant suggesting it is the superior of the two specifications. Interestingly, it
is in the simultaneous estimation that the size of the compensating differential appears larger.
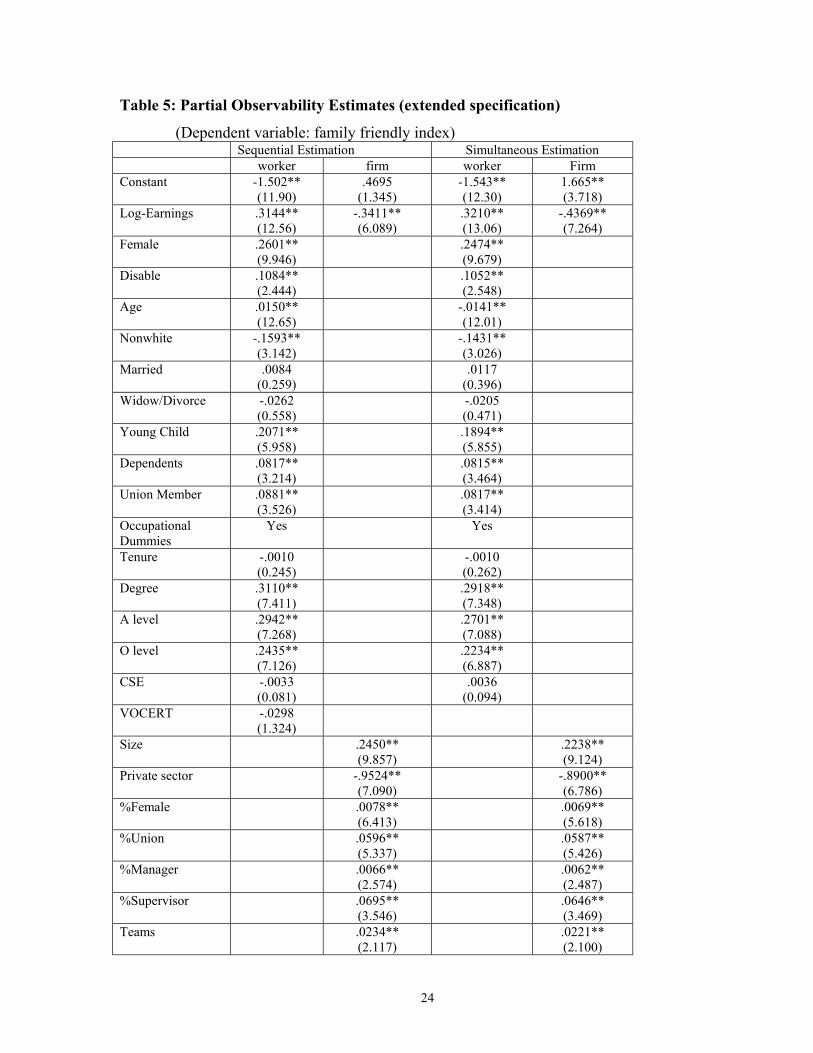
The estimation remains stable to changes in specification. We added additional
variables to both the determination of the employee and the workplace decisions. As seen in
Table 5, the addition of tenure and education to the worker decision shows a strong role for
education but worker earnings remains a positive determinant of the desire for family friendly
practices. The addition of establishment age, market power and a series of worker participation
variables reveal a mixed pattern with many but not all of the new variables taking significant
roles as determinants of the workplace decision to provide family friendly jobs. The addition of
these variables does not alter the role of higher worker earnings as a strong negative
determinant of providing family friendly jobs. Again, the estimated error correlation in the
simultaneous version remains statistically significant.
The estimations from the simultaneous model in Table 5 can be used to illustrate the
magnitude of the market trade-off between earnings and family friendly jobs. We consider the
influence on the workplace side holding constant all variables except the wage for the
workplace, and holding all variables constant on the worker side8. The marginal effect is -0.039,
which yields an elasticity of family friendly coverage with respect to earnings of approximately
-0.121 (= -0.039/0.322) 9. The reciprocal of this figure gives the elasticity of earnings with
respect to family friendly coverage, -8.3, implying that legislation for family friendly work
practices will be associated with substantially lower earnings.
13
However, we regard the -8.3 figure very much as an upper limit for the reaction of
earnings to family friendly work practices. In the first place, our simple zero-one family
friendly index necessarily lists as “non-family friendly” many jobs which are, in fact, family
friendly in some dimensions (for instance, Table 2 shows that 23% of workers in non-family
friendly jobs have access to flexible working hours). Secondly, any policy move toward family
friendly work practices is likely to be sensitive to costs. Thus, in the British case the Bain
Commission has said that, “if it does not make business sense to adopt a flexible working
pattern, employers will not have to do so” (Bain, 2001, Executive Summary). For example, it is
hard to imagine a worker successfully requesting a workplace nursery (daycare) if one does not
exist already. For both these reasons, a law requiring extension of family-friendly work
practices need not move large numbers of jobs from zero to one on our index. These caveats
made, however, one would expect some new provision of family friendly practices (as we
measure them) and this new provision is likely to be associated with substantially higher costs,
as indicated by our earnings estimates.
UK Policy Impact
As noted at the beginning, the UK government is displaying enthusiasm for family
friendly legislation, and has made an “impact assessment” of the legislation. Given that our
results are derived from UK data, they can be used to directly to assess the possible
consequences of this legislative drive. The UK interest springs from the government's “Work-
Life Balance Campaign” set up in the year preceding the 2001 election. The government
published a consultative green paper (DTI, 2000) presaging an extension of
maternity/paternity/parental leaves (forthcoming in the new Employment Act), and also
proposing a new right for parents to have requests for flexible working "seriously considered"
by their employers10. This "duty to consider" has received the imprimatur of the Work and
Parents Taskforce (Bain, 2001), and the government has committed itself to April 2003 as the
target date for implementation.
The duty to consider law aims to spread family friendly work practices more widely
among firms. The practices envisaged (Bain, 2001, 2.2) involve compressed hours, flexitime,
home-working, job sharing, teleworking, term-time working, shift-working, staggered hours,

14
annualised hours, as well as part-time working, for all of which workers can make requests11.
These practices overlap with the variables underlying our family friendly index, and our results
are therefore relevant (subject to the caveats above). Nevertheless, in appraising this law,
neither the Bain Commission nor the government’s impact assessment has considered the
possibility of adverse wage movement.
The government’s impact assessment forecasts a large take-up (DTI, 2001, 14) of the
new right. The forecast is for a flow of around 400,000 successful new requests per year
(restricted to parents of children under 6). This forecast is based on surveys of workers’
responses about what they “would have liked” in the way of flexible working arrangements. For
example, 25% of mothers who returned to work on a full-time basis would have liked the option
of flexible working (DTI, 2001, 27)12. To put this increase of 400,000 a year in context, our
index gives family friendly arrangements as being available to 32% of the workforce (Table 1),
that is, about 8 million workers. Given this context, it can be seen that a considerable change is
likely, if the government is correct.
On the cost side, the Work and Parents Taskforce (Bain 2001, 617-6.21) believes that
the cost of accommodating requests would vary between zero and, at most, one week's wages
per request.13 Accepting this higher figure, the impact assessment then gives £170m. a year as
the cost of accommodating requests (DTI, 2001, p 21). In addition, the cost of “running the
request procedure”, that is, making and processing a request, is assessed at half a day each of
management's and worker's time, that is, £150 per request, or a £75m. year. This processing
figure is assumed to become £100m. a year when the cost of dealing with appeals is taken in.
Therefore, the total cost of the law is forecast by the government to be only £270m. a year,
about half of one percent of annual labour costs.
We believe this cost estimate is too small given the large forecast take-up of the family
friendly programme. Our empirical analysis shows a substantial trade-off between wages and
family friendly practices suggesting such practices are costly, even among firms well placed to
adopt them. To the extent that the programme requires family friendly work practices of firms
that have chosen not to adopt these practices, such practices must be yet more costly (Deardorff
and Stafford 1976). The consideration of possible wage reductions as an element of costs seems
warranted and has a history in the economics of mandated benefits. For instance Gruber (1994)
found that wages among 20-40 year old married women fell 5.4 percent as a result of mandated

15
maternity leave. Our empirical analysis, therefore, suggests that the government’s impact
analysis should be more cognizant of the implicit market for family friendly practices.
Conclusions
This research recognizes the implicit market, which provides family friendly work
practices. In this market those firms able to provide such practices most cheaply do so,
attracting workers who value these practices and who will accept reduced earnings to cover the
costs of provision. In this respect, we see the provision of family friendly practices as similar to
those implicit markets which provide workplace health and safety, fringe benefits or, indeed,
improved working conditions in general.
We are not the first to take this view but, as indicated above, limited testing
methodology has often resulted in a failure to confirm the assumed trade-off between earnings
and family friendly practices. We argue that this failure has been the result of failing to control
for the strong income effect. Those with high earnings use a portion of them to purchase family
friendly practices. Our empirical strategy has been unique: to isolate the determinants of these
practices by separating the worker and firm determinants through partial observability
techniques. We think the evidence is compelling. While workers with higher earnings are
much more likely to desire family friendly work practices, firms paying lower wages are those
that are more likely to provide them, all else equal. Thus, firms face a trade-off between paying
higher wages and providing family friendly practices. Evidence of this trade-off is particularly
timely, as the UK government seems poised to mandate increased provision of family friendly
practices. Yet, when the government examined the impact of this mandate no recognition has
been made of the implicit market which values these practices.

16
References
Abbot, J., H. De Cieri and R. Iverson. 1998. "Costing Turnover: Implications of Work/Family
Conflict at the Management Level." Asia Pacific Journal of Human Resources 36(1): 25-
43.
Abowd, J. and Farber H. 1982. “Job Queues and the Union Status of Workers.” Industrial and
Labor Relations Review 35: 354 - 67.
Appelbaum, E. and T. Bailey, P. Berg and A. Dallenberg. 2002. Shared Work, Valued Care:
New Norms for Organizing Market Work and Unpaid Care Work. Economic Policy
Institute: Washington, DC.
Bain, Sir G (Chairman), 2001. About Time: Flexible Working, London: Work and Parents
Taskforce.
Caputo, R. 2000.”Race and Marital History as Correlates of Women’s Access to Family-
Friendly Employee Benefits.” Journal of Family and Economic Issues 21(4): 365-85.
Cowling, M. 2000. “At Home but in Work: The Extent and Determination of Home Working in
the EU.” Working Paper of the Birmingham Business School, December.
Cully, Mark, Stephen Woodland and Andrew O’Reilly and Gill Dix. 1999. Britain at Work
London: Routledge.
Deardorff, A. and F. Stafford. 1976. "Compensation of Cooperating Factors." Economica 44:
671 – 84.
DTI, 2000. Work and Parents: Competitiveness and Choice, London: Department of Trade and
Industry.
DTI, 2001. Government Response to Recommendations from the Work and Parents Taskforce,
London: Department of Trade and Industry.
Duncan, G. and F. Stafford. 1980. "Do Union Members Receive Compensating Wage
Differentials." American Economic Review 70(3): 355 – 71.
Forth, John and Simon Kirby. 2000. Guide to the Analysis of “The Workplace Employee
Relations Survey, 1998.” National Institute of Economic and Social Research, London.
Gariety, B. and S. Shaffer. 2001. “Wage Differentials Associated with Flextime.” Monthly
Labor Review 124(3): 69 – 75.

17
Gerstel, N. and K. McGonagle. 1999. “Job Leaves and the Limits of the Family and Medical
Leave Act.” Work and Occupations 26(4): 510 – 34.
Golden, L. 2001. “Flexible Work Schedules.” Monthly Labor Review 124(3): 50 – 67.
Gramm, C. and J. Schnell. 2001. “The Use of Flexible Staffing Arrangements in Core
Production Jobs.” Industrial and Labor Relations Review 55(2): 245 – 58.
Gruber, Jonathan. 1994. “The Incidence of Mandated Maternity Benefits,” American Economic
Review 85(3): 622 – 41.
Hanes, V., G. Guerin and S. St-Onge. 1999. "Effects of Flexible Hours on Turnover Rates and
Absenteeism of Workers with Children." Canadian Journal of Administrative Sciences
16(4): 232-33.
Heywood, J. and M. Mohanty. 1995. “Estimation of the US Federal Job Queue in the Presence
of an Endogenous Union Queue. Economica 62(4): 479 – 93.
Hogarth, T, C Hasluck, and G Pierre, 2001. Work-Life Balance 2000: Baseline Study of work-
life balance practices in Great Britain, IER Warwick and IFF Research, November
2000, updated June 2001.
Houseman, S. 2001. “Why Employers use Flexible Staffing Arrangements: Evidence from an
Establishment Survey.” Industrial and Labor Relations Review 55(1): 149-170.
Hyatt, D. and M. Gunderson. 2001. “Workplace Risks and Wages : Canadian Evidence from
Alternative Models.” Canadian Journal of Economics 34(2): 377 – 95.
Jirjahn, Uwe. 2002. “Performance Pay in Germany,” in Paying for Performance: An
International Comparison, eds. Michelle Brown and John Heywood, M.E. Sharpe,
Armonk, NY.
Johnson, N. and K, Provan. 1995. “The Relationship between Work/Family Benefits and
Earnings: A Test of Competing Predictions.” Journal of Socio-Economics Winter: 571 –84.
Lanoie, P., F. Raymond and B. Schearer. 2001. "Work Sharing and Productivity: Evidence from
the Firm Level." Applied Economics 33(9) 1213-20.
Leroy, B. 2000. “Use Family-Friendly Perks to Attract Staff Members.” Veterinary Economics
41(11): 14.
Poirier, D. 1980. “Partial Observability in Bivariate Probit Models.” Journal of Econometrics
12: 209 – 17.

18
Rosen, Sherwin. 1974. “Hedonic Prices and Implicit Markets.” Journal of Political Economy
92(1): 34 – 55.
Saltzstein, A., Y. Ting and G. Saltzstein. 2001. “Work-family Balance and Job Satisfaction: The
Impact of Family-Friendly policies on Attitudes of Federal Government Employees.”
Public Administration Review 61(4): 452 – 467.
Schrage, M. 1999. "'Family Friendly' Firms will Find that No Good Deeds Go Unpunished."
Fortune 139:(10), May 24, 294-94.
Shephard, E., T. Clifton and D. Kruse. 1996. “Flexible Work Hours and Productivity: Some
Evidence from the Pharmaceutical Industry.” Industrial Relations 35(1): 123 – 139.
Shmueli, A. 2001. “The Effect of Health on Accute Care Supplemental Insurance Ownership:
An Empirical Analysis.” Health Economics 10: 241 - 50.
Vanderkolk, B. and A. Young. 1991. The Work and Family Revolution: How Companies Can
Keep Employees Happy and Business Profitable. New York: Facts on File.
Viscusi, K. 1978. “Wealth Effects and Earnings Premium for Job Hazards.” Review of Economics and Statistics 60: 408-16.
Waldfogel, J. 1998 “Understanding the ‘Family Gap’ in Pay for Women with Children.” Journal of Economic Perspectives 12(1):127-156.
Waldfogel, J., Y. Higuchi, M. Abe. 1999. “Family Leave Policies and Women’s Retention after Childbirth: Evidence from the United States, Britain and Japan.” Journal of Population Economics 12(4):523-45.

19
Table 1. Variables and Their Descriptive Statistics Variables Mean Std. Dev. Meaning Dependent Variables: Family friendly arrangements at workplace (opinion of worker)a: flexhr .321 .467 dummy=1 if flexible working hours (flexi-time) available jshare .169 .375 dummy=1 if able to share a full-time job with someone else pleave .282 .450 dummy=1 if parental leave is available workathome .xx .xx dummy=1 if able to work at or from home during normal working hours nursery .047 .211 dummy=1 if a workplace nursery or help with the cost of childcare is available timeoff .146 .353 dummy=1 if able to take time off and make it up later ntimeoff .028 .166 dummy=1 if not allowed to take time off Family friendly index: famfriend .322 .466 dummy=1 for family friendly workplace (an index derived
from cluster analysis using the above 7 variables: see Table 2)
Personal Characteristics Variables: male .492 .500 dummy=1 for male age 39.727 11.854 age of the employee married .687 .464 dummy=1 for married widdiv .082 .274 dummy=1 for widowed or divorced child4 .137 .344 dummy=1 for having children under age of 4 nodepchd .561 .496 dummy=1 for having no dependent children (age under 16) nonwhite .061 .239 dummy=1 for non-white disable .059 .236 dummy=1 for disabled Highest educational qualification dummies: degree .243 .429 degree or above alevel .148 .355 A-level or equivalent olevel . 251 .434 O-level cse .110 .313 CSE/GCSE vocert .365 .481 vocational training certificate Job-related Personal Characteristics Variables: lpaywk 5.422 .707 log weekly pay hour 37.502 12.223 normal hours of work per week tenure 6.767 5.496 years of tenure on the current job union .405 .491 dummy=1 for union members pension .834 .372 dummy=1 if covered by a company pension scheme sickpay .805 .396 dummy=1 if the employer provides sick pay Occupation dummies: manager .104 .306 managers and senior administrators prof .151 .358 professionals aprof .110 .313 associate professionals and technical staff clerk .176 .381 clerical and secretarial craft .078 .268 craft and skilled service service .068 .251 personal and protective service sale .065 .247 sales operator .115 .319 operative and assembly

20
Workplace Characteristics Variables: ltnem 5.273 1.656 log establishment size private .662 .473 dummy=1 for private organizations tucover 3.134 2.603 % covered by collective bargaining arrangementsb pfemale 47.989 28.741 % female employees in the establishment pnmsup 1.739 1.230 % non-managerial supervisors in the establishment pmng 8.548 9.313 % managers in the establishment balwkfam 2.169 .772 index variable indicating management’s view on the
following statement: it is up to individual employees to balance their work and family responsibilities (0=strongly agree,…, 4=strongly disagree)
teamwork 4.167 2.043 % working in formally designated teamsb jcc .538 .499 dummy=1 if the establishment has joint consultative
committees qcircle .532 .499 dummy=1 if the establishment has quality circles brief .900 .299 dummy=1 if the establishment operates a system of briefings
by which management communicates or consults with employees
noconsul .075 .263 dummy=1 if the managers do not use any other ways (other than JCC, quality circles, system of briefings) to consult their employees
infinv .617 .486 dummy=1 if management regularly gives employees or their representative any information on internal investment plan
inffin .751 .433 dummy=1 if management regularly gives employees or their representative any information on the financial position of the est.
infstaff .661 .474 dummy=1 if management regularly gives employees or their representative any information on staffing plans
prperpay .840 1.843 proportion of non-managerial employees receiving performance-related pay in the last 12 monthsb
pprpay 1.482 2.438 proportion of non-managerial employees receiving profit-related pay in the last 12 monthsb
pshareow .594 1.487 proportion of non-managerial employees participating in share ownership schemesb
papprais 3.940 2.419 proportion of non-managerial employees having their performance formally appraisedb
pintfill 2.014 1.559 proportion of vacancies filled internallyb layoff .147 .354 dummy=1 if compulsory redundancy used in the last 12
months mpower .333 .471 dummy=1 if the organisation either dominates the market or
has only few competitors
Industry dummies: secelect .008 .087 utilities secconst .027 .163 construction secwhole .121 .327 wholesale and retailing sechotel .030 .171 hotel and catering sectrans .058 .233 transportation secfinan .045 .208 financial secothbu .082 .275 other business service secpubli .099 .298 public administration seceduc .116 .320 education sechealt .141 .348 health and social welfare secoth .028 .165 other industry Sample size: 23,683

21
a. These are answers to questions beginning: “If you personally needed any of these arrangements, would they be available at the workplace?” (tick all that apply).
b. Index variable with 0=0%, 1=1-19%,2=20-39%,3=40-59%,4=60-79%,5=80-99% and 6=100%. c. The omitted industry category is manufacturing, and the omitted regional dummy is Yorkshire.
Table 2: Bivariate K-mean Cluster to Derive the Family Friendly Index
Family Friendly Non-Family Friendly
Col. 1/Col. 2
Flexible hours .5427 .2297 2.36** Job sharing .4174 .0587 7.11** Parental leave .8820 .0000 inf.** Workathome .181 .079 2.29** Nursery .1808 .0792 2.28** Time off .1814 .0123 14.75** No time off .0123 .0344 .358** Overall: percent of observations
32.2 67.8
The numbers should be interpreted as follows: for example, the number in the first cell, .5427 means that 54.27% of the workers identified as being in a family-friendly job have flexible hours. The number at the bottom of the column, 32.2, gives the percentage of workers in family friendly jobs. Also, the overall percentage in the sample having flexible hours is the average of those in family friendly and non-family friendly jobs, ie, 32% (=0.54·0.32+0.23·0.68), as in Table 1. **Indicates a significant difference in proportions between the family friendly and not family friendly clusters at the 5 percent level.

22
Table 3: Simple Probit Estimates (Dependent variable: family friendly index) Individual Variables Firm Variables Both Firm and
Individual Variables Constant -1.177**
(12.91) -2.629** (24.97)
-1.795** (14.45)
Log Earnings .2168** (12.07)
0.1576** (10.71)
.1595** (8.087)
Female .3266** (15.69)
.2773** (12.08)
Disabled .1185** (3.214)
.0897** (2.396)
Age -.0151** (16.57)
-.0151** (16.16)
Nonwhite -.1024** (2.369)
-.1075** (2.461)
Married .0072 (0.273)
-.0032 (0.119)
Widow/Divorce -.0201 (0.755)
-.0261 (0.649)
Young Child .1708** (6.037)
.1559** (5.438)
Dependents .0888** (4.159)
.0870** (4.017)
Union Member .3063** (16.15)
.1364** (6.259)
Occupational Dummies Yes Yes Size .0867**
(14.26) .0770** (12.23)
Private Sector -.1127** (3.350)
-.0875** (2.529)
%Female .0071** (15.42)
.0040** (7.979)
%Union .0279** (6.520)
.0290** (6.049)
%Manager .0078** (7.944)
.0058** (5.830)
%Supervisor .0492** (6.758)
.0425** (5.734)
Teams .0307** (6.694)
.0288** (4.870)
Worker Responsibility .0570** (4.998)
.0484** (4.178)
Discretion .0379** (3.478)
.2900** (2.609)
Industrial Dummies Yes Yes Chi-squared 1416.9** 1250.5** 2138.3 % Correctly Predicted 69.4 70.2 70.7 N 23683 23683 23683 Note: Asymptotic t-statistics are presented in parentheses. **statistically different from zero at the 5 percent level
23
Table 4: Partial Observability Estimates (parsimonious specification)
(Dependent variable: family friendly index) Sequential Estimation
Simultaneous Estimation
worker firm worker firm Constant -1.449**
(11.27) .4620
(1.345) -1.506** (11.68)
1.480** (3.412)
Log-Earnings .3522** (13.78)
-.3399** (6.064)
.3564** (14.01)
-.4271** (7.270)
Female .2686** (10.17)
.2493** (9.751)
Disabled .0924** (2.077)
.0907** (2.249)
Age .0177** (15.73)
-.0162** (14.10)
Nonwhite -.1525** (3.001)
-.1312** (2.846)
Married -.0050 (0.154)
.0010 (0.034
Widow/Divorce .0431 (0.908)
-.0328 (0.768)
Young Child .2183** (6.191)
.1914** (5.994)
Dependents .0848** (3.311)
.0839** (3.632)
Union Member .0779** (3.078)
.0709 (3.006)
Occupational Dummies Yes Yes Size .2487**
(12.03) .2295**
(10.01) Private sector -.7783**
(6.579) -.7083**
(6.198) %Female .0081**
(6.878) .0069**
(5.835) %Union .0583**
(5.493) .0560**
(5.473) %Manager .0079**
(3.196) .0073**
(3.087) %Supervisor .0722**
(3.820) .0640**
(3.627) Teams .0364**
(3.531) .0331**
(3.420) Worker Responsibility .1203**
(3.591) .1081**
(3.462) Discretion .0770**
(3.096) .0708**
(3.057) Industry Dummies Yes Yes Rho -.4879**(3.584) Chi-squared 2189.2 2199.5 % Correct Predictions 64.1 64.4 N 23683 23683
Note: Asymptotic t-statistics are presented in parentheses. **statistically different from zero at the 5 percent level
24
Table 5: Partial Observability Estimates (extended specification)
(Dependent variable: family friendly index) Sequential Estimation Simultaneous Estimation worker firm worker Firm Constant -1.502**
(11.90) .4695
(1.345) -1.543** (12.30)
1.665** (3.718)
Log-Earnings .3144** (12.56)
-.3411** (6.089)
.3210** (13.06)
-.4369** (7.264)
Female .2601** (9.946)
.2474** (9.679)
Disable .1084** (2.444)
.1052** (2.548)
Age .0150** (12.65)
-.0141** (12.01)
Nonwhite -.1593** (3.142)
-.1431** (3.026)
Married .0084 (0.259)
.0117 (0.396)
Widow/Divorce -.0262 (0.558)
-.0205 (0.471)
Young Child .2071** (5.958)
.1894** (5.855)
Dependents .0817** (3.214)
.0815** (3.464)
Union Member .0881** (3.526)
.0817** (3.414)
Occupational Dummies
Yes Yes
Tenure -.0010 (0.245)
-.0010 (0.262)
Degree .3110** (7.411)
.2918** (7.348)
A level .2942** (7.268)
.2701** (7.088)
O level .2435** (7.126)
.2234** (6.887)
CSE -.0033 (0.081)
.0036 (0.094)
VOCERT -.0298 (1.324)
Size .2450** (9.857)
.2238** (9.124)
Private sector -.9524** (7.090)
-.8900** (6.786)
%Female .0078** (6.413)
.0069** (5.618)
%Union .0596** (5.337)
.0587** (5.426)
%Manager .0066** (2.574)
.0062** (2.487)
%Supervisor .0695** (3.546)
.0646** (3.469)
Teams .0234** (2.117)
.0221** (2.100)

25
Worker Responsibility
.1069** (3.017)
.0989** (2.944)
Discretion .0561** (2.148)
.0527** (2.127)
Industry Dummies Yes Yes Establishment Age -.0003
(0.576) -.0003
(0.535) Market Power -.1059**
(2.142) -.0954**
(2.026) JCC .1935**
(3.625) .1782**
(3.499) Single Establishment
.1612** (2.723)
.1513** (2.683)
Quality Circle .1556** (2.926)
.1347** (2.851)
No Consultation -.0427 (0.573)
-.0217 (0.309)
Rho -.4018**(2.826) Chi-squared 2337.3 2344.4 % Correct Predictions
65.1 68.9
N 23683 23683
Note: Asymptotic t-statistics are presented in parentheses. **statistically different from zero at the 5 percent level

26
Appendix 1
This appendix illustrates the problem that unmeasured determinants of wages imply for estimating compensating differentials for family friendly practices.
Assume individuals maximize utility across goods with price one and consumption of family friendly practices at work U(W, ff) where W is earnings and ff is a measure of family friendly practices.. Further, consider a hedonic equilibrium for such practices in which wages vary negatively with the measure, h(ff) and h’(ff) < 0 and imagine a wage determinant, K, which cannot be measured in empirical applications, W = h(ff) + K. The worker then maximizes the following with respect to the extent of family friendly practices: ],)([ ffKffhWUU +== . The resulting first order condition shows the worker’s indifference curve tangent to the hedonic locus: )('/ 12 ffhUU =− . The second order condition requires that U11 < 0, U22 < 0 and D = U11[W’(ff)]2 + U1W’’(ff) + [U21W’(ff)]2 + U22 < 0. The comparative static associated with changes in K across otherwise similar workers is DUffhUKff /])('[/ 2111 +−=∂∂ . This expression can be signed as positive if ff is a normal good (Henderson and Quandt 1980). Thus, any empirical estimate of the relationship between W and ff confounds the positive association from the income effect with the negative relationship from the hedonic equilibrium.

27
Endnotes 1 Such job characteristics include reduced risk of death or injury on the job, employment security and fringe benefits among others. 2 The benefits may include increased retention or improved recruiting. Waldfogel (1998) and Waldfogel et al. (1999) demonstrate that family leave increases female retention and Levoy (2000) provides an employer’s view on recruiting. 3 This condition is guaranteed by differences in the distribution of preferences between firms and workers and by search costs that make sorting imperfect. See Duncan and Stafford (1980) for more detail. 4 As a practical matter, many of the worker characteristics are aggregated to the firm level for inclusion on the firm side of the bivariate probit. 5 Jirjahn (2002) presents a similar methodology to identify high performance workplaces. As in this application, he then uses this identification as a dependent variable for which he estimates determinants in a second stage (although not using partial observability). 6 It is interesting to compare WERS figures with those from the Work-Life Balance Baseline study which asked a sample of 7,500 employees whether they were using various flexible working time arrangements (Hogarth et al., 2001). For flexible working hours, the WERS gives 33% of employees as having this arrangement available, compared to 24% actually using it (Hogarth et al., 2001, Table 3). For job-sharing, WERS figures are 17% for availability to workers, compared to 4% using job sharing. These figures differ in the expected direction, since the WERS questions relate to whether particular arrangements are available to workers - they need not necessarily use them. 7 All estimations are adjusted with the matched individual/establishment weights (empwt_nr) as provided by WERS See Forth and Kirby (2000). 8 Thus, we conduct a partial equilibrium analysis focusing on the workplace trade-off while holding constant the earnings (and hence the income effect) of workers. 9 Green (1997 p. 908) gives the marginal effect ∂G/∂lnW as αwg2 where αw is the estimated coefficient on log wages from the workplace side and g2 = f(Yα + Zθ)F[{(Yα + Zθ)-ρ(Xβ)}/(1-ρ2)1/2], where the notation follows the development in earlier sections of this paper. The coefficient from Table 5 is -.437 and g2 equals .090 thus the marginal effect is -.039. The elasticity is (∂G/∂W).(W / G ) = (∂G/∂lnW)/G = -0.039/0.322. 10 In fact, a government survey, the Work-Life Balance Baseline study of 2,500 workplaces and 7,500 employees found that women preferred extra flexibility in their working arrangements to an extension to their maternity leave (Hogarth et al, 2001, 24). Note that Germany (since Jan 2001) and the Netherlands (July 2000) have introduced a right to work reduced hours (Bain, 2001, App 5). However, small firms are exempt - below 15 in Germany, and below 10 in the Netherlands. If employers object, their objections have to pass a "harm test", ie the employer has to prove detrimental impact on the business (DTI, 2000, 6.33).. 11 The law will be based on the following (Bain, 2001, viii): 1) parents of children under 6 will make a request in writing to their employer setting out the working pattern they want; 2) the firm will have to consider the business case for or against the proposals, meet the employee (plus advisor), and make a response in writing; 3) if the response is rejection - which can be only on specific business grounds, for example increased costs - the employee will be able to complain to an Employment Tribunal; 4) there is to be no small firm exemption, and no formal harm test.
28
12 The Work-Life Balance Study also found many workers not presently covered by flexible working arrangements would like such arrangements. For example 47% of workers (males and females together) would have liked flexitime, compared to only 24% using it (Hogarth et al., 2001, Tables 4 and 6), and there are similar large gaps for conditions such as job-sharing and term-time working. Interestingly, these surveys indicate that the demand for flexible working is almost as great among men as women, and does also does not differ according to caring responsibilities (DTI, 2000, 6.8), which supports our statistical approach of analysing all the workers in the WERS, rather than particular sub-groups. 13 These low estimates are bolstered by evidence from the WERS that most managers of firms with family friendly practices have found them “cost-effective.” First, we note that expenditures can be very costly even as being cost-effective. Second, we would expect that in the implicit market every firm has found a cost-effective combination of earnings and family friendly practices but could not expect this to provide any guidance to a government mandated level of practices.