the impact of working capital management on firms
TRANSCRIPT

International Journal of Scientific & Engineering Research Volume 10, Issue 2, February-2019 1631 ISSN 2229-5518
IJSER © 2019 http://www.ijser.org
The Impact of Working Capital Management on Firms’ Profitability
Mulualem Mekonnen Admasu
Abstract— A well planed and implemented working capital management is expected to contribute positively for the firms profit and then its wealth maximization objective. The purpose of this study is to investigate the im-pact of working capital management on firms’ profitability. In light of this objective the study used survey of documentary analysis of companies’ audited financial statements. Accordingly, the study selected a sample of thirteen companies for the period of five years (2005-2009). Data was then analyzed on quantitative basis using Pearson’s correlation and OLS regression analysis. The results showed that there is statistical significance negative relationship between profitability (Gross operat-ing profit) and working capital management (Average collection period, Inventory turnover in days’, Average payment period, Cash conversion cycle, Current ratio, Debt ratio and Size firms. It means that, companies man-agers can create profits or value for their companies and share holders by handling correctly the cash conversion cycle and keeping each different component of working capital to a possible optimum level. The study also found that there is a significant negative relationship between liquidity and profitability. Moreover, the re-searcher finds that there is strongly significance positive relationship between size and firm profitability. Unlike, the study found that there is no statistically significance negative relationship between debt used and firms prof-itability. Index Terms— cash conversion cycle, firm size, working capital and working capital management.
—————————— ——————————
1 INTRODUCTION
orporate literature has traditionally focused on the study of long-term financial decisions such as the capital structures, investments, dividends and firm
valuations. However, finance theories are discussed under three main threads as capital budgeting, capital structure and working capital management. As a re-sult, the first two are mostly related to financing and managing long term investments. Meanwhile, finan-cial decisions about working capital are mostly related to financing and managing short term investments and under both current assets and current liabilities simul-taneously (Mueller, 1953; Pinches, 1992; Brealey and Myers, 1996; Damodaran, 2002). Hence, management of working capital refers to management of current assets and current liabilities (Ross et al., 2003, Raheman and Nasr, 2007).
Management of working capital is an important com-ponent of corporate financial management because it directly affects the profitability of firms. Smith (1980) concluded that working capital management is im-
portant because of its effect on firm’s profitability and risk, and consequently its value. Similarly, Deloof (2003) indicated that the way working capital is man-aged has a significant impact on profitability of firms. The above studies point out that there is a certain level of working capital requirement, which potentially maximizes firm’s returns. On the other hand, Kargar and Bluementhal (1994) mentioned that bankruptcy may be likely for firms that put inaccurate working capital management procedures into practice, even though their profitability is constantly positive. There-fore, firms must to avoid receding from optimal work-ing capital level by bringing the aim of profit maximi-zation in the foreground. Hence, it is indirect contra-diction to focus only on liquidity and consequently pass over profitability to working capital management. Because, conservative liquidity policy may goes be-low optimal level of working capital requirement and treats the day to day operation of a business. Whereas, excessive levels of working capital can easily result in a substandard return on assets; while inconsiderable amount of it may incur shortages and difficulties in
C IJSER

International Journal of Scientific & Engineering Research Volume 10, Issue 2, February-2019 1632 ISSN 2229-5518
IJSER © 2019 http://www.ijser.org
maintaining day-to-day operations. The ultimate objective of any firm is to maximize its profit. However, preserving liquidity of the firm is an important objective as well. The problem is that in-creasing profits at the cost of liquidity can bring seri-ous problems to the firm. Therefore, there must be a tradeoff between these two objectives (liquidity and profitability) of firms. One objective should not be at the cost of the other because both have their own im-portance. If firms do not care about profit, they cannot survive for a longer period. In other round, if firms do not care about liquidity, they may face the problem of insolvency or bankruptcy. For these reasons managers of firms should give proper consideration for working capital management as it does ultimately affect the profitability of firms. Indeed, firms may have an opti-mal level of working capital that maximizes their val-ue. Large inventory and generous trade credit policy may lead to high sales. Large inventory also reduces the risk of a stock-out. Trade credit may stimulate sales because it allows a firm to access product quality before paying (Long, 1993 and Raheman and Nasr, 2007). Another component of working capital is ac-counts payables, Raheman and Nasr (2007) indicated that delaying payment of accounts payable to suppliers allows firms to access the quality of obtaining prod-ucts and can be inexpensive and flexible source of fi-nancing. On the other hand, delaying of such payables can be expensive if a firm is offered a discount for the early payment. By the same token, uncollected ac-counts receivables can lead to cash inflow problems for the firm. A popular measure of working capital management is the cash conversion cycle, that is, the time span be-tween the expenditure for the purchases of raw materi-als and the collection of sales of finished goods. Deloof (2003) found that the longer the time lags, the larger the investment in working capital, and also a long cash conversion cycle might increase profitability because it leads to higher sales. However, corporate profitability might decrease with the cash conversion cycle, if the costs of higher investment in working capital rise faster than the benefits of holding more inventories or granting more trade credit to customers. In general, working capital management is not only improving financial performance in today’s cash-strapped and uncertain economy, but it is the question of meeting firm’s day to day operation. Hence, it may
have both negative and positive impact on firm’s prof-itability, which in turn, has negative and positive im-pact on the shareholders’ wealth.
2. Statement of the Problems
Working capital management is an important issue in any organization. This is because without a proper management of working capital components, it’s diffi-cult for the firm to run its operations smoothly. That is why Brigham and Houston (2003) mentioned that about 60 percent of a typical financial manager’s time is devoted to working capital management. Hence, the crucial part of managing working capital is maintain-ing the required liquidity in day-to-day operation to ensure firms smooth running and to meet its obligation (Eljelly, 2004). Further, working capital management has been major issue especially in developed countries. As a result, in order to explain the relationship between working cap-ital management and profitability different researches have been carried out in different parts of the world especially in developed countries. Indeed, the research has tried to find studies on the area in the context of our country Ethiopia. However, there are no similar studies; published or unpublished in the context of Ethiopia to the researcher. Hence, the research be-lieves that, despite the above importance this issue failed to attract the attention of researchers in the country and the area demands empirical justifications to examine the impacts of working capital manage-ment on profitability of firms. In general, in its effect most Ethiopian company’s managers thought regarding working capital manage-ment is, to shorten the cash conversion cycle (tradi-tional views) to increase firm’s profitability. However, if firm has higher level of account receivable due to the generous trade credit policy, it would result to longer cash conversion cycle. In this case, the longer cash conversion cycle will increase profitability and thus, the traditional view of managers cannot be ap-plied to all circumstances. Hence, lack of proper re-search study on the area gives a chance for Ethiopian company’s managers to have limited awareness in re-lation to working capital management to increase firm’s profitability. Therefore, by keeping the above problem in mind, the study tried to find out the im-pacts of working capital management on firms profit-ability in Addis Ababa city with a special reference to
IJSER

International Journal of Scientific & Engineering Research Volume 10, Issue 2, February-2019 1633 ISSN 2229-5518
IJSER © 2019 http://www.ijser.org
the manufacturing sector of share companies.
3. Research Objective and Hypotheses The study aims to examine the impacts of working capital management on profitability of firms in Addis Ababa city with a special reference to the manufactur-ing sector of share Companies. In light of the above research objective several statements of supposition can be made in view of the impacts of working capital management on firms’ profitability. Hence, study attempted to test the following research hypotheses (HP): HP1: There is positive relationship between efficient working capital management and profitability of firms’. HP2: There is a negative relationship between cash conversion cycle and profitability of firms’. HP3: There is a negative relationship between liquidity and profitability of firms. HP4: There is a positive relationship between firm size and profitability. HP5: There is a negative relationship between debt used by the firms and their profitability.
4. Research Method Adopted In order to achieve the main research objectives a quantitative method is adopted. The purpose of using such approach is to gather data that help the researcher to investigate cause-effect relationships. In this partic-ular case, the effect is the company’s profitability and the research is targeted at identifying significant caus-es, i.e. determinants on profitability related to working capital management. In line with this, in this section the researcher discuss-es points on sampling and data collection method, var-iable identification, model specification and research hypothesis.
4.1 Sampling and data collection method According to Addis Ababa city administration trade and industry bureau, formally registered manufactur-ing share companies’ until end of the year 2004 were about 29 firms. Since, the study covered only five years data (from 2005 – 2009) manufacturing compa-nies registered after end of year 2004 were not eligible for the study. Therefore, the total number of popula-tion eligible and used for the study was 29 manufac-turing share companies found in Addis Ababa city ad-ministration.
In designing a sample, basing the sample selection on a comprehensive list of potential respondents (compa-nies) who have an equal chance of selection is vital to increasing the representativeness of the samples. Ac-cordingly, after stratifying the population using nature of operations and turnover the study selected a total sample of thirteen (13) companies from all sectors and turnover groups’ using random sampling techniques. To gather data on working capital component and profitability, it is apparent to use survey of structured documentary review. Accordingly, companies audited financial statement especially balance sheet and in-come statement was reviewed. For the reason that the ultimate data’s for the study couldn’t be found simply using questioner or face to face interviews with con-cerned bodies, thoroughly the study was depend on secondary data.
4.2 Variable identification and model specifica-tion
The study identified a total of nine (9) variables to un-dertake the study which includes one dependent, four independent and four control variables based on the previews studies on different countries on similar top-ic.
Explained (Dependent) variable Gross operating profitability (GOP)1 that is a measure of profitability of firm is used as dependent variable. It is defined as sales minus cost of goods sold, and di-vided by total assets minus financial assets. Explanatory (Independent) Variable Average collection period (ACP) is used as a proxy for the collection policy of firms and it is computed by dividing account receivable by sales and multiplying the result by 365 (number of days in a year). Inventory turnover in days (ITID) is used as a measure for the inventory policy of firms and it is computed by dividing inventory by cost of goods sold and multiply-ing with 365 days. 1 The researcher anticipated that, for a number of firms in the sample, financial assets, which are chiefly shares in affiliated firms, are/may be a significant part of total assets. When the fi-nancial assets are main part of total assets (presented on balance sheet), its operating activities will contribute little to overall re-turn on assets. Hence, that is the reason why return on assets is not considered as a measure of profitability for this study.
IJSER

International Journal of Scientific & Engineering Research Volume 10, Issue 2, February-2019 1634 ISSN 2229-5518
IJSER © 2019 http://www.ijser.org
Average payment period (APP) is used as proxy for the payment policy of firms and computed by dividing accounts payable by purchases and multiplying the result by 365. Cash conversion cycle (CCC) which is used as a com-prehensive measure of working capital management. It is measured by adding average collection period with inventory turnover in days and deducting average payment period. Control Variables Current ratio (CR) is used as a conventional measure of firm’s liquidity. Current ratio is calculated by divid-ing current assets by current liabilities. Companies with relatively high levels of liquidity are expected to post low levels of profitability and vice versa. Firm size was other control variable and calculated as (Natural logarithm of sales). Debt ratio (DR) is also used as a proxy for leverage and calculate by dividing total debt by total assets, and finally, sales growth (SG) were used as a measure of sales growth and calculated as ((this year’s sales mi-nus previous year’s sales)/previous year’s sales). Therefore, the general formula used for the model is:
Source: Raheman and Nasr, (2007) Where: GOPit = Gross operating profit of a firm i at time t; i = 1, 2, 3…, 13 firms. β0 = The intercept of equation β0 = Coefficient of X it variables Xit = The different independent variables for working
capital management of firm i at time t. t = Time from 1, 2…, 5 years and ε = Error term Finally, the above general least square model is con-verted in to specified variables as follows; GOPit = β0 + β1 (ACPit) + β2 (ITIDit) + β3 (APPit) + β4
(CCC it) + β5 (CRit) + β6 (DRit) + β7 (SGit) + β8 (Sizeit) + ε
Model used for regressing account receivable as inde-pendent variable.
GOP it =β0 + β1 (ACP it) + β2 (CR it) + β3 (DR it) + β4 (SG it) + β5 (Size it) +ε
Model used for regressing inventor as an independent variable
GOP it =β0 + β1 (ITID it) + β2 (CR it) + β3 (DR it) + β4 (SG it) + β5 (Size it) +ε
Model used for regressing account payable as an inde-pendent variable
GOP it =β0 + β1 (APP it) + β2 (CR it) + β3 (DR it) + β4 (SG it) + β5 (Size it) +ε
Model used for regressing cash conversion cycle as an independent variable
GOP it =β0 + β1 (CCC it) + β2 (CR it) + β3 (DR it) + β4 (SG it) + β5 (Size it) +ε
Where: GOP= Gross operating profit ACP= Average collection period ITID= Inventory turnover in days’ APP= Average payment period CCC= Cash conversion cycle CR= Current ratio DR= Debt ratio Size= Natural logarithm of Sales SG= Sales growth and ε= Error term
4.3 Data Presentation and Analysis Used It is known that different software packages have dif-ferent features used to generate some statistical output even if the result is the same. As a result for the sake of convenience in presenting the regression output and balancing limitations of each package the researcher used and processed the raw data using SPSS V19.0 and Eviews 6 software packages. Finally, the study was analyzed using descriptive sta-tistics, Pearson correlation coefficient and regression (pooled ordinary least squares) analysis. Descriptive analyses were used to describe patterns of behavior or relevant aspects of phenomena and detailed infor-mation about each variable under the study. The study used correlation analysis, specifically Pearson correla-tion to measure the degree of association between dif-ferent variables under consideration. Similarly, with the help of Eviews 6 software the study used multiple regression analysis to estimate the caus-al relationships between profitability variable, liquidi-ty and other chosen variables. Indeed, in regression analysis a pooled regression2 was conducted since the 2 Pooled regression, involve estimating a single equation on all the data
IJSER
International Journal of Scientific & Engineering Research Volume 10, Issue 2, February-2019 1635 ISSN 2229-5518
IJSER © 2019 http://www.ijser.org
data has both time series and cross-sectional dimen-sions. The major benefits of using penal data is, more useful in studying the dynamics of adjustment, and it is better able to identify and measure effects that are simply not detectable in pure cross-sections or pure time series data. Moreover, many variables can be more accurately measured at the micro level and bias-es resulting from aggregation over firms or individuals are eliminated (Brooks, 2008 pp.488-489).
5. Analysis Of The Study As the research tried to highlight on the data analysis part, the study was performed using three types of analysis as descriptive, correlation and regression analysis.
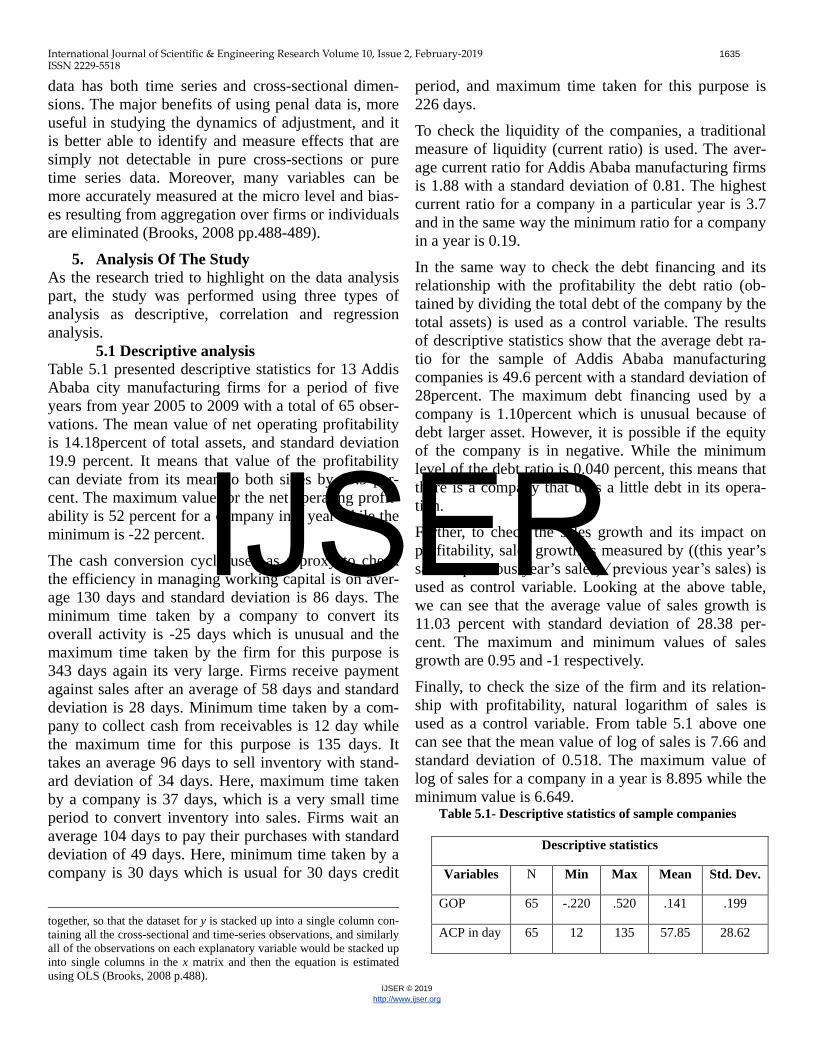
5.1 Descriptive analysis Table 5.1 presented descriptive statistics for 13 Addis Ababa city manufacturing firms for a period of five years from year 2005 to 2009 with a total of 65 obser-vations. The mean value of net operating profitability is 14.18percent of total assets, and standard deviation 19.9 percent. It means that value of the profitability can deviate from its mean to both sides by 19.9 per-cent. The maximum value for the net operating profit-ability is 52 percent for a company in a year while the minimum is -22 percent. The cash conversion cycle used as a proxy to check the efficiency in managing working capital is on aver-age 130 days and standard deviation is 86 days. The minimum time taken by a company to convert its overall activity is -25 days which is unusual and the maximum time taken by the firm for this purpose is 343 days again its very large. Firms receive payment against sales after an average of 58 days and standard deviation is 28 days. Minimum time taken by a com-pany to collect cash from receivables is 12 day while the maximum time for this purpose is 135 days. It takes an average 96 days to sell inventory with stand-ard deviation of 34 days. Here, maximum time taken by a company is 37 days, which is a very small time period to convert inventory into sales. Firms wait an average 104 days to pay their purchases with standard deviation of 49 days. Here, minimum time taken by a company is 30 days which is usual for 30 days credit
together, so that the dataset for y is stacked up into a single column con-taining all the cross-sectional and time-series observations, and similarly all of the observations on each explanatory variable would be stacked up into single columns in the x matrix and then the equation is estimated using OLS (Brooks, 2008 p.488).
period, and maximum time taken for this purpose is 226 days. To check the liquidity of the companies, a traditional measure of liquidity (current ratio) is used. The aver-age current ratio for Addis Ababa manufacturing firms is 1.88 with a standard deviation of 0.81. The highest current ratio for a company in a particular year is 3.7 and in the same way the minimum ratio for a company in a year is 0.19. In the same way to check the debt financing and its relationship with the profitability the debt ratio (ob-tained by dividing the total debt of the company by the total assets) is used as a control variable. The results of descriptive statistics show that the average debt ra-tio for the sample of Addis Ababa manufacturing companies is 49.6 percent with a standard deviation of 28percent. The maximum debt financing used by a company is 1.10percent which is unusual because of debt larger asset. However, it is possible if the equity of the company is in negative. While the minimum level of the debt ratio is 0.040 percent, this means that there is a company that uses a little debt in its opera-tion. Further, to check the sales growth and its impact on profitability, sales growth is measured by ((this year’s sales – previous year’s sales) ∕ previous year’s sales) is used as control variable. Looking at the above table, we can see that the average value of sales growth is 11.03 percent with standard deviation of 28.38 per-cent. The maximum and minimum values of sales growth are 0.95 and -1 respectively. Finally, to check the size of the firm and its relation-ship with profitability, natural logarithm of sales is used as a control variable. From table 5.1 above one can see that the mean value of log of sales is 7.66 and standard deviation of 0.518. The maximum value of log of sales for a company in a year is 8.895 while the minimum value is 6.649.
Table 5.1- Descriptive statistics of sample companies
Descriptive statistics
Variables N Min Max Mean Std. Dev.
GOP 65 -.220 .520 .141 .199
ACP in day 65 12 135 57.85 28.62
IJSER

International Journal of Scientific & Engineering Research Volume 10, Issue 2, February-2019 1636 ISSN 2229-5518
IJSER © 2019 http://www.ijser.org
ITID 65 37 200 97.58 34.02
APP 65 30 226 104.49 48.86
CCC 65 -25 343 129.88 86.53
CR 65 .190 3.700 1.88 .812
DR 65 .040 1.100 .496 .280
SG 65 -1.00 .950 .11 .284
Size of the company
65 6.64 8.89 7.66 .518
Source: SPSS output from financial statements of sample companies, 2005-2009
5.2 Correlation Analysis From table 5.2 below the researcher started the analy-sis of correlation results between the average collec-tion period and gross operating profitability. The result of correlation analysis shows a negative coefficient – 0.637, with p-value of (0.000). It indicates that the result is highly significant at ά = 1 percent significant level and that if the average collection period increases it will have a negative impact on the profitability and decrease it. Correlation results between inventory turnover in days and the gross operating profitability also indicate the same result. The correlation coeffi-cient is – 0.461 and the p-value of (0.000). This again shows that the result is highly significant at ά = 1percent. It also indicates that if the firm takes more time in selling inventory, it will adversely affect its profitability. Correlation results among the payable turnover in days or average payment period also indi-cate the same trend. Here again, the coefficient is neg-ative but not significant. The coefficient is - 0.048 and the p value of (0.703). This means that the less profit-able firms wait longer to pay their bills. Moreover, a negative relationship between number of day’s ac-counts payable and profitability is consistent with the theoretical view that less profitable firms wait longer to pay their bills. In that case, profitability affects the account payables policy and vice versa. An alternative explanation for a negative relationship between the number of day’s accounts payable and profitability could be that firms wait too long to pay their accounts payable. Speeding up payments to suppliers might in-crease profitability because firms often receive a sub-stantial discount for prompt payment. The cash con-version cycle which is a comprehensive measure of
working capital management also has a negative coef-ficient – 0.569 and the p value of (0.000). Unlike, APP it is significant at ά = 1percent. It means that if the firm is able to decrease this time period known as cash conversion cycle, it can increase its profitability. By analyzing the results the researcher concluded that, if the firm is able to reduce these time periods, then the firm is efficient in managing working capital. This ef-ficiency will lead to increase its profitability. To sum-marize the above discussion demonstrates that paying suppliers longer and collecting payments from cus-tomers earlier, and keeping products in stock less time, are all associated with an increase in the firm’s profit-ability. Current ratio is a traditional measure of checking li-quidity of the firm. On the same table 5.2 current ratio has a significant negative relationship with profitabil-ity measured by gross operating profitability with the coefficient of –0.510 and p-value of (0.000) and the result is significant at ά = 1percent. It indicates that the two objectives of liquidity and profitability have inverse relationships. So, the Addis Ababa manufac-turing firms need to maintain a balance or tradeoff be-tween these two measures. Meanwhile, debt ratio (DR) used as a proxy for leverage of a company, the Pearson correlation analysis shows that positive rela-tionship with gross profit and the coefficient is 0.049. However, the P- value is not significant at all. Further with reference to the control variables, sales growth and size of the company are significant. Cor-porate profitability is positively associated with sales growth of a company. The coefficient is 0.550 with p-value of (0.000) and the result is highly significant at ά = 1percent. This shows that as sales growth over time will increase company’s profitability of a firm. One should not overlook the positive significant associa-tion that exists between gross operating profit and log-arithm sales (the measures of size). Hence, the result does not change if the logarithm of sales is used to measure the size. As it can be seen in the correlation table 4.10, the coefficient is positive 0.674 with p-value of (0.000) and the result is highly significant at ά = 1percent. This similar with the theoretical view that higher sale will generate higher profit. To sum, the above two analysis pinpointed that sales growth and company size are significantly predominate factors for corporate profitability. On the other hand Pearson’s correlation table 5.2 dis-
IJSER

International Journal of Scientific & Engineering Research Volume 10, Issue 2, February-2019 1637 ISSN 2229-5518
IJSER © 2019 http://www.ijser.org
played a significant positive relationship between the average collection period (ACP) and cash conversion cycle (CCC) the correlation coefficient is 0.618 and the p-value of (0.000). That ratio is slightly significant at ά = 1%, which means that if a firm takes more time to collect cash against the credit sales it will increase its operation or cash conversion cycle. There is also a positive relationship between inventory turnover in days (ITID) and the cash conversion cycle which means that if the firm takes more time to sell inventory it will lead to increase in the cash conversion cycle as well. The correlation coefficient is positive and 0.460 with the p-value of (0.000) showing highly significant at ά = 1percent. This means, whenever a firm lowers it time to convert raw material and good in process to finished good it decrease cash conversion cycle. Un-like the above output the average payment period (APP) and cash conversion cycle have a negative rela-tionship. The coefficient is – 0.063, the p-value is (.060), highly significant at ά = 10 percent. It means that if firms take more time to pay their purchases than the time for collection and selling inventory, the cash conversion cycle will be reduced. In general, these negative relationships between cash conversion cycle, average collection period, average payment period and inventory turnover in days with the profitability of companies are consistent with the literature review and have significant effect on the profitability of company. The results of correlation analysis indicated that, as far as Addis Ababa manu-facturing firms are concerned, working capital man-agement is very strongly and significantly affects their profitability. Therefore, the researcher accepted its all hypotheses except (HP5) that “there is a negative rela-tionship between debt used by the firms and profitabil-ity” because the p-value is not significant event at 10 percent. Table 5.2 Pearson’s correlation coefficients
5.3 Regression Analysis The overall regression equation on table 4.3 shows that there is a negative relationship between average collection period (ACP), inventory turnover in day (ITID), average payment period (APP) and cash con-version cycle (CCC) with profitability measured by gross operating profit. It is consistent with the litera-ture that a decrease in the working capital component including cash conversion cycle will generate more profits for a company. As a result all independent vari-ables have a negative coefficient and the result is high-ly significant for ACP, ITID, APP and CCC at ά = 1percent significant level. Therefore, this is consist-ence with the view of Weston and Brigham (1977, P. 690) minimizing components of working capital will increase profitability as a measure of efficiency CCC.
IJSER

International Journal of Scientific & Engineering Research Volume 10, Issue 2, February-2019 1638 ISSN 2229-5518
IJSER © 2019 http://www.ijser.org
Similarly, the regression shows that the larger firms (measured through the natural logarithm of sales) the higher profit with a very high level of significance. The regression coefficient (0.212) is very higher from all output and signifying that size of the company is playing a greater role for firm’s profitability with a p-value of (0.000), showing the result is very strongly significant at ά = 1percent. This is consistence with the theoretical views of large firms higher economic of scale and good will in the market. Using these market diversifications is the right avenue which increase sales and there by maximize profitability. At the same time, on table 4.11 sales growths is statistically signif-icant where gross operating profit increases as sales increase. The result shows sales growths has a positive coefficient of 0.157 and significant at ά = 1percent with a p-value of 0.0052. Table 4.3 Result of multiple regressions for pooled OLS
Analysis for multiple regressions for model 1 Below table 4.4 presented the result for model 1, it indicates that the coefficient of accounts receivable is negative -0.002 and p-value of 0.0277 which is signif-icant at ά = 1percent. It implies that the increase or decrease in account receivables will significantly af-fect profitability of the firm. The above analysis is similarly with Fabozzi and Peterson (2003) those who mentioned that increase in amounts of account receiv-able has opportunity costs and bad debt, while increas-ing sales for a company. Therefore, whenever collec-tion periods increases bad debt increase and hence profitability will full down and vice versa. Similarly, the finding is consistence with previous research who found negative relationship between accounts receiva-bles and corporate profitability (Deloof, 2003; Laz-aridis and Tryfonidis, 2006; Raheman and Nasr, 2007;
Falope and Ajilore, 2009 and Amarjit et. al. 2010). The regression result for current ratio (CR) which is a traditional measure of liquidity has a negative coeffi-cient -0.047 and signifying negative relationship with profitability. The p-value 0.0392 shows that the coeffi-cient is significant at ά = 1percent. On the same table 4.13 debt ratio is used as a proxy for leverage; from analysis of regression it shows that there is a negative relationship with gross operating profit. The coefficient is -0.111, but only marginally significant with p-value 0.073 at ά = 10percent. This means that if there is an increase in debt ratio it will lead to decrease in profitability of firm. Similarly log of sales used as proxy for size of a company shows a significant positive relationship with profitability which means that bigger size firms have more profita-bility compared to firms of smaller size with the coef-ficient and p-value of 0.201 and 0.0016 respectively. In general having with the above coefficient the re-gression equation makes GOP to have a value of -0.663 and -0.863 if all coefficients on variables are constant and zero respectively. Therefore, the regres-sion output has economical meaning for profitability of a firm.
Table 4.4 Result of multiple regressions for model 2
Analysis of multiple regressions for model 2 Below looking table 4.4 coefficients, the intercept C has a value of -1.061 and also highly significant. Simi-larly, the coefficient for inventory turnover in days is negative and highly significant at ά. = 1percent with the coefficient -0.002and p value 0.003. The coeffi-cient implies that the increase or decrease in the inven-
IJSER

International Journal of Scientific & Engineering Research Volume 10, Issue 2, February-2019 1639 ISSN 2229-5518
IJSER © 2019 http://www.ijser.org
tory turnover in days, significantly affect profitability of a firms’. It can be interpreted that if the inventory takes more time to sell, it will adversely affect profita-bility. Again the finding is consistence with the previ-ous studies, Garcia and Martinez (2007) and Raheman and Nasr (2007) Moreover, all the other variables are also significantly affecting profitability as in case of the first regression. But, unlike that of the first regres-sion here debt ratio coefficient is -0.112 and signifi-cant at ά. = 1percent having a p-value of 0.0488. whereas increase in sales has a positive impact on profitability while all other control variables like cur-rent ratio and sales growth have a significantly nega-tive and positive effect on profitability of a firm re-spectively.
Table 4.5 Result of multiple regressions for model 2
Analysis of multiple regressions for model 3 The result table 4.6 reveled that, there is negative rela-tionship between gross operating profit and average number of account payable. The coefficient of inter-cept C and average payment period is -1.082 and -0.001 respectively. The coefficient including intercept and average payment period (proxy for payment poli-cy) is negative and highly significant at ά = 1percent, and implies that the increase or decrease in the aver-age payment period, significantly affects profitability of the firm. However, the finding is not consistent with Lazaridis and Tryfonidis (2006) who claimed that there was a positive relationship between number of day’s accounts payable and profitability. Differing from Lazaridis and Tryfonidis (2006) the finding is similar to Eljelly (2004) and Mathuva (2009) who found a strong negative relationship between number
of day’s accounts payable and profitability. Hence, the negative relationship between average payment period and profitability indicates that the less profitable firms wait longer to pay their bills. Similarly, all other vari-ables are also significantly affect firms profitability. All of them are significant at ά = 1percent. However, sales growth and size of the firm (measured in terms of log of sales) has a positive impact on firm profita-bility while other control variable like current and debt ratio has a negative impact on profitability of a firm and strongly significant at ά = 1percent
Table 4.6 Result of multiple regressions for model 3
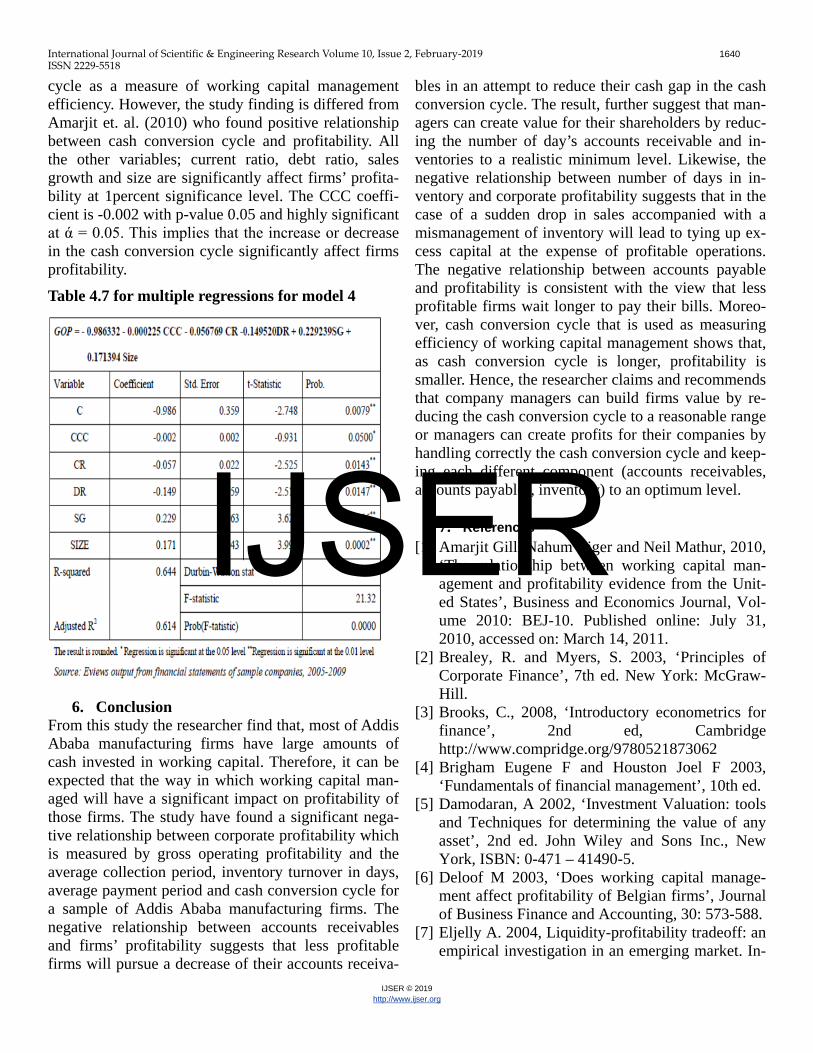
Analysis of multiple regressions for model 4 Finally, the cash conversion cycle is used as a popular to measure efficiency of working capital management. Therefore, model 4 took the cash conversion cycle as an independent variable, and the result on table 4.7 indicated that CCC has negative coefficient and signif-icant at ά = 5percent. This means there is a negative relationship between cash conversion cycle and firms profitability. The researcher finding is balanced against the previews studies of one African country (Nigeria) Garcia and Martinez (2007) who found strong negative relationship between cash conversion
IJSER
International Journal of Scientific & Engineering Research Volume 10, Issue 2, February-2019 1640 ISSN 2229-5518
IJSER © 2019 http://www.ijser.org
cycle as a measure of working capital management efficiency. However, the study finding is differed from Amarjit et. al. (2010) who found positive relationship between cash conversion cycle and profitability. All the other variables; current ratio, debt ratio, sales growth and size are significantly affect firms’ profita-bility at 1percent significance level. The CCC coeffi-cient is -0.002 with p-value 0.05 and highly significant at ά = 0.05. This implies that the increase or decrease in the cash conversion cycle significantly affect firms profitability.
Table 4.7 for multiple regressions for model 4
6. Conclusion From this study the researcher find that, most of Addis Ababa manufacturing firms have large amounts of cash invested in working capital. Therefore, it can be expected that the way in which working capital man-aged will have a significant impact on profitability of those firms. The study have found a significant nega-tive relationship between corporate profitability which is measured by gross operating profitability and the average collection period, inventory turnover in days, average payment period and cash conversion cycle for a sample of Addis Ababa manufacturing firms. The negative relationship between accounts receivables and firms’ profitability suggests that less profitable firms will pursue a decrease of their accounts receiva-
bles in an attempt to reduce their cash gap in the cash conversion cycle. The result, further suggest that man-agers can create value for their shareholders by reduc-ing the number of day’s accounts receivable and in-ventories to a realistic minimum level. Likewise, the negative relationship between number of days in in-ventory and corporate profitability suggests that in the case of a sudden drop in sales accompanied with a mismanagement of inventory will lead to tying up ex-cess capital at the expense of profitable operations. The negative relationship between accounts payable and profitability is consistent with the view that less profitable firms wait longer to pay their bills. Moreo-ver, cash conversion cycle that is used as measuring efficiency of working capital management shows that, as cash conversion cycle is longer, profitability is smaller. Hence, the researcher claims and recommends that company managers can build firms value by re-ducing the cash conversion cycle to a reasonable range or managers can create profits for their companies by handling correctly the cash conversion cycle and keep-ing each different component (accounts receivables, accounts payables, inventory) to an optimum level.
7. References [1] Amarjit Gill, Nahum Biger and Neil Mathur, 2010,
‘The relationship between working capital man-agement and profitability evidence from the Unit-ed States’, Business and Economics Journal, Vol-ume 2010: BEJ-10. Published online: July 31, 2010, accessed on: March 14, 2011.
[2] Brealey, R. and Myers, S. 2003, ‘Principles of Corporate Finance’, 7th ed. New York: McGraw- Hill.
[3] Brooks, C., 2008, ‘Introductory econometrics for finance’, 2nd ed, Cambridge http://www.compridge.org/9780521873062
[4] Brigham Eugene F and Houston Joel F 2003, ‘Fundamentals of financial management’, 10th ed.
[5] Damodaran, A 2002, ‘Investment Valuation: tools and Techniques for determining the value of any asset’, 2nd ed. John Wiley and Sons Inc., New York, ISBN: 0-471 – 41490-5.
[6] Deloof M 2003, ‘Does working capital manage-ment affect profitability of Belgian firms’, Journal of Business Finance and Accounting, 30: 573-588.
[7] Eljelly A. 2004, Liquidity-profitability tradeoff: an empirical investigation in an emerging market. In-
IJSER

International Journal of Scientific & Engineering Research Volume 10, Issue 2, February-2019 1641 ISSN 2229-5518
IJSER © 2019 http://www.ijser.org
ternational Journal of Commerce and Manage-ment, 14: 48-61.
[8] Fabozzi Frank, j. and Peterson Pamela P., 2003, ‘Financial management and analysis’, 2nd ed, John Wiley and Sons, Inc., publisher, New Jersey Can-ada.
[9] Falope OI and Ajilore OT, 2009, Working capital management and corporate profitability: evidence from panel data analysis of selected quoted com-panies in Nigeria. Research Journal of Business Management, 3: 73-84.
[10] Garcia-Teruel, PJ and Martinez-Solano, PM, 2007, ‘Effects of working capital management on SME profitability’. International Journal of Mana-gerial Finance, 3: 164-177.
[11] Kargar, J. and R. Bluementhal, 1994, ‘Lever-age impact on working capital on small business’, TMA J., 14: 46-53.
[12] Lazaridis, I. and Tryfonidis, D. 2006, ‘Rela-tionship between working capital management and profitability of listed companies in the Athens stock exchange’, Journal of Financial Management and Analysis, 19(1), 26-35.
[13] Mathuva D. 2009, ‘The influence of working capital management components on corporate profitability: a survey on Kenyan listed firms’, Re-search Journal of Business Management, 3: 1-11.
[14] Muller, F.W. 1953, ‘Corporate Working Capi-tal and profitability’ J. Univ. Chicago, 26: 157- 72.
[15] Pinches, G.E. 1992, ‘Essentials Management’, 4th ed, Harper Collins Publishers, New York, ISBN: 0-06-500450-7.
[16] Raheman, A. and Nasr M., 2007, ‘Working capital management and profitability – case of Pa-kistani firms’, International Review of Business Research Papers,3:279-300.
[17] Smith, K. V. 1980 Profitability and liquidity trade off in working capital management. In Read-ing on the Management of Working capital (pp. 549-562). St. Paul: West Publishing Co.
IJSER