the impact of marketing mix, brand awareness, and …
TRANSCRIPT
THE IMPACT OF MARKETING MIX, BRAND
AWARENESS, AND WORD OF MOUTH
TOWARDS CUSTOMER LOYALTY ON
ONITSUKA TIGER IN INDONESIA
By
Giovanni Samuel
Macawalang
014201500156
A Skripsi presented to the
Faculty of Business President University
in partial fulfillment of the requirements for Bachelor Degree in Management
February 2019

i
PANEL OF EXAMINERS
APPROVAL SHEET
The Panel of Examiners declare that the skripsi entitled “THE
IMPACT OF MARKETING MIX, BRAND AWARENESS, AND
WORD OF MOUTH TOWARDS CUSTOMER LOYALTY ON
ONITSUKA TIGER IN INDONESIA” that was submitted by
Giovanni Samuel Macawalang majoring in Management concentrating
in Internati onal Business from the Faculty of Business was assessed
and approved to have passed the Oral Examinations on February 14th,
2019.

ii
DECLARATION OF
ORIGINALITY
I declare that this skripsi, entitled “The Impact of Marketing Mix,
Brand Awareness, and Word of Mouth Towards Customer Loyalty
on Onitsuka Tiger in Indonesia” is, to the best of my knowledge and
belief, an original piece of work that has not been submitted, either in
whole or in part, to another university to obtain a degree.
Cikarang, Indonesia, January 29th, 2019
Giovanni Samuel Macawalang

iii
ABSTRACT
The purpose of this quantitative research was to know and explain the impact of
marketing mix, brand awareness, and word of mouth towards customer loyalty on
Onitsuka Tiger in Indonesia. The results were taken from a questionnaire form
consisting of 32 statements with the Likert scale as a tool to measure the level of
agreement was distributed to 137 respondents. Non-probability sampling with
convenience sampling was used in this study. Data analysis used in this research
were validity, reliability, classical assumption, and multiple regression. The result
affirmed that brand awareness has a partial significant influence towards customer
loyalty. While product, promotion, price, place, and word of mouth has no
significant influence towards customer loyalty. This study also showed that all
independent variables (product, promotion, price, place, brand awareness, and word
of mouth) have simultaneously significant influence towards customer loyalty with
73.8% of adjusted R2 square.
Keywords: Product, Promotion, Price, Place, Brand Awareness, Word of
Mouth, Customer Loyalty

iv
ACKNOWLEDGMENTS
The completion of this skripsi is a grateful achievement that I wish to express my
gratitude and thanks completely towards God, Jesus Christ for the support on
power, knowledge and perseverance in writing this thesis. This work is presented
as one of the requirements to accomplish the Bachelor of Science at President
University. This thesis is also completed with the support and assistance from
several others. Therefore, I would like to deliver my highest appreciation for these
people
1. My dearest family, my father Maurits Macawalang, my mother Iriana Pieter,
and my older sister Gabriella Macawalang for their endless support and
love.
2. Jean Richard Jokhu, SE., M.M. as my thesis advisor, who is always patient,
provides advices and knowledge in doing my thesis, and also teach and
guide me in my University life.
3. My ARK SURVIVAL squad which are Eric Ricardo Senjaya and Holydhio
Gilbert S. Thank you all for the memories, laugh, and support that helped
me a lot during my thesis period.
4. My COOL friends who I can’t mention one by one, thank you for the
support throughout my university life.
5. MAMA LALA KOS squad with members of Leonardo Rakinaung, Rendy
Joshua Sipahutar, Moses Armando, Jeremy Widjaja, and Frilly Ondang.

v
Thank you for giving me a place to stay in Cikarang that help me a lot to
finish my skripsi. Thank you all for the memories, laugh, love and support.
6. My PUSH squad which consists of Meickel Peterson, Meliani Natalia,
Devina Felicia, Sylvia Salim, Fira Deviana, Felly Florenita, Emmanuella
Huang, Fifi, Joseph Utama, and Daniel Owen. Thank you all for the
memories, laugh, love and support.
7. Last but not least, to all parties that couldn’t be mentioned one by one which
are all staffs, lecturers, and President Univeristy friends that took parts and
contributing on my university life. And to everyone who support, help, and
took part on my research. Without all of you involved on my writing, it is
impossible for me to finish my skripsi on time. Thank you so much for
everything you’ve done right to me.
Cikarang, Indonesia, January 29th, 2019
Giovanni Samuel Macawalang

vi
TABLE OF CONTENTS
PANEL OF EXAMINERS APPROVAL SHEET .................................................... i
DECLARATION OF ORIGINALITY ................................................................... ii
ABSTRACT ........................................................................................................... iii
ACKNOWLEDGEMENTS .................................................................................... iv
TABLE OF CONTENTS ........................................................................................ vi
LIST OF APPENDICES ......................................................................................... ix
LIST OF TABLES ................................................................................................... x
LIST OF FIGURES ................................................................................................ xi
CHAPTER I: INTRODUCTION ............................................................................. 1
1.1. Background Study ......................................................................................... 1
1.2. Problem Identification ................................................................................... 5
1.3. Statement of Problem .................................................................................... 6
1.4. Research of Objective ................................................................................... 6
1.5. Significance of Study .................................................................................... 7
1.6. Scope and Limitations ................................................................................... 8
1.7. Organization of Skripsi ................................................................................. 8
CHAPTER II: LITERATURE REVIEW ................................................................ 9
2.1. Review of Literature ...................................................................................... 9
2.1.1. Marketing Mix ........................................................................................ 9
2.1.1.1. Product ............................................................................................... 10
2.1.1.2. Promotion .......................................................................................... 11
2.1.1.3. Price ................................................................................................... 13
2.1.1.4. Place .................................................................................................. 14
2.1.2. Brand Awareness .................................................................................. 16
2.1.3. Word of Mouth ..................................................................................... 17
2.1.4. Customer Loyalty ................................................................................. 19
2.2. Previous Research ....................................................................................... 21
2.3. Research Gap ............................................................................................... 24
CHAPTER III: METHODOLOGY ....................................................................... 26
3.1. Research Framework ................................................................................... 26

vii
3.2. Theoretical Framework ............................................................................... 27
3.3. Hypothesis ................................................................................................... 27
3.4. Operational Definitions of Variables .......................................................... 28
3.5. Research Design .......................................................................................... 32
3.5.1. Population ............................................................................................. 32
3.5.2. Sample .................................................................................................. 32
3.5.3. Sampling Technique ............................................................................. 33
3.5.4. Questionnaire ........................................................................................ 33
3.6. Pre-test ......................................................................................................... 34
3.6.1. Validity test .......................................................................................... 35
3.6.2. Reliability test ....................................................................................... 36
3.7. Descriptive Analysis .................................................................................... 36
3.7.1. Mean ..................................................................................................... 37
3.7.2. Standard Deviation ............................................................................... 37
3.8. Classical Assumption Tests ......................................................................... 38
3.8.1. Normality Test ...................................................................................... 38
3.8.2. Heteroscedasticity Test ......................................................................... 38
3.8.3. Multicollinearity Test ........................................................................... 39
3.9. Multiple Regression .................................................................................... 39
3.10. Testing Hypothesis .................................................................................... 40
3.10.1. T-test ................................................................................................... 40
3.10.2. F-test ................................................................................................... 41
3.10.3. Coefficient Determination (R2) .......................................................... 42
CHAPTER IV: RESULTS AND DISCUSSIONS ................................................ 43
4.1. Pre-test ......................................................................................................... 43
4.1.1. Validity Test ......................................................................................... 43
4.1.2. Reliability Test ..................................................................................... 45
4.2. Descriptive analysis ..................................................................................... 47
4.2.1. Data of respondent ................................................................................ 47
4.2.2. Descriptive data .................................................................................... 52
4.3. Classical Assumption Tests ......................................................................... 53
4.3.1. Normality test ....................................................................................... 53

viii
4.3.2. Heteroscedasticity Test ......................................................................... 55
4.3.3. Multicollinearity Test ........................................................................... 56
4.4. Multiple Regression Model Result .............................................................. 57
4.5. Testing Hypothesis ...................................................................................... 59
4.5.1. T-test ..................................................................................................... 59
4.5.2. F-test ..................................................................................................... 63
4.5.3. Coefficient of Correlation (R) and Coefficient of Determination (R2) 64
4.6. Interpretation of Results .............................................................................. 64
4.6.1. The Impact of Product towards Customer Loyalty ............................. 64
4.6.2. The Impact of Promotion towards Customer Loyalty ......................... 65
4.6.3. The Impact of Price towards Customer Loyalty .................................. 65
4.6.4. The Impact of Place towards Customer Loyalty ................................. 66
4.6.5. The Impact of Brand Awareness towards Customer Loyalty ............. 66
4.6.6 . The Impact of Word of Mouth towards Customer Loyalty ................ 66
CHAPTER V: CONCLUSION AND RECOMMENDATIONS ......................... 68
5.1 Conclusion .................................................................................................... 68
5.2 Recommendation .......................................................................................... 70
5.2.2. Onitsuka Tiger ...................................................................................... 70
5.2.3. Future Research .................................................................................... 70
REFERENCES ...................................................................................................... 71
APPENDICES ...........................................................................................................

ix
LIST OF APPENDICES
Appendix 1: Questionnaire .................................................................................... 76
Appendix 2: Data Respondents .............................................................................. 86
Appendix 3: SPSS Results ..................................................................................... 95
Appendix 4: Plagiarism Document ...................................................................... 104
Appendix 5: Table ................................................................................................ 104

x
LIST OF TABLES
Table 2.1. Previous Researches.............................................................................. 21
Table 3.1. Operational Definitions ......................................................................... 28
Table 3.2. Likert Scale ........................................................................................... 34
Table 3.3. Range and Categorize of Mean Value .................................................. 37
Table 4.1. Validity Test ......................................................................................... 43
Table 4.2. Cronbach coefficient alpha ................................................................... 45
Table 4.3. Reliability Test ...................................................................................... 45
Table 4.4. Result of Multicollinearity Test ............................................................ 56
Table 4.5. Multiple Regression Model Result ....................................................... 57
Table 4.6. T-test ..................................................................................................... 60
Table 4.7. F-test ..................................................................................................... 63
Table 4.8. Coefficient of Correlation (R) and Coefficient of Determination (R2) . 64

xi
LIST OF FIGURES
Figure 3.1. Research Framework ........................................................................... 26
Figure 3.2. Theoretical Framework........................................................................ 27
Figure 4.1. Histogram of Regression Standardized Residual ................................ 53
Figure 4.2. P-plot diagram .................................................................................... 54
Figure 4.3. Heteroscedasticity Test ........................................................................ 55
Figure 4.4. Gender ................................................................................................. 48
Figure 4.5. Age ...................................................................................................... 49
Figure 4.6. Place .................................................................................................... 49
Figure 4.6. Occupation ........................................................................................... 50
Figure 4.6. Monthly Spending ............................................................................... 51
Figure 4.6. Descriptive Data .................................................................................. 52

1
CHAPTER I
INTRODUCTION
1.1 Background study
Saravanan (2016) explained that fashion trends come and go, meanwhile a society’s
values are established and evolving characteristic to their beliefs and culture. One
of the oldest footwear companies from Japan is Onitsuka Tiger. A 32 years old
former military officer Kihachiro Onitsuka started his company in 1949, in a post-
world war 2 period that saw a lot of socio-economic restructuring. Paradigms were
shifting. Pioneers all over the world gave birth to new ideas and products and
Kihachiro Onitsuka was one of them. A socially responsible man, he felt a strong
desire to help his country recover from the ruin of the second world war by founding
Onitsuka Co. Ltd. in September 1949. In 1950, he introduced Onitsuka Tiger’s first
breakthrough sports shoe innovation, the OK basketball shoe. Afterwards, Onitsuka
Tiger focusing their shoes for other sports such as for running, volley, tennis, and
other sports shoes that called all training shoes (Onitsuka, 2015).
In 1977, Onitsuka Tiger joined the shoe company GTO, a sportswear and nets
manufacturer and Jelenk, a knitwear manufacturer. In strengthening their mutual
market positions, the merger also marked the start of a new era in sport shoes with
the launch of global brand ASICS, an acronym of the Latin phrase Anima Sana In
Corpore Sano or a sound mind in a sound body. As a result of the merger, ASICS
began to focus on a wider range of products, including skiing, baseball, and golf
equipment. Although they continued to create sports shoes, but Onitsuka Tiger's
iconic series began to sink. Unfortunately, a few years have passed, the ASICS

2
business has faded. Until the 90s, the company record a lost for nine consecutive
years. The causes vary, from economic conditions to the emergence of many new
competitors (Footasylum, 2018).
But like heroic and romantic stories, ASICS has risen again after returning to its
iconic designs. In the world of fashion, the new millennium was also marked by
nostalgia for the old one. Vintage clothing, especially from the 60’s until 80’s,
became extremely popular. This resurgence is inseparable from the emergence of
retro trends and nostalgia throughout the world, where people are looking for iconic
items that are recreated with new materials and technology. In 2001, Onitsuka Tiger
reintroduced as a fashionable, vintage shoe brand from ASICS. The return of the
legend was an instant success. The face of modern, metropolitan Japan became a
cult favorite among style leaders and fashion followers worldwide. Onitsuka's
popularity skyrocketed in 2003, when the Kill Bill movie starring Uma Thurman
appeared. In the film, the heroine wears yellow Onitsuka Tiger Mexico 66 shoes,
like the one Bruce Lee used in the 1978 Game of Death film, complete with his all-
yellow costume. People began to look for these shoes which until now is known as
Kill Bill and glanced at other Onitsuka collections. Right at the same time, ASICS
is also aggressively re-creating shoes that were once popular (Bogaisky, 2018).
Here are the strategies for Onitsuka Tiger to keep their brand remained popular
and hip in Japan while so many have fallen (Brooks, 2018).
1. Modern Retro Design Born from Performance

3
Onitsuka started with athleticism in mind and has kept that a core of its
business. With its narrow long nose silhouette, thin sole, and striking color
combinations, the Onitsuka retro design is instantly recognizable. It’s a
unique and understated recognizability that remains classic.
2. Limit Sales Channels to Maintain an Expensive Brand Image
Onitsuka’s bold and daring strategy heralded by President Oyama in 1999
to avoid the tempting wholesale market ensured that Onitsuka Tiger would
become a high-end brand. In addition to limiting sales channels, the
heightened brand image would start from the construction of their products,
putting high quality materials at the forefront. That’s an image to be proud
of.
3. Establish Reasonable Pricing
Onitsuka Tiger manages to deliver high quality with the NIPPON MADE
label at pretty economical prices. You can attain a heightened NIPPON
MADE sensibility without the crazy price tag. Mostly all of the shoe models
sell for less than 13,000 yen. The Serano which uses natural leathers is
priced at 8,640 yen, the all-natural leather upper Mexico 66 you can get your
hands on for 12,960 yen.
4. Surprise of A Mysterious Brand Name To Remember
From the name “Onitsuka” to the roaring tiger image the brand screams
Japan to even those with the faintest familiarity with the country. It’s a
striking brand image and this has definitely played in Onitsuka’s favor. You
look at it and think this is a Japanese brand. And that is enticing for the
overseas consumer because along with it come all of the positive adjectives

4
characteristics you would attach to a Japan-made product – quality, cutting
edge, reliable, built to last, different. This is the “Cool Japan” that the
Japanese government doesn’t get.
Many people, including from Indonesia, were often entrusted to buy Mexican shoes
66 if there were friends or relatives who went to Japan or other countries that had
Onitsuka outlets. But apparently the popularity of Onitsuka is unstoppable. In the
end of 2017, Onitsuka Tiger opened its first outlet in Indonesia (Kurniawan, 2017).
Ryoji Shoda, the senior General Manager in lifestyle Asics Corp. division said that
lately, many Indonesians have bought Onitsuka even directly to Japan, so they
thought, why not if they just open in Indonesia (Kompas, 2017).
Apparently, the demand for shoes remains high. At the Plaza Senayan store for
example, the sales target for one year can be achieved in just three months. In 2018,
Onitsuka Tiger open their second store on Kota Kasablanka mall, Jakarta and their
third store in Bandung (Kompas, 2018).
Nicholas Saputra, one of the Indonesian famous artists, have been a fan of Onitsuka
Tiger for a long time ago. When he is 17 years old, he bought his first Onitsuka
Tiger shoes in Sydney. He like the model when first see it. Casual but made of
leather, so it can be used for more formal events. Later on, he bought another model
when travelling to japan (Wisnubrata, 2018).
1.2 Problem identification
A brand that once killed off and now restored as one of the most popular sneakers
worldwide until Indonesian people frequently ask their companions or relatives

5
who went to Japan or different nations that had Onitsuka outlets to purchase
Onitsuka Tiger shoes. Because of the popularity of Onitsuka has spread all over the
world including Indonesia, toward the end of 2017, Onitsuka Tiger opened its first
outlet in Indonesia (Kurniawan, 2017).
Based on the situation, Onitsuka Tiger has passed the purchase intention of
customer in Indonesia as for the meaning is the likelihood of a customer buying the
same product again based on their purchase history. Or it can also be the need of a
product which is driving the customer towards a purchase (Bhasin, 2018).
Amazingly, the first Onitsuka Tiger store in Indonesia sales target for one year can
be achieved in just three months (Kompas, 2018).
As for the final stage, Onitsuka Tiger need the customers to be loyal to their product
because the importance of customer loyalty impacts almost every metric important
to running a business. Without happy customers that continue to buy, the business
won’t survive. New customers tend to cost more to acquire, and do not spend as
much money as loyal, repeat customers. Keeping customers coming back for more
is critical to business success (Chambers, 2018).
Based on the information, the researcher uses customer loyalty for the dependent
variable. As for the independent variables, the researcher adapted the independent
variables from Selang (2013), Haque et al (2018), Saputra et al (2015) which are
Marketing mix that consists of product, promotion, price, place; word of mouth,
and brand awareness.

6
1.3 Statement of problem
The problem that researcher will find out can be formulated in the of question
as stated below:
1. Is there any significant influence of price towards customer loyalty on
Onitsuka Tiger?
2. Is there any significant influence of place towards customer loyalty on
Onitsuka Tiger?
3. Is there any significant influence of product towards customer loyalty on
Onitsuka Tiger?
4. Is there any significant influence of promotion towards customer loyalty on
Onitsuka Tiger?
5. Is there any significant influence of brand awareness towards customer
loyalty on Onitsuka Tiger?
6. Is there any significant influence of word of mouth towards customer loyalty
on Onitsuka Tiger?
7. Is there any simultaneously significant influence of Product, Promotion,
Price, Place, Brand Awareness, and Word of Mouth towards Customer
Loyalty on Onitsuka Tiger?
1.4 Research objective
The objectives are:
1. To find out whether price has a significant influence towards Customer
loyalty on Onitsuka Tiger.
2. To find out whether place has a significant influence towards Customer
loyalty on Onitsuka Tiger.

7
3. To find out whether product has a significant influence towards Customer
loyalty on Onitsuka Tiger.
4. To find out whether promotion has a significant influence towards Customer
loyalty on Onitsuka Tiger.
5. To find out whether brand awareness has a significant influence towards
Customer loyalty on Onitsuka Tiger.
6. To find out whether word of mouth has a significant influence towards
Customer loyalty on Onitsuka Tiger.
7. To find out whether Product, Promotion, Price, Place, Brand Awareness,
and Word of Mouth has simultaneously significant influence towards
Customer Loyalty on Onitsuka Tiger.
1.5 Significance of study
1. For Onitsuka Tiger Indonesia
This research could be a feedback for Onitsuka Tiger Indonesia to more
focused on brand awareness because according to T-test, Brand Awareness
has significant influence to make Indonesian customers to be loyal with
Onitsuka Tiger. The more customers that loyal to Onitsuka Tiger, it means
that more surplus for Onitsuka Tiger Indonesia
2. For researcher:
This research is made to fulfill the requirements of completing bachelor’s
degree in Management, concentrating in International Business. The
researcher also gets more knowledge by bringing this research as the final
task of college.

8
1.6 Scope and Limitations
The study focuses on measuring the factor that influence marketing mix (price,
product, place, promotion), word of mouth, and brand awareness towards customer
loyalty on Onitsuka Tiger in Indonesia. The respondent will be Indonesian people
who have purchased Onitsuka Tiger. The result of this research is valid for
Indonesian people who have purchased Onitsuka Tiger.
1.7 Organization of Skripsi
This paper consists of five chapters which are introduction, literature study,
methodology, data analysis and conclusion. Chapter I includes a background of the
research topic, consists of explanation of the broad topic, need of the study, problem
identification, research questions, research objectives, significance of the study,
limitation, and organization of the skripsi. Chapter II is about the literature study
which contains explanations, factor affecting, as well as measurement of dependent
and independent variables related to this particular study. Chapter III is
methodology which talks about the method used to collect the data and analysis of
the data. Chapter IV presents the data analysis and the final result of the research.
Lastly, Chapter V is the overall conclusion of the research, this includes summary
about the research finding as well as the recommendation.

9
CHAPTER II
LITERATURE REVIEW
2.1. Review of Literature
In organizing the research, the researcher needs to think about the relationship
among those variables, hence the researcher needs to initially comprehend the
theories clarifying the theme that will be inquired about and ready to investigate
and analyze the relationship among those variables. In this research, the researcher
plan to research which factors of Marketing Mix that consists of Product,
Promotion, Price, Place, Brand Awareness, and Word of Mouth that gives the most
critical impact on Customer Loyalty.
2.1.1. Marketing Mix
According to Kotler and Keller (2016), Marketing Mix are the marketing
instruments that utilized by the organization to impact the customer to purchase
their product in order to produces income.
Based on Kotler and Armstrong (2001), they define the marketing mix as "A
collection of tactical marketing tools is under control which the company combined
for produce the desired response on the market target". Marketing mix is a variable
which can be controlled by the company to affect four important variables for
influence consumers on that market addressed. There are 4 variables which are
Product, Promotion, Price, and Place. For the relationship between Marketing mix
and customer loyalty will be based on Sukamto and Lumintan (2015) for the base
of the research.

10
2.1.1.1 Product (X1)
According to Kotler and Armstrong (2001), they define product as anything that
can be offered to a market for attention, acquisition, use, or consumption and that
might satisfy a want or need. Products can be measured with this following
instruments such as (Kotler & Keller, 2016):
1. Product variation
2. Product quality
3. Product display
The intensity of competition in the market forces companies to strive for high
product adaptation to achieve competitive advantage over competitors, because
product adaptation can expand the local market base and be increased for certain
local preferences. Consumers increasingly have alternatives and are very careful in
deciding the decision to make a purchase by considering the factors of need, product
superiority, service and price comparison before deciding to buy. From these
factors, product excellence is included in the main considerations before buying.
The competitive advantage of a product is one of the determinants of the success of
a new product, where the success of the product is measured by the parameters of
the number of product sales (Tjiptono, 2008).
The product covers the whole concept of an object or process that provides a
number of values benefits to consumers. According to Lupiyoadi (2007), he defines
a product as a whole concept of an object or process that provides a number of value
benefits to consumers. Goods and services are sub categories that explain two types
product, thus the term product is sometimes used in a broad sense for interpret

11
manufacturing goods or products. The product offered includes physical goods,
such as; TV, computer, motorcycle. Medium services consist of hotel, restaurant,
transportation, person or person. A good product quality, design, variety and
features will be able to make customers to do a repeat purchase on a particular brand
products or services (Harsono, 2016). As for the indicators such as variation,
design, color, quality, and size variety (Nugroho, 2013).
2.1.1.2 Promotion (X2)
Kotler and Keller (2016) express that Promotion is a variety of approaches to
inform, persuade, and remind customers directly or indirectly about an item or
brand sold.
The promotion element in the service marketing mix forms an important role in
helping communicate the positioning of services to consumers and market
relationships. Lupiyoadi (2007) define promotion as a program communication
related to the marketing of products or services. Service promotion covers a number
of key fields. These fields, known as mixes communication or promotion mix,
including the following elements: advertising, personal sales, sales promotion,
public relations, word of mouth, and direct post (direct mail). The choice of
communication mix for services includes decisions regarding issues such as
whether to advertise, use personal sales or making publicity through more public
awareness big with tools such as editorials, publications and press activities.
One of the ways a company introducing their products that are owned is by using a
promotion. Boyd (2000) stated that promotion is an effort to attract consumers by
persuading them to accept the products offered, while the promotion strategy is a

12
controlled and integrated program of communication methods and materials
designed to present company and its products to prospective customers. Based on
Boyd (2000), he said that a company developed a strategy promotion through a
promotional mix consisting of:
1. Advertisement
Advertising (advertising) is a form presentation and promotion of ideas,
non-personal goods and services paid by certain sponsors.
2. Personal Selling
Personal selling is a process to help and persuades one or more customers
to buy the goods or services that are offered
3. Sales Promotion
Sales Promotion is an incentive activity created to encourage the purchase
or sale of a product. Sales promotions are carried out within a certain time
period or in a short period of time
4. Public Relations
Public Relation is a stimulation of unpaid and non-personal requests for a
product, service or business unit by producing interesting news about it or
preferred presentation about it in the media
Based on Swastha and irawan (2005), Promotion generally is a form marketing
communication that intends to support demand, what is implied by marketing
communications is promoting activities that attempt to scatter information, impact
as well as remind the target market for the company on its products to be willing to
acknowledge, purchase, and be loyal to the product or service offered by the
company concerned. promotional activities will help to attract as many customer

13
candidates as possible by creating interesting ads and promotions. Advertising had
significant effects in influencing customer's buying decision, which in turn helped
to acquire new customers and retain loyal customers (Harsono, 2016). As for the
indicators for promotion such as social media, attraction, easy to find, easy to
understand (Nugroho, 2013).
2.1.1.3 Price (X3)
According to Kotler and Armstrong (2001) price is the amount of money that must
be paid by consumers to obtain the desired product or service. In pricing,
management must set prices according to the product. Price decision are influenced
by the strength of the company, the environment, and the complex and amazing
competition.
Price is one of the core elements of marketing mix. (Kotler, Armstrong, Harris, &
Piercy, 2017) opined that price is the money customer want to buy for a particular
products and service. Prices are solely dependent on company policy, but of course
consider various things. Prices are said to be expensive, cheap, or ordinary - usually
for each individual it does not have to be the same, because it depends on the
individual who is motivated by the environment and the condition of the individual.
In order to be successful in marketing an item or services, each company must
determine its price right. Price is the only element of the marketing mix which
provides income or income for the company, while the other three elements
(product, distribution, and promotion) cause costs. In addition, prices are an element
of marketing mix that is flexible, meaning that it can be changed quickly. Price is
very important because it determines profit and company survival. Pricing has an

14
impact on adjusting the marketing strategy taken. The price elasticity of a product
will also affect demand and sales. Price can be measured with (Chandra, 2002):
1. Price of competitor products.
2. Discount
3. Variation of payment system
A product needs to be offered within the price range that is suitable to be paid by
the customers, a customer is less likely to change their brand preference if they feel
that the price paid for the product is suitable. Price discounts does indeed caused
temporary brand switching, but after the discounts end, customers will lose interest
in the product (Harsono, 2016). For the indicators of price such as competitive,
membership, variation of price, discount (Nugroho, 2013).
2.1.1.4 Place (X4)
According to Kotler and Armstrong (2001) Place includes company activities that
make product available to target consumers. Place does not mean the location of
the companies only but also include: marketing channels, collection and location
settings, inventory and last but not least transportation arrangements. In the service
industry, places mainly refer to location and distribution that can provide
convenience for customers in obtaining company services. The location can be
measured through how strategic the place is, the facilities that can be obtained by
prospective customers, and the ease of accessing the location. Location decisions
and sales channels include considerations on how to deliver products to customers
and where products must be placed.

15
Place is a combination of location and decision on distribution channels related to
how to deliver services to consumers and where strategic location. Satisfaction of
consumer needs not only depends on high-quality products, good promotion so that
products can be well-known and prices affordable to consumers but also the
problem of distribution channels must be considered because this problem has a
considerable role and should not be ignored. Choosing a distribution channel is
increasingly important when the product is marketed have consumers who spread
(Kotler & Keller, 2016).
The choice of distribution and channels for services is highly dependent on market
demand and the characteristics of the service itself. Submission of services in
distribution channels can be done through service providers, intermediaries and
consumers. These choices illustrate that although many services are intangible and
cannot be separated, then direct sales are suitable channels so that services can be
distributed with a large number of other channel choices. According to Hawkins
(2010) Place is a channels used to get the products to the target customers inside
and outside the company, where target customers usually makes the purchase. If a
product is always available and customers have easy access to the products or
services, there will be an increase in the customer’s willingness to purchase or use
the products or services, as a result of increment on availability, customers will have
more time and place to perceive more value for the product, which will lead to
greater customer satisfaction and loyalty (Harsono, 2016). As for the indicators for
place such as easy to find, cozy, access, design, attraction (Nugroho, 2013).

16
2.1.2 Brand Awareness (X5)
Based on O’Guinn, Allen, and Semenik, (2009) Brand Awareness is an important
indicator of customers’ knowledge about a brand, the power of a brand’s presence
inside the mind of customers and how it is very easy that knowledge can be regain
from customer’s memory. In B2C context, Brand Awareness refers to the strength
of decision-makers to recall or distinguish a brand (Homburg, Klarmann, &
Schmitt, 2010). Aaker (2008) said that brand awareness is the ability of consumer
to recognize that a brand is a part of a certain product. Brand Awareness establishes
a conclusive role in the arrangement of brands that interest customers while
choosing a product or service. The customers’ ability to recognize a brand under
particular circumstances is a result of his or her brand awareness to the brand
connection (Lin, 2013).
According to Terence. A. Shimp (2003), brand awareness is the ability of a brand
to emerge in the minds of consumers when they was thinking a certain products and
how easy the name of the brand to pop up in the consumer’s mind. Brand Awareness
can be measured in 3 parts, which are:
1. Spontaneous (unaided) Awareness
Consumers will be given a list of several brands of certain categories of
products. Consumers will choose the brands they know from the list
provided without further hint or instructions. Spontaneous awareness is a
spontaneous reaction from consumers for brands in certain product
categories.

17
2. Top of Mind Awareness
Top of Mind Awareness is a brand that pop up first in a customer’s mind in
a certain product category. For example, customer will be given a question
regarding a brand that they remember first in a certain product category.
3. Aided awareness
Aided awareness is a brand that is actually already known by consumers not
spontaneously and may be the brand that has been used by consumers.
Usually it will need another stimulus to help consumers to be able to
remember other brands of product categories.
Based on Koniewski (2012), he stated that brand awareness is the starting point for
a customer to be loyal to a brand. When a customer already aware of a certain brand,
whenever the customer sees or heard about that certain brand, the customer will
remember and when that brand gives a good memory to the customer than the
customer will be loyal to that certain brand. According to Lin (2006), warranty and
brand awareness will help building brand equity to impact developing customer
loyalty. As for the indicators such as spontaneous awareness, top of mind
awareness, aided awareness, and priority (Tandarto & Dharmayanti, 2017).
2.1.3 Word of Mouth (X6)
Kotler and Keller (2016) said that Word of Mouth (WOM) communication is a
communication process in the form of giving recommendations both individually
and in groups to a product or services that aim to provide information personally.
According to Goyette, Richard, Bergeron, and Marticotte (2010), WOM is defined
as exchange, flow information, or the conversation of two individuals. Word of
mouth communication is one of the communication channels that is often used by

18
many companies, because this communication is considered very effective in
facilitating the marketing process and is able to provide benefits to the company.
Marketing using word of mouth can also be called word of mouth marketing, which
is a marketing activity through the intermediary of people to people, both verbally,
written, and electronic communication devices related to the experience of
purchasing services or experience using product or service (Kotler & Keller, 2016).
Another definition of word of mouth marketing based on Sumardy (2011), word of
mouth marketing is a marketing activities that trigger consumers to discuss,
promote, recommend to sell the brand of a product to other prospective customers.
In a study conducted by Goyette, Richard, Bergeron, and Marticotte (2010) on the
WOM measurement scale, they proposed several indicators for measuring WOM,
including:
1. WOM intensity
It is the intensity or conversation volume about a product that is happens in
everyday conversation.
2. Positive valence WOM
It is a positive evaluation as the effect of customer satisfaction that is
expressed in daily conversations such as giving recommendations or
invitations to buy a product.
3. Negative valence WOM
It is the opposite from the positive valence WOM. It is submitting negative
things to others about a product caused by the inability of the product to
meet consumer expectations.

19
4. WOM content
Contents of the conversation or content of the discussion of a product such
as type, quality, price, etc.
Zamil (2011) also reveals word of mouth as an informal transmission of ideas,
opinions, comments and information between two people, both of whom are not
marketers. The word of mouth phenomenon is believed to be able to encourage
purchases, can affect the community, an efficient promotion strategy because it
does not require large costs, can create a good image and make consumers to buy
back the product. As for the indicators for word of mouth such as recommendation,
information, social media comments, and positive valence WOM (Babin et al,
2005).
2.1.4 Customer Loyalty (Y)
Customer loyalty is a consistent consumer preference for making purchases on the
same brand on specific products or certain service categories. Customer loyalty is
a strong commitment in subscribing or buying a brand consistently in the future
(Schiffman & Kanuk, 2010).
According to Griffin (2007), Customer loyalty is the creation of attitudes and
patterns a person's behavior towards the purchase and use of the product which is a
result of their previous experience. Whereas according to Karsono (2008), customer
loyalty is a matter deep commitment to buy back or subscribe to a product or service
consistently in the future so that it can cause repetition of the same product
purchases despite the influence of the situation from various marketing efforts that
have the potential to causing the move to brand products. Griffin (2007) concluded

20
that buying behavior in a loyal consumer showed similarities on four traits, namely
repeated purchases, product purchases from the same company, advice to others to
use the same product, and the tendency to ignore competing products.
Customer loyalty as the strength of the relationship between the relative attitude of
an individual to a unit (brand, service, shop, or supplier) and repurchase. Customer
loyalty emphasizes the consumer purchase sequence such as the proportion and
probability of purchase. Customer loyalty is an important factor that becomes a
measure of repurchase (Surya & Setiyaningrum, 2009). As for the indicators for
customer loyalty such as regular repeat purchases, purchases across products and
services, refer friends, and refer family (Tandarto & Dharmayanti, 2017). Griffin
(2007) states that the benefits obtained by the company if they have loyal customers
are as follows:
1. Can reduce the costs for Marketing
Marketing costs will be cheaper in maintaining consumers for a long time,
when compared to efforts to attract and get new consumers.
2. Can increase the trading volume
Strong loyalty to a brand will result in increased sales and strengthen the
confidence of marketing intermediaries, so as to increase the share of the
company.
3. Attract new customers
Consumers from a certain brand who feel satisfied and like a certain brand
will create a feeling of confidence for prospective new customers to
consume a brand, especially if the purchase they carry contains a high risk.

21
4. Decrease customer’s turn over cost
This is due to the level of replacement of consumers become less.
5. Can give time to respond to threats from competing company products
Brand loyalty will give time to one company to respond to competitors'
movements.
6. Can reduce failure costs, such as product replacement costs, and etc.
7. Positive Word of Mouth
Assuming that loyal consumers means they are satisfied with the product.
2.2 Previous Research
Table 2.1 Previous Research
No. Author and
Year
Title Variables Method Result
1. Haque, M. S.
S., Bappy, T.
A., &
Arifuzzaman,
M. (2018)
The
Impact of
Brand
Awareness
on
Customer
Loyalty
towards
Igloo Ice
Cream: A
Study on
-Customer
loyalty
-Brand
awareness
-brand name
-brand logo
-brand slogan
-product
-price
-product
availability
quantitative brand
characters,
affordable
price,
sponsorship,
brand name
and slogan
influence more
to positively
affect the
customer

22
Dhaka
University
Students
-
communication
-trade show
-organizing
event
-sponsorship
-promotional
merchandise
loyalty as in
increase
purchase or
facilitate
advocacy for
Igloo
2. Christian
A.D Selang
(2013)
Impact of
marketing
mix
towards
Customer
Loyalty on
Fresh
Mart Bahu
mall
Manado
-product
-price
-promotion
-place
-people
-process
-Physical
evidence
-customer
loyalty
quantitative Simultaneously
Products,
Prices,
Promotions
and Places
have a
significant
effect on
Consumer
Loyalty. In
Partial
Products,
Prices have a
significant
effect on
Consumer

23
Loyalty while
Promotion and
Place have no
significant
effect on
Consumer
Loyalty.
3. Adrian
Yuwono and
Prof. Dr.
Hatane
Semuel, MS.
1 (2015)
Impact of
marketing
mix
towards
Customer
Loyalty
that used
digital
printing
PT. Elang
Perkasa
Langgeng
-customer
loyalty
-product
-promotion
-price
-place
Quantitative From the
research, the
researcher can
conclude that
Product, price,
and place is
significantly
influence
towards
customer
loyalty
whereas
promotion is
not
significantly
influence

24
customer
loyalty
4. Ida Bagus
Indra
Saputra,
Dr. Alit
Suryani, and
Drs. I Ketut
Nurcahya
(2015)
The
impact of
customer
relation
and word
of mouth
towards
customer
loyalty
bank
customers
BPD Bali
-customer
loyalty
-customer
relation
-word of
mouth
quantitative Customer
relation and
word of mouth
significantly
influence
customer
loyalty
2.3 Research Gap
The Research Gap between this research and the previous researches are not
focused on one field of study such as marketing mix towards customer loyalty,
brand awareness towards customer loyalty, and word of mouth towards customer
loyalty. But this research is a combination of marketing mix, brand awareness, and
word of mouth towards customer loyalty. This previous research focused in brand
awareness towards customer loyalty and also conducted in other countries, such as

25
Bangladesh titled “The Impact of Brand Awareness on Customer Loyalty towards
Igloo Ice Cream: A Study on Dhaka University Students” by Haque, Bappy, and
Arifuzzaman (2018). While this previous research titled “Impact of marketing mix
towards Customer Loyalty on Fresh Mart Bahu mall Manado” by Selang (2013)
focused in marketing mix towards customer loyalty. This previous research titled
“The impact of customer relation and word of mouth towards customer loyalty bank
customers BPD Bali” by Ida Bagus Indra Saputra, Alit Suryani, and I Ketut
Nurcahya (2015) focused in customer relation and word of mouth towards customer
loyalty.

26
CHAPTER III
RESEARCH METHODOLOGY
3.1 Research Framework
This research is conducted by using quantitative method because the process of this
research is deductive where to know the answer if the identified problem, the
researcher using several theories to get the hypothesis. Then the hypothesis will be
tested by collecting data from the field. All of the gathered data is analyzed using
quantitative method by using descriptive or inferential statistics to conclude the
hypothesis and know whether it proven or not. Quantitative research usually done
to random sample to make the result of the research generalized to the population
where the sample taken.
Figure 3.1 Research Framework
Source: Developed by Researcher
Problem Statement
Variables
Literature Review
questionnaire
Pretest Validity and Reliability
Data valid and reliable
Data Analysis
Results and Recommendations

27
3.2 Theoretical Framework
Figure 3.2: Theoretical Framework
Source: adapted from Selang (2013), Haque et al (2018), Saputra et al (2015)
3.3 Hypothesis
In order to find the relations between marketing mix, brand awareness, word of
mouth towards customer loyalty. The hypothesis in this particular study is
presented as:
Product
(X1)
Promotion
(X2)
Price
(X3)
Place
(X4)
Brand
Awareness (X5)
w Word of Mouth
(X6)
Customer
Loyalty (Y)
H1
H2
H6
H7
H5
H3
H4

28
H1 : There is a significant influence of Product towards Customer Loyalty of
Onitsuka Tiger.
H2 : There is a significant influence of Promotion towards Customer Loyalty
of Onitsuka Tiger
H3 : There is a significant influence of Price towards Customer Loyalty of
Onitsuka Tiger.
H4 : There is a significant influence of Place towards Customer Loyalty of
Onitsuka Tiger.
H5 : There is a significant influence of Brand Awareness towards Customer
Loyalty of Onitsuka Tiger.
H6 : There is a significant influence of Word of Mouth towards Customer
Loyalty of Onitsuka Tiger.
H7 : Product, Promotion, Price, Place, Brand Awareness, and Word of Mouth
have simultaneously significant influence towards Customer Loyalty of
Onitsuka Tiger
3.4 Operational Definitions of Variables
Table 3.1 Operational Definitions
Variable Definition Indicator Scale
Product
(X1)
anything that can be
offered to a market for
attention, acquisition,
1. Variation
2. Design
3. Color
Likert Scale

29
use, or consumption
and that might satisfy a
want or need (Kotler &
Armstrong, 2001).
4. Quality
5. Size Variety
(Nugroho, 2013)
Promotion
(X2)
Promotion is a variety
of approaches to
inform, persuade, and
remind customers
directly or indirectly
about an item or brand
sold (Kotler & Keller,
2016).
1. Social Media
2. Attraction
3. Easy to
understand
4. Easy to find
(Nugroho, 2013)
Likert Scale
Price
(X3)
price is the money
customer want to buy
for a particular products
and service. Prices are
solely dependent on
company policy, but of
course consider various
things. Prices are said
to be expensive, cheap,
or ordinary - usually for
each individual it does
not have to be the same,
1. Competitive
2. Membership
3. Variation of
price
4. Discount
(Nugroho, 2013)
Likert Scale

30
because it depends on
the individual who is
motivated by the
environment and the
condition of the
individual (Kotler et al.,
2017).
Place
(X4)
Place is a channel used
to get the products to
the target customers
inside and outside the
company, where target
customers usually
makes the purchase
(Hawkins, 2010).
1. Easy to find
2. Cozy
3. Access
4. Design
5. Attraction
(Nugroho, 2013)
Likert Scale
Brand
Awareness
(X5)
Brand Awareness is an
important indicator of
customers’ knowledge
about a brand, the
power of a brand’s
presence inside the
mind of customers and
how it is very easy that
knowledge can be
1. Spontaneous
2. Top of mind
awareness
3. Aided
awareness
4. Priority
(Tandarto &
Dharmayanti, 2017)
Likert Scale

31
regain from customer’s
memory (O’Guinn et
al., 2009).
Word of
Mouth
(X6)
WOM is defined as
exchange, flow
information, or the
conversation of two
individuals. Word of
mouth communication
is one of the
communication
channels that is often
used by many
companies, because this
communication is
considered very
effective in facilitating
the marketing process
and is able to provide
benefits to the company
(Goyette et al., 2010).
1. Recommended
2. Information
3. Social Media
comments
4. Positive
valence WOM
(Babin et al, 2005)
Likert Scale
Customer
Loyalty
(Y)
customer loyalty is a
matter deep
commitment to buy
1. Regular repeat
purchases
Likert Scale

32
back or subscribe to a
product or service
consistently in the
future so that it can
cause repetition of the
same product purchases
despite the influence of
the situation from
various marketing
efforts that have the
potential to causing the
move to brand products
(Karsono, 2008).
2. Purchases
across
products and
services
3. Refers friends
4. Refers family
(Tandarto &
Dharmayanti, 2017)
3.5 Research Design
3.5.1 Population
According to Sujarweni (2015), The population is defined as a generalization region
consisting of the objects or the subjects that have certain qualities and
characteristics that are set by the researcher to be learned and then take the
conclusion. The population in this research are people who know about Onitsuka
Tiger.
3.5.2 Sample
The Sample is a part of a number of characteristics possessed by the population
used for the research (Sujarweni, 2015). The researcher use Hair theory as he said

33
that as a general rule, the minimum is to have at least five times as many
observations as the number of variables to be analyzed (Hair, 2014).
N = 5 x q
= 5 x 7
= 35
Where,
N = Sample Size
q = total variables
3.5.3 Sampling technique
In this quantitative research, the sampling technique that was used is non-
probability sampling. It means, in this quantitative research, the researcher selected
respondents’ population that based on subjective judgement, rather than random
respondents. In non-probability sampling there is convenience sampling. The
convenience sampling is a non-probability sampling which can dependable on the
information accumulation population of individuals who are advantageously
accessible or available when it comes to take an interest and take part of this
research (Saunders, Lewis, & Thornbill, 2012).
3.5.4 Questionnaire
The tool that is used to make the questionnaire is Google Form. After the researcher
create the questionnaire, the researcher will distribute the questionnaire to
respondents. The link of the questionnaire was distributed through social media
such as WhatsApp, Line, Instagram, Twitter, etc. in this quantitative research, the

34
researcher used six independent variables (X) and one dependent variable (Y).
Likert scale is used by the researcher in the questionnaire. Likert scale is used to
calculate or measure the variable value that shown in the number form, so it can be
analyzed accurately, efficiently, and last but not least more communicative
(Suwartono, 2014). Likert scale test how strongly disagree and agree of respondents
with the representation of five-point scale.
Table 3.2 Likert Scale
Source: (Suwartono, 2014)
Likert scale being used by the researcher because this type of scaling could define
the precise number of scaling based on respondents. From the table above, the
respondents were asked to answer the agreement level that connected to the
variables honestly by using five points Likert scale ranging from strongly disagree
until strongly agree.
3.6 Pre-test
The researcher utilizes primary data or information for the pre-test to know the
validity and reliability of poll. Primary data or information alludes to data that got
first-hand by the researcher on the variables of interest for the particular reason of
the research. To decide the inquiries can be utilized or not, both validity and
reliability test are performed.

35
3.6.1 Validity Test
According to Sugiyono (2013), a valid instrument has a definition the measuring
instrument used to obtain the data is valid. Hence, validity data is not different
between the data reported by the researcher with actual data that occurs in the object
of the research. To run the validity test, the researcher uses SPSS v.21 to see the r
to summarize the validity of the question in the questionnaires. If (n) = 51, alpha =
0.05 be obtained r table 0.361. For the question to be valid, r should be bigger than
r table which is 0.361. if the r of the question is lower than 0.361 so the question is
invalid. The formula of validity test is as follow:
Validity Test Formula
Source: (Black, 2010)

36
3.6.2 Reliability Test
According to Sugiyono (Sugiyono, 2013), Reliability is synonymous with the
consistency of a test, survey, observation, or other measuring device. It is to check
the correlation of statement in the questionnaire. To get the results of reliability test,
the researcher uses Cronbach Alpha which is the reliability coefficient. To get a
positive result, Cronbach Alpha value should be minimum 0.6 to indicate that the
statement is reliable.
Reliability Test Formula
Source: (Goforth, 2015)
3.7 Descriptive Analysis
Sugiyono (Sugiyono, 2013) said that Descriptive Analysis Method is the statistic
used for the researcher to analyze data by data that has been accumulated because
without intending to make conclusions that apply to the public or generalization.
Descriptive analysis is used to analyze data that has been collected without
intending to accept generally accepted conclusions or generalizations.
37
3.7.1 Mean
Black (Black, 2010) said that the mean is a measure of data concentration. The
mean data is also a statistic because it is able to describe that the data is in the range
of the mean data. The mean cannot be used as a measure of concentration for
nominal and ordinal data types.
Mean Formula
Source: (Black, 2010)
Table 3.3. Range and Categorize of Mean Value
Source: (Black, 2010)
3.7.2 Standard Deviation
Standard deviation is the statistical value used to determine how the data is
distributed in the sample, and how close the individual data points are to the mean
or sample values. A standard deviation from a data set equal to zero indicates that

38
all the values in the set are the same. A larger deviation value will mean that
individual data points are far from the average value (Black, 2010).
Standard Deviation Formula
Source: (Black, 2010)
3.8 Classic Assumption Test
3.8.1 Normality Test
Normality Test is a test that used with the purpose is to assess the distribution of
data in a group of data or variables, whether the data distribution is distributed
normally or not. Normality test is useful for determining data that has been collected
normally distributed or taken from a normal population. The classic method in
testing the normality of a data is not so complicated. Normality test can be done by
histogram test, P-Plot normal test, Chi Square test, Skewness and Kurtosis or
Kolmogorov-Smirov test (Hidayat, 2013).
3.8.2 Heteroscedasticity Test
Heteroscedasticity test have a goal to assesses whether there is an inequality of
variants from the residuals for all observations in the linear regression model. This
test is belong to one of the classic assumption tests that must be done in linear

39
regression. If heteroscedasticity assumptions are not met, then the regression model
is declared invalid as a forecasting tool (Hidayat, 2013). To detect the
heteroscedasticity can be found by analyze the plot that scatter on the scatter plot
that has been resulted from SPSS.
3.8.3 Multicollinearity Test
Multicollinearity is used to find a situation that shows a strong correlation between
two or more independent variables in a multiple regression analysis. The regression
models in this case include: linear regression, logistic regression, panel data
regression and cox regression.
In situations where multicollinearity occurs in a multiple regression model, the beta
coefficient value of an independent variable or predictor variable can change if
there is an addition or subtraction of the independent variable in the model.
Therefore, multicollinearity does not reduce predictive power simultaneously, but
affects the predictive value of an independent variable. The predictive value of an
independent variable here is the beta coefficient. Therefore, in some cases
multicollinearity detected with the large standard value error of an independent
variable in regression model (Hidayat, 2016).
3.9 Multiple Regression
Based on Sugiyono (2013), regression analysis is used to make predictions, how to
change the dependent variable when the value of independent variables increased
or lowered value (manipulated).

40
Data analysis techniques in this study using regression analysis linear multiple.
Multiple linear regression analysis is a statistical technique used to predict how the
influence of independent variables to the dependent variable.
Multiple Regression Formula
Source: (Black, 2010)
3.10 Testing Hypothesis
3.10.1 T-test
Based on Sujarweni (Sujarweni, 2015), T Statistic test shows how much influence
the individual independent variable in explaining the variation in the dependent
variable. The test done by reviewing the value of probability. If the probability
value is less than 0,05 then the independent variable affects the dependent variable.
Meanwhile, if the probability is greater than 0,05, then the independent variable had
no effect on the dependent variable.
a. If t count > t table and the probability of significance <5% (λ = 0.05) then
Ho is accepted, and Ha is rejected. That means there is a significant effect
of each independent variable on the dependent variable.

41
b. If t count < t table and probability of significance >5% (λ = 0.05) then Ho
is rejected, and Ha is accepted. That means there is no significant effect of
each independent variable on the dependent variable.
T-test Formula
Source: (Black, 2010)
3.10.2 F-test
The F statistic test basically shows whether all independent variables entered in the
model have a simultaneous influence on the dependent variable (Ghozali, 2013). In
this research, the researcher wants to find out either the marketing mix, brand
awareness, and word of mouth will simultaneously influence Customer Loyalty or
not. The F test is a test conducted to determine the effect of the independent
variables together the same as the dependent variable, whether it has a significant
influence or not. Basic decision making of F test will based on, as follows:
1. By comparing the value of F count with F table
- If F table> F count, then Ho is accepted, and Ha is rejected
- If F table <F counts, Ho is rejected, and Ha is accepted
2. Using a probability number:

42
- If the probability of significance is> 0.05, then Ho is accepted, and Ha
is rejected
- If the probability is significant <0.05 then Ho is rejected, and Ha is
accepted.
F-test Formula
Source: (Black, 2010)
3.10.3 Coefficient Determination (R2)
Coefficient determination or R2 is a summary measure that tells how well the
sample regression line fits the data. It rates how many percentages the Y variable
explained by the regress or jointly. It is a nonnegative quantity between 0 and 1. In
this quantitative research, the researcher focuses on Adjusted R2 value because in
this study, the independent variable used is more than two variables. The value of
adjusted R2 is range from 0 to 1. (Ghozali, 2013).
Coefficient Determination Formula
Source: (Black, 2010)

43
CHAPTER IV
RESULTS AND DISCUSSIONS
4.1 Pre-test analysis
4.1.1 Validity Test
Validity test is the degree to which the scores from a measure speak to the variable
they are expected to. This research validity test was calculated with SPSS v.21 to
know the validity test of the inquires in the questionnaires
Table 4.1. Validity Test
Variable Sub
Variable
R table Pearson
Correlation
Result
Product(X1)
A1 0.361 0.726 Valid
A2 0.361 0.729 Valid
A3 0.361 0.685 Valid
A4 0.361 0.655 Valid
A5 0.361 0.769 Valid
Promotion(X2)
B1 0.361 0.817 Valid
B2 0.361 0.732 Valid
B3 0.361 0.820 Valid
B4 0.361 0.849 Valid
B5 0.361 0.807 Valid
Price(X3)
C1 0.361 0.781 Valid
C2 0.361 0.818 Valid

44
C3 0.361 0.789 Valid
C4 0.361 0.788 Valid
Place(X4)
D1 0.361 0.743 Valid
D2 0.361 0.822 Valid
D3 0.361 0.735 Valid
D4 0.361 0.692 Valid
D5 0.361 0.732 Valid
Brand Awareness(X5) E1 0.361 0.787 Valid
E2 0.361 0.864 Valid
E3 0.361 0.901 Valid
E4 0.361 0.890 Valid
Word of mouth(X6) F1 0.361 0.749 Valid
F2 0.361 0.838 Valid
F3 0.361 0.802 Valid
F4 0.361 0.729 Valid
Customer loyalty(Y)
G1 0.361 0.776 Valid
G2 0.361 0.732 Valid
G3 0.361 0.687 Valid
G4 0.361 0.883 Valid
G5 0.361 0.837 Valid
Source: processed primary data by SPSS v.21
As shown from table 4.1, it concludes the results of pre-test for validity test that
consists of six independent variables and one dependent variable. The validity of
variable questions can be seen by comparing the R table with Pearson-correlation.

45
The table shows that all of the questions are valid after compared the Pearson-
correlation with R table in 0.361.
4.1.2 Reliability test
Reliability test is a proportion of the stability or consistency of test scores. This
reliability test was calculated with SPSS v.21 to know the reliability test of the
questions in the questionnaire. Cronbach coefficient alpha will be used as a tool to
compare the test results.
Table 4.2 Cronbach coefficient alpha
Source: (Stephanie, 2014)
Table 4.3 Reliability test
Variable Questions Cronbach’s
Alpha
Internal
consistency
Results
X1 5 0.758 Acceptable Reliable
X2 5 0.865 Good Reliable
X3 4 0.806 Good Reliable

46
X4 5 0.799 Acceptable Reliable
X5 4 0.884 Good Reliable
X6 4 0.785 Acceptable Reliable
Y 5 0.842 good Reliable
Source: processed primary data, by SPSS v.21
1. Product
The first variable, which is Product, was tested the reliability using
Cronbach’s alpha. From the table 4.3, it is shown that the result is satisfying,
which is 0.758. This means that X1 has an acceptable reliability rate.
2. Promotion
The second variable, which is Promotion, was tested the reliability using
Cronbach’s alpha. From the table 4.3, it is shown that the result is satisfying,
which is 0.865. This means that X2 has a good reliability rate.
3. Price
The third variable, which is Price, was tested the reliability using
Cronbach’s alpha. From the table 4.3, it is shown that the result is satisfying,
which is 0.806. This means that X3 has a good reliability rate.
4. Place
The forth variable, which is Place, was tested the reliability using
Cronbach’s alpha. From the table 4.3, it is shown that the result is satisfying,
which is 0.799. This means that X4 has an acceptable reliability rate.
47
5. Brand Awareness
The fifth variable, which is Brand awareness, was tested the reliability using
Cronbach’s alpha. From the table 4.3, it is shown that the result is satisfying,
which is 0.884. this means that X5 has a good reliability rate.
6. Word of Mouth
The sixth variable, which is word of mouth, was tested the reliability using
Cronbach’s alpha. From the table 4.3, it is shown that the result is satisfying,
which is 0.785. this means that X6 has an acceptable reliability rate.
7. Customer Loyalty
The seventh variable, which is Customer loyalty, was tested the reliability
using Cronbach’s alpha. From the table 4.3, it is shown that the result is
satisfying, which is 0.842. this means that Y has a good reliability rate.
4.2 Descriptive Analysis
4.2.1 Data of Respondent
This research aims to investigate the impact of marketing mix, Word of mouth, and
Brand awareness towards Customer loyalty on Onitsuka Tiger in Indonesia.
Furthermore, the target of this research is people who knows or ever buy Onitsuka
Tiger. In total, there are 137 respondent’s data collected, and all of 137 data is
qualified as the respondents answers all questions statement being asked.

48
Figure 4.4 Gender
Source: Researcher Primary data
With total of 137 respondents who have participated to fill the questionnaire, the
results above show that for gender (Jenis kelamin) there are more male respondents
answer the questionnaires rather than female respondents. As seen from Figure 4.4
above there are 45 male (Pria) respondents (54.7%), while female (Wanita)
respondents have 62 respondents (45.3%)

49
Figure 4.5 Age
Source: Researcher Primary data
Taken from 137 respondents, the majority respondent’s age (Usia) are 20-25 with
111 respondents (81%), followed by age under 20 with 16 respondents (11.7%),
age 25-30 with 6 respondents (4.4%), and last but not least age over 30 with 4
respondents (2.9%).
Figure 4.6 Place
Source: Researcher Primary data

50
In this research, according to the figure above, the respondents mostly placed
(Tempat tinggal) in Cikarang with 62 respondents (45.3%), followed by Bekasi
with 42 respondents (30.7%), Tangerang with 10 respondents (7.3%), and many
other cities.
Figure 4.7 Occupation
Source: Researcher Primary data
From 137 respondents, it is clear that majority of the respondent’s occupation
(Pekerjaan) is university students (Pelajar/mahasiswa) with 109 respondents
(79.6%), followed by private employees (Swasta) with 17 respondents (12.4%), and
many more.

51
Figure 4.8 Monthly Spending
Source: Researcher Primary data
In this research, according to figure above, most of the respondent’s monthly
spending (Pengeluaran bulanan) are 1 million until 5 million rupiah with 107
respondents (78.1%). Followed by under 1 million rupiah with 17 respondents
(12.4%).

52
4.2.2 Descriptive data
Figure 4.9 Descriptive Data
Source: Researcher Primary data
From figure 4.9, it represents the descriptive data of people that know about
Onitsuka Tiger. It shows the respondent’s responses for both independent and
dependent variables. The most dominant variable would be the first variable, which
is Product, with the value of mean of 3.8, which means that most of the answers of
the respondents were between neutral and agree. While the lowest variable would
be Brand Awareness, with the mean of 3. So, the most of the respondent’s answers
was neutral.
Product Promotion Price PlaceBrand
AwarenessWord ofMouth
CustomerLoyalty
Mean 3.8 3.4 3.6 3.6 3 3.4 3.4
Std. Dev 0.7 0.9 0.75 0.74 1 0.9 0.8
3.8
3.4
3.6
3.6
3
3.4
3.4
0.7
0.9
0.7
5
0.7
4 1
0.9
0.8
DESCRIPTIVE DATA
Mean
Std. Dev

53
4.3 Classical Assumption Tests
4.3.1 Normality Test
Normality test is created to know how the data circulated as well as to decide the
data whether it is ordinally distributed or not. The normality test is mainly used to
explain the probability. To determine the normality of this research is by using
Histogram and P-plot, the result as follows:
Figure 4.1 Histogram of Regression Standardized Residual
Source: Processed primary data, by SPSS v.21
As it shown in figure 4.1, it can be seen from the figure that the line on histogram
illustrate bell shape. The figure above is normally distributed as the line curved
perfectly on the center which indicates that the data have a variation of value. While
if the curve is deviated to the right or left, the data are not normal.

54
Figure 4.2 P-plot Diagram
Source: processed primary data, by SPSS v.21
Based on the figure 4.2, it shows the plots spread around the diagonal line and
follow the direction of the diagonal line. By that indicator it can be said that the
data distribution is normal, and the figure above represents Normal P-P Plot of
Regression Standardized Residual.

55
4.2.2 Heteroscedasticity Test
In the multiple regression, some of the variance need to be tested to check the
residuals of the observation with any other observations. If the variance from the
residuals of the observations to other observations remain the same, it is called
heteroscedasticity. Multiple regressions equation is good if there are no
heteroscedasticity.
Figure 4.3 Result of Heteroscedasticity Test
Source: Processed primary data, by SPSS v.21

56
4.2.3 Multicollinearity Test
Table 4.4 Result of Multicollinearity Test
Coefficients
Model Collinearity Statistics
Tolerance VIF
1
(Constant)
X1 0.389 2.56
X2 0.333 3.00
X3 0.377 2.65
X4 0.286 3.49
X5 0.437 2.28
X6 0.473 2.11
A. Dependent Variable: Y
Source: Processed primary data, by SPSS v.21
In general, the results of multicollinearity test in table 4.4 above have a positive
result. The general value to measure Tolerance is greater than 0.1 or close to 1,
whereas the acceptable value for VIF is less than 10, in order to verify that there is
no multicollinearity problem around. From table 4.4, VIF (Variance Inflation
Factor) of every independent variable which are product, promotion, price, place,
brand awareness, and word of mouth has value less than 10 which is good. On the
other side, tolerance value of all independent variables also has a good result
because all the tolerance values are more than 0.1 (Hidayat, 2016).

57
4.4 Multiple Regression Model Result
Researcher using multiple linear regression in this research to define whether there
is any significant influence from independent variables to the dependent variable.
In a multiple regression, researcher used statistical calculation from SPSS v.21. The
summary results of the SPSS calculation as follows:
Table 4.5 Multiple Regression Model Result
Coefficients
Model Unstandardized
coefficients
Standardized
coefficients
T
Sig
B Std. Beta
1
(Constant)
X1
X2
X3
X4
X5
X6
.576
.149
.099
.102
.139
.527
.109
1.211
.092
.077
.107
.099
.068
.076
.112
.098
.068
.115
.515
.092
.476
1.613
1.294
.955
1.405
7.771
1.434
.635
.109
.198
.341
.162
.000
.154
Source: Processed primary data, by SPSS v.21

58
From the result in table, if written in standardized form of the question, the
regression is as follows:
Y = .576 + .117 X1 + .098 X2 + .063 X3 + .117 X4 + .517 X5 + .084 X6
Where,
Y = Customer Loyalty
X1 = Product
X2 = Promotion
X3 = Price
X4 = Place
X5 = Brand Awareness
X6 = Word of Mouth
From the formula above, the researcher can construct a conclusion of the test result
as follow:
1. Table 4.5. indicate that the regression coefficient of Product is .109 which
is more than α (0.05). It means that Product is not significantly influence
Customer Loyalty of Onitsuka Tiger in Indonesia.
2. Table 4.5. indicate that the regression coefficient of Promotion is .198 which
is more than α (0.05). It means that Promotion is not significantly influence
Customer Loyalty of Onitsuka Tiger in Indonesia.

59
3. Table 4.5. indicate that the regression coefficient of Price is .341 which is
more than α (0.05). It means that Price is not significantly influence
Customer Loyalty of Onitsuka Tiger in Indonesia.
4. Table 4.5. indicate that the regression coefficient of Place is .162 which is
more than α (0.05). It means that Place is not significantly influence
Customer Loyalty of Onitsuka Tiger in Indonesia.
5. Brand Awareness is significantly affecting Customer Loyalty of Onitsuka
Tiger in Indonesia, indicated by the value of regression coefficient of Brand
Awareness is .000, which is less than α (0.05). It means that every 1 unit
increased of Brand Awareness able to increase the Customer Loyalty of
Onitsuka Tiger in Indonesia by 51.7%
6. Table 4.5. indicate that the regression coefficient of word of mouth is .154
which is more than α (0.05). It means that word of mouth is not significantly
influence Customer Loyalty of Onitsuka Tiger in Indonesia.
In conclusion, from all of the 6 independent variables which are product,
promotion, price, place, brand awareness, and word of mouth, only brand
awareness that significantly influence Customer Loyalty of Onitsuka Tiger in
Indonesia.
4.5 Testing Hypothesis
4.5.1 T-Test
T-Test is used to determine how much the influence of independent variables
(Product, Promotion, Price, Place, Brand Awareness, Word of Mouth) through the
dependent variable (Customer Loyalty). The result for the T-Test progress as
follows:

60
Table 4.6 T-Test
Model T Sig.
1
(Constant)
X1
X2
X3
X4
X5
X6
.476
1.613
1.294
.955
1.405
7.771
1.434
.635
.109
.198
.341
.162
.000
.154
Source: Processed primary data, by SPSS v.21
a. Product (X1)
Ho1 : There is no significant influence of Product towards Customer
Loyalty of Onitsuka Tiger.
Ha1 : There is a significant influence of Product towards Customer
Loyalty of Onitsuka Tiger.
By using SPSS v.21 for the variable Product (X1), researcher got the tcount =
1.613 with ttable of 1.655 which mean tcount have smaller value than ttable.
While, the tsignificance is .109 and the value bigger than significance level of
0.05. From the result, researcher can conclude that Ha1 hypothesis was
rejected and Ho1 hypothesis was accepted.
b. Promotion (X2)
Ho2 : There is no significant influence of Promotion towards Customer
Loyalty of Onitsuka Tiger.

61
Ha2 : There is significant influence of Promotion towards Customer
Loyalty of Onitsuka Tiger.
By using SPSS v.21 for the variable Promotion (X2), researcher got the tcount
= 1.294 with ttable of 1.655 which mean tcount have less value than ttable. While,
the tsignificance is .198 and the value bigger than significance level of 0.05.
From the result, researcher can conclude that Ha2 hypothesis was rejected
and Ho2 hypothesis was accepted.
c. Price (X3)
Ho3 : There is no significant influence of Price towards Customer
Loyalty of Onitsuka Tiger.
Ha3 : There is significant influence of Price towards Customer Loyalty
of Onitsuka Tiger.
By using SPSS v.21 for the variable Price (X3), researcher got the tcount =
0.955 with ttable of 1.655 which mean tcount have less value than ttable. While,
the tsignificance is .341 and the value bigger than significance level of 0.05.
From the result, researcher can conclude that Ha3 hypothesis was rejected
and Ho3 hypothesis was accepted.
d. Place (X4)
Ho4 : There is no significant influence of Place towards Customer
Loyalty of Onitsuka Tiger.
Ha4 : There is significant influence of Place towards Customer Loyalty
of Onitsuka Tiger.
By using SPSS v.21 for the variable Place (X4), researcher got the tcount =
1.405 with ttable of 1.655 which mean tcount have less value than ttable. While,

62
the tsignificance is .162 and the value bigger than significance level of 0.05.
From the result, researcher can conclude that Ha4 hypothesis was rejected
and Ho4 hypothesis was accepted.
e. Brand Awareness (X5)
Ho5 : There is no significant influences of Brand Awareness towards
Customer Loyalty of Onitsuka Tiger.
Ha5 : There is significant influence of Brand Awareness towards
Customer Loyalty.
By using SPSS v.21 for the variable Place (X4), researcher got the tcount =
7.771 with ttable of 1.655 which mean tcount have bigger value than ttable.
While, the tsignificance is .000 and the value is less than significance level of
0.05. From the result, researcher can conclude that Ha5 hypothesis was
accepted and Ho5 hypothesis was rejected.
f. Word of Mouth (X6)
Ho6 : There is no significant influence of Word of Mouth towards
Customer Loyalty of Onitsuka Tiger.
Ha6 : There is significant influence of Word of Mouth towards
Customer Loyalty of Onitsuka Tiger.
By using SPSS v.21 for the variable Word of mouth (X5), researcher got the
tcount = 1.434 with ttable of 1.655 which mean tcount have less value than ttable.
While, the tsignificance is .154 and the value bigger than significance level of
0.05. From the result, researcher can conclude that Ha6 hypothesis was
rejected and Ho6 hypothesis was accepted.

63
4.5.2 F-test
The researcher using F-Test to determine whether independent variables have
influence on dependent variable or not. If F value > F table, Ho rejected, and Ha
accepted. But, if F value < F table, then Ho accepted, and Ha rejected. The result of
F-Test (ANOVA) shown in the table below:
Table 4.7 F-test
Ho7 : Product, Promotion, Price, Place, Brand Awareness, and Word of Mouth
have no simultaneously significant influence towards Customer Loyalty of
Onitsuka Tiger.
Ha7 : Product, Promotion, Price, Place, Brand Awareness, and Word of Mouth
have simultaneously significant influence towards Customer Loyalty of
Onitsuka Tiger.
The result of this F-test shows the Fcount = 66.124 with a significance level of .000.
The Fcount with value 66.124 is compared with Ftable of 1.35 and it means that Fcount
has bigger Ftable. Furthermore, compare to 0.05 of p-value, the number of
probabilities in this test is 0.000 which is less than 0.05. Therefore, the researcher
ANOVAa
Model Sum of Squares Df Mean Square F Sig.
1
Regression 2024.426 6 337.404 66.124 .000b
Residual 663.340 130 5.103
Total 2687.766 136
Source: Processed Primary data, by SPSS v.21

64
conclude Ho7 is rejected and Ha7 accepted. It means that Product, Promotion, Price,
Place, Brand Awareness, and Word of Mouth have simultaneously significant
influence towards Customer Loyalty of Onitsuka Tiger.
4.5.3 Coefficient of Correlation (R) and Coefficient of Determination (R2)
Table 4.8 Coefficient of Correlation (R) and Coefficient of Determination
(R2)
Model Summaryb
Model R R square Adjusted R
square
Std. error of
the estimate
1 .866a .750 .738 .51153963
Source: Processed Primary data, by SPSS v.21
Results calculated using SPSS can be seen that the Adjusted R square value of 0.738
obtained. The 73.8% means that customer loyalty can be influenced by the variable
product, promotion, price, place, brand awareness, word of mouth while the rest is
26.2% of customer loyalty is influenced by other variables which are not developed
in this research.
4.6 Interpretation Results
4.6.1 The Impact of Product towards Customer Loyalty
Based on the analysis result on table 4.6., the Probability value of X1 (Product) is
0.109 which has higher value than the significant value of 0.05. It means that
Product has no significant influence towards Customer Loyalty on Onitsuka Tiger

65
in Indonesia. It can be interpreted that even the quality, variant of color, design, and
size variety of Onitsuka Tiger products cannot guarantee to have a loyal customer.
Another Research titled “Impact of marketing mix towards Customer Loyalty that
used digital printing PT. Elang Perkasa Langgeng” by Adrian Yuwono and Prof.
Dr. Hatane Semuel, MS. (2015) supported this research.
4.6.2 The Impact of Promotion towards Customer Loyalty
Based on the analysis result on table 4.6., the Probability value of X1 (Promotion)
is 0.198 which has higher value than the significant value of 0.05. It means that
Promotion has no significant influence towards Customer Loyalty on Onitsuka
Tiger in Indonesia. It can be interpreted that even the promotion in social media,
ads, and many more cannot guarantee customer to be loyal. Another Research titled
“Impact of marketing mix towards Customer Loyalty on Fresh Mart Bahu mall
Manado” by Christian A.D. Selang (2013) supported this research.
4.6.3 The Impact of Price towards Customer Loyalty
Based on the analysis result on table 4.6., the Probability value of X1 (Price) is
0.341 which has higher value than the significant value of 0.05. It means that Price
has no significant influence towards Customer Loyalty on Onitsuka Tiger in
Indonesia. It can be interpreted that even discount, membership, and many more
cannot guarantee customer to be loyal. Another Research titled “Impact of
marketing mix towards Customer Loyalty that used digital printing PT. Elang
Perkasa Langgeng” by Adrian Yuwono and Prof. Dr. Hatane Semuel, MS. (2015)
supported this research.

66
4.6.4 The Impact of Place towards Customer Loyalty
Based on the analysis result on table 4.6., the Probability value of X1 (Place) is
0.162 which has higher value than the significant value of 0.05. It means that Place
has no significant influence towards Customer Loyalty on Onitsuka Tiger in
Indonesia. It can be interpreted that even design, positioning, of Onitsuka Tiger
stores in Indonesia cannot guarantee customer to be loyal. Another Research titled
“Impact of marketing mix towards Customer Loyalty that used digital printing PT.
Elang Perkasa Langgeng” by Adrian Yuwono and Prof. Dr. Hatane Semuel, MS.
(2015) supported this research.
4.6.5 The Impact of Brand Awareness towards Customer Loyalty
Based on the analysis result on table 4.6., the Probability value of X5 (Brand
Awareness) is 0.000 which has lower value than the significant value of 0.05. It
means that Brand Awareness has significant influence towards Customer Loyalty
on Onitsuka Tiger in Indonesia. It can be interpreted that Onitsuka Tiger as the
newcomer to Indonesia may try to start building their brand awareness because
when people start to be aware of a brand, they will start to be a loyal customers.
Another research titled “The Impact of Brand Awareness on Customer Loyalty
towards Igloo Ice Cream: A Study on Dhaka University Students.” By Haque, M.
S. S., Bappy, T. A., & Arifuzzaman, M. (2018) supported this research.
4.6.6 The Impact of Word of Mouth towards Customer Loyalty
Based on the analysis result on table 4.6., the Probability value of X6 (Word of
Mouth) is 0.154 which has higher value than the significant value of 0.05. It means

67
that Word of Mouth has no significant influence towards Customer Loyalty on
Onitsuka Tiger in Indonesia. However, Another Research titled “The impact of
customer relation and word of mouth towards customer loyalty bank customers
BPD Bali” by Ida Bagus Indra Saputra, Dr. Alit Suryani, and Drs. I Ketut Nurcahya
(2015) is not corresponding with the result that the researcher gets which stated that
Word of Mouth has significant influence towards Customer Loyalty.

68
CHAPTER V
CONCLUSIONS AND RECOMMENDATIONS
5.1 Conclusion
The main purpose of this research is to find if there any impact of product,
promotion, price, place, brand awareness, and word of mouth towards customer
loyalty of Onitsuka Tiger in Indonesia partially and simultaneously. Therefore, the
researcher has conducted a statistical testing such as classical data assumption and
multiple linear regression. The researcher’s tool used to collect the primary data
was questionnaire and was spread to 137 respondents around Indonesia to get
primary data. As shown by the classical data assumption, the data that was gathered
from the questionnaire is normally distributed and has been proved that there is no
multicollinearity and heteroscedasticity in it. Then, all of the data was being
processed through multiple regression. Therefore, according to the result on chapter
IV, the conclusion drawn by the researcher was as follow:
1. There is no significant influence of product towards customer loyalty on
Onitsuka Tiger in Indonesia. From the chapter IV, it is proven by the T-test
result which stated that there is no significant impact between product to
customer loyalty. It means that the product of Onitsuka Tiger is not the main
reason for the customer to be loyal.
2. There is no significant influence of promotion towards customer loyalty on
Onitsuka Tiger in Indonesia. From the chapter IV, it is been proved by the
T-test result which stated that there is no significant impact between

69
promotion to customer loyalty. It means that the promotion of Onitsuka
Tiger is not the main reason for the customer to be loyal.
3. There is no significant influence of price towards customer loyalty on
Onitsuka Tiger in Indonesia. From the chapter IV, it is proven by the T-test
result which stated that there is no significant impact between price to
customer loyalty. It means that the price, which is high in Indonesia
compared to Onitsuka Tiger in other countries, of Onitsuka Tiger is not the
main reason for the customer to be loyal.
4. There is no significant influence of place towards customer loyalty on
Onitsuka Tiger in Indonesia. From the chapter IV, it is proven by the T-test
result which stated that there is no significant impact between place to
customer loyalty. It means that the place, the store location of Onitsuka
Tiger is not the main reason for the customer to be loyal.
5. There is significant influence of brand awareness towards customer loyalty
on Onitsuka Tiger in Indonesia. From the chapter IV, it is proven by the T-
test result which stated that there is significant impact between brand
awareness to customer loyalty. As one of the oldest footwear brands from
Japan, Onitsuka Tiger already known worldwide especially in Indonesia. It
means that when the customers see the brand or logo of Onitsuka Tiger, they
are familiar with it and because of that they want to buy the products of
Onitsuka Tiger and stay loyal to it.
6. There is no significant influence of word of mouth towards customer loyalty
on Onitsuka Tiger in Indonesia. From the chapter IV, it is proven by the T-
test result which stated that there is no significant impact between Word of

70
Mouth to customer loyalty. It means that the product of Onitsuka Tiger is
not the main reason for the customer to be loyal.
7. There is a simultaneous significant influence of product, promotion, price,
place, brand awareness, and word of mouth towards customer loyalty.
5.2 Recommendations
5.2.1 Onitsuka Tiger
Based on the result of this research, only one out of six independent variables which
is Brand Awareness that generated significant impact result towards customer
loyalty on Onitsuka Tiger in Indonesia. Therefore, this research could be a feedback
for Onitsuka Tiger Indonesia to more focused on brand awareness because
according to T-test, Brand Awareness has significant influence to make Indonesian
customers to be loyal with Onitsuka Tiger. The more customers that loyal to
Onitsuka Tiger, it means that more surplus for Onitsuka Tiger Indonesia
5.2.2 Future Research
For the researchers that will do this kind of research, they should do the research
with different variables and/or focus. If other researchers want to research about
Customer Loyalty, then they should choose other variables besides Product,
Promotion, Price, Place, Brand Awareness, and last but not least Word of Mouth.
Furthermore, the other researcher also can have different focus regarding the
Customer Loyalty topic such as investigating influence of Brand Awareness
towards Customer Loyalty. It will better to get wider population to get more
accurate result of factor affecting Customer Loyalty.

71
REFERENCES
Books
Aaker, D. (2008). Manajemen Ekuitas Merek: Memanfaatkan Nilai dari suatu
Merek. Cetakan ketiga. Jakarta: Penerbit Mitra Utama.
Black, K. (2010). Business Statistics (6th edition): For Contemporary Decision
Making. New Jersey: John Wiley & Sons, Inc.
Boyd, H. W. (2000). Manajemen Pemasaran : Suatu Pendekatan Strategis dengan
Orientasi Global. Jilid 2. Edisi Kedua. Alih Bahasa : Imam Nurmawan.
Jakarta : Penerbit Erlangga.
Chandra, G. (2002). Strategi dan Program Pemasaran, edisi pertama, cetakan
pertama. Yogyakarta.
Ghozali, I. A. (2013). Analisis Multivariat dan Ekonometrika: Teori, Konsep, dan
Aplikasi dengan EViews 8. Semarang: ISBN.
Goforth, C. (2015). Statistical Consulting Associate. University of Virginia.
Goyette, I., Richard, L., Bergeron, J., & Marticotte, F. (2010). e-WOM Scale:
Word-of-Mouth Measurement Scale for e-Services Context. Canadian
Journal of Administrative Sciences.
Griffin, J. (2007). Loyalitas Pelanggan. Jakarta: Erlangga.
Hair, J. F. (Ed.). (2014). Multivariate data analysis (7. ed., Pearson new internat.
ed). Harlow: Pearson.
Hawkins, D. M. (2010). Consumer Behavior: Building Marketing Strategy 11th
edition. New York: McGraw Hill.
Karsono. (2008). Pemasaran Jasa dan Kualitas Pelayanan. Malang: Bayu Media
Publishing.
Koniewski, M. (2012). Brand Awareness and Customer Loyalty. Research-PMR,
pp.2-3.
Kotler, P., & Armstrong, G. (2001). Principle of Marketing : 9thnEdition. New
Jersey: Prentice Hall.
Kotler, P., Armstrong, G., Harris, L., & Piercy, N. (2017). Principles of Marketing.
Harlow: Pearson.

72
Kotler, P., & Keller, K. L. (2016). Manajemen Pemasaran (edisi ketiga belas, Jilid
1). Jakarta: Erlangga.
Lin, S. Y. (2006). The impact of warranty and brand awareness on customer loyalty.
Chinese Management Review. 8. 1-20.
Lin, Y. C. (2013). Evaluation of co-branded hotels in the taiwanese market: the role
of brand familiarity and brand fit. International Journal of contemporary
Hospitality Management, 25(3), 346-364.
Lupiyoadi, H. (2007). Manajemen Pemasaran Jasa.
O’Guinn, Allen, & Semenik. (2009). Advertising and Integrated Brand Promotion,
5th. Perfect paperback Oklahoma.
Saunders, M., Lewis, P., & Thornbill, P. (2012). Research Methods for Business
Students (6th edition).
schiffman, & Kanuk. (2010). Perilaku Konsumen. Jakarta: PT. INDEK.
Shimp, T. (2003). Periklanan dan Promosi. Erlangga, Jakarta.
Sugiyono. (2013). Metodologi Penelitian Kuantitatif, Kualitatif Dan R&D.
Bandung: ALFABETA.
Sujarweni, V. W. (2015). Metodologi Penelitian Bisnis Ekonomi. Yogyakarta:
PustakaBaruPress.
Suwartono, D. (2014). Dasar-Dasar Metodologi Penelitian. Yogyakarta: ANDI.
Swastha, B., & Irawan. (2005). Manajemen Pemasaran Modern. Yogyakarta.
Tjiptono, F. (2008). Strategi Pemasaran (edisi III). Yogyakarta.
Journal Article
Babin, B. J., Yong-Ki Lee, Eun-Ju Kim, & Griffin, M. (2005). Modeling Consumer
Satisfaction and Word of Mouth : Restaurant Patronage in Korea. The
Journal of Services Marketing, 19(3) : 133-139.
Goforth, C. (2015). Statistical Consulting Associate. University of Virginia.
Goyette, I., Richard, L., Bergeron, J., & Marticotte, F. (2010). e-WOM Scale:
Word-of-Mouth Measurement Scale for e-Services Context. Canadian
Journal of Administrative Sciences.
Harsono, R. (2016). The Impact of Marketing Mix (4P’S) on Customer Loyalty
Towards Toyota Avanza, 4(1), 1–7.

73
Haque, Bappy, T. ., & Arifuzzaman, M. (2018). The Impact of Brand Awareness
on Customer Loyalty towards Igloo Ice Cream: A Study on Dhaka
University Students. International Journal of Science and Business, 2(1),
1–21.
Homburg, C., Klarmann, M., & Schmitt, J. (2010). Brand Awareness in business
markets: when is it related to firm performance? International Journal of
research in marketing, 27(3), 201-202.
Lin, Y. C. (2013). Evaluation of co-branded hotels in the taiwanese market: the role
of brand familiarity and brand fit. International Journal of contemporary
Hospitality Management, 25(3), 346-364.
Nugroho, R. (2013). Pengaruh People, Physical Evidence, Product, Promotion,
Price dan Place Terhadap Tingkat Kunjungan Di Kafe Coffee Cozies
Surabaya. JURNAL MANAJEMEN PEMASARAN, 1(2), 1–9.
Saputra, I. B. I., Suryani, A., & Nurcahya, I. K. (2015). The impact of customer
relation and word of mouth towards customer loyalty bank customers BPD
Bali. E-Jurnal Manajemen Universitas Udayana, 2(1), 526–537.
Saravanan, D. D. (2016). FASHION TRENDS AND ITS IMPACT ON SOCIETY,
11.
Selang, C. (2013). Impact of marketing mix towards Customer Loyalty on Fresh
Mart Bahu mall Manado. Jurnal EMBA, 1(3), 71–80.
Sukamto, R., & Lumintan, D. B. (2015). The Impact of Marketing Mix towards
Customer Loyalty Mediated by Customer Satisfaction of Blackberry
Indonesia, 3(2), 316–324.
Sumardy. (2011). The Power of Word of Mouth Marketing.
Surya, & Setiyaningrum, A. (2009). Analisis Persepsi Konsumen pada Aplikasi
Bauran Pemasaran Serta Hubungannya terhadap Loyalitas Konsumen
Journal of Business Strategy and Execution 2.
Tandarto, R., & Dharmayanti, D. (2017). Pengaruh Brand Awareness Terhadap
Customer Loyalty Dengan Celebrity Endorsement Raline Shah Sebagai
Variabel Intervening Top White Coffee di Surabaya. Jurnal Strategi
Pemasaran.

74
Yuwono, A., & Semuel, H. (2015). Impact of marketing mix towards Customer
Loyalty that used digital printing PT. Elang Perkasa Langgeng.
Web Page
Bhasin, H. (2018). Purchase intention - Role of Purchase Intention in Increasing
Sales. Retrieved March 4, 2019, from
https://www.marketing91.com/purchase-intention/
Bogaisky, J. (2018). Farewell To The Father Of The Octopus Shoe. Retrieved
March 3, 2019, from 2007/10/01/onitsuka-asics-obit-face-markets-
cx_jb_1001autofacescan01
Brooks, M. (2018). HOW TO BE ICONIC: Onitsuka Tiger’s World Domination
Strategy. Retrieved March 4, 2019, from
http://www.japansubculture.com/how-to-be-iconic-onitsuka-tigers-world-
domination-strategy/
Chambers, S. (2018, February 21). The Importance of Customer Loyalty. Retrieved
March 4, 2019, from https://www.nicereply.com/blog/the-importance-of-
customer-loyalty/
Footasylum. (2018). Onitsuka Tiger Brand History. Retrieved March 3, 2019, from
https://www.footasylum.com/onitsuka-tiger-history/
Hidayat, A. (2013, January 3). Pengertian dan Tutorial Uji Heteroskedastisitas
dengan Uji Glejser. Retrieved January 24, 2019, from
https://www.statistikian.com/2013/01/uji-heteroskedastisitas.html
Hidayat, A. (2013, January 23). Penjelasan Tentang Uji Normalitas dan Metode
Perhitungan. Retrieved January 24, 2019, from
https://www.statistikian.com/2013/01/uji-normalitas.html
Hidayat, A. (2016, November 11). Pengertian Multikolinearitas dan Dampaknya.
Retrieved January 24, 2019, from
https://www.statistikian.com/2016/11/multikolinearitas.html
Kurniawan, V. (2017). Sneakers Mania, Onitsuka Tiger Buka Toko Pertama
Indonesia di Plaza Senayan. Retrieved March 4, 2019, from

75
https://wolipop.detik.com/fashion-news/d-3703716/sneakers-mania-
onitsuka-tiger-buka-toko-pertama-indonesia-di-plaza-
senayan?_ga=2.123462344.2109467947.1551616127-
76046349.1530000866
Kompas. (2017, November 2). Onitsuka Tiger Hadir di Indonesia. Retrieved
January 24, 2019, from
https://lifestyle.kompas.com/read/2017/11/02/144048420/onitsuka-tiger-
hadir-di-indonesia
Kompas. (2018). Gerai Terbaru Onitsuka Tiger dan Kata Pesohor Tentangnya.
Retrieved March 4, 2019, from
https://lifestyle.kompas.com/read/2018/10/02/003112420/gerai-terbaru-
onitsuka-tiger-dan-kata-pesohor-tentangnya
Onitsuka. (2015). Onitsuka Tiger Unique, playful and artistic. Retrieved from
www.onitsukatiger.com
Stephanie. (2014, December 9). Cronbach’s Alpha: Simple Definition, Use and
Interpretation. Retrieved January 18, 2019, from
https://www.statisticshowto.datasciencecentral.com/cronbachs-alpha-spss/
Wisnubrata. (2018). Cerita Nicholas Saputra dan Onitsuka Tiger. Retrieved March
4, 2019, from
https://lifestyle.kompas.com/read/2018/10/02/060600620/cerita-nicholas-
saputra-dan-onitsuka-tiger

76
APPENDICES
Appendix 1
Questionnaire
Impact of Marketing mix, Word of mouth, and Brand awareness towards
Customer loyalty on Onitsuka Tiger In Indonesia
Halo, perkenalkan nama saya Giovanni Macawalang. Saya seorang mahasiswa
bisnis internasional, prodi manajemen di Universitas Presiden angkatan 2015. Saat
ini saya sedang mengerjakan penelitian saya untuk mencapai gelar sarjana saya.
Penelitian ini dilakukan untuk mendukung penelitian saya tentang pengaruh
Marketing mix(harga, tempat, produk, promosi), word of mouth, dan brand
awareness terhadap customer loyalty untuk Onitsuka Tiger. Saya akan meminta
partisipasi Anda dalam mengisi kuesioner ini untuk membantu saya mengumpulkan
data penelitian. semua jawaban Anda bersifat rahasia dan hanya akan digunakan
untuk tujuan penelitian. Terakhir, saya ingin mengucapkan terima kasih karena
telah meluangkan waktu untuk menyelesaikan survei ini.

77
Onitsuka Tiger
Onitsuka Tiger adalah salah satu perusahaan sepatu tertua di Jepang, menelusuri
sejarahnya kembali ke pembentukan Onitsuka Co. Ltd. Pada tahun 1949 ketika
mantan perwira militer, 32 tahun, Kihachiro Onitsuka memulai perusahaannya
dengan harapan meningkatkan harga diri pemuda pascaperang melalui atletik.

78
Profil responden

79
Marketing mix (price, pace, product, promotion)
Product

80
Promotion

81
Price

82
Place

83
Brand Awareness

84
Word of Mouth

85
Customer Loyalty

86
Appendix 2
Data Respondents
Product and Promotion

87

88
89
Price, Place, and Brand Awareness

90

91

92
Word of Mouth and Customer Loyalty

93

94

95
Appendix 3
SPSS Results
Pre-test
Validity Test
PRODUCT(X1)

96
PROMOTION(X2)

97
PRICE(X3)

98
PLACE(X4)
Correlations
Place1 Place2 Place3 Place4 Place5 Total4
Place1
Pearson Correlation 1 .740** .493** .171 .289* .743**
Sig. (2-tailed) .000 .000 .232 .040 .000
N 51 51 51 51 51 51
Place2
Pearson Correlation .740** 1 .573** .404** .335* .822**
Sig. (2-tailed) .000 .000 .003 .016 .000
N 51 51 51 51 51 51
Place3
Pearson Correlation .493** .573** 1 .314* .360** .735**
Sig. (2-tailed) .000 .000 .025 .009 .000
N 51 51 51 51 51 51
Place4
Pearson Correlation .171 .404** .314* 1 .757** .692**
Sig. (2-tailed) .232 .003 .025 .000 .000
N 51 51 51 51 51 51
Place5
Pearson Correlation .289* .335* .360** .757** 1 .732**
Sig. (2-tailed) .040 .016 .009 .000 .000
N 51 51 51 51 51 51
Total4
Pearson Correlation .743** .822** .735** .692** .732** 1
Sig. (2-tailed) .000 .000 .000 .000 .000
N 51 51 51 51 51 51
**. Correlation is significant at the 0.01 level (2-tailed).
*. Correlation is significant at the 0.05 level (2-tailed).

99
BRAND AWARENESS(X5)
Correlations
BA1 BA2 BA3 BA4 Total5
BA1
Pearson Correlation 1 .543** .583** .669** .787**
Sig. (2-tailed) .000 .000 .000 .000
N 51 51 51 51 51
BA2
Pearson Correlation .543** 1 .756** .651** .864**
Sig. (2-tailed) .000 .000 .000 .000
N 51 51 51 51 51
BA3
Pearson Correlation .583** .756** 1 .733** .901**
Sig. (2-tailed) .000 .000 .000 .000
N 51 51 51 51 51
BA4
Pearson Correlation .669** .651** .733** 1 .890**
Sig. (2-tailed) .000 .000 .000 .000
N 51 51 51 51 51
Total5
Pearson Correlation .787** .864** .901** .890** 1
Sig. (2-tailed) .000 .000 .000 .000
N 51 51 51 51 51
**. Correlation is significant at the 0.01 level (2-tailed).

100
WORD OF MOUTH (X6)
Correlations
WOM1 WOM2 WOM3 WOM4 Total6
WOM1
Pearson Correlation 1 .685** .450** .217 .749**
Sig. (2-tailed) .000 .001 .127 .000
N 51 51 51 51 51
WOM2
Pearson Correlation .685** 1 .485** .427** .838**
Sig. (2-tailed) .000 .000 .002 .000
N 51 51 51 51 51
WOM3
Pearson Correlation .450** .485** 1 .597** .802**
Sig. (2-tailed) .001 .000 .000 .000
N 51 51 51 51 51
WOM4
Pearson Correlation .217 .427** .597** 1 .729**
Sig. (2-tailed) .127 .002 .000 .000
N 51 51 51 51 51
Total6
Pearson Correlation .749** .838** .802** .729** 1
Sig. (2-tailed) .000 .000 .000 .000
N 51 51 51 51 51
**. Correlation is significant at the 0.01 level (2-tailed).

101
CUSTOMER LOYALTY (Y)
Correlations
CL1 CL2 CL3 CL4 CL5 Total7
CL1
Pearson Correlation 1 .451** .233 .669** .692** .776**
Sig. (2-tailed) .001 .100 .000 .000 .000
N 51 51 51 51 51 51
CL2
Pearson Correlation .451** 1 .623** .456** .354* .732**
Sig. (2-tailed) .001 .000 .001 .011 .000
N 51 51 51 51 51 51
CL3
Pearson Correlation .233 .623** 1 .480** .371** .687**
Sig. (2-tailed) .100 .000 .000 .007 .000
N 51 51 51 51 51 51
CL4
Pearson Correlation .669** .456** .480** 1 .839** .883**
Sig. (2-tailed) .000 .001 .000 .000 .000
N 51 51 51 51 51 51
CL5
Pearson Correlation .692** .354* .371** .839** 1 .837**
Sig. (2-tailed) .000 .011 .007 .000 .000
N 51 51 51 51 51 51
Total7
Pearson Correlation .776** .732** .687** .883** .837** 1
Sig. (2-tailed) .000 .000 .000 .000 .000
N 51 51 51 51 51 51
**. Correlation is significant at the 0.01 level (2-tailed).
*. Correlation is significant at the 0.05 level (2-tailed).
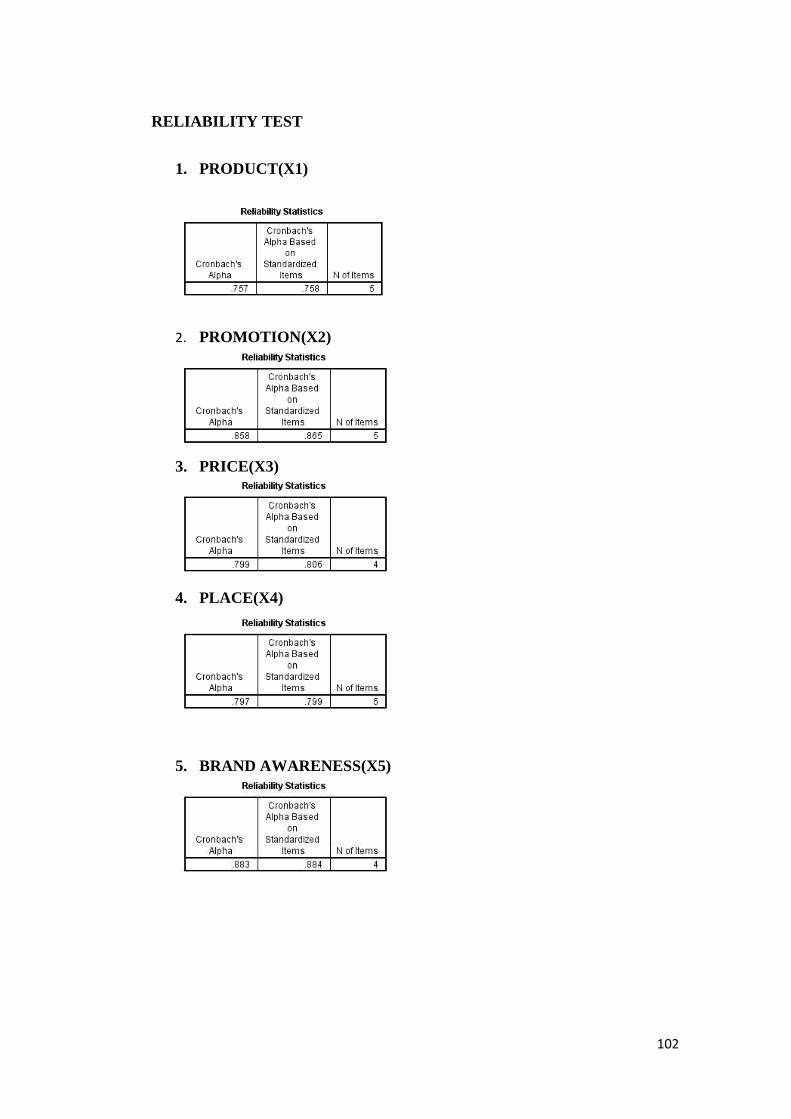
102
RELIABILITY TEST
1. PRODUCT(X1)
2. PROMOTION(X2)
3. PRICE(X3)
4. PLACE(X4)
5. BRAND AWARENESS(X5)
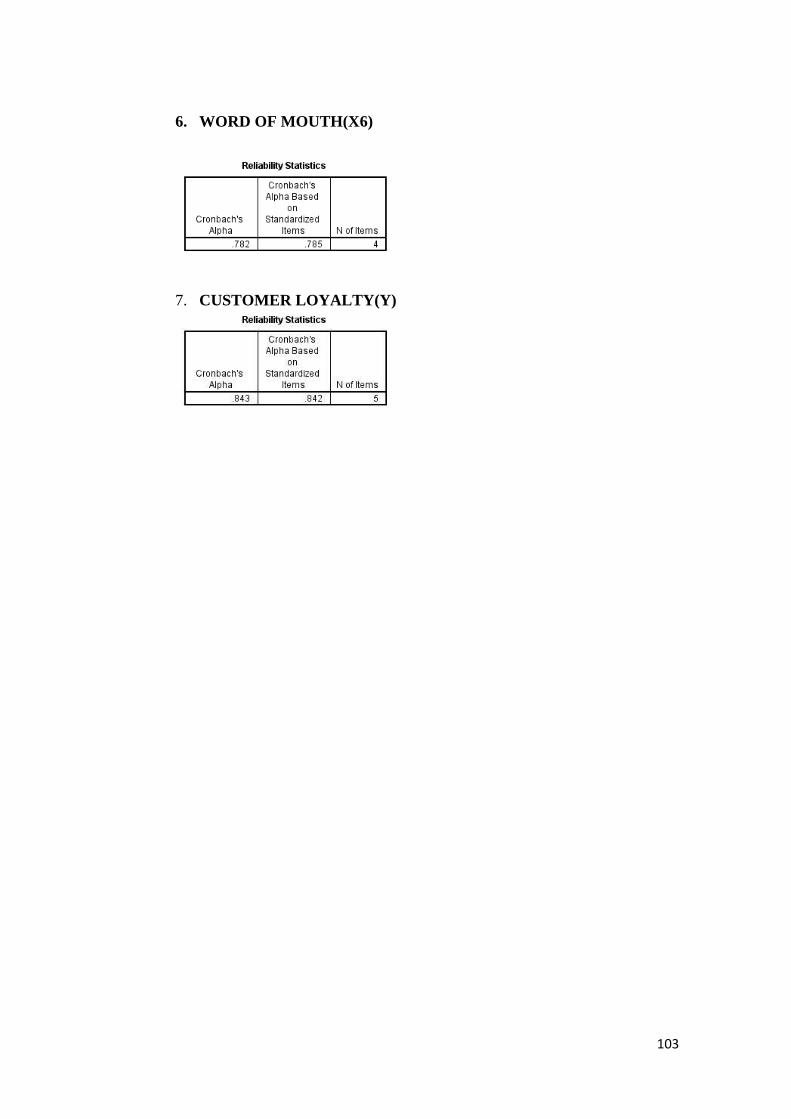
103
6. WORD OF MOUTH(X6)
7. CUSTOMER LOYALTY(Y)

104
Appendix 4
Plagiarism Document

105

106

107

108

109

110

111
Appendix 5
Table
R-table

112
T-table
F-table