the impact of land-use change on water quality at the catchment scale: the use of export coefficient...
TRANSCRIPT

The impact of land-use change on water quality at the catchmentscale: the use of export coefficient and structural models
F. Worralla,* , T.P. Burtb
aDepartment of Geological Sciences, University of Durham, Science Laboratories, South Road, Durham DH1 3LE, UKbDepartment of Geography, University of Durham, South Road, Durham DH1 3LE, UK
Received 23 June 1998; received in revised form 25 January 1999; accepted 1 June 1999
Abstract
The consequences of a decline in soil nitrogen following ploughing of permanent pasture and land-use change are explored interms of nitrate export at the catchment scale. The release of reserves of organic nitrogen built up in grassland soils is modelledas a first-order kinetic decay. The build up of reserves of nitrogen upon reversion to pasture is modelled both as a first-orderprocess and under the assumption that new grassland can absorb all the nitrogen applied to it. Results show that the release andsequestration of nitrogen in these reservoirs shows supply-limited hysteresis, and consequently the ploughing-up of permanentpasture has the dominant effect. Allowing for the present land-use and the effect of rainfall, the model is compared to stream-water nitrate concentrations measured in the Slapton Wood catchment, south west England. Significant overestimates areobserved that suggest that nitrogen released from ploughing up of grassland is either in an organic form or that significantdenitrification capacity is available. Optimising the model against the data from Slapton Wood catchment confirms there is anelastic capacity for denitirification within the catchment. At the catchment scale the grassland reservoirs acts as a constantsource of nitrogen whilst the effect of the reversion of land to permanent pasture, at the catchment scale, attains rapidequilibrium and does not continue to remove significant levels of nitrogen after the first year.q 1999 Elsevier Science B.V.All rights reserved.
Keywords:Water quality; Agricultural catchments; Export coefficient modelling; Nitrate
1. Introduction
Nitrate concentrations in surface and ground waterscontinue to be a matter of concern throughout thedeveloped world (Burt et al., 1993). Agriculture isseen as a considerable source of this growing nitrateproblem. There is a need, therefore, to understand andpredict the influence of agriculture and agriculturalpractice on the export of nitrogen from catchments.
One approach has been to develop physically-based
models to predict nutrient concentrations in real time.A number of such catchment wide models now exist(e.g. Styczen and Storm, 1993a,b; Lunn et al., 1996;Skop and Sorensen, 1998). However, such physically-based models have a number of disadvantages. Thesedisadvantages have been discussed in Worrall andBurt (1999), but can be summarised as: a dependenceof site-specific parameters; model parameters requireadditional effort and expense to measure; and physi-cally-based models impose a theory upon the data, atheory that may or may not be complete. An alterna-tive to the physically-based approach is to use anempirical model—especially for management use.
Journal of Hydrology 221 (1999) 75–90
0022-1694/99/$ - see front matterq 1999 Elsevier Science B.V. All rights reserved.PII: S0022-1694(99)00084-0
* Corresponding author. Fax:1 44-191-374-2535.E-mail address:[email protected] (F. Worrall)

Export coefficient models (e.g. OECD, 1982) havebeen developed for modelling the export of nitratesfrom catchments on the assumption that land-use is amajor control on nitrate occurrence at the catchmentlevel. These models have input requirements thatmake them fit for catchment management (Johnes,1996). Equally, the annual time step makes it suitablefor land-use change data. However, it can be arguedthat such export coefficient approaches are not trulyempirical, rather this approach suggests a single struc-tural equation for the export of nitrate. Such structuralmodels can be constructed from a series of empiricalrules for each of the processes believed to be operat-ing. Such structural models then form a bridgebetween the truly empirical and physical models andby examining the patterns in the data they are betterable to explore and interpret patterns in the observa-tions (Liu et al., 1997).
Export coefficient models tend to ignore the role oforganic nitrogen in the release of nitrate (Powlson etal., 1992) and the potential of reserves of nitrogen inthe soil. Such reserves of organic nitrogen vary in sizeand have a strong memory for the land use andmanagement under which they developed (Whitmoreet al., 1992). Addiscott and Mirza (1998) havesuggested that these reserves and their role in the‘nitrate problem’ have been underestimated. Thiswork explores the implications of what is knownabout the nature of soil nitrogen reserves and thelink between land use and water quality in agriculturalcatchments, using data for the Slapton Wood catch-ment (Devon, UK) to explore how these processesmay upscale to the catchment level. A structuralmodel is proposed that includes their influence.
2. Approach
This work combines an export coefficient modelwith a model of the kinetically-controlled release ofnitrogen from a soil reservoir.
2.1. Export coefficient model
The export coefficient model provides a model ofthe contribution of nitrogen from land-use types byvirtue of its present use rather than its historic use. Theapproach is based on the idea that the nitrate loadexported from a catchment is the sum of the losses
from individual sources, this being predicted from theproduct of the annual nitrogen loading at that sourceand an export coefficient that describes the fraction ofthat load; lost to the local stream each year. Originalexport coefficient models used only one generalexport coefficient for all agricultural land (e.g. Vollen-weider, 1968; Rast and Lee, 1983), but this is insen-sitive to change in the use of agricultural land, forexample, changes between crop types. The exportcoefficient model used in this study is based on Johnes(1996) where account is taken of inputs from nitrogenfixation by each agricultural crop, areas of woodland,inputs from human settlement and septic tanks, andspecific land management practices.
It is normal within some export coefficient modelsto allow for some component of past use and thepotential for the release of nitrogen when land-usechanges. The Department of the Environment (1988)in its model of nitrogen loss from agriculture to aqui-fers allows an additional 280 kg N for each hectare ofgrassland (not necessarily permanent pasture)ploughed up for the first three years after ploughing.Burt and Hanwell (1992) allow an additional280 kg N ha21 of ploughed permanent pasture forthe year after ploughing only. These allowanceswere not included in the model developed here;being replaced by a kinetic model of the release ofnitrogen built up under previous land use.
2.2. Kinetic model
Export coefficient models that set an allowance forrelease of nitrogen from build up under previous landuse are essentially equilibrium models. They assumethat the nitrogen built up under grassland is released inone pulse and that the soil reservoir of nitrogenquickly attains equilibrium with its new land-useand management. In the case of the Department ofthe Environment (1988) model equilibrium is attainedwithin three years, whereas the model proposed byBurt and Hanwell (1992) assumes equilibrium isattained within one year. One year is the usual timestep of the export coefficient model and so equilibriumis effectively instantaneous. However, Whitmore et al.(1992) showed that organic nitrogen losses, in the top25 cm of the soil, from the ploughing up of permanentgrassland were up to 489 kg N ha21 in the first yearafter ploughing. The organic nitrogen content of the
F. Worrall, T.P. Burt / Journal of Hydrology 221 (1999) 75–9076

ploughed grassland continued to decline after the firstyear with some 4 t N being lost over a twenty yearperiod. Jenkinson (1988) showed, on the basis of thechanges in organic carbon content under arable landthat was formally permanent pasture, a similar scaleof decline. On figures published by the Soil Surveyand Land Research Centre (Soil Survey of Englandand Wales, 1984) for the organic carbon content ofland under various types of usage, the average differ-ence (a measure of the equilibrium shift betweendifferent regimes) between arable land and permanentpasture is about 5 t N. Allison (1973) measured a 40%decrease in the organic nitrogen content of soils uponploughing; for the soils studied by Whitmore et al. thisrepresents a loss on the order of 4 t N. Reinhorn andAvinmelech (1974) showed that losses in nitrogenafter ploughing of old grassland was linearly relatedto the amount originally present in the soil. Whitmoreet al. (1992) modelled the decline in organic nitrogenas a first-order decay process with a half-life of5.5 years (decay constant 0.126 a21). The above datasuggest that 280 kg N a21 is an underestimate oflosses of nitrogen upon the ploughing up of grasslandand that equilibrium cannot be assumed on a time-scale of either one or three years.
It is relatively easy to account for this kinetically-controlled release of nitrogen from the soil reservoirwithin the framework of an export coefficient model.The area of permanent pasture that comes under theplough in one year is allowed to lose an additional489 kg N. This amount is in addition to the losesfrom that land due to its new use. In subsequentyears this additional loss of nitrogen is allowed todecline at the rate given above. The loss of nitrogenfrom the catchment then becomes the sum of thelosses of nitrogen from present land use and theamount of nitrogen released from decaying grasslandsoil reserves, be it one, two or more years since theycame under the plough. Nitrogen input to the landfrom rainfall is taken as separate from other inputsand sources and is given a global figure for per hectareof land in the catchment. Therefore the loss of nitro-gen from the catchment becomes:
Annual loss�X
AiEi Ii 1X
AjN0e2lj 1 R
whereAi is the area of catchment occupied by land usetype i (or number of livestock typei); Ei the export
coefficient of land use typei (or number of livestocktype i); Ii the annual nitrogen input to land use typei(or from livestock typei), Aj the area of permanentpasture ploughed in yearj, N0 the initial loss of nitro-gen in year after ploughing (given as 489 kg N in theabove discussion);l the decay constant (given as0.126 in the above discussion); andR is the input ofnitrogen from precipitation-the input per hectare bythe area of the catchment.
If grassland soils act as a store of nitrogen thatdecays with time, then it follows that the reverseprocess can occur. Land put back to pasture willabsorb nitrogen and so limit the amount leachedfrom the catchment. The usual export coefficientapproach assumes that land reverting to, or becomingpasture, export nitrogen in proportion to its input.Again, this assumes that equilibrium nutrient exportis achieved instantaneously. Equally, it assumes thateither the reserves of nitrogen stored in grassland soilsare established instantaneously or that their build updoes not exert any influence on nitrogen export fromthe new pasture. In the light of what is known aboutthe release of nitrogen from the ploughing ofpermanent pasture, it seems likely that a kineticdescription of the build up of nitrogen in pasture isalso required.
What is the appropriate description of the build upof nitrogen in pasture? Because of the large differencebetween the organic nitrogen content of permanentgrassland and arable land, it could be assumed, atleast in the first years after reversion, that grasslandis so far from equilibrium that it can absorb all theapplied nitrogen. This ‘far from equilibrium’ modelwould mean that the model of nitrate export wouldbecome:
Annual loss�X
AiEiIi 1 N0
XAje
2lj 1 R
2 Ip
XAk
whereAk is the area of land reverting to, or becoming,pasture in thekth year; andIp the input of nitrogen tothe new pasture.
Alternatively, the build up of organic nitrogenreserves could be a first order process. In this casethe amount of the nitrogen input absorbed is propor-tional to how far from the equilibrium organic nitro-gen content the pasture is. This ‘distance from
F. Worrall, T.P. Burt / Journal of Hydrology 221 (1999) 75–90 77

equilibrium’ model is:
Annual loss�X
AiEiIi 1 N0
XAje
2lj 1 R
2 Ip
XAke
2mk
wherem is the rate constant for the accumulation oforganic nitrogen.
Clement and Williams (1967) showed that grass-lands could accumulate organic nitrogen at a rate ofapproximately 0.005% N a21 in the top 15 cm of thesoil. Jenkinson (1988) suggests that grassland soilscan accumulate much more than this, given sufficienttime, but that in the first 25 years the rate of accumu-lation is about 0.003% N a21. This suggests that therate of decay of nitrogen absorption is more or lessequivalent to the rate of decay of nitrogen releaseestimated by Whitmore et al. (1992).
More complex rate laws could be utilised for eitherthe release of nitrogen or for the build up of organicnitrogen. Jenkinson and Rayner (1977) used paralleland series first-order rate laws to describe the turnoverof the various fractions of organic matter in soils.Whitmore (1996) used a second-order rate law tomodel the mineralisation of carbon in crop residues.Although both approaches have theoretical attractionsneither the level of data available to this study nor thenature of the export coefficient model justifies suchcomplexities. Equally no allowance at this stage ismade in this model for denitrification either in thegroundwater of the catchment or in riparian zones.
2.3. Rainfall model
Addiscott and Mirza (1998), modelling the leach-ing of nitrogen from the long-term experiments atRothamsted, showed that the decline in nitrogenleaching from lysimeters was not only dependent onthe exponential decay of the available nitrogen reser-voir but also on the present and previous year’s rain-fall. The release of nitrogen from the soil reservoir istaken as being in equilibrium with the average rainfallconditions, it is enhanced if the rainfall in any oneyear is above average and the previous year’s rainfallhad been below average. The effect of rainfall on theuptake of nitrogen into the soil reservoir is the reversesituation, i.e. uptake will be limited in year with aboveaverage rainfall and below average rainfall in theprevious year. Allowing for this in ‘distance fromequilibrium’ model:
Annual loss�X
AiEi Ii 1 N0
X�a= �a�a�u= �a�bAje
2lj
1 R2 Ip
X�a= �a�d�u= �a�1Ake
2mk
where:a is the rainfall in the current year;�a is theaverage rainfall over the period of the study;u therainfall in the year previous to current; anda , b , dande are empirical constants.
It would be expected thata ande will be positive,and thatb and d will be negative in line with thetheory of how the present and previous year’s rainfalleffects the export of nitrogen.
F. Worrall, T.P. Burt / Journal of Hydrology 221 (1999) 75–9078
Table 1Land-use areas, inputs and export coefficients for the simulated catchment
Land use type Fertiliser input (kg N ha21 a21)a Export coefficientb Area (ha)
Temporary pasture 125 0.05 25Permanent pasture 125 0.05 50Cereals 150 0.12 50Root crops 100 0.2 25
Livestock type Nitrogen input (kg N animal21 a21)c Export coefficientd Number
Cattle 70 0.16 50Sheep 9 0.17 50Human population 4.5 0.65 5Effective runoff� 489 mm
a Source: The Royal Society (1983).b Sources: The Royal Society (1983), Cooke (1976), and Gostick (1982).c Source: Vollenweider (1968).d Source: Cooke (1976).

In each of the above cases the annual loss calcu-lated in kg N a21 is converted to a concentration(mg N l21) by knowledge of the annual runoff of thecatchment for each of years of the period of the study.
3. Methodology
3.1. Effect of soil nitrogen reserves
To demonstrate the comparative performance of thekinetic models of the build up and release of nitrogenreserves a series of land-use changes was performedon an idealised catchment with a settled initial landuse (Table 1.). It is assumed that no land-use changeshave occurred over a sufficiently long timescale suchthat there would be no significant changes takingplace in the grassland soil reservoir.
The scenarios used for the simulations are as follows:
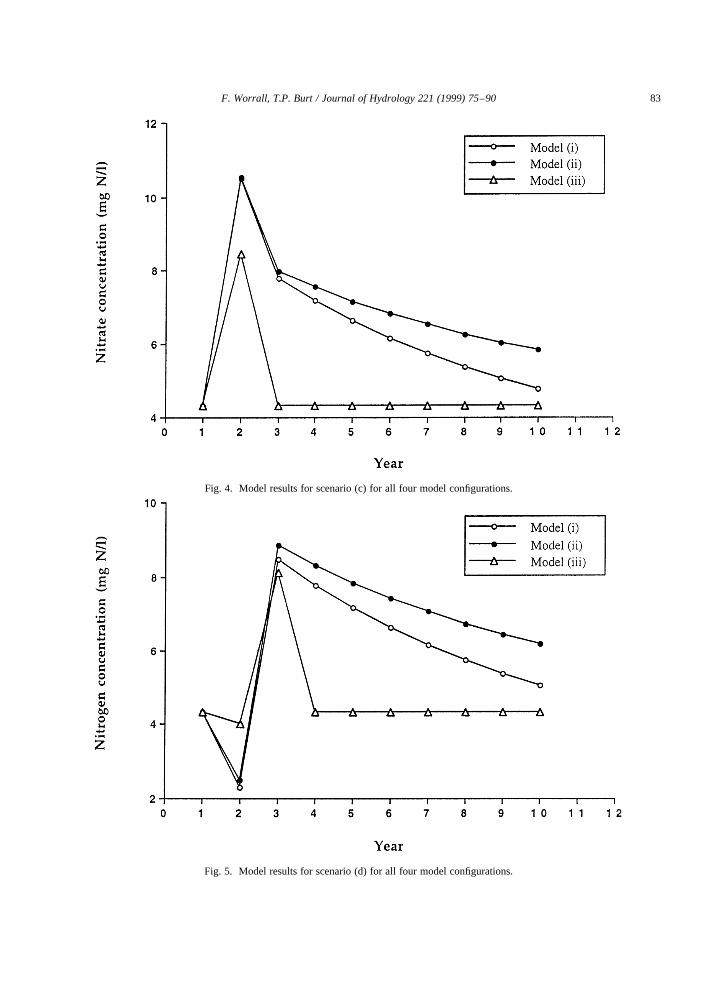
(a) a 20% decrease in the area of permanent pasturewith land going to cereal production as a means ofillustrating the unlocking of the soil nitrogen reser-voir;(b) a 20% increase in the area of permanent pasturewith the land coming from cereal production inorder to illustrate the locking-up effect of the soilnitrogen reservoir;(c) a 20% increase in the area of permanent pasturein the second year of the simulation with thischange being reversed in the third year, the 20%of land coming from and returning to cereal produc-tion. It is assumed that the land returned to cerealproduction in the third year of the simulation is notthe same grassland that was ploughed in the secondyear of the simulation but comes from the pool ofinitial permanent pasture (see discussion below).This scenario allows comparison of the locking-up and then unlocking of the grassland soil reser-voir; and(d) a 20% decrease in the area of permanent pasturein the second year of the simulation, this beingreversed in the third year, again with land goinginto and coming from cereal production. Reversingscenario (c) allows the examination of the effects ofthe sequential unlocking to locking up of thereserves to be compared.
In each case the simulation is run for a period of ten
years. It was assumed, for reasons of clarity, that therewas no change in the numbers of livestock over theperiod. The scenarios were run against three modelconfigurations, each being without the rainfall compo-nent proposed above:
(i) ‘best-estimates’ model: the unlocking and lock-ing up of the organic nitrogen reservoir are kineti-cally-limited with the rate constant being equal forboth �l � 0:126�;(ii) ‘far from equilibrium’ model: the grassland soilreservoir can absorb all the nitrogen applied to it;and(iii) equilibrium model: the ploughing-up of perma-nent pasture is accompanied by a one off additionalrelease of nitrogen in the year subsequent to theploughing as modelled in Burt and Hanwell (1992).
3.2. Sensitivity analysis
An analysis is performed to examine the sensitivityof the model outputs to the rate constants (l ( m ), ratelaws (see above), initial concentration released fromthe grassland soils (N0), and the amount of fertiliserapplied to the pasture (Ip). One approach to measuringthe sensitivity of individual parameters is to model afixed percentage change in such parameters while allothers were held constant (Jorgensen, 1991, Kirkby etal., 1993). However, this ‘one at a time’ designassumes that parameters of interest do not interactwith each other, i.e. that changes in anyone parameterare independent of changes in any other parameter. Tocircumvent this problem a factorial approach to thesensitivity analysis is taken: the sensitivity analysis ofthe separate rate laws and model configurations istreated separately. Parameter values were set at oneof two levels (one 10% greater than the other) and amodel simulation run for each possible combinationof the four parameters of interest at their two respec-tive levels, 16 model runs in all. For each model run,the percentage change in the concentration after10 years is calculated relative to the model concentra-tion results from scenario (d) for model (i). The calcu-lation of the effect of each factor and eachcombination of factors is then performed by standardtechniques (Miller and Miller, 1994). Since there is nomeasurement error involved in using computer
F. Worrall, T.P. Burt / Journal of Hydrology 221 (1999) 75–90 79

models the significance of effects neither needs to be,nor can be, tested.
3.3. Comparison with catchment data
The model configurations are compared againstdata for the Slapton Wood catchment (Fig. 1). TheSlapton Wood catchment is a sub-catchment of theRiver Gara, which flows into the Slapton Ley, thelargest freshwater lake in south west England.Because of concern that the lake was becomingeutrophic the catchments have been monitored forstream discharge, sediment load and nutrient concen-trations since 1970 (Troake and Walling, 1973;
Troake et al., 1976; Burt et al., 1983, 1988). Thecatchment is 0.94 km2 in area it is underlain byimpermeable Devonian slates above which freelydraining brown earth soils of the Manod Series havedeveloped (Trudgill, 1983). Topographically thecatchment divides at approximately the 90 m contourwith land above this level forming an extensiveplateau where slopes are typically less than 58. Thevalley-side slopes are much steeper, up to 258. Landuse history for the catchment is available from theannual agricultural census (MAFF, 1866 to date,Heathwaite et al. 1990-Table 2). Since hydrologicaland nutrient data were available for the period 1970–85, simulations were conducted from 1965 to account
F. Worrall, T.P. Burt / Journal of Hydrology 221 (1999) 75–9080
Fig. 1. Site location map for the Slapton catchment showing the subcatchment.

for prior land use change. Nitrate concentrations weresampled weekly for this period, Walling and Webb(1982) have shown that for weekly data measuredfor the Exe basin (south west England) such asampling frequency will have an error of̂18%: All
parameter values used were derived from the indepen-dent sources listed above. Inputs of nitrogen weretaken from data available for 1986 (Johnes, 1996;MAFF, 1969–1985). The annual rainfall and theeffective runoff are known for each year of the period
F. Worrall, T.P. Burt / Journal of Hydrology 221 (1999) 75–90 81
Table 2Land-use data for the Slapton Wood catchment for the period of the study
Year
Land-use (ha) 1 2 3 4 5 6 7 8 9 10 11 12 13 14 15Temp. grassland 46 47.2 47.4 53.2 31.9 28.9 29.3 31.2 30.9 29.4 28 26.5 27.2 30 28.8Perm. Grassland 37.4 36.5 36.2 30.4 50.3 53.5 53 47.4 46.6 50.4 51.6 52.3 53.3 49.8 52.1Cereals 19 20.1 18.3 17.3 18.4 18.3 18.3 22.4 23.5 21.6 25.2 24.1 23.2 27.8 26.8Root crops 5.9 6 4.9 4.5 4.9 5.2 8.8 5 5 5.2 4.3 4.2 3.3 4.9 6Field vegetables 4.9 8.1 8.1 5.7 4.9 5.8 5.5 4 1.1 5.1 3.7 3.7 3.2 2.8 4.6Oilseed rape 0 0 0 0 0.1 0.3 0 0.04 0.2 0.05 0.02 0.1 0.2 0.1Orchards 1.6 1 1.7 1.1 1.4 1.2 1 1.5 1.4 1.5 2.7 2.7 1.7 1.9 1.9Rough grazing 0.6 0.5 0.4 0.1 0.3 0.3 0.1 1.4 0.9 0.1 0.2 0.2 0.1 0.2 0.5Cattle 144 139 150 179 172 164 155 149 157 154 154 160 167 168 158Sheep 359 361 406 427 483 457 407 393 418 422 422 435 449 465 473Pigs 80 70 66 54 49 29 38 43 30 30 30 28 24 19 14Poultry 283 47 306 55 304 298 290 287 289 287 49 311 305 295 298
Rainfall (mm) 540 333 436 484 538 168 689 569 580 557 601 607 654 486 630
Fig. 2. Model results for scenario (a) for all four model configurations.

of the study (Burt et al., 1988). The rainfall com-ponent of model is not included at this stage as theempirical parameters on which it is based cannot beestimated independently of the model. In a separatestep the model, including the rainfall component, isoptimised against the Slapton Wood data. Optimisa-tion of the model against the Slapton Wood data, byenabling the comparison of the independently derivedparameter values and optimised parameter values,allows the importance of the processes at the catch-ment-scale to be assessed. In particular, export coeffi-cient values used above were calculated assumingthat all the nitrogen export derived from the presentland-use and there was no contribution from soilnitrogen reservoirs. Thus export coefficient valuesused above would be expected to be too high andthe contribution from soil nitrogen reservoirs wouldbe underestimated. Equally, the comparison withoptimised and independent parameter values willenable the need for the inclusion of additionalprocesses to be identified., for example, the need ofincluding denitrification processes at the catchmentlevel.
4. Results
Under scenario (a) no difference exists betweenmodel (i) and (ii) (Fig. 2) as they both have thesame rate constant for the decay of the release ofnitrogen from grassland soils. The real difference isbetween the models that are kinetically-limited ((i)and (ii)) and the equilibrium model (iii). The equili-brium model shows a single pulse corresponding tothe year after the ploughing up of permanent pastureafter which it obtains an equilibrium level onlydistinct from the initial conditions because of theadditional export from the cereal land. The presenceor absence of such sharp pulses provides an obviousdiagnostic for testing models (i) and (ii) against model(iii) in real data. The size of the initial change of anyobserved peaks would be indicative of the magnitudeof initial release from the soil reservoir.
An increase in permanent pasture (scenario (b)-Fig.3) does not manifest itself as a pulse in the equilibriummodel; however, those models with a kinetic elementshow a steep decline. This decline is proportional tothe amount of nitrogen applied to the newly created
F. Worrall, T.P. Burt / Journal of Hydrology 221 (1999) 75–9082
Fig. 3. Model results for scenario (b) for all four model configurations.
F. Worrall, T.P. Burt / Journal of Hydrology 221 (1999) 75–90 83
Fig. 4. Model results for scenario (c) for all four model configurations.
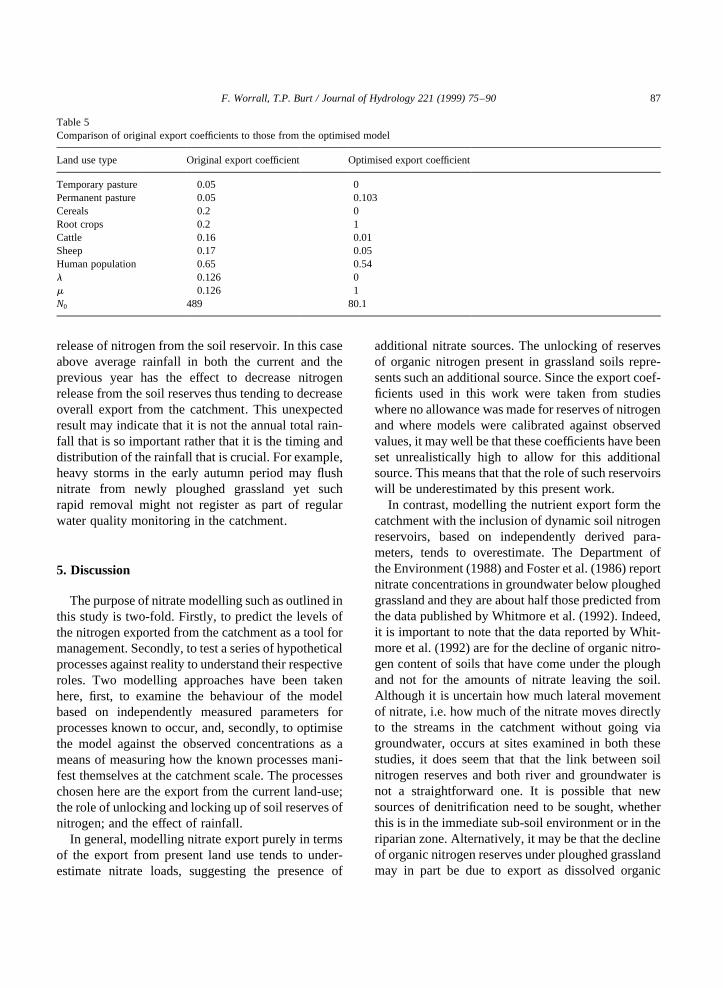
Fig. 5. Model results for scenario (d) for all four model configurations.

pasture as this limits the amount of nitrogen that canbe absorbed and removed from the system. Model (i)is now distinct from model (ii) because of the assump-tion that the newly created soil reservoir can absorb allthat is applied to it. Over the period of study thismeans that a new, far lower level of equilibrium isachieved in model (ii) whereas model (i) predicts anasymptotic return to the equilibrium model.
When reversing land-use changes that haveoccurred, the equilibrium model again predicts asimple pulse in both scenario (c) and (d) (Figs. 4and 5). The only difference is that in scenario (c) thepulse is preceded by a slight decrease in nitrateconcentrations corresponding to lower export of nutri-ent from pasture, due both to its lower inputs andlower export coefficient. The kinetically-limitedmodels show an apparent asymmetry in the responseof the reservoirs to locking up or unlocking. Thisasymmetry is illustrated by the fact that in bothscenario (c) and (d) the dominant factor is the releaseof nitrogen from ploughed-up grassland. The effect ofincreases in grassland is only to modify the decliningeffect of the unlocking of the reservoir of organicnitrogen under permanent pasture. If a new scenario
is considered where in a catchment with initially50 ha. of permanent pasture, 5 ha. of pasture isploughed-up and transferred to cereal productionevery year for five years and then 5 ha. of pasture isrestored every year for the subsequent five years theresultant nitrate losses show an hysteresis loop (Fig.6). This apparent hysteresis is not due to imbalance inthe rate constants between the processes of lockingand unlocking of the reservoirs, but rather one of theprocesses being supply-limited. When the reservoir ofnitrogen in permanent pasture is unlocked, the supplyof nitrogen is limited by the initial size of the reser-voir. In the case of these simulations it is assumed thatpasture coming under the plough is at equilibrium, i.e.it has been pasture for sufficient time so that it is nolonger absorbing significant amounts of the nitrogeninput to it, and therefore will release nitrogen in linewith the values estimated by Whitmore et al. (1992).However, the locking up of nitrogen under permanentpasture is limited by the amount of nitrogen applied tothe field, i.e. the absorption is supply-limited. In allsimulations a representative figure for fertiliser appli-cation to grassland was chosen, 125 kg N ha21 a21,this can be compared with 489 kg N ha21 a21 for the
F. Worrall, T.P. Burt / Journal of Hydrology 221 (1999) 75–9084
Fig. 6. Hysteresis loop for the ploughing up and subsequnet re-establish of permanent pasture.

initial release of N from the reservoir. The implicationof this is that it takes longer to develop the reserves oforganic nitrogen under grassland than it takes todeplete it.
It is apparent from Figs. 2–5 that the results of thesesimulations are more sensitive to the inclusion of thekinetically-limited soil reservoirs than the nature ofthe kinetic limitation. That is to say that larger differ-ences exist between the results from the equilibriummodel and those models that include a time-dependentdescription of the behaviour of the organic nitrogenreservoir, than between the models with different ratelaws describing this process.
Only the effects of individual factors and pairs offactors need to be considered in the sensitivity analy-sis (Table 3). The model appears particularly sensitiveto the parameters controlling the release of nitrogenfrom ploughed grassland soils. This reinforces theidea of supply-limited hysteresis controlling thenature of the locking up and unlocking of the soilnitrogen reservoir.
The effect of individual parameters could be due inpart to the magnitude of each of the parameters. Evenallowing for this, the magnitude of the initial releaseof nitrogen from ploughed grassland and the rate ofdecay of this release are the dominant factors. Thelarge effect of the interaction of the initial size ofthe reservoir and the rate of decay (N0l ) comparedto the nitrogen input (Ip) and the other interactionsmay suggest that rate of decay is not independent ofthe size of the reservoir. Such an interaction suggeststhat higher order rate laws may be operating.However, it is uncertain as to what extent thesemeasured sensitivities are scenario dependent
4.1. Comparison with catchment data
Even though the export component of each of the
F. Worrall, T.P. Burt / Journal of Hydrology 221 (1999) 75–90 85
Table 3Effects of individual factors and pairs of factors. Only those pairs offactors that showed non-zero interactions are shown
Factor Effect (%)
N0 3.48Ip 0.28l 4.14m 1.08N0 l 0.61Ipm 0.05
Fig. 7. The fit of the export coefficient model component to the observed concentration data for the Slapton Wood catchment.

models was calibrated against the 1986 land use datait does not fit well to the recorded stream nitrate data(Fig. 7). On average the export component is 26%(mean average percentage error) too low over theperiod of the study. For those models where a compo-nent of nutrient export from a kinetically-limitedreservoir has been included they all, on average,overestimate the nutrient export. (Table 4), whilethe equilibrium model (model (iii)) underestimatesthe export of nitrogen. None of the models provide agood description of the shape of the trend in the actualdata (Fig. 8a and b): all models predict high initialvalues that are not reflected in the measured
concentrations and no model predicts local maximaat times when they are actually observed. None of thediagnostic features discussed above can be observedin this data.
If the model parameters are optimised against theSlapton Wood data the fit of the model improves to10.3 mean average percentage error, which is withinthe error in the original data. The optimised para-meters show radical changes (Table 5). The rate ofuptake of nitrogen in newly formed grasslandincreased to 1, which implies that the uptake of nitro-gen is rapid and reaches equilibrium within a fewyears. The rate of release of nitrogen from the soilreservoir drops to approximately zero, the effect isthat ploughed grassland achieves equilibrium farslower than predicted. The initial size of the reservoiris now calculated as 80 kg N ha21 rather than the489 kg N ha21 estimated from the data of Whitmoreet al. (1992). The export coefficients show that someland use types have no apparent influence on theexport of nitrogen, whilst others have an increasedinfluence-this will be discussed further below. Opti-mising the rainfall model shows that rainfall has noeffect on the locking up of nitrogen in new grassland,but that rainfall pattern does have an effect on the
F. Worrall, T.P. Burt / Journal of Hydrology 221 (1999) 75–9086
Table 4Average percentage difference between measured annual averagenitrate concentrations and predicted concentrations (mean averagepercentage error). Negative values refer to predicted values beingsmaller than measured
Model Percentage difference
Export component only 2 23(i) 47(ii) 63(iii) 2 26Optimised (i) 10.3
Fig. 8. The fit of model configurations to the observed concentration data for the Slapton Wood catchment.
release of nitrogen from the soil reservoir. In this caseabove average rainfall in both the current and theprevious year has the effect to decrease nitrogenrelease from the soil reserves thus tending to decreaseoverall export from the catchment. This unexpectedresult may indicate that it is not the annual total rain-fall that is so important rather that it is the timing anddistribution of the rainfall that is crucial. For example,heavy storms in the early autumn period may flushnitrate from newly ploughed grassland yet suchrapid removal might not register as part of regularwater quality monitoring in the catchment.
5. Discussion
The purpose of nitrate modelling such as outlined inthis study is two-fold. Firstly, to predict the levels ofthe nitrogen exported from the catchment as a tool formanagement. Secondly, to test a series of hypotheticalprocesses against reality to understand their respectiveroles. Two modelling approaches have been takenhere, first, to examine the behaviour of the modelbased on independently measured parameters forprocesses known to occur, and, secondly, to optimisethe model against the observed concentrations as ameans of measuring how the known processes mani-fest themselves at the catchment scale. The processeschosen here are the export from the current land-use;the role of unlocking and locking up of soil reserves ofnitrogen; and the effect of rainfall.
In general, modelling nitrate export purely in termsof the export from present land use tends to under-estimate nitrate loads, suggesting the presence of
additional nitrate sources. The unlocking of reservesof organic nitrogen present in grassland soils repre-sents such an additional source. Since the export coef-ficients used in this work were taken from studieswhere no allowance was made for reserves of nitrogenand where models were calibrated against observedvalues, it may well be that these coefficients have beenset unrealistically high to allow for this additionalsource. This means that that the role of such reservoirswill be underestimated by this present work.
In contrast, modelling the nutrient export form thecatchment with the inclusion of dynamic soil nitrogenreservoirs, based on independently derived para-meters, tends to overestimate. The Department ofthe Environment (1988) and Foster et al. (1986) reportnitrate concentrations in groundwater below ploughedgrassland and they are about half those predicted fromthe data published by Whitmore et al. (1992). Indeed,it is important to note that the data reported by Whit-more et al. (1992) are for the decline of organic nitro-gen content of soils that have come under the ploughand not for the amounts of nitrate leaving the soil.Although it is uncertain how much lateral movementof nitrate, i.e. how much of the nitrate moves directlyto the streams in the catchment without going viagroundwater, occurs at sites examined in both thesestudies, it does seem that that the link between soilnitrogen reserves and both river and groundwater isnot a straightforward one. It is possible that newsources of denitrification need to be sought, whetherthis is in the immediate sub-soil environment or in theriparian zone. Alternatively, it may be that the declineof organic nitrogen reserves under ploughed grasslandmay in part be due to export as dissolved organic
F. Worrall, T.P. Burt / Journal of Hydrology 221 (1999) 75–90 87
Table 5Comparison of original export coefficients to those from the optimised model
Land use type Original export coefficient Optimised export coefficient
Temporary pasture 0.05 0Permanent pasture 0.05 0.103Cereals 0.2 0Root crops 0.2 1Cattle 0.16 0.01Sheep 0.17 0.05Human population 0.65 0.54l 0.126 0m 0.126 1N0 489 80.1

nitrogen rather than loss as nitrate. However, this doesnot mean that large shifts in the potential soil nitrogenreservoirs do not contribute to nitrate export from thecatchment.
The nature of the land use change in the SlaptonWood catchment during the period of the study wouldsuggest three peaks in the nitrate concentration trend(1974, 1979 and 1983). None of these peaks appear inthe measured record. The kinetic models of nitrogenrelease/uptake tend to overestimate the nitrogenexport at precisely the times of greatest release fromthese reservoirs. Even allowing for the fact that someof the loss of nitrogen from ploughed soils will be inan organic form these times would also represent thegreatest release of nitrate. If these large changes in theland use are not to appear in the catchment record thecapacity for denitrification must be large, larger thanthe possible export of nitrogen, but not utilised undernormal conditions otherwise the nitrate levels in thestream would be close to zero. That is to say, the rateof denitrification that must be invoked to cope withthe export of nitrogen from land-use changes occur-ring in, for example, 1974 would be sufficient toremove all the nitrogen exported in, for example,1971. Thus at the catchment scale the denitrificationcapacity appears to behave in an elastic manner andmust be proportionate to the levels of nitrate beingreleased.
The optimisation of the model suggested that theoriginal size of the reserves available for release is farsmaller than expected from independent observations.This confirms the theory that the amounts of nitrogenreleased from land-use change do not necessarily orcompletely transfer as nitrate to the streams of thecatchment, but may be lost to denitrification or asorganic nitrogen. The decay of nitrogen releasedfrom the soil reserve is close to zero suggesting thatat the catchment scale there is a continuous leakagefrom this reservoir. There is an assumption within themodel that the land-use classified as permanentpasture is at equilibrium, and therefore the ploughingup of this land would release nitrogen from a “full”reservoir. Due to the complex history of any one fieldthe reserves of nitrogen represented by that field maynot be at equilibrium or as complete as assumed. Thelow-level leakage from ploughed land may also indi-cate a role for temporary grassland in controllingexport of nitrogen at the catchment-scale.
When optimised the export coefficient for thetemporary grass drops to zero, this is consistent withtemporary grass absorbing most of nitrogen applied toit and rapidly attaining equilibrium. It is also consis-tent with the temporary grass in the catchment beingaway from the river and out of hydrological contactwith it. It is difficult to judge which of these alterna-tive interpretation is correct. A zero export coefficientis also found for the cereals and since it is unlikely thatcereals would absorb all the nitrogen applied to themit must represent the lack of effective hydrologicalcontact between the areas of cereal production andthe river. This lack of effective contact maybe dueto no real hydrological contact or the fact the hydro-logical pathways are such a character or sufficientlylong that either complete denitrification can occur ordilution makes the concentration negligible. Thenature of the Slapton Wood catchment is such thatthe topography divides between a broad plateauabove the 90m contour and the valley slopes. If cerealproduction is dominantly on the plateau then its effec-tive connection with the river might well be expectedto be less. The optimisation of the export coefficients,therefore produces an allowance for the spatial natureof the land use in any specific catchment.
This work has only considered the potential role ofthe ploughing up or creation of permanent pasture, butthe approach could equally be extended to all changesin land use. The amount of organic nitrogen in any soilwill be at or approaching equilibrium with its specificland use: when that lands use changes the equilibriumposition will also shift with a concomitant release orabsorption of nitrogen. This amount may well beinsignificant when the change is between crop types;however, two other types of land use are worthconsidering-temporary grassland and woodland.Darby et al. (1988) showed that the amounts of nitro-gen released upon the ploughing of temporary grass-land was between 100–200 kg N ha21, depending onthe length of time it had been under grass, in compar-ison to losses of4 t N ha21 over a 20 year period forpermanent pasture. Temporary grass is, however, bydefinition temporary, meaning that it comes under theplough much more frequently than permanent pasture.Perhaps its major contribution to the nutrientdynamics of the catchment is its potential role inabsorbing nitrogen. The potential rate at which perma-nent pasture can absorb nitrogen has already been
F. Worrall, T.P. Burt / Journal of Hydrology 221 (1999) 75–9088

discussed, especially the role of high rates of absorp-tion in the initial years after being put over to grass.Land that is put over to grass has no “knowledge” ofwhether it will later become permanent (pasture over20 years old) or be ploughed up within the next fewyears. For example, if the creation of temporary grass-land is modelled in the same manner as the creation ofpermanent pasture, then for the year 1974, when 6 ha.of permanent pasture were ploughed up but 6 ha. oftemporary grass were also created, the predictednitrate concentration drops by 2 mg N l21 (a 17%reduction). Therefore, creation of temporary grass-land could act as a buffer and provide an additionalsink at the catchment scale without necessarilyproviding such an effective source.
The behaviour of woodland soils is more compli-cated and may involve competing, multiphase beha-viour (Reynolds and Edwards, 1995). Roberts et al.(1989) reported elevated levels of nitrate in newlyafforested catchments subsequent to ground prepara-tion and planting, levels that declined over a 3 yearperiod. The amount of nitrate exported from forestedcatchments tends to increase with time with standsover 30 years old achieving equilibrium, probablybecause of nitrogen saturation of the soil (Aber etal., 1989). In the final phase of the forest cycle catch-ments show increased nitrogen export upon the fellingof the trees. All this suggests that stands of woodlandwould show time-dependent nitrogen behaviour thatcould not be adequately modelled by a single exportcoefficient.
6. Conclusions
This study proposes models of the effect of land usechange on water quality in agricultural catchments.The potential for permanent pasture to release itslarge reserve of organic nitrogen upon ploughing arewell known but this effect has not been considered atthe catchment scale. The release of nitrogen ismodelled as a first-order kinetic process with a half-life of 5.5 years and an initial export of489 kg N ha21 a21. Equally, the accumulation ofthese reserves, when land reverts to pasture, mustact as a sink of nitrogen. Simulation of the behaviourof this reserve shows apparent hysteresis caused bythe supply-limited absorption of nitrogen to the new
pasture. This suggests that the ploughing up of perma-nent pasture is the dominant effect in controllingexport from the catchment; a sensitivity analysisconfirms this.
Export coefficient modelling, using independentlyderived parameters, of nitrate levels in the SlaptonWood stream underestimates the observed values.Inclusion of time-dependent release and uptake offrom nitrogen reservoirs overestimates observedvalues: this is in line with studies of nitrate in ground-water. The overestimation coincides with periodswhen it is predict that releases from reserves are attheir greatest, suggesting that release may be in theform of dissolved organic nitrogen and that denitrifi-cation capacity in the catchment appears to respond tothe scale of the nitrate flux. Optimising the modelagainst the Slapton Wood catchment suggests thatthe ploughing up of grassland acts as continuouslow-level source of nitrate at the catchment-scale.While reversion of land to grassland has only ashort term effect.
The concept of kinetically-limited release of nitro-gen from soil reservoirs can be extended to all landuse changes but it may be of particularly use in under-standing the role of grassland, whether permanent ortemporary.
References
Aber, J.D., Nadelhoffer, K.J., Steudler, P., Mellilo, J.M., 1989.Nitrogen saturation in northern forest ecosystems. Bioscience39, 378–386.
Addiscott, T.M., Mirza, N.A., 1998. Modelling contaminant trans-port at catchment or regional scale. Agric. Ecosystems Environ.67, 211–221.
Allison, F.E., 1973. Soil organic matter and its role in crop produc-tion, Developments in Soil Science, 3, Elsevier, Amsterdam, pp.133-134.
Burt, T.P., Hanwell, J., 1992. Land of many uses. GeographyReview (November).
Burt, T.P., Butcher, D.P., Coles, N., Thomas, A.D., 1983. Thenatural history of the Slapton Ley nature reserve. XV. Hydro-logical processes in the Slapton Wood catchment. Field Studies5, 731–752.
Burt, T.P., Arkell, B.P., Trdugill, S.T., Walling, D.E., 1988. Streamnitrate levels in a small catchment in South West England over aperiod of 15 years (1970–1985). Hydrological Processes 2,267–284.
Burt, T.P., Heathwaite, A.L., Trudgill, S.T., 1993. Nitrate:Processes, Patterns and Management, Wiley, Chichester.
Clement, C.R., Williams, T.E., 1967. Leys and soil organic matter.
F. Worrall, T.P. Burt / Journal of Hydrology 221 (1999) 75–90 89

II. The accumulation of nitrogen in soils under different leys. J.Agric. Sci. 69, 133–138.
Cooke, G.W., 1976. A review of the effects of agriculture on thechemical composition and quality od surface and undergroundwaters. In: Agriculture and Water Quality, MAFF Tech. Bull.,32. HMSO. London, pp. 5-58.
Darby, R.J., Hewitt, M.V., Penny, A., Johnston, A.E., McEwan, J.,1988. The effects of increasing length of ley on the growth andyield of winter wheat. Rothamsted report I, 101–102.
Department of the Environment, 1988. The Hatton catchment study:A report of a joint investigation on the control of nitrate in watersupplies. Severn-Trent Water, Birmingham (also with Ministryof Agriculture Fisheries and Food).
Foster, S.S.D., Bridge, L.R., Geake, A.R., Lawrence, A.R., Parker,J.M., 1986. The groundwater nitrate problem. Hydrogeologyreport 86/2. British Geological Survey, Wallingford, UK.
Gostick, K.G., 1982. Agricultural Development and AdvisoryService recommendations to farmers on manure disposal andrecycling. Phil. Trans. R. Soc. London, B 296, 309–332.
Heathwaite, A.L., Burt, T.P., Trudgill, S.T., 1990. Land use controlson sediment production in lowland catchment, south-westEngland. In: Boardman, J., Foster, I.D.L., Dearing, J.A.(Eds.). Soil Erosion on Agricultural Land, Wiley, Chichester,pp. 69–86.
Jenkinson, D.S., 1988. The turnover of organic matter in soils. InRussell’s soil conditions and plant growth. In: Wild, A. (Ed.).Longman, London, pp. 564–607.
Jenkinson, D.S., Rayner, J.H., 1977. The turnover of soil organicmatter in some of the Rothamsted classical experiments. SoilSicence 123 (6), 298–305.
Johnes, P.J., 1996. Evaluation and management of the impact ofland use change on the nitrogen and phosphorus load deliveredto surface waters: the export coefficient modelling approach. J.Hydrol. 183, 323–349.
Jorgensen, S.E., 1991. Environmental management modelling. In:Hansen, P.E., Jorgensen, S.E. (Eds.). Introduction to Environ-mental Management, Elsevier, London, pp. 377–396.
Kirkby, M.J., Naden, P., Burt, T.P., Butcher, D.P., 1993. Computersimulation in physical geography, 2. Wiley, Chichester.
Liu, Z-J., Hallberg, G.R., Malanson, G.P., 1997. Structural equationmodeling of dynamics of nitrate contamination in ground water.J. Amer. Water Res. Association 32, 1219–1235.
Lunn, R.J., Adams, R., Mackay, R., Dunn, S.M., 1996. Develop-ment and application of a nitrogen modelling system for largecatchments. J. Hydrol. 174, 285–304.
MAFF, 1866 to date. Annual Agricultural Census Returns: Parishsummaries. Public Records Office, Kew, London.
MAFF, 1969, 1974, 1980, 1985. Survey of Fertiliser Practice.MAFF, Rothamsted, ADAS, Fertiliser Manufacturers Association.
Miller, J.C., Miller, J.N., 1994. Statistics for Analytical Chemistry,Ellis Horwood, London.
OECD, 1982. Eutrophication of waters: monitoring, assessment andcontrol. OECD, Paris.
Powlson, D.S., Hart, P.B.S., Poulton, P.R., Johnston, A.E., Jenkin-son, D.S., 1992. Influence of soil type, crop managementand weather on the recovery of 15N-labelled fertilizer appliedto winter wheat in spring. J. Agric. Sci., Cambridge 118, 83–100.
Rast, W., Lee, G.F., 1983. Nutrient loading estimates for lakes. J.Environ. Engng. 109, 502–517.
Reinhorn, T., Avinmelech, Y., 1974. Nitrogen release associatedwith the decrease in soil organic matter in newly cultivatedsoils. J. Environ. Qual. 3, 118–121.
Reynolds, B., Edwards, A., 1995. Factors influencing dissolvednitrogen concentrations and loadings in upland streams of theUK. Agric. Water Management 27, 181–202.
Roberts, G., Reynolds, B., Talling, J., 1989. Upland managementand water resources. Report to the Department of Environmentand Welsh Office, Institute of Hydrology, Wallingford, UK.
Royal Society, 1983. The nitrogen cycle of the United Kingdom.Royal Society, London.
Skop, E., Sorensen, P.B., 1998. GIS-based modelling of solutefluxes at the catchment scale: a case study of the agriculturalcontribution to the riverine nitrogen loading in the Vejle Fjordcatchment, Denmark. Eco. Modelling 106, 291–310.
Soil Survey of England and Wales, 1984. Soils and their use inEngland. Bull. 10-15, SSEW, Harpenden.
Styczen, M., Storm, B., 1993. Modelling of N-movements on catch-ment scale-a tool for analysis and decision making. I. Modeldescription. Fertiliser Res. 36, 1–6.
Styczen, M., Storm, B., 1993. Modelling of N-movements on catch-ment scale-a tool for analysis and decision making. II. Casestudy. Fertiliser Res. 36, 7–17.
Troake, R.P., Walling, D.E., 1973. The natural history of the Slap-ton Ley nature reserve. Field Studies 3, 719–740.
Troake, R.P., Troake, L.E., Walling, D.E., 1976. Nitrate loads ofSouth Devon streams. In Agriculture and Water Quality, MAFFTech. Bull., 32. HMSO. London, pp. 340-351.
Trudgill, S.T., 1983. The natural history of the Slapton Ley naturereserve. XVI. The soils of Slapton Wood. Field Studies 5, 833–840.
Vollenweider, R.A., 1968. Scientific fundamentals of stream andlake eutrophication, with particualr reference to nitrogen andphosphorus. OECD Tech. Rep. DAF/DST/88. OECD, Paris.
Walling, D.E., Webb, B.W., 1982. The design of samplingprogrammes for studying catchment nutrient dynamics.Proceedings of the Symposium on the Hydrology of ResearchBasins. Sonderh. Landeshydrologie. Bern, 747–758.
Whitmore, A.P., Bradbury, N.J., Johnston, P.A., 1992. Potentialcontribution of ploughed grassland to nitrate leaching. Agric.Ecosystems Environ. 39, 221–233.
Whitmore, A.P., 1996. Describing the mineralization of carbonadded to soil in crop residues using second-order kinetics. SoilBiol. Biochem. 28 (10/11), 1435–1442.
Worrall, F., Burt, T.P., 1999. A univariate model of riverwaternitrate time series. J. Hydrol. 214, 74–90.
F. Worrall, T.P. Burt / Journal of Hydrology 221 (1999) 75–9090