the impact of institutions and policy on informal economy in … · the policy coherence group. the...
TRANSCRIPT

The Impact of Institutions and Policy on Informal Economy
in Developing Countries An econometric exploration
Working Paper No. 84
Diego Rei
and
Manas Bhattacharya
Policy Integration and Statistics Department International Labour Office
Geneva
April 2008
Working papers are preliminary documents circulated to stimulate discussion and obtain comments

Copyright © International Labour Organization 2008 First published 2008 Publications of the International Labour Office enjoy copyright under Protocol 2 of the Universal Copyright Convention. Nevertheless, short excerpts from them may be reproduced without authorization, on condition that the source is indicated. For rights of reproduction or translation, application should be made to ILO Publications (Rights and Permissions), International Labour Office, CH-1211 Geneva 22, Switzerland, or by email: [email protected]. The International Labour Office welcomes such applications.
Libraries, institutions and other users registered with reproduction rights organizations may make copies in accordance with the licences issued to them for this purpose. Visit www.ifrro.org to find the reproduction rights organization in your country.
ILO Cataloguing in Publication Data Rei, Diego; Bhattacharya, Manas The impact of institutions and policy on informal economy in developing countries : an econometric exploration / Diego Rei and Manas Bhattacharya ; International Labour Office, Policy Integration and Statistics Department. - Geneva: ILO, 2008 35 p. (Working paper ; no.84) ISBN: 9789221213444;9789221213451 (web pdf) International Labour Office informal economy / informal employment / income / government policy / institutional framework / measurement / econometric model 03.01.5
The designations employed in ILO publications, which are in conformity with United Nations practice, and the presentation of material therein do not imply the expression of any opinion whatsoever on the part of the International Labour Office concerning the legal status of any country, area or territory or of its authorities, or concerning the delimitation of its frontiers.
The responsibility for opinions expressed in signed articles, studies and other contributions rests solely with their authors, and publication does not constitute an endorsement by the International Labour Office of the opinions expressed in them.
Reference to names of firms and commercial products and processes does not imply their endorsement by the International Labour Office, and any failure to mention a particular firm, commercial product or process is not a sign of disapproval.
ILO publications and electronic products can be obtained through major booksellers or ILO local offices in many countries, or direct from ILO Publications, International Labour Office, CH-1211 Geneva 22, Switzerland. Catalogues or lists of new publications are available free of charge from the above address, or by email: [email protected]
Visit our website: www.ilo.org/publns
Printed in Switzerland

Working Paper No. 84 i
Abstract: This paper performs empirical tests for the determinants of informal economy separately in terms of (i) income generation in the informal economy in proportion to the GDP and (ii) the proportion of employment in the informal economy to the total non-agricultural employment. Drawing on the previous findings and their policy implications, the paper attempts to estimate statistically more encompassing and robust models to assess how a mix of policies and institutions impact informal economy. In doing so, the paper tests the hypothesis that informal economy is a defensive refuge of the agents against over-regulation. Unlike most of the earlier studies, the paper covers only the developing countries (low and middle income). The results from the income measure of informal economy suggest that the quality of governance has a primary role to play and the impact of strict regulation is generally overrated. A good blend of regulation and governance may yield satisfactory results in promoting formal economy, while, at the same time the functioning of the banking system seems to be crucial. An increase in the trade openness tends to promote greater formality. The results from the model performed on the proportion of informal economy employment as the dependent variable highlight a more important role of regulation. However, this result does not stand the test of a more general and rigorous consistency check. A reconciliation of the findings from the two different measures of informal economy tends to suggest that the combination of policies and institutions that promote formality in terms of income generation also tends to support the growth of official (or formal) economy that aids transition from informal to formal economy employment.
JEL classification: J01, J24, J49.
Résumé: Cette étude réalise des tests empiriques portant sur les déterminants du secteur informel. Ces tests analysent séparément la part des revenus générés par le secteur informel dans le PIB et la part des emplois du secteur informel dans le total des emplois non agricoles. En s'appuyant sur des résultats antérieurs et sur les enseignements qui en ont été tirés sur le plan de l'action, ce document de travail tente d'estimer de manière statistique des modèles plus puissants et plus universels permettant d'évaluer l'impact de l'action conjuguée des politiques et des institutions sur le secteur informel. Ce faisant, l'étude teste l'hypothèse selon laquelle le secteur informel serait un refuge pour les agents économiques face à une réglementation excessive. À l'inverse de la plupart des études menées précédemment, ce document de travail ne couvre que les pays en voie de développement (à revenus faibles et intermédiaires). Les résultats des mesures des revenus générés par le secteur informel suggèrent le rôle primordial de la qualité de la gouvernance et la surestimation générale de l'impact de réglementations strictes. Des résultats satisfaisants dans la promotion du secteur informel peuvent être obtenus par un savant mélange de réglementation et de gouvernance, appuyé par un système bancaire dont le bon fonctionnement semble jouer un rôle essentiel. Une perméabilité accrue aux échanges tend à promouvoir une économie plus formelle. Les résultats produits par le modèle appliqué à la part des emplois dans le secteur informel, en tant que variable dépendante, mettent en lumière un rôle plus important de la réglementation. Cependant, ce résultat ne passe pas le test d'un contrôle de la cohérence plus général et plus rigoureux. Un rapprochement des résultats des deux différentes mesures du secteur informel tend à suggérer que la combinaison des politiques et des institutions favorisant l'aspect formel de l'économie en terme de génération de revenus, tend également à soutenir la croissance de l'économie officielle (ou formelle), laquelle contribue à une transition du secteur informel vers le secteur formel en matière d'emploi.
Classification JEL: J01, J24, J49.
Resumen: En este documento se presentan pruebas empíricas de los factores que determinan de manera separada la economía informal con respecto a: (i) la generación de ingresos en la economía informal en proporción con el PIB y (ii) la proporción de empleos en la economía informal en relación con el empleo no agrícola. Sobre la base de los resultados anteriores y sus repercusiones en las políticas, se intenta calcular estadísticamente modelos más robustos y más globales para evaluar cómo repercute en la economía informal una combinación de políticas e instituciones. De este modo, en el documento se demuestra la hipótesis de que la economía informal es un refugio defensivo de los agentes contra la regulación excesiva. A diferencia de la mayoría de los estudios realizados anteriormente, el documento abarca sólo a los países en desarrollo (ingresos bajos y medios). De los resultados provenientes de la medida de los ingresos de la economía informal se desprende que la calidad de la gobernanza desempeña un papel primordial y los efectos de la regulación estricta suelen sobrevalorarse. Una buena combinación de regulación y gobernanza puede generar resultados satisfactorios para promover la economía formal, al mismo tiempo que el funcionamiento del sistema bancario resulta ser esencial. Un aumento en la apertura del comercio tiende a promover una mayor formalidad. Los resultados del modelo aplicado a la proporción del empleo de la economía informal como variable dependiente ponen de relieve un papel más importante de la regulación. Sin embargo, este resultado no se sostiene en caso de una verificación sistemática más general y rigurosa. Al conjugar los resultados de las dos diferentes medidas de la economía informal, cabe pensar que la combinación de políticas e instituciones que fomentan la economía formal en términos de generación de ingresos también tiende a apoyar el crecimiento de la economía oficial (o formal), contribuyendo así a la transición del empleo informal al de una economía formal.
Clasificación JEL: J01, J24, J49.

ii Working Paper No. 84
The Policy Integration and Statistics Department
The Policy Integration and Statistics Department pursues the ILO’s decent work and fair globalization agenda from an integrated perspective. It consists of the Bureau of Statistics and the Policy Coherence Group.
The central objective of the latter is to further greater policy coherence and the integration of social and economic policies at the international and national level. To this end, it works closely with other multilateral agencies and national actors such as Governments, trade unions, employers’ federations, NGO’s and universities. Through its policy-oriented research agenda, it explores complementarities and interdependencies between employment, working conditions, social protection, social dialogue and labour standards. Current work is organized around four thematic areas that call for greater policy coherence: Fair globalization, the global poor and informality, macro-economic policies for decent work, and emerging issues.
Labour statistics play an essential role in the efforts of member States to achieve decent work for all and for the ILO’s support of these efforts. These statistics are needed for the development and evaluation of policies towards this goal, for assessing progress towards decent work, and for information and analysis of relevant labour issues. The ILO Bureau of Statistics works with integrity, independence and high professional standards to provide users within and outside the ILO with relevant, timely and reliable labour statistics, to develop international standards for better measurement of labour issues and enhanced international comparability, and to help member States develop and improve their labour statistics. It maintains strong professional relationship with national statistical systems and with statistics offices of other international agencies.
Director of the Policy Integration and Statistics Department: Stephen Pursey Director of the Bureau of Statistics: Sylvester Young Director of the Policy Coherence Group and Research Advisor: Rolph van der Hoeven
This paper was initiated by Duncan Campbell. This was a study initiated as a follow-up research from the recommendations of the Report of the World Commission on Social Dimension of Globalization.

Working Paper No. 84 iii
The Impact of Institutions and Policy on Informal Economy in Developing Countries An econometric exploration
Contents
Page
1. Introduction......................................................................................................................... 1
2. Literature............................................................................................................................. 3
3. The model, operational hypothesis and data .................................................................... 9
4. The rationale behind the choice of variables .................................................................. 13
5. Results ................................................................................................................................ 20 (a) Estimation based on income measure of informality ................................................ 20 (b) Estimation based on employment measure of informality........................................ 28
6. Summary and conclusions................................................................................................ 33
References ..................................................................................................................................... 35

Working Paper No. 84 1
The impact of Institutions and Policy on Informal Economy in Developing Countries An econometric exploration
1. Introduction
In the development literature, there have been alternative characterizations of informal sector based on competing perspectives. The earlier proponents of the concept of informal sector [Hart (1973); ILO (1972)] highlighted the state of informality as a form of survival through low quality and low earning occupations for individuals primarily as a result of lack of productive employment opportunities and lack of access to the market and productive resources (Tokman, 2001). However, unprotected workers (lack of protection being a defining characteristic of informal sector work) can also exist in the formal and the organised sector. Based on this realization, the ILO in its International Labour Conference, 2002, broadened the definition of informal sector to informal economy so as to include unprotected workers even if they work in the organised sector. Yet from another perspective, the informal economy has been described in various ways1 like shadow economy [Fleming et al. (2000); Schneider and Enste (2000)], hidden economy (Frey and Weck-Hannemann, 1984), black economy (Lyssiotou et al., 2004), underground economy [Tanzi (1999); Schneider and Enste (2000)], unofficial economy (Hibbs Jr. and Piculescu, 2005), to name some of those commonly found in the literature. These designations identify the attributes of informality with the characteristics of being unrecorded or unaccounted officially. Economic activities, which generate economic output, but unregistered with the public authority, and do not pay taxes or other statutory contributions, have been considered informal from this point of view. Corresponding to these definitions, informal economy is measured in terms of income generated by such activities and in aggregate, one can call it a measure of unofficial GDP. These definitions and measurements emerge from a regulatory perspective and run the risks of identifying informality, in part, with ‘illegality and labour precariousness’ though these two categories are conceptually different (Tokman, 2001).
The international definition for the purpose of statistical estimation of employment in the informal economy has an enterprise approach and starts with the definition of informal economy enterprises to include private unincorporated enterprises (excluding quasi-corporations) owned by individuals or households where enterprises do not have separate legal entity from their owners and separate accounts of the production activities as distinct from other activities of its owners. Based on this, a worker is considered as employed in the informal economy if the worker is employed in at least one informal economy enterprise irrespective of whether the work status is primary or secondary.2
For some of the authors, informal economy is a drag on economic growth, a dismal feature of an economy, ‘a last resort for labour absorption’ (ILO, 2001). Being unrecorded and hidden, informal economy does not contribute to government revenue constraining thereby the capacity of the government to invest in development while at the same time creating congestion in the use of public services that hinders growth (Loayza, 1996). The shadow economy, in a way is an aberration from efficient market economy since the agents do not
1 An interesting paper on definitions and measurements of informal sector is by Henley et al., 2006.
2 ILO (2006): KILM Fourth Edition.

Working Paper No. 84 2
have access to legally entitled benefits of market efficiency. However, there are contrasting views held by some others. Schneider and Klinglmair (2004), for instance, found the inverse relationship between the growth in shadow economy and that of the official economy valid in the developing countries, while the relationship was just the opposite in the developed countries. Sarte (2000) had shown that informality need not necessarily be detrimental to growth.
Several other authors also pointed out the positive economic effects that informal economy has on the official economy [Bhattacharyya (1993); Asea (1996); Schneider and Enste (2000)]. According to them, informal economy contributes to the growth of official economy by creation of market for its products and also increases tax revenue of the government indirectly. Fields (1990), Cunningham and Maloney (2001) and Maloney (2004) have argued that there is a big voluntary component in the informal economy, i.e., entrepreneurs and workers voluntarily opt for informality3 and not necessarily do so as “a last resort”. Given these heterogeneous approaches in characterisation of informality, the present paper seeks to address the question why the proportion of informality varies across the countries - why proportionately more people in some countries would voluntarily like to be in the informal economy compared to others? An inquiry into the causes of informality assumes relevance in order to diagnose the factors that might be associated with the growth and the sustenance of informality. There can be multiple causes affecting informality. The present paper looks into the combination of institutions and policies that determines informality separately in terms of (i) income generation in the informal economy in proportion to the GDP and (ii) the proportion of employment in the informal economy to the total non-agricultural employment.
This choice is also motivated by the interests in understanding the possible determinants of the transition from informality to formality at a global level across broad spectrum of development from lower to middle income countries. A large volume of literature analysed the possible determinants of informality obtaining mixed results in regard to the roles and the magnitudes of the impact of different variables in the domain of institutions and policies. The present paper examines whether these empirical findings stand the tests of alternative and arguably more complete modelling choices. The null hypothesis in this paper is that the variables and the measures considered in the empirical literature do have impacts on informality and these impacts should find their reflections in statistically significant and consistently signed regression coefficients.
The informal economy accounts for a large share in the Gross Domestic Product (GDP) of the developed and the developing countries. According to the estimates of Schneider (2005), the contribution of income generated in informal economy to GDP varied from 8.4 per cent in the United States to 68.3 per cent in Bolivia in the years 2002-03. Moreover, the percentage contribution, reportedly, is on the rise in several countries, e.g. Colombia moved from 39.1 per cent in the years 1999-2000 to 43.4 per cent in the years 2002-03, Haiti from 55.4 per cent to 58.6 per cent, Lao PDR from 30.6 per cent to 33.4 per cent, Moldova from 45.1 per cent to 49.3 per cent, (see Schneider, 2005 for a table covering 145 countries). The share of informal economy is also significantly large in terms of employment, particularly in the developing world. According to one estimate, in all regions of the developing world, informal employment outside of agriculture represents nearly half or more of the total non-agricultural employment (ILO, 2002).4
3 Pisani and Pagan (2004), based on a study of Nicaragua during the 1990s found that self-employment was often by choice and it was a source of microentrepreneurial dynamism in the economy.
4 These estimates are often not available for the same year for all the countries.

Working Paper No. 84 3
There is lack of uniformity in the ways informal economy is defined in various countries. According to these national definitions (the way different countries defined informal economies for the estimation of informal employment in the respective countries), employment in the informal economy in proportion to total employment was as varied as 5.8 per cent in Barbados in 1998 and 94.1 per cent in Mali in 1996. The ILO brought out estimates of informal employment by homogenisation of definitions of different countries and according to these estimates, the percentage of employment in informal economy varied between 3 per cent in Georgia to 50.15 per cent in Ethiopia in 1999. According to another definition, based on the number of micro enterprises in an economy, employment in the informal economy varied between 34.7 per cent in Panama to 57.9 per cent in Paraguay in the year 1996. The number of countries, for which employment data is available is rather small compared to the number of countries, for which, estimates on the size of informal economy in terms of income is available (Schneider, 2005). Notwithstanding differences in statistics, there is no denying the fact that, the size of the informal economy is quite large, both in terms of income (Schneider, 2005) and in terms of the size of employment.
The present paper is divided into six sections. The first section provides the introduction followed by a review of literature in section two. Section three provides a discussion on the model, the operational hypothesis and the data while section four highlights the rationale behind the choice of variables. The results and their interpretations are presented in section five. Section six concludes the paper and discusses the policy implications. Appendices include description of data and their sources and a discussion on the robustness checks performed on the models.
2. Literature
Chen, Sebstad and O’Connel (1999) attribute persistence of informality to lack of economic growth, the jobless nature of growth, the growth from below (like small scale informal enterprises driving growth) and structural adjustments (informality increases when structural adjustments are on course). The emphasis here is on the quantum and the nature of growth as the determinants of informality. Thus, policies or institutions that affect economic growth are expected to impact informality through indirect route.
The writings by some other authors, who seek to relate informality to policies and institutions share the view that informality is a defensive refuge of the economic agents in reaction to unacceptable regulatory burden of the state imposed through policies (like rigid labour laws, tax laws, social security laws etc.) and/ or seemingly oppressive bureaucratic red tapes or corruption embedded in the implementation mechanism [Hirschman (1970); Olson (1982); De Soto (1989)].5 Findings of some of the studies, which sought to estimate the precise impact of these factors on informality, were not always consistent amongst themselves in matters of details and yielded results, which are subject to qualifications. Loyaza (1996), for example, found informality to increase in response to a rise in the highest statutory corporate income tax rate (used as a measure of proxy of the tax burden). His study was based on observations of 31 countries in Latin America and the Caribbean for the period 1980-92. Friedman, Johnson, Kaufmann and Zoido-Lobaton (2000) had a different result. Based on a sample of 64 countries from OECD, Latin America and transition countries, the authors found that higher tax rates were generally correlated with a lower share of unofficial economy and argued that this is possible (at least in the richer countries) where higher tax burden is matched by better provision of public goods. Thus, the cost of higher tax burden is outweighed by the advantages of better public services
5 See Schneider and Enste (2000) for a review of literature.

Working Paper No. 84 4
reducing thereby any incentive for the tax payers to move into informality. The authors tested this premise by observing that the tax variable lost significance in the OLS when control for the legal environment (‘law and order’ representing the level of public goods provision) is introduced in the regression.6 The authors have also argued in an earlier paper (Johnson, Kaufmann and Zoido-Lobaton, 1998) that it was not the tax rate alone, but the way the tax system is administered determines the propensities to evade taxes. Using the data on ‘ratings’ of countries on the basis of tax burden (from the firm’s point of view) brought out by the 1997 Global Competitiveness Survey, which combined tax rates with the way they were administered (abuse of tax authorities’ discretionary power worsens the ratings), they found that, given the tax rates, better tax administration leads to lower share of unofficial economy. The findings of these authors bring into light the roles of regulatory quality and governance in determining informality. A review of writings of various authors7 on this subject demonstrates that empirical determination of the relationship between the tax burden and informality is contingent upon the approach to the measurement of tax burden and the type of tax variable chosen for this purpose. For example, Hibbs and Piculescu (2005) showed that it was ‘statutory tax rates relative to firm-specific thresholds of tax toleration’, rather than ‘high tax rates’, which caused ‘large shadow economies’. Hill and Kabir (1996) had shown that marginal tax rates were more relevant than average tax rates in explaining the growth of underground economy in Canada.8
The literature is replete with studies showing how various aspects of regulatory burden cause informality as an escape route. Labour regulations very commonly find places in these discussions. There are authors who hold workers’ welfare costs to employers (like social security contributions) and trade union pressures to protect workers against wage reduction or dismissal as aspects of regulation which induce informal practices since informality provides scope of evasion from these burdens [Mazumdar (1976); Portes, Castells and Benton (1989); Nipon (1991) cited in Loayza (1996); Loayza (1994); Botero et al. (2003)9]. Besides, compliance with various forms of regulations requires going through bureaucratic red tape, and there are significant transactions costs attached to this process [De Soto (1989); Alonzo (1991); Chikering and Salahdine (1991) cited in Loayza (1996)]. Loayza (1996) finds that the size of the informal sector positively depends on the proxies for labour market restrictions10 and negatively on the proxies for the quality of government institutions.11
6 It may be noted that law and order might also imply enforcement culture (enforcement of tax laws) more than popular satisfaction with public goods provision.
7 Literature on this subject is large. See, for references, Schneider and Enste (2000), and Schneider and Klinglmair (2004).
8 Cited in Schneider and Enste (2000).
9 Botero et al. find that heavier labour regulations tend to increase the share of unofficial economy. They also find that regulation has its own political base though the effects of legal origin of the country have stronger influence on the regulatory style than the political influence.
10 The author used the index constructed by Rama (1995) to proxy for the government imposed restrictions on the labour market controlling for inter-country variation in labour productivity by dividing the proxy with the per capita GDP of the respective country.
11 The author used the average of three indicators reported by the International Country Risk Guide (ICRG): quality of the bureaucracy, corruption in government and rule of law. For details see the appendix of Loayza (1996).

Working Paper No. 84 5
Regulatory environment in this area of empirical literature has been sought to be captured by ratings of various countries (or reports published) by different agencies like Heritage Foundation, Global Competitiveness Survey reports, International Country Risk Guide, Freedom House, Fraser Institute and Transparency International. The aspects covered to reflect regulatory qualities comprised of a range of attributes like formal rules and the ways they are enforced (whether there are regulatory discretions leading to laxity of enforcements), whether bureaucracy is efficient and predictable (bureaucratic quality), the extent of economic freedom and business friendliness, non-discriminatory judiciary, control of corruption etc. Better enforcement, efficient bureaucracy, economic freedom and more business friendly environment, less corruption, non-discriminatory judiciary – all set to capture better regulatory environment in a country. They also reflect better governance and institutional quality.12 Authors have found that better regulatory environment leads to lower informality [Johnson, Kaufmann and Zoido-Lobaton (1998); Friedman, Johnson, Kaufmann and Zoido-Lobaton (2000); Dreher et al. (2005)]. However, the generality of evidence in support of significant economic costs of labour regulation is not beyond challenge [Diwan and Walton (1997)]. Banerjee and Ghanem (1997) had shown that organized labour had little power to distort overall wage in the economy. Botero et al. (2004) held that the results showing negative labour market outcome of labour regulation are valid for the richer, but generally not the poorer countries.
Rational behaviour approach underpins the analyses that attribute informality to high taxes and social security costs and the costs of compliance with the labour regulations. According to this approach an economic agent weighs the costs and benefits of staying formal vis-à-vis informal. Staying informal has its explicit and implicit costs.
Explicit costs are those which accrue due to lack of access to legal recourse to enforce contracts (and therefore property rights) or to seek protection against criminal offences [Braun and Loayza (1993) and De Soto (1989) cited in Sarte (2000)], significantly higher cost of capital in the informal credit market [De Soto (1989); Huq and Sultan (1991) reported in Loayza (1996)] and lack of access to other promotional incentive schemes and benefits that are made available by the governments or other developmental agencies to the registered enterprises. According to Krakowski (2005), the costs of formality include: registration costs, costs of compliance with labour standards, costs due to taxes and compliance with other regulations – an increase in each may add incentive to go informal. The benefits of being formal, on the other hand, are directly proportional to the quality of the services available: legal protection (rule of law), trade promotion services, access to credit market and, in general, the government services that require registration. This would suggest that a better rule of law, more possibilities to trade, a better credit market and, in general, better government effectiveness (increasing the aspiration to make use of the government services) would all favour the decision to stay in the formal economy.13
Implicit costs accrue when enterprises have to bribe enforcement agencies to stay informal and not complying with the regulatory burden. This cost depends upon, and bears some proportion to the probability of being detected.14 These costs enter into calculations and
12 Discussion on institutional quality has been extended to include aspects of political institutions as well. Chong and Gradstein (2004) included government stability and democratic accountability in institutional dimensions. Galli and Kucera (2004) had shown that countries with stronger “civic rights” tend to have higher share of formal and lower share of informal employment.
13 These benefits also depend upon institutional quality. Institutional quality, thus, affects both costs and benefits of formality (and therefore informality).
14 Since the probability of being detected depends on the government effectiveness, the rule of law and the level of corruption - institutional quality determines the costs of informality.

Working Paper No. 84 6
determine the threshold where the benefits of formality outweigh the costs and impact the ability of the informal enterprises to grow and reap the benefits of economies of scale. Higher the costs, higher the threshold, the efficiency criteria alone does not determine the scale of operation.
Authors have also drawn attention to the limited roles of pure rational behaviour approach in explaining informality. There are other factors too. As the firms grow, they need to engage in formal institutional mechanisms like securing property rights to enter into formal contracting relationships [Maloney (2004)]. While arguing that there is a larger element of choice rather than compulsions in being a part of the informal economy, the author drew attention to a wider set of factors like size of the enterprise, coverage and quality of education (the level of human capital also poses a barrier to entry into formality), perceived credibility of the government in efficiently providing services (including social security administration) in explaining the decisions of the agents to remain informal. Krakowski (2005) has drawn attention to the importance of socio-cultural indicators (like size of the indigenous population) in explaining the relative size of the informal economy. Since these factors vary from region to region, the importance of regional dummies in statistical estimation of the determinants of informality on a global study has been underscored. The author also makes the point that legal non-reported activity need not necessarily be the product of conscious choice. Due to factors like illiteracy, remoteness of location etc. (i.e., difficulties of access) the regulatory requirements may not be known to economic agents, or difficult to fulfil even if known. This is particularly the case in the developing world where a traditional low productivity sector persists with modern sector. These low productivity sectors, very often, do not yield sufficient income to be taxed. They are either tax-exempt or subject to special taxation. The transaction costs of enforcement of regulations by the enforcement authorities may outweigh the benefits in such cases. Being low-productivity sector, share of employment of these activities will tend to be higher than their share in value added. This is another reason, why factors that account for informality while measured in terms of income will not be entirely the same as those that determine informality while measured in terms of employment. Our paper, therefore, attempts to estimate separately the determinants two different measures of informality. Our first set of results relates to informality measured in terms of income while the second set estimates the determinants of informal employment. We also try to control for a wider set of related factors, which might directly or indirectly impact informality (formality).
Table 1 summarizes the results of some of the major empirical works in this area.

Working Paper No. 84 7
Table 1. Summary results of the empirical literature
Author(s) Dependent Variable
Results: Independent variables and signs Number of observations and sample coverage
Johnson et al. (1998) Size of the Unofficial Economy
Regulation burden (>0), Corruption (higher value indicates less corruption) (<0), Rule of law (<0), Bureaucratic quality (<0), Economic freedom (<0), Tax burden (a higher value indicates better score for private business) (<0), Tax rules (these are marginal tax rates; the higher the value of the index, the lower the marginal tax rates) (>0), Control: GDP per capita. Note: variables inserted one at a time.
34<n<47: Latin American, Socialist, and OECD countries. The sample size (number of countries) varies depending upon the number of countries for which data is available for the independent and the dependant variables, whichever is lower.
Friedman et al. (2000)
Size of the Informal Economy
Tax rates (<0 or N.S. in some of the regressions) Over Regulation (perception of regulatory burden) (>0) Quality of the legal system (<0) Corruption (higher value means less corruption) (<0) Control: GDP per capita
11<n<67, cross sections. Regional regressions do not fully confirm the results. The sample size varies depending upon the number of observations available on each index measures as also the number of countries in regional regressions.
Kucera and Galli (2004)
Employment type – formal/informal expressed as shares over total employment
Civil Liberties(generally boost employment in large firms and public sector and decrease employment in more “informal” types) Control: GDP per capita
n=l08 (13*8)(8 years’ data for 13 Latin American countries pooled)
Size of the unofficial economy (average of few different estimates provided by different authors)
Employment laws index (>0 N.S.) Social security laws index (<0 N.S.) Collective bargaining laws index (>0) Control: average years of schooling
n=85 (Cross- section)
Botero et al. (2004)
Employment in the unofficial economy (in the capital city of each country).
Employment laws index (<0 N.S.) Social security laws index (>0N.S.) Collective bargaining laws index (>0) Control: average years of schooling
n=46(Cross-Sections)
Size of the Informal Economy
Cost of labor regulation (>0) Government efficiency (<0) Duration of starting a business (<0) Cost of starting a business (<0 N.S.) Tax rate, fiscal burden (<0), Lack of fractionalization in the country (<0) Controls: GNP per capita , regional dummies
n=109/97/79; number of observations varied in alternative regressions as adjusted R-squired sought to be improved by inclusion or exclusion of variables through estimation process. There were pronounced regional differences in results.
Krakowsky (2005)
Direct estimation of employment in low productivity sectors
Labor regulation intensity (<0 N.S.) Starting Business Duration (>0) Starting Business Cost (>0) Government Effectiveness(<0) Lack of Fractionalisation in the country (<0)
n=16 (for Latin American countries only)
Dreher, Schneider (2006)
Size of the Informal Economy
Corruption (higher value means less corruption) (<0 N.S.) Fiscal burden: higher fiscal burden, less shadow economy (<0) Trade barriers (<0 N.S.) Top marginal Income tax (<0 N.S.). Tax Revenue, % of GDP (<0 N.S.). Overall Govt Revenue, % of GDP (<0 N.S.) Credit Market Regulation (Fraser index): In the Fraser index, higher value of the index indicates less regulation (>0) (less regulation expands informal economy) Minimum Wage Regulation (Fraser index): In the Fraser index, higher value means less regulation: (<0) (less regulation leads to lower informal economy)
n=118. The results in the previous column refer to partial models where shadow economy was regressed on one each of the three categories of variables at a time. The three categories are: tax burden, regulation and institutional quality. The paper also presents a ‘Full model’ (table 7 of the reference), which includes only more robust results showing the following:

Working Paper No. 84 8
Price regulation (Fraser index): In Fraser index, higher value means less regulation (>0 N.S.) Administrative .Procedure (Fraser index): In Fraser index higher value means fewer procedure (<0) (less burden means lower informality) Time with Bureaucracy (Fraser index): In Fraser index higher value means less time with bureaucracy (< 0 N.S.) Judicial Independence (Fraser index): In Fraser index higher value means more independent judiciary (<0) (more independence is associated with less informality) Wage and Price regulation (Heritage Foundation index): In this index higher value means higher regulation (<0) (higher regulation leads to lower informality) Integrity of Legal System (Fraser index): Higher value means higher integrity (<0) (higher integrity is associated with lower formality) Government Effectiveness (World Bank index): Higher value means higher effectiveness (<0) (higher effectiveness associated with lower informality) Rule of Law (World Bank index): Higher score shows better environment (<0) (higher score associated with lower informality) Control: per capita GDP, Corruption
Government Effectiveness: (N.S.), Credit market Regulation (N.S.), Minimum Wage Regulation (Fraser index) (<0) (less regulation is associated with lower informality) Corruption (index of the International Country Risk Guide): Higher score means higher corruption (>0) (higher corruption associated with higher informality) Number of observations varied in different models. Maximum number of observations used in any particular model is 118.
Loayza et al. (2005) Size of the Informal Economy
Overall Regulation (N.S. or >0 when interaction with Governance included) Product market Regulation (>0) Labor regulation (>0) Fiscal regulation (<0 or N.S. when interaction with Governance Included) Governance interacted with the four types of regulation (always <0) Control: per capita GDP
n=72, worldwide. Main effect of governance variables not included.
Notes: (i) The signs > 0 or < 0 indicate the signs of the coefficients in the estimated equations. (ii) N.S. stands for ‘not significant’ (statistically). (iii) n indicates the number of observations.
It is interesting to note in Table 1 that Johnson et al. (1998) found lower tax rates associated with larger informal economy. The authors argued that the rates (as appear in the tax rules) were inappropriate guide of the incidence of the tax burden that the business communities faced. How the tax system is administered is the crucial determinant of the tax burden and therefore the size of the informal economy. Irrespective of the tax rates (higher or lower as per rules), it is the tax burden (as evaluated by executives) that determines the size of the informal economy. Likewise, a review of the results summarized in the table show that several variables do not conform to the expectations of rational behaviour approach. For instance, in Botero et al. (2004), both employment laws index and social security laws index are not significant. Moreover, social security laws index does not have the expected sign in explaining the size of the unofficial economy. Similarly, employment laws index does not have the expected sign in explaining employment in the unofficial economy. In Krakowsky (2005), we find that the two variables, ‘duration of starting a business’ and ‘cost of starting a business’ do not have the right signs, the latter being non-significant. It is also seen that some of the results tabled above are not fully confirmed in all the regions [Friedman et al. (2000); Krakowsky (2005)].
The estimation attempted in the present paper is based on a larger sample consisting of only low and middle income countries so that the results are not driven by the advanced industrialised countries.15 This is in contrast with the studies mentioned in the table above, where either a particular region has been considered or the sample of countries included
15 Advanced industrialised countries have smaller niches of informal economy. Loayza (1996) shows that the size of the informal sector is related inversely to the development level of the country; higher the level of development, lower the size of the informal sector.
Working Paper No. 84 9
both developed and developing countries. We employ a full model instead of partial16 and use a wider set of variables, more encompassing and fine grained.17 A complete discussion of the methodology used and the variables included follows.
3. The model, operational hypothesis and data
The paper uses cross-country regressions for the size of the informal economy (measured in income) and the size of informal employment. The explanatory variables are, in both cases, a series of institutional and policy variables identified in the literature as having a potential impact on informality. The impacts of institutional variables are assessed when the policy variables are controlled for. It is also explored whether some institutional variables have greater explanatory powers when interacted with policy variables. The sample includes 111 countries and depending upon the availability of data successive temporal observations have been incorporated for a limited time span for some of the countries making the data set an unbalanced panel.18
The dependent variable in the first set of regressions is the size of the informal economy expressed as the ratio between the value of “all market-based legal production of goods and services that are deliberately concealed from public authorities” and the official GDP. Data are taken from Schneider (2005). In Schneider (2005), the size of the informal economy is measured as a latent variable by combining the DYMIMIC (Dynamic Multiple Indicators Multiple Causes) approach and the currency–demand-based approach. The main advantages of using this data rest on their comprehensiveness and on the comparability with other studies in the literature that made use of a sub-sample of them.
The second set of regressions makes use of the ratio of informal employment to total non-agricultural employment as a dependent variable.19 The data availability on informal employment is quite limited and the regressions suffer from the limitations of scope and quality. The data employed in this paper are from Jaques Charmes [ILO (2002)].
Our baseline linear model specification is:
Infi,t = β0 + ∑ γj xj,it + ∑ηn zn,it + ∑ λl kl,it + ∑ σp hp,it + δi + εi,t j n l p
where Infi, t is the size of the Shadow Economy or the relative size of the informal employment, in country i at times t, the Xs are j institutional quality variables, the Zs are n macroeconomic controls, the ks are l policy variables, the hs are p interactions, the δis are various fixed or semi fixed control variables and εi,t is the stochastic residual. The baseline specification is then modified, taking into consideration the data availability. In particular
16 In partial models, separate regressions are run each for a smaller set of variables, each set including a particular category of variables. For example, one category may include variables on ‘tax burden’, while another category on ‘regulation’, etc. See Dreher and Schneider (2006).
17 For example, we use several variables to capture more complete dimension of a particular attribute; more than one variable to capture the impact of each dimension, fiscal, monetary, regulatory, etc.
18 Dreher and Schneider (2006) used unbalanced panel in their paper.
19 There are different approaches to define the concept of informal employment. See Hussmanns (2004) for a review of the definitions.

Working Paper No. 84 10
the regressions of the informal employment greatly reduce the number of regressors. Our sample size is 111 for the regressions on informality as a proportion to GDP and 24 for the regressions on the informal employment.20 Contrary to many other studies, thanks also to the relatively bigger size of the dataset used, a conservative approach has been followed by employing a wide range of controls rather then only GDP per capita. In order to gain policy insights, GDP has been decomposed into its main determinants to capture their effects on informality/informal employment21 and the variable GDP captures only the residual effects net of the effects of these determinants. Following is a list of the variables used in the paper. The rationale for the choice of the variables is presented in the next section.
The institutional variables included in the regression are:
an index of labour market regulations, an index of regulatory constraints on business, an index of workers rights, an index of women social rights,22 an indicator of the level of democracy in the political process, a set of Word Bank governance indicators measuring voice and accountability,23 government effectiveness, rule of law, control of corruption.24 To increase the degrees of freedom and to cope with the high collinearity, last three variables have also been averaged in some of the models to capture the overall quality of the public administration.25 This composite variable is designated as ‘quality of public administration’. The other variables chosen to reflect institutional behaviour include separate index of the government size, government intervention in the economy and the banking policy.26 Our paper could not benefit from the use of the World Bank’s Doing
20 In both cases, we considered only countries classified according to the World Bank’s World Development Indicator as low or middle income ones. We are interested in understanding the possible determinants of a transition from informality to formality on a larger scale across broad spectrum of development from lower to middle income countries without being affected by niches of informality, as is the case in most industrialised countries. See appendix for the full list of the countries and years included in the samples.
21 Also from an econometric angle, including only GDP per capita may not warrant the orthogonality between the error term and the explanatory variables, a necessary condition for sound OLS estimations.
22 These first four indicators represent institutional characteristics of which we would like to understand the specific impact. Labour Market Regulation and the index of workers rights, potentially indicating rigidity in the labour markets [see for instance Loayza (1996), Krakowski (2005) and Loayza et al. (2005)] correlate at only 0.11. The regulatory constraints on business have also been included among the determinants of informality [e.g. Friedman et al. (2000), Dreher and Schneider (2006)]. We chose to include the index of women rights to understand if there is empirical evidence of a separate impact of regulation on gender.
23 This index is not actually overlapping with the quality of democracy indicator. The coefficient of correlation between the two is only 0.29.
24 For a more detailed description of these and all the other variables see the data appendix.
25 We follow Eastely and Levine (2003) and IMF (2003) in performing a simple arithmetic average of the three underlying indexes. The attempt to create an aggregate measure using the first principal component of the three variables considered (explaining over 89 per cent of their variance) leads to a substantially identical result. This is because the weights indicated in the component are almost equal.
26 Although the variable is designated as ‘banking policy’, it is more of a reflection of institutional behaviour in the economy since this index measures the restrictions posed on the banking activities through government regulations.

Working Paper No. 84 11
Business indicators due to the mismatch between the years for which such indicators are available and the years of our study.
The policy variables are:
an index of the overall tariffs’ level and an index of freedom of trade (to understand the impact of trade policy), the ratio of total trade to gross domestic product (used as a possible direct measure of the trade policy), the ratio of net foreign direct investment inflows to gross domestic product, an index of the quality of money management27 (sound money), the top marginal income tax rate, also the square of it as a separate variable in order to catch a possible non-linear pattern (both used as possible direct measures of the fiscal pressures), and an index of the fiscal burden.
The macroeconomic indicators employed are: the ratio of gross fixed capital formation to gross domestic product, the per capita gross domestic product, the number of telephone subscribers per 1,000 people in the country, the percentage contribution of agriculture to gross domestic product, the general government consumption expenditures as a share of gross domestic product, the percentage of gross primary education enrolment and the total working population.
The fixed factors inserted in the model are: a set of geographical dummies, representing the main regions where the countries included in our sample belong to (Sub-Saharan Africa, Latin America and Caribbean, Middle East and North Africa, East Asia-Pacific, East Europe and Central Asia, South Asia); a set of legal origin variables, representing mainly according to the colonial history, the influence on the national legal system of the main European legal traditions (British, French, Socialist and German); a set of dummies grouping the countries according to their level of income as measured by per capita gross domestic product(low, lower-middle, and upper-middle).
Finally, as in Loyaza et al. (2005), the model includes a set of interactions between institutional variables and policies that may better illustrate the presence of conditional relationships. We thus test for the interaction between: labour market regulation and government effectiveness, fiscal burden and government effectiveness, government size and government effectiveness, government intervention in the economy and government effectiveness, top marginal income tax rate and government effectiveness. We also test, whether (suggested) positive impact (meaning thereby increase in the size of informal economy) on informality of a high fiscal burden or of a high top marginal income tax rate could possibly get offset by stronger control of corruption, which in turn might lead to a sounder use of public finances motivating the agents to remain formal. Following the results suggested by Dreher and Schneider (2006), we also checked if the impact of the corruption varies with differences in the income level through interaction of the variable with per capita GDP.
As in Baccaro and Rei (2005) all of the interactive terms are expressed as deviations from the sample average ψ. Thus, the interaction between variable Xi at period t (represented as VARXi, t) and variable Yi at period t (represented as VARYi, t) is expressed as:
VARXi, t VARYi, t = {VARXi, t − ψ VAR Xt} * {VARYi, t − ψ VAR Yt}
27 This includes assessment on the money supply, the inflation history and the freedom to open accounts in foreign bank.

Working Paper No. 84 12
This allows us to interpret the coefficient of each institutional/policy variable (main effect) as the coefficient of the hypothetical country characterized by the average level of the other variable (the one that is interacted).28
For the estimation of the model on informal employment, where the sample size is considerably smaller, we kept the variables more univocally determining a certain dimension, policy or institutional, avoiding overlaps in the domain of reference, and used the aggregated indicator of the three “quality of public administration” variables (Rule of Law, Control of Corruption and Government effectiveness), leaving room for a potential separate effect of the democracy-related variables. The rationale behind this choice is to make an assessment of the dimension more directly connected with the quality of the public administration (saving precious degrees of freedom), and maintain an independent judgement concerning the political regime or the citizens freedoms. Due to the limited sample size, fewer controls, less fixed effects and no interactions were used.
Following a general to particular approach the specification of the model has been progressively refined following the commonly employed (nested) model selection criteria,29 and four basic principles: avoiding, as much as reasonable, high collinearity,30 keeping a minimal sample size.31 Accordingly, a conservative approach has been adopted, in favour of a better specified model, even if it implies opting for a (potential) loss of efficiency. Care has been taken to exclude or limit the omitted variable bias (and thus the independence between the independent variables and the error term) in the interest of a reasonable degree of fitness. Most of the other studies carried out in the literature, are necessarily limited by the sample sizes or by the theoretical construct to few regressors; our bigger sample size32 enables us to use a wider set of explanatory variables. Nevertheless some of the variables, though found in the literature, could not be included in this paper, either because those represented roughly the same underlying concept of some other variables included in this paper, or data was not available for a sufficient number of observations in our sample size; also because these variables did not add, according to several individual and collective significance tests (performed on different specifications), explanatory power to the model.
28 See also Nunziata (2002:8).
29 Like Adjusted R-Square, Akaike Information Criteria and Root Mean Square Error. In performing the estimation we proceeded, to a sort of stepwise regression as in Dreher and Schneider (2006). An attempt has been made to determine whether a given variable (already cited in the literature) does or does not have a statistically significant effect on informality. When a variable has been eliminated from the initial model, tests on alternative specifications or series were performed. Also, a dummy variable has not been eliminated only because it appeared, individually, not significant (indeed if a categorization through dummies was undertaken, it was maintained). The variables with borderline significance have been maintained if their removal would lower the adjusted R-Square.
30 Collinearity may very well be the biggest obstacle in carrying out this sort of estimation with institutional variables and fixed factors, potentially very collinear among themselves. Effort has been made to select variables with the lowest level of correlation between them. However, given the broader goal of the estimation process, a variable has not been dismissed from the model on grounds of collinearity when no suitable substitute was available.
31 The overall data availability is quite limited for the whole set of countries, making the panel highly unbalanced.
32 Some of the studies with comparable sample size include developed countries as well, whereas the sample in the present study excludes them.

Working Paper No. 84 13
4. The rationale behind the choice of variables
The paper re-examines the applicability of the rational choice approach to estimate the determinants of the relative size of unofficial economy (income measure). As already stated, the model uses a larger set of variables and a larger sample of countries and therefore has a larger canvass. Available studies, which attempt to estimate the determinants of proportion of informal employment have been constrained by data availability and thus have focused on a smaller sample size or have concentrated on a particular geographical region.33 The present paper also proceeds on the basis of a much smaller sample size and fewer variables while trying to estimate the determinants of the relative size of informal employment.
The paper makes use of the variables commonly used in the literature based on rational choice approach. However, empirical questions regarding the explanatory powers of many of these variables are still open. As for instance, the impact of corruption on the size of the shadow economy has generated a large debate and contrasting results in the literature. According to Rose-Ackerman (1997), going underground is a substitute of bribery. Corruption and shadow economy, therefore, are substitutes. However, Hindriks et al. (1999) argue that shadow economy and corruption are complements. Corruptive malpractices between tax payers and tax inspectors lead to under-reporting of tax liability and leakage to shadow economy. Both Johnson et al. (1998) and Friedman et al. (2000) found a positive relationship between various measures of corruption and the shadow economy. For Friedman et al. (2000),34 corruption leads to a decline in tax revenue in the official economy leading to a fall in the quality of public administration. These in turn reduces the incentive to stay official. Corruption induces expansion of shadow economy and therefore, they complement each other. More bureaucracy, greater corruption and weaker legal environment contribute to poor institutional quality, which leads to larger shadow economy. Choi and Thum (2005) argue that shadow economy mitigates government induced distortions leading to enhanced economic activities in the official sector. Shadow economy, therefore, is a complement to the official economy; however, since shadow economy constrains bribery, shadow economy and corruption are substitutes. Using data from OECD countries, Dreher, Kotsogiannis and McCorriston (2005) show that an improvement in institutional quality reduces shadow economy directly and corruption both directly and indirectly through its effect on the shadow market; corruption and the shadow economy are substitutes. Dreher and Schneider (2006) show that the shadow economy reduces corruption in high income countries, but increases it in low income countries. Stricter regulations increase both corruption and the shadow economy. The authors also find that corruption and the shadow economy are never significant when variables controlling for the quality of institutions are included. According to Dreher and Schneider (2006), Johnson et al. (1998) neglected the impact of the quality of governance and institutions. Neither corruption nor GDP per capita have any significant impact on the shadow economy once these variables are taken into account. An implication of these findings for the present paper is that a better rule of law or government effectiveness or, simply, the level of economic development, might play a role when interacted with corruption in determining informality. An attempt has been made in this paper to test for the impact of corruption allowing for conditional effects with the level of gross domestic product and the taxes. Given that the sample is composed only of low and middle income countries, we have no strong a priori regarding the sign of the corruption variable, while
33 See Krakowski (2005) and Kucera and Galli (2004) for examples.
34 On a world wide sample.

Working Paper No. 84 14
the sign of the interaction should be negative (for a given level of corruption higher income level should be associated with a lower informality).
The degree of regulation of the economic activity is another variable around which much debate has developed.35 The traditional deregulatory view upholds that each additional burden to the free functioning of the markets will push agents away from the formal sector. Johnson et al. (1998), Dreher and Schneider (2006) and Friedman et al. (2000) find results more or less robust, confirming this hypothesis but the first authors also rightly note that it is not necessarily the degree of regulation that matters but its enforcement. Loyaza et al. (2005:2) point out the importance the quality of regulation in the sense that more business/competition friendly regulation may stir the spread of formality (or at least enhance growth that then affects formality). They also uphold that the quality of the regulation may well be associated with the quality of governance. In our estimates we attempt to distinguish between the impacts of these two dimensions, regulation and governance. Krakowski (2005) finds a negative (but not statistically significant) impact of the business starting up costs on the size of the informal economy. Botero et al. (2004) constructs three indices indicating the tightness of the employment laws, the coverage and the power of collective bargaining, and the generosity of the social security laws; they find that the first two indices are positively associated with the size of the informal economy (but only the second is statistically significant), whilst the third one is negatively associated. At the same time they also find that the ratio of employment in the informal economy is positively affected by the collective labour relation index and the social security index (with only the first being significant), and negatively affected by the employment laws index.36 When the authors divided their sample into richer and poorer countries it was found that the results showing negative outcome of labour regulation on labour market hold among the richer, but generally not the poorer countries. Interpreting these results the authors argued that this evidence was consistent with the view that labour laws had adverse consequences in countries where they were more likely to be enforced, namely the richer ones. Based on a sample of Latin American countries, Loayza (1996) obtains that labour market restrictions positively influence the size of the informal sector.37 This result is contradicted by Maloney et al. (2002) who, using a very precise dataset on three Latin American countries do not find stricter labour regulation to have any impact on informality. The present paper, therefore, takes a fresh look at the relationship between regulations and informality.
Concerning the impact of trade liberalization (reflecting on the stance of trade policy), Rama (2002) notes that: “series of case studies on the effects of trade liberalization shows a considerable dispersion of the net impact on employment”. On the one hand there is the argument that trade reforms expose formal establishments to increased foreign competition, and in response, such establishments try to reduce labour costs by cutting
35 The subject was briefly introduced earlier in this paper in the section dealing with the review of literature. At the cost of some repetition, the issue is being discussed here in the context of the rationale behind the choice of variables.
36 See Table I for summary.
37 In 2002, the ILO decided to use the term ‘informal economy’ instead of ‘informal sector’ since informality is not confined to a specific sector of economic activity but rather cuts across many sectors. There can be informality even in parts of formal economy. In this sense the concept of shadow economy is more akin to the concept of informal economy rather than informal sector. However, some of the authors used the phrase ‘informal sector’ in their papers. While referring to them we maintain the same terminology. Our paper, thematically concerns ‘informal economy’ and not ‘informal sector’ in a classical sense. Informal economy encompasses aspects of informality even in formal economy. See, for discussion, ILO (2002), ILO (2002a) and ILO (2002b).

Working Paper No. 84 15
worker benefits, replacing permanent workers with part-time labour, or subcontracting with establishments in the informal sector, including home-based and self-employed micro entrepreneurs. Alternatively, firms in the formal sector may respond to the intensified competition from abroad by laying off workers who subsequently seek employment in the informal sector [Goldberg and Pavcnik (2003)]. On the other hand, as far as an increase in trade causes boosts in economic growth [Franklel and Romer (1996)] through increased access to the global markets, this may lead to the creation of formal jobs and activities, conditional on the relative share of the non-tradable (service) sector in the economy. The net effect is, thus, an empirical question. Currie and Harrison (1997), in a case study of Morocco, found that firms started hiring more temporary workers after the completion of a comprehensive trade liberalization programme. Goldberg and Pavcnik (2003) did not find evidence of a relationship between trade policy and informality in Brazil. However, in Colombia they did find such a relationship, but only for the period preceding a major labour market reform that increased the flexibility of the Colombian labour market.38 It might be of interest to relate this debate to what Rama (2002) observed, “to become more competitive, countries may need to dismantle their trade barriers, abolish their legal monopolies, privatize their state-owned enterprises and reduce over-staffing in their bloated bureaucracies. These reforms could lead to the massive loss of "good jobs (...) on the other hand, the delocalization of production to developing countries in sectors such as food processing, textiles or garments, could also increase the demand for labour, thus expanding employment opportunities and raising workers' earnings. New jobs in export industries might not be as good as the privileged jobs lost in protected sectors, but for the young women from rural areas who are hired in large numbers by those industries, they could be much better than the alternatives”. He concludes that “anecdotal evidence on all these positive and negative effects of globalization on the labour market abounds. But a comprehensive picture is missing. Lacking this picture, the policy debate has taken strong ideological biases, from all sides”.
In the literature, one finds reflections on multiple channels through which trade, institutions and labour market outcome have been linked. Devrajan, Ghanem and Thierfelder (1997) argue that trade liberalization reduces the monopoly rent enjoyed by the trade unions by exposing an economy to competition. Rodrik, Subramanian and Trebbi (2002) argued that trade39 could have an indirect effect on incomes by improving institutional quality. This implies that trade improves formality both directly and indirectly: directly through improvement of institutional quality and indirectly through increase in income. Banerjee and Ghanem (2002) found a strong link between protectionist policies and labour market distortions. They have argued that more closed economies generally tended to have relatively smaller formal labour markets. Openness to trade raises the costs of labour market intervention and thus may reduce it [Ades and Di Tella (1999); Rajan and Zingales (2003)]. Dreher and Schneider (2006) found that higher trade barriers significantly increased corruption. Thus, if corruption expands informality, there is an indirect link between trade and informality through corruption route. Comprehensively, therefore, effect of trade on informality remains an empirical question – relevant for this paper to explore. The present paper uses index of freedom of trade and index of tariffs level in order to capture comprehensively the overall trade policy environment. Both tariffs
38 This is but natural because the context of the relationship did not exist any longer after the labour market reforms and hence once could not validly compare the relationship between the pre-reform and post-reform period.
39 They used the term integration and measured integration using the ratio of trade to GDP.

Working Paper No. 84 16
and freedom of trade variables would reflect the barriers to trade more appropriately than trade-GDP ratio.40
The net impact of foreign direct investments on informality has also been debated in the literature. Carr and Chen (2002) provide anecdotal evidence of workers pushed out of the formal market by the (labour saving) foreign direct investment, especially in Africa. Schneider and Klinglmair (2004), on the other hand, found for OECD countries that 1 percentage point increase in FDI leads to increases in annual growth rate by 0.4 per cent.41 This, when linked to the findings of Loayza (1996) that economic growth is negatively correlated with the size of informal economy would imply that FDI would lead to the reduction of informality through growth route. Botero et al. (2003) argue that regulation of labour market is correlated with regulation of entry. This implies that FDI will be lower in an economy, which regulates labour market more. If that be the case, and if more labour market regulation leads to more informality, less informality will be correlated with higher FDI. The present paper, therefore, finds FDI as a relevant dependant variable to include.
The present paper includes variables, which reflect the state of political institutions: the nature of political regime, workers’ rights and women social rights. To reflect on the political regime, the variable ‘democratic polity’ has been included. Banerjee and Ghanem (2002) found a strong link between authoritarianism and protectionist policies, and between protectionist policies and labour market distortions. According to these authors, regimes with more political freedom tend to place fewer restrictions on trade, and tend to have relatively larger proportion of the labour force in formal employment. Chong and Gradstein (2004) used dimension of democratic accountability as one of the elements capturing institutional quality42 to estimate the determinants of informal sector. Dreher and Schneider (2006) argue that corruption is lower with better rule of law and greater democracy. Therefore, if lower corruption leads to lower informality, the relationship between democracy and formality is direct and positive. Buchanan and Tullock (1962), Djankov et al. (2002), writing on the political power theory of regulation, hold that those in power use protective regulations to gain political support of the workers. Autocrats are less constrained in this respect, while democratically elected government is subject to many constitutional checks and balances and therefore, tend to have fewer regulations. However, there are also evidences to the contrary. In a democratic set up, trade unions can act as organised lobbies to resort to insider rent seeking behaviour and elected government in power can take populist measures to compromise with these pressure groups to nullify their opposition. Only organised workers may benefit at the cost of those outside these pressure groups. Banerjee and Ghanem (1997) have given examples from India, Trinidad and Tobago, Sri Lanka and Senegal as democracies that have awarded large economic rents to their organised unions. On the contrary, the authors mention the examples of Chile, the Republic of Korea, Singapore and Turkey in the 1970s and early 1980s, when authoritarian regimes in these countries repressed trade unions and basic rights to workers,
40 Dreher and Schneider (2006) use two variables to measure trade restrictions: taxes on international trade and trade barriers. While the former deals with taxation aspects, the latter captures trade regulation plus trade taxation. Though many of these indices have partial overlaps, it is difficult to separate the overlapping elements. On the other hand, use of one index without another (which partially overlaps) leaves certain dimensions of the attributes that these variables represent uncovered in the explanatory equation. In the interest of comprehensiveness, more than one variable is used if they jointly bring more information even if they overlap partially.
41 However, in a mixed sample of developed and developing countries, FDI did not have a statistically significant impact on annual growth.
42 Since it is clubbed with other variables to reflect institutional quality, the separate effect of democratic accountability was not discussed in the paper.

Working Paper No. 84 17
but the economies prospered and welfare of workers as a whole increased. These examples and counter examples leave the contestable issues of the relationship between the nature of political regime, or workers rights and informality in the realm of empirics to determine. Our paper, therefore, finds it relevant to explore.
Galli and Kucera (2004) found that countries with strong ‘civic rights’ had higher shares of formal employment. We did not use this variable separately since this was included in another variable used in the paper, ‘voice and accountability’.
Due to preponderance of women workers in informal employment, we have used the variable ‘women social rights’ in order to see whether a higher value of this variable is associated with their increased participation in formal employment.
We tested for conditional effect of some of the variables we have used in our model with respect to the government effectiveness (labour market regulation, government size and government intervention in the economy).43 We expect that some of the policy and regulatory variables might increase formality under effective government. To put it otherwise, some of the variables blamed for increasing informality might change their behaviour in the opposite direction if government is effective.
We inserted in our model, an index aimed at assessing the quality of monetary policy in a country, an index of ‘Sound Money’ aimed at capturing the expansion of money supply, the growth and variability of inflation and the freedom to own foreign currency bank accounts (developed by the Fraser Institute). Monetary policy variables serve as macroeconomic controls [Chong and Gradstein (2004)] and can potentially impact informality through growth route.44 Dreher and Schneider (2006) argued that shadow economy expands with fewer regulations in the credit market. From a theoretical perspective, the impact of monetary policy on informality can be either way depending on how inflation affects the redistribution of income between employees and employers. Even in a situation of formal sector guaranteeing more protection for the employees, employers can still increase their demand for labour in the formal sector, if they are the bigger beneficiaries from the redistributive consequences of inflation. Conversely, in the opposite case, if there is persistent pressure from the trade unions to raise wages commensurate with inflation, employers may resort to outsourcing a part of the activities to informal economy. The issue, therefore, remains in empirical domain worthy of a fresh scrutiny in this paper.
It has already been discussed earlier in Section 2 of the paper that the empirical impact of burden of taxation on the size of the underground economy is itself not firmly proven. To recall the broad findings, Loayza (1996) among others45 found that the higher the tax burden, the higher the shadow economy. Johnson et al. (1998) recognised that it was not necessarily the case of more regulation and higher taxes directly increasing the size of the unofficial economy. The problem appeared to be not regulation or taxation per se, but whether the state administrative system could operate without corruption. A high level of regulatory discretion could help to create the potential for corruption and drive firms into the unofficial economy. Schneider and Neck (1993) suggested that the key variables to consider, in a rational choice framework were the tax rates and the complexity of the tax system (on the grounds that it is easier to find “legal” way to pursue tax avoidance in a
43 Loayza (2005), as for instance, tested interaction term between governance and regulation.
44 Inflation and other financial variables are obvious candidates for measuring economic performance [IMF (2003)].
45 See Schneider (2005) for a full list of the studies upholding the impact of taxes and social security contributions in promoting informality.
Working Paper No. 84 18
complex tax system). The implication of this observation was that higher tax revenue, achieved with lower tax rates but a broader tax base (which could be created by simpler rules), would likely to decrease informality. Friedman et al. (2000) and Krakowski (2005) found a negative effect of the tax rate on the size of the informal economy. Friedman et al. (2000) however, elaborated on the findings, suggesting that it held only when GDP per capita was not taken into account. Considering GDP per capita as a proxy for institutional quality, they speculated that higher tax rates might be part of a virtuous circle, in presence of good institutions, where agents might like to remain in the formal sector to take advantage of the public goods/services provided with the increased financing.
In our regressions, we tested for the direct impact of tax rates and the overall fiscal burden.46 We also inserted interaction terms of the tax rates with the government effectiveness and the corruption measure. We expect both interactions to be negative (for a given level of taxes, a better control of corruption or a more efficient government, leads to a lower level of informality).
The overall level of Institutional Quality is reckoned to affect the size of the shadow economy through various channels [Dreher and Schneider (2006), Krakowsky (2005), Friedman et al. (2000)]. Johnson et al. (1998) find that a better rule of law does matter, but their results are not robust to controlling for the gross domestic product per capita. Hibbs and Piculescu (2005), in a study based on micro-level data, find that the better the system efficiency (banking and monetary policy) and the government services, the higher the threshold of tax toleration for firms, i.e. their willingness to stay formal and not to look for evading taxes. Loayza et al. (2005) find that better governance quality, when interacted with regulation (intended as market un-friendly measures) reduces informality. Sound institutional quality appears to counteract market unfriendly regulation. The range of variables introduced in our model to capture institutional quality has been mentioned earlier, in Section 3. We have also tried to explore qualitative dimensions of different policy and regulatory variables through interaction of the policy and regulatory variables with government effectiveness.
We inserted in our regressions a series of macroeconomic control variables47: the GDP per capita, commonly employed in the literature as a control variable and itself possibly reflecting the link between growth and informality, gross fixed capital formation, government consumption expenditures, number of telephone subscribers48 (an index of infrastructural development), and gross primary school enrolment. These variables, apart from being proxies for the level of physical and human capital investment render gross
46 This variable, despite being an index, provides a better proxy of the overall fiscal pressure agents have to bear, covering both income and corporate tax rates, and the change in government expenditures. It may be noted that Dreher and Schneider (2006) found higher fiscal burden associated with less unofficial activity.
47 These variables are expressed as ratios as available in the data source.
48 Loayza (1996), on the basis of cross-country data, shows a strong and negative correlation between public-infrastructure index and size of the informal sector. The author uses per capita telephone lines as one of the indicators of infrastructure.

Working Paper No. 84 19
domestic product to represent only the other leftover variables included in it. We also included the share of agriculture over GDP49 as a control for the structure of the economy.
We have been guided by the literature in matters of selection of fixed factors. The fixed factors introduced in the regression include a set of geographical dummies, a set of legal origin variables and income dummies that group countries into low, lower-middle, and upper-middle income categories by per capita GDP. Choice of dummies has been guided by the existing literature. La Porta et al. (1999) found that legal systems, historically adopted or imported in a country, has important bearing on the development of institutions and hence on income levels. Easterly and Levine (2002) found that geography exerted a significant effect on the quality of institutions. Rodrik, Subramanian and Trebbi (2002) pointed out the influence of geography and income levels on the quality of institutions. Friedman et al. (2000), while exploring the relationship between institutions and the share of unofficial economy, used linguistic fractionalization, geographic location, religious composition of population and legal origin as instruments in the model to explain institutional development. Krakowski (2005) empirically finds that ethnic fractionalisation and regional factors may play roles in explaining informality. When an ethnic group dominates the formal market, it might lead to the exclusion of other ethnic groups to informality. The author also finds empirical confirmation (significant regional dummies in his regression) that there are pronounced regional differences that should be attributed to specific local factors not unaccounted for. We check for these hypotheses inserting a measure of ethnic fractionalisation from the Global Development Network Growth database and regional dummies. Dreher and Schneider (2006) used instrumental variables reflecting a country’s geographic position, ethnic and religious fractionalization and legal origin to deal with potential endogeneity between corruption and shadow economy.
Djankov et al. (2003) and Botero et al. (2004)50 argue that legal origin of a country shapes its regulatory style. In our model we insert the dummies representing the legal systems, which should normally catch the residual legislative aspects not emerging from the other law-related variables, aiming at increasing the explanatory power of the model and thus reducing the possible omitted variable bias.
In our regression, the income dummies, representing groups of countries with similar level of per capita GDP, could be interpreted to capture some unknown fixed elements, common
49 Regarding all of these variables, an endogeneity/simultaneity problem may arise as far as the shadow economy is measured as a percentage of “official” GDP or if it influences, by spill-over effects [see Schneider and Enste (2000)], the size of it. Hausman specification tests and Durbin-Wu-Hausman tests whose results are not presented here do indeed confirm this suspicion regarding GDP but, at the same time, they rule out (in the large majority of the cases) the possible endogeneity of the other variables representing a share of the GDP. Our empirical strategy was thus based on applying two- stage least squares estimation, adding as exogenous variable the one year lagged value of the log GDP per capita. The temporal difference should guarantee the validity of the instrument (in terms of independence, given that fixed effects, potentially correlated with this lagged variable if included in the error term, are mostly explicitly taken into account in the second stage) but the sluggishness of the log GDP variable (and the explanatory power of the exogenous regressors) causes the first stage regression to have a very high explanatory power, and at the end the difference between the OLS and the two stage least squares regressions are minimal.
50 Botero et al. (2004:1345) note “Common law countries tend to rely more on markets and contracts, and civil law (and socialist) countries on regulation (and state ownership)”. This would imply that common law countries impose fewer boundaries on the functioning of the markets. They perform empirical estimations showing that the indices of labour legislation (p. 1376) (influenced by the legal origins) do have an impact on the size of informality and on employment in the unofficial economy.

Working Paper No. 84 20
to all countries with a similar level of economic development, that did influence GDP growth and consequently also the levels informality, but are not explicitly taken into account through the other regressors.
5. Results
(a) Estimation based on income measure of informality
The results of the regression are given in Table 2.
The descriptions of the variables, their coverage and sources are given in the data appendix. Table 2 below shows results of seven models attempted and also the results of the associated parametric tests.
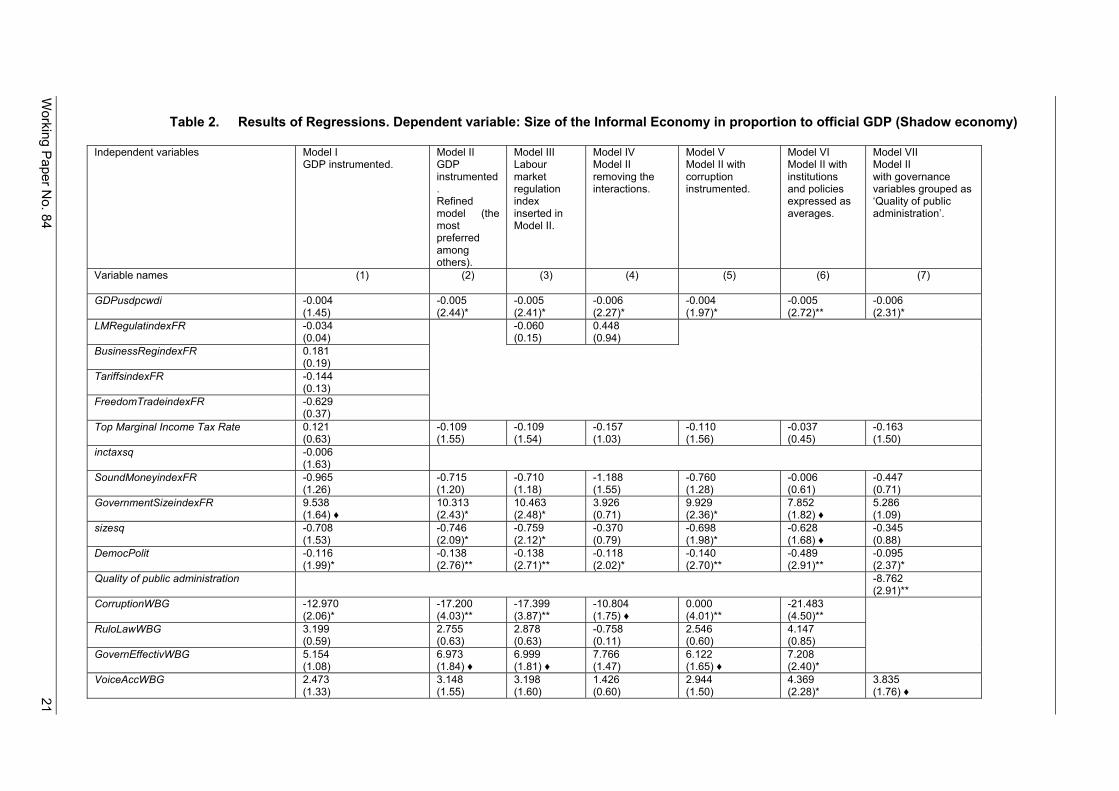
Working P
aper No. 84
21
Table 2. Results of Regressions. Dependent variable: Size of the Informal Economy in proportion to official GDP (Shadow economy)
Independent variables Model I GDP instrumented.
Model II GDP instrumented. Refined model (the most preferred among others).
Model III Labour market regulation index inserted in Model II.
Model IV Model II removing the interactions.
Model V Model II with corruption instrumented.
Model VI Model II with institutions and policies expressed as averages.
Model VII Model II with governance variables grouped as ‘Quality of public administration’.
Variable names (1) (2) (3) (4) (5) (6) (7)
GDPusdpcwdi -0.004 (1.45)
-0.005 (2.44)*
-0.005 (2.41)*
-0.006 (2.27)*
-0.004 (1.97)*
-0.005 (2.72)**
-0.006 (2.31)*
LMRegulatindexFR -0.034 (0.04)
-0.060 (0.15)
0.448 (0.94)
BusinessRegindexFR 0.181 (0.19)
TariffsindexFR -0.144 (0.13)
FreedomTradeindexFR -0.629 (0.37)
Top Marginal Income Tax Rate 0.121 (0.63)
-0.109 (1.55)
-0.109 (1.54)
-0.157 (1.03)
-0.110 (1.56)
-0.037 (0.45)
-0.163 (1.50)
inctaxsq -0.006 (1.63)
SoundMoneyindexFR -0.965 (1.26)
-0.715 (1.20)
-0.710 (1.18)
-1.188 (1.55)
-0.760 (1.28)
-0.006 (0.61)
-0.447 (0.71)
GovernmentSizeindexFR 9.538 (1.64) ♦
10.313 (2.43)*
10.463 (2.48)*
3.926 (0.71)
9.929 (2.36)*
7.852 (1.82) ♦
5.286 (1.09)
sizesq -0.708 (1.53)
-0.746 (2.09)*
-0.759 (2.12)*
-0.370 (0.79)
-0.698 (1.98)*
-0.628 (1.68) ♦
-0.345 (0.88)
DemocPolit -0.116 (1.99)*
-0.138 (2.76)**
-0.138 (2.71)**
-0.118 (2.02)*
-0.140 (2.70)**
-0.489 (2.91)**
-0.095 (2.37)*
Quality of public administration -8.762 (2.91)**
CorruptionWBG -12.970 (2.06)*
-17.200 (4.03)**
-17.399 (3.87)**
-10.804 (1.75) ♦
0.000 (4.01)**
-21.483 (4.50)**
RuloLawWBG 3.199 (0.59)
2.755 (0.63)
2.878 (0.63)
-0.758 (0.11)
2.546 (0.60)
4.147 (0.85)
GovernEffectivWBG 5.154 (1.08)
6.973 (1.84) ♦
6.999 (1.81) ♦
7.766 (1.47)
6.122 (1.65) ♦
7.208 (2.40)*
VoiceAccWBG 2.473 (1.33)
3.148 (1.55)
3.198 (1.60)
1.426 (0.60)
2.944 (1.50)
4.369 (2.28)*
3.835 (1.76) ♦

22 W
orking Paper N
o. 84
GovtintHF 2.056 (1.39)
2.865 (2.45)*
2.858 (2.40)*
2.058 (1.30)
3.181 (2.66)**
1.713 (1.02)
1.952 (1.37)
FiscalHF 1.835 (0.86)
2.203 (1.27)
2.225 (1.28)
2.725 (1.55)
1.911 (1.14)
-3.844 (1.32)
1.159 (0.69)
BankingHF -3.678 (2.55)*
-3.874 (3.48)**
-3.858 (3.44)**
-3.505 (2.04)*
-4.073 (3.67)**
-4.035 (3.25)**
-3.506 (2.39)*
Domesticcredittoprivatesector 0.219 (4.79)**
0.210 (6.38)**
0.211 (6.39)**
0.119 (2.19)*
0.210 (6.31)**
0.176 (4.75)**
0.210 (4.97)**
WOSOC 3.678 (1.64) ♦
4.191 (2.18)*
4.212 (2.16)*
4.891 (1.87)
4.195 (2.18)*
4.727 (2.77)**
5.092 (2.46)*
WORKER -0.897 (0.55)
Ethnicity -4.909 (0.96)
-5.255 (1.31)
-5.404 (1.30)
1.623 (0.23)
-4.870 (1.20)
-9.656 (1.92) ♦
1.788 (0.39)
Agriculturevaladdperworker -0.001 (1.57)
GCFgdpwdi 0.069 (0.30)
FDInetgdpwdi 1.066 (2.17)*
0.969 (2.18)*
0.965 (2.15)*
0.515 (0.77)
1.044 (2.36)*
0.585 (1.58)
1.080 (2.24)*
Telsubscrwdi -0.000 (0.03)
Agriculturewdi 0.292 (1.32)
0.192 (1.17)
0.190 (1.13)
-0.053 (0.27)
0.234 (1.46)
0.108 (0.72)
0.165 (0.95)
Govconsexpgdpwdi -0.152 (1.92) ♦
-0.165 (2.25)*
-0.166 (2.25)*
-0.072 (0.67)
-0.165 (2.29)*
-0.278 (1.36)
-0.094 (1.21)
Tradegdpwdi -0.084 (1.96) ♦
-0.092 (2.85)**
-0.092 (2.78)**
-0.055 (1.30)
-0.093 (2.82)**
-0.036 (1.16)
-0.093 (2.77)**
TLabFo -0.000 (3.24)**
-0.000 (4.32)**
-0.000 (4.17)**
-0.000 (4.74)**
-0.000 (4.29)**
-0.000 (2.40)*
-0.000 (5.30)**
primaryenrolgroswdi -0.067 (1.03)
-0.045 (0.94)
-0.042 (0.82)
-0.063 (0.95)
-0.043 (0.90)
-0.032 (0.81)
-0.089 (1.75) ♦
reg_eap -1.761 4.646 4.700 3.765 5.078 -3.975 5.208 (0.30) (0.93) (0.93) (0.54) (1.03) (0.65) (1.08) reg_eca -1.615 11.939 12.058 8.140 11.479 4.992 11.493 (0.19) (2.54)* (2.51)* (1.25) (2.49)* (1.00) (2.18)* reg_lac 6.056 13.510 13.651 14.838 11.897 8.356 6.315 (0.78) (2.19)* (2.12)* (1.91) (1.97) (1.28) (1.11) reg_mena -7.761 0.000 0.000 0.000 0.000 0.000 0.000 (0.96) (.) (.) (.) (.) (.) (.) reg_ssa 6.025 9.538 9.614 9.192 9.391 7.685 5.676 (1.32) (2.39)* (2.34)* (1.45) (2.31)* (1.50) (1.24) reg_sa 0.000 3.469 3.646 5.978 3.475 5.388 3.404 (.) (0.72) (0.71) (0.95) (0.72) (1.04) (0.73) leg_british -1.165 (0.10) leg_french 2.863

Working P
aper No. 84
23
(0.23) leg_socialist 10.365 (1.32) inc_low 0.000 -14.389 0.000 0.000 -12.009 -17.410 0.000 (.) (2.79)** (.) (.) (2.38)* (3.16)** (.) inc_lower middle 9.785 -4.718 9.633 4.748 -2.608 -8.605 7.647 (2.87)** (1.08) (3.23)** (1.10) (0.62) (2.31)* (2.38)* inc_upper middle 15.014 0.000 14.328 11.856 0.000 0.000 15.618 (2.60)* (.) (2.77)** (1.76) (.) (.) (2.54)* lm_effect -1.807
(1.79) ♦ -1.957 (2.20)*
-1.962 (2.17)*
-2.101 (2.45)*
-2.805 (2.90)**
-2.328 (2.57)*
tax_effect -0.541 (1.81) ♦
-0.646 (2.87)**
-0.650 (2.86)**
-0.679 (3.02)**
-0.126 (0.58)
-0.386 (2.66)**
fiscal_corr 0.300 (0.05)
3.125 (0.61)
2.978 (0.56)
2.069 (0.41)
13.983 (1.84) ♦
-2.539 (0.99)
tax_corr -0.016 (0.06)
0.149 (0.74)
0.151 (0.75)
0.189 (0.95)
-0.170 (0.91)
size_effect 3.053 (1.91) ♦
3.819 (3.62)**
3.823 (3.60)**
3.942 (3.80)**
7.435 (4.43)**
5.242 (3.81)**
int_effect -2.193 (0.91)
fiscal_effect -4.738 (0.74)
-8.622 (1.59)
-8.502 (1.52)
-7.425 (1.41)
-13.234 (1.48)
corruptionwbg_gdp -0.001 (0.68)
Constant 16.311 13.505 -1.542 33.658 10.360 50.131 25.739 (0.46) (0.63) (0.07) (1.08) (0.49) (1.85) (1.04) Observations 111 111 111 111 111 111 111 Adjusted R-squared 0.7 0.72 0.71 0.42 0.72 0.76 0.63 RMSE 6.52 6.38 6.42 9.13 6.37 5.86 7.25 Ramsey/Pesaran-Taylor/Pagan-Hall RESET specification test51
P. Val.= 0.68
P. Val.= 0.08
P. Val.= 0.16
P. Val.= 0.32
P. Val.= 0.22
P. Val.= 0.01
P. Val.= 0.93
Mean Variance Inflation Factor 22.25 15.19 15.24 13.39 18.2 18 12.66 Note: (i) Absolute values of ‘t’ statistic are in parentheses. (ii) * significant at 5%, ** significant at 1%, ♦ significant at 10%.
51 This test is used to test for omitted variables or neglected non linearity in the model specification. The null hypothesis is that there are no neglected nonlinearities. Stata routine “IVRESET”

Working Paper No. 84 24
Column 1 presents the results of the most general model, where all the variables of interest to us are inserted. The high value of the Variance Inflation Factor52 (as a rule of thumb a value greater then ten is a concern) shows that multicollinearity is a potential problem; however, we gain in terms of performing a fully inclusive analysis and do not lose much by way of analytical insights due to the presence of multicollinearity.53 Moreover, if the model is correctly specified, the presence of multicollinearity affects negatively the efficiency of the estimation but not un-biasedness.54 Looking at the results, the level of GDP per capita (GDPusdpcwdi) has an expected negative sign but it is not significant. Of particular relevance appear the variables related to the banking policy (BankingHF) and the amount of domestic credit to the private sector. Higher value of the banking policy index implies higher restrictions and control by the government over the banking system. The negative sign (significant) means that control and the supervision of the government over the banking system is associated with a lower share of informality in GDP. Directed lending by the banks under the statutory requirements of the government towards the informal economy might help in the graduation of informal economy into the formal. A positively signed significant variable, domestic credit to private sector, on the other hand implies that increase in domestic credit to private sector runs the risk of leakages of money (or income generation) from the formal to the informal economy.
Higher level of democracy (DemocPolit) is also negatively and significantly associated with a decrease in the size of the informal economy. The governance variable, “Voice and Accountability” (VoiceAccWBG)55 appears positive but insignificant. Control of corruption (CorruptionWBG) (the higher the index the better the control of it) is negatively associated with the size of informality, underpinning the vision of the two variables as substitutes, independent of the level of per capita GDP (their interaction is indeed never significant). The other variables (Rule of Law (RuloLawWBG) and government effectiveness (GovernEffectivWBG)) are positively signed but not significant.
It would be of interest to see, how certain variables, when interacted with effective governance, assumes significance. Top Marginal Income Tax Rate, which is insignificant and positively signed becomes significant and negatively signed when interacted with government effectiveness (tax_effect). This means, if government is effective, higher top marginal income tax rate would reduce informality. Labour Market Regulation Index sourced from Fraser Institute (LMRegulatindexFR), which is negatively signed and insignificant retains its negative sign and becomes significant when interacted with government effectiveness (lm_effect). Higher value of this index means more market friendly regulation. The negative sign of the coefficient would imply reduction of
52 Indeed the average value presented here for reasons of space may be misleading; in reality the tests show that there are few variables highly collinear with the others and many with an inflation factor below the critical threshold.
53 We, therefore, avoid dropping of variables to get rid of multicollinearity.
54 Multicollinearity may also lead to wide swings in estimates of coefficients following the introduction of small changes in the database and/or the model. We test for the potential impact of this phenomenon presenting the results in the discussion on robustness tests in the appendix.
55 The two variables, representing two similar but not overlapping concepts do indeed correlate only at 0.28. Further analysis (like simple scatter plots or bi-variate or reduced multivariate regressions on institutional quality variables, controlling only for GDP) proved that whilst for the other governance variables (rule of law and government effectiveness) the positive signs disappear, and they turn out to be negative, the sign of the Voice and Accountability variable hinges on the presence of two countries, Iran and China, that present relatively low levels of informality and low levels of democracy.

Working Paper No. 84 25
informality if regulation becomes more market friendly. The same relationship assumes statistical significance when the regulatory variable is interacted with government effectiveness.
The government size (the smaller the government the higher the index) index (GovernmentSizeIndexFR) appears significant and positively signed implying that lower government size is associated with higher informality. Its square measure (sizesq) has the opposite effect. It is on the borderline and not significant. This would mean that bigger government helps in reducing informality but not beyond a point, after which increase in size would produce the opposite results. The fact that bigger government reduces informality is also confirmed when government size is interacted with government effectiveness (size_effect). Our results are akin to the findings of La Porta et al. (1999) that larger governments tend to be the better performing ones.
Concerning the indices of legal rights, the workers’ rights variable (WORKER) is negatively signed but not significant and the women’s social rights (WOSOC) variable is borderline-significant and positive. This last result seems to suggest that when women have the chance to participate in the economic activity they are more likely to (or can only) participate in the informal economy.
The other policy variables, fiscal pressure (FiscalHF), government intervention (GovintHF) and quality of the monetary policy (SoundMoneyindexFR) are not significant.
Amongst the macroeconomic control variables the ratio of foreign investments to GDP (FDInetgdpwdi) is positive and significant. This implies that higher FDI would tend to increase informality. The level of government consumption expenditures, expressed as their ratio to GDP (Govconsexpgdpwdi) seems to encourage the shift from the informality to the formality. The trade to GDP ratio is significant and has the negative sign (to trade is more than likely to require an official activity). Interestingly, the indices measuring the average rate of tariffs (TariffsindexFR) and the potential to trade freely (FreedomTradeindexFR) are both negative but far from being significant. The percentage of primary enrolment is negative as expected but not significant.
The subsequent columns (two to seven) present the refinements of our model. Model two, trims down most of the redundant variables and is our preferred model. Model three simply adds to model two the variable labour market regulation (LMRegulatindexFR) to cross check whether the significant interaction term between this latter and government effectiveness may be influenced by the absence of the main effect (and it turns out that it does not). Model four performs a similar check, omitting all interactions, to check whether the lack of significance of certain policy variables may be due to the collinearity with the interaction terms. Model five, re-estimates model two following the hypothesis of Dreher and Schneider (2006) of simultaneity between corruption and informality, instrumenting for the former.56 Model six re-estimates model two taking into account that of the fact that the current level of income and informality may be the result of policies and institutions
56 In performing the two stage least squares estimation, (which, in any case, a large sample technique) we followed Friedman et al. (2000) and Dreher and Schneider (2006) choosing the instruments for corruption among a series of fixed factors traditionally shown to be correlated with institutional development such as the longitude and latitude of a country, and a dummy for the landlocked countries. See Easterly and Levine (2003) for a review. However, contrary to the results of Easterly and Levine, these instruments, although passing the relevance tests, do not fully pass the test of independence from the error term of the second stage regression. P value of the Hensen over identification test is only 0.08 showing that they might potentially (and collectively) be correlated with the size of the informal economy. Other combinations of fixed factors do not provide any better fit for the first stage regression, nor guarantee a better independence.

Working Paper No. 84 26
that evolved over the past. (See IMF, 2003). We thus averaged the variables entering the regression over the past ten years (policies) and five years (institutional quality).57 This provided for a substantial boost of the adjusted R –Square. Finally model seven re-elaborated model two substituting the three highly collinear measures of the quality of public administration (control of corruption, government effectiveness and rule of law) with an index obtained averaging the three of them.58 Averaging allows us to have a synthetic indicator that overcomes the issue of high collinearity between the single regressors, that can be interpreted as an overall ‘quality of public administration’ indicator and, that also enables to save few degrees of freedom.
To shift from model one to model two, maintaining our baseline hypothesis that all the variables might have a potential influence on the level of informality, we progressively eliminated the variables most collinear with each others and/or less significant in the more general specification of model one, in order to improve the efficiency and the fit. The model two is our preferred model in terms of statistical model selection criteria and completeness of the set of explanatory variables. Emerging from this model and largely confirmed by the following alternative specifications we find that the top-marginal income tax rate is borderline and not significant but, like in Krakowski (2005) and Friedman et al. (2000), is negative, and its positive effect on the reduction of the informality is reinforced in a statistically significant way by the government effectiveness.59 However, these results are not confirmed (signs are inverted and/or significance is lost) if we employ the alternative Fraser institute indexes averaging the income and the payroll tax rates. As mentioned earlier in this paper, the estimates are contingent upon the nature of tax variable used. A general case, therefore, can not be made regarding the impact of taxation on informality.
The labour market regulation index60 is omitted from model two and reinserted in model three and four. In none of these cases, it reaches significance. On the contrary, its interaction with the level of government effectiveness61 is always significant and negatively signed. Thus, for a given level of labour protection, better government effectiveness decreases informality.
The index representing the freedom of trade and the average tariff’s level are omitted from the models but the actual measure of trade to GDP is significant in five out of seven models and negatively signed in all of the models implying strong links between trade and reduction in informality. The monetary policy measures (which ever is included in the model) do not appear to significantly influence informality, but they are borderline not significant and negatively signed. The government size (the measure is inversely signed meaning lower size implied by higher score) appears, in most of the models, to decrease the informality but there is also evidence that this beneficial effect is limited up to a certain
57 The difference is due to the lack of sufficient available data for the institutional quality measures.
58 The three original variables have all approximately a unit normal distribution with mean equal to zero.
59 The quadratic term was omitted but, in other alternative specifications not presented here we did not find any confirmation of the existence of this possible non-linearity.
60 The same results are obtained when the business regulation index (BusinessRegindexFr) is used at the place of the labour market regulation. The two variables are indeed very collinear and it is not possible to insert both of them at the same time.
61 Note that also eliminating the interaction and hence possible collinearity with the main effect, the two variables do not reach statistical significance.

Working Paper No. 84 27
extent (the quadratic term has a negative sign). This index is an average of four other indicators: consumption spending, top marginal income tax rates, transfers and subsidies, and relative importance of government enterprises and investments. In our estimates we control more or less directly for the first two indicators and the fourth one (through the variable representing government intervention in the economy). Government transfers and subsidies may be conditional to belonging to the formal sector and it appears that this form of direct intervention of the government guarantees formality, as far as it does not cause diseconomies beyond a point of expansion, as proven by the significant and inversely signed quadratic term. Moreover, from the interaction term with the government effectiveness measure (positively signed), it appears that a smaller government, even if more effective, cannot guarantee a lower level of informality.
Democracy and the control of corruption both seem to have quite robust and negative impact on the level of informality (in the sense that they reduce informality). The government effectiveness, the rule of law and the voice and accountability variables have all, as in the first model, positive signs counterbalanced in the case of ‘government effectiveness’ by the negative sign of interactions; the other two variables, namely, ‘rule of law’ and ‘voice and accountability’ are not significant either.
The level of the index of government intervention in the economy (significant in three cases) and the overall index of fiscal burden (FiscalHF) are signed according to the deregulatory view, upholding a reduction in the active role of government, even though this result is potentially at odds with the government size index.62 Higher value of government intervention index implies more interference with market freedom and this would lead to the expansion of the size of informal economy. The interaction between government intervention in the economy and the government effectiveness is omitted because of non-significance whilst the interaction with the fiscal burden is negative and borderline, not significant. The interaction of the top marginal income tax rate with the level of effectiveness is instead negatively signed and significant. Finally, the interaction between the fiscal burden index and the level of control of corruption is not significant, suggesting that the level of corruption does not worsen the (potential) impact of the fiscal burden on informality. The coefficient of the interaction between government effectiveness and fiscal burden is negatively signed but not significant.63
Higher value of the variable (BankingHF) implies more government control over the banking system and that is associated with higher share of formal economy. As mentioned before, higher control over the banking system by the government often leads to more directed credit towards informal economy. In contrast, there is a positive impact of the amount of domestic credit to the private sector on promoting informality. One possible interpretation is that higher domestic credit to private sector leads to the spill-over of fund to the informal economy. The policy implication is clear. Without institutionally geared lending to the agents in informal economy contingent upon their formalisation, mere increase in domestic credit to private sector would enhance the flow of money to informal economy more in proportion than it stays in formal economy.
The infrastructures, proxied by the number of telephone lines and the gross fixed capital investments do not appear to have an influence on reducing informality (and they are thus excluded from the models); primary school enrolment is negative but significant only in model seven. The coefficient of the government consumption expenditures variable
62 The correlation between government size and government intervention is -0.41, which implies that the two variables interpret opposite meanings. Higher size of the government should not be construed as synonymous with higher value of the index of government intervention.
63 Dreher and Schneider (2006) found higher fiscal burden associated with less unofficial activity.

Working Paper No. 84 28
instead, is negatively signed and apparently robustly significant. The level of foreign direct investments appears to influence positively informality. This effect is also confirmed by simple bivariate regressions using basic controls. It appears that there is a significant crowding out effect with respect to local economic formal activity.64
Among the fixed factors, we find a partial corroboration of the results of Krakowski (2005), concerning the impact of ethno diversity (Ethnicity) on informality. This variable, in five out of seven cases have negative signs implying association of more homogeneous population with higher degree of formality.65 In model six, the result is significant at 10 per cent level with negative sign.
We have a relatively robust impact of the women social rights on the level of informality substantiating that strengthening of women’s social rights would expand informality.
The last model in column seven evidences once again that there is a robust negative impact of the governance quality on informality, given that the ‘quality of public administration’ variable, obtained by averaging control of corruption, government effectiveness and rule of law, is strongly significant and negatively signed. The interactions of this variable with the other policy variables generally confirm the signs and significance of the previous models where the interactions were with the variable ‘government effectiveness’.
Overall, the story that seems to emerge from these set of estimates is that there are some factors quite central in determining the size of the informal economy. Governance quality variables seem to play important roles. The impact of the control of corruption or of the quality of public administration is robustly significant and the potential impact of a complete shift from the worst quality, to the best quality situation, could reduce the relative size of the informal sector between eight and twenty-one percentage points net of interactions. On the other hand, the size of the government, representing the marginal effect of transfer and social contribution, helps (within a given limit) to reduce informality. Banking system and the institution of democracy do also appear as key robust determinants of informality. In our findings, the top marginal income tax rate does not seem to contribute to informality. Other variables that seem to have impacts are trade (expressed as trade to GDP ratio), government consumption and the level of foreign direct investments. Government consumption and trade promote formality whereas FDI reduces it. Overall, good governance seems to play very important role. It is the role of the government that is crucial in promoting formality.
(b) Estimation based on employment measure of informality
Table 3 gives results of regression where the dependent variable is the ratio of the size of informal employment to total employment. Serious data problems, arising out of limited number of observations available for the dependent variable and in a very unbalanced panel, hinder us from performing regressions on the previously employed full set of explanatory variables as in Table 2. These regressions are thus, by necessity, more limited in size and scope but they present nonetheless some interesting findings. We performed stepwise regressions keeping the general to particular approach, and maintaining, for the sake of theoretical coherence, the whole set of dummy variables in any given estimates. For control, log GDP, and among the dummy variables income dummies or geographical
64 On a purely statistical base, this result is not at odds with the result on the trade to GDP variable (negatively signed) if we consider that in our sample the correlation between these two variables is only of 0.36.
65 Higher numeric magnitude of the variable reflects more ethnically homogeneous population.

Working Paper No. 84 29
dummies or legal dummies have been used.66 Also, the variables inserted represent averages over the last five or ten years,67 depending, as before, on data availability.
Models are grouped in three columns, depending on the dummies included. Columns 1 to 3 are the basic models, columns 4 to 6 substitute the variable representing workers’ rights with the index of labour market regulations, columns 7 to 9 substitute the index of labour market regulations with the index of business regulations, and columns 10 to 12 substitute the freedom of trade index from the Fraser Institute with the trade policy index from Heritage Foundation. In these three sets of three columns each, the sets of dummies have been alternated: the regional dummies in the first column substituted by the income dummies in the second column and the legal dummies in the third.
66 The use of these controls helps us to reduce omitted variable bias.
67 It appears that the fit of the models of informal employment with contemporaneous-only regressors is considerably reduced; this is why we include only averaged regressors.

30 W
orking Paper N
o. 84
Table 3. Results of Regressions Dependent variable: Size of Informal Employment over total Employment
Independent variables Model I Model II Model
III Model
IV Model
V Model
VI Model
VII Model VIII Model
IX Model X Model XI Model XII
Variable names (1) (2) (3) (4) (5) (6) (7) (8) (9) (10) (11) (12) TlabFo 0.000
(3.21)** 0.000 (1.74)
0.000 (3.18)**
0.000 (1.92)♦
L5WORKER 15.957 (3.50)**
7.630 (1.83)♦
13.559 (2.47)*
9.919 (2.28)*
Log GDPusdpcwdi -15.412 (5.27)**
-14.486 (2.95)**
-15.786 (6.25)**
-9.567 (2.85)*
-16.277 (6.83)**
-17.050 (7.11)**
-9.567 (2.85)*
-14.486 (2.95)**
-17.618 (7.02)**
-18.461 (4.38)**
-13.879 (2.72)*
-15.344 (5.88)**
L5 Quality of public administration
3.826 (1.23)
3.380 (0.86)
-1.555 (0.36)
-1.555 (0.36)
3.380 (0.86)
1.394 (0.38)
3.779 (0.91)
1.303 (0.34)
reg_eap 39.564 (3.90)**
36.881 (3.51)**
36.881 (3.51)**
21.934 (1.79)♦
reg_lac 31.460 (4.15)**
21.951 (2.45)*
21.951 (2.45)*
20.809 (2.34)*
reg_mena 25.347 (2.99)*
17.660 (1.64)
17.660 (1.64)
30.311 (2.61)*
reg_ssa 18.210 (2.51)*
31.829 (2.89)*
31.829 (2.89)*
15.245 (1.75)♦
reg_sa -74.871 (2.11)
39.913 (2.92)*
39.913 (2.92)*
-114.278 (2.35)*
L10 FreedomTradeindexFR
-4.017 (2.79)*
-2.789 (1.34)
-3.706 (1.96)♦
-3.096 (1.67)
-2.547 (1.38)
-3.706 (1.96)♦
-2.789 (1.34)
-3.039 (1.65)
L10 GCFgdpwdi -0.913 (2.58)*
-0.676 (1.60)
L5 DemocPolit 0.999 (1.61)
0.999 (1.61)
0.903 (1.34)
1.808 (1.37)
inc_lower middle -12.385 (1.72)
-12.385 (1.72)
-14.238 (1.93)♦
inc_upper middle -8.804 (0.77)
-8.804 (0.77)
-9.839 (0.82)
L10 GovtintHF -4.985 (1.50)
-6.087 (2.27)*
-4.985 (1.50)
-4.017 (1.48)

Working P
aper No. 84
31
L10 primaryenrolgroswdi 0.255 (1.60)
0.255 (1.60)
0.317 (1.90)
L10 cpiwdi 0.037 (2.09)♦
0.023 (1.37)
0.031 (1.83)
leg_british 17.131 (1.75)
leg_french 22.177 (2.48)*
L10 tradeHF
-4.385 (2.1)*
L10 BankingHF -5.184 (1.74)
-5.204 (1.79)♦
-4.036 (1.35)
L10 BusinessRegindexFR
2.284 (2.11)*
L10 FiscalHF -7.663 (1.72)
-7.663 (1.72)
L10 LMRegulatindexFR
3.032 (3.42)**
2.824 (3.21)**
Observations 24 24 24 24 24 24 24 24 24 24 24 24 Adj. R-squared 0.84 0.68 0.67 0.72 0.68 0.69 0.72 0.68 0.68 0.78 0.64 0.7 Countries included in the sample are: Albania, Algeria, Benin, Bolivia, Brazil, Chad, Chile, Colombia, Costa Rica, Dominican Republic, Egypt, El Salvador, Guatemala, Honduras, India, Indonesia, Kenya, Morocco, Philippines, South Africa, Syrian Rep., Thailand, Tunisia, Venezuela. The year of observation is the year 2000. Note: (i) L5 or L10 indicate average over last 5 and 10 years respectively (ii) Absolute values of ‘t’-statistic are in parentheses (ii) ♦ significant at 10%, * significant at 5%, ** significant at 1%
32 Working Paper No. 84
We present the results incorporating a relatively full set of regressors: the Cingranelli index of workers’ rights, the Polity IV variable on democracy, the index reflecting quality of public administration, the actual measure of the last ten years’ CPI inflation, the indices of: banking policy, fiscal policy, trade policy and the indicators of primary school enrolment, gross fixed capital formation, log GDP and total labour force. We proceeded to trim down the variables in order to boost the efficiency of the estimation, using stepwise regression, indicating a bar of .2 concerning the P-value of the variables to be excluded.
We have tried alternative models by inserting alternative variables. We substituted the measure of democracy with voice and accountability (not shown in the table). The results are substantially identical, however, as with the index of democracy, the voice and accountability variable is not significant (nor does it become when other variables are excluded).
We have also explored substituting the Cingranelli index of workers’ rights with the Fraser measure of labour market regulation.68 This latter index becomes positive and significant at ten percent level.
It is interesting to observe that log of per capita GDP is the only variable which retained its significance in all the models; the coefficients are negatively signed implying that growth is an obvious cure for informal employment. No other variable consistently remained robust in all the models. Regional dummies are important (indeed the models with the highest adjusted R-square are the ones with the regional dummies), which means that region-specific factors unrelated to the variables on policies and institutions considered in the models influence the dependent variables. This underscores the usefulness of studies of informal employment at disaggregated level.
We try to decipher those variables in the table, which are significant in, at least, one of the models and did not change signs between one model and another. Workers’ rights, significant in three models, had fairly large coefficients positively signed. However, we do not attach importance to this finding since it does not stand the test of our consistency come robustness check. If we use labour rights index from Fraser Institute, then we get results, which contradict our findings based on Cingranelli index. Labour market regulations, which substituted workers’ rights in three models emerged significant in two models and were positively signed. Index of business regulations, which was substituted for labour market regulations in three models, was positively signed and significant in one model. The inferences are the following:
(i) Countries with more market friendly labour market regulations have higher proportions of informal employment;
(ii) Countries with more market friendly business regulations have higher proportion of informal employment.
All the coefficients of freedom of trade index (significant in one model, but figured in eight out of twelve models in Table 3) are consistently negatively signed implying that countries with more liberal trade regime have lower proportions of informal employment. This is
68 The Fraser measure is indeed based on a more comprehensive array of primary sources and is perhaps more reliable. Note that the results of this estimation are very similar to the ones obtained by inserting the business regulation index from the Fraser Institute at the place of the labour market regulations index (these two Fraser measures do indeed have a very high correlation). Conversely, when inserted, alternating between them, but contemporaneously with the Cingranelli index, the Fraser measures always resulted not significant.

Working Paper No. 84 33
consistent with the results of Banerjee and Ghanem (2002) discussed earlier. The result is also consistent with our results in Table 2, that trade liberalization promotes formality.
Gross capital formation surfaced only in two models, significant in one, signed negative in both implying association of higher value of the variable with lower proportion of informal employment.
Government intervention featured in four models and was significant in one. The coefficients are negatively signed implying that more government intervention is associated with higher proportion of formal employment. The result is not counter intuitive in the sense that government intervention is linked to formal employment in government.
Our results indicate that higher per capita GDP is associated with the lower share of informal employment. Since institutions and policies do impact GDP [see IMF (2003) for a review of literature] they influence informal employment through indirect channel.
6. Summary and conclusions
An appropriate mix of policies and institutions can improve income generation in official economy and enhance growth and welfare. We do not find generalized evidence that higher taxation or labour market regulation as such promote unofficial economy. The results are rather just the opposite when regulation or taxation is combined with improved governance (including control of corruption). Both labour market regulation and taxation help to reduce unofficial economy when combined with effective governance. Larger size of government helps to reduce unofficial economy. However, beyond a point, further growth in the size of government produces opposite results. A mix of good governance and regulation rather than deregulation, therefore, holds the key to the promotion of official economy.
Supervised and controlled banking system promotes official economy. Mere increase in private credit to domestic economy results in more than proportionate increase in unofficial economy. Stronger banking regulation and supervision, rather than the growth of private credit alone, should be the policy target.
Net Foreign Direct Investment (FDI) inflows are significantly associated with the promotion of unofficial economy. Since this is a finding at macro level through cross country regression, it is important to have a closer look at the income generation process associated with FDI to find out the channels through which FDI is causing unofficial economy to flourish. Trade-GDP ratio, on the other hand is associated with larger official economy.
Interestingly, most of these institutional and policy variables do not explain the relative size of informal employment. Be it quality of governance or banking supervision or increase in private credit, none seems to have any significant effect on informal employment. Nevertheless, it is seen that per capita GDP and capital formation have positive effect on the promotion of formal employment. We have seen from our results on unofficial economy (size of informal economy) that certain policies and quality of institutions help to reduce unofficial economy. This would imply that these set of policies and institutions would help to promote economic growth, which in turn would help to reduce informal employment.
Our results on informal employment show that higher freedom of trade is associated with higher proportion of formal employment. It is important to examine the channel at micro level, through which trade and formality are related.

34 Working Paper No. 84
From the policy perspective, it is clear that the debate should not hover round regulation versus deregulation. Government has a positive role provided it is effective. Quality of governance and control of corruption have major roles in improving formality. In the context of public policy, the issue is to examine how policies and governance interact at micro level and what sort of intervention is needed to improve the quality of such interactions.

Working Paper No. 84 35
References
Ades, A. and Di Tella, R. 1999. “Rents, Competition, and Corruption”, American Economic Review, Vol. 89.
Alonza, R. 1991. “The Informal Sector in the Philippines”, The Silent Revolution, (eds.) A. Chickering and M. Salahdine. International Center for Economic Growth (San Francisco).
Asea, P.K. 1996. “The Informal Sector: Baby or Bath Water?” Carnegie-Rochester Conference Series on Public Policy, Vol. 45, pp. 163-71.
Baccaro, L. and Rei, D. 2005. “Institutional determinants of unemployment in OECD countries: A time series cross-section analysis (1960-98)”, International Institute for Labour Studies (Geneva, ILO) DP/160/2005.
Baldwin, R.E. 1994. “The effects of Trade and Foreign Direct Investments on Employment and Relative Wages” OECD Economic Study, Vol. 23.
Banerji, A. and Ghanem, H. 1997. “Does the Type of Political Regime Matter for Trade and Labor Market Policies?”, World Bank Economic Review, Vol. 11, No. 1, pp. 171-94.
Bhattacharyya, D.K. 1993. “How does the “Hidden Economy” Affect Consumers’ Expenditure? An Econometric Study of the U.K. 1960-84”, International Institute of Public Finance (Berlin).
−. 1999. “On the Economic Rationale of Estimating the Hidden Economy”, Economic Journal, Vol. 109, No. 456, pp. 348-59.
Blanchard, O. 1987. Comment on "Vector Autoregressions and Reality," by D. Runkle. Journal of Business and Economic Statistics, Vol. 5, No. 4, pp. 449-51.
Botero, J.C.; Djankov, S.; La Porta, R.; Lopez de Silanes, F.C. and Shleifer, A. 2003. “The Regulation of Labour”, NBER Working paper series No. 9756.
−, −, −. 2004. "The Regulation of Labour", The Quarterly Journal of Economics, MIT Press, Vol. 119, No. 4, pp. 1339-82.
Braun, J. and Loayza, N. 1994. “Taxation, Public Services, and the Informal Sector in a Model of Endogenous Growth”. Policy Research Working Paper No. 1334. The World Bank.
Buchanan, J. and Tullock, G. 1962. “The Calculus of Consent” (Ann Arbor, MI, University of Michigan Press).
Carr, M. and Chen, M. 2002. ‘Globalization and the Informal Economy: How Global Trade and Investment Impact on the Working Poor’. Employment Sector Working Paper on the Informal Economy (Geneva, ILO).
Chickering, A. and Salahdine, M. 1991. “Introduction and the Informal sector search for self-governance”, The Silent Revolution, (eds.) A. Chickering and M. Salahdine. International Center for Economic Growth (San Francisco).

36 Working Paper No. 84
Choi, J.P. and Thum, M. 2005. “Corruption and the Shadow Economy”, International Economic Review, Vol. 46, No. 3, pp. 817-36.
Chong, A. and Gradstein, M. 2004. “Inequality, Institutions, and Informality”, Inter-American Development Bank and Ben-Gurion University.
Cingranelli, D.L. and Richards, D.L. 2005. “Human Rights dataset” Version 2005.10.12. Available at http://www.humanrightsdata.org
Cunningham, W.V. and Maloney, W.F. 2001. “Heterogeneity among Mexico’s Microenterprises: An Application of Factor and Cluster Analysis”, Economic Development and Cultural Change, Oct., Vol. 50, No. 1, pp. 131-56.
Currie, J. and Harrison, A.E. 1997. “Sharing the Costs: The Impact of Trade Reform on Capital and Labor in Morocco”, Journal of Labor Economics, Vol. 15.
De Soto, H. 1989. “The Other Path” (New York, Harper and Row).
Devarajan, S.; Ghanem, H. and Thierfelder, K. 1997. “Economic Reform and Labor Unions: A General-Equilibrium Analysis Applied to Bangladesh and Indonesia”, World Bank Economic Review, Vol. 11, No. 1.
Diwan, I. and Walton, M. 1997. “How International Exchange, Technology, and Institutions Affect Workers: An Introduction”, World Bank Economic Review, Vol. 11, No. 1, pp. 1-15.
Djankov, S.; La Porta, R.; Lopez de Silanes, F. and Shleifer, A. 2002. “The Regulation of Entry”, Quarterly Journal of Economics, Vol. 117.
Djankov, S.; La Porta, R.; Lopez de Silanes, F. and Shleifer, A. 2003. “Courts”, Quarterly Journal of Economics, Vol. 118, pp. 457–522.
Dreher, A.; Kotsogiannis, C. and McCorriston, S. 2005. "How do Institutions Affect Corruption and the Shadow Economy?," Public Economics 0502012, Econ WPA, revised 24 Feb.
Dreher, A. and Schneider, F. 2006. "Corruption and the Shadow Economy: An Empirical Analysis," IZA Discussion Papers 1936, Institute for the Study of Labour (IZA).
Easterly, W. and Levine, R. 2003. "Tropics, germs, and crops: how endowments influence economic development", Journal of Monetary Economics, Vol. 50, No. 1, pp. 3-39.
Fields, G.S. 1990. “Labour Market Modelling and the Urban Informal Sector: Theory and Evidence in OECD”, The Informal Sector Revisited (Paris).
Fleming, M.H.; Roman, J. and Farrell, G. 2000. “The Shadow Economy”, Journal of International Affairs, Spring Vol. 53, No. 2, pp. 387-409.
Frankel, J. and Romer, D. 1996. “Trade and Growth: An Empirical Investigation”. NBER Working Paper 5476.
Frey, B.S. and Weck-Hannemann, H. 1984. “The hidden economy as an unobserved variable”, European Economic Review, Vol. 26, No. 1-2, pp. 33-53.
Friedman, E.; Johnson, S.; Kaufmann, D. and Zoido-Lobaton, P. 2000. "Dodging the grabbing hand: the determinants of unofficial activity in 69 countries", Journal of Public Economics, Vol. 76, No. 3, pp. 459-93.
Working Paper No. 84 37
Galli, R. and Kucera, D. 2004. “Labour Standards and Informal Employment in Latin America”, World Development, Vol. 32, No. 5, pp. 809-28.
Global Development Network Growth Database. Download 3/2006. Available at: http://www.nyu.edu/fas/institute/dri/global%20development%20network%20growth%20database.htm
Goldberg, P. and Pavcnik, N. 2003. “The Response of the Informal Sector to Trade Liberalization” (Yale University) http://www.econ.yale.edu/~pg87/informality.pdf
Gwartney, J. and Lawson, R. 2005. “Economic Freedom of the World. 2005 annual report”. Available at: http://www.freetheworld.com/release.html
Hart, K. 1973. ‘Informal Income Opportunities and Urban Employment in Ghana’, Journal of Modern African Studies, Vol. 11, No. 1, pp. 61-89.
Henley, A.; Arabsheibani, G.R. and Carneiro, F.G. 2006. “On Defining and Measuring the Informal Sector”, World Bank Policy Research Working Paper 3866.
Hibbs Jr., D.A. and Piculescu, V. 2005. "Institutions, Corruption and Tax Evasion in the Unofficial Economy," Working Papers in Economics 173 (Göteborg University, Department of Economics).
Hill, R. and Kabir, M. 1996. “Tax Rates, the Tax Mix, and the Growth of the Underground Economy in Canada: What can we infer?”, Canadian Tax Journal, Vol. 44, No. 6, pp. 1552-83.
Hindriks, J.; Muthoo, A. and Keen, M. 1999. “Corruption, extortion and evasion”, Journal of Public Economics, Vol. 74, pp. 395-430.
Hirschman, A.O. 1970. “Exit, Voice and Loyalty” (Cambridge, Harvard University Press).
Huq, M. and Sultan, M. 1991. “‘Informality’ in Development: The Poor as Entrepreneurs in Bangladesh”, The Silent Revolution, (eds.) A. Chickering and M. Salahdine. International Center for Economic Growth (San Francisco).
Hussmans, R. 2004. “Measuring the informal economy: From employment in the informal sector to informal employment” ILO, Policy Integration Department Working Paper No. 53.
ILO. 1972. Incomes, Employment and Equality in Kenya (Geneva, ILO).
ILO. 2001. “Reducing Decent Work Deficit: A global challenge”.
ILO. 2002. “Women and Men in the Informal Economy: a statistical picture”.
ILO. 2002a. “Decent work and the informal economy − Report VI” presented for the General Discussion at the International Labour Conference 2002.
ILO. 2002b. “Decent work and the informal economy: Resolution and conclusions” from the International Labour Conference General Discussion 2002.
ILO. 2006. “Key Indicators of Labour Market database” Fourth Edition.
IMF. 2003. “World Economic Outlook”, April (Washington D.C.).
IMF. 2005. “World Economic Outlook”, September (Washington D.C.).

38 Working Paper No. 84
Johnson, S.; Kaufmann, D. and Zoido-Lobaton, P. 1998. "Regulatory Discretion and the Unofficial Economy", American Economic Review, American Economic Association, Vol. 88, No. 2, pp. 387-92.
Kaufmann, D.; Kraay, A. and Mastruzzi, M. 2005. “Governance Matters IV: Governance Indicators for 1996–2004”Draft, 9 May 2005. Accessible at: http://www.worldbank.org/wbi/governance/pubs/govmatters4.html
Krakowski, M. 2005. “Determinants of the Informal Economy: The Importance of Regional Factors" HWWA Discussion Paper No. 313.
La Porta, R.; Lopez-de-Silanes, F.; Shleifer, A. and Vishny, R. 1999. “The Quality of Government”, Journal of Law, Economics, and Organization, Vol. 15.
Loayza, N.V. 1994. “Labour Regulations and the Informal Sector”, Policy Research Working Paper No. 1335. The World Bank.
−. 1996. “The economics of the informal sector: a simple model and some empirical evidence from Latin America”, Carnegie-Rochester Conference Series on Public Policy, Vol. 45, pp. 129-62.
−; Oviedo, A.M. and Serven, L. 2005. "The impact of regulation on growth and informality - cross-country evidence," Policy Research Working Paper Series 3623, The World Bank.
Lyssiotou, P.; Pashardes, P. and Stengos, T. 2004. "Estimates of the black economy based on consumer demand approaches", Economic Journal, Royal Economic Society, Vol. 114, No. 497, pp. 622-40.
Maloney, W.F.; Fiess, N.M. and Fugazza, M. 2002. "Exchange rate appreciations, labor market rigidities, and informality," Policy Research Working Paper Series 2771, The World Bank.
Maloney, W.F. 2004. “Informality Revisited”, World Development, Vol. 32, No. 7, pp. 1159-78.
Mazumdar, D. 1976. “The Urban Informal Sector”, World Development, Vol. 4, No. 8.
Miles, M.; Holmes, K. and O’Grady, A. 2006. “2006 index of economic freedom”.
Nipon, P. 1991. “The Informal Sector in Thailand”, The Silent Revolution, (eds.) A. Chickering and M. Salahdine. International Center for Economic Growth (San Francisco).
Nunziata, L. 2002. “Unemployment, Labour Market Institutions and Schocks”. Nuffield College Working papers in Economics, 2002-W16.
Olson, M. 1982. “The Rise and Decline of Nations. Economic Growth, Stagflation, and Social Rigidities” (New Heaven, Yale University Press).
Pisani, M.J. and Pagan, J.A. 2004. “Self-employment in the era of the New Economic Model in Latin America: a case study from Nicaragua”, Entrepreneurship and Regional Development, 16 July, pp. 335-50.

Working Paper No. 84 39
Portes, A.; Castells, M. and Benton, L. 1989. “World Underneath: The Origins, Dynamics, and Effects of the Informal Economy”, The Informal Economy: Studies in Advanced and Less Developed Countries (eds.) A. Portes, M. Castells and L. Benton (Baltimore, Johns Hopkins).
Rajan, R. and Zingales, L. 2003. “The Great Reversals: the Politics of Financial Development in the 20th Century”, Journal of Financial Economics, Vol. 69, No. 1.
Rama, M. 1995. “Do Labour Market Policies and Institutions Matter? The Adjustment Experience in Latin America and the Caribbean”, Mimeo. The World Bank.
−. 2002. “Globalization and Workers in Developing Countries”, Policy Research Working Paper 2958, World Bank.
Rodrik, D.; Subramanian, A. and Trebbi, F. 2002. “Institutions Rule: The primacy of institutions over geography and integration in economic development”, NBER Working Paper Series, Working Paper 9305.
Rose-Ackerman, S. 1997. “Corruption and Development”. The World Bank. Washington D.C.
Sarte, P.G. 2000. “Informality and Rent-Seeking Bureaucracies in a Model of Long-Run Growth”, Journal of Monetary Economics, Vol. 46, No. 1, pp. 173-97.
Schneider, F. and Neck, R. 1993. “The development of the shadow economy under changing tax systems and structures”, Finanzarchiv N. F, Vol. 50, pp. 344-69.
Schneider, F. 1998. “Stellt das Anwachsen der Schwarzarbeit eine wirtschaftspolitische Herausforderung dar? Einige Gedanken aus volkswirtschaftlicher Sicht”, Tübingen: Mitteilungen des Instituts für Angewandte Wirtschaftsforschung (IAW), 1998:1.
Schneider, F. and Enste, D. 2000. "Shadow Economies: Size, Causes, and Consequences," Journal of Economic Literature, American Economic Association, Vol. 38, No. 1, pp. 77-114.
Schneider, F. and Klinglmair, R. 2004. “Shadow Economies around the World: What do we know?”, CREMA Working Paper Series 2004-03, Centre for Research in Economics, Management and the Arts (CREMA).
Schneider, F. 2005. "Shadow Economies of 145 Countries all over the World: What Do We Really Know?," CREMA Working Paper Series 2005-13, Centre for Research in Economics, Management and the Arts (CREMA).
Tanzi, V. 1999. "Uses and Abuses of Estimates of the Underground Economy," Economic Journal, Royal Economic Society, Vol. 109, No. 456, pp. 338-47.
Tokman, V. 2001. “Integrating the Informal Sector into the Modernisation Process”, SAIS Review, Vol. 21, No. 1, pp. 45-60.
40 Working Paper No. 84
Appendix I
Data: Definition and sources
Size of the informal economy in proportion to official GDP: This measure, presented in Schneider (2005), represents estimates of the shadow economy calculated using a combination of DYMIMIC (dynamic multiple-indicators multiple causes) and the currency demand approach. In this approach, hidden output is treated as the latent variable, and several (measurable) causal variables and indicator variables are used to estimate it. The definition, Schneider (2005) refers to includes “all market-based legal production of goods and services that are deliberately concealed from public authorities”, i.e. it does not include criminal activities.
Informal employment: The variable represents the informal employment as a percentage of non-agricultural employment for the years 1994-2000, see ILO (2002: 18-19 for details). The data are elaborated by Jaques Charmes.
Per capita GDP (GDPusdpcwdi): Data is taken from the World Development Indicators (WDI). They represent the per capita gross domestic product at constant US dollars (2000).
Consumer price index (cpiwdi): Data is taken from the World Development Indicators.
Enrolment in primary Education (primaryenrolgroswdi): Data is taken from the WDI. They represent the ratio of total enrolment, regardless of age, to the population of the age group that officially corresponds to the level of education shown.
Gross Fixed Capital Formation (GCFgdpwdi): Data is taken from the WDI. They represent the percentage over GDP of the expenses for capital formation (these include land improvements (fences, ditches, drains, and so on); plant, machinery, and equipment purchases; and the construction of roads, railways, and the like, including schools, offices, hospitals, private residential dwellings, and commercial and industrial buildings).
Agricultural value added (Agriculturevaladdperworker): data taken form the WDI. They represent the net output of the agricultural sector as a percentage of GDP.
Trade over GDP (Tradegdpwdi): Data is taken from the WDI. The variable is defined as the sum of exports and imports of goods and services measured as a share of gross domestic product.
Fixed line and mobile phone subscribers (Telsubscrwdi): Data is taken from the WDI. They represent the number of fixed lines and mobile phone subscribers per 1,000 people.
Foreign Direct Investment (FDInetgdpwdi): Data is taken form the WDI. They represent the percentage ratio of the net inflows of investment to acquire a lasting management interest (10 per cent or more of voting stock) in an enterprise operating in the country’s economy over the gross domestic product of the country.
General Government consumption (Govconsexpgdpwdi): Data is taken from the WDI. The general government final consumption expenditures include all government current expenditures for purchases of goods and services (including compensation of employees). It also includes most expenditure on national defence and security, but excludes government military expenditures that are part of government capital formation. The variable is expressed as a percentage of GDP.
Top Marginal Income Tax Rate: The data is from the Fraser Institute; it represents the maximum tax rate in percentage.

Working Paper No. 84 41
Labour Supply (TLabFo): This variable, constructed using WDI data represents the percentage ratio of total labour force (defined as “people who meet the International Labour Organization definition of the economically active population”) over total population.
Domestic credit to private sector (Domesticcredittoprivatesector): Data taken from the WDI. It refers to financial resources provided to the private sector, such as through loans, purchases of non-equity securities, trade credits and other accounts receivables that establish a claim for repayment. For some countries, these claims include credit to public enterprises.
World Bank Governance Indicators:
These variables are taken from the World Bank Governance Research Indicators dataset, May 2005 version. For a full description of the methodology and original sources see Kauffman et al. (2005: appendix A-B-D). All the variables are aggregated indices, available for five time periods: 1996, 1998, 2000, 2002 and 2004. All the indicators are originally rescaled and normalised to have mean zero and standard deviation of one across countries in each period. Each series is constructed so that an increase in the value of the indicator represents an amelioration of the underlying concept. “The indicators are based on several hundred individual variables measuring perceptions of governance, drawn from 37 separate data sources constructed by 31 different organizations. We assign these individual measures of governance to categories capturing key dimensions of governance, and use an unobserved components model to construct six aggregate governance indicators in each period”(Kauffman et al., 2005:1). The following definitions draw from Kauffman et al. (2005:4 and appendix D).
Control of Corruption (CorruptionWBG): It measures the perceptions of corruption i.e. the exercise of public power for private gain, including both petty and grand corruption and state capture.
Rule of Law (RuloLawWBG): It measures the quality of contract enforcement, the police, and the courts, the overall confidence of agents in the rules of the society, as well as the likelihood of crime and violence.
Government Effectiveness (GovernEffectivWBG): It measures the competence of the bureaucracy, the quality of public service provision, the independence from political pressures and the credibility of government’s commitment to policies.
Voice and Accountability (VoiceAccWBG): The variable measures civil rights, and political and human rights.
Heritage Foundation Indicators:
All these indicators are ranked on an ordinal scale from one to five. The lowest values represent the environments featuring, according to the authors, more economic freedom. For more on the methodology and the original data sources see Miles et al. (2006: Chapter 5).
Government intervention in the economy (GovtintHF): This index is a combination of other indices based on macroeconomic data, referring to the government consumption, the government ownership of enterprises, the share of government revenues from state-owned enterprises and the government ownership of property, and the economic output produced by the government. The higher the value of the index the more interventionist is the government.

42 Working Paper No. 84
Fiscal Burden (FiscalHF): This index is the combination of three indices based on actual data, two grading the top marginal individual tax rates and corporate tax rates for the current year and a third one grading the change in government expenditures over total output with respect to the previous fiscal year. The smaller the value of the index, the lower is the estimated fiscal burden on the economy.
Banking Policy (BankingHF): This index measures the extent of restrictions posed on the banking activities and the degree of government regulation and control (beyond the minimal supervision needs). It is based on the individual assessment of the authors. The highest the score, the heavier is the control of governments on the banking sector the harder the free market activity in the banking sector.
Trade Policy (TradeHF): This index is a measure of the weighted average tariff rate.
Fraser Institute Indicators:
The indicators produced by the Fraser institute are ranked from one to ten, were ten is the more market friendly or “sound” policy. See Gwartney and Lawson (2005: appendix 1) for more details about the primary sources and the methodology.
Index of Labour Market regulation (LMRegulatindexFR): This index is an average of five other indices assessing the conditions in the labour markets mostly on the basis of survey’s responses: an index of the impact of the statutory minimum wage (based on survey responses), an index evaluating the hiring and firing practices, an index of the share of the labour force whose contract is set by collective bargaining, an index of the level of unemployment benefits, and an index on the use of conscripts to obtain military personnel. Primary sources are surveys conducted for the World Economic Forum Global Competitiveness Report.
Index of Business Regulation (BusinessRegindexFR): This index is the average of five other indices, evaluating, mostly on the basis of survey answers: the extent to which businesses are free to set their own prices(price controls), the degree to which administrative procedures are an important obstacle to start a business, the time spent with government bureaucracy by senior management, the easiness to start a new business, the extent to which Irregular payments related to bureaucratic policies are common. Primary sources are surveys conducted for the World Economic Forum Global Competitiveness Report.
Index of freedom of trade (FreedomTradeindexFR): This index is the average of five other indices based mostly on actual data: an index of the overall tariff level based on revenue from taxes on international trade as a percentage of exports plus imports, mean tariff rate, standard deviation of tariff rates; an index on regulatory trade barriers based on hidden import barriers and costs of importing; an indicator of the difference between actual and expected size of the trade sector; an index of the difference between official and black market exchange rate; an index of international capital markets control, based on access to domestic/foreign capital markets, overall restrictions to the exchange/capital market controls. The index is ranked from zero to ten with ten being the most liberalised economic environment.
Index of Tariffs level (TariffsindexFR): This is one of the components of the index of freedom of trade. See above for description.
Index of Sound Money (SoundMoneyindexFR): This index is an average of four other indices ranking, respectively, on the basis of actual data: the average growth rate of money supply in the last five years minus the average GDP growth in the last ten years, the inflation rate in the last year, the average standard deviation of inflation in the last five years and the freedom to own foreign currency bank accounts (three scores possible: 0
Working Paper No. 84 43
where no possibility at all, 5 where there is the possibility but it is not reciprocated with foreign countries and 10 where there is full freedom).
Index of government Size (GovernmentSizeindexFR): This index is the average of four other indices gauging, according to actual data, the impact of: general government consumption spending as a percentage of total consumption, transfers and subsidies as a percentage of GDP, government enterprises and investment as a percentage of total investment, top marginal tax rate (and income threshold at which it applies).
Others:
Workers’ rights index (WORKER): This variable is taken from the Cingranelli and Richards (2005) dataset. It measures on a discrete scale from zero (severely restricted) to two (fully protected) the extent to which workers enjoy freedom of association, the right to bargain collectively and other internationally recognized rights at work, including a prohibition on the use of any form of forced or compulsory labour; a minimum age for the employment of children; and acceptable conditions of work with respect to minimum wages, hours of work, and occupational safety and health. The main primary source is the “US State Department Reports on Human Rights”.
Women Social Rights (WOSOC): This variable is taken from the Cingranelli and Richards (2005) dataset. It measures on a discrete scale form zero (no social rights) to three (practically fully protected rights) the extent to which women may enjoy some basic internationally recognised rights such as for instance: right to an education, right to own, acquire, manage, and retain property brought into marriage, right to obtain a passport, freedom to choose a residence/domicile, etc.
Democracy (DemocPolit): This variable, taken from the POLITY IV database, is created coding two of the three69 elements (the competitiveness of political participation together with the openness and competitiveness of executive recruitment and the constraints on the chief executive, excluding measures of civil liberties) that represent the extent to which a country may be considered democratic. The Democracy indicator is an additive eleven-point scale (0-10) where the highest rank represents more democracy.
Ethnic Fractionalisation (Ethnicity): This indicator is taken from Global Development Network Growth Database.
Fixed Factors:
Geographical dummies: We grouped the countries according to their geographical location following the classification of the Global Development Network Growth Database: (EAP): East Asia and the Pacific; (EEC): East Europe and Central Asia; (MENA): Middle east North Africa; (SA): South Asia; (SSA): Sub Saharian Africa; (LAC): Latin American and Caribbean.
Legal origin dummies: Following Djankov et al. (2003), we inserted dummies grouping the countries according to their legal origin: British, French, and Socialist.
69 According to the POLITY IV authors, Democracy is conceived as three essential, interdependent elements: One is presence of institutions and procedures through which citizens can express effective preferences about alternative policies and leaders. Second is the existence of institutionalized constraints on the exercise of power by the executive. Third is the guarantee of civil liberties to all citizens in their daily lives and in acts of political participation. Other aspects of plural democracy, such as the rule of law, systems of checks and balances, freedom of the press, and so on are means to, or specific manifestations of, these general principles.

44 Working Paper No. 84
Income level dummies: Following the classification of the World Bank reported in the Global Development Network Growth Database we grouped the countries of our sample according to their income level: low, lower middle, upper middle.
reg_eap: Regional dummy for East Asia and Pacific; similarly, reg_mena: Regional dummy for Middle East North Africa and so on.
Leg_british: Legal dummy for British origin.
Leg_french: Legal dummy for French origin.
Leg_socialist: Legal dummy for countries of socialist origin.
Inctaxsq: Square of top marginal income tax rate.
Sizesq: Square of Government size index.
Interactions:
lm_effect: Interaction between labour market regulation and government effectiveness.
tax_effect: Interaction between top marginal income tax rate and government effectiveness.
fiscalhf_corr: Interaction between FiscalHF and CorruptionWBG.
tax_corr: Interaction between top marginal income tax rate and CorruptionWBG.
size_effect: Interaction between government size and government effectiveness.
int_effect: Interaction between government intervention and government effectiveness.
fiscal_effect: Interaction between fiscal pressure and government effectiveness.
Corruptionwbg_gdp: Interaction between CorruptionWBG and GDP per capita.
Working Paper No. 84 45
Appendix II Countries and Years: Table 2
Bangladesh: 2000, 2002; Bolivia: 2000, 2002; Botswana: 2000, 2002; Brazil: 2000, 2002; Bulgaria: 2000, 2002; Cameroon: 2000, 2002; Chile: 2000, 2002; China: 2000, 2002; Colombia: 2000, 2002; Congo Rep.: 2000, 2002; Costa Rica: 2000, 2002; Côte d’Ivoire: 2000, 2002; Croatia: 2000, 2002; Czech Rep.: 2000, 2002; Dominican Republic: 2000, 2002; Ecuador: 2000, 2002; Egypt: 2000, 2002; El Salvador: 2000, 2002; Estonia: 2000, 2002; Ghana: 2000, 2002; Guatemala: 2000, 2002; Honduras: 2000; Hungary: 2000, 2002; India: 2000, 2002; Indonesia: 2000, 2002; Iran: 2000, 2002; Jamaica: 2000, 2002; Jordan: 2002; Kenya: 2000, 2002; Latvia: 2000, 2002; Lithuania: 2000, 2002; Malawi: 2000, 2002; Malaysia: 2000, 2002; Mexico: 2000, 2002; Morocco: 2000, 2002; Nicaragua: 2000, 2002; Nigeria: 2002; Pakistan: 2000, 2002; Panama: 2000, 2002; Paraguay: 2000, 2002; Peru: 2000, 2002; Philippines: 2000, 2002; Poland: 2000, 2002; Romania: 2000, 2002; Russian Fed.: 2000, 2002; Senegal: 2000, 2002; South Africa: 2000, 2002; Sri Lanka: 2002; Syrian: 2002; Tanzania: 2000, 2002; Thailand: 2000, 2002; Tunisia: 2002; Turkey: 2000, 2002; Uganda: 2000, 2002; Ukraine: 2000, 2002; Uruguay: 2000, 2002; Venezuela: 2000, 2002; Zambia: 2000, 2002; Zimbabwe: 2000, 2002.

46 Working Paper No. 84
Appendix III
Robustness tests
Together with testing alternative specifications, we run a series of robustness tests on the model two. A possible cause of concern could be the non-linearity of the dependent variable, which is expressed as a ratio. Formal RESET tests presented at the bottom of each column show that our specifications do not apparently suffer form this problem, exceptions are models two and six, the best fitting ones. We re-estimated both of this models proceeding to a log-odds transformation of the dependent variable.70 Whilst this did not influence the signs and the significance level of virtually any coefficient (only the magnitude was affected), formal reset tests run after the re-estimation, presented a P-value of respectively 0.91 and 0.12 for model two and six, permitting to exclude possible non-linearity.
The high collinearity between the variables could be worrisome if it leads to instability of the coefficients, as is possibly the case with this data problem. We tried several alternative specifications, inserting and omitting the independent variables (and alternative series for each of them) to ensure that the results found were not derived from a random combination, ending up with fairly stable coefficients. We also tested the stability of our preferred specifications across different sample sizes, running another robustness test consisting in selecting randomly a percentage of the observations of the sample (from 50 per cent upward) and estimating the model on the sub sample so obtained. The results of this experiment (omitted for reasons of space) proved once again to be extremely consistent with the ones of the full model. In the end, to deal with the high collinearity between them, the governance variables were grouped in model six and as shown in the Table 2; the new variable appears largely significant and consistently signed.
Finally, there might be a concern regarding the effective explanatory power of our large set of independent variables when dealing with a sluggish dependent variable71, i.e. whether the actual number of observations should not be reduced to the number of different cross section (because the within country variation may be dismissible), entailing a modification of the degrees of freedom and of all the statistical tests. A regression (omitted for reason of space) on purely (averaged) cross sectional data, run on model two, showed a drop in the adjusted R-Square, to 0.53, while, the signs of the coefficients remain the same and the magnitude is very close. Regarding the significance level, the variables (not representing fixed effects) that appear more robust in this latter estimate are the index of control of corruption, the index of banking policy, the level of domestic credit to the private sector, the level of foreign direct investments, the interaction between the index of government effectiveness and the index of labour market regulation and the interaction between the index of government effectiveness and the index of government size. All of the previous maintain the same sign as in model II. The robust variables maintained themselves.
70 Results are omitted for reasons of space.
71 We thank Malte Lübker for pointing out this issue.
Working Paper No. 84 47
Policy Integration and Statistics Department
Working Papers∗
No. 1 ILO activities on the social dimension of globalization: Synthesis report
No. 2 Measuring decent work with statistical indicators – Richard Anker, Igor Chernyshev, Philippe Egger, Farhad Mehran and Joseph Ritter
No. 3 Globalization and decent work: Options for Panama – Philippe Egger
No. 4 Globalización y trabajo decente: Opciones para Panamá – Philippe Egger
No. 5 Indicators of social dialogue: Concepts and measurements – Lane Kenworthy and Bernhard Kittel
No. 6 Assessing the impact of the attacks of 11 September 2001 on women’s employment in the United States – Gertrude Schaffner Goldberg and Helen Lachs Ginsburg
No. 7 Decent work and the informal economy in Central America – Juan Diego Trejos Solórzano and Miguel Del Cid
No. 8 Poverty initiatives in the ILO: A review of past and present approaches – Pat Holden and Dagmar Walter
No. 9 Whither the International Standard Classification of Occupations (ISCO-88)? – Debbie Budlender
No. 10 Improving occupational classifications as tools for describing labour markets: A summary of recent national experiences – Debbie Budlender
No. 11 Recent developments in China’s labour economy – Thomas G. Rawski
No. 12 The Impact of economic liberalization on employment and wages in India – Sonia Bhalotra
No. 13 The impact of trade liberalization upon inequality in developing countries – Donald J. Robbins
No. 14 The impact of liberalization and globalization on income inequality in developing and transitional economies – Giovanni Andrea Cornia
No. 15 The impact of technology transfer on employment and income distribution in developing countries: A survey of theoretical models and empirical studies – Mariacristina Piva
No. 16 International finance: Meeting the needs of people in developing countries – José Guilherme Almeida dos Reis
No. 17 The gender dimensions of globalization of production – Stephanie Barrientos, Naila Kabeer and Naomi Hossain
No. 18 Social exclusion in the context of globalization – Jan Breman
No. 19 Gender and globalization: A macroeconomic perspective – Çağatay Nilüfer and Ertük Korkurt
No. 20 Globalization, social exclusion, and work: With special reference to informal employment and gender – Marilyn Carr and Martha Chen
No. 21 Resources for social development – Antony Clunies Ross
No. 22 Does the new international trade regime leave room for industrialization policies in the middle-income countries? – Alisa DiCaprio and Alice Amsden
No. 23 Social dimension of globalization in Latin America: Lessons from Bolivia and Chile – lvaro García Hurtado
No. 24 The social dimension of globalization: A review of the literature – Bernhard Gunter and Rolph van der Hoeven
No. 25 The social dimension of global production systems: A review of the issues – Susan Hayter
No. 26 Reforming global economic and social governance: A critical review of recent programmatic thinking – Jeremy Heimans
No. 27 Corporate social responsibility: An issues paper – Michael Hopkins
No. 28 Upgrading in global value chains – John Humphrey
∗ Working Papers 16-38 prepared for the World Commission on the Social Dimension of Globalization.

48 Working Paper No. 84
No. 29 Implications of globalization and economic restructuring for skills development in Sub-Saharan Africa – Richard K. Johanson
No. 30 The outcome and impact of the main international commissions on development issues – Frédéric Lapeyre
No. 31 Globalization and structural adjustment as a development tool – Frédéric Lapeyre
No. 32 Globalization and perceptions of social inequality – Malte Lübker
No. 33 The changing structure of international trade linked to global production systems: what are the policy implications? – William Milberg
No. 34 Corporate social responsibility: An overview of principles and practice – Jill Murray
No. 35 Inclusive development strategy in an era of globalization – Ignacy Sachs
No. 36 Social consequences of the globalization of the media and communication sector: some strategic considerations – Seán Ó. Siochrú
No. 37 Globalization, history and international migration: A view from Latin America – Andrés Solimano
No. 38 Towards a different kind of globalization, or how the anti-globalists view the world – Gijsbert van Liemt
No. 39 How do trade union rights affect trade competitiveness? – David Kucera and Ritash Sarna
No. 40 Statistics on the employment situation of people with disabilities: A compendium of national methodologies – ILO Bureau of Statistics in collaboration with the In Focus Programme on Skills, Knowledge and Employability
No. 41 Employment in the informal economy in the Republic of Moldova – ILO Bureau of Statistics in collaboration with the Department for Statistics and Sociology of the Republic of Moldova
No. 42 Decent work in a least developed country: A critical assessment of the Ethiopia PRSP – Graeme J. Buckley
No. 43 Unemployment and labour market institutions: The failure of the empirical case for deregulation – Dean Baker, Andrew Glyn, David Howell and John Schmitt
No. 44 Women's access to occupations with authority, influence and decision-making power: Women as legislators, senior officials and managers around the world – Richard Anker
No. 45 The world of work in the context of economic integration and trade liberalization – Daniel Martínez
No. 46 Poverty reduction in Pakistan: The strategic impact of macro and employment policies – Moazam Mahmood
No. 47 Trends in work stoppages: A global perspective – L. J. Perry and Patrick J. Wilson
No. 48 Generating decent work for poverty reduction in Cambodia: The voice of workers, employers and the Government – Moazam Mahmood
No. 49 The social dimension of regional integration in ECOWAS – René Robert
No. 50 Measuring trade union rights: A country-level indicator constructed from coding violations recorded in textual sources – David Kucera
No. 51 Patterns of job quality attributes in European Union – Joseph A. Ritter
No. 52 Child labour, education and export performance – David Kucera and Ritash Sarna
No. 53 Measuring the informal economy: From employment in the informal sector to informal employment – Ralf Hussmanns
No. 54 Indicators of labour standards: An overview and comparison – Richard N. Block
No. 55 The pattern of globalization and some implications for the pursuit of social goals – Gerry Rodgers
No. 56 Statistical indicators of social dialogue: A compilation of multiple country databases – Anne Chataigner
No. 57 Trade unions and informal workers’ associations in the urban informal economy of Ecuador – Catherine Vaillancourt-Laflamme
No. 58 Decent work, standards and indicators – Monique Zarka-Martres and Monique Guichard-Kelly
No. 59 Social dialogue indicators: Trade union membership and collective bargaining coverage. Statistical concepts, methods and findings – Sophia Lawrence and Junko Ishikawa
No. 60 Informality and gender in Latin America – María Elena Valenzuela
No. 61 Labour developments in dynamic Asia: What do the data show? – David Kucera and Anne Chataignier

Working Paper No. 84 49
No. 62 Sources and Methods: Labour Statistics – Volume 5: Total and economically active population, employment and unemployment (Population censuses), Third edition
No. 63 Desarrollo local en América Latina: Oportunidades y desafíos para el trabajo decente – Francisco Alburquerque
No. 64 Bangladesh decent work statistical indicators: A fact-finding study – Mustafa K. Mujeri No. 65 The impact of globalization on poverty in Bangladesh – S. R. Osmani No. 66 International labour migration from Bangladesh: A decent work perspective – Tasneem Siddiqui No. 67 Globalization and decent work: A report for the Decent Work Pilot Programme in Bangladesh –
Sukti Dasgupta and Amelita King Dejardin No. 68 East Africa reduction poverty and gender inequality: Selected strategies and issues No. 69 Sources et méthodes: statistiques du travail – Volume 5: Population totale et active, emploi et chômage
(Recensements de population), Troisième édition No. 70 Fuentes y Métodos: Estadísticas del Trabajo – Volumen 5: Población total y económicamente activa,
empleo y desempleo (Censos de población ), Tercera edición No. 71 The quantification of respect for selected core labour standards: Towards a social development index? –
Ludo Cuyvers and Daniel van den Bulcke No. 72 A new methodology for estimating internationally comparable poverty lines and living wage rates –
Richard Anker No. 73 Issues in macroeconomic and financial policies, stability and growth – Yilmaz Akyüz No. 74 From liberalization to investment and jobs: Lost in translation – Yilmaz Akyüz No. 75 Financial openness and employment: The need for coherent international and national policies –
Rolph van der Hoeven and Malte Lübker No. 76 Socio-economic security and decent work in Ukraine: a comparative view and statistical findings
Igor Chernyshev No. 77 Global Production Systems and Decent Work – Stephanie Barrientos No. 78 Globalization and the illicit market for human trafficking: an empirical analysis of supply and demand –
Gergana Danailova-Trainor and Patrick Belser No. 79 Employment Creation, Real Wages and Job Quality: How Much Aggregate Economic Growth Delivers?
The Case of Chile – Andrés Solimano No. 80 Growth, Investment and Employment in Ghana – Ernest Aryeetey and William Baah-Boateng No. 81 Globalisation, Industrial Revolutions in India and China and Labour Markets in Advanced Countries:
Implications for National and International Economic Policy – Ajit Singh No. 82 Growth and Employment Dynamics in Botswana: A Case Study of Policy Coherence –
Happy K. Siphambe No. 83 Beyond the Employment/Unemployment Dichotomy: Measuring the Quality of Employment in Low Income
Countries – Sabina Dewan and Peter Peek No. 84 The Impact of Institutions and Policy on Informal Economy in Developing Countries: An econometric
exploration – Diego Rei and Manas Bhattacharya
Regional and Country Policy Coherence Reports
No. 1 Implementing the GPRGS in Vietnam through Decent Work – Moazam Mahmood No. 2 Policy Coherence and Sequencing for Post-Conflict Recovery in Liberia – Moazam Mahmood No. 3 Macro Policy Coherence for Decent Work in the Caribbean – Moazam Mahmood No. 4 Employment, Decent Work and Poverty Reduction in Urban China – Zhang Junfeng and Moazam
Mahmood