the impact of foreign direct investment on china: an
TRANSCRIPT

Southern Illinois University CarbondaleOpenSIUC
Research Papers Graduate School
Spring 5-14-2011
THE IMPACT OF FOREIGN DIRECTINVESTMENT ON CHINA: AN EMPIRICALANALYSIS BASED ON THE CHINESE REALESTATE SECTORLinlin [email protected]
Follow this and additional works at: http://opensiuc.lib.siu.edu/gs_rp
This Article is brought to you for free and open access by the Graduate School at OpenSIUC. It has been accepted for inclusion in Research Papers byan authorized administrator of OpenSIUC. For more information, please contact [email protected].
Recommended CitationLiu, Linlin, "THE IMPACT OF FOREIGN DIRECT INVESTMENT ON CHINA: AN EMPIRICAL ANALYSIS BASED ON THECHINESE REAL ESTATE SECTOR" (2011). Research Papers. Paper 89.http://opensiuc.lib.siu.edu/gs_rp/89
THE IMPACT OF FOREIGN DIRECT INVESTMENT ON CHINA: AN
EMPIRICAL ANALYSIS BASED ON THE CHINESE REAL ESTATE SECTOR
By
Linlin Liu
B.A., NANKAI University, 2009
A Research Paper
Submitted in Partial Fulfillment of the Requirements for the
Master of Science Degree
Department of Economics
in the Graduate School
Southern Illinois University Carbondale
May 2011

RESEARCH PAPER APPROVAL
THE IMPACT OF FOREIGN DIRECT INVESTMENT ON CHINA: AN
EMPIRICAL ANALYSIS BASED ON THE CHINESE REAL ESTATE SECTOR
By
Linlin Liu
A Research Paper Submitted in Partial
Fulfillment of the Requirements
for the Degree of
Master of Science
in the field of Economics
Approved by:
Dr. Scott Gilbert
Graduate School
Southern Illinois University Carbondale
April 14, 2011

i
AN ABSTRACT OF THE RESEARCH PAPER OF
LINLIN LIU, for the Master of Science degree in Economics, at Southern Illinois
University Carbondale.
TITLE: THE IMPACT OF FOREIGN DIRECT INVESTMENT ON CHINA: AN
EMPIRICAL ANALYSIS BASED ON THE CHINESE REAL ESTATE SECTOR
MAJOR PROFESSOR: DR. Scott Gilbert
As China becomes the world’s second largest economy, it is among the top
positions as an FDI destination. FDI inflows in China have grown dramatically in the
last thirty years, from 1258 million dollars in 1984 to 90033 million dollars in 2009.
Along with China’s growing real estate market, FDI inflows to the real estate sector
have also increased by more than 200 percent in the last decade. In recent years, the
price of commercialized buildings in major cities increased tremendously which
arouses concern of bubble in the real estate industry in China. This paper explores the
impact of FDI on the real estate sector in China using the OLS method and granger
causality test. Evidence found in this study suggests that a 1% increase in the growth
rate of the utilized FDI will bring about 0.55% increase in the growth rate of the
average selling price of commercialized buildings and nearly 93% of the variation in
the latter can be explained by the former variable. The results of granger causality test
suggest that the causality runs from the utilized FDI to the average selling prices of
commercialized buildings. The policy implication from our analysis is that regulations
should be implemented in controlling the amount of FDI in the real estate sector and
guidance should be provided in directing the sector distribution of FDI.
ii
TABLE OF CONTENTS
CHAPTER
ABSTRACT ........................................................................................................................ …….i
LIST OF TABLES…………………………………………………………………...……..... iii
LIST OF FIGURES…………………………...……………………………………………....iv
CHAPTERS
CHAPTER 1-Introduction………………………………………………………………1
CHAPTER 2-Literature Review………………………………………………………...3
CHAPTER 3-Overview of the impact of Foreign Direct Investment on China………...5
1. Development of FDI in China…………………..…………..5
2. Sources of FDI in China………............................................8
3. Sector distribution of FDI in China……...............................9
CHAPTER 4-Empirical study on the impact of FDI on the real estate sector in China.14
1. Methodology……………………………………………….14
2. Linear Regression Model………………………………….14
3. Unit Root Test……………………………………………..15
4. Granger Causality Test ……………………………………20
CHAPTER 5-Conclusion…….………………………………………………………...22
REFERENCES ….……………………………….………………………………………..23
APENDICIES….……………………………….…………………………………………….24
VITA….……………………………….……………………………….……………………..28

iii
LIST OF TABLES
Table 1 Contracted and Actually Utilized FDI from 1987 to 2009 ............................................ 5
Table 2 Average Selling Price of Commercialized Buildings from 1987 to 2009…………... 12
Table 3 Results from Granger Causality Test………………………………………………..21
iv
LIST OF FIGURES
Figure 1 Contracted and Actually Utilized FDI from 1987 to 2009…………………………...6
Figure 2 FDI Actually Utilized by Countries or Regions …………………………………8
Figure 3 FDI by Sector from 1997-2009…............…………………………....…………10
Figure 4 FDI in Real Estate Sector from 1997-2009…………………………………………10
Figure 5 Average Selling Price of Commercialized Buildings by Use from 1987-2009...…...13
Figure 6 LOGFDI…………………………………………...………………………………..15
Figure 7 DLOGFDI…………………………………………………………………………..16
Figure 8 LOGREP……………………………………………………………………………18
Figure 9 DLOGREP………………………………………………………………………….19
Figure 10 DDLOGREP……………………………………………………………………….19
1
CHAPTER 1
Introduction
China is the world's fastest-growing major economy, with an average growth
rate of 10% for the past 30 years. As China’s economy is growing stronger, the FDI
inflows were more than doubled in the last decade and FDI has played an important
role in the country’s economic development and institutional reform. After the
Housing Reform in 1998, the property prices in China have experienced rapid growth.
In recent years, the speed of the growth in property prices in China exceeded that in
the United States and United Kingdom and the bubble in the real estate sector in
China has aroused more attention than ever. Speculation, unrealistic attitudes and easy
credit are reasons why China's property market bubble might burst in the future. In
Japan at the end of the 1980s and in the United States in 2008, residential real estate
bubbles ended in recession. With China acting as a key engine of global growth, a
bursting of the Chinese real estate bubble could trigger a larger crisis.
Many factors may contribute to the heated real estate market, and foreign direct
investment is one of them. The Chinese real estate market is particularly interesting
for many international investors, because it is relatively young which gives early
investors many opportunities. Moreover, the real estate conditions under the process
of changing are increasing the attractiveness for real estate investments in China.
At the same time, there are some problems with the distribution of the FDI in
real estate industry in China. Foreign direct investment in real estate industry in China
has been disproportionately agglomerated on the east coast, and first tier cities such as

2
Beijing, Shanghai, Shenzhen, and Guangzhou which are already highly developed
economically have attracted the majority of investment capital. The property prices in
these major cities are therefore driven up and effective measures are needed to be
taken to balance the market.
Although there have been many studies on the impact of FDI on the real estate
sector in China, such as Dianchun Jiang, Jean Jinghan Chen and David Isaac(1998),
Stèphane Dees (1998) etc. none of them incorporate FDI with the high property price
in China; and the issue of real estate bubble facing China today is more serious than
ever.
The paper proceeds as follows: chapter 2 presents a literature review. In chapter
3, I introduce the overview of the impact of Foreign Direct Investment (FDI) on
China and the property price movement in China. In chapter 4 I explain the
methodology and empirical results of the study. Chapter 5 presents the conclusion and
policy implications.
3
CHAPTER 2
Literature Review
A number of empirical studies have investigated the effect of foreign direct
investment on economic growth and the determinants of FDI in China, as well as the
FDI contribution to the total factor productivity.
E. Borensztein, J. De Gregorio and J-W. Lee(1998) tested the effect of foreign
direct investment on economic growth in a cross-country regression framework,
utilizing data on FDI flows from industrial countries to 69 developing countries over
the last two decades. Their results suggest that FDI is an important vehicle for the
transfer of technology, contributing relatively more to growth than domestic
investment. However, FDI contributes to economic growth only when a sufficient
absorptive capability of the advanced technologies is available in the host economy.
Dianchun Jiang, Jean Jinghan Chen and David Isaac(1998) studied the
development of real estate industry in China and argued that even though Hayek's
theory of economic fluctuations can help to explain the contraction of the real estate
market in 1994 in China as a whole, it is no longer robust when applied to cities
where there is heavy foreign direct investment. It is the foreign direct investment that
is making the real estate industry perform well.
Stèphane Dees (1998) assessed the determinants of Foreign Direct Investment
in China and its effects on the whole economy. An empirical study was implemented
and supported the view that FDI affects China’s growth through the diffusion of ideas.
Through the introduction of new ideas, multinational firms develop technical progress

4
and hence long-run economic growth. The transmission of ideas seems to have had a
positive effect on the Chinese growth.
Edward M. Graham and Erika Wada (2001) applied an econometric test of
whether FDI in China has contributed to increased total factor productivity growth in
those provinces that have received large amounts of FDI. The tests suggested that the
result is positive, and hence that FDI has contributed significantly to economic growth
in China beyond that which results from faster capital accumulation.
Guoqiang Long (2005) evaluated FDI’s impact in China and the effectiveness
of China’s policies governing FDI with regard to export trade and technological
advancement. The author also evaluated the influence exerted by FDI policies upon
export performance requirements and evaluated the effectiveness of technological
performance requirements.
5
CHAPTER 3
Overview of the impact of Foreign Direct Investment on China
1. Development of FDI in China
Over the past decade, China has established itself as the top recipient of foreign
direct investment among developing countries. In 2009, Actually Utilized FDI in
China reached $90 billion - corresponding to a 98.9% rise from 1997. The reasons for
these huge foreign capital inflows and their impact on the Chinese economy have
given rise to an important body of literature. Such rapid growth of FDI inflows in
China is attributable to several factors. The low cost of production such as cheap land
and blue‐collar workers, the abundance of labor, the low taxes for high‐technology
companies, the role of the overseas Chinese investors from Hong Kong, Taiwan and
Macao, the well developed infrastructure versus other emerging markets, and the
underdeveloped judicial system are all attractions China has for the foreign direct
investment. Moreover, doing manufacturing in china not only makes the price
competitiveness but also helps to reach the product to other Asian countries associated
with China.
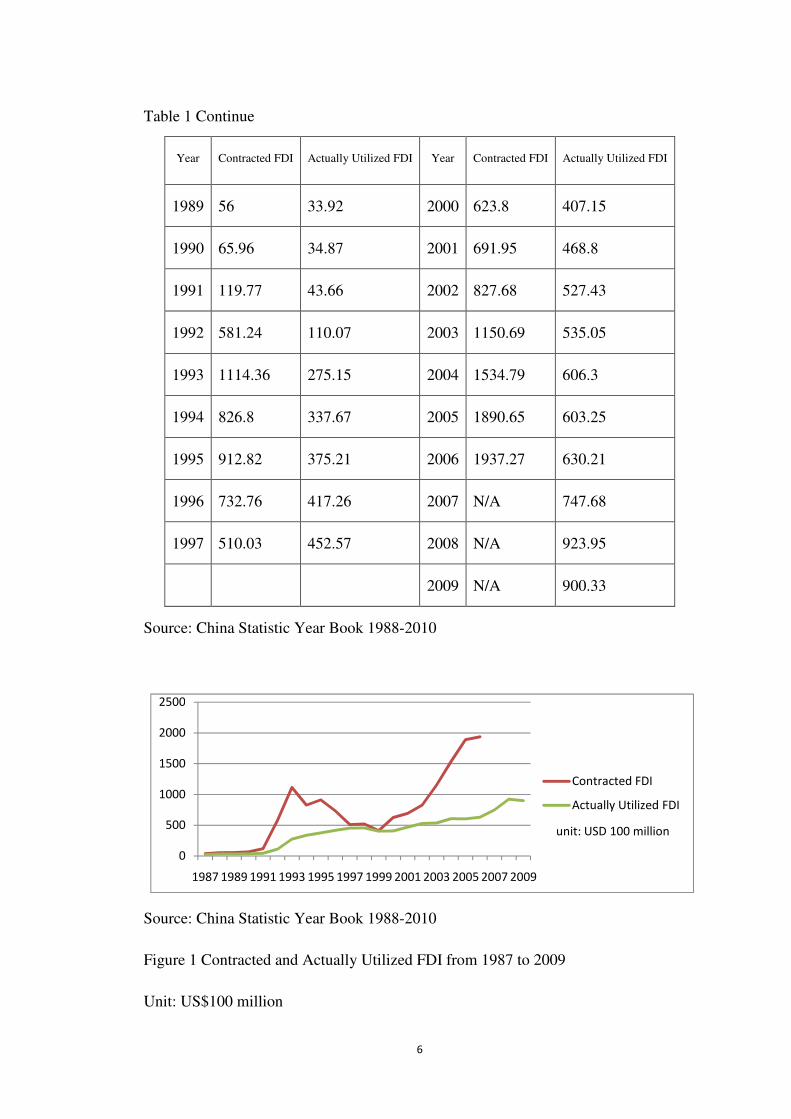
Table 1
Contracted and Actually Utilized FDI from 1987 to 2009 Unit: US$100 Million
Year Contracted FDI Actually Utilized FDI Year Contracted FDI Actually Utilized FDI
1987 37.09 23.14 1998 521.02 454.63
1988 52.97 31.94 1999 412.23 403.19
6
Table 1 Continue
Year Contracted FDI Actually Utilized FDI Year Contracted FDI Actually Utilized FDI
1989 56 33.92 2000 623.8 407.15
1990 65.96 34.87 2001 691.95 468.8
1991 119.77 43.66 2002 827.68 527.43
1992 581.24 110.07 2003 1150.69 535.05
1993 1114.36 275.15 2004 1534.79 606.3
1994 826.8 337.67 2005 1890.65 603.25
1995 912.82 375.21 2006 1937.27 630.21
1996 732.76 417.26 2007 N/A 747.68
1997 510.03 452.57 2008 N/A 923.95
2009 N/A 900.33
Source: China Statistic Year Book 1988-2010
Source: China Statistic Year Book 1988-2010
Figure 1 Contracted and Actually Utilized FDI from 1987 to 2009
Unit: US$100 million
0
500
1000
1500
2000
2500
1987 1989 1991 1993 1995 1997 1999 2001 2003 2005 2007 2009
Contracted FDI
Actually Utilized FDI
unit: USD 100 million
7
From the above figure we can see that foreign direct investment in China has
exhibited an increasing trend since 1987, after China has opened up its first Special
Economic Zones to foreign trade and investment. FDI inflows have since then
increased tremendously, and the number of international investors was growing
steadily. During the period of 1987 to 1991, FDI inflows remained relatively low due
to the joint ventures with Chinese state-owned enterprises. Xiaoping Deng made his
famous southern tour of China in the spring of 1992, encouraging personal
entrepreneurship and wholly-owned subsidiaries of foreign companies, which fostered
a new wave of foreign direct investment. The economic reforms began to generate
steady growth in FDI. From the beginning of the reforms legalizing foreign
investment, capital inflows expanded every year until 1997. The Asian financial crisis
in 1997 has not affected China directly, but the deterioration of the economic situation
in the South-East Asian countries has resulted in the decline of their investment
capacity, thus slowed down the FDI inflows during the period of 1997 to 1999. With
the recovery of the economic crisis, FDI increase steadily since 2000. Even though
there was a slight dip in FDI in 2009 as a result of the global economy slowdown,
2010 has again seen investments increase in China, with Beijing's foreign direct
investment estimated to reach around US$100 billion.
Before 1990, contracted FDI and actually utilized FDI remained at the same
level. In the early 1990s, however, contracted FDI exceeded actually utilized FDI by a
large margin. This gap narrowed in 1997 as the authorities became more realistic in
registering inflows. However, it has widened again sharply after 1999, which shows
that there is still inefficiency
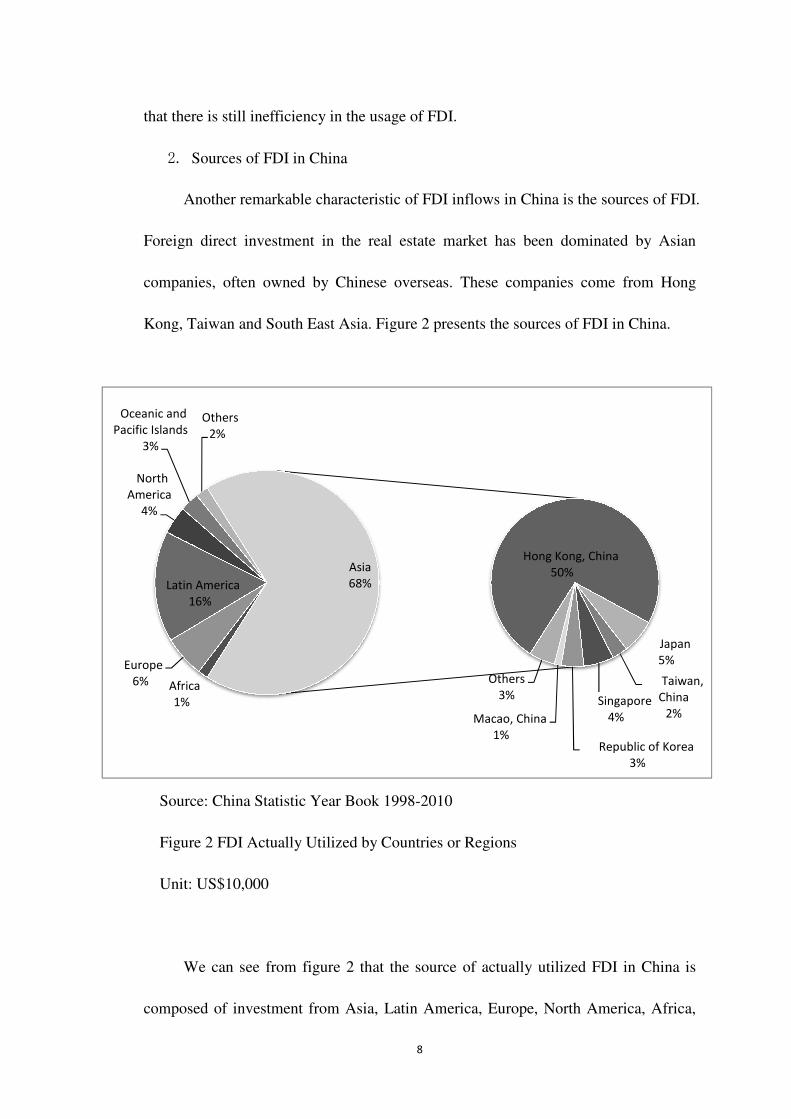
2. Sources of FDI in C
Another remarkable characteristic of FDI inflows in China
Foreign direct investment in the real estate market has been dominated by Asian
companies, often owned by Chinese overseas. These companies come from Hong
Kong, Taiwan and South East Asia.
Source: China Statistic Year Book
Figure 2 FDI Actually Utilized by Countries or Regions
Unit: US$10,000
We can see from
composed of investment from Asia, Latin America, Europe, North America, Africa,
Africa
1%
Europe
6%
Latin America
16%
North
America
4%
Oceanic and
Pacific Islands
3%
Others
2%
8
inefficiency in the usage of FDI.
Sources of FDI in China
Another remarkable characteristic of FDI inflows in China is the sources of FDI.
Foreign direct investment in the real estate market has been dominated by Asian
companies, often owned by Chinese overseas. These companies come from Hong
Kong, Taiwan and South East Asia. Figure 2 presents the sources of FDI in China.
Statistic Year Book 1998-2010
FDI Actually Utilized by Countries or Regions
We can see from figure 2 that the source of actually utilized
composed of investment from Asia, Latin America, Europe, North America, Africa,
Hong Kong, China
50%
Macao, China
1%
Others
3%
Asia
68%
is the sources of FDI.
Foreign direct investment in the real estate market has been dominated by Asian
companies, often owned by Chinese overseas. These companies come from Hong
the sources of FDI in China.
the source of actually utilized FDI in China is
composed of investment from Asia, Latin America, Europe, North America, Africa,
Hong Kong, China
50%
Japan
5%
Taiwan,
China
2%Singapore
4%
Republic of Korea
3%
9
Oceanic and pacific islands and other regions. Among all the countries and regions,
68% of FDI in China has originated from elsewhere in Asia. Hong Kong, now a
self-governing “special autonomous region” of China itself, has been the largest
source of record, which composes 50% of the total investment from Asia. The
dominance of Hong Kong, however, is somewhat illusory in that much FDI nominally
from Hong Kong in reality is from elsewhere. Some of what is listed as Hong
Kong-source FDI in China is, in fact, investment by domestic Chinese that is
“round-tripped” through Hong Kong. Other FDI in China listed as Hong Kong in
origin is in reality from various western nations and Taiwan that is placed into China
via Hong Kong intermediaries.
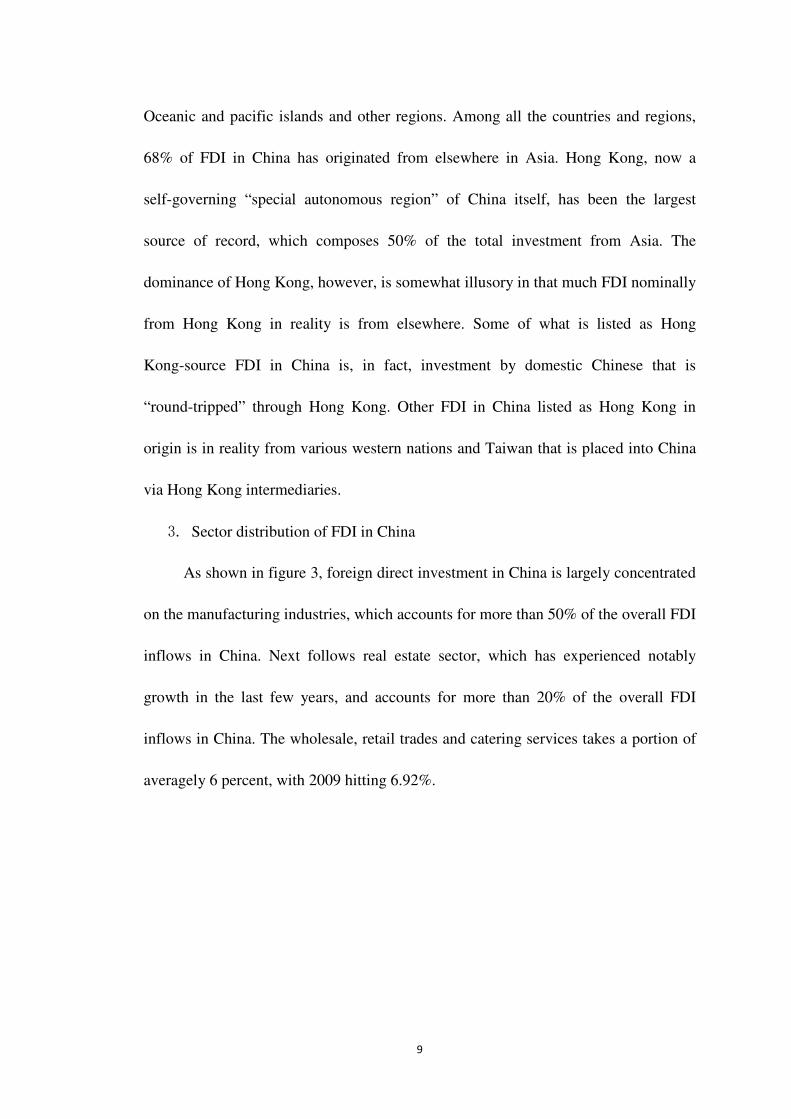
3. Sector distribution of FDI in China
As shown in figure 3, foreign direct investment in China is largely concentrated
on the manufacturing industries, which accounts for more than 50% of the overall FDI
inflows in China. Next follows real estate sector, which has experienced notably
growth in the last few years, and accounts for more than 20% of the overall FDI
inflows in China. The wholesale, retail trades and catering services takes a portion of
averagely 6 percent, with 2009 hitting 6.92%.
10
Source: China Statistic Year Book 1998-2010
Figure 3 FDI by Sector from 1997-2009 Unit: US$100 million
Source: China Statistic Year Book 1998-2010
Figure 4 FDI in Real Estate Sector from 1997-2009
Unit: US$10,000
The rapid growing real estate sector in China has become a lucrative target for
foreign investor as housing prices have continued to soar despite the government's
0%
20%
40%
60%
80%
100%
19
97
19
98
19
99
20
00
20
01
20
02
20
03
20
04
20
05
20
06
20
07
20
08
20
09
Percentage
Year
others
Wholesale, Retail Trades and
Catering Services
Real Estate
Manufacturing
0
500000
1000000
1500000
2000000
1997 1998 1999 2000 2001 2002 2003 2004 2005 2006 2007 2008 2009
actually utilized FDI in real estate sector
11
tightening measures. Foreign direct investment in China's real estate sector leveled
around 5 billion between 1997 and 2005 and surged to 8 billion in 2006. From 2007
to 2009, FDI grew by more than 100% than 2006, which is much higher than the
growth rate for total FDI inflows to China. According to the ministry of commerce,
the first 11 months of 2010 has seen US$ 20.1 billion of foreign investment went into
China's real estate sector. Meanwhile, total FDI in China grew by 17.73% during the
same period, hitting US$ 91.7 billion. According to the National Bureau of Statistics
of China, between January and November of 2010, foreign direct investment
increased by 59.0% compared with last year’s figure, surging to $ 9.92 billion among
the fund sources of real estate developing companies. According to State
Administration of Foreign Exchange estimates, FDI now accounts for 15% of China's
real estate market. Investment in this industry has become an important channel
through which so-called “hot money” flows into the country.
Even though some analysis maintains that the FDI surge in real estate should
not be seen as a sign of "hot money" inflows since property developers in big cities
are in need of more investment. There is a growing common concern of the real estate
bubble resulted from the “hot money” inflows. The following table presents the
Average Selling Price of Commercialized Buildings from 1987 to 2009.

12
Table 2
Average Selling Price of Commercialized Buildings from 1987 to 2009
Unit: Yuan/Sq.m
Year
Average Selling Price of
Commercialized Buildings
Year
Average Selling Price of
Commercialized Buildings
1987 408.183 1998 2063
1988 502.9 1999 2053
1989 573.5 2000 2112
1990 702.85 2001 2170
1991 786.19 2002 2250
1992 994.66 2003 2359
1993 1291.46 2004 2778
1994 1408.64 2005 3168
1995 1590.86 2006 3367
1996 1806.4 2007 3864
1997 1997 2008 3800
2009 4681
Source: China Statistic Year Book 1988-2010

13
Source: China Statistic Year Book 1988-2010
Figure 5 Average Selling Price of Commercialized Buildings by Use from 1987-2009
Unit: Yuan/Sq.m
The economic reform in 1978 was the starting point for major changes in the
real estate market and the market is now becoming more and more accessible for
private property developments. The average price per square meter is 408.183 Yuan in
1987 compared to 4681 Yuan per square meter in 2009. The average monthly income
in China is only 2058.7 Yuan in 2009. This implies that the majority of the urban
residents may be unable to afford an apartment. We can see from the figure that the
average housing prices in 2009 rose up to 30 percent from 2007 levels, proving that
the international financial crisis has done nothing to effect an adequate adjustment of
the Chinese property market. Now that a new round of price increases has begun,
China is feeling the negative effects of an apparent real estate bubble.
0
500
1000
1500
2000
2500
3000
3500
4000
4500
5000
1987 1989 1991 1993 1995 1997 1999 2001 2003 2005 2007 2009
14
CHAPTER 4
Empirical study on the impact of FDI on the real estate sector in China
1. Methodology
Linear regression model and granger causality test are conducted to make an
empirical assessment of the link between the utilized FDI and the average selling
price of the commercialized buildings in China. Data for the utilized FDI and average
selling price of the commercialized builds are taken from the China Statistic Year
Book and are presented in Table 1 and Table 2. Time periods under examination are
between 1987 and 2009.
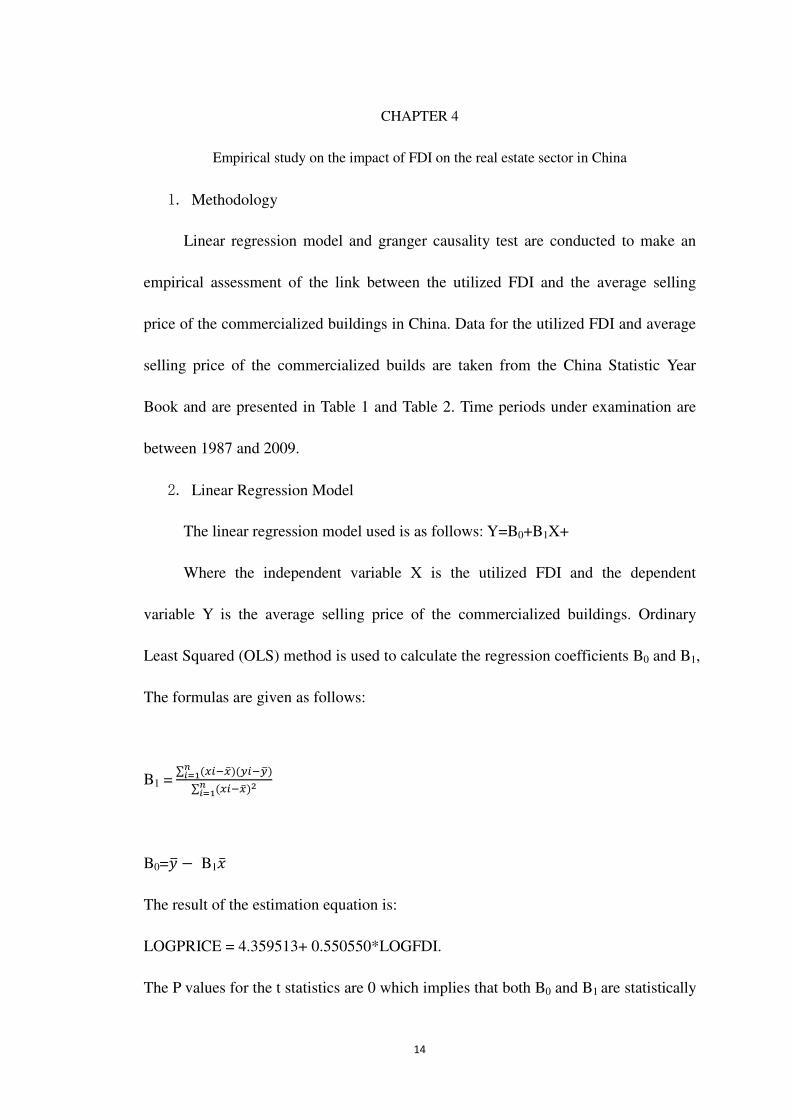
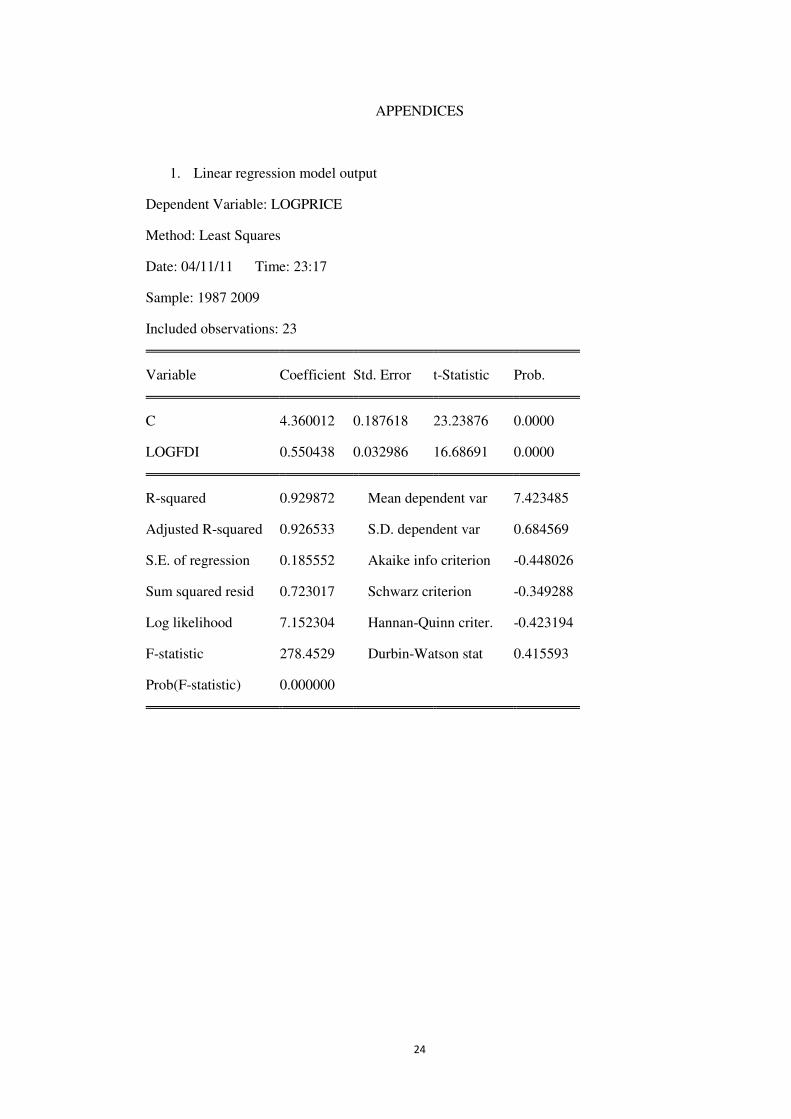
2. Linear Regression Model
The linear regression model used is as follows: Y=B0+B1X+�
Where the independent variable X is the utilized FDI and the dependent
variable Y is the average selling price of the commercialized buildings. Ordinary
Least Squared (OLS) method is used to calculate the regression coefficients B0 and B1,
The formulas are given as follows:
B1 = ∑ ����������� ��∑ �������� ��
B0=�� � B1��
The result of the estimation equation is:
LOGPRICE = 4.359513+ 0.550550*LOGFDI.
The P values for the t statistics are 0 which implies that both B0 and B1 are statistically
15
significant. The R-squared value is 0.929718 which imply that nearly 93% of the
variation in the log form of average selling price of the commercialized buildings can
be explained by the log form of the utilized FDI.
3. Unit root test
The strong association between FDI and real estate price indicated in the linear
regression model does not necessarily mean causality from the former to the latter. In
order to examine the impact of the utilized FDI on the average selling price of the
commercialized buildings in China, granger causality test is applied. Before
conducting granger causality test, we need to make sure that the time series of the
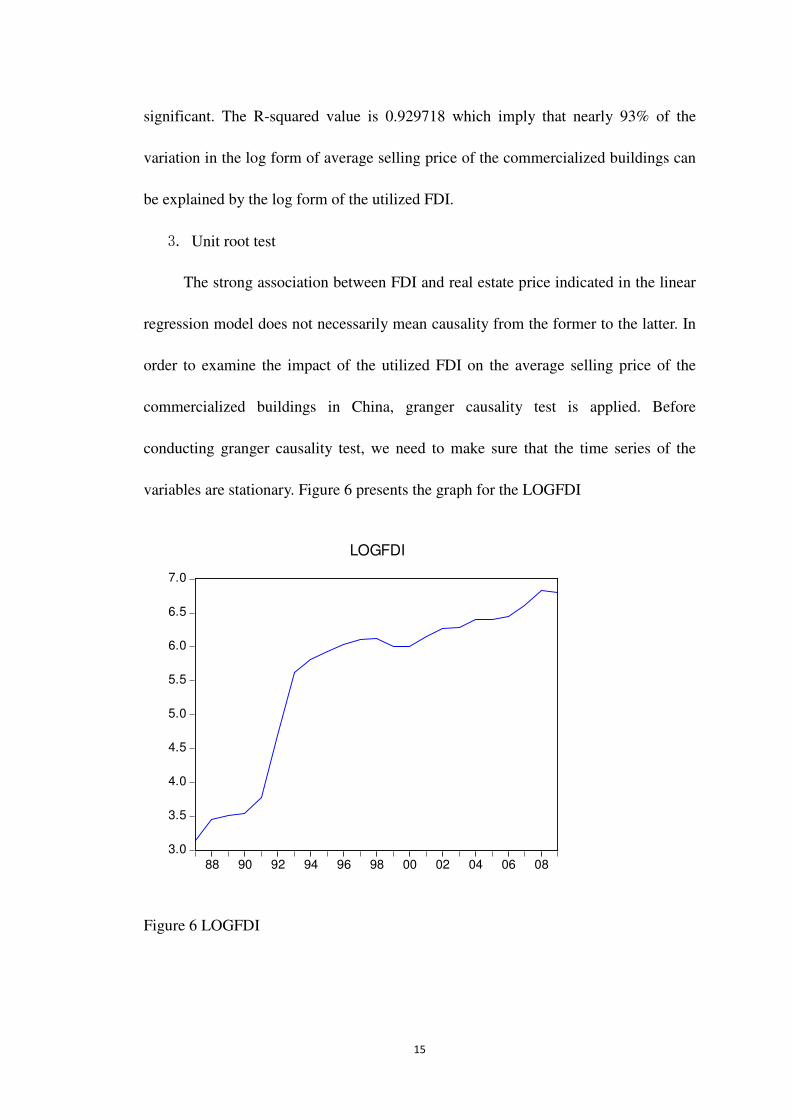
variables are stationary. Figure 6 presents the graph for the LOGFDI
Figure 6 LOGFDI
3.0
3.5
4.0
4.5
5.0
5.5
6.0
6.5
7.0
88 90 92 94 96 98 00 02 04 06 08
LOGFDI
16
From the plot of the LOGFDI we can identify that the time series has a trend.
There is a sharp increase in the LOGFDI between the periods of 1991 to1993, which
coincides with the fact that during these periods, several southern coastal cities in
China are fostering personal entrepreneurship and wholly-owned subsidiaries of
foreign companies to attract FDI inflows. Figure 7 presents the graph of the first
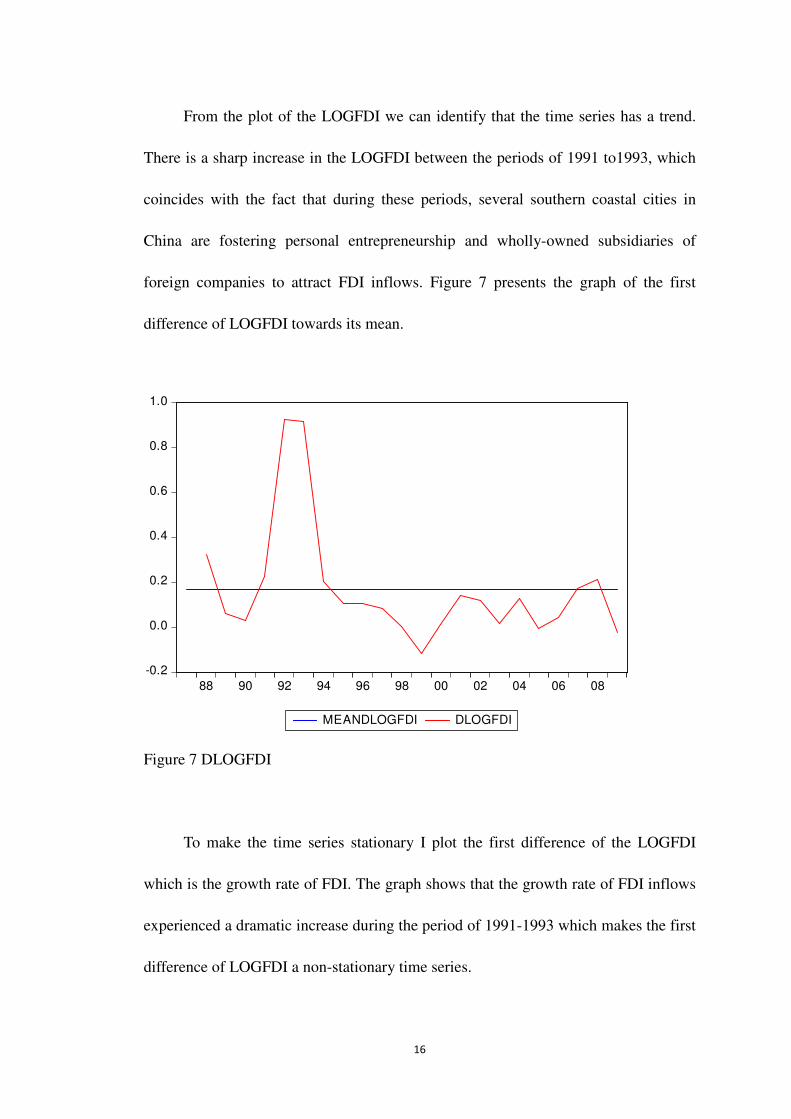
difference of LOGFDI towards its mean.
Figure 7 DLOGFDI
To make the time series stationary I plot the first difference of the LOGFDI
which is the growth rate of FDI. The graph shows that the growth rate of FDI inflows
experienced a dramatic increase during the period of 1991-1993 which makes the first
difference of LOGFDI a non-stationary time series.
-0.2
0.0
0.2
0.4
0.6
0.8
1.0
88 90 92 94 96 98 00 02 04 06 08
MEANDLOGFDI DLOGFDI
17
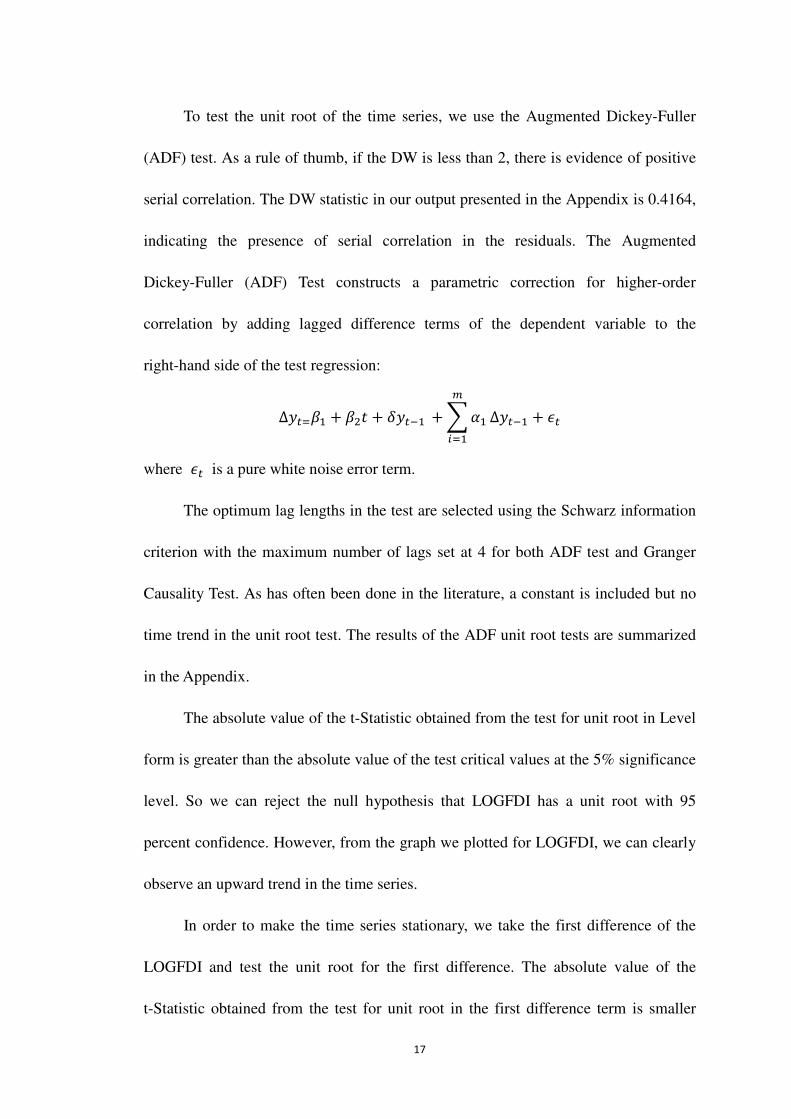
To test the unit root of the time series, we use the Augmented Dickey-Fuller
(ADF) test. As a rule of thumb, if the DW is less than 2, there is evidence of positive
serial correlation. The DW statistic in our output presented in the Appendix is 0.4164,
indicating the presence of serial correlation in the residuals. The Augmented
Dickey-Fuller (ADF) Test constructs a parametric correction for higher-order
correlation by adding lagged difference terms of the dependent variable to the
right-hand side of the test regression:
∆����� � ��� � ����� � � ���
���∆���� � �
where � is a pure white noise error term.
The optimum lag lengths in the test are selected using the Schwarz information
criterion with the maximum number of lags set at 4 for both ADF test and Granger
Causality Test. As has often been done in the literature, a constant is included but no
time trend in the unit root test. The results of the ADF unit root tests are summarized
in the Appendix.
The absolute value of the t-Statistic obtained from the test for unit root in Level
form is greater than the absolute value of the test critical values at the 5% significance
level. So we can reject the null hypothesis that LOGFDI has a unit root with 95
percent confidence. However, from the graph we plotted for LOGFDI, we can clearly
observe an upward trend in the time series.
In order to make the time series stationary, we take the first difference of the
LOGFDI and test the unit root for the first difference. The absolute value of the
t-Statistic obtained from the test for unit root in the first difference term is smaller
18
than the absolute value of the test critical values at the 10% significance level. So we
cannot reject the null hypothesis that D(LOGFDI) has a unit root.
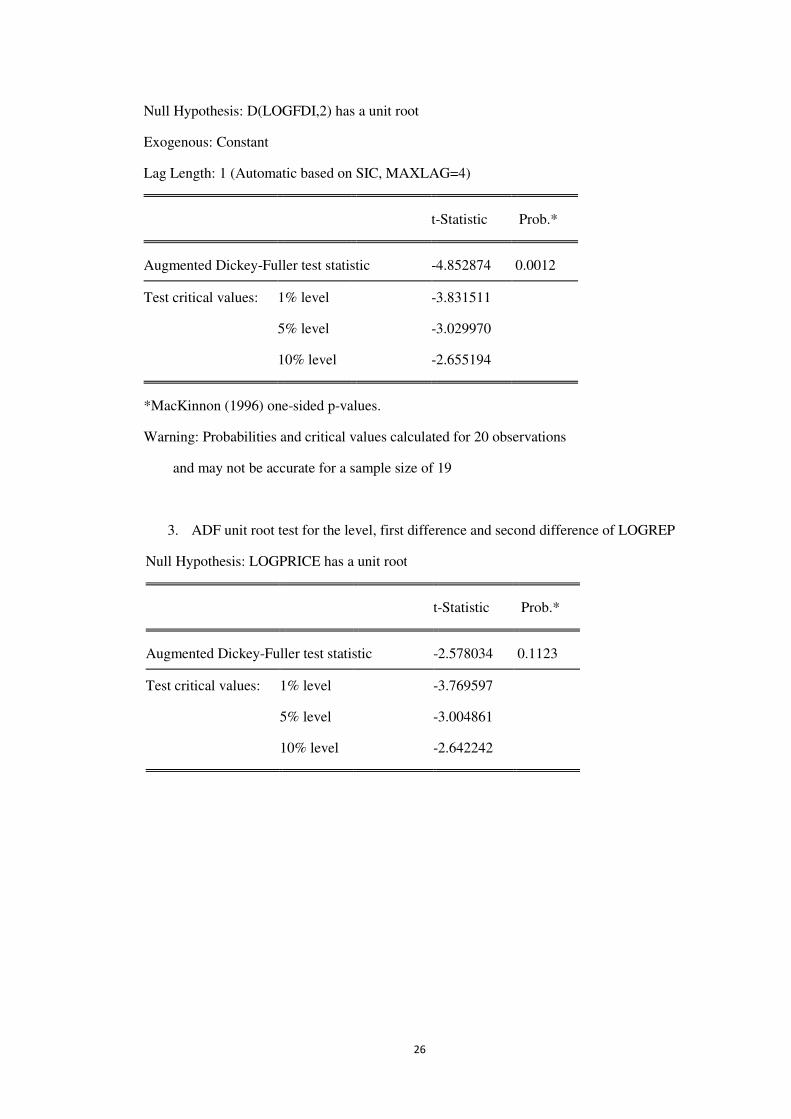
We take the second difference of the LOGFDI and find the absolute value of the
t-Statistic obtained from the test for unit root in second difference is greater than the
absolute value of the test critical values at the 5% significance level. So we can reject
the null hypothesis that D(LOGFDI,2) has a unit root. Therefore we can conclude
that the time series for LOGFDI is integrated of order 2.
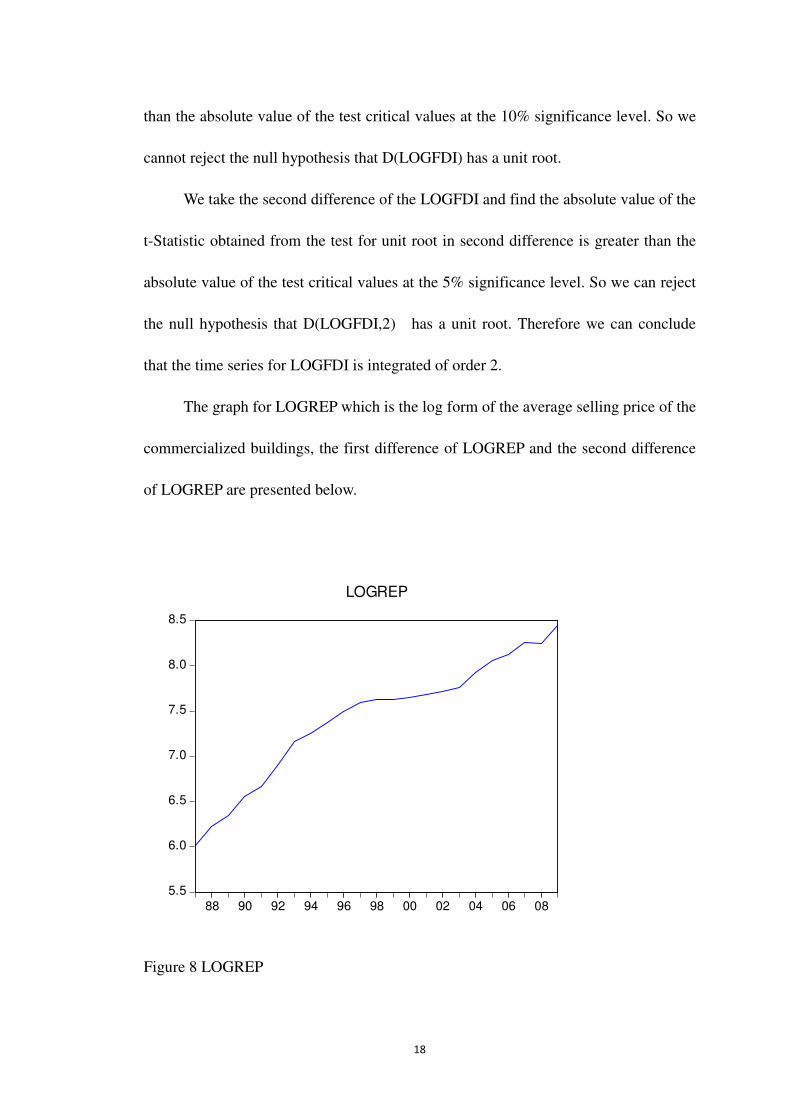
The graph for LOGREP which is the log form of the average selling price of the
commercialized buildings, the first difference of LOGREP and the second difference
of LOGREP are presented below.
Figure 8 LOGREP
5.5
6.0
6.5
7.0
7.5
8.0
8.5
88 90 92 94 96 98 00 02 04 06 08
LOGREP

19
Figure 9 DLOGREP
Figure 10 DDLOGREP
-.05
.00
.05
.10
.15
.20
.25
.30
88 90 92 94 96 98 00 02 04 06 08
DLOGREPMEAN DLOGREP
-.2
-.1
.0
.1
.2
.3
88 90 92 94 96 98 00 02 04 06 08
DDLOGREPMEAN DDLOGREP
20
From the three graphs presented above, we can see that the level form of
LOGREP has a upward trend and the time series is much stationary after the second
difference. The results of the ADF unit root tests are summarized in the Appendix.
The absolute value of the t-Statistic obtained from the test for unit root in Level
form is less than the absolute value of the test critical values at the 5% significance
level. So we can not reject the null hypothesis that LOGREP has a unit root.
The absolute value of the t-Statistic obtained from the test for unit root in the
first difference term is greater than the absolute value of the test critical values at the 5%
significance level. So we can reject the null hypothesis that D(LOGREP) has a unit
root with 95% confidence.
4. Granger causality test
In doing analysis of how the inflows of FDI would affect the real estate prices,
we would like to know whether changes in FDI variable will have an impact on
changes on the real estate price variable. The granger causality test assumes that the
information relevant to the prediction of the respective variables is contained in the
time series data on these variables.
To test for Granger causality, we first regress ∆Y on its lagged values. The
regressions are performed in terms of ∆Y rather than Y since the independent variable
in our case is not stationary. Once the set of significant lagged values for ∆Y is found,
the regression is augmented with lagged levels of ∆X. Any particular lagged value of
∆X is retained in the regression if it is significant according to t-test, and it and the
other lagged values of ∆X jointly add explanatory power to the model according to an
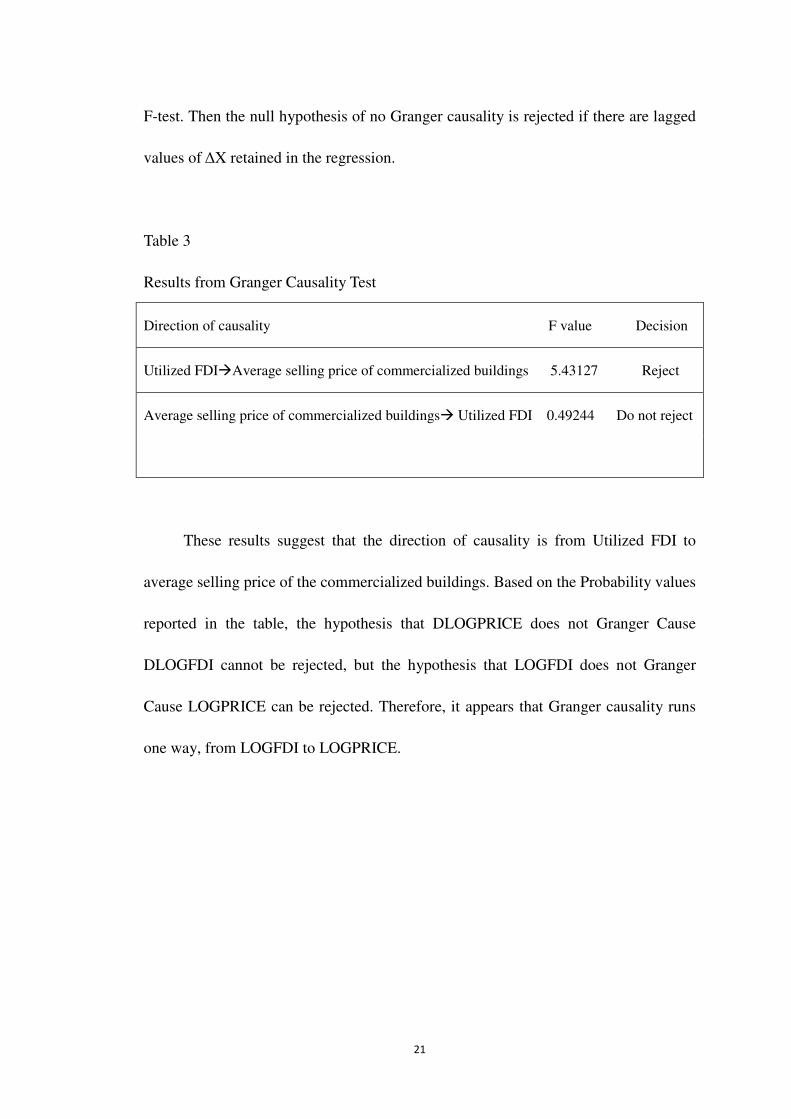
21
F-test. Then the null hypothesis of no Granger causality is rejected if there are lagged
values of ∆X retained in the regression.
Table 3
Results from Granger Causality Test
Direction of causality F value Decision
Utilized FDI�Average selling price of commercialized buildings 5.43127 Reject
Average selling price of commercialized buildings� Utilized FDI 0.49244 Do not reject
These results suggest that the direction of causality is from Utilized FDI to
average selling price of the commercialized buildings. Based on the Probability values
reported in the table, the hypothesis that DLOGPRICE does not Granger Cause
DLOGFDI cannot be rejected, but the hypothesis that LOGFDI does not Granger
Cause LOGPRICE can be rejected. Therefore, it appears that Granger causality runs
one way, from LOGFDI to LOGPRICE.

22
CHAPTER 5
Conclusion
The linear regression analysis and granger causality test verify our expectation
that the increase in the inflows of FDI contribute significantly to the increase in the
real estate prices. The main implication from our analysis is that various restrictions
need to be implemented to cool down the real estate industry due to overwhelming
amount of foreign direct investment. We should note that a series of regulations have
already been issued to encourage foreign direct investment to the manufacturing
industry, high-tech industries, modern service industry, new energy and energy-saving
environmental protection industry. During December 2007 the central government has
amended the foreign investment catalogue which divides the foreign investment
market to encouraged, restricted and prohibited industries. Prior to the recent
amendment, development of residential housing was an encouraged industry and
received governmental incentives. However, the new catalogue of 2007 removed the
development of residential housing from the encouraged industries and thus
complicated the approval process. Due to the guidance of the policy, FDI in real estate
sector remains at a steady level and the portion of the foreign direct investment in the
sources of funds of enterprises for real estate development has been below 5% in the
past 10 years and there is a decreasing trend of the percentage year by year.
Awareness of real estate market risks should be found at all levels of China's
central and local governments. Several control measures need to be introduced in
areas such as taxes, credit, land supply and housing construction.
23
REFERENCES
Bagchi-Sen, Sharmistha. (1995). FDI in U.S. producer services: a temporal analysis of
foreign direct investment in the finance, insurance and real estate sectors. Regional
Studies, 4/1/1995, p159, 12p; (AN 33863316)
Edward M. Graham& Erika Wada. Graham. (2001) Foreign Direct Investment in
China: Effects on Growth and Economic Performance. Institute for International
Economics Working Paper No. 01-03
Fariborz Moshirian, Toan Pham. (2000). Determinants of US Investment in Real
Estate Abroad. Journal of Multinational Financial Management, v. 10, iss. 1, pp.
63-72 AN: 0510
Guoqiang Long. (2005). China’s Policies on FDI: Review and Evaluation, Does
Foreign Direct Investment Promote Development? Institute for international
economics center for global development.
John Whalley, Xian Xin. (2010). China's FDI and non-FDI economies and the
sustainability of future high Chinese growth. China Economic Review, Elsevier, vol.
21(1), pages 123-135, March.
Lemoine, Francoise. (2000). FDI and Opening up the Chinese Economy. CEPII
Working Paper 2000-11, Paris: Centre d’Etudes Prospectives et d’Information
Internationale.
Lian, Lina, Haiying Ma. (2010). Revaluation of FDI on the Economy Development of
China: Is It an Entirely Unalloyed Benefit? International Journal of Business &
Management, Oct, Vol. 5 Issue 10, p184-190.
Stèphane Dees. Foreign Direct Investment in China: Determinants and Effects.
Economics of Planning, Volume 31, Numbers 2-3, 175-194, DOI:
10.1023/A:1003576930461
Wei, Shang Jin. (1996). Foreign Direct Investment in China: Sources and
Consequences. Financial Deregulation and Integration in East Asia. Chicago:
University of Chicago Press.

APPENDICES
24
APPENDICES
1. Linear regression model output
Dependent Variable: LOGPRICE
Method: Least Squares
Date: 04/11/11 Time: 23:17
Sample: 1987 2009
Included observations: 23
Variable Coefficient Std. Error t-Statistic Prob.
C 4.360012 0.187618 23.23876 0.0000
LOGFDI 0.550438 0.032986 16.68691 0.0000
R-squared 0.929872 Mean dependent var 7.423485
Adjusted R-squared 0.926533 S.D. dependent var 0.684569
S.E. of regression 0.185552 Akaike info criterion -0.448026
Sum squared resid 0.723017 Schwarz criterion -0.349288
Log likelihood 7.152304 Hannan-Quinn criter. -0.423194
F-statistic 278.4529 Durbin-Watson stat 0.415593
Prob(F-statistic) 0.000000

25
2. ADF unit root test for the level, first difference and second difference of LOGFDI
Null Hypothesis: LOGFDI has a unit root
Exogenous: Constant
Lag Length: 2 (Automatic based on SIC, MAXLAG=4)
t-Statistic Prob.*
Augmented Dickey-Fuller test statistic -3.072690 0.0452
Test critical values: 1% level -3.808546
5% level -3.020686
10% level -2.650413
*MacKinnon (1996) one-sided p-values.
Null Hypothesis: D(LOGFDI) has a unit root
Exogenous: Constant
Lag Length: 2 (Automatic based on SIC, MAXLAG=4)
t-Statistic Prob.*
Augmented Dickey-Fuller test statistic -1.668460 0.4303
Test critical values: 1% level -3.831511
5% level -3.029970
10% level -2.655194
*MacKinnon (1996) one-sided p-values.
Warning: Probabilities and critical values calculated for 20 observations
and may not be accurate for a sample size of 19
26
Null Hypothesis: D(LOGFDI,2) has a unit root
Exogenous: Constant
Lag Length: 1 (Automatic based on SIC, MAXLAG=4)
t-Statistic Prob.*
Augmented Dickey-Fuller test statistic -4.852874 0.0012
Test critical values: 1% level -3.831511
5% level -3.029970
10% level -2.655194
*MacKinnon (1996) one-sided p-values.
Warning: Probabilities and critical values calculated for 20 observations
and may not be accurate for a sample size of 19
3. ADF unit root test for the level, first difference and second difference of LOGREP
Null Hypothesis: LOGPRICE has a unit root
t-Statistic Prob.*
Augmented Dickey-Fuller test statistic -2.578034 0.1123
Test critical values: 1% level -3.769597
5% level -3.004861
10% level -2.642242
27
Null Hypothesis: D(LOGPRICE) has a unit root
t-Statistic Prob.*
Augmented Dickey-Fuller test statistic -3.242962 0.0315
Test critical values: 1% level -3.788030
5% level -3.012363
10% level -2.646119
Null Hypothesis: D(LOGREP,2) has a unit root
Exogenous: Constant
Lag Length: 0 (Automatic based on SIC, MAXLAG=4)
t-Statistic Prob.*
Augmented Dickey-Fuller test statistic -7.119286 0.0000
Test critical values: 1% level -3.808546
5% level -3.020686
10% level -2.650413
*MacKinnon (1996) one-sided p-values.
4. Table output for the granger causality test
Pairwise Granger Causality Tests
Sample 1987 2009
Lags: 4
Null Hypothesis: Obs F-Statistic Prob.
DLOGREP does not Granger Cause DLOGFDI 18 1.04296 0.4370
DLOGFDI does not Granger Cause DLOGREP 5.46623 0.0163
28
VITA
Graduate School
Southern Illinois University
Linlin Liu Date of Birth: June 30, 1986
714 E college street, Lot 12, Carbondale, Illinois 62901
4-3-1102 Chengfengyicui, No.59 Cui Jing Road, Xiangzhou district, Zhuhai,
Guangdong Province, P.R.China 519000
NANKAI University
Bachelor of Economics, June 2009
Research Paper Title: The Impact of Foreign Direct Investment on China: An
Empirical Analysis Based on the Chinese Real Estate Sector
Major Professor: DR. Scott Gilbert