does china have an impact on foreign direct investment to latin america? · does china have an...
TRANSCRIPT

DOES CHINA HAVE AN IMPACT ON FOREIGN DIRECT INVESTMENT TO
LATIN AMERICA?
Abstract
We analyze empirically whether the emergence of China as a large recipient of FDI has
affected the amount of FDI received by Latin American countries. Allowing for the
structural break related to China's WTO accession, we found a significant negative
impact of Chinese inward FDI on that of Mexico until 2001 and on that of Colombia after
that date. The rest of Latin American countries do not seem to be affected by Chinese
inward FDI. For the region as a whole, there is no significant Chinese effect on Latin
America’s FDI.
Keywords: China, Latin America, FDI
JEL classification: F21, F3
Alicia García-Herrero (a) and Daniel Santabárbara (b) (a) Bank of International Settlements (b) Banco de España
(*) Alicia García-Herrero is currently affiliated with the Bank of International Settlements and Daniel Santabárbarawith Banco de España. The opinions expressed are the authors' and not necessarily those of Banco de España orthe Bank of International Settlements. We would like to thank Enrique Martínez, Luis Molina, José ManuelMontero, Daniel Navia and Juan Ruiz for their clarifications on data and methodological issues. We are alsograteful for suggestions from participants to the First LAEBA Conference on the Challenges and Opportunities of the Emergence of China and to a Banco de España seminar, as well as Javier Vallés and two anonymous referees.Remaining errors are obviously our own. Authors maybe contacted at [email protected] and [email protected].

3
1 Introduction
The rapid emergence of China as an important player in the global economy is a
remarkable issue with consequences for the rest of the world. An important aspect is
foreign direct investment (FDI) since China has been attracting a growing share of FDI
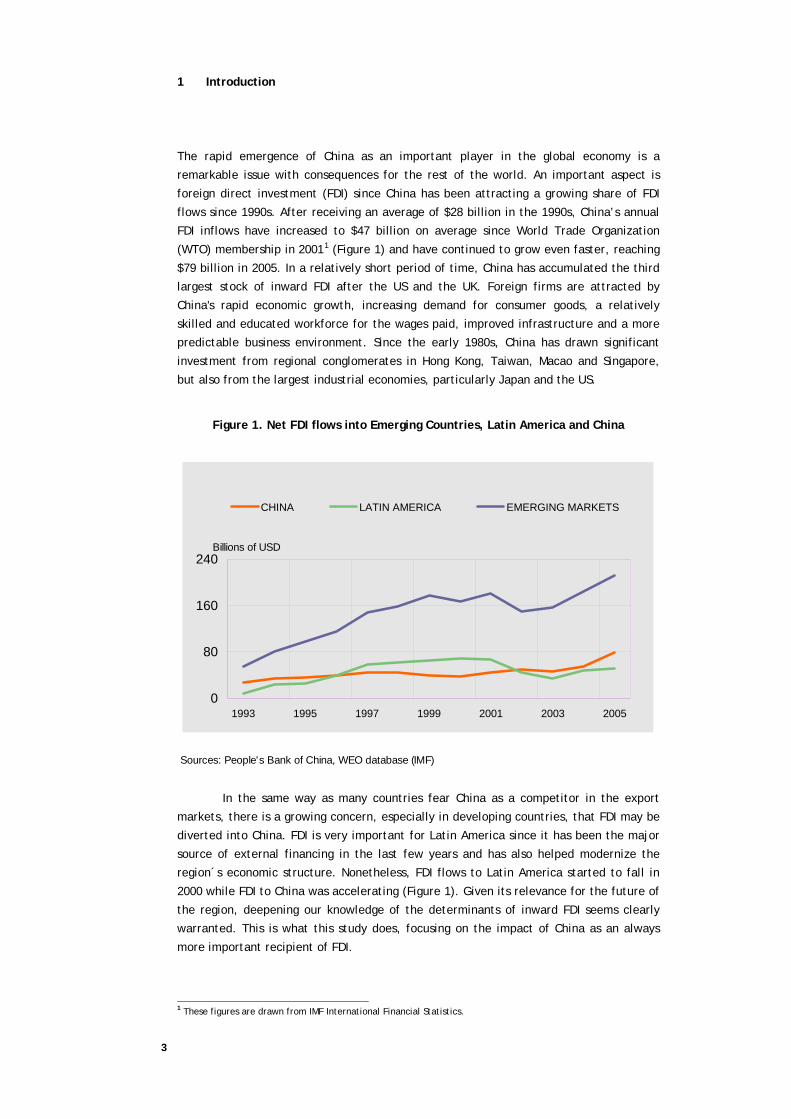
flows since 1990s. After receiving an average of $28 billion in the 1990s, China’s annual
FDI inflows have increased to $47 billion on average since World Trade Organization
(WTO) membership in 20011 (Figure 1) and have continued to grow even faster, reaching
$79 billion in 2005. In a relatively short period of time, China has accumulated the third
largest stock of inward FDI after the US and the UK. Foreign firms are attracted by
China's rapid economic growth, increasing demand for consumer goods, a relatively
skilled and educated workforce for the wages paid, improved infrastructure and a more
predictable business environment. Since the early 1980s, China has drawn significant
investment from regional conglomerates in Hong Kong, Taiwan, Macao and Singapore,
but also from the largest industrial economies, particularly Japan and the US.
Figure 1. Net FDI flows into Emerging Countries, Latin America and China
Sources: People's Bank of China, WEO database (IMF)
0
80
160
240
1993 1995 1997 1999 2001 2003 2005
CHINA LATIN AMERICA EMERGING MARKETS
Billions of USD
In the same way as many countries fear China as a competitor in the export
markets, there is a growing concern, especially in developing countries, that FDI may be
diverted into China. FDI is very important for Latin America since it has been the major
source of external financing in the last few years and has also helped modernize the
region´s economic structure. Nonetheless, FDI flows to Latin America started to fall in
2000 while FDI to China was accelerating (Figure 1). Given its relevance for the future of
the region, deepening our knowledge of the determinants of inward FDI seems clearly
warranted. This is what this study does, focusing on the impact of China as an always
more important recipient of FDI.
1 These figures are drawn from IMF International Financial Statistics.
4
Whether external financing is diverted from Latin American countries into China
will depend on a number of factors. A first one is the degree of integration of capital
markets. If capital markets are not fully integrated across countries –or, more likely,
regions– an increase in Chinese inward FDI will not necessarily imply a reduction in FDI to
another country or region. The large regional FDI flows in Asia may fit into this
description. In fact, Hong Kong, Taiwan, Macao and Singapore have been the main
suppliers of FDI to China while practically irrelevant for other parts of the world,
including Latin America.
A second aspect is the impact of Chinese inward FDI on worldwide FDI flows. If
foreign direct investors reap large benefits from their presence in this country, or there
are spillovers in other countries, more savings may be converted into FDI also in other
areas of the world. This would imply that the supply of FDI flows is elastic to changing
conditions. In the same vein, China’s contribution to raising the rate of return of FDI
could twist investors’ preference towards FDI instead of other private capital flows
(mainly portfolio or cross-border lending), particularly if their returns were hardly
correlated with those of FDI.
A third aspect is the nature of Chinese inward FDI. If oriented towards exports,
it might reduce FDI in other countries which compete in the same export markets. This
will be less so if FDI is oriented towards China’s domestic demand. In addition, if FDI
substantially increases Chinese imports, it might foster FDI to other countries which are
suppliers of Chinese imports. This will particularly be the case for exporters of
commodities, which China is scarce of.
It seems, thus, clear that the impact of Chinese inward FDI on Latin American
countries is an empirical question. There have been very few attempts in the literature
to address this issue. A first step –even if only descriptive– is found in a recent
publication by the IADB (2004). The report depicts the evolution of cumulative bilateral
FDI flows to Latin America and to China and calculates a coincidence index of FDI home
countries, which appears to be low. Chantasasawat et al. (2004) analyze empirically
whether China is taking FDI away from other Asian and Latin American countries. They
find that the level of Chinese inward FDI is positively related to other Asian economies’
inward FDI and that there is practically no impact on Latin American countries. They also
conduct their same exercise on the shares of FDI to total FDI flows where they do show a
negative Chinese effect on the Asian and Latin American shares.
In our paper, we continue with the empirical approach and go beyond
Chantasasawat et al. (2004) in a number of ways. First, we use bilateral (home-host)
data and not aggregate one. Bilateral data describes much better investor’s behaviour,
avoids a potential aggregation bias and limits collinearity problems.
Second, we not only estimate the impact of Chinese inward FDI on Latin
America as a whole, but also differentiate among countries since their productive
structure and the type of FDI they attract is very different. For instance, Mexico and
Central America have generally received export-oriented FDI while South America has
mainly attracted FDI into the non tradable sector (financial services and utilities), as
well as for the extraction of natural resources. We would, therefore, expect China to
have a negative impact of the first group of countries but not on the second. In the
latter case, it could even turn positive as China steps up its demand for commodities.
5
A third difference between Chantasasawat et al. (2004)’s approach and ours is
that they assume the supply of FDI to be inelastic. This is quite a restrictive assumption
for emerging countries, which have to compete for financing. We allow for the possibility
of an elastic supply of FDI by introducing other capital flows as an additional regressor.
In this way, we capture potential substitution or complementarities among flows.
Fourth, we take into account the adjustment cost of FDI, which is known to be relevant
for long-term (generally physical) investment, such as FDI. Fifth, we improve on the
econometric technique to take better account of endogeneity. We us the generalized
method of moments, instrumenting potentially endogenous variables with lags,
exogenous variables and other valid instruments, in order to obtain unbiased and
consistent estimators and as efficient as possible. Finally, we compare different time
spans, so as to assess whether China’s impact on other countries inward FDI is a recent
phenomenon, linked to the negotiations and final participation in the WTO, or began
already after China announced it would open up its economy at the end of the 1970s.
Our results show that there is virtually no “Chinese effect” on Latin American inward FDI
from 1993 to 2003. However, when we allow for a structure break coinciding with WTO
accession, Mexico and Colombia seem to be negatively affected prior to China's WTO
entry.
This paper is organized as follows: section 2 reviews the literature of FDI
determinants; section 3 describes the dataset, the variables included, their sources and
the expected relation with Latin American inward FDI; section 4 sets out our
econometric strategy and its advantages and caveats; section 5 reviews the results; and,
finally, section 6 draws the main conclusions and policy implications.
2 Determinants of FDI
A wealth of empirical literature has analyzed which are the main determinants of inward
FDI and very little consensus exists, except perhaps for the size of the host country’s
economy.2
For a long time, the general view was that the “better” a country, in terms of
its macroeconomic situation and institutional environment, the more easily it would
attract FDI. For example, Albuquerque et al. (2003) find that macroeconomic stability
increases FDI. Hines (1995) and Wei (1997) show that corruption discourages it, and the
same is true for poor business operating conditions (Singh and Jun, 1995) or the inability
to repatriate profits (Mody et al., 1998). In the same vein, a survey conducted to over
1000 chief executives of multinational enterprises concludes that macroeconomic and
political stability, as well as the regulatory environment and country size are keys for
foreign direct investors to decide where to establish themselves (AT Kerney, 2003).
Haussmann and Fernandez-Arias (2000), however, challenged the view showing
evidence that poor-performers, in terms of lower GDP per capita and more
macroeconomic stability, tend to attract more FDI. They also find that countries with
poorer institutions tend to attract more FDI as a share of total private capital flows.
2 Reviewing the reasons behind the lack of consensus is beyond the scope of this paper but two very important ones are the lack of reliable data (Singh and Jun, 1995) and the difference between horizontal and vertical FDI (Ewe-Ghee Lim, 2001).

6
Another variable for which there is clearly no consensus is human capital. While it
generally helps increase the marginal productivity of capital, this might not be the case
in low-skill labour intensive countries where FDI is mostly attracted by low salaries
(Chantasasawat et al., 2003).
More recently, the literature on the determinants of FDI has started using
gravity models, following the trade literature.3 In its simplest formulation, bilateral FDI
flows are set to depend negatively on the distance between countries and positively on
their size. Jaumotte (2004) and Love and Lage-Hidalgo (2000), among others, show
evidence that the host country’s total GDP and GDP per capita, respectively, help
receiving more FDI. In addition, openness to trade also appears to be a relevant
determinant of FDI (Singh and Jun, 1995; and Albuquerque et al., 2003) as well as as so-
called push factors (either from the investor country or global ones). Albuquerque et al.
(2003) report that push factors explain more than 50% of FDI developments. In the same
vein, Levy-Yeyati et al. (2002) show that the economic cycle in industrial countries is a
relevant determinant of FDI but the direction of influences changes for the US, Japan
and Europe.
Finally, another strand of the FDI literature has concentrated on the relation
between trade and FDI (Brainard, 1997). Some find evidence of a substitution effect
between the two while others argue in favour of complementarities. Substitution
implies, in principle, that a country stops exporting a certain good and starts producing
it in the destination country so as to avoid import or export tariffs. Complementarities
could exist if FDI is export-oriented and requires importing inputs from the home
country.
3 Variables and data issues
Our dependent variable is composed of real annual bilateral inward FDI flows from the
different OECD home countries towards the six largest host economies of Latin America,
expressed in millions of US dollars (2000 constant prices). These are Argentina, Brazil,
Chile, Colombia, Mexico and Venezuela (the full list of home and host countries is shown
in Table A-1). The reason to limit our analysis to these six countries is that they are the
major Latin American ones included in the only database available for bilateral FDI flows
for a large number of countries, namely the OECD’s International Direct Investment
Statistics.
We consider a time span from 1993 to 2003. The starting date reflects the time
in which China’s decided to transform its economy into a market based one through the
“open door policy” and coincides with the FDI boom worldwide. The final date is the last
available observation. This yields an unbalanced panel of 1903 observations of bilateral
FDI flows. Nonetheless, due to the missing values in the explanatory variables, this
model is estimated with a maximum of 915 observations.4
3 See Eaton and Tamura (1994) is one of the first examples. 4 This is the number of observations in the restricted model (after eliminating jointly non-significant parameters). In the general model the number of observations is lower, 844, because of the existence of missing values in the not-significant regressors.
7
Our variable of interest is the real bilateral inward FDI flows from different
OECD countries to China. If there were a substitution effect from Latin American inward
FDI towards China, the sign of this coefficient would be negative. The data is drawn from
the same OECD source, so that important suppliers of FDI to China are excluded, being in
the Asian region but outside the OECD. In reality, it is hard to think of a potential
competition between China and Latin America for FDI from Asian countries such as Hong
Kong, Macao, Taiwan or Singapore. In other words, for Asian non-OECD countries, there
does seem to be a fragmentation in the FDI market. Including these countries as FDI
providers could actually distort our results since the question we are interested in is
whether global foreign direct investors have reduced their FDI in Latin America because
of China. Moreover, as this Chinese effect could be different depending on the size of
the recipient country, we include the interaction between China’s inward FDI with the
host country’s GDP. In addition, since the foreign investors’ could change in the light of
China’s entrance in the WTO, we explore the possibility of a structural break in 2001.
Finally, we run a robustness test, by including bilateral inward FDI to Hong
Kong. This is to take into account the reinvesting takes place between the two
economies and is not adequately accounted for in the statistics. One of the most
apparent problems is round-tripping, starts with China’s exporting capital to Hong Kong,
to escape foreign exchange controls. This capital, then, returns to China in the form of
FDI. In addition, foreign direct investors might prefer to place their funds in Hong Kong
(with clearer rules for investor protection) although the funds are then redirected to
China.
More specifically, potentially relevant determinants of FDI can be classified
into: (i) capital flows, (ii) bilateral variables, (iii) host country factors, (iv) home country
variables and (v) global factors. The model estimated is the following:
, 1 , , 1
t , ,
,
capital flows bilateral factors host factors
home factors global factors
j j j ji t i China t i t
ji t i t
j jt t i t
FDI FDI FDI
ε
λ μ η γ
α β χ
δ φ
−= + + × + ×
+ × + × + ×
+ × + × +∑ ∑ ∑∑ ∑
(1)
i= host country (Latin America)
j= home country (OECD)
Where λ is a constant, jiμ represents the time invariant bilateral effect
between home-host FDI, 1η is the coefficient of –the Chinese FDI effect-, γ captures the
persistence of bilateral FDI flows, and , , , ,α β χ δ φ ,are the coefficients of the
different types of control variables as described in the previous section. Finally,
,j
i tε represents the error term.
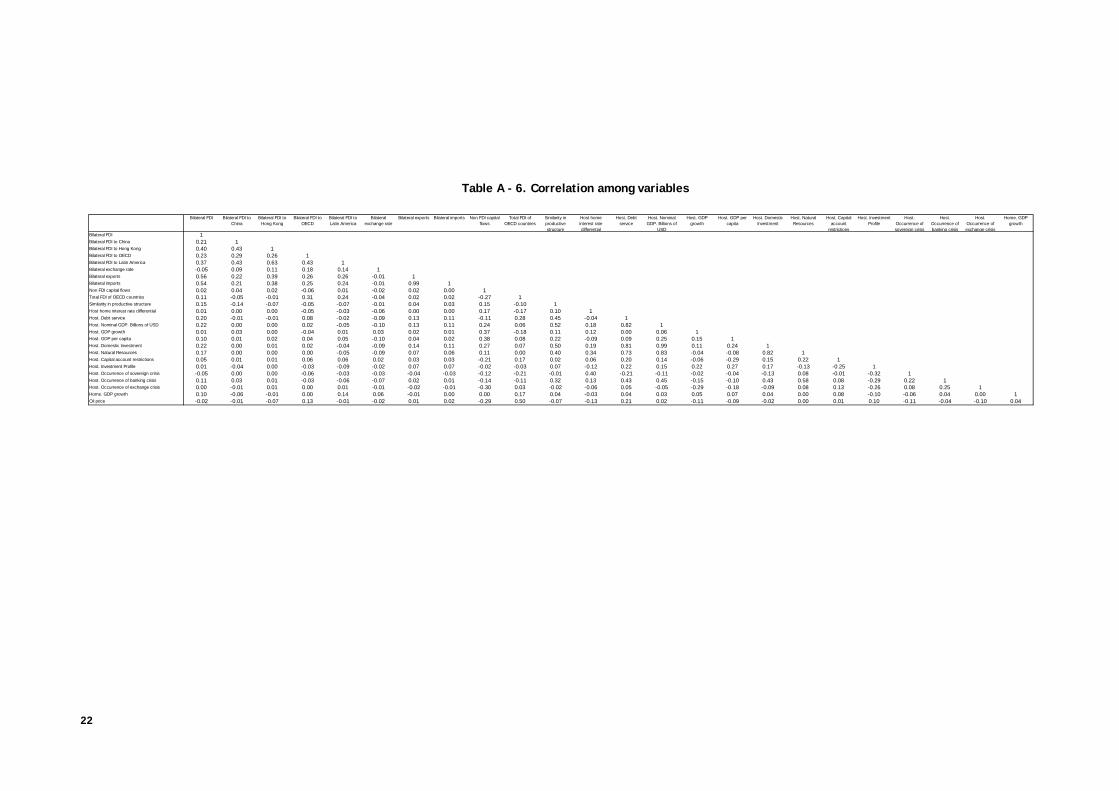
Given the large size of potential FDI determinants shown in the previous
section, we shall need to reduce the number of controls to those that are significant in
explaining Latin American inward FDI. To do so, we first introduce potentially relevant -
but not highly correlated- variables (as it is shown in Table A-6). We, then, test the joint
hypothesis that the coefficients of the variables that are not significant individually are
equal to zero.
We first consider developments in other capital flows (namely portfolio and
cross-border or non-FDI capital flows) in the host country so as to account for the
8
potential substitution between different types of investment. If such substitution
existed, the coefficient would have to be negative and significant. We use aggregate
data, since no bilateral one is available. The data is drawn from the IMF International
Financial Statistics (IFS). Second, we allow for the possible persistence of FDI flows since
investment requires time to adjust to desired levels. We do so by taking the lag of the
dependent variable. Third, we also consider the possibility that FDI decisions may be
taken at a regional level. In other words, if a country invests in, say, Chile, it could
encourage additional investment in other Latin American countries.5 Fourth, FDI to OECD
is introduced to test whether foreign direct investors prefer to be present only in
industrial countries, discouraging FDI to Latin America. Finally, we control for global
trends in FDI flows. The idea behind is that it should be easier for Latin American
countries to receive FDI in boom years. All these variables are drawn from the above-
mentioned OECD database.
As for bilateral factors, we include the bilateral nominal exchange rate because
it affects the cost of the investment –if paid in local currency– but also the value of
repatriated profits. A depreciation of the host country currency against the home
country one reduces the cost of the investment but also profits repatriated. The data is
drawn from the IFS; and an increase implies a depreciation of the host currency against
the home one. We add a measure of the relative investment cost, measured by the
difference in the short-term interest rate between the host and the home country, and
which is also drawn from the IFS. The coefficient of this variable should, in principle, be
negative but only if the investment is financed locally; otherwise it would be the home
interest rate or an international one to matter. In addition, we take bilateral exports
and imports from the IMF Direction of Trade Statistics. This allows us to control for the
potential sustituibility or complementarity between exports/imports and inward FDI.
Finally, we include an index of the similarity in the production structure between the
home and the host countries, based on two-digit manufactured value added data from
United Nations Industrial Development Organization (UNIDO).6 This variable should
indicate how similar their economies are and to what extent the may compete in third
markets.
There are a number of potentially relevant host factors. First, macroeconomic
conditions measured by GDP, GDP growth, GDP per capita, domestic investment and the
debt service. The first three should, in principle, bear a positive relation with inward FDI
while the last one, should be negatively related. All these variables are drawn from the
IFS and the World Bank World Development Indicators (WDI). Finally, due to the
restrictions imposed by the methodology used –only time variant variables can be
considered– only a few host country institutional characteristics are included, namely
capital account restrictions, drawn from Lane and Milesi-Ferretti (2004), the quality of
creditor rights from the International Country Risk Guide database, and the country’s
endowment of natural resources, drawn from Haussmann and Fernandez-Arias (2000).
5 To capture this effect while avoiding endogeneity problems, we build a control variable that includes the direct investment of each home country into the rest of Latin America. 6 The construction of this measure of economic similarity follows García-Herrero and Ruiz (2005). It is expressed as
, , , , , ,1
N
j i t n j t n i tn
S s s=
= − −∑
where N is the number of sectors. Note that
, ,i j tS represents the average of discrepancies in economic structures
in the period t. , ,i j tS might take values between 0 for identical structures and –2 for disjoint productive
structures. Therefore higher values for , ,i j tS imply more similarity between the host and home productive
structure.

9
The first should discourage capital flows, including FDI, and the last one should, in
principle, yield a positive effect. However, as for macroeconomic variables, there is no
strong consensus in the literature.
Other potentially relevant host country factors are financial crises. We include
one dummy variable for each type of crisis, sovereign, currency or banking, which take
the value of one in each year in which a country finds itself in a crisis. The variables are
drawn from Díaz-Cassou, García-Herrero and Molina (2006)7. While we should generally
expect crises to discourage foreign investors, it is also true that banking crises tend to be
followed by the opening up of the banking system to foreign competition, mainly through
privatization. This could attract FDI.
Home county effects are considered, such as home GDP growth from the IFS
database. Finally, we take developments in oil prices as the main global factor affecting
FDI. These are drawn from Datastream. Table A-2 gives additional details on data
sources and definitions. Table A-3 shows their descriptive statistics. Table A-6 shows a
matrix of bilateral correlations between all these regressors. None of the correlations is
high enough to lead to collinearity problems.8
4 Empirical methodology
The paper aims at assessing the most accurate way whether China’s inward FDI affects
that of Latin America. To that end, we face one major challenge: endogeneity.
Endogeneity could lead to a biased estimation of such impact. Other potential problems
are how to deal with the adjustment costs of FDI and unobserved heterogeneity. To
tackle potential endogeneity, but also the existence of adjustment costs and unobserved
heterogeneity, we use the Generalized Method of Moments (GMM), following Arellano
and Bover (1995).
The Arellano-Bover estimator –also called system GMM estimator– combines the
regression expressed in first differences (lagged values of the variables in levels are used
as instruments) with the original equation expressed in levels (this equation is
instrumented with lagged differences of the variables) and allows to include some
additional instrumental variables.
We prefer this option to a fixed-effects estimator for several reasons. First, it
also allows us to tackle into account unobserved time-invariant bilateral specific effects.
Second, we can deal with the potential endogeneity arising from the inclusion of the
lagged dependent variable (to capture the adjustment costs) and other potentially
endogenous variables.9. Third, it deals with the possibility that the dependent variable is
7 Since banking crises tend to extend over years, we construct two types of dummies, a first one which takes the value of one only when the crisis erupts and another which equals one during the years in which the crisis is ongoing (considered the benchmark case). 8 In addition, traditional collinearity tests (based on variance inflation factors) do not detect any major problems of collinearity. 9 In our model, we assume that endogenous variables are predefined, i.e., that are known at the beginning of the current time period. Thus, the lags of the endogenous variables and the exogenous variables are not related to the contemporaneous shocks -do not help to predict the current bilateral FDI- while they do affect the endogenous variables of the model. Then, we used as instruments the first lags of the predetermined variables and strictly exogenous variables of our model. Through the GMM procedure, we treat the following regressors as potentially endogeneous: bilateral FDI flows, to China or Latin America, other FDI flows, bilateral trade and bilateral nominal

10
not stationary. Finally, we achieve a high degree of efficiency by considering all possible
instruments.
However, there are several disadvantages with this approach. First, it is related
to the GMM estimator whose properties hold asymptotically. Then, it would be safer to
use this methodology with a very large number of observations, as could be the case.10
Anyway, as robustness test, we run all regressions as a fixed-effect panel with robust
standard errors. The results do not differ too much. Other disadvantage related to the
use of panel data methodology and it is that we cannot include time-invariant regressors
since their coefficients are hardly identifiable with this methodology. This does not
imply however that there is a problem of omitted variables since they are all included in
the time-invariant country-specific effects.
Finally, to choose the determinants of FDI, we need to strike a balance between
not losing heterogeneity and the choice of the control variables not to lose too many
degrees of freedom while avoid a missing variable problem. We tackle any potential
omitted variable problem by first estimating a general equation including all control
variables considered [columns (1), (3) of Tables A-4 and A-5]. We, then, test –through a
Wald test– the joint hypothesis that the coefficients of the variables that are not
significant individually are equal to zero. If not rejected, we re-estimate the model only
with the controls which were significant in the general regression. Otherwise, we test a
less restrictive hypothesis but still trying to reduce the number of regressors to the
maximum extent possible. This is a sequential –from general to specific11– strategy,
which we follow until we reject that the remaining set of coefficients of the control
variables is equal to zero [columns (2) and (4) of Tables A-4 and A-5 and Table 1 and 2].
In this way, we achieve more efficient coefficients of the remaining parameters,
including that of the variable of interest, Chinese inward FDI.
At in all, we have estimated four different models that combine the possibility
of an individual effect of Chinese FDI in each Latin America country and a structural
break in 2001. First, we deal with a general model with a common effect for Latin
America (Table A-4, Columns 1 and 2). Second, we allow for a different effect of Chinese
inward FDI across Latin American countries (Table A-4, Columns 3 and 4). Third, we
estimate a model with a structural break in 2001 with a common effect for Latin America
(Table A-5, Columns 1 and 2). Fourth, we jointly allow for a structural break and an
individual Latin America country effects (Table A-5, Columns 3 and 4).
5 Results
As previously described, we regress the six largest Latin American countries’ inward FDI
on bilateral FDI into China and control for the all aforementioned regressors in an
unrestricted model.
exchange rates. The Sargan Test for validity of instruments cannot be rejected in the restricted specifications considered 10 In any event, the small sample problem is less acute for the Arellano-Bover estimator than the Arellano-Bond one, since it has been shown to provide more accurate estimations in small samples (Bond, 2002). Additionally, this estimator does not require time stationarity as long as T is small, which seems to be our case. 11 See Campos et al. (2005) for details on the general to specific strategy.
11
We first concentrate on the impact of FDI into the Latin American region as a
whole for the complete sample: from 1993 to 2003. This captures developments shortly
after China started its market reforms until the most recent data. When all controls are
introduced, we find no evidence of a substitution effect for Latin American FDI because
of China (Table A-4, column 1). The same is true for Hong Kong inward FDI. When the
number of control variables is reduced to the relevant ones, the same result is obtained.
(Table 1 or Table A-4, column 2).
We, then, look into China´s impact on the inward FDI of each of the Latin
American countries considered. None of the Latin American countries are negatively
affected (Table A-4, column 4). In addition, we cannot reject the hypothesis that the
coefficients of each Latin American country are the same and equal to zero. At in all, we
can generally conclude that there is virtually no “Chinese effect” on Latin American
inward FDI in this time span.
Moving to other potential determinants of FDI into Latin America, we
concentrate on the restricted model since the estimators are more efficient. First, the
amount of bilateral exports also appears to foster FDI, which supports the hypothesis of
a complementarity –and not substitution– between FDI and trade. Second, a higher GDP
and GDP per capita in the host country foster inward FDI. This indicates that investors
expect better opportunities in larger and richer countries. Third, we tend to find a
substitution effect between FDI and other private capital flows since the coefficient for
non-FDI capital flows is negative and significant in most of regressions. This result
supports the hypothesis of an inelastic supply of FDI. Fourth, there is no clear “regional
behaviour” of investors, as FDI into a certain Latin American country from a given source
does not significantly affect bilateral FDI into Latin America from a given source does
not significantly affect bilateral FDI into Latin America. Fifth, as one would expect,
capital account restrictions and sovereign crisis dampen inward FDI. Sixth, and
interestingly, the occurrence of banking crises appears to foster FDI in all three
specifications. This causal link is probably not so much the banking crisis itself but rather
the privatization and opening-up to foreign competition which have followed these crises
in virtually all Latin American countries in our sample.12 Increase in oil prices reduces
FDI in a significant way. Finally, it should be noted that the fixed effects estimated for
each home-host pair are also picking up the information of the FDI determinants which
barely change over time. This could help to explain why they are not found significant13.
12 The fact that this result is only found for the dummy which considers all crisis years, and not only the burst of the crisis, supports this interpretation. 13 The bilateral nominal exchange rate, the debt service and GDP growth in the host country are only significant in the first specification with all regressors. The non-significance in the restricted model may be due to the increased number of observations and degrees of freedom.

12
Table 1. Results for 1993-2003 time span
Dependent variable: Bilateral real FDI (millions of 2000 USD)
Objetive variables Coefficient P-valueBilateral FDI to China -0.107 (0.306)Bilateral FDI to China * GDP host 0.000 (0.468)Bilateral FDI to Hong Kong 0.145 (0.103)Capital flowsLag of bilateral FDI over host GDP 0.029 (0.863)Non FDI capital flowsBilateral FDI to Latin America 0.028 (0.208)Bilateral FDI to OECD 0.002* (0.081)Total FDI of OECD countriesBilateral variablesBilateral exports 0.059*** (0.000)Host country variablesNominal GDP 0.002** (0.032)GDP growth 1,032.421** (0.011)Domestic Investment -0.007 (0.127)Debt serviceCapital account restrictions -104.653* (0.060)Occurrence of sovereign crisis -80.531* (0.062)Occurrence of banking crisis 144.394*** (0.001)Home country variablesHome. GDP growth 1,743.275** (0.038)Global shocksOil price -11.094* (0.052)Constant 83.007 (0.501)ObservationsNumber of group(home host)Hansen testArellano-Bond test for AR(1) in first differencesArellano-Bond test for AR(2) in first differencesRobust p values in parentheses* significant at 10%; ** significant at 5%; *** significant at 1%Variables in italics are instrumented through the GMM procedure following Arellano and Bover (1995)
(1)Common impact - restricted model
(0.019)(0.096)
884140
(0.840)
In a second set of exercises, we take into account the possibility of a change in
the behaviour of investors since 2001, when China entered into the WTO. That means
that we allow objective variables (Chinese bilateral inward FDI) to differ before and
after 2001. Although not significant, we do find a higher negative effect of Chinese
inward FDI on that to Latin America after 2001 (Table 2, column 1 and Table A-5, column
1 and 2). When analyzing the impact country by country, Mexico and Colombia are
negatively affected by a reduction in Chinese inward FDI in a significant way although in
different time spans. In Mexico, the negative impact happened before 2001 and in
Colombia only thereafter (Table 2, column 2). These results can be interpreted in the
following way: when Chinese inward FDI increases by $100 million, Mexican FDI is
reduced by $20 million, and, after 2001, Colombian FDI by $29 million. This result is
particularly interesting in the case of Mexico since its free trade agreement with the US
(NAFTA) was in place during the most of the time span and inward FDI generally
increased. In fact, it only fell 2002. This does not imply, however, that China had no
effect. Our results should be read in terms of a counterfactual: Had Chinese inward FDI
not been so strong, Mexico could have attracted more FDI than it actually did. Finally, if
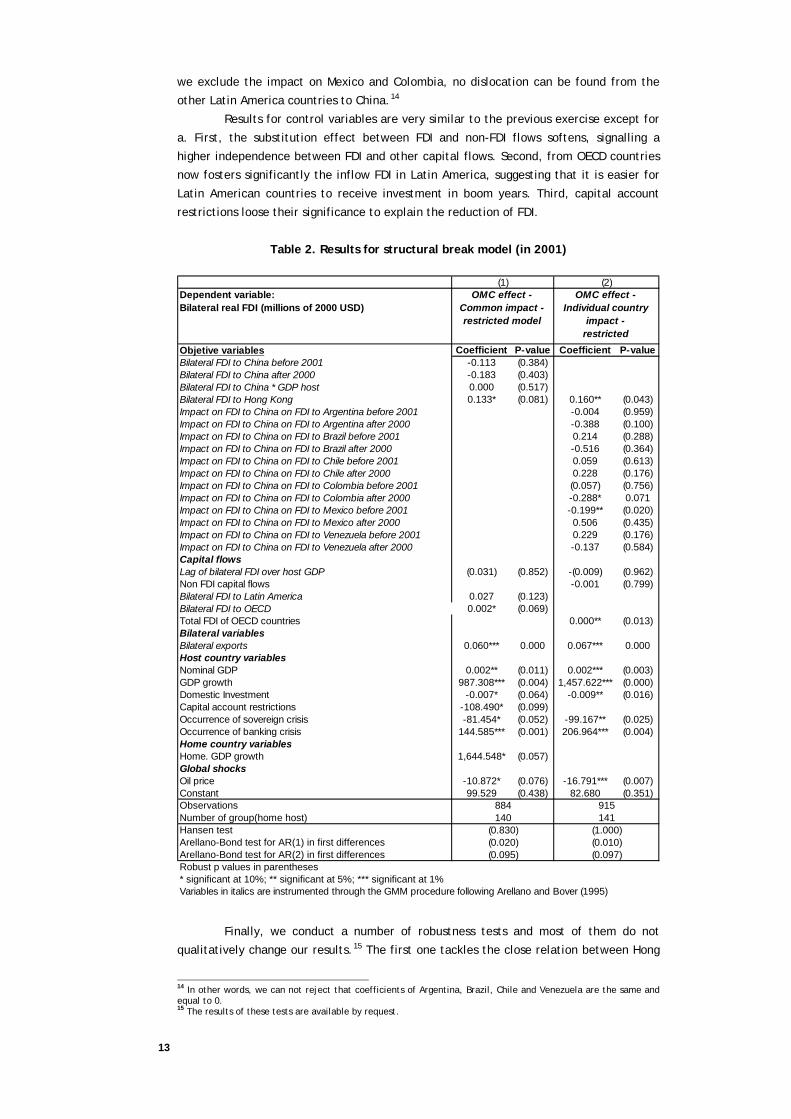
13
we exclude the impact on Mexico and Colombia, no dislocation can be found from the
other Latin America countries to China.14
Results for control variables are very similar to the previous exercise except for
a. First, the substitution effect between FDI and non-FDI flows softens, signalling a
higher independence between FDI and other capital flows. Second, from OECD countries
now fosters significantly the inflow FDI in Latin America, suggesting that it is easier for
Latin American countries to receive investment in boom years. Third, capital account
restrictions loose their significance to explain the reduction of FDI.
Table 2. Results for structural break model (in 2001)
Dependent variable: Bilateral real FDI (millions of 2000 USD)
Objetive variables Coefficient P-value Coefficient P-valueBilateral FDI to China before 2001 -0.113 (0.384)Bilateral FDI to China after 2000 -0.183 (0.403)Bilateral FDI to China * GDP host 0.000 (0.517)Bilateral FDI to Hong Kong 0.133* (0.081) 0.160** (0.043)Impact on FDI to China on FDI to Argentina before 2001 -0.004 (0.959)Impact on FDI to China on FDI to Argentina after 2000 -0.388 (0.100)Impact on FDI to China on FDI to Brazil before 2001 0.214 (0.288)Impact on FDI to China on FDI to Brazil after 2000 -0.516 (0.364)Impact on FDI to China on FDI to Chile before 2001 0.059 (0.613)Impact on FDI to China on FDI to Chile after 2000 0.228 (0.176)Impact on FDI to China on FDI to Colombia before 2001 (0.057) (0.756)Impact on FDI to China on FDI to Colombia after 2000 -0.288* 0.071Impact on FDI to China on FDI to Mexico before 2001 -0.199** (0.020)Impact on FDI to China on FDI to Mexico after 2000 0.506 (0.435)Impact on FDI to China on FDI to Venezuela before 2001 0.229 (0.176)Impact on FDI to China on FDI to Venezuela after 2000 -0.137 (0.584)Capital flowsLag of bilateral FDI over host GDP (0.031) (0.852) -(0.009) (0.962)Non FDI capital flows -0.001 (0.799)Bilateral FDI to Latin America 0.027 (0.123)Bilateral FDI to OECD 0.002* (0.069)Total FDI of OECD countries 0.000** (0.013)Bilateral variablesBilateral exports 0.060*** 0.000 0.067*** 0.000Host country variablesNominal GDP 0.002** (0.011) 0.002*** (0.003)GDP growth 987.308*** (0.004) 1,457.622*** (0.000)Domestic Investment -0.007* (0.064) -0.009** (0.016)Capital account restrictions -108.490* (0.099)Occurrence of sovereign crisis -81.454* (0.052) -99.167** (0.025)Occurrence of banking crisis 144.585*** (0.001) 206.964*** (0.004)Home country variablesHome. GDP growth 1,644.548* (0.057)Global shocksOil price -10.872* (0.076) -16.791*** (0.007)Constant 99.529 (0.438) 82.680 (0.351)ObservationsNumber of group(home host)Hansen testArellano-Bond test for AR(1) in first differencesArellano-Bond test for AR(2) in first differencesRobust p values in parentheses* significant at 10%; ** significant at 5%; *** significant at 1%Variables in italics are instrumented through the GMM procedure following Arellano and Bover (1995)
140 141
(1) (2)OMC effect -
Common impact - restricted model
OMC effect - Individual country
impact - restricted
884 915
(0.095) (0.097)
(0.830) (1.000)(0.020) (0.010)
Finally, we conduct a number of robustness tests and most of them do not
qualitatively change our results.15 The first one tackles the close relation between Hong
14 In other words, we can not reject that coefficients of Argentina, Brazil, Chile and Venezuela are the same and equal to 0. 15 The results of these tests are available by request.
14
Kong’s and Chinese inward FDI by taking the sum of FDI to China and Hong Kong. Second,
we test the extreme hypothesis of complete substitution from Latin American inward FDI
to that of China and it is rejected. Third, we run the regressions for the longest time
span possible, 1980-2003. Fourth, we do not consider the potential endogeneity
problems and we estimate all models using the fixed effects estimator.
6 Conclusions
In this paper we investigate how Chinese inward FDI affects FDI flows to Latin American
countries. When taking into account the structural break which occurred with China's
WTO entry in 2001, we do find evidence of FDI dislocation from Latin American countries
to China. More specifically, we report a significant negative impact of Chinese inward
FDI on that of Mexico until 2001 and on that of Colombia thereafter. Finally, the rest of
Latin America countries are not affected. In addition, no effect is found for the whole
sample period. All in all, Latin America’s inward FDI seems to be only marginally -if at
all- affected by China.
The more worrisome results from Mexico and Colombia, suggest that competing
in the same sectors as China increases the likelihood of a substitution of FDI. Having a
cursory look a the sector structure of FDI in Mexico and Colombia, we find that
manufacturing accounts for 56% of total in the case of Mexico (the largest of all sectors)
and 21% in the case of Colombia (the largest after financial services). By contrast, Brazil
has a much smaller share of FDI in manufacturing (about 10%) while most of it
concentrates on telecommunications and financial services.16 In any event, this
interpretation of the results should be taken with care since we do not have enough
evidence that this is the main channel through which China affects Latin American FDI.
To that end, we would need bilateral and sectoral FDI data, which are not available.
When looking into the future, there are reasons to expect that China will
continue to receive large amounts of FDI, and perhaps even increase them: the country
has embarked in a large privatization process, which has already been announced for
some sectors. In addition, the wage differential with Latin American countries will
probably be maintained for quite some time given China’s large –for some close to
infinite– elasticity of labour supply. Finally, even if wages increase substantially,
purchasing power for a very large population would also do. This will make China a
particularly attractive country for FDI targeting domestic demand.
This scenario, where China continues to attract a large share of world FDI, may
seem worrisome for Latin American countries, particularly those with a more similar
productive structure to that of China. However, it only reflects one side of the coin. At
the same time, it provides tremendous opportunities in the medium term. Due to
geographical and technological reasons, Latin American countries are not in such good
position as Asian economies to profit from China's manufacturing needs.. However, they
will clearly benefit from China’s increasing demand for raw materials in a scenario where
China continues to grow fast. This is not only true for Latin American exports but also for
16 This has been estimated using FDI flows from the three main investors to Brazil, namely the US, Spain and Japan. Unfortunately, we cannot compare Mexico and Colombia with the other Latin American countries included in our analysis since we could not find sectoral information.

15
inward FDI in sectors related to raw materials. Interestingly, potential investors in the
region are not only OECD countries, but also China, which will want to ensure its access
to raw material. This is why the further opening of these sectors to foreign investors is
an important condition for Latin American countries to reap these benefits of China’s
increasing global presence.
16
REFERENCES
ALBUQUERQUE, R., N. LOAYZA AND L. SERVÉN (2003), “World Market Integration through the Lens of Foreign Direct Investors”, Policy Research Working Paper Series 3060, The World Bank, Washington DC.
ARELLANO, M., AND O. BOVER (1995), “Another Look at the Instrumental-Variable Estimation of Error-Components Models”, Journal of Econometrics, Vol. 68, pp. 29-52
AT KEARNEY (2003), FDI Confidence Index Reports, 1997-2002. Available at: http://www.atkearney.com
BOND, S. (2002), “Dynamic Panel Data Models: A Guide to Micro Data Methods and Practice”, Working Paper 09/02, Institute for Fiscal Studies, London.
BRAINARD, L. (1997). “An Empirical Assessment of the Proximity-Concentration Trade-off between Multinational Sales and Trade”, American Economic Review, 87 (4), pp. 520-544.
CAMPOS, J., N. R. ERICSSON, AND D. F. HENDRY, "General-to-Specific Modeling: An Overview and Selected Bibliography" (August 2005). FRB International Finance Discussion Paper No. 838.
CHANTASASAWAT, B., K.C. FUNG, H. IIZAKA AND SIU (2003), “International Competition for Foreign Direct Investment: The Case of China”, Paper presented at the Hitotsubashi Conference on International Trade and FDI, Tokyo
CHANTASASAWAT, B., FUNG, IIZAKA AND A. SIU (2004), “Foreign Direct Investment in East Asia and Latin America: Is there a People’s Republic of China Effect?”, ADB Institute Discussion Paper N.º 17, Tokyo
DÍAZ-CASSOU, J, A. GARCÍA-HERRERO AND J. L. MOLINA (2006), “What kind of capital flows does the IMF catalyze and when?”, Documento de Trabajo 0617, Banco de España, Madrid.
EATON, J. AND A. TAMURA (1994), “Bilateralism and Regionalism in Japanese and US trade and Direct Foreign Investment Patterns”, Journal of the Japenese and International Economies 8:478-510.
EWE GHEE L. (2001), Determinants of, and the Relation Between, Foreign Direct Investment and Growth: A Summary of the Recent Literature, IMF Working Paper WP/01/175.
GARCÍA-HERRERO, A. AND J. RUIZ (2005), “How Much do Trade and Financial Linkages Matter for Business Cycle Synchronization?”, mimeo, Available at: www.eco.uc3m.es/jruiz/TFSynchronization.pdf.
HAUSSMANN, R. and E. Fernandez-Arias (2000), "Foreign Direct Investment: Good Cholesterol?". IADB, Research Department Working Paper No. 417. Available at SSRN: http://ssrn.com/abstract=252192
HINES, J. R. (1995), “Forbidden Payment: Foreign Bribery and American Business after 1977”, NBER Working Paper 5266.
INTER-AMERICAN DEVELOPMENT BANK (IDB) (2004), “The Emergence of China: Opportunities And Challenges For Latin America And The Caribbean”, draft for discussion, October Available at: http://www.iadb.org/ ,
JAUMOTTE, F. (2004), “Foreign Direct Investment and Regional Trade Agreements: The Market Size Effect Revisited”, Working Paper Nº 04/206, IMF, Washington DC.
LANE, P. R. AND G. M. MILESI-FERRETTI (2004), “Financial Globalization and Exchange Rates”, mimeo, IMF, Washington DC.
LEVY-YEYATI, E., E. PANIZZA AND U. STEIN (2002), “The Cyclical Nature of North-South FDI Flows”, paper presented at the Joint Conference of IDB-WB, The FDI Race: Who Gets the Prize? Is it Worth the Effort?
LOVE, J. H., AND F. LAGE-HIDALGO (2000), “Analysing the Determinants of US Direct Investment in Mexico”, Applied Economics, 32, pp. 1259-1267.
MODY, A., S. DASGUPTA AND S. SINHA (1998), “Japanese Multinationals in Asia: Drivers and Attractors”, Oxford Development Studies, Vol. 27, Nº 2, pp. 149-164.
SINGH, H., AND K. JUN (1995), “Some New Evidence on Determinants of Foreign Direct Investment in Developing Countries”, World Bank Policy Research Working Paper Nº 2338, Washington DC.
WEI, S. (1997), “Why is Corruption So Much More Taxing Than Taxes? Arbitrariness Kills”, National Bureau of Economic Research Working Paper 6255.

17
Appendix: List of Tables
Table A - 1. List of countries considered
Home country Host country Additional
countries or areas
Australia Argentina China
Austria Brazil Hong Kong
Belgium Chile Latin America
Czech Republic Colombia OECD
Denmark Mexico World
Finland Venezuela
France
Germany
Greece
Hungary
Iceland
Italy
Japan
Korea
Mexico
Netherlands
New Zealand
Norway
Poland
Portugal
Slovak Republic
Spain
Sweden
Switzerland
Turkey
United Kingdom
United States

18
Table A - 2. Variables and data sources
Variable type Name Description Units Source
Dependent variable Bilateral FDI Bilateral FDI Millions of USD (constant prices 2000) OECD
Objetive variable Bilateral FDI to China Level of FDI flows of each home country in China Millions of USD (constant prices 2000) OECD
Objetive variable Bilateral FDI to Hong Kong Level of FDI flows of each home country in Hong Kong Millions of USD (constant prices 2000) OECD
Capital flows Non FDI capital flows Portfolio and other investment inflows in host country Millions of USD (constant prices 2000) IFS, IMF
Capital flows Bilateral FDI to Latin America FDI flows of each home country in the six Latin American countries included except host country Millions of USD (constant prices 2000) OECD
Capital flows Bilateral FDI to OECD Level of FDI flows of each home country in OECD Millions of USD (constant prices 2000) OECD
Capital flows Total FDI of OECD countries FDI of all OECD's countries in the world Millions of USD (constant prices 2000) OECD
Bilateral Bilateral exchange rate Bilateral exchange rate. Increase implies depreciation in home currency Host per home currency IFS, IMF
Bilateral Bilateral exports Bilateral Export flows Millions of USD (constant prices 2000) Direction of Trade Statistics, IMF
Bilateral Bilateral imports Bilateral Import flows Millions of USD (constant prices 2000) Direction of Trade Statistics, IMF
Bilateral Similarity in productive structure Index UNIDO
Bilateral Host home interest rate differential Host home differential in short term interest rates Percentage IFS, IMF
Host GDP Gross domestic product Millions of USD (constant prices 2000) WEO, IMF
Host GDP growth Real GDP annual growth rate Percentage IFS, IMF
Host GDP per capita Gross domestic product per capita, constant prices US dollars (constant prices 2000) WEO, IMF
Host Domestic Investment National Accounts. Investment Millions of USD (constant prices 2000) IFS, IMF
Host Debt service Interest expenditures plus amortizations Millions of USD (constant prices 2000) World Bank
Host Capital account restrictions Dummy. 1 if the country had capital account restrictions Dummy Milesi-Ferretti (1998)
Host Investment Profile Contract Viability, Profits Repatriation, Payment Delays Index PRS Group
Host Natural Resources Natural resources valuation Millions of USD (PPP) Haussmann and Fernandez Arias (2000)
Host Occurrence of sovereign crisis Dummy. 1 if the country has been under default in that year. Dummy
Diaz-Cassou, García-Herrero and Molina
(2006)
Host Occurrence of banking crisis Dummy. 1 if the country has undergone a banking crisis in a certain year. Dummy
Diaz-Cassou, García-Herrero and Molina
(2006)
Host Occurrence of exchange crisis Dummy. 1 if the country has undergone a currency crisis in a certain year. Dummy
Diaz-Cassou, García-Herrero and Molina
(2006)
Home Home. GDP growth Real GDP annual growth rate Percentage IFS, IMF
Global Oil price Brent Crude Current Month, fob USD per barrel Datastream

19
Table A - 3. Descriptive statistics
Name obs mean sd min p 1% p 99% maxBilateral FDI 1137 284 1099 -1470 -612 4963 16633Bilateral FDI to China 1306 303 677 -409 -235 2883 4985Bilateral FDI to Hong Kong 1252 238 842 -5009 -668 4544 4922Bilateral FDI to OECD 1606 18951 34348 -3028 -722 192470 232390Bilateral FDI to Latin America 1092 2067 4341 -7611 -2435 18811 36853Bilateral exchange rate 1903 288 2420 0 0 3311 86307Bilateral exports 1875 990 6225 0 0 11910 108751Bilateral imports 1875 1151 7988 0 0 14901 135080Non FDI capital flows 1903 3706 9917 -14923 -14923 37308 37308Total FDI of OECD countries 1903 567297 302590 255214 255214 1227067 1227067Similarity in productive structure 1823 -0.59 0.22 -1.20 -1.10 -0.17 -0.14Host home interest rate differential 1823 1.27 6.84 -0.86 -0.27 48.13 48.18Host. Debt service 1903 18375 18142 2819 2819 71069 71069Host. Nominal GDP 1903 260310 223184 47694 47694 808045 808045Host. GDP growth 1903 0.02 0.04 -0.11 -0.11 0.11 0.11Host. GDP per capita 1903 4519 1882 1735 1735 8831 8831Host. Domestic Investment 1903 54585 48219 8259 8259 173709 173709Host. Natural Resources 1903 904 590 383 383 2093 2093Host. Capital account restrictions 1903 0.91 0.29 0 0 1 1Host. Investment Profile 1903 6.85 2.01 3.00 3 11.5 11.5Host. Occurrence of sovereign crisis 1903 0.15 0.36 0 0 1 1Host. Occurrence of banking crisis 1903 0.27 0.45 0 0 1 1Host. Occurrence of exchange crisis 1903 0.14 0.34 0 0 1 1Home. GDP growth 1903 0.03 0.03 -0.1 -0.1 0.1 0.1Oil price 1903 22.4 5.8 12.8 12.8 35.4 35.4

20
Table A – 4. Detailed results for 1993-2003 time span
(1) (2) (3) (4)Dependent variable: Bilateral real FDI (millions of 2000 USD)
Common impact -unrestricted model
Common impact - restricted model
Individual country impact -
unrestricted
Individual country impact -
restricted
Objetive variablesLatin America as whole
-0.078 -0.107(0.366) (0.306)0.000 0.000(0.503) (0.468)0.131 0.145 0.121 0.132(0.114) (0.103) (0.130) (0.125)
Country specific-0.098 -0.095(0.146) (0.110)0.047 -0.009(0.674) (0.934)-0.001 -0.003(0.989) (0.966)-0.279 -0.125(0.116) (0.528)-0.042 -0.031(0.786) (0.817)0.370* 0.138(0.072) (0.399)
Control variablesCapital flows
0.050 0.029 0.070 0.052(0.766) (0.863) (0.668) (0.766)
-0.009*** -0.009*** -0.005**(0.002) (0.002) (0.033)0.022 0.028 0.018 0.027(0.203) (0.208) (0.276) (0.229)0.002 0.002* 0.001 0.001(0.141) (0.081) (0.176) (0.162)0.000 0.000 0.000(0.263) (0.163) (0.191)
Bilateral variables0.013 0.028(0.845) (0.713)0.117* 0.059*** 0.132** 0.061***(0.055) (0.000) (0.035) (0.000)-0.043 -0.054(0.414) (0.311)20.238 84.536(0.891) (0.564)-0.579 2.072(0.803) (0.412)
Host country variables Macroeconomic factors
0.003** 0.002** 0.004*** 0.003**(0.038) (0.032) (0.010) (0.014)
1,665.245*** 1,032.421** 1,956.568*** 1,724.096***(0.002) (0.011) (0.001) (0.000)0.021 0.008(0.249) (0.690)-0.008 -0.007 -0.012** -0.008(0.101) (0.127) (0.021) (0.119)-0.009 -0.010 -0.007(0.102) (0.112) (0.180)
Institutional characteristics-134.262 -104.653* -123.377* -113.266**(0.107) (0.060) (0.093) (0.038)4.748 3.585(0.824) (0.866)0.195** 0.065(0.029) (0.441)
Ocurrence of Crisis-139.721** -80.531* -170.952** -146.861***
(0.041) (0.062) (0.012) (0.003)152.950*** 144.394*** 165.843*** 162.287***
(0.003) (0.001) (0.005) (0.008)-53.795 -69.393(0.427) (0.285)
Home country variables1063.965 1,743.275** 905.345 1169.730
(0.151) (0.038) (0.211) (0.110)Global shocks
-11.926 -11.094* -13.361* -12.858**(0.146) (0.052) (0.091) (0.045)-69.477 83.007 67.295 57.715(0.795) (0.501) (0.786) (0.677)
Observations 844 884 844 884Number of group(home host) 136 140 136 140Hansen test (1.000) (0.840) (1.000) (1.000)Arellano-Bond test for AR(1) in first differences (0.024) (0.019) (0.028) (0.021)Arellano-Bond test for AR(2) in first differences (0.096) (0.096) (0.102) (0.094)Robust p values in parentheses* significant at 10%; ** significant at 5%; *** significant at 1%Variables in italics are instrumented through the GMM procedure following Arellano and Bover (1995)
Impact on FDI to China on FDI to Chile
Impact on FDI to China on FDI to Colombia
Impact on FDI to China on FDI to Mexico
Impact on FDI to China on FDI to Venezuela
Constant
Home. GDP growth
Oil price
Occurrence of banking crisis
Host home interest rate differential
Occurrence of exchange crisis
GDP per capita
Domestic Investment
Natural Resources
Capital account restrictions
Investment Profile
Occurrence of sovereign crisis
Non FDI capital flows
Debt service
Nominal GDP
GDP growth
Total FDI of OECD countries
Similarity in productive structure
Bilateral FDI to OECD
Bilateral FDI to Latin America
Bilateral exchange rate
Bilateral exports
Bilateral imports
Lag of bilateral FDI over host GDP
Bilateral FDI to China
Bilateral FDI to China * GDP host
Bilateral FDI to Hong Kong
Impact on FDI to China on FDI to Argentina
Impact on FDI to China on FDI to Brazil

21
Table A – 5 Detailed results for structural break model (1) (2) (3) (4)
Dependent variable: Bilateral real FDI (millions of 2000 USD)
OMC effect - Common impact -unrestricted model
OMC effect - Common impact - restricted model
OMC effect - Individual country
impact - unrestricted
OMC effect - Individual country
impact - restricted
Objetive variablesLatin America as whole
-0.090 -0.113(0.423) (0.384)-0.108 -0.183(0.651) (0.403)0.000 0.000(0.550) (0.517)0.119* 0.133* 0.118* 0.160**(0.093) (0.081) (0.058) (0.043)
Country specific-0.062 -0.004(0.326) (0.959)
-0.700*** -0.388(0.005) (0.100)0.109 0.214(0.446) (0.288)-1.036* -0.516(0.073) (0.364)-0.042 0.059(0.536) (0.613)0.285 0.228(0.212) (0.176)-0.291 0.057(0.116) (0.756)-0.324* -0.288*(0.050) (0.071)
-0.198** -0.199**(0.029) (0.020)1.376 0.506(0.224) (0.435)0.346 0.229(0.141) (0.176)0.166 -0.137(0.531) (0.584)
Control variablesCapital flows
0.051 0.031 0.049 -0.009(0.762) (0.852) (0.711) (0.962)
-0.009*** -0.008*** -0.001(0.002) (0.006) (0.799)0.022* 0.027 0.024*(0.099) (0.123) (0.061)0.001 0.002* 0.002(0.148) (0.069) (0.140)0.000 0.000 0.000**(0.249) (0.182) (0.013)
Bilateral variables0.029 0.053(0.765) (0.414)0.115** 0.060*** 0.152*** 0.067***(0.034) (0.000) (0.002) (0.000)-0.041 -0.073*(0.380) (0.071)13.827 281.617(0.934) (0.163)-0.627 -1.542(0.790) (0.633)
Host country variables Macroeconomic factors
0.003** 0.002** 0.002** 0.002***(0.026) (0.011) (0.013) (0.003)
1,654.138*** 987.308*** 1,858.373*** 1,457.622***(0.001) (0.004) (0.001) (0.000)0.022 0.016(0.204) (0.455)-0.009* -0.007* -0.009*** -0.009**(0.066) (0.064) (0.008) (0.016)-0.009* -0.009*(0.098) (0.068)
Institutional characteristics-137.317 -108.490* -49.129(0.107) (0.099) (0.492)3.942 12.440(0.820) (0.497)0.202** 0.289*(0.028) (0.067)
Ocurrence of Crisis-143.315** -81.454* -156.125** -99.167**
(0.028) (0.052) (0.021) (0.025)150.884*** 144.585*** 237.299*** 206.964***
(0.005) (0.001) (0.003) (0.004)-57.610 -53.379(0.407) (0.425)
Home country variables1063.387 1,644.548* 956.080
(0.131) (0.057) (0.221)Global shocks
-12.163 -10.872* -11.797 -16.791***(0.178) (0.076) (0.115) (0.007)-64.496 99.529 -42.079 82.680(0.832) (0.438) (0.868) (0.351)
Observations 844 884 844 915Number of group(home host) 136 140 136 141Hansen test (1.000) (0.830) (0.000) (1.000)Arellano-Bond test for AR(1) in first differences (0.024) (0.020) (0.004) (0.010)Arellano-Bond test for AR(2) in first differences (0.095) (0.095) (0.061) (0.097)Robust p values in parentheses* significant at 10%; ** significant at 5%; *** significant at 1%Variables in italics are instrumented through the GMM procedure following Arellano and Bover (1995)
Home. GDP growth
Oil price
Constant
Natural Resources
Occurrence of sovereign crisis
Occurrence of banking crisis
Occurrence of exchange crisis
Domestic Investment
Debt service
Capital account restrictions
Investment Profile
Host home interest rate differential
Nominal GDP
GDP growth
GDP per capita
Bilateral exchange rate
Bilateral exports
Bilateral imports
Similarity in productive structure
Non FDI capital flows
Bilateral FDI to Latin America
Bilateral FDI to OECD
Total FDI of OECD countries
Impact on FDI to China on FDI to Mexico after 2000
Impact on FDI to China on FDI to Venezuela before 2001
Impact on FDI to China on FDI to Venezuela after 2000
Lag of bilateral FDI over host GDP
Impact on FDI to China on FDI to Chile after 2000
Impact on FDI to China on FDI to Colombia before 2001
Impact on FDI to China on FDI to Colombia after 2000
Impact on FDI to China on FDI to Mexico before 2001
Impact on FDI to China on FDI to Argentina after 2000
Impact on FDI to China on FDI to Brazil before 2001
Impact on FDI to China on FDI to Brazil after 2000
Impact on FDI to China on FDI to Chile before 2001
Impact on FDI to China on FDI to Argentina before 2001
Bilateral FDI to Hong Kong
Bilateral FDI to China before 2001
Bilateral FDI to China after 2000
Bilateral FDI to China * GDP host
22
Table A - 6. Correlation among variables
Bilateral FDI Bilateral FDI to China
Bilateral FDI to Hong Kong
Bilateral FDI to OECD
Bilateral FDI to Latin America
Bilateral exchange rate
Bilateral exports Bilateral imports Non FDI capital flows
Total FDI of OECD countries
Similarity in productive structure
Host home interest rate differential
Host. Debt service
Host. Nominal GDP. Billions of
USD
Host. GDP growth
Host. GDP per capita
Host. Domestic Investment
Host. Natural Resources
Host. Capital account
restrictions
Host. Investment Profile
Host. Occurrence of sovereign crisis
Host. Occurrence of banking crisis
Host. Occurrence of exchange crisis
Home. GDP growth
Bilateral FDI 1Bilateral FDI to China 0.21 1Bilateral FDI to Hong Kong 0.40 0.43 1Bilateral FDI to OECD 0.23 0.29 0.26 1Bilateral FDI to Latin America 0.37 0.43 0.63 0.43 1Bilateral exchange rate -0.05 0.09 0.11 0.18 0.14 1Bilateral exports 0.56 0.22 0.39 0.26 0.26 -0.01 1Bilateral imports 0.54 0.21 0.38 0.25 0.24 -0.01 0.99 1Non FDI capital flows 0.02 0.04 0.02 -0.06 0.01 -0.02 0.02 0.00 1Total FDI of OECD countries 0.11 -0.05 -0.01 0.31 0.24 -0.04 0.02 0.02 -0.27 1Similarity in productive structure 0.15 -0.14 -0.07 -0.05 -0.07 -0.01 0.04 0.03 0.15 -0.10 1Host home interest rate differential 0.01 0.00 0.00 -0.05 -0.03 -0.06 0.00 0.00 0.17 -0.17 0.10 1Host. Debt service 0.20 -0.01 -0.01 0.08 -0.02 -0.09 0.13 0.11 -0.11 0.28 0.45 -0.04 1Host. Nominal GDP. Billions of USD 0.22 0.00 0.00 0.02 -0.05 -0.10 0.13 0.11 0.24 0.06 0.52 0.18 0.82 1Host. GDP growth 0.01 0.03 0.00 -0.04 0.01 0.03 0.02 0.01 0.37 -0.18 0.11 0.12 0.00 0.06 1Host. GDP per capita 0.10 0.01 0.02 0.04 0.05 -0.10 0.04 0.02 0.38 0.08 0.22 -0.09 0.09 0.25 0.15 1Host. Domestic Investment 0.22 0.00 0.01 0.02 -0.04 -0.09 0.14 0.11 0.27 0.07 0.50 0.19 0.81 0.99 0.11 0.24 1Host. Natural Resources 0.17 0.00 0.00 0.00 -0.05 -0.09 0.07 0.06 0.11 0.00 0.40 0.34 0.73 0.83 -0.04 -0.08 0.82 1Host. Capital account restrictions 0.05 0.01 0.01 0.06 0.06 0.02 0.03 0.03 -0.21 0.17 0.02 0.06 0.20 0.14 -0.06 -0.29 0.15 0.22 1Host. Investment Profile 0.01 -0.04 0.00 -0.03 -0.09 -0.02 0.07 0.07 -0.02 -0.03 0.07 -0.12 0.22 0.15 0.22 0.27 0.17 -0.13 -0.25 1Host. Occurrence of sovereign crisis -0.05 0.00 0.00 -0.06 -0.03 -0.03 -0.04 -0.03 -0.12 -0.21 -0.01 0.40 -0.21 -0.11 -0.02 -0.04 -0.13 0.08 -0.01 -0.32 1Host. Occurrence of banking crisis 0.11 0.03 0.01 -0.03 -0.06 -0.07 0.02 0.01 -0.14 -0.11 0.32 0.13 0.43 0.45 -0.15 -0.10 0.43 0.58 0.08 -0.29 0.22 1Host. Occurrence of exchange crisis 0.00 -0.01 0.01 0.00 0.01 -0.01 -0.02 -0.01 -0.30 0.03 -0.02 -0.06 0.05 -0.05 -0.29 -0.18 -0.09 0.08 0.13 -0.26 0.08 0.25 1Home. GDP growth 0.10 -0.06 -0.01 0.00 0.14 0.06 -0.01 0.00 0.00 0.17 0.04 -0.03 0.04 0.03 0.05 0.07 0.04 0.00 0.08 -0.10 -0.06 0.04 0.00 1Oil price -0.02 -0.01 -0.07 0.13 -0.01 -0.02 0.01 0.02 -0.29 0.50 -0.07 -0.13 0.21 0.02 -0.11 -0.09 -0.02 0.00 0.01 0.10 -0.11 -0.04 -0.10 0.04