the impact of fdi on firm survival and employment: a
TRANSCRIPT

1
Università degli Studi di Salerno
CELPE Centro di Economia del Lavoro e di Politica Economica
Anna Maria FERRAGINA*
*Università degli Studi di Salerno – CELPE
*FEMISE
The Impact of FDI on Firm Survival and Employment: A Comparative Analysis for Turkey and Italy
Technical Report1 - Research Project n° FEM34-12
Corresponding author
Discussion Paper 127
Team members CELPE - Centre of Labour Economics and Economic Policy, University of Salerno, Italy
Team members METU, Ankara, Turkey Faculty of Economics & Administrative Sciences Department of Economics
Fernanda Mazzotta Dr., University of Salerno Erol Taymaz Pr.,METU
Giulia Nunziante, University of Rome “Tor Vergata” Kamil Yilmaz Pr., Koc University, Istanbul
Rosanna Pittiglio Dr., Second University of Naples Yesim Ucdogruk Dr., Dokuz Eylül University- Izmir
Filippo Reganati Pr., University of Rome “La Sapienza” Ünal Töngür, METU
1This document has been produced with the financial assistance of the European Union within the context of the FEMISE program. The contents of this document are the sole responsibility of the authors and can under no circumstances be regarded as reflecting the position of the European Union.

2
Scientific Commitee:
Adalgiso Amendola, Floro Ernesto Caroleo, Cesare Imbriani, Marcello D’Amato, Pasquale Persico C.E.L.P.E. Centro di Ricerca Interdipartimentale di Economia del Lavoro e di Politica Economica Università degli Studi di Salerno
Via Ponte Don Melillo, 84084 Fisciano, I- Italy http://www.celpe.unisa.it E-mail: [email protected]

3
Index
Abstract ................................................................................................................................................................... 7
Non technical synthesis ........................................................................................................................................... 9 1. Introduction ........................................................................................................................................................ 17 2. Literature review* ............................................................................................................................................... 20
2.1. FDI effects on firm survival: a theoretical overview of key hypotheses ................................................... 20 2.2. Survival dynamics of foreign and domestic firms: empirical evidence .................................................... 23 2.3. Previous studies on the potential impact of FDI on domestic firms’ survival ........................................... 25 2.4. Empirical evidence on ownership and firms resilience over economic slowdowns ................................. 30
3. The Italian case ................................................................................................................................................. 33 3.1. Stylised facts about FDI and firm mortality in Italy* ................................................................................. 33 3.2. Foreign ownership and firms’ survival ..................................................................................................... 39 3.2.1. Data and descriptive statistics ............................................................................................................. 40 3.2.2. Empirical Model ................................................................................................................................... 41 3.2.3. Econometric results ............................................................................................................................. 47 3.2.3.1. Sensitivity of results to sectors with different technological intensity ................................................ 51 3.2.4. Conclusions ......................................................................................................................................... 55 3.3. The impact of FAs on domestic firms’ survival: intersectoral and intra-sectoral spillover effects* ........... 56 3.3.1. Dataset construction ............................................................................................................................ 57 3.3.2. Variables specification ......................................................................................................................... 57 3.3.3. Modelling and estimation results .......................................................................................................... 61 3.3.3.1. Non-parametric estimates of the survivor functions .......................................................................... 63 3.3.3.2. Empirical model: FDI impact on firm duration ................................................................................... 68 3.3.4. Conclusions ......................................................................................................................................... 73 3.4. Foreign ownership and firm growth ......................................................................................................... 73 3.4.1. Econometric model .............................................................................................................................. 75 3.4.2. Results ................................................................................................................................................. 77 3.5. The impact of the global crisis on firms’ survival and employment growth of foreign and domestic firms 78 3.5.1. Estimates of the exit rates before and after the crisis .......................................................................... 81 3.5.2. Results of the estimates of firm exit ..................................................................................................... 81 3.5.3. Firm employment growth estimates ..................................................................................................... 83 3.5.4. Conclusions ......................................................................................................................................... 90
Appendix A ............................................................................................................................................................ 91 4. The Turkish Case .......................................................................................................................................... 95
4.1.Data and Stylized Facts About FDI in Turkey .......................................................................................... 95 4.1.1.Stylised Facts about FDI in Turkey ....................................................................................................... 95 4.1.2. TURKSTAT’s Industrial Analysis Database: 1983-2001 .................................................................... 102 4.1.3. TURKSTAT’s Annual Industry and Service Statistics Database: 2002-2009 ..................................... 103 4.2. Previous studies on productivity and FDI in Turkish Manufacturing Industry ........................................ 103 4.3. Foreign ownership and firm survival ..................................................................................................... 105 4.3.1. Empirical strategy .............................................................................................................................. 105 4.3.2. Econometric results ........................................................................................................................... 108 4.3.3. Conclusions ....................................................................................................................................... 112 4.4. Foreign ownership and firm growth ....................................................................................................... 113 4.4.1. Empirical Model ................................................................................................................................. 113 4.4.2. Econometric results ...................................................................... Errore. Il segnalibro non è definito.
4.4.3. Conclusions ....................................................................................................................................... 122 4.5. The impact of economic crises on firm survival and employment growth ............................................. 122 4.5.1. The Turkish economic crises: 1994 and 2001 ................................................................................... 122 4.5.2. The global economic crisis of 2008 .................................................................................................... 123 4.5.3. The effects of economic crises on firms’ survival and employment growth ........................................ 124
5. Conclusions and policy implications ............................................................................................................ 125 References 130

4
List of Tables Italy
Tab. 2.2.1 Micro-econometric studies on foreign ownership and firm survival Tab. 2.3.1 Microeconometric studies on the impact of FDI on firm survival Tab. 2.4.1 Literature on foreign MNEs performance over a crisis. Tab. 3.1.1 Foreign owned firms: main indicators (2001 -2009) Tab. 3.1.2 Rates of survival of cohorts of firms over 1999-2008 Tab. 3.1.3 Rates of survival of cohorts of firms over 2003-2009 by macrosectors Tab. 3.1.4 Birth and death rates by macrosectors (2004-2009) (numbers and percentages) Tab. 3.2.1 Distribution of Italian firms by size and ownership status (percentages, average) Tab. 3.2.2 Average exit rate by ownership status and sector (percentages) Tab. 3.2.3 Log-rank tests for the equality of the survival functions by ownership status Tab. 3.2.4 Definition of variables, data sources and expected relationships Tab. 3.2.5 Mean statistics by ownership status and t-test of comparison of means Tab. 3.2.6 Mean statistics by ownership status and t-test of comparison of means (manufacturing) Tab. 3.2.7 Mean statistics by ownership status and t-test of comparison of means (services) Tab. 3.2.8 Estimation results: Cox Proportional Hazard Model Tab. 3.2.9 Technology taxonomy (OECD) Tab. 3.2.10 Estimation results by technological intensity in manufacturing: Cox Proportional Hazard Model Tab. 3.2.11 Estimation results by technological intensity in the services: Cox Proportional Hazard Model Tab. 3.3.1 Definition of variables, data sources and expected relationships with firm exit Tab. 3.3.2 Descriptive statistics (all firms, domestic firms, exporting firms, non exporting firms, foreign
multinationals, domestic multinationals, 2007) Tab. 3.3.3 Regression estimates of firm exit: Cox Proportional Hazard Model (pooled sample and sub-
samples, 2002-2010) Tab. 3.4.1 Determinants of growth Tab. 3.5.1 Descriptive statistics: variable means (2007) Tab. 3.5.2 The likelihood of exit before and after the crisis: Probit and CPHM Tab. 3.5.3 Employment yearly growth rates (means 2002-2009 and 2008-2009) Tab. 3.5.4 Panel estimates of firm employment growth (2002-2009)
List of Figures Italy
Fig. 3.1.1 Italy and Turkey: inward FDI flows (1990-2011, billion USD) Fig. 3.1.2 Inward FDI in Italy, Turkey and selected Mediterranean countries (millions USD; 1992, 2000,
2009) Fig. 3.1.3 Foreign owned firms: main indicators (2001-2009; in percentage of total firms) Fig. 3.1.4 Italian foreign owned firms by sector (in %; 2003-2009) Fig. 3.1.5 Employees in Italian foreign owned firms by sector (in %; 2003-2009) Fig. 3.1.6 Turnover in Italian foreign owned firms by sector (in %; 2003-2009) Fig. 3.1.7 Inward FDI Regulatory Restrictiveness and Inward FDI Stock Fig. 3.2.1 Kaplan-Meier Survival Functions by Nationality of Ownership Fig. 3.2.2 Kaplan-Meier Survival Functions by Nationality of Ownership (manufacturing) Fig. 3.2.3 Kaplan-Meier Survival Functions by Nationality of Ownership (services) Fig. 3.3.1 Kaplan-Meier survival estimate Fig. 3.3.2 Kernel density estimates Fig. 3.3.3 Kaplan-Meier survival estimates by technology clusters Fig. 3.3.4 Kaplan-Meier survival estimates by ownership Fig. 3.3.5 Kaplan-Meier survival estimates by technology gap Fig. 3.3.6 Kaplan-Meier survival estimates by foreign investment Fig. 3.3.7 Kaplan-Meier survival estimates by foreign investment (High and Medium-High Tech) Fig. 3.3.8 Kaplan-Meier survival estimates by foreign investment (Low and Medium-Low Tech) Fig. 3.4.1 Average firms’ size by age and technology (2002-2010) Fig. 3.4.2 Average size of foreign and domestic firms (2002-2010) Fig. 3.4.3 Average size of survivors and exitors by survival duration (2002-2010) Fig. 3.5.1 Unemployment rate in Italy (2002-2009) Fig. 3.5.2 Annual real GDP growth rates in Italy (2002-2009) Fig. 3.5.3 Employment growth rates for exporters and non exporters (2002-2009, in log) Fig. 3.5.4 Employment growth rates for domestic firms, foreign firms and domestic multinationals (2002-
2009, in log)

5
List of Tables Turkey
Tab. 4.1.1 Sectoral Distribution of Foreign Direct Investment in Turkey (Million USD, Real Estate Investment Excluded)
Tab. 4.1.2 Breakdown of Newly Established Companies with Foreign Capital (Grouped According to Equity Capital, 1000 USD)
Tab. 4.1.3 Sectoral Distribution of Outward FDI Flows from Turkey (Million USD) Tab. 4.4.1 Determinants of exit (1983-2001 dataset) Tab. 4.4.2 Determinants of exit (2003-2009 dataset) Tab. 4.4.3 Determinants of survival and growth (Heckman model) Tab. 4.4.4 Determinants of growth (1983-2001 dataset)(GMM-system estimates) Tab. 4.4.5 Determinants of growth (2003-2009 dataset)(GMM-system estimates)
List of Figures Turkey
Figure 4.1.1 Global FDI Flows (1990-2011, trillion USD) Figure 4.1.2 Turkey - Inward and Outward FDI Flows (1990-2011, billion USD) Figure 4.1.3 Italy and Turkey: Inward FDI Flows (1990-2011, billion USD) Figure 4.1.4 Share of foreign firms in Turkish manufacturing (%) Figure 4.1.5 Inward FDI Regulatory Restrictiveness and Inward FDI Stock Figure 4.3.1 Survival rates by ownership and size (1983-2001 data) Figure 4.4.1 Average size of new firms by cohort (1983-2001 dataset) Figure 4.4.2 Average size of new firms by cohort (2003-2009 dataset) Figure 4.4.3 Average size of new foreign firms by cohort (1983-2001 dataset) Figure 4.4.4 Average size of new foreign firms by cohort (2003-2009 dataset) Figure 4.4.5 Average size of exitors by survival duration (1983-2001 dataset) Figure 4.4.6 Average size of exitors by survival duration (2003-2009 dataset) Figure 4.4.7 Average size of survivors by age (1983-2001 dataset) Figure 4.4.8 Average size of survivors by age (2003-2009 dataset) Figure 4.4.9 Average size of foreign survivors by age (1983-2001 dataset) Figure 4.4.10 Average size of foreign survivors by age (2003-2009 dataset) Figure 4.5.1 Impact of economic crises on survival Figure 4.5.2 Impact of economic crises on growth
Table Turkey and Italy
Tab. 5.1 Overview table

6

7
The Impact of FDI on Firm Survival and Employment: A Comparative Analysis for Turkey and Italy
Anna Maria FERRAGINA Università degli Studi di Salerno – CELPE
Abstract
This report summarizes the findings of a research project using firm level data on Italian and Turkish manufacturing industries. In this project we study the dynamics of firm survival and growth, and the spillover effects from foreign-owned to domestic firms. First, we investigate the differences in survival patterns of foreign-owned and domestic firms and test the hypothesis that foreign multinational enterprises (FMNEs) display “foot-loose” behavior. Secondly, we analyse the effects of FDI on the survival and growth prospects of domestic firms by disentangling horizontal and vertical spillovers. We use hazard models for the econometric analysis of firm survival and the system-GMM and Heckman selection models for the analysis of firm (employment) growth. In the case of Italy, a comparison of survival rates of domestic and foreign firms shows that foreign firms are more likely to survive than domestic firms, although the survival rates of foreign firms are not much different than those of Italian multinational firms. To check for a more general applicability of this preliminary finding, we estimate the hazard functions for the domestic and foreign firms, controlling for a number of sector-specific and firm-specific characteristics. The results reveal that foreign firms are more “foot-loose” compared to their domestic counterparts while Italian multinationals exhibit lower hazard rates with respect to both domestic non-multinational firms and to foreign multinationals. Besides, the foreign firms’ likelihood of exit compared to domestic firms is higher in sectors with low technology- and knowledge-intensity. In the Turkish case, the simple comparison of survival rates also highlights that foreign firms are more likely to survive than Turkish firms, although the survival rates of foreign firms are not different from those of large domestic firms. Since foreign firms usually start with a larger size, use more capital-intensive technologies, survival rates may reflect the impact of entry characteristics. The hazard function estimates reveal that, when we control for sector-specific variables, foreign firms still have higher survival probabilities, but once firm-specific variables are included in the hazard function model, they appear more “foot-loose” for the 1983-2001 period. Foreign firms are more likely to survive than the domestic firms in the 2003-2009 period even after firm-specific variables are taken into account, but the inclusion of firm-specific variables reduces the impact of foreign ownership on the likelihood of survival considerably. These results for Italy and Turkey indicate that foreign ownership has not necessarily a positive impact on firm survival. Conversely, there is evidence that multinational experience matters for survival because multinational firms have larger size and may employ more capital-intensive technologies thanks to their superior financial strength and experience in other markets. Other firm-level characteristics (size, skill level, etc) are also crucial for survival. The exit behavior of foreign firms is also quite related to the technological environment due to the role played by opportunity costs, which are more relevant in low-tech industries, and by sunk investments costs, which (on average) are lower in more traditional sectors. The mixed results for Turkey across the two periods considered also highlight the importance of the institutional setting for firm survival and growth. Turkey experienced two different policy and growth regimes in the 1990s and 2000s. The 1990s, which is labeled by some researchers as the “lost decade”, is characterized by extreme uncertainty and boom-and-bust cycles, whereas the Turkish economy achieved a high and stable growth performance in the

8
2000s. In terms of industrial policy, the foot-loose behavior of foreign multinationals should be taken into account in designing investment incentives to attract foreign multinationals also pursuing sector specific policies and institutional reforms ensuring that managers have the right incentives to make long-term investment and to enhance absorptive capacity development. Besides, to improve the likelihood of firm survival, policy makers should target firm-specific characteristics that are crucial determinants of performance gaps in survival, primarily size, productivity and multinational activities. Concerning the issue of how the presence of foreign firms affects the domestic firms’ survival and employment growth, our findings suggest that there is a huge degree of heterogeneity across firms, periods and sectors in both countries. However, positive evidence in favour of positive spillovers is not overwhelming. In the case of Italy, the survival of domestic firms is positively affected by the increased presence of foreign firms within the same industry, but this only occurs in low- and medium-low tech industries. This result may be due to the fact that domestic firms in medium-high tech industries have not enough absorptive capacity to benefit from FDI spillovers. The relevance of domestic firms’ absorptive capacity for spillover effects is confirmed by our analysis: only domestic firms that have smaller technology gap vis-à-vis foreign firms benefit from significant horizontal and vertical (upstream) spillovers on survival. From the system GMM growth estimates we find that, in terms of FDI spillovers, there is evidence of a negative impact on domestic firms employment growth if the foreign firm share in the region employment increases (negative local spillovers), .and a negative employment impact for firms with a higher technology gap is detected if the foreign firm share in the sector increases. For Turkey, the regional share of foreign firms has a weak negative static impact on the survival rate, and an increase in the share of foreign firms in a sector also has a negative impact on survival in the 2003-2009 period. The foreign share of users seems to have positive coefficients, i.e., domestic firms will be more likely to survive if users are foreign, but these results are statistically significant only if firm-specific effects are not controlled for in the 2003-2009 period. Moreover, there is some evidence of a negative effect on survival if downstream firms are foreign in the 2003-2009 period. Regarding firm growth, foreign suppliers and change in regional share of foreign firms have strong negative impact on domestic firms' growth rates, i.e., those firms supplied by upstream foreign firms, and those firm operating in regions with an increasing foreign presence experience lower growth rates. There is also a weak negative impact of sectoral foreign share on growth whereas a weak positive impact is observed for the change in sectoral foreign share. These results do not support the broad conclusion that FDI have positive impact on firms’ indigenous survival and growth dynamics. Conversely, our findings provide not a favorable picture in terms of the balance between displacement/competition versus spillover effects of FDI on domestic firms. We also obtain evidence indicating that the interaction between the presence of foreign firms and domestic firm survival is markedly affected by the technological environment that shapes up domestic firms’ absorptive capacity. The displacement effect in dynamic industries implies that the damage is concentrated on high-tech firms, which should be the higher quality segment of national production. In terms of industrial policy, this implies that the desire to encourage FDI and simultaneously building up a stable supply of indigenous enterprises is more challenging in dynamic sectors, where a trade-off in terms of these objectives appears to exist.
Keywords: International investment; Multinational firms; Duration analysis; Firm performance, International Linkages to Development
JEL: F21, F23, C41, L25, O19.

9
Non Technical Synthesis
Objective of the Study
The present “Executive Summary” synthesizes all research findings included in the technical Report of Femise Research Project FEM 34-12, on "THE IMPACT OF FDI ON FIRM SURVIVAL AND EMPLOYMENT: A COMPARATIVE ANALYSIS FOR TURKEY AND ITALY", corresponding to Femise Research Program 2010-2011. Since the mid-1990s foreign direct investment (FDI) have become the main source of external finance for developing countries, with a share more than twice as large as the official development aid. In particular, the increase in FDI flows to emerging markets as a major vehicle of financial capital and technology transfer raised expectations about its potential contribution to the economic growth and development. Hence, many countries not only liberalized their markets, but also offered generous investment packages, such as tax holidays, import duty exemptions, or preferential loans to attract FDI. A set of effects attached to the attraction of FDI (more capital, technology and higher productivity, spillover effects to domestic firms, increased competition, elimination of less productive firms, encouragement to productivity improvement) may explain the reason why policy makers, both in developing and in developed contexts, have tended to emphasize the potential benefit that FDI can bring to the host economy and have started to treat foreign investment even more favorably than investment by domestic firms (Görg and Greenaway, 2004). Most of the literature on the effects of FDI on local contexts has focused on the productivity spillovers of FDI (technological or pecuniary). Following an alternative approach proposed by Görg and Strobl (2003) in this report we focus instead on the spillover channels and transmissions mechanisms through which FDI impact on domestic firms’ survival. This approach has several advantages. First, it allows to test the hypothesis of FMNEs’ “footloose” behavior. Secondly, it leads to a better understanding of the spillover effects of FDI given that the presence of FDI may increase average productivity of domestic firms through two channels: forcing them to be more productive and eventually eliminating inefficient domestic firms by intensified competition; alternatively, inducing technology or pecuniary spillovers. Hence, a simple positive correlation between the presence of FDI and higher productivity of domestic firms, as found in some studies, does not necessarily imply the existence of spillovers from foreign to domestic firms. Thirdly, the analysis of survival also allows us to measure the FDI impact on firm performance overcoming the input endogeneity and simultaneity problems typical of productivity estimations. Hence, our report using firm level data on Italian and Turkish manufacturing industries investigates the dynamics of firm survival and growth, and the spillover effects from foreign-owned to domestic firms. First, we investigate the differences in survival patterns of foreign-owned and domestic firms and test the hypothesis that foreign multinational enterprises’ (FMNEs) display “foot-loose” behavior. Secondly, we analyse the effects of FDI on the survival and growth prospects of domestic firms by disentangling horizontal and vertical spillovers. We use hazard models for the econometric analysis of firm survival and the system-GMM and Heckman selection models for the analysis of firm (employment) growth. Italy and Turkey are two excellent case studies for analyzing to what extent FDI contributes to firm survival, a topic which is understudied with respect to other more investigated issues related to FDI. This topic is particularly neglected for Italy and Turkey and for the whole Mediterranean region. This Report is therefore expected to fill a gap in the empirical literature on FDI. Italy and Turkey over the last years both entered a process of progressive increase in FDI starting from very low levels. Italy experienced fast rising increase in inward FDI, whose value passed from 6,918 million dollars in 1999 to 44,202 million dollars in 2007 (Unctad, 2012). Turkey provides a sort of textbook experiment of the impact of FDI in an emerging country having become after 2003 a very attractive acquisition target for foreign investment inward, whose value passed from 1,000 million dollars in 2003 to 44,000 million dollars in 2007. Therefore, it is worth exploring whether Italian and Turkish firms were able to gain positive externalities from the increasing presence of foreign firms. The countries under study are also affected by high firm mortality: taking firms entered in 2002, four years after their

10
entry we observe that only 60 percent survived in Italy (Istat, 2010) and only 51 percent in Turkey (Turkstat, 2010). Our lines of research have relevant policy implications given that encouraging FDI and at the same time enterprise creation and persistence are cornerstones of most industrial policies. We investigate the differences in survival patterns of foreign owned and domestic firms testing the hypothesis of foreign multinational enterprises (FMNEs) “foot-loose” behavior in line with studies for other countries (see Bernard and Sjöholm, 2003 for Indonesia; Görg and Strobl, 2003b for Ireland; Girma and Görg, 2004 for UK; Alvarez and Görg, 2009 for Chile; Mata and Portugal, 2002 for Portugal; Kimura and Fujii, 2003 for Japan; Van Beveren, 2007 for Belgium; Inui, et al., 2009; Bandick, 2010 for Sweden). Furthermore, we study the effects of FDI on the survival prospects of domestic firms following a quite scant and recent literature on the transmission of technological and pecuniary FDI externalities to domestic firms survival (De Backer and Sleuwaegen, 2003; Burke et al., 2008; Girma and Gong, 2008; Bandick, 2010; Wang, 2010; Kosovà, 2010). The two studies on Italian and Turkish firms use microeconometric analysis and are largely comparable as we estimate similar empirical models. We basically use the same variables for the two analyses. The key variables of interest are those related to FDI: the dummy for FDI, the output share of foreign firms in the same sector, to measure sectoral horizontal spillovers, the output share of foreign firms in the region (a proxy for local spillovers), the relative growth of these variables to check for dynamic effects, the vertical spillover variables, such as foreign share among suppliers and foreign share among buyers, using as weights the technical coefficient derived by the national input/output tables. In order to purge out the effects on firms’ survival due to the presence of FDI, we also control for several firm and industry factors which are known by the literature to be related to life duration. At firm level we include variables such as size, relative size, age, productivity, real wage, capital/labor ratio, export status, and some financial indicators such as the firm profit margin. At industry level, we control for market characteristics such as exposure to trade, entry rate, sectoral output growth rate, producer price index growth, competition of the market measured by the Herfindahl concentration index, minimum efficient scale, R&D intensity. In addition to this, for Turkey it was also possible to check for the share of subcontractors in inputs and for the share of output subcontracted to other firms and also to introduce a dummy for technology transfer. For each country under analysis we focus on three sets of questions: 1) firm exit behavior and foreign ownership; 2) impact of FDI on firm survival and growth; 3) foreign and domestic firm exit and employment growth, also taking into account the recent global crisis shock. 1) First, we investigate how different are the firm exit and employment dynamics according to ownership (foreign /domestic) and whether exit patterns are different in modern versus more traditional segments of production. Theoretically, the link between foreign ownership and firm survival is ambiguous. On the one hand, it is suggested that foreign firms are “foot-loose”, because they can easily re-allocate their resources to other countries as a reaction to adverse changes in the host country (Gibson and Harris 1996; Görg and Strobl 2003). In other words, foreign firms may have lower exit costs that make exit probability higher. On the other hand, foreign firms on average may have superior technological and managerial skills that enable them to develop successful entry strategies. Therefore, self-selection before entry may increase the survival probability of foreign firms. Recent empirical work on productivity differences between firms shows that multinational enterprises (MNEs), regardless of whether they are domestic (DMNEs) or foreign-owned (FMNEs), exhibit a “productivity premium” compared to purely domestic firms (Criscuolo and Martin, 2009). This is in line with the literature on firm heterogeneity (Helpman et al., 2004) which shows that a firm’s status in terms of global engagement is crucially related to the firm’s performance. The inclusion of the local and global dimension let us identify the relationships between firms’, industry and local (province) characteristics and the firms’ international competitiveness, which recent studies have strongly confirmed to be crucially related to their demographic dynamics and growth (Altomonte et al., 2012). In this context, FMNEs may have a higher probability of survival because on the one hand foreign capital participation may itself be signalling unobserved quality of the affiliate firm (cherry-picking hypothesis), and/or on the other, it may be a vehicle for accessing to more advanced foreign technologies and, therefore for improving firm efficiency. However, some

11
studies show that after acquiring a firm, foreign firms tend to shut some plants and Acquisition entry has been found to have a 60 per cent shorter survival time than Greenfield entry (Girma and Gorg, 2003; Harris, 2009). The first step of the empirical analysis has involved showing the differences between foreign affiliates (FAs) of MNEs and indigenous firms in terms of survival patterns controlling for firm, industry and time variables to also take into account macroeconomic shocks and institutional changes. The empirical analysis is based on Kaplan Meyer survival functions and on hazard models. In the hazard estimates we consider those variables that might enhance the persistence of firms on the market and attract more stable FDI, above all global engagement, dimension and productivity, in addition to investment in R&D. In line with the theoretical work by Helpman et al. (2004) we consider the heterogeneity of both MNEs and of domestic firms (size, sector and regional dimension, R&D intensity). Hence, we carry out theoretically and empirically the analysis of firm survival distinguishing between foreign multinationals, domestic multinationals (large firms in the case of Turkey), domestic non multinational firms. We expect that larger and more productive firms and firms in export intensive and growing industries have the highest rate of survival. We also check for distinctive patterns of survival of manufacturing and service firms according to the technological intensity of the sector in which firms operate. We assume that in a process of creative destruction, the major factor impacting on firm survival is a firm's ability to innovate (Audretsch, 1991). Higher volatility of behaviour of foreign and of domestic firms is therefore expected in low technology sectors following the literature. 2) Furthemore, we explore how the presence of FAs affect the domestic firms’ survival and employment growth disentangling horizontal and vertical spillovers. The presence of foreign establishments changes competitive conditions in the market and might hence reduce domestic establishments’ survival probability. Foreign establishments are likely to intensify competition, and may force domestic establishments go out of the market (Caves, 1974; Blomström and Sjöholm, 1998). However, domestic firms may also benefit from technological and pecuniary spillovers from foreign establishments, and become more competitive in domestic and in international markets, although this is more likely to happen in the long run. In the end, if the spillover effect is dominant on the competition/displacement effect, then the survival probability of domestic firms will be enhanced by the presence of foreign firms. Therefore, we ask whether indigenous plants tend to have shorter lives (more deaths) due to competition with FDI affiliates operating in the same industry and region and also whether there are technological/knowledge/pecuniary externalities on firms’ survival stemming from the presence of foreign multinationals in the same sector and region and in upstream and downstream industries as input suppliers and customers. Another question we investigate is whether the impact of FAs on domestic firm survival rates varies with domestic firm technological gap with respect to foreign firms. Hence, our analysis also provides a test for the absorptive capacity hypothesis, which has been investigated in the large literature on FDI spillovers on productivity (Findlay, 1978, Wang and Blomstrom, 1992; Glass and Saggi, 1998; Jordaan, 2008; Jabbour and Mucchielli, 2007 among the others). Furthermore, we check for the level of technology of the sector, another source of potential heterogeneity in firm behaviour (see Görg and Strobl, 2001 and 2003; Burke et al., 2008; Kosovà, 2010). To this purpose, we re-estimate our model by disaggregating manufacturing into two groupings: i) high and medium-high technology industries and ii) low and medium-low technology industries (OECD taxonomy). We explore these issues both for firms’ survival and for employment growth. 3) We finally investigate upon the effects of the recent global crisis on firms’ survival and employment growth according to firm ownership status. The focus is upon issues of firms financial fragility and behaviour of foreign investors in the context of the global turbulence of 2008-2009 checking whether foreign firms turns out more resilient in the crisis period (e.g., because these type of firms are less likely to be financially constrained by means of easier external and intra-group financing). In this part we examine the determinants of firm survival (extensive margin of firm adjustment) and employment growth (intensive margin of firm adjustment). In the case of Turkey the impact of the 2008 global financial crisis on firms’ survival and employment growth has also been compared and contrasted with the impact of two previous domestic economic crises occurred in Turkey: the 1994 and the the 2001 crisis.
12
To this purpose all models include time dummies that capture the effects of all other time-varying effects. We look at these variables in detail to obtain a measure for the effects on firm growth and survival of the economic crises Turkey experienced in 1994, 1999, 2001 and 2009. We also estimate growth equations where the dependent variable is the log difference in employment allowing the crisis to impact differently on firms growth trajectories according to several control variables (ownership status, involvement in exports, financial health, innovation activities).
Main Findings
Survival and Growth Dynamics of Foreign and Domestic Firms
Considering the survival and growth dynamics of foreign and domestic firms our results are quite homogeneous between the two countries. Focusing our attention exclusively on firm level descriptive statistics, we observe for Italy and Turkey that foreign multinationals are on average older, larger, more productive, more innovative, and pay higher wages compared to firms which are purely domestic. For Italy we could also compare foreign multinationals and domestic multinationals and we found that, excluding services, foreign firms are even more productive than their national counterparts (domestic multinationals), in spite of the fact that the latter are bigger and older than them. Besides, if we apply non parametric unconditional analysis of survival by the Kaplan-Meyer (KM) survival estimator, there are substantial (and statistically significant) differences between the survival rates of foreign and domestic firms in both Turkish and Italian firms. In particular, for Italy we distinguish survival prospects for three different firm categories: FMNEs, DMNE, domestic non-MNEs. The first two firm categories endure much better survival prospects: while 72 percent of domestic non-MNEs survive more than 30 years, the same probability of survival is 78 percent for foreign-owned firms and 87 for domestic MNEs. The survival rates for foreign and domestic plants are also quite different in the case of Turkey where observing new firms over 2002-2009 we get that 46 percent of domestic firms survive more than 8 years, whereas the same (survival) rate for foreign plants is 70 percent. Moreover, large domestic firms’ survival rates are comparable to those of foreign firms (73 per cent). This finding points out that firm size could be an important explanatory variable in explaining differences in survival rates. However, a severe limitation of Kaplan-Meier survival functions is that such analysis does not consider other factors that may affect firm survival and growth. Therefore, we turn to an econometric analysis of firm survival and growth and, we estimate two equations, one for survival, and the other one for growth. For survival, in order to properly control for other characteristics associated with survival probabilities, we basically use a continuous hazard model, the Cox proportional hazard model. Since foreign firms usually start with a larger size, use more capital intensive technologies, etc., the differences in survival rates may reflect the impact of entry characteristics. We used hazard models to understand the effect of ownership on survival by controlling for a number of sector-specific and firm-specific variables. For growth, the dependent variable is the employment growth rate for the next year. Explanatory variables are those used in survival model. The problem with the growth model is the fact that it should take into account unobserved firm specific effects, sample selection (survival) and dynamic specification. Hence, after experimenting with various models to estimate growth we applied Heckman sample selection model (SSM) and system GMM. For Italy, our main finding reveals that during the period 2004-2008 manufacturing and service firms owned by foreign MNEs are more likely to exit the market than purely domestic firms. We also checked how domestic firms differ in their rates of exiting according to whether or not they are multinationals. We find no evidence of lower survival rates of domestic MNEs and in the services sector these firms have a higher chance of survival compared to non multinational firms. These findings suggest that foreign multinationals are likely to increase firm exit in Italy because of their multinational status not because of foreign ownership. We also find that foreign ownership actually exerts a negative influence on firm survival no matter the technology of the sector involved. However, the chance of exit compared to domestic firms are higher in less technology- and knowledge-intensive sectors than in more technology- and knowledge-intensive ones. This might support the hypothesis that the exit behaviour of foreign

13
firms is the result of the interaction of opportunity costs, which are more relevant in less technology intensive sectors, and of sunk investment costs afforded when setting up production, which (on average) are lower in more traditional sectors, ceteris paribus. In the Turkish case, the results reveal that, when we control for sector-specific variables, foreign firms still have higher survival probabilities, but once firm-specific variables are included, they become footloose for the 1983-2001 period. The results are somewhat different for the 2003-2009 period. Foreign firms are more likely to survive than the domestic firms in the 2003-2009 period even when firm-specific variables are taken into account, but the inclusion of firm-specific variables reduces considerably the impact of ownership on survival. The mixed results for these two periods could be due to the fact that Turkey experienced two different policy and growth regimes in the 1990s and 2000. The 1990s, which is labeled by some researchers as the “lost decade”, is characterized by extreme uncertainty and boom-and-burst cycles, whereas the Turkish economy experienced high and stable growth in the 2000s.
Impact of FDI on domestic firms’ survival and growth
Concerning the issue of how the presence of FAs affects the domestic firms’ survival and employment growth, our findings suggest that there is a huge degree of heterogeneity among the two countries and across firms, period and sectors. In the case of Italy, the survival of domestic firms is positively affected by the increased presence of foreign firms within the same industry, but this only occurs in low- and medium-low tech industries. This result may be due to the fact that domestic firms in medium-high tech industries have not enough absorptive capacity to benefit from FDI spillovers. The relevance of domestic firms’ absorptive capacity for spillover effects is confirmed by our analysis: only domestic firms that have smaller productivity gap vis-à-vis the foreign firms benefit from significant horizontal and vertical (upstream) spillovers on survival. Hence, being a customer of foreign companies has a beneficial effect on local firms’ with higher productivity, that is the Italian companies are able to improve themselves once they are offered products and services from MNEs from upstream sectors. These findings point to a sensible economic interpretations. Foreign firms in the upstream sectors probably supply better quality products at lower costs, as well as providing support to local companies in the form of training and supply of equipment. On the contrary, if foreign firms act as customers of Italian local firms the chance of getting spillovers might be weaker for several reasons: foreign firms have a strong bargaining power, the ability to diversify their supply network and to impose low prices on their suppliers, and hence to be quite selective on them. However, the net effect of foreign firms on domestic establishments’ survival also depends crucially on the technological capacity of domestic firms: only in the group of firms with a low productivity gap with respect to foreign firms (high absorptive capacity) we find positive and significant horizontal and vertical (upstream) spillovers on survival. Hence, our analysis confirms that economic distance matters considerably for spillovers: only domestic firms with at least some level of productivity are enabled to adapt to better technologies. We might argue that, when the productivity gap is high the inputs and the output produced locally by foreign firms can be more expensive and less adapted to local requirements as foreign firms are too technologically advanced compared to local enterprises. For Turkey, the regional share of foreign firms has a weak negative static impact on the survival rate, and an increase in the share of foreign firms in a sector also has a negative impact on survival in the 2003-2009 period. The foreign share of users seems to have positive coefficients, i.e., domestic firms will be more likely to survive if users are foreign, but this results is statistically significant only if firm-specific effects are not controlled for in the 2003-2009 period. Moreover, there is some evidence of a negative effect on survival if downstream firms are foreign in the 2003-2009 period. Turning to the analysis of firm growth, from the system GMM growth estimates we find that in Italy foreign firms do not have higher growth rates than domestic firms and, in terms of FDI spillover, there is evidence of a negative impact on domestic firms employment growth if the foreign firm share in the region employment increases. Also foreign competition in the same sector pushes domestic firms out of market if

14
they have a high productivity gap. Regarding firm growth in Turkey, foreign suppliers and change in regional share of foreign firms have strong negative impact on domestic firms' growth rates, i.e., those firms supplied by upstream foreign firms, and those firm operating in regions with an increasing foreign presence experience lower growth rates. There is also a weak negative impact of sectoral foreign share on growth whereas a weak positive impact is observed for the change in sectoral foreign share. These results do not support the conclusion that FDI have a positive impact on indigenous firms’ survival and growth dynamics. Conversely, our findings provide not a favorable picture in terms of the balance between displacement/competition versus spillover effects of FDI on domestic firms. The outcome of the interaction between the presence of foreign firms and domestic firm survival is markedly conditional upon the technological environment and the domestic firms’ absorptive capacity.
Foreign and domestic firms exit and employment growth in a crisis shock: are foreign multinationals more resilient?
We test for firm exit over the crisis. A simple test of mean differences between surviving and failing firms for Italy shows that the share of affiliates of foreign firms among surviving firms is significantly higher than the share of foreign firms failing both before the crisis and during it. However, carrying out a probit analysis it emerges that the affiliates of foreign firms exhibit no different exit probabilities than domestic firms over the crisis. We also check for firm adjustment along the intensive margin, i.e. along the scale of operations by looking at employment growth over the crisis. First, descriptive statistics are built on employment growth for different subgroups of firms (all firms, small-medium, medium-large and large), taking both the whole period 2002-2009 period and the crisis years. Both domestic and foreign firms' growth rates declined significantly during the economic crises. Employment growth appears lower in foreign multinationals with respect to the other firm categories. These results hold across the different firms size classes. Furthermore, we check these descriptive results by Fixed Effect Model (FEM) and a system GMM. In the FEM we do find evidence that foreign firms have followed a lower employment growth trajectory than domestic firms over the crisis. Hence, we find support for the hypothesis that foreign multinationals have been more flexible in terms of employment contributing to the reduction of employment over the crisis and hence we might say that they have been less resilient and have played an “unstabilising” role in Italy. For Turkey the effects of economic crises on firms' survival probabilities and growth rates is tested both looking at sectoral output growth rates as an explanatory variable and to time dummies. Looking at these variables in detail it is possible to obtain a measure for the effects of economic crises Turkey experienced in 1994, 1999, 2001 and 2009 on firm growth and survival. The standardized coefficients of time dummies for the survival model decline during the economic crises for domestic firms, but the impact on foreign firms is somewhat lower. Indeed, the survival probability of foreign firms seems to increase during the 1994 crisis. Although the number of observations on foreign firms and exits is low, the results provide some weak evidence for the resilience of foreign firms against crises. However, the growth effects of the economic crises are quite different. Domestic and foreign firms' growth rates declined significantly during the economic crises. The coefficient values of the time dummies for domestic and foreign firms are almost the same for domestic and foreign firms in 1994 and 2009, and somewhat lower for foreign firms in 1999 and 2001. These results show that the impact on foreign firms is at least as strong as the impact experienced by domestic firms.
Conclusions and policy recommendations
This report was aimed at investigating the dynamics of firm survival and growth and the spillover effects from foreign-owned to domestic firms. These two lines of research have strong relevance to policy given that incentives to FDI and enterprise survival are essential targets of industrial policies. Foreign firms are generally viewed as having potential for both displacement/competition effect as well as spillovers on domestic firms due to linkages effects. The results are not straightfoward across countries, periods and sectors. However, they suggest that foreign investment are likely to influence both the quantity and the quality of

15
domestic entrepreneurship. More in detail, we find higher hazard ratios for FMNEs in Italy over 2002-2009, and in Turkey, as far as the estimates of FMNEs exit rates for the 1984-1991 period are concerned.. In both cases, we get positive and significant coefficients, i.e. an increase in the overall firm hazard rate when a large set of firm and industry level controls are added. Quite different are the results for Turkey over the period 2003-2009: the coefficient on the fdi variable remains negative and statistically significant even after the firm-specific effects are controlled for, although its absolute value declines sharply. We may conclude that foreign firms are more likely to survive than domestic firms operating in a similar sector, but when we control for firm-specific characteristics, we get somehow different results. The results of the Cox proportional hazards model suggest that foreign firms are more likely to survive than domestic firms, but the difference between domestic and foreign firms could be explained to a large extent by their firm-specific characteristics. Once firm-specific characteristics are controlled for, it is ambiguous if foreign firms can survive more or if they are foot-loose. Foreign firms may have higher or lower survival probability than domestic firms, however it is not only their foreign ownership, but also because of other characteristics shared by some domestic firms, for instance by domestic multinationals, too. We can also conjecture that foreignness does not matter for survival, but multinational experience does because multinational firms start with larger size and could employ more capital-intensive technologies thanks to their superior financial strength and experience in other markets. Besides, our results do not support the broad conclusion that FDI have positive impact on firms’ indigenous survival and growth dynamics. The net effect of foreign firms on domestic establishments’ survival depends crucially on the technological capacity of domestic firms: only in the group of firms with a low productivity gap with respect to foreign firms (high absorptive capacity) we find positive and significant horizontal and vertical (upstream) spillovers on survival. Hence, technology, innovation and knowledge are necessary complementary policy measures and tools for benefitting of the spillovers from FMNE. Moreover, the displacement effect is concentrated on high-tech firms, which should be the higher quality segment of national production. In terms of industrial policy, this implies that the desire to encourage FDI and simultaneously building up a stable supply of indigenous enterprises is more challenging in dynamic markets, where a trade-off in terms of these objectives appears to exist. The negative influence on firm survival is likely to be small in current economic terms but could be potentially bigger over a longer term horizon. On the ground of policy implications, the “footloose” behaviour of foreign owned firms and the potential displacement of domestic firms due to a stronger competition effect have several implications in terms of policy perspectives. The foot-loose behavior of foreign multinationals under some conditions should be taken into account in designing investment incentives to attract more stable foreign multinationals. More specifically, it is crucial for policy makers to take into account the different sources of firm specific heterogeneity as determinants of firm survival. To enhance the likelihood of firm survival, industrial policy should target firm-specific characteristics that are crucial determinants of performance gaps in survival, primarily firm dimension, productivity, innovation and multinational activities. Policies aimed to increase firm survival and to attract more stable FDI should also be calibrated according to the sectors involved, due to different sensitivity to industrial policies according to firm technology capacity and to technology environment. The role of institutional reforms should also be taken into account. The mixed results for Turkey across the two periods considered (the 1990s and 2000s), in which Turkey experienced two different policy and growth regimes, indeed highlight the importance of the institutional setting for firm survival and growth. Hence, the policy oriented perspective depends on several factors: certainty of the legal environment, sector of specialisation, consideration of domestic markets features. These considerations should help policy to target specific sectors and priorities and hence upon conditioning the FMNE entry. Our results for Turkey and Italy are of pivotal importance for the whole Mediterranean region for several reasons. Turkey and Italy share many similarity with the countries within the Mediterranean region: an increasing role of FDI as a source of investment, large presence of take overs, mainly of public firms by privatizations but also, more recently, of private domestic enterprises, production systems structure strongly biased towards small and medium enterprises, large presence of micro firms, often belonging to the informal sector, high rate of firm mortality, low ability to compete with foreign investors and to compete on foreign markets,

16
only limited access to external capital, scarce propensity to innovate, relevant technological gap with respect to foreign firms that may affect the capacity of firms to exploit technological spillovers from MNEs. The large presence of micro and small firms makes Italy and Turkey an interesting case for analysing the hypothesis according to which small enterprises are hampered in their ability to absorb new technology from inward FDI-related spillovers because of a lack of scientific and technical staff or experience. The firm structure is certainly reducing on the one hand the attractiveness for foreign investors, especially of long term and productive investment, on the other hand, it affects the ability of domestic firms to compete successfully with foreign investors. Therefore, FDI is a potential factor of increase of the already high rate of firm mortality. The small size of firms implies the difficulty of meeting the up-front cost of R&D with only limited access to external capital. The scarce propensity to innovate may suggest the presence of a relevant technological gap with respect to foreign firms that may affect the capacity of firms to exploit technological spillovers from MNEs. Therefore the Italian and the Turkish economy are two interesting case-studies in order to test the effects of inward FDI-related spillovers from MNEs and the absorptive capacity of domestic firms. Besides, the volatility of FDI is a typical feature of the whole south Mediterranean region, so the issue of the footloose behaviour of foreign firms, which we have analysed with respect to Italy and Turkey, may be extended to the whole region and have an important knowledge spillover. This is quite relevat to make our results easy to be generalised. Hence, the investigation of this topic for Italy and Turkey might have an important value added for further research on the impact of FDI on South mediterranean countries. The better economic performance and level of development of Italy and Turkey also provides us with a benchmark for future research on the region.

17
1. Introduction
During the last few years the importance of foreign direct investment (FDI) from multinational enterprises (MNEs) across the world economy has increased dramatically. The global stock of inward FDI has grown from less than 5% in 1980 to about 30% of global gross domestic product (GDP) in 2010 (UNCTAD, 2011). Government which up to the 80’s had been quite hostile to foreign investment turned progressively to more liberal policies. Many countries not only liberalized their markets but started to offer generous investment packages, such as tax holidays, import duty exemptions or preferential loans to attract FDI. The economic rationale behind these efforts is that multinational firms have both direct and indirect positive effects on host economies. The direct effects are related to the fact that foreign multinationals enterprises (FMNEs) are usually larger, more productive and pay higher wages than domestic-owned firms due to their greater technological know-how and modern management practices (Doms and Jensen, 1998). In addition to these advantages, foreign multinationals also have an indirect impact on domestic firms and this is compounded of a competition effect and a spillover effect, through pecuniary and knowledge externalities to the host economy (see the seminal paper by Blomström and Kokko, 1998). All these effects attached to the attraction of FDI may explain the reason why policy makers have started to treat foreign investment even more favourably than investment by domestic firms (Görg and Greenaway, 2004). Most of the literature on the effects of FDI on local contexts has concentrated on spillovers of FDI (technological or pecuniary) on productivity. In this report we focus instead on FDI impact on domestic firms’ survival. This approach has been explored quite recently (see the seminal paper by Görg and Strobl, 2003). This line of analysis allows us to test the hypothesis of FMNEs’ “footloose” behavior and leads to a better understanding of the spillover effects of FDI.2 The evidence on FDI productivity spillovers might be overestimated if it overlooks the crucial issue of firm turnover, which shapes the competitive landscape of the economy, is linked to the persistence of jobs, has an important impact on welfare in the economy and is an important factor of fragility of the economy in many countries. The analysis of survival also allows us to measure the FDI impact on firm performance overcoming the input endogeneity and simultaneity problems typical of productivity estimations. Hence, our report using firm level data on Italian and Turkish manufacturing industries investigates the dynamics of firm survival and growth, and the spillover effects from foreign-owned to domestic firms on domestic firms’ survival and growth. We investigate the differences in survival patterns of foreign owned and domestic firms testing the hypothesis of foreign multinational enterprises (FMNEs) “foot-loose” behavior (in line with seminal studies such as Görg and Strobl, 2003, Mata and Portugal, 2002, Van Beveren, 2007, Bandick, 2010). Furthermore, we study the effects of FDI on the survival and growth prospects of domestic firms following the literature on the transmission of technological and pecuniary FDI externalities to domestic firms (Görg and Strobl, 2003; De Backer and Sleuwaegen, 2003; Burke et al., 2008; Girma and Gong, 2008; Bandick, 2010; Wang, 2010; Kosovà, 2010). The aim of this report is to contribute to the empirical literature on firm survival and foreign investment studying the case of Italy and Turkey which over the last decade both entered a process of progressive increase in FDI and are both affected by a high rate of firm mortality. While previous firm-level studies for these countries analyzed the impact of FDI on domestic firm productivity, we focus on the effect of foreign ownership on firm survival and employment growth of Italian and Turkish manufacturing firms. Firm exit and growth are the underpinnings of job creation and destruction. Knowing how FDI affects these variables will help us not only
2 The presence of FDI may increase average productivity of domestic firms through two different
channels: forcing them to be more productive and eventually eliminating inefficient firms by intensified competition, or, alternatively, inducing technology or pecuniary spillovers. Hence, a simple positive correlation between the presence of FDI and higher productivity of domestic firms, as found in some studies, does not necessarily imply the existence of spillovers from foreign to domestic firms but simply a process of entry and exit of firms which contributes to aggregate productivity growth to the extent that more productive new firms displace obsolete ones.

18
better assess the impact of FDI on domestic firms’ performance but also better understand the impact on the entire economy. How foreign firms contribute to domestic firm dynamics and to what extent achieving a stronger degree of foreign investment might imply a displacement impact or a positive spillover effect on firms in the economy are issues of great interest to both policy makers and academics. Hence, we provide original contribution to the literature and lead to interesting policy conclusions. The two studies are largely comparable as we estimate similar empirical models. For each country we focus on three sets of questions:
1. How different are firm exit and employment dynamics according to ownership (foreign/domestic)? Are these patterns different in modern versus more traditional segments of production? In line with the theoretical work by Helpman et al. (2004) we consider the heterogeneity of firms. Hence, we carry out theoretically and empirically the analysis of firm survival distinguishing between foreign multinationals,domestic multinationals and domestic non multinational firms and controlling for those variables that might enhance the persistence of firms on the market and attract more stable FDI, above all global engagement, dimension, productivity, and investment in R&D. We also test for distinctive patterns of survival in high versus low technology industries. Regarding this topic, we assume that in a process of creative destruction, the major factor impacting on firm survival is a firm's ability to innovate (Audretsch, 1991). Higher volatility of behaviour of foreign and of domestic firms is expected in low technology sectors following the literature.
2. We also ask how the presence of FAs affects domestic firms’ survival and employment growth. More specifically, we ask the following questions. Do indigenous plants tend to have shorter lives (more deaths) due to competition with FDI affiliates operating in the same industry? We will also focus on a topic so far neglected in the literature: the role of vertical technological spillovers and pecuniary externalities on firms’ survival. We ask whether firms are benefiting from FDI affiliates operating in upstream and downstream industries as input suppliers and customers. Another question we explore is the asymmetric impact of FAs on domestic firm survival rates according to the technological intensity of production at the sectoral level and to the technological capacity of domestic firms.
3. We also investigate upon the effects of the recent global crisis on firms’ survival and employment growth according to firm ownership status. The focus is upon issues of firms financial fragility and behaviour of foreign investors in a context of turbolence. In this part, we examine the determinants of firm survival (extensive margin of firm adjustment) and employment growth (intensive margin of firm adjustment). We want to check whether foreign firms have a stronger resilience in terms of survival and compensate for job losses during the crisis. To this purpose, we use a difference-indifference approach by estimating employment growth equations and allowing the crisis to impact differently on firms growth trajectories according to several control variables (ownership status, involvement in exports, financial health, innovation activities).
The report is organized as follows. Section 2 provides a review of the literature both theoretical and empirical on the different survival and employment dynamics of foreign and domestic firms and on the potential impact of foreign presence on domestic and foreign firms’ survival and employment. Section 3 focuses on the Italian case, providing data and basic stylised facts about FDI and firm mortality in Italy (3.1 and 3.2.); the empirical strategy to analyse foreign ownership and the different dynamic of firm (3.3), the analysis of horizontal and vertical impact of foreign affiliates on survival (3.4), the study of the behaviour of foreign affiliates vis à vis domestic firms over economic crises (3.5). Section 4 analyses the same issues for Turkey following the same organisation in subsections. Finally, section 5, concludes and draws policy implications, comparing the Turkish and Italian results and providing some policy implications and generalization of the results to the whole South Mediterranean region.

19
Some methodological issues
A special effort has been devoted to make the two studies comparable by estimating similar empirical models, but we were unable to avoid some data restrictions and discrepancies which explain the different empirical approach adopted in some cases. First, the Turkish survey is totally exhaustive for establishments with 10 or more employees. All the Turkish firms have to answer the survey, so we have information about all firms after 1982, in particular firms created after 1982 and those who exited the market after 1982 above 10 employees. So in the Turkish case we have an unbalanced panel of more than 150,000 observations per year for the 1983-2001 period and of more than 18,000 observations for 2003-2009. For Italy the first dataset deployed (2004-2008) is very large (an unbalanced panel of about 900 thousand observations) which is highly representative of the entire universe of corporate companies (in 2007 it covers about 87 percent of total employees declared by the Italian National Institute of Statistics), but there is a discrepancy with respect to the entire population due to the fact that it only covers corporate enterprises. The second dataset we use, the survey for 2002-2010, is stratified and randomly selected so to reflect sector’s geographical and dimensional distribution of Italian firms with 11 to 500 employees.3 This sample has three advantages: allows to expand the time span back and forward (2002-2010), to identify the firms in the sample that were exporters over the period, to include the crisis years (2008 and 2009). However it is quite small compared to the Turkish dataset (we have 4,066 firms and an unbalanced sample of 32.131 observations). This creates some important limitations which need to be underlined: we cannot do separate estimates for domestic and foreign firms due to the limited number of observation; besides, as in this panel we do not have year by year entry we cannot focus on new firms. Nevertheless, we follow similar estimations strategies in the two studies, as far as we are able to. Firm survival was measured in both studies following hazard models and growth was estimated by GMM-system and Heckman models to eliminate potential simultaneity, endogeneity and selection biases.
3 For both Italy and Turkey the data used are not exhaustive for small firms.

20
2. Literature review*
2.1 FDI effects on firm survival: a theoretical overview of key hypotheses
Little attention has been paid in the literature on how foreign presence affects the host country firms’ survival. Theoretically, foreign owned firms survival dynamics are ambiguous. On the one hand, the “footloose” character of MNEs is justified by the fact that, as part of an international production network, these firms can easily relocate production between countries in response to adverse shocks in the host country (FMNEs) or to changes in local costs (DMNEs). Using optimal portfolio theory, Flamm (1984) showed that U.S. multinationals rapidly adjust their operations to changes in host country environments based on particular country risks. The exit propensity might also depend on the nature of FDI involved: if FDI is horizontal – which occurs when a firm duplicates its home country-based activities at the same value chain stage as in the host-country - then FMNEs may be less likely to close plants since they are mainly motivated by market-seeking determinants and serve a target market and as such lees likely to be influenced by changes in production costs in host countries. Conversely, vertically integrated firms might be more likely to close as they are more sensitive to changes in costs of production and sudden shocks (this kind of investment is primarily driven by cost-saving forces and opportunity costs) (Inui et al., 2009). On the other hand, the “rooted” character of MNEs may be justified by a result that emerges from the finance literature, which analyses the impact of sunk entry costs on firm exit (Dixit and Pindyck, 1994): the larger the amount of irrecoverable costs, the greater the value of waiting before making an exit decision. So, it could be argued that if the sunk costs of investing abroad are higher than those for setting up a purely domestic plant in the host country, foreign affiliates are less likely to exit. However, it should be noted that on this point the arguments are quite controversial. Some authors, in fact, state that MNEs should face higher sunk costs when establishing a new firm because new firms are typically more skill- and capital-intensive than incumbent firms. Vice versa, other authors claim that MNEs, such as multi-unit enterprises, are likely to benefit from lower sunk costs in terminating plant’s operations, due to the greater efficiency of their internal factor markets in re-deploying the production equipment and labour force of the closed plant (Baden-Fuller, 1989). However, foreign firms on average may have superior technological and managerial skills that enable them to develop successful entry strategies. Therefore, self-selection before entry may increase the survival probability of foreign firms. On the other hand, observation of plant level data suggests that after acquiring a firm, foreign firms tend to shut some plants. Acquisition entry has been found to have a 60 per cent shorter survival time than Greenfield entry (Girma and Gorg, 2003; Harris, 2009). Recent empirical work on productivity differences between firms shows that MNEs, regardless of whether they are domestic or foreign-owned, exhibit a “productivity premium” compared to purely domestic firms (Criscuolo and Martin, 2009). This ties in with the literature on firm heterogeneity (Helpman et al., 2004) which shows that a firm’s status in terms of global engagement is crucially related to the firm’s performance. In this context, foreign multinationals may have a higher probability of survival because on the one hand foreign capital participation may itself be signalling unobserved quality of the affiliate firm (cherry-picking hypothesis), and/or on the other, it may be a vehicle for acceding to more advanced foreign technologies and, therefore for improving firm efficiency. Similarly, we can argue that domestic multinationals should exhibit better survival dynamics compared to domestic non MNEs, because only the more productive firms are able to become multinationals (self-selection effect), and/or investing abroad improves firm efficiency (learning effect). Another important and widely investigated issue in the literature is the impact of FDI on domestic firms. Multinational firms may have both direct and indirect effects on host economies. The direct effects are related to the fact that foreign multinationals enterprises are usually more productive than domestic-owned firms. Therefore, by attracting FMNEs a country can increase its aggregate productivity by a pure composition effect (Doms and Jensen, B.,
* Authored by Anna Maria Ferragina.

21
1998). However, foreign multinationals also have an indirect impact on domestic firms and this may be compounded of a competition effect and a spillover effect through pecuniary and knowledge externalities.4 However, the technological superiority of foreign firms, larger, more productive and more capital and skill intensive than their domestic counterparts, does not necessarily imply any productivity benefit spilling over to the host economy’s firms. The large and overwhelming strand of literature on the effect of FDI on local contexts has focused primarily on examining the spillovers effects on firms productivity (see Görg and Greenaway, 2004a, Hanousek, Kočendab and Maurel, 2010, and Havranek and Irsovà, 2010, for a survey of this large literature). Within this framework, the empirical literature has identified three main channels through which FDI impact on domestic-owned plants: horizontal intra-industry economic linkages, vertical upstream and vertical downstream inter-industry linkages.5 Building on this research, recent empirical works (Görg and Strobl, 2003; De Backer and Sleuwaegen, 2003; Görg and Strobl, 2004b; Burke et al., 2008; Girma and Gong, 2008; Bandick, 2010; Wang, 2010; Kosovà 2010) have investigated the issue of the transmission of technological and pecuniary FDI externalities to firms survival. There are two main advantages stemming from this new approach which deserve some consideration. Firstly, while the measurements of productivity spillovers entails the problem of input measurement, and therefore face the input endogeneity problem typical of productivity estimations, the estimation of firm exit largely avoids measurement problems. More importantly, the research on FDI spillovers has neglected the possibility that domestic firms may exit as a result of foreign competition. Therefore, the positive evidence on productivity spillovers might be overestimated. The current literature on FDI only focuses on multinationals’ and host countries’ (static) characteristics neglecting the process of competition. However, the competition process is crucial for understanding the interactions between foreign and domestic firms, and, hence, the effects of FDI on the host economy. For example, the presence of FDI may increase average productivity of domestic firms by two channels: forcing them to be more productive and/or eliminating inefficient domestic firms by intensified competition; alternatively, through technology spillovers. Therefore, a simple positive correlation between the presence of FDI and higher productivity, as found in some studies, does not necessarily imply the existence of spillovers from foreign to domestic firms. As discussed in Görg and Strobl (2003) the theoretical a priori are quite ambiguous. On the one hand, foreign establishments are likely to intensify competition and may force domestic establishments go out of the market. Multinationals may also have negative effects on firm survival via their higher output and wages. They would hence push up domestic firms average costs of production and produce a selection/crowding out effect as described in the prominent work by Aitken and Harrison (1999).6 On the other hand, domestic firms may benefit from spillovers, of knowledge or pecuniary, from foreign establishments.7 Within this framework, the empirical literature has identified three main channels through which FDI impact on domestic-owned plants: horizontal intra-industry economic linkages
4 The literature has mainly focused on testing the indirect impact of FDI due to the fact that estimating
the direct effect is complicated by several issues as foreign firms and domestic firms are heterogeneous enterprises and contrasting the former with the latter entail building a counterfactual to avoid the selection bias due to the different size, productivity and performance of foreign and domestic firms. 5 Horizontal intra-industry linkages refer to the economic relationships between domestic- and foreign-
controlled affiliates within the same industry, mainly through competition for market shares. Upstream inter-industry linkage is the economic relationships of a local firm with foreign firms in forward industries through purchasing intermediate inputs from them, downstream inter-industry linkage is the economic relationships of a local firm with foreign firms in backward industries through selling products to them. 6 These authors argue that foreign firms producing at lower marginal costs than indigenous firms have
an incentive to increase output and attract demand away from indigenous firms. This will cause host country rivals to cut production which, if they face fixed costs of production, will raise their average cost and, therefore, reduce their probability of survival. A different competition effect is also described in the literature: multinationals, due to their advantages, may use foreign acquisitions in order to gain market access take over a rival and closing it down afterwards. 7 FDI knowledge and technology spillovers occur when the benefit from FDI are not completely
captured by monetary transactions due to the public good nature of knowledge transmission. FDI pecuniary spillovers are instead fully captured by prices.

22
between domestic- and foreign-controlled affiliates within the same industry, mainly through competition for market shares but also through imitation, demonstration and labour mobility (Bomstrom and Kokko, 1998); vertical upstream and vertical downstream inter-industry linkages, i.e. the economic relationships of a local firm with foreign firms in forward industries through purchasing intermediate inputs from them and linkages of local with foreign firms through selling products to them. A common assumption made in the literature is that there is a potential technology gap between domestic firms and MNEs (due to MNEs' firm-specific assets)8, and this creates the opportunity for transfer of more efficient technology and managerial practices from foreign to domestic firms.9 However, theoretical arguments assess that intra-industry FDI effects are less likely as the diffusion of technology and know-how to their local competitors is not in the strategic interest of foreign affiliates, especially when the technological superiority of the foreign affiliates is the main element of their competitive advantage in the host market.10 Conversely, spillovers from inter-industry linkages are much more likely. When FDI affiliates are customers of domestically-owned firms they will often provide technical assistance to them, in order to have a high-standard and stable stream of input suppliers. These, backward linkages with domestic suppliers may lead to vertical FDI downstream spillovers with increased productivity and lower prices in upstream industries (Blalock and Gertler, 2008). Furthermore, the linkages between local final-good producers and foreign suppliers, may also help the diffusion of the foreign technology through the local economy if foreign affiliates provide local firms with more variety and good quality inputs in upstream industries. These forward linkages might be an effective channel through which FDI may transfer technology to the host economy (vertical FDI upstream spillovers). An increase in productivity through technology or pecuniary spillovers will reduce a host country firm's average cost of production, so increasing their price-cost-margins with a positive effect on firm survival (see e.g. Audretsch, 1991 and 1995). However, the intensity of linkages between foreign and domestic firms and the extent to which those linkages will generate technology transfers depends also on other crucial elements, particularly the technological capacity of domestic firms. The lack of absorptive capacity is another traditional explanation for the absence of the horizontal technology spillovers. Caves (1996) argues that the likelihood that MNEs will crowd out local firms is larger in developing than in developed countries because of a higher technology gap between domestic and foreign firms. The technology gap may also prevent inter-sectoral spillovers through vertical linkages. More precisely, if the technological gap between the foreign buyer and the domestic supplier is considerable, one can suppose that the foreign firm will be reticent to purchase specialized intermediates from domestic suppliers. Besides, in the presence of technology transfer the suppliers will not have the capacity to absorb this technology and to develop the intermediate goods. Similarly, if the gap between the domestic final-good producer and the foreign supplier is significant, the former will lack the capacity to absorb and to benefit from the foreign technology incorporated in the input. This view is supported by the technological-accumulation literature (see Cantwell 1989; Kokko 1994; Takii 2005; Dimelis 2005; Hamida
8 Multinationals are generally assumed to have some sort of firm specific asset or efficiency advantage
that enables them to operate abroad successfully (Markusen, 2002; Helpman et al., 2003). 9 The channels of impact on firm survival in sectors that supply inputs to multinationals is described by
Markusen and Venables (1999). According to this model, the presence of multinationals has three effects on the host economy. First, there is a negative competition effect as multinationals compete with domestic final good producers. The increase in total output due to multinationals production decreases the market price, which leads to the exit of some domestic firms. Hence, there is a demand effect as multinationals create additional demand for domestically produced intermediate goods through linkages with indigenous suppliers inducing the entrance of new intermediate producers. Then, a derived third effect takes place through a fall in the price of intermediates which induce the entry of domestic final good producing firms. The latter two positive effects may outweigh or not the potential negative competition effect.See also Rodriguez-Clare (1996) which sets up a theoretical model in which multinationals benefit a host country by expanding the set of intermediate inputs available there. 10
Gorg and Greenaway (2004a) in their review of the literature on the impact of FDI on productivity conclude that the net effects of FDI are often found negative: competition effects generally dominate potential technology and pecuniary spillover as FDI affiliates try to safeguard their technology as tightly as possible. See also Castellani and Zanfei (2007).

23
and Gugler 2009). However, the theoretical and empirical literature on the relation between the level of technology gap and the absorptive capacity of firms is split. Findlay (1978), later on Wang and Blomstrom (1992), Blomstrom and Wolff (1994), and more recently Jordaan (2008) and Jabbour and Mucchielli (2007) find that the potential for positive spillovers is higher when the technology gap between domestic firms and MNEs is large. This argument is based on the idea that firms with lower stocks of technology have a greater scope for technological accumulation in that they have a larger stock of established knowledge to assimilate.. Finally, the technology of the sector to which the firm belongs to is also relevant. It has been argued that domestic firms in high tech sectors should be more likely to benefit from positive spillovers as they can be assumed to have relatively high levels of technology themselves and thus to have the necessary stock of knowledge which allows them to utilise spillovers from multinationals (Görg and Strobl 2003). However, this is not necessarily the case. In high tech sectors firms are generally more competitive, besides, MNEs have more incentives to prevent technology leakages to their competitors (Burke et al. 2008). To sum up, we may conclude that the effect of MNCs on the survival of host country firms is ambiguous on a theoretical ground. The presence of foreign plants will change competitive conditions in the market. Foreign plants are likely to intensify competition, and may force domestic plants out of the market (Caves 1974; Blomström and Sjöholm 1999). This has, of course, efficiency-improving effects because the least efficient domestic plants tend to exit first. At the same time, domestic plants may benefit from spillovers from foreign firms, and become more competitive in domestic and, more importantly, in international markets. If the spillover effect is dominant, then the survival probability of domestic firms will be enhanced by the presence of foreign firms in the same market.
2.2. Survival dynamics of foreign and domestic firms: empirical evidence
The factors determining the probability of firm exit have been extensively analysed in the Industrial Organization literature. In particular, there is a large body of empirical evidence which has modeled the likelihood of firm’s survival as a function of several variables, designed to reflect both firm characteristics, e.g., age, size, technological level, profitability, and industry characteristics, such as, among others, market concentration, growth (see among others Dunne et al., 1988; Caves, 1998 and subsequent studies for different periods and countries (e.g. Audretsch and Mahmood, 1995; Audretsch et al., 1999; Mata and Portugal, 1994; Disney et al., 2003).11 Only recently the literature has opened a further strand of research by trying to analyse the impact of multinational ownership on survival probability (see the seminal papers by Mata and Portugal, 1994 and 2002; Bernard and Sjöholm, 2003; Görg and Strobl, 2003; Girma and Görg, 2004). The literature review included in this section is not exhaustive but is limited to the research studies that we consider relevant to the purpose of our Report. A synoptic view of this literature is in Tab. 2.2.1., which summarises in detail the results of 30 country specific studies, also describing the span of time covered, the methods used and the most important findings. Empirically, we can distinguish three groups of studies. A first one has compared “foreign-owned” and “domestic firms” survival rates. 12 The findings are country sensitive. In some of these studies - after controlling for firm and industry differences - FMNEs are found to be more footloose than domestic firms (see, among others, Colombo and Delmastro, 2000 for Italy; Bernard and Sjöholm, 2003 for Indonesia; Görg and Strobl, 2003 for Ireland; Girma and Görg,
11
Dunne et al. (1988) established that plant survival is positively associated with size and that exit rates vary across industries. Subsequent studies have confirmed these findings for different periods and countries (e.g., Audretsch and Mahmood, 1995; Audretsch et al., 1999; Mata and Portugal, 1994; Disney et al., 2003)
. However, two recent studies by Bottazzi and Tamagni (2011) and Bottazzi et al.
(2011) on business failure proxied by financial firm defaults events have challenged the general wisdom that death rates of firms decrease as size increases and demonstrate a positive relationship between size and the event of default. 12
For a more detailed review please refer to Wagner and Gelubcke (2011), and to their synoptic table at p. 26, which summarise in detail the results of 22 country specific studies, also describing the span of time covered, the methods used and the most important findings.

24
2004 study of acquisitions of a domestic establishment by a foreign owner in UK; Pérez, Sanchis Llopis and Sanchis Llopis, 2004 for Spain, Alvarez and Görg, 2009 for Chile), while in other studies they are found to have the same chances of survival as domestic firms (Mata and Portugal, 2002 for Portugal; Ozler and Taymaz, 2007 for Turkey; Kimura and Kyota, 2007 for Japan). Gibson and Harris (1996) and Li and Guisinger have found that, for New Zealand and USA resepctively, foreign firms are less likely to exit than domestic firms and also Baldwin and Yan (2011) find that foreign owned plants have much lower failure rates that domestic plants but their survival rates are more sensitive to changes in tariffs and eschange rates.13 A second strand of literature has focused on comparing domestic multinational and non multinational survival behaviour. Bernard and Jensen (2007) and Giovannetti et al. (2009), controlling for plant (firm) and industry attributes, find respectively that U.S. and Italian multinationals exhibit higher failure risks. Using longitudinal panel data on Japanese firms, Kimura and Kiyota (2006) find that overseas investment has a negative impact on firm survival. Finally, more recently a group of authors have compared three firms’ categories: foreign multinationals, domestic multinationals and non multinational domestic firms (Kimura and Fujii, 2003; Van Beveren, 2007; Inui, et al., 2009; Bandick, 2010 and Bandick and Gorg, 2010). The results are also quite mixed. Kimura and Fujii (2003) show that foreign shareholders do not exhibit a footloose behaviour while Japanese firms, if small and globally committed via FDI, appear less likely to survive. Inui et al. (2009) find that foreign ownership raises plant exit rates but the effect is only weakly significant, while Japanese multinationals are much more likely to shut down plants. Bandick (2010) further suggests that FMNEs and export active plants have higher survival rates than both domestic non-exporting firms and DMNEs. Besides, foreign acquisitions increase the life time of plants if they were exporters (Bandick and Gorg, 2010). Taking changes over time into account, Kronborg and Thomsen (2009) find a declining survival premium for foreign companies in Denmark during the period 1895 to 2005 which disappeared in the last decade. Van Beveren (2007) finds that foreign multinationals are more likely to shut down operations compared to national firms and to DMNEs both in manufacturing and in service sectors.
13
In this study for New Zealand the result was probably influenced by the increasing trade liberalisation taking place over the period analysed.

25
Country Author(s)
(Year of publication)
Period covered
Topics investigated Method used Important findings
Belgium Van Beveren (2007)
1996-2001 Impact of multinational ownership on exit decisions
Cox proportional hazard model
Foreign MNEs are more likely to shut down compared to national firms in manufacturing and services. Domestic multinationals exhibit higher exit rates in manufacturing.
Canada Baldwin and Yan (2011)
1979-1996
Effects of changes in tariffs and real exchange rates on plant death
Probit estimates for exit
Foreign-owned plants have much lower failure rates than domestic plants but their survival rates are more sensitive to changes in tariffs and exchange rates.
Chile Alavarez and Gorg (2009)
1990-2000
Whether affiliates of foreign multinationals more likely to exit than domestic firms- How the exit probability of multinationals depend on its export orientation.
Probit estimates for exit
Foreign plants are more likely to exit the economy only during the late 1990s, a period when the Chilean economy experienced a massive slowdown. However, only domestic market oriented multinationals responded to this negative shock by being more “footloose”.
Denmark Kronborg and Thomsen (2009)
1895-2005
Long-term survival patterns of foreign and domestically owned companies
Cox hazard model
Survival premium in favor of foreign-owned companies which declines over time and disappears in the last decade.
Germany Wagner (2011)
2007-2008
Survival premia of foreign owned firms over domestically controlled firms
Probit and rare event logit estimates
Ceteris paribus higher risk of exit for foreign owned firms in West Germany but not in East Germany
Greece Georgopoulos and Lalountas (undated)
1960-2001 Impact of changing environmental factors on plant survival
Cox hazard model No differences between domestic and foreign plants in the long run.
Indonesia Bernard and Sjöholm (2003)
1975-1989
Association of foreign ownership with plant survival in a developing economy
Semi-parametric estimation of hazard function
Foreign-owned plants are more likely to survive. Once controlled for size and productivity they are more likely to close.
Ireland Godart, Görg, and Hanley (2012)
2006-2009 Exit probabilities of foreign and domestic firms during crisis
Hazard function estimates
Increasing likelihood of exit in manufacturing and services for all firms but no difference for foreign-owned. Only EU firms were 40 percent less likely to exit before the crisis.
Ireland Görg and Strobl (2003a)
1973-1996 Exit probabilities of foreign and domestic plants
Cox proportional hazard model
Foreign multinationals have lower survival rates, ceteris paribus.

26
Ireland Görg and Strobl (2003b)
1973-1996
Effect of the presence of multinationals on survival of indigenous and foreign plants
Cox proportional hazard model
Foreign plants have a higher chance of exiting than indigenous plants, once controlled for other determinants.
Ireland O’Farrell and Crouchley (1983)
1973-1981 Analysis of industrial closures at plant level
Logit estimates
Foreign MNEs have a higher closure probability than indigenous single and multi-plant units. Closure probabilities of different overseas groups do not differ.
Italy Colombo and Delmastro (2000)
1989-1997 Relation between size, ownership status and plant’s closure
Probit estimates
Likelihood of survival would seem to be larger for foreign owned units than for establishments of Italian groups.
Ferragina et al. (2011)
2004-2008 Impact of multinational ownership on exit decisions
Cox proportional hazard model
Foreign MNEs are more likely to shut down compared to national firms in manufacturing and services. Domestic multinationals exhibit lower exit rates in services.
Japan Kimura and Fuji (2003)
1994-99
Connection between the global commitment of firms and their survival
Cox proportional hazard model
No statistically significant evidence that firms with foreign shareholders are more likely to exit.
Kimura and Kiyota (2007)
1994-1998 Exit probabilities of foreign and domestic plants
Probit estimates
No difference in the probability of exit between foreign-owned and domestically-owned firms.
Inui (2009)
1994-2005
Why multinational ownership increase the probability that a plant will exit.
Multivariate Probits of Plant Exit within Multiplant Firms.
Plants belonging to a multinational are 9 percentage points more likely to exit. The“footloose” effect is attributable to multinationals closing their weakest plants. Plants that are small, capital un-intensive and have low input intensities relative to the firm are more vulnerable to closure within multinationals.
Portugal Mata and Portugal (2004)
1983-1989
Comparison of the entry and post-entry process by foreign and domestic firms
Hazard rate estimates
Domestic entrants are much more likely to exit, both greenfield and acquisition.
Portugal Mata and Portugal (2002)
1983-1989 Survival of domestic and foreign entrants
Cox proportional hazard model estimates
Chances of survival not different after controlling for other determinants.
Spain Pérez, Sanchis Llopis, and Sanchis Llopis (2004)
1990-1999 Factors determining Spanish manufacturing firms’ survival
Cox proportional hazard model estimates
Firms with foreign capital participation have a higher risk of exit.

27
Sweden Bandick (2010)
1993-2002
How different ownership structures affect plant survival, separating plants into those owned by foreign MNEs, domestic MNEs, exporting non-MNEs, and purely domestic firms.
Complementary log–log model (cloglog)
Foreign MNE plants have lower survival rates than non-MNE plants. However, separating the non-MNEs into exporters and non-exporters, the result shows that foreign MNE plants have higher survival rates than non-exporting non-MNEs, while the survival rates of foreign MNE plants and exporting non-MNE plants do not seem to differ.
Sweden Bandick and Görg (2010)
1993-2002 Survival effect of foreign acquisitions
IV, propensity score matching, and hazard rates
Foreign acquisitions increase the lifetime of plants only if they were exporters.
Taiwan Chen and Wu (1996)
1975-1990
Relationship between divestment and subsidiary characteristics
Hazard rate estimates with Weibull and log-logistic distribution
Foreign ownership contributes to survival.
Turkey Taymaz and Özler (2007)
1983-2001 Differences in survival patterns of foreign and domestic plants
Cox proportional hazard model estimates
Foreign plants are more likely to survive but differences disappear if industry and plant characteristics are controlled for.
United Kingdom Girma and Görg (2004)
1980-1993
Effect of foreign takeover on plant survival in electronics and food industries
Standard hazard model estimates
Foreign takeover reduces the lifetime of the acquired plant.
United Kingdom Fabbri, Haskel, and Slaughter (2003)
1973-1992 Labor demand differences by firm type and nationality
Cox proportional hazard model
Foreign and domestic multinationals are both more likely to shut down as compared to purely domestic plants, ceteris paribus.
USA Li and Guisinger (1991)
1978-1988
Business failures of foreign-owned and domestically owned firms
Comparison of failure rates with non-parametric tests
Foreign-controlled firms fail less often.
Global Alfaro and Chen (2012)
2005-2008
Response of multinational subsidiaries to the crisis relative to local establishments
Matching and probit estimates
Foreign subsidiaries fared better than local counterparts but only in crisis years. Furthermore, establishments sharing stronger vertical production and financial linkages with parents exhibit greater resilience
Global Zaheer and Mosakowski (1997)
1974-1993 Impact of foreignness on survival of currency trading rooms
Event history analysis
Liability of foreignness that declines over time.
Table 2.2.1 Micro-econometric studies on foreign ownership and firm survival
Source Adapted from Wagner and Gelubcke, IZA Discussion Paper n. 6207, December 2011

28
2.3 Previous Studies on the Potential Impact of FDI on Domestic Firms’ Survival
The most investigated issue in the literature on the impact of FDI on host economies is the FDI spillover on firm productivity. The empirical evidence is quite extensive. Early case studies and industry-level findings (Caves, 1974; Blomström, 1986) emphasize that activities of MNEs generate knowledge externalities and several macroeconomic studies (Borensztein, Gregorio & Lee, 1998; Alvarez et al., 2004) provide supporting evidence. However, firm-level panel studies disaggregating by intra-sectoral and inter-sectoral spillovers generally find no clear-cut findings. Mixed evidence is generally found on intra-industry spillovers.14 On the contrary, studies on inter-industry FDI productivity effects suggest the presence of important and positive spillovers. They mainly focus on developing or transition economies and on the channel where domestic-owned firms provide inputs to downstream FDI affiliates (downstream inter-industry linkages).15 Referred to developed countries, both upstream and downstream economic linkages between FDI affiliates and domestic-owned plants are found to be important channels.16 The empirical evidence on the effect of inward FDI on survival of domestic entrants and/or incumbents firms is quite limited (see the synoptic view of this literature in Tab. 2.3.1.). The majority of studies focus on intra-industry spillovers. De Backer and Sleuwaegen (2003) analyze firm entry and exit across Belgian manufacturing industries and find evidence that foreign direct investment discourage entry and stimulate exit of domestic entrepreneurs.17 However, the crowding out effect is moderated or even reversed in the long-run as a result of learning, demonstration, networking and linkages effects. Görg and Strobl (2003 and 2004) distinguish between the impact of foreign MNEs on Irish-owned (indigenous) firms and on foreign-owned ones (i.e., other FMNEs) located in the host country confirming positive spillover effects rather than competition/crowding out. However, this only holds for plants in high tech industries.18 Alvarez and Görg’s (2009) findings suggest that the presence of foreign firms has no effect on plant survival in Chilean manufacturing, after controlling for productivity. Burke et al. (2008) using U.K. single-plant firms also document net positive effects from FDI. They find a negative effect of foreign presence on survival of firms in dynamic industries, alongside a net positive effect in static industries.19 Bandick (2010) investigates how survival of
14
Several studies find that FDI generates positive spillovers on the productivity of domestic-owned firms—Chuang and Lin (1999) for Taiwan, and Branstetter (2005) and Keller and Yeaple (2009) for the US, among others. But others find significant and negative effects of FDI on local firms‘ productivity, see Haddad and Harrison (1993) for Morocco, Aitken and Harrison (1999) in the case of Venezuela. Studies in transitional economies also show negative FDI spillovers in the Czech Republic and in Bulgaria and Romania (Djankov and Hoekman, 2000; Kinoshita, 2000; Sabirianova et al., 2005),) and no spillovers in Poland (Konings, 2001). 15 At the firm level, the seminal paper by Javorcik (2004) finds substantial FDI spillover effects to Lithuanian-owned firms through these economic linkages (termed backward linkages). Similar findings are in Bwalya (2006) for Zambia, Blalock and Gertler (2008) for Indonesia, Marcin (2008) for Poland, Javorcik and Spatareanu (2008) for Romania and Jordaan (2008) for Mexico. 16
Lileeva (2010) find significant FDI spillover effects on Canadian-owned manufacturing plants as input suppliers. Jabbour and Mucchielli (2007) find positive and significant FDI spillovers through both forward and backward inter-industry linkages in Spain but conditioned on a certain level of absorptive capacity, and so is Wang (2010) which studies the productivity effects of FDI for Canadian manufacturing industries. 17
These results are in line with theoretical occupational choice models in open economy (Grossman, 1994), that predict foreign direct investment would crowd out domestic entrepreneurs through their selections in product and labour markets. 18 The presence of foreign firms will change competitive conditions not only for domestic establishments but for other foreign establishments as well. It is suggested that a foreign presence may generate positive information externalities for foreign entrants. Görg and Strobl (2003a) found that a foreign presence has no effect on foreign firms’ survival in high technology sectors, but it has a positive impact in low technology sectors in Irish manufacturing. Thus, the empirical evidence indicates that foreign presence in an industry may enhance other foreign establishments’ survival probabilities. 19
The explanation the authors provide for this result is that dynamic markets are typically characterised by high rates of churn (firm entry plus exit relative to the stock of firms) as they are at earlier stages of

29
domestic plants is determined by the presence of foreign ownership disentangling between domestic MNEs, export active plants and purely domestic oriented plants. The results reveal that foreign presence has negative effects on the survival of purely domestic firms while does not impact on the exit rate of Swedish MNEs and Swedish non multinationals exporting plants. Kosová (2010) using 1994–2001 firm-level data for Czech R. find evidence of technology spillovers and underline that crowding out is only a short term phenomenon. However, domestic firms in technologically advanced industries are the main beneficiaries of technology spillovers in the Czech Republic. Two recent studies extend upon this literature differentiating the effects of FDI on domestic plants‘ survival across three channels of linkages: intra-industry, upstream, downstream. Girma and Gong (2008) using Chinese state-owned enterprises (SOEs) data find that intrasectoral competition from sectoral FDI has a deleterious impact on growth and survival probability of SOEs due to low absorptive capacity, export-oriented FDI in downstream sectors also have negative spillovers on performance while there are no discernible spillover effects that can be attributed to FDI in upstream sectors. Wang (2010) examines Canadian indigenous plants‘ survival though their economic linkages with FDI. The study finds that indigenous plants tend to have shorter lives due to competition with FDI affiliates operating in the same industry, but theybenefit from FDI affiliates operating both in upstream and downstream industries as input suppliers and customers. The positive benefits of FDI outweigh the negative competition effects, resulting in a net positive impact on survival.20
the diffusion of innovation. In these types of markets, new ventures are often innovative and tend to introduce new technology (Audretsch and Mahomood 1995, Geroski, 1995). By contrast lower churn (more static) industries are associated with later stages of innovation diffusion where price competition become more prevalent. In dynamic industries the relationship between them is more likely to be competitive hence, has a greater chance of being negative for survival. By contrast, in static industries new ventures are more imitative and hence have more scope to benefit from knowledge spillovers from foreign firms. 20
Ayyagari, M. Kosová, R. (2010) also investigate the role of horizontal and vertical spillovers in the Czech Republic during 1994–2000 on firm entry. They find that larger foreign presence stimulates the entry of domestic firms within the same industry, indicating the existence of positive horizontal spillovers from FDI. Their results also show that entry spillovers through vertical linkages are stronger than horizontal spillovers and that while service industries benefit from both horizontal and vertical spillovers, manufacturing industries do not experience significant positive entry spillovers at all.

30
Country/Author(s)/Year of publication
Period covered
Topics investigated Methods
used Main findings
Ireland Gorg and Strobl (2003)
1973-1996
Effect of the presence of multinationals on survival of indigenous and foreign plants
Cox proportional hazard model estimates
Positive spillover effects rather than competition/crowding out for plants in high tech industries.
Belgium De Backer and Sleuwaegen (2003)
1990-1995
Effect of the presence of multinationals on firm entry and exit across Belgian manufacturing industries
Cox proportional hazard model estimates
In the short run: foreign direct investment discourage entry and stimulate exit of domestic entrepreneurs. However, evidence of structural effects of FDI fostering domestic entrepreneurship due to learning, demonstration, networking and linkages effects.
UK Burke, Görg and Hanley (2008)
1997-2002
Impact of foreign presence (share of employment by MNCs at the industry level) on the survival of business start ups in U.K.
Cox proportional hazard model estimates
A negative effect of foreign presence on survival of firms in dynamic industries, a net positive effect in static industries.
Sweden Bandick (2010)
1993-2002
Impact of foreign presence (share of employment by MNCs at the industry level) disentangling domestic MNEs, export active plants and purely domestic plants.
Cox proportional hazard model estimates
Negative effects on the survival of purely domestic firms while does not impact on the exit rate of Swedish MNEs and Swedish non multinational exporting plants.
Czech R. Kosová (2010),
1994–2001
Impact of foreign presence (share of employment by MNCs at the industry level) on growth and survival of domestic firms
Both continuous models (parametric log-normal model, non parametric Cox model ) and discrete method: probit.
Evidence of both technology spillovers and crowding out as a short term phenomenon: growing foreign saler increase domestic firms survival and gowth expecially in technologically advanced industries are the main beneficiaries of technology spillovers.
Girma and Gong (2008) 1999-2005 FDI competition to Chinese state-owned enterprises (SOEs)
Cox proportional hazard model estimates.
Deleterious impact on growth and survival probability of SOEs, export-oriented FDI in downstream sectors have negative spillovers on performance while there are no discernible spillover effects from FDI in upstream sectors.
Wang (2010) 1973-1997
Canadian indigenous plants‘ survival though their economic linkages with FDI affiliates as competitors, input suppliers and customers.
Log normal accelerated failure time model
Indigenous plants tend to have shorter lives due to competition with FDI affiliates operating in the sam e industry, but benefit from FDI affiliates operating both in upstream and downstream industries as input suppliers and customers.
Table 2.3.1 Microeconometric studies on the impact of FDI on firm survival
31
2.4 Empirical evidence on ownership and firms resilience over economic slowdowns
As seen from previous sections, in the recent literature on firm survival, export activities and international production are largely investigated (Görg and Strobl, 2003; Kimura and Fujii, 2003; Bernard and Sjöholm, 2003; Ozler and Taymaz, 2007; Esteve Pérez et al. 2004; Alvarez and Görg, 2009; Wagner, 2011 and 2012). However, the impact of foreign investment during an economic slowdown ha received little attention so far. MNEs can either help to alleviate the crisis’ effects owing to their ownership advantages and their consequent superior performance, or add to macroeconomic instability due to the easiness with which they can transfer production facilities from one country to another. At macro level during the recent global crisis the foreign channel seems to have played an important role in magnifing the negative impact: countries more involved in international trade and FDI seem to have been hit more by the recent downturn, although the recovery has also been more accelerated in these countries thanks to the export channel. The debate is still open in literature. There are ambiguous a priori on the way MNEs react to an economic shock. In the following we sketch out some theoretical arguments to answer these questions. First of all, the different response of foreign and domestic firms to the financial crisis might be related to their different distribution across sectors, size and to their different exposition to external market. Secondly, MNEs have access to both internal and international financial markets, which allows them to diversify their sources of financing and the associated risks and also allows foreign affiliates to be less dependent on host capital markets in their operations as they may obtain credit from their multinational parents. This is crucial especially under a credit tight imposed by a global financial crisis. Thirdly, because MNEs enjoy less bankruptcy risk and adopt international standards in terms of product quality, they find it easier to gain access to domestic banks and so are less sensitive to financial variables than domestic firms (Bridges and Guariglia, 2008; Harrison and McMillan, 2003; Colombo 2001). Furthermore, there is the argument of substantial sunk costs of investing abroad, and the strong investment in long-term relationships and accumulation of firm-specific skills in foreign markets, which might also make MNEs more resilient (Fukao, 2001; Wang et al., 2005). However, there are also reasons to expect MNEs to be more reactive to the negative effects of an economic crisis, and therefore, act as “unstabilising agents”. First of all, having an international production network, they can move production facilities easily between different countries (the “footloose behaviour” hypothesis). Secondly, they are also less linked to the host country by means of input sourcing from local upstream firms. Besides, the local market is often less important for their sales, being multinationals generally more export intensive than domestic firms (Godart et al., 2012). Involvement in value chain production may also matter. Value chain production may act as a factor of propagation and synchronization of a demand crisis. More in detail, if production is organized in value chains across several producers, the whole production network might suffer. Moreover, the just in time nature of many production chains may further complicate matters due to the so-called “disorganisation hypothesis” (Kremer, 1993, Blanchard and Kremer, 1997; Blanchard et al., 2012).21 There is a scant empirical evidence on the specific reaction of foreign firms in terms of both exit behaviour and growth patterns over a crisis. According to the role played by MNEs, these studies can be summerized into three different groups, which respectively find: 1) a stabilising role 2) a destabilising role; 3) no evidence of a (de) stabilising role (see Tab.2.4.1.).
21
This hypothesis states that exogenous shocks which hit intermediate goods can give rise to much larger contractions in output, if the affected inputs are important components of wider production processes. However, a counterargoment by Antras (2003) claims that vertical integration partly eliminates problems with enforcing contracts, making trade within a multinational corporation, or in well integrated production networks, less subject to payment delays or defaults.

32
Results References
FMNEs as “stabilizing” agents
Fukao, 2001; Athukorala, 2003; Wang et al. , 2005; Blalock et al., 2008; Chung & Beamish, 2005; Narioko & Hill, 2007; Desai, et al., 2004 and 2008; Alfaro& Chen, 2012; Tong & Wei, 2010; Kolasa et al., 2010;
FMNEs as “unstabilising” agents Flamm, 1984; Lipsey, 2001; Görg &Strobl, 2003; Alvarez &Görg, 2012;
No evidence of a (de)stabilizing role of FMNEs McAleese & Counahan, 1979; Varum & Rocha, 2011; Godart et al., 2012;
Table 2.4.1 Literature on foreign MNEs performance over a crisis
A discrete number of studies find that MNEs exhibit a better reaction to crises than domestic firms (stabilising role). Many of them stress upon the financial issues. Desai et al. (2004) show that multinational affiliates substitute internal borrowing for costly external finance when facing adverse capital market conditions. In a more recent paper, Desai et. al. (2008) also find that US multinationals located in emerging markets increase operations more than domestic firms in the presence of a currency crisis and they argue that this is due to multinationals being less financially constrained than domestic firms. Blalock et al. (2008) show that, after the 1997 East Asian financial crisis, Indonesian exporters with foreign ownership were able to significantly increase their investment, while domestically owned exporting firms were unable to do so due to financing constraints. Focusing on the recent crisis, with data on 3,823 firms in 24 emerging countries, Tong and Wei (2010) find that exposure to FDI alleviated liquidity constraints. Fukao (2001) and Wang et al. (2005) emphasise the role of substantial sunk costs in investing abroad, in addition to investment in long-term relationships and accumulation of firm-specific skills, as the reasons why foreign firms are unlikely to reply to short term changes in host country conditions. Alvarez and Görg (2012) point to the same conclusion in their investigation of the response of multinational and domestic firms to an economic downturn in Chile: lower employment reductions over the economic crisis with respect to domestic firms (although they are more likely to exit). Kolasa et al. (2010) confirm for Poland that foreign ownership and the consequent involvement in global value chains was a factor influencing firms’ performance in the direction of more resilience to global shocks. Foreign owned firms were better able to cope with the contraction of foreign demand and increased credit constraints as their access to external and intra-group financing supported their sales, trade and investment activity. These results are in line with a recent literature which has found evidence that globally engaged firms, being less sensitive to financial constraints than purely domestic firms, get better performance (Guariglia and Mateut 2005; Blalock et al. 2008; Greenaway et al, 2007; Bridges and Guariglia 2008; Görg and Spaliara 2009). A less optimistic view on multinational behaviour over a crisis (destabilising role as a result of “footloose behaviour”) is supported by the pioneer study of Flamm (1984) where offshoring firms in US semiconductor industry are shown to introduce higher volatility because are more sensitive to the perception of risky production locations. A higher exit behaviour in multinational companies is also found: in Lipsey (2001), for US manufacturing affiliates over three financial crises in Latin America, Mexico and East Asia, in Görg and Strobl (2003), for Ireland, and in Alvarez and Görg (2009 and 2011), for Chile during the late 1990s, when these economies experienced a massive slowdown. Finally, there is a third group of studies that do not find any particular difference in the behaviour of MNEs compared to domestic firms during a slowdown. McAleese and Counahan (1979) for Ireland and Varum e Rocha (2011) for Portugal both find no significant difference in employment growth between domestic and foreign firms. Godart et al. (2012) find that foreign firms did not behave differently than Irish firms in terms of survival during the recent crisis.

33
3. The Italian case
3.1 Stylised facts about FDI and firm mortality in Italy*
FDI in Italy
Although relative to the size of its market and to the EU average Italy still attracts astonishingly little FDI, she has experienced an increasing penetration of foreign firms since 1990. Over the decade before the 2008 crisis Italy’s inward FDI value increased substantially passing from 6,918 million dollars in 1999 to almost 15 thousands million dollars in in 2000, doubled in the following decade reaching up to 44,202 million dollars in 2007. After the serious drop in 2008 recovered at 30,000 million dollars in 2011 (Unctad, 2012) (see Fig. 3.1.1). Given that this project is about the FDI inflows to Turkey and Italy, it is relevant to compare the two countries’ FDI performance. The comparison reveals some similarities over the long-term inward FDI inflows (See Figure 3.1.1). In the 1990s FDI inflows in Turkey and Italy were quite low. Given that Italy has quite high outward FDI flows in the 1980s and 1990s, having rather low inflows differentiates Italy from other EU countries. In the case of Italy, the upward trend in inward FDI flows started in 2000. In the case of Turkey, FDI inflows to the country increased significantly only after the EU Council decision of December 2004 that approved the initiation of membership negotiations with Turkey.
Figure 3.1.1 Italy and Turkey: inward FDI flows (1990-2011, billion USD)
Figure 3.1.2 Inward FDI in Italy, Turkey and selected Mediterranean countries (millions USD; 1992, 2000, 2009)
Sources UNCTAD, World Investment Report
* Authored by Anna Maria Ferragina.
-20
-10
0
10
20
30
40
50
1990 1995 2000 2005 2010
bill
ion
USD
Italy Turkey
0 20000 40000
Syrian Arab Republic
Morocco
Algeria
Croatia
Serbia and …
Lebanon
Turkey
2009
2007
2000
1992

34
In 2007, the number of foreign-controlled firms in Italy amounted at 14,401 (from 11,396 in 2001) with 1,246,794 workers employed (they were 1,003,693 in 2001) and a substantially higher added value (86,401 million dollars from 64,931 in 2001) and investment amount (16,132 from 12,566) (see Tab. 3.1.1.). Although less than 1 per cent of the population of firms in Italy are foreign owned, foreign multinationals accounted for about 13 per cent of net value added, 16 per cent of sales and 27 per cent of R&D in 2007 (see Fig. 3.1.3.) (ISTAT, 2010). The share of foreign firms in investment is considerably higher than the employment share because foreign firms tend to use more capital-intensive technologies.
N. of firms Emloyees Turnover Added Value Investment R&D
(mln Euro) (mln Euro) (mln Euro) (mln Euro)
2001 11,396 1,003,693 364,787 64,931 12,566 2,195
2002 11,905 1,047,697 333,021 63,327 12,139 1,957
2003 14,125 1,074,662 343,301 63,146 11,980 1,834
2004 13,951 1,115,894 383,304 66,516 11,591 1,885
2005 14,012 1,175,235 386,868 67,522 10,310 1,980
2006 14,281 1,206,089 447,192 78,625 15,428 2,186
2007 14,401 1,246,794 472,420 86,401 16,132 2,590
2008 14,375 1,266,789 489,281 88,451 16,566 2,497
2009 14,155 1,221,962 444,544 79,298 13,715 2,511
Table 3.1.1 Foreign owned firms: main indicators (2001 -2009)
Source ISTAT, Indagine sulle imprese a controllo estero in Italia
Figure 3.1.3 Foreign owned firms: main indicators (2001-2009; in percentage of total firms)
Source ISTAT, Indagine sulle imprese a controllo estero in Italia
0,0
5,0
10,0
15,0
20,0
25,0
30,0
35,0
2001 2002 2003 2004 2005 2006 2007 2008 2009
N. of firms
Emloyees
Turnover
Added Value
Investment
R&D

35
From a sectoral perspective, the lion's share of investment is directed to manufacturing. which alone accounted in 2009 for almost 40 percent of foreign firms, 35 per cent of total turnover of foreign firms and 60 per cent of employment. Specifically, the number of foreign firms in the manufacturing sector was 3,301 (with 466,698 workers employed). Retail, wholesale trade and the service sector showed a remarkable dynamism too in recent years. FDI patterns in these sectors reflect change in the national privatisation strategies.
Figure 3.1.4 Italian foreign owned firms by sector (in %; 2003-2009)
Source Reprint, Politecnico di Milano - ICE
Figure 3.1.5 Employees in Italian foreign owned firms by sector (in %; 2003-2009)
Source Reprint, Politecnico di Milano - ICE
Figure 3.1.6 Turnover in Italian foreign owned firms by sector (in %; 2003-2009)
Source Banca dati Reprint, Politecnico di Milano - ICE
0%
20%
40%
60%
80%
100%
2003 2004 2005 2006 2007 2008 2009 Other professonial services Telecommunication and information tech. Logistics and transportation Wholesale trade
0%
20%
40%
60%
80%
100%
2003 2004 2005 2006 2007 2008 2009 Mining Manufacturing Energy, gas and water Building
0%
20%
40%
60%
80%
100%
2003 2004 2005 2006 2007 2008 2009 Mining Manufacturing Energy, gas and water Building

36
Most FDI inflows took the form of take over, first of public firms (privatizations) as privatization of public assets has attracted substantial FDI after 2002, and then of private domestic enterprises. As a result of these take-overs, the number of foreign affiliates among the largest firms has increased significantly, often contributing to the diversification of the economy and the development of a more dynamic service sector. Services such as telecommunications, electricity, water and banks accounted for a large share of FDI inflows after 2000. Greenfield investment, according to the World Investment Report, were only around 40 per cent of total FDI over 2008-2010 (UNCTAD, 2011). Italy is still lagging behind most EU countries in terms of FDI attraction and FDI performances are still far from potential (UNCTAD, 2011). This is also clear if we look at the Figure 3.1.7. This is the graph OECD prepares every year where it plots the FDI stock/GDP ratio with the regulatory restrictiveness of the economic environment. There is a negative association between the two: countries that have more restrictive regulatory environment tend to attract lower amounts of FDI inflows and end up having lower stocks of inward FDI relative to GDP. Italy is one of the outliers to this relationship: even though it has a low regulatory restrictiveness index (0.05), its inward FDI stock/GDP ratio is just 0.15, much lower than 0.42, the ratio that is implied by the estimated relationship. In 2007 the inward FDI flows to Italy represented just 1.4% of total investment in OECD countries, of which only 3.5% was directed to Southern regions. In the same year the total FDI flows directed to Germany, France and Spain were 7.9%, 6.8% and 3.2% respectively (Eurostat, 2009). UNCTAD (2012) shows that the stock of IDE inward in Italy only amounted to 17,7 per cent of GDP in 2007, while in other EU comparable it was remarkably higher (48.2 per cent in France, 20.9 in Germny, 43.5 in UK and 44.4. on average in EU 27). In terms of flows the share was only 2.1 in 2007 compared to 3.7 in France, 7.1. in UK and 5.1 on average for EU 27. Besides, after a further contraction in 2010-2011, Italy was not able to regain the flows of 2007 unlike the other EU countries. In 2012 the flows in the FDI was only 0.5 per cent (1.6 on average for EU 27). According to the World Economic Forum Italy is ranked 62nd on 132 countries for foreing participations in national firms,
Figure 3.1.7 Inward FDI Regulatory Restrictiveness and Inward FDI Stock
Sources OECD Statistics, IMF and Wordbank
It should be noted that investing in Italy has always been met with mistrust and that the Italian ruling system has always been considered unsatisfactory. The reasons are many and varied: the inefficiency of Italian bureaucracy; the exponential increase in legislation (“regulatory inflation”); the proliferation of actors entrusted with legislative powers and the ensuing overlapping of different tiers of regulation; excessively lengthy and complicated bureaucratic
0,00
0,20
0,40
0,60
0,80
1,00
1,20
1,40
0,000 0,100 0,200 0,300 0,400 0,500
20
11
Inw
ard
FD
I Sto
cks
(% o
f G
DP
)
2012 FDI RR Index (Closed = 1; Open = 0)

37
compliance procedures (“compliance costs”); and, finally, the several inefficient aspects of the administrative justice system. These factors have always been a “barrier” to FDI inflows to Italy (Scuola Superiore della Pubblica Amministrazione, 2008). De Santis and Vicarelli (2001) empirically analyse Italy’s performance in terms of FDI attraction. They conclude that Italy, compared to international competitors, has a specific disadvantage caused by high taxes on labour, high bureaucracy costs and low R&D investment. A similar analysis of Italy’s institutional disadvantage was carried out by Basile et al. (2005) to explain the “doom” of (Southern) Italian regions. The findings show that it is mainly attributable to the inefficiency of their bureaucracy and legal systems. 22 In addition to the weak institutional and business environment, the economic structure of the country (e.g. the pattern of specialisation, the very low R&D activity, the large presence of micro and small firms, the high incidence of firm mortality, the social-economic dualism between the more advanced North and the less industrialised South of the Peninsula,) have played a key role on foreign investors strategies.
Firm survival in Italy
As this report is focused on the issue of firm exit it is useful to look at the national statistics portraying the dynamic of firm survival in Italy. This is likely to be influenced by foreign firms competition but in turn also determines the sectoral distribution and types of foreign investment which a country is more likely to attract. Table 3.1.2. shows the rates of survival of cohorts of firms born in the period 1999-2008.23 The rates of survival after three years of life range between 75,7% (firms born in 2005) and 79,5% (firms born in 2001); after five years of life these rates are only ranging between 63,1% (born in 2003) and 67,1% (born in 2001), while after 9 years only 49,8% of firms born in 1999 survive. It is worth noting that firms, no matter the year of birth, in 2008 survive less.
Years of survival
1999 2000 2001 2002 2003 2004 2005 2006 2007 2008
Ye
ar
of b
irth
1999 99,3% 93,6% 87,9% 79,5% 72,6% 66,6% 62,4% 57,9% 53,9% 49,8%
2000
99,2% 94,6% 86,6% 79,1% 71,9% 65,5% 61,8% 56,9% 52,3%
2001
99,4% 94,6% 86,8% 79,2% 73,3% 67,1% 61,4% 56,1%
2002
99,3% 92,8% 83,8% 77,2% 69,9% 63,6% 57,9%
2003
99,1% 93,2% 85,8% 77,6% 70,1% 63,1%
2004
99,3% 93,9% 85,5% 77,5% 69,2%
2005
99,4% 93,9% 85,8% 75,7%
2006
99,6% 93,5% 83,9%
2007
99,6% 92,0%
2008
99,5%
Table 3.1.2 Rates of survival of cohorts of firms over 1999-2008
Source ISTAT (2011), Demografia d‟impresa, anni 2004-2009
22
On the policy-making side, Sviluppo Italia, renamed INVITALY in 2012, is the Italian national agency in charge of FDI attraction. The National Agency mainly carried out advertising for the potential locations for FDI in Italy more than promoting an effective FDI promotion policy. 23
They are computed as the ratio between the number of firms born in t and alive in t+i, i=1,…,k (k=1,…,9) and the number of firms born in t. In what follows we consider alive a firm which was born in t and is still alive in t+1. A firm is classified as active if it is working i.e. if it uses labour force and produces turnover.

38
Tab. 3.1.3. also gives us details of firm survival according to their main activity. The sectors considered are Industry (which includes textiles, heavy sectors, chemical and energy) Building, Wholeasale and Retail Trade and Social services. We may observe which sectors are more at risk of exit in the short, medium and long term. This also allows to assess from the point of view of the entrants the attractiveness of each sector of activity. We observe that on average firm in the Industry and in the Building sectors have higher chances of surviving compared to firms in Trade and other services.
MACROSECTORS Year of birth Year of survival
2003 2004 2005 2006 2007 2008 2009
Industry 2002 88,8 77,9 69,3 62 55,9
2003
88,6 88,8 69,1 61,9 54
2004
88,7 78,7 68,4 60,8 53
2005
89,4 78 69,1 59,1
2006
88,8 77,9 65,5
2007
91,5 77,1
2008
86,9
Building 2002 87,1 75 66,6 59,3 52,9
2003
87 75,6 65,7 58 50
2004
86,9 74,5 63,9 56,4 48,2
2005
87 73,6 64,2 53,6
2006
85,6 73,7 59,8
2007
89,8 72,4
2008
81,7
Trade 2002 86 73 63,4 55,9 49,7
2003
86,3 73,2 63 55,4 47,6
2004
85,8 73,6 62,5 54,3 47,6
2005
86,1 72,3 61,4 52,8
2006
84,7 70,7 59,2
2007
88,8 73,2
2008
86,2
Other services 2002 86,9 75,4 66,6 60 54,6
2003
87,6 76,2 67,2 60,3 53,5
2004
87,4 76,6 66,1 58,9 52,6
2005
88,1 75,9 66,3 58,1
2006
87,5 75,6 64,4
2007
91,1 77,9
2008
86,7
Total 2002 86,9 74,9 65,9 58,9 53
2003
87,2 75,4 65,9 58,6 52,3
2004
86,9 75,6 64,9 57,3 50,5
2005
87,5 74,7 64,8 55,9
2006
86,4 74 62,1
2007
90,3 75,5
2008
85,6
Table 3.1.3 Rates of survival of cohorts of firms over 2003-2009 by macrosectors
Source ISTAT (2011), Demografia d’impresa, anni 2004-2009

39
Complementary to survival is the trend of entry in the market for the macrosectors considered. This, compared to the birth rates, gives us the net turnover rate which is quite high in 2009. In the industry and trade net turnover is negative in almost very year while it is always positive in other services and mostly positive in the building sector.
Years Birth rates Number of new
born firms Death rates
Number of dead firms
Net turnover rates
Industry
2004 4,6 24.710 6,1 33.169 -1,5
2005 4,9 26.025 6,3 33.687 -1,4
2006 4,9 25.993 6,4 33.798 -1,5
2007 5,4 26.666 6,1 30.242 -0,7
2008 5,2 25.056 6,5 31.400 -1,3
2009 4,5 20.808 6,4 29.533 -1,9
Building
2004 9,8 56.581 8,1 46.419 1,7
2005 10,1 60.017 9,1 54.251 1,0
2006 9,4 57.102 9,2 55.795 0,2
2007 11,3 72.077 8,5 54.072 2,8
2008 8,7 55.911 9,4 60.279 -0,7
2009 10,0 63.475 9,2 58.223 0,8
Trade
2004 6,2 79.406 7,4 95.267 -1,2
2005 6,3 81.305 7,7 98.778 -1,4
2006 6,3 80.529 7,7 97.628 -1,3
2007 6,8 85.325 8,0 101.224 -1,3
2008 6,0 73.650 7,8 96.922 -1,8
2009 5,7 68.982 7,8 93.570 -2,0
Other services
2004 9,4 139.670 7,2 107.302 2,2
2005 9,1 140.959 7,2 111.705 1,9
2006 7,7 120.641 7,6 119.050 0,1
2007 9,4 154.371 7,1 117.463 2,2
2008 7,8 131.524 7,5 126.389 0,3
2009 8,0 135.569 7,3 124.814 0,6
Total
2004 7,7 300.367 7,3 282.157 0,4
2005 7,8 308.306 7,5 298.421 0,2
2006 7,1 284.265 7,7 306.271 -0,6
2007 8,4 338.439 7,5 303.001 0,9
2008 7,1 286.141 7,8 314.990 -0,7
2009 7,2 288.834 7,7 306.140 -0,4
Table 3.1.4 Birth and death rates by macrosectors (2004-2009) (numbers and percentages)
Source ISTAT (2011), Demografia d‟impresa, anni 2004-2009.

40
3.2 Foreign ownership and firms’ survival*
In order to start our empirical analysis of the survival dynamics of foreign firms in Italy in this section we use a rich dataset at firm level. We study the determinants of survival of three categories of firms: foreign multinationals (FMNEs), domestic multinationals (DMNEs) and purely domestic firms (NMNEs). Our aim is to explore whether foreign multinationals are more “footloose” than domestic firms, a highly debated issue in the political as well as in the academic field. We answer our research questions first using an unconditional analysis of survival by the Kaplan-Meyer (KM) survival estimator and then turning to a conditional analysis based on the Cox proportional hazard model (CPHM), in which we look for the impact of ownership dummies on firm survival controlling for several covariates both at firm and industry level, which may affect survival. The plan of this section 3.2. of the Report is as follows. In section 3.2.1., we present the data and shows some descriptive statistics on FMNEs, DMNEs and NMNEs disaggregated by firm size. Section 3.2.2. presents the empirical methodology and section 3.2.3. the estimation results. Finally, section 3.2.4 summarizes and concludes.
3.2.1 Data and Descriptive Statistics
The data employed in this section are drawn from AIDA database (Analisi Informatizzata Delle Aziende) provided by Bureau Van Dijk. AIDA collects annual accounts of Italian corporate enterprises and contains information on a wide set of economic and financial variables such as sales, costs and number of employees, value added, tangible fixed assets, start-up year, sector of activity, as well as legal and ownership status. 24In the database, the legal status (i.e. active, into liquidation, inactive) identify the exit of the firm, year by year. Specifically, a firm is defined to exit in year t when this is the last year of operation (i.e. firm characterised by permanent closure, firm in liquidation and each firm acquired by another firm).25 The information on ownership status included in the dataset allowed us to separate Italian firms into:
Domestic Multinational Enterprises (DMNEs): non foreign-owned firms with a share of direct ownership greater/equal to 10 percent in firms located in countries other than Italy.
Foreign Multinational Enterprises (FMNEs): Italian firms whose Global Ultimate owner is foreign.
Non – Multinational Enterprises (NMNEs): Italian non-multinational firms. The data used covers the years 2004-2008. By omitting all observations for which the required data are incomplete, we obtained an unbalanced panel of about 900 thousand observations. Table 3.2.1. compares the distribution of our sample by ownership status, sector of activity (manufacturing and services) and size (small, medium and large firms), the latter measured by the number of employees. According to the figures, NMNEs represent the largest percentage of Italian firms, which are mainly of smaller size, while the shares of FMNEs (0.6) and DMNEs (0.65) are very small. These figures are very close to those provided by ISTAT, according to which in 2007 about 0.3% of Italian firms was foreign-owned (ISTAT, 2009). The discrepancy occurs because our sample is restricted to corporate companies. It also appears that DMNEs are mainly of small size in services and of medium size in manufacturing.
* Coauthored by Anna Maria Ferragina, Rosanna Pittiglio and Filippo Reganati.
24 See section A.I. for a more detailed description of the dataset.
25 See section A.II for a more detailed definition of exit.

41
Small firms
Medium firms
Large firms Total
To
tal
sa
mp
le
FMNEs 61.08 27.30 11.62 0.60
DMNEs 33.66 48.11 18.23 0.65
NMNEs 94.99 4.45 0.56 98.76
All firms 94.39 4.87 0.74 100.00
Ma
nu
fac
turi
ng
se
cto
r
FMNEs 45.95 37.48 16.57 0.76
DMNEs 20.34 59.32 20.34 1.31
NMNEs 92.10 7.33 0.57 97.93
All firms 90.80 8.24 0.95 100.00
Se
rvic
es
se
cto
rs
FMNEs 71.03 20.60 8.37 0.52
DMNEs 56.78 28.65 14.57 0.34
NMNEs 96.29 3.16 0.56 99.13
All firms 96.02 3.34 0.64 100.00
Table 3.2.1 Distribution of Italian firms by size and ownership status (percentages, sample average)
Source Author's elaborations on AIDA database
Table 3.2.2 reports the average exit rate of firms (measured by the number of exiting firms relative to the total number of firms), both for all firms and according to the ownership status. The exit rates for all sectors and services suggest that the percentage of exit is larger in NMNEs with a rate of 6 and 6.5 percent. Conversely, in manufacturing sectors, FMNEs present the higher exit rate with a percentage of 5.83. Our sample is quite representative with regard to the exit rate, reflecting the average exit rate registered by official national sources, which is 7.5 percent for total Italian firms (ISTAT, 2008).
All sectors Manufacturing sectors Services
All firms 6.00 4.74 6.50
FMNEs 5.80 5.83 5.80
DMNEs 3.30 3.41 3.20
NMNEs 6.00 4.75 6.50
Table 3.2.2 Average exit rate by ownership status and sector (percentages)
Source Author's elaborations on AIDA database)
3.2.2 Empirical Model
The focus of our work is to examine whether foreign multinationality on the one hand, and domestic multinationality on the other, are significant for domestic firms’ probability of survival. We start by using non-parametric methods such as the Kaplan-Meier’s to estimate the probability of survival up to a certain age and to compare survival patterns across the three different groups of firms: NMNEs, FMNEs and DMNEs. We are interested in the probability that the period of survival is of at least length t. This probability is given by the survival function that is defined as:
)Pr()(1)( tTtFtS [1]
where T represents a random variable and F(t) is the cumulative probability distribution of T. The most commonly used non-parametric estimate of the survival function is the Kaplan- Meier estimator which is given by:

42
ttj j
jj
jn
dntS )(
[2]
where S(t) denotes the probability of surviving up to age t - defined as the difference between year t and the official year of incorporation of the firm - whereas the failure event is identified as the interruption of firm’s activities,26 nj is the number of firms that have survived up to tj years of age and dj is the number of firms that die at age tj. From Figure 3.2.1. with regard to the total sample, we observe different survival patterns between domestic and foreign MNEs compared to purely domestic firms. In particular, both FMNEs and DMNEs endure better survival prospects: 72 percent of domestic non-MNEs survive more than 30 years, whereas the same probability of survival is 78 percent for foreign-owned firms and 87 for domestic MNEs. A similar result was found at firm level by Van Beveren (2007) and also at plant level by Bernard and Sjöholm (2003), Görg and Strobl (2003) and Ozler and Taymaz (2007). However, Bandick (2010) found that MNEs, both foreign and domestic, were less likely to survive than Swedish owned non-MNE domestic plants. This picture is also confirmed with regard to services (Figure 3.2.3.). Less clear-cut is the evidence for the manufacturing sector (Figure 3.2.2.).
Figure 3.1.1 Kaplan-Meier Survival Functions by Nationality of Ownership
Note Survival probability on the vertical axis. Analysis time represents firms’ age.
Figue 3.1.2 Kaplan-Meier Survival Functions by Nationality of Ownership (manufacturing)
Note Survival probability on the vertical axis. Analysis time represents firms’ age.
26
The effect of age on the hazard rate is incorporated into the model since duration is a function of the firm’s age.
0.00
0.25
0.50
0.75
1.00
0 20 40 60 80 analysis time
FMNEs DMNEs non MNEs
0.00
0.25
0.50
0.75
1.00
0 20 40 60 80 analysis time
FMNEs DMNEs non MNEs

43
Figure 3.1.3 Kaplan-Meier Survival Functions by Nationality of Ownership (services)
Note Survival probability on the vertical axis. Analysis time represents firms’ age.
In order to check for the significance of the differences in survival functions across the three groups of firms, we run log-rank non-parametric tests of homogeneity. The results for all sectors, reported in Tab.3.2.3., confirm the existence of remarkable differences in the survival prospects among the three groups of firms.
Foreign-owned versus domestic MNEs
Foreign-owned versus domestic firms
Domestic MNEs versus domestic firms
All sectors 31.0*** 35.7*** 136.9***
Manufacturing 4.8** 2.9* 21.6***
Services 19.9*** 15.6*** 60.9***
Table 3.2.3 Log-rank tests for the equality of the survival functions by ownership status
Note The null hypothesis is that groups of firms survival functions are equal.This statistic distributes as a chi square with r-1 degrees of freedom.
As it is well known a severe limitation of Kaplan-Meier survival functions is that such analysis does not consider other factors that may affect firm survival. In order to properly control for other characteristics associated with the survival probabilities, we turn to a multivariate analysis based on the following hazards model where the hazard function [λ(t)] of a firm i – i.e., the rate at which firms exit at age t given that they have survived up to age t-1-, is given by:
)( '
0 xHtt [3]
The use of Cox’s proportional hazard models (CPHM) is quite common in the literature on firm survival (see the IO literature e.g., Audretsch and Mahmood, 1995, Disney et al., 2003 and previous studies on FDI and firm survival in the synoptic table 2.2.1.). This model is based on the assumption that the variables that influence survival have a proportional impact on the baseline hazard function, that is, that their effect is the same throughout the entire period.27
27
Another advantage of CPHM is that it does not require the researcher to adopt any specification on the baseline function (semi-parametric model). As the analysis of firm duration generally are not interested in investigating the underlying shape of the baseline hazard but in understanding the effect
0.00
0.25
0.50
0.75
1.00
0 20 40 60 80 analysis time
FMNEs DMNEs non MNES

44
In the CPHM continuous model, we consider age length as the spell length. Besides, we have to precise that we have left truncated survival time data because only those who have survived more than some minimum amount of time are included in the observation sample, those below some threshold are not observed. Left truncation is also known by other names: delayed entry and stock sampling with follow-up.28 Furthermore, as the dependent variable in the Cox proportional hazard model is the event of a firm's exit at a particular age t, conditional on the fact that the establishment survived until that age., the exit of those firms that survived until the end of the dataset (2008) is not observed, i.e., the distribution of the dependent variable is censored at that year. The underlying assumption in Cox’s model is that the hazard
ratio Xt, , the rate at which the plants exit in interval t, depends only on time at risk,
t0 (the so-called baseline hazard), and on explanatory variables affecting the hazard
independently of time )exp( 'x .29 The hazard function depends multiplicatively on the vector
of explanatory variables X for the i-th firm (which measure firm and industry specific characteristics affecting firm survivability), with the corresponding vector of unknown
parameters arbitrary and unspecified) baseline hazard, t0 ,
which is the hazard corresponding to )( '
ixH =1 when all the covariates are set to zero. In
this specification, the effect of a unit change of the independent variables is a constant parallel shift of the baseline function, which is estimated for all those firms that survive until a particular period. Following the CPHM, the functional form adopted to specify the effect of the covariates on the base hazard is exponential. So, the hazard a firm i faces may be written in the following form:
)'exp(),( 0 iixtXt [4]
In equation (4), β=1 means that the covariates do not affect the hazard ratio; a coefficient of β >1 implies that the variable increases the risk of exit, while a value of β <1 reduces the hazard of failure or increases survival time. Equation (4) is the proportional hazard model, and its logarithmic expression gives us a linear model that can be estimated by maximum likelihood method:
ii xtt '0lnln
[5]
that some exogenous variables have on the firm’s hazard of exit, Cox’s (1972) partial likelihood approach provides a convenient model. The covariates predict the shifts in the baseline hazard. 28 Note that the spell start is assumed known in this case (cf. left censoring), but the subjects survival is only observed from some later date hence we have delayed entry. Consequently, the data have been properly stset first (use the enter option to indicate the entry.time, i.e. stock sampling date). 29
So the hazard rate satisfies a separability assumption: it is the product of a baseline hazard t0 ,
which depends only on time at risk, and )( '
ixH
, which is independent of t.

45
Description Source Expected
sign
Firm-specific variables
SIZE* Firm size measured by the number of employees. Aida -
TFP** Total Factor Productivity measured by the residuals from a Cobb-Douglas production function estimated separately for each Ateco 3-digit industry.
Aida -
TECH R&D intensity defined as the ratio of R&D expenditure to sales Aida -
PCM Firm’s margin price-cost ratio constructed as total sales minus the variable costs of production (labour cost and intermediate consumer goods) divided by the total sales
Aida +/-
WAGE Firms’ average wages Aida -
OUT Domestic multinational ownership dummy that takes on the value 1 if the firm is an Italian owned-MNE, 0 otherwise.
Aida +/-
INW Foreign ownership dummy that takes on the value 1 if the firm is foreign-owned, 0 otherwise Aida +/-
Industry-specific variables
HERF Herfindhal concentration ratio at industry level (3-digit Ateco) Aida +/-
MES Minimum Efficient Scale of the industry, measured as the ratio between the sales of the firms which are above the average sales for the industry, divided by total industry sales (3-digit Ateco) (Comanor & Wilson, 1967)
Aida +/-
GROWTH 3-digit Ateco industry growth rate of sales Aida -
KL Overall capital intensity given by the ratio of fixed assets on number of employees at the industry (3-digit Ateco) level
Aida -
FP Foreign penetration defined as the share of foreign employment in a given sector Aida -
IMPCOMP Import penetration ratio measured by the ratio between imports and apparent consumption at industry (3-digit Ateco) level
Istat +
Table 3.2.4 Definition of variables, data sources and expected relationships
Notes * Firms are classified in several groups: lower than 20 employees (size 1), between 20 and 50 employees (size 2), between 50 and 100 employees (size 3) and more than 100 employees (size 4). In all models, size 1 firms are the reference group.
** The Levinsohn and Petrin (2003) estimation method was adopted: intermediate inputs were used as instruments to deal with the potential simultaneity problem in estimating firm level production functions.
Following both the leading theoretical and empirical literature on firm survival, we use in our model the set of explanatory variables shown in Table 3.2.4, distinguishing firm and industry level variables. All financial variables were converted into constant 2000 euro, using 3-digit industry price level deflators.

46
Mean
Diff_1-2 t Diff_1-3 t Diff_2-3 t
FMNEs DMNEs NMNEs
(1) (2) (3)
AGE 19.54 24.26 12.77 -4.72 -15.64 6.77 42.66 11.49 75.83
SIZE 142.59 218.46 14.95 -75.87 -7.38 127.64 95.44 203.51 152.76
TFP 77.34 71.48 30.64 5.86 2.38 46.70 64.78 40.83 59.43
WAGE 34.51 27.18 19.90 7.33 6.88 14.61 30.72 7.28 16.22
TECH 0.07 0.27 0.04 -0.20 -29.64 0.03 12.21 0.24 93.96
PCM 0.38 0.38 0.42 0.00 -0.82 -0.04 -11.89 -0.04 -11.37
IMPCOMP 0.18 0.23 0.10 -0.05 -8.22 0.08 30.46 0.13 49.92
KL 63.79 60.03 56.49 3.76 1.98 7.30 6.15 3.54 3.13
MES 53.37 63.26 3.70 -9.89 -1.87 49.66 55.52 59.55 66.46
HERF 0.02 0.02 0.01 0.00 5.23 0.00 8.11 0.00 0.82
GROWTH 0.02 0.02 0.03 0.00 -2.10 -0.01 -8.56 -0.01 -6.10
FP 0.08 0.06 0.04 0.03 19.17 0.04 59.91 0.02 23.53
Table 3.2.5 Mean statistics by ownership status and t-test of comparison of means for the three distributions
Source Authors' elaborations on AIDA_database
Mean
Diff_1-2 t Diff_1-3 t Diff_2-3 t
FMNEs DMNEs NMNEs
(1) (2) (3)
AGE 22.82 25.58 15.15 2.76 -6.01 7.67 27.53 10.43 49.22
SIZE 183.25 213.85 20.48 -30.60 -2.63 162.77 92.06 193.37 133.52
TFP 82.34 60.77 28.19 21.57 7.33 54.15 59.13 32.58 46.45
WAGE 30.85 25.37 19.75 5.48 7.85 11.09 36.41 5.61 23.71
TECH 0.09 0.34 0.06 -0.24 -21.23 0.03 5.75 0.27 66.10
PCM 0.31 0.33 0.37 -0.02 -4.16 -0.06 -14.92 -0.04 -13.97
IMPCOMP 0.90 0.85 0.69 0.05 4.71 0.20 18.82 0.16 19.11
KL 48.46 41.55 40.49 6.90 8.11 7.97 14.95 1.07 2.64
MES 37.61 37.12 3.15 0.49 0.19 34.46 61.60 33.97 80.21
HERF 0.02 0.01 0.01 0.01 7.68 0.01 13.00 0.00 1.78
GROWTH 0.02 0.02 0.03 0.00 -1.20 0.00 -2.44 0.00 -1.38
FP 0.11 0.06 0.04 0.05 19.26 0.06 47.31 0.02 17.30
Table 3.2.6 Mean statistics by ownership status and t-test of comparison of means for the three distributions (manufacturing)
Source Authors' elaborations on AIDA_database

47
Mean
Diff_1-2 t Diff_1-3 t Diff_2-3 t
FMNEs DMNEs NMNEs
(1) (2) (3)
AGE 17.53 22.27 11.91 -4.73 -11.61 5.62 29.10 10.36 45.10
SIZE 117.64 225.42 12.95 -107.78 -6.20 104.69 58.25 212.47 95.88
TFP 74.25 87.65 31.53 -13.39 -3.31 42.72 43.68 56.11 48.42
WAGE 36.75 29.94 19.95 6.81 3.34 16.80 24.15 9.99 12.18
TECH 0.05 0.18 0.03 -0.12 -15.18 0.03 8.96 0.15 42.90
PCM 0.42 0.47 0.44 -0.05 -6.35 -0.02 -3.67 0.03 5.22
IMPCOMP 0.06 0.06 0.05 0.00 -0.11 0.01 3.20 0.01 2.76
KL 73.19 87.87 62.28 -14.68 -4.01 10.92 6.31 25.60 12.46
MES 63.04 102.66 3.91 -39.62 -3.84 59.13 45.51 98.75 60.77
HERF 0.02 0.02 0.02 0.00 0.01 0.00 2.42 0.00 2.02
GROWTH 0.02 0.02 0.03 0.00 -0.99 -0.01 -8.51 -0.01 -5.95
FP 0.07 0.05 0.04 0.02 12.72 0.03 33.93 0.01 10.30
Table 3.2.7 Mean statistics by ownership status and t-test of comparison of means for the three distributions (services)
Source Authors' elaborations on AIDA_database
Tables 3.2.5 contains the mean of the variables for the whole sample distinguished by ownership type as well as tests of comparison of means for the three groups of firms. All figures presented in the table are averages over the sample period. Focusing our attention exclusively on the firm level variables, we observe that multinationals, both foreign and domestic, are on average older, larger, more productive, more innovative, and pay higher wages compared to NMNEs. This is true both for total sample and for manufacturing and service sectors (Tables 3.2.6 and Tables 3.2.7). However, excluding services, FMNEs are more productive than their national counterparts (DMNEs), in spite of the fact that the latter are bigger and older than foreign multinationals.
3.2.3 Econometric results
Our empirical strategy controls for heterogeneity among firms by including in our model the variables described in Table 3.2.8, which measure the relevant characteristics that are expected to affect firm survival in the Italian economy. Two binary variables will enable us to discriminate the effect of being FMNEs or DMNEs. These variables are used to check if the hazard probability of foreign firms and of domestic multinational are different from that of the non multinationals domestic firms. However, since domestic and foreign firms could react to external conditions differently, we run also separate regressions for domestic and foreign plants, and compare the differences between the determinants of survival. Domestic firms dominate the sample of firms in the datasets (more than 98 % of firms are domestic), and estimation results for the whole sample (including the foreign firm dummy) are almost identical to the results obtained for the subset of domestic firms. Therefore, we present the results for the whole sample, because the coefficient of the foreign firm dummy can be used directly to test survival differences between domestic and foreign firms. We run separate regressions for manufacturing and service(s) sectors in order to determine whether the multinationality, both foreign and domestic, responds in different ways in these two sectors to a given set of factors. For all the different sector aggregations, we present two different specifications of the model: the first considers only covariates at firm level; the

48
second also inserts industry level variables. Simple correlation coefficients have been calculated among the variables in order to assess whether multicollinearity is present. Correlations between the independent variables are generally low. The possibility of ending up with biased estimates when testing for the direct impact of foreign ownership on a firm’s exit decision is a potential econometric concern. This concern is mainly due to the fact that the foreign ownership dummy variable might not be entirely exogenous. It is usually argued that foreign investors tend to acquire shares in the most successful and larger firms and that foreign ownership is thus not randomly distributed (see Djankov and Hoekman, 2000; Damijan et al., 2003). In this case, the foreign ownership dummy is potentially a choice variable that might be correlated with unobservables relegated to the error term. More specifically, it may be endogenous if the acquisition by a foreign firm is correlated with unobservables that affect a firm’s exit decision. For instance, foreign investors are more likely to acquire shares in more successful firms and therefore experience a lower probability of exiting ceteris paribus. If the research fails to control for this correlation, the estimated coefficients will overestimate the effect of foreign ownership on the probability of exiting. To deal with this problem, we also used a two-stage estimation methodology. At the first stage, we used a probit model to calculate as an instrumental variable the probability of a firm being acquired by foreign firms. More specifically, in our binary choice model, we use a dependent variable which equals to one if a firm is an affiliate of a foreign MNE and 0 otherwise. The vector of independent variables includes a set of firm attributes such as total factor productivity, plant age, current employment size, R&D intensity, etc. At the second stage, we use the CPHM to estimate the impact of foreign presence on the survival of firms. Table 3.2.8. provides the regression results of the Cox proportional hazard model of equation (4) applied to our sample of Italian firms over our period of analysis. All estimations are stratified by 2-digit (Ateco) industry classification, which allows for equal coefficients of the covariates across strata (industries), but baseline hazards unique for each stratum (industry). The first two columns show the results of the basic and extended model applied to the overall economy (Ateco 15-99), while columns 3 to 6 display the results of these two models for manufacturing and services, respectively. For each regression, we report coefficients and associated robust standard errors, adjusted for clustering at the firm level. Wald tests provide satisfactory support for our model specification. Overall, we have almost 900 thousand observations corresponding to approximately 370 thousand firms (99,840 in manufacturing and 269,612 in services) of which almost 45,000 fail during the five-year observation period (10,610 in manufacturing and 34,382 in services). In order to interpret the magnitude of these effects, it is useful to calculate the hazard ratio of the coefficients in table 3.2.8. by taking the exponential. For a dummy variable, the hazard ratio represents the increase in the overall hazard rate facing the firm when the corresponding dummy is equal to one. For a non binary variable, the hazard ratio represents the increase in the overall hazard rate facing the firm when the corresponding variable increases. Negative (positive) coefficients correspond to risk ratios lower (higher) than one, and imply that the hazard rate decreases (increases) while the corresponding probability of survival increases (decreases).

49
Overall Manufacturing Services
(1) (2) (3) (4) (5) (6)
INW 0.395 0.370 0.544 0.497 0.334 0.307
(0.065)*** (0.070) *** (0.123) *** (0.135) *** (0.080) *** (0.084) ***
OUT -0.119 -0.104 0.072 0.048 -0.345 -0.279
(0.082) (0.087) (0.106) (0.113) (0.135) ** (0.143) **
SIZE 2 -0.267 -0.238 -0.398 -0.397 -0.191 -0.146
(0.019) *** (0.021) *** (0.033) *** (0.036) *** (0.023) *** (0.026) ***
SIZE 3 -0.305 -0.293 -0.402 -0.445 -0.242 -0.196
(0.033) *** (0.037) *** (0.053) *** (0.058) *** (0.042) *** (0.048) ***
SIZE 4 -0.219 -0.181 -0.190 -0.243 -0.239 -0.177
(0.038) *** (0.042) *** (0.066) *** (0.075) *** (0.047) *** (0.053) ***
TECH -0.053 -0.067 -0.039 -0.019 -0.049 -0.077
(0.028)* (0.030) (0.046) (0.049) (0.035) (0.038) **
TFP -0.002 -0.002 -0.004 -0.005 -0.002 -0.002
(0.000) *** (0.000) *** (0.001) *** (0.001) *** (0.000) *** (0.000) ***
PCM -0.115 -0.010 0.148 0.189 -0.158 -0.035
(0.026) *** (0.029) ** (0.068) *** (0.074) ** (0.029) *** (0.031)
WAGE 0.0014 0.0005 0.0011 0.001 0.000 0.000
(0.0010) (0.0002) *** (0.0004) *** (0.000) *** (0.002) (0.001)
IMPCOMP -0.156 -0.062 -0.379
(0.035) *** (0.042) (0.090) ***
KL -0.001 -0.004 -0.001
(0.000) *** (0.001) *** (0.000) ***
MES 0.000 0.0010 0.000
(0.000) ** (0.0003)*** (0.000)
HERF 0.316 -0.900 0.414
(0.146) * (0.533) * (0.153) ***
GROWTH -0.145 0.145 -0.218
(0.086) (0.085) (0.100) **
FP -0.564 0.242 -0.708
(0.156) *** (0.362) (0.177) ***
Time dummies Yes Yes Yes Yes Yes Yes
Industry dummies Yes Yes Yes Yes Yes Yes
Wald’s test (chi2) 442.36 379.14 276.81 287.21 231.71 188.55
p-value (000) (000) (000) (000) (000) (000)
N° of observations 881358 728715 254153 217410 627705 511305
N° of failures 44992 37289 10610 9119 34382 28170
N° of firms 369113 306759 99840 85677 269612 221342
Log-likelihood -217511.14 -183716.69 -40893 -33389.451 -176570.9 -150259.85
Table 3.2.8 Estimation results: Cox Proportional Hazard Model
Notes (a) The coefficients indicate the effect on the hazard rate of a standard increase in a continuous variable or a change from 0 to 1 in a dummy variable b) Robust Standard errors in brackets. c) ***, **, *, significant at 1%, 5% and 10%, respectively d) The base hazard has been stratified by 2 digit Ateco.

50
The first remarkable result is that, unlike the unconditional analysis, we find that foreign firms have significantly higher probability of exit in all models and sectors considered. Focusing on the extended model results, we observe that being controlled by a foreign firm enhances the hazard rates of a firm 1.6 and 1.4 times in manufacturing and services respectively. This result lends support to the hypothesis that foreign MNEs are more “footloose” than purely domestic firms, and is in line with the findings of a wide range of literature (see e.g., Audretsch and Mahmood, 1995; Bernard and Sjöholm, 2003; Görg and Strobl, 2003; Van Beveren, 2007). Conversely, the results for the domestic-owned multinationals (OUT) are less clear-cut. While the DMNEs in manufacturing do not show a hazard rate significantly different from the rest of the sample, in services the hazard ratio indicates that the probability of exit for domestic MNEs operating in this sector is 24 percent lower than that of NMNEs. This result is in line with Van Beveren (2007) but differs from Kimura and Fujii (2003), Bandick (2010), Inui et al. (2009), Bernard and Jensen (2007) and Giovannetti et al. (2009). We also observe that compared to exiters, surviving firms are larger, regardless of the sector of activity. This result is consistent with most of the empirical evidence obtained by the literature concerning the “liability of smallness” (Audretsch and Mahmood, 1995; Dunne et al. 1988; Mata and Portugal, 1994; Esteve Pérez and Sanchis Llopis, 2004 and Esteve Pérez and Mañez Castillejo, 2008). Several reasons could suggest a negative relationship between firm size and the probability of exit. First, larger firms are more likely to have output levels close to their industry minimum efficient scale. Moreover, compared to small firms, large firms could also have an enhanced chance of survival given their easier access to capital market and better possibility of recruiting qualified workers.30 To account for a possible non-linear effect, we also included a set of dummy variables distinguishing different size classes. Like previous studies (Strotmann, 2007; Esteve Peréz and Mañez Castillejo, 2008) we find evidence of a non-linear effect. Our results also clearly indicate, in line with several theoretical (Jovanovic, 1982; Hopenhayn, 1992) and empirical studies (Esteve Perèz and Mañez Castillejo, 2008; Van Beveren, 2007; Bandick, 2010), that the probability of survival is mainly motivated by productivity differences at the firm level. We also find that investing in R&D weakly increases the probability of survival of firms in the service sector (+8%) while it is not significant in manufacturing. A negative impact of R&D in the manufacturing sector was found by Giovannetti et al. (2009) while Kimura and Fujii (2003), Esteve Pérez et al. (2004), Esteve Pérez and Manez (2008), found a positive effect. A possible explanation for our result is that R&D represents a special investment which develops firm’s capabilities and improves competitiveness, but also represents a heavy financial burden especially for small Italian firms. A higher profit margin (PCM) turns out to reduce the hazard ratio in the service sector (although it is only significant in the basic model), but surprisingly tends to increase the risk of failure by more than 21 percent in the manufacturing sector. The explanation for our result may be twofold. On the one hand, if profit margins are higher, firm activities tend on average to be more risky; on the other hand, firms with higher profit margins more easily become a target for acquisitions. An increase in failure risk is also shown by firms that pay higher wages in manufacturing. This result is in line with the hypothesis that firms are relatively less competitive if they pay higher wages for given productivity levels. Looking at the industry-specific factors, our results show that capital intensity positively affects the likelihood of survival, irrespective of the sectors. This can be explained by the argument that, in industries with high capital requirements, firms are more committed to their resources, i.e. capital intensity being a sunk cost acts as a barrier to exit (Audretsch and Mahmood, 1995). Furthermore, firms in manufacturing sectors where economies of scale are relevant face a higher exit risk. whereas a higher degree of concentration measured by the Herfindahl concentration index decreases the exit rate in manufacturing, but increases it in services. In this regard, our results are very close to Görg and Strobl (2003) and Audretsch (1995), who pointed out that firms in sectors with a high MES level face a higher chance of exit, because they may find it more difficult to achieve an
30
The theoretical model by Clementi and Hopenhayn (2006) based on a repeated moral hazard model (where the Modigliani-Miller proposition does not hold) predicts that the failure rate decreases with size and age and the conditional probability of survival increases with the value of the firm’s equity. Small firms may face higher restrictions on capital markets leading to higher risk of insolvency and illiquidity and consequently a higher risk of failure compared to their counterparts.

51
efficient production scale and suffer a cost-disadvantage vis-à-vis the most efficient firms in the market. With regard to the effect of market concentration on firm survival, the theory is not clear-cut. On the one hand, in concentrated industries, many firms may be protected by competition and, as a result, the likelihood of firm closure will be reduced. On the other hand, firms in highly concentrated markets may face aggressive behaviour from rivals and, as a consequence, have a higher possibility of exit. Empirical evidence regarding the effect of market concentration on firm survival also produced mixed results: Görg and Strobl (2003) found a positive impact while Mata and Portugal (1994) and Strotmann (2007) found a negative one. Firms in import-competing industries have a chance of survival 32 percent higher in services, while the coefficient although negative is not significant in manufacturing. Industry growth also reduces the risk of failure but only in services: firms operating in fast-growing industries have a likelihood of survival 20 percent higher. In many studies, fast-growing industries were found to induce lower exit rates than slowly growing or declining industries, since the better the demand side-conditions are, the higher is the chance of survival (Audretsch, 1995; Dunne et al. 1988, Mata and Portugal, 1994, 2004; Görg and Strobl, 2003. Finally, the presence of foreign firms reduces hazard ratios in the service sector by a high percentage (51%), suggesting that the presence of FDI generates positive spillover effects. Our results are consistent with the literature that tested the impact of foreign presence on domestic firms’ survival (Görg and Strobl, 2005; Ozler and Taymaz, 2007; Bandick, 2010), but in contrast with some studies which have found that a greater presence of foreign affiliates may generate competition effects that increase the probability of exit of all firms (De Backer and Sleuwaegen, 2003), or alternatively of firms located in specific sectors (Görg and Strobl, 2005; Burke et al., 2008). However, the literature on FDI spillovers in Italy generally points to a weak presence of spillovers from FDI in manufacturing (Imbriani and Reganati, 2002; Reganati and Sica, 2007; Castellani and Zanfei, 2007), while finding a significant impact in services (Pittiglio et al., 2008).
3.2.3.1 Sensitivity of results to sectors with different technological intensity
Due to the large size of our database, we are able to better verify the existence of some sector specific characteristics that may interact with the different covariates in explaining the probability of firm survival in the Italian economy. Thus, we re-estimate our model by disaggregating manufacturing and service sectors according to the level of technological intensity. Following the OECD taxonomy, we aggregate our manufacturing (service) sectors into two groupings: i) high and medium-high technology (knowledge-intensive) industries and ii) low and medium-low technology (less-knowledge-intensive). In the following we refer to the former as dynamic industries and to the latter as static industries.

52
High and medium-high technology manufacturing sectors
Knowledge-intensive services
24 Manufacture of chemicals and chemical products 25 Manufacture of rubber and plastic products
60 Land transport; transport via pipelines; 61 Water transport
29 to 35 Manufacture of machinery and equipment n.e.c.; Manufacture of electrical and optical equipment; Manufacture of motor vehicles, trailers and semi-trailers; Manufacture of other transport equipment
62 Air transport
64 Post and telecommunications
65 to 67 Financial intermediation
70 to 74 Real estate, renting and business activities
80 Education
85 Health and social work
92 Recreational, cultural and sporting activities
Low and medium-low technology manufacturing sectors
Less knowledge-intensive services
15 to 22 Manufacture of food products, beverages and tobacco; Textiles and textile products; Leather and leather products; Wood and wood products; Pulp, paper and paper products; Publishing and printing
50 to 52 Wholesale and retail trade
55 Hotels and restaurants
63 Supporting and auxiliary transport activities; activities of travel agencies
23 Manufacture of coke, refined petroleum products and nuclear fuel
75 Public administration and defence; compulsory social security
26 to 28 Minerals, basic metals and fabricated metal products; other non-metallic mineral products
90 Sewage and refuse disposal, sanitation and similar activities
36 Furniture 93 Other service activities
Table 3.2.9 Technology taxonomy (OECD)

53
Low and medium-low technology High and medium-high technology
Firm variables
INW 0.5113 0.3858
(0.0976)*** (0.0602)***
OUT 0.0935 -0.0439
(0.1453) (0.1684)
SIZE 2 -0.4433 -0.3698
(0.0432)*** (0.0609)***
SIZE 3 -0.4507 -0.4704
(0.0698)*** (0.0999)***
SIZE 4 -0.3629 -0.1138
(0.0915)*** (0.1093)
TECH 0.0769 -0.1440
(0.0595) (0.0789)*
TFP -0.0084 -0.0038
(0.0021)*** (0.0013)**
PCM -0.4721 0.1125
(0.1197)*** (0.0917)
WAGE 0.0018 0.0015
(0.0006)*** (0.0018)
Industry variables
IMP COMP -0.1686 -0.1899
(0.0396)*** (0.0386)***
KL -0.0016 -0.0018
(0.0001)*** (0.0001)***
MES 0.0010 0.0011
(0.0004)** (0.0007)
HERF -0.4578 -0.1422
(0.7367) (0.7166)
GROWTH 0.2172 -0.107
(0.2335) (0.3954)
FP -0.4408 0.3954
(0.6111) (0.4006)
Industry dummies Yes Yes
Time dummies Yes Yes
No. of obs. 149,134 68,276
No. Of subjects 59,006 26,691
No.of failures 6,400 2,719
World's test (χ2) 261,093*** 70,165***
Table 3.2.10 Estimation results by technological intensity in manufacturing: Cox Proportional Hazard Model
Note ***, **, * indicate statistical significance at the 1, 5 and 10 percent levels. Standard errors, adjusted for clustering at the firm level, are in parentheses.

54
Less-knoledge-intensive services Knoledge-intensive services
Firm variables
INW 0.3294 0.3437
(0.1466)** (0.1090)***
OUT -0.4918 -0.2761
(0.2406)** (0.2055)
SIZE 2 -0.1166 -0.1132
(0.0392)*** (0.0480)**
SIZE 3 -0.0666 -0.3052
(0.0682) (0.0855)***
SIZE 4 0.0351 -0.3378
(0.0762) (0.0881)***
TECH -0.0608 -0.0305
(0.0597) (0.0703)
TFP -0.0075 -0.0006
(0.0010)*** (0.0002)**
PCM -0.5899 -0.0316
(0.0500)*** (0.0497)
WAGE 0.0012 -0.0015
(0.0001)*** (0.0013)
Industry variables
IMP COMP -0.1125 -0.3023
(0.0917) (0.0890)***
KL -0.0010 -0.0010
(0.0001)*** (0.0001)***
MES 0.0004 -0.0001
(0.0001)** (0.0002)
HERF 0.1654 0.4024
(0.3480) (0.1744)**
GROWTH 0.4549 -0.2490
(0.1888) (0.1176)**
FP -0.9287 -0.3243
(0.2933)*** (0.2543)
No. of obs. 249,792 143,175
No. of subjects 105,674 62,096
No. of failures 12,587 7,909
World's test (χ2) 162,10*** 198,61***
Table 3.2.11 Estimation results by technological intensity in the services: Cox Proportional Hazard Model
Note ***, **, * indicate statistical significance at the 1, 5 and 10 percent levels. Standard errors, adjusted for clustering at the firm level, are in parentheses.

55
The estimates in Tab. 3.2.10. and Tab. 3.2.11. reveal that being controlled by a FMNE increases the hazard rate of a firm, regardless of the technological level of the sector of activity in which it operates. Thus, within both static and dynamic industries, foreign ownership exerts a strongly negative influence on the survival of firms by increasing the chance of exit; this result suggests that the behaviour and strategies of MNEs differ from those of domestic non-multinational firms. In the low and medium-low technology manufacturing sectors, the chances of exit for FMNEs increase by approximately 66 percent compared to non-MNEs; in the high and medium-high technology manufacturing industries, the chance of exit increases by approximately 47 percent. The same result is obtained in the service sector: FMNEs belonging to the less-knowledge-intensive services have a 41 percent greater risk of exiting compared with NMNEs belonging to the same sector, and exceed by 39 percent the exit risk of domestic non-multinational firms within knowledge-intensive services. Consistently with what we saw in the previous estimations, the results for domestic multinationals are different. Being a domestic multinational is correlated with having higher survival chances in services. More specifically, this result is observed only in the less-knowledge intensive services, where the probability of exit for DMNEs is 61 percent lower than for NMNEs. In the knowledge intensive services and in manufacturing there is no different behaviour with regard to domestic non-multinational firms. Turning to the other firm- and industry-specific characteristics, we observe that the results are generally in accordance with our previous results at a more aggregate level. In particular, bigger and more productive firms are found to have a lower risk of exit than smaller and less productive firms. The degree of a firm’s R&D intensity has a positive effect on firm survival only for firms belonging to high and medium-high technology industries in the manufacturing sector. Both in manufacturing and in the services, higher profit margins and lower average wages appear to reduce the hazard ratio only for firms belonging to low and medium-low technology industries in the manufacturing sector and to less-knowledge-intensive services. As for the industry-specific covariates, our results show that firms in industries with a higher minimum efficient scale have a higher probability of exit in both manufacturing and services sectors of lower technological intensity, whereas capital intensity positively affects the likelihood of survival regardless of the technological level of the sector. In addition, higher levels of industry concentration correspond to an increased probability of firm exit in the knowledge-intensive services. Thirdly, regardless of the technological level of the sector, belonging to import competing industries increases the chance of survival but only for firms in the less-knowledge intensive services, while industry growth reduces the risk of exit only in the knowledge intensive industries. Lastly, we find that the share of MNEs in the sector has a positive effect on firm survival in less-knowledge-intensive services, in which the exit risk decreases by more than 50. 31 These effects may be due to the fact that domestic non-multinational firms are more imitative and thus more able to absorb the knowledge spillovers from foreign firms.
3.2.4 Conclusions
Our main finding reveals that during the period 2004-2008, while manufacturing and service firms owned by foreign MNEs are more likely to exit the market than purely domestic firms, domestic MNEs located in services have a higher chance of survival. These results are obtained even when other firm- and industry-specific variables are controlled for and support the idea that foreign MNEs are inherently footloose. This finding suggests that not multinationals per se, but rather foreign multinationals, are likely to increase firm mortality in Italy. However, in the service sector we found a positive impact of foreign investments on domestic firms, which suggests the presence of spillover effects. We also investigated how multinational ownership affects the survival prospects of Italian manufacturing and service firms according to the technological intensity of the sector in which firms operate, and highlighted some differences between static and dynamic industries. In particular, we find that being a domestic multinational has a positive effect on firm survival only
31
For a detailed list of these sectors along with their ATECO codes, see Appendix A.

56
in the less-knowledge-intensive services. Conversely, foreign ownership exerts a negative influence on firm survival both in static and dynamic industries. However, the chance of exit compared to domestic firms is higher in the less technology- and knowledge-intensive sectors than in the more technology- and knowledge-intensive ones. To sum up, it is clear that although there was no clear a priori indication of the conditional correlation between multinational ownership and exit patterns, our findings nevertheless allow us to draw some general conclusions. Firstly, it is clear that there is a different degree of persistence between foreign and domestic multinationals. This suggests that domestic multinationals are more firmly rooted in the local economy, while foreign MNEs are more swift to change location.32 Secondly, the much higher hazard ratios for FMNEs in low and medium-low technology intensive manufacturing sectors seem to support the hypothesis that the exit behaviour of foreign firms is indeed related to the role of opportunity costs, which are generally quite relevant in less technology intensive sectors, and to the role of sunk costs when setting up production, which (on average) are higher in less traditional sectors, ceteris paribus. Thirdly, our estimates offer significant implications in terms of different exit behaviour in services. More specifically, the results seem to suggest that firms in services behave in a peculiar way. Domestic multinationals in less-knowledge-intensive services appear more persistent, but FMNEs in services also exhibit lower exit rates, especially as far as less-knowledge-intensive services are concerned. These results suggest that the particular features of services might play an important role. There is, in fact, a range of less-knowledge-intensive services that are more likely to be non tradable and can therefore be supplied to local markets by foreign and domestic firms only through the location in those markets. Therefore it is not surprising that activities in these sectors are less volatile. Our study enriches our understanding of the determinants of firms’ survival in Italy and suggests a number of policy implications. In order to increase firm survival, the indications show the importance of adopting ownership-specific incentive policies. In order to raise the probability of survival, policy makers should also target some firm-specific characteristics that are crucial determinants of performance gaps in survival, primarily size and productivity. Our findings should be taken into account in current policies of FDI attraction and firm internationalisation via FDI. Policies should also be calibrated according to the sector involved, taking into account the very different features of manufacturing and services activities, which need to be further investigated with regard to their differing sensitiveness to variables and policy of firm attraction and internationalization.
3.3 The impact of FAs on domestic firms’ survival: intersectoral and intra-sectoral spillover effects*
Once the differences in survival among the two groups of firms, foreign and domestic, are documented, we want to ask the question: how does the presence of FAs affects domestic firms’ survival? More specifically, we investigate upon the following issues: Do indigenous plants tend to have shorter lives (more deaths) due to competition with FDI affiliates? What is the role of spillovers (knowledge and pecuniary) stemming from the presence of foreign multinational enterprises (MNEs)? Are firms benefiting from FDI affiliates operating in upstream and downstream industries as input suppliers and customers? To answer these questions we disentangle between intra- and inter-industry economic linkages. Hence, we explicitly differentiate the economic linkages between FDI affiliates and domestic-owned plants as competitors, input suppliers, and customers.
32
A possible explanation for the more rooted nature of Italian multinationals can be found in the particular characteristics of the types of multinational present in Italy. They generally show a lower capacity for internationalisation, are of a local nature and much smaller in size (pocket multinationals) than their correspondent firms in other developed countries. This peculiarity of the Italian model of internationalisation might also explain why we found different results from studies concerning other developed countries (Kimura and Fujii, 2003; Bandick, 2010; Inui et al., 2009). * Coauthored by Anna Maria Ferragina and Fernanda Mazzotta.

57
We further investigate the same questions checking how the impact of FAs on domestic firm survival rates varies with the technological intensity of production at the sectoral level and how relevant is firm absorptive capacity. Regarding these topics, we test the findings of Audretsch (1991; 1995), namely, that in a market environment shaped by the process of creative destruction, the major factor determining the firm’s survival likelihood is its ability to innovate. Previous studies have underlined that the net effect of foreign firms on domestic establishments’ survival crucially depends on the host country’s policy environment, and the technological capacity of domestic firms. Görg and Strobl (2001 and 2004) confirm that the larger the foreign presence in an industry, the higher are domestic establishments’ probabilities of survival for plants in high tech industries but not in low tech ones, which suggests that firms in low tech industries have not enough absorptive capacity to profit of the spillovers from technological gap. Conversely, according to Burke et al. (2008), as both domestic and foreign firms are likely to be engaging in innovation in dynamic industries, and differences in innovation represent the focal point for competition in such industries, then foreign ownership is more likely to lower the firm survival rate in dynamic industries, while in static industries firms are more imitative and hence have more scope to benefit from knowledge spillovers from foreign firms. These research questions will be investigated in detail using an unconditional analysis of survival and then turning to a conditional analysis based on the Cox proportional hazard model (CPHM), in which we look for the impact of several FDI related variables on firm survival controlling for several covariates both at firm and industry level, which may affect survival. The analysis is organised as follows. Section 3.3.1 describes the dataset, while the variables specifications, the theoretical a priori with respect to the signs and some descriptive statistics are in section 3.3.2. Section 3.3.3 presents the model used and the estimation results. Some conclusions follow.
3.3.1 Dataset construction
The empirical analysis for this part of the Report has been conducted using a firm level database for the period 2002-2010 resulting from the intersection of three different sources: IXth Survey on Manufacturing Firms, by Capitalia, AIDA (Analisi Informatizzata delle Aziende) and Mint-Italy, both by Bureau Van Dyck. For a detailed description of the dataset see section A.I. in Appendix A.
3.3.2 Variables specification
In this section we describe the specification and the expected sign for the set of variables which we use in our empirical analysis distinguishing between industry level and firm level covariates (a full list is provided in table 3.3.1.).
Industry level covariates
We use three explanatory variables at industry level adopted in our previous econometric analysis of foreign ownership and firm survival (see Tab. 3.2.4): output growth,33 mes, 34 herf.35
33
ISTAT data. The growth rate of sectoral output is an indicator for current market. Therefore, it is expected to have a negative impact on exit. 34
The variable will have a negative coefficient if new firms can find niches for themselves in markets where large firms operate (high MES), but find it difficult to compete in markets dominated by similar, small firms (low MES). 35
This is the Herfindhal-Hirschman index of concentration constructed as the sum of squares of the
market shares of all firms in the market i.e.
and bound between 0 and 1. The value of the
index is equal to one if there is monopoly in the market and will approach zero if the market is perfectly competitive. The index is used as a proxy for the level of concentration and thus of competition within the sector and year. If the higher levels of concentration in the market make survival more difficult (the
58
We further add some FDI related variables to analyse in detail the impact of FDI:
FDI _OWN_INDUSTRYj,t= /
where is foreign firms turnover and
is
turnover of all firms in sector j at time t.36 It is a measure of the importance of foreign presence in the host industry in the same firm’s sector.37 A positive coefficient reflects the presence of technology spillovers through demonstration effects, labour turnover or competition.
is constructed as a weighted
average of FDI _OWN_INDUSTRY in all upstream industries k of industry j, where the weights are input-shares38 that industry j purchases from all its upstream industries (including non-manufacturing industries).39 It is a measure of FDI in upstream industries k which affect firm i in industry j through providing intermediate inputs to industry j (see Langer and Taymaz, 2006 and Wang, 2010). 40
is constructed as a weighted
average of in all downstream industries of industry k, where the weights are output-shares that industry j sell to all of its downstream industries k (including non-manufacturing industries).41 It is a measure of FDI in downstream industries affecting firm i in industry j, through foreign firms purchasing inputs produced by firm i.
=
where is the production of foreign firms
in region r at time t and is the production of all firms in region r at time t. It is a
measure of the importance of FDI in the region in which the firm is located. 42
HIGH_FOREIGN, a dummy for firms belonging to sectors with low or high foreign presence and is equal to 1 if the percentage of foreign multinationals turnover over total turnover in the industry exceeds the 50th percentile, 0 otherwise. We also expand our set of industry variables with the following ones:
IMPSHARE, the ratio of 3 digit Ateco 2007 industry j’s total imports over its output at year t (Istat data). Imports could spur technology spillover effects, as often found in the
competitive pressure argument), we may expect a negative effect of the level of concentration on survival. However, if the oligopolistic firms raise the product price above the competitive level, new firms could find more opportunities to survive in highly concentrated markets. Therefore, the effect of concentration on survival could be ambiguous. 36
Source: Eurostat, http://appsso.eurostat.ec.europa.eu/nui/setupModifyTableLayout.do) 37
For sectoral classification we use 2 digit Ateco 2002. 38
Source: Istat, input-output Tables. The information on the proportion of sector j’s inputs purchased
from upstream sectors k
) is available for 2 digit sectors and for 1995, 2000 and 2005,
Ateco91 classification. We used the coefficients related to 2005. 39
The formula excludes inputs supplied within each sector since they are already captured through the variable FDI _OWN_INDUSTRY. Besides, the input/output coefficients are calculated excluding products supplied for final consumption and imports of intermediate goods in order to consider only domestically sourced inputs. 40
The amount purchased from foreign-owned firms or sold to foreign-owned firms for each industry is inferred from the industry input-output tables. This is common practice in literature given that it is generally unknown how much each firm (plant) sold to foreign-owned buyers or purchased from foreign suppliers. Implicit in the construction of Upstream and Downstream FDI is also the assumption that the interindustry input-output shares for each plant/firm in an industry are identical, and are the same as the one at the industry level. Blalock and Gertler (2008) argue that this measure, although not perfect, also avoids certain endogeneity problems regarding domestic firms‘ decision to supply foreign firms and to adopt the more advanced foreign technology into their production process. 41
Source: Istat, Input-Output tables. The information on the proportion of sector j’s output used by k
downstream sectors
) is available for 2 digit sectors and for 1995, 2000 and 2005, Ateco91
classification. We used the coefficients related to 2005. 42
Region is defined by NUTS2-level regions (Eurostat).

59
trade literature43, and the spillover effects can lead to higher productivity and thus higher survival rates.
EXPSHARE , the ratio of 3 digit Ateco 2007 industry j’s total exports over its output at year t. 44 Exporting to foreign markets not only allows firms to access foreign knowledge, but also to gain an expanded customer base. Accordingly, these industries are expected to generate some positive effects on firm survival. Exports are also argued to improve productivity performance of the domestic economy (Falvey et al, 2004).
ENTRY RATE, the ratio between the number of firms which enter the business registry each year and the total number of active firms operating in industry j at year t-1.45 Entry rate captures the dynamics of an industry. High levels of entry are associated with conditions that make entry less costly. Ceteris paribus, industries with higher entry rates should experience higher level of competition, and higher rates of churning, and thus higher exit rates.
TECH, the technology macrosector dummies (tech_class=1 and 2) for firms belonging to low, medium-low, medium high and high technology (OECD taxonomy).46 Previous work examining survival conditions of new entrants at the industry level (Audretsch and Mahmood, 1995; Audretsch et al., 2000) have found exit rates to be greater in R&D intensive industries given that the competition environment is tougher.
Firm level covariates
Here we use a set of standard covariates also adopted in the previous estimates (see Tab. 3.2.4): size, age 47, productivity 48, capintensity , wage, outfdi , inwfdi , r&d, profit margin. We also add the following variables:
RELSIZE, defined as the log ratio between firm employment and the mean employment per firm in 2 digit Ateco sectors. relsizeijt = log(Eit/Sjt) = log(Eijt) - log(Sjt) where Eijt is the number of employees in firm i operating in sector j at time t, log(Sjt) = ΣjЄJlog(Eijt)/Njt, and Njt the number of firms in sector j at time t. We used the size variable relative to the sector average to take into account differences between average firm size across sectors. However, as the results between absolute firm size and relative size do not differ much in the estimate we only use the former variable.
EXPORT, the export dummy variable that takes a value of 1 if firm i is an exporter and 0 otherwise;
As our data do provide us with detailed information on firm’s financing requirements we also added some firm level financial variables: solvency ratio, short term and long term debts with
43
Imports are found to be an important channel for productivity growth (Frankel and Romer, 1999). Grossman and Helpman (1991) argue that imports embed the technology level of the producing countries, and a country can get access to other countries‘ technology through imports. Coe and Helpman (1995) find that imports promote technology diffusion among OECD countries. That finding is confirmed by later studies using data on OECD or developing countries, such as Keller (2002), Schiff and Wang (2006) and Schiff and Wang (2008). 44
ISTAT data. 45
ISTAT data. 46
The classification of sectors by technology is based on an OECD classification as used by Keans and Ruane (2001). We aggregated the OECD’s medium and high-sectors. For a detailed list of these sectors along with their ATECO codes, see tab. 9. 47
Since older firms are more likely to possess a bundle of characteristics that have helped them to prevent exit in the past, we expect they have a lower chance to exit. This is coherent with noisy selection models (Jovanovic, 1982; Hopenhayn, 1992), where firms go through a process of learning about their relative efficiency and market competitiveness, and in line with a large number of empirical papers which have shown that younger firms are more likely to fail (e.g., Mata and Portugal, 1994; Audretsch and Mahmood, 1995; Disney et al., 2003). 48
Several theoretical models describing the dynamics of industries with heterogeneous firms (Jovanovic, 1982; Hopenhayn, 1992) predict that the exit of firms is motivated to a large extent by productivity differences at the firm level. Hence, we expect that the exit rates are lower for more productive firms.

60
banks over turnover and collateral ratio, given by the ratio of tangible assets to total assets, like in Guariglia and Bridges (2007).49
SOLVENCY, the solvency ratio (shareholder's funds/total assets), which is an indicator of the liquid assets of the firm. We expect to find that more solvent firms face a lower likelihood of failure. Low solvency indicates the need to raise funds due to low shareholder's equity (Mateut et al. 2006). As less liquid firms show greater demand for external funds compared to more liquid firms which have substantial internal sources, we expect to find that more solvent firms face a lower likelihood of failure
COLLATERAL, given by the ratio of firm tangible assets to its total assets, is expected to have an important impact in terms of lowering failure probabilities.
DEBT WITH BANKS OVER TURNOVER, which can be associated with a worse balance sheet situation, increasing moral hazard and adverse selection problems. Hence, we should expect a positive relationship between higher leverage and the probability of exit as some empirical studies have found (Becchetti and Trovato, 2002; Bunn and Redwood, 2003; Fotopoulos and Louri, 2000; Vartia, 2004; Bridges and Guariglia, 2008). On the other hand, as a high rate of leverage can also be seen as an indicator of a good credit standing and high borrowing capacity of firms, we expect an ambiguous sign between leverage and the exit probability. We finally built two measures of firm absorptive capacity:
GAP, the difference between the mean productivity of foreign firms in the sector and the productivity of each firm in the same sector and is used as a proxy for domestic technological gap (see Jabbour and Mucchielli, 2007). 50 Higher positive value of this variable indicates higher technology distance between domestic and foreign firms. We have ambiguous expectations on this variable since the literature on the relation between the level of technology gap and the firm absorptive capacity is split among two opposite views (see details in footnote 12).
GAP_CLASS, the dummies for two technology gap classes: gap_1=low technology gap firms; gap_2 =high technology gap firms; low tech gap and the high tech gap classes respectively contain firms below and above the 50th percentile.
In table 3.3.2. we describe the mean characteristics of firms with respect to all the variables listed above for the whole sample and disaggregating according to different types of global engagement (exporting, non exporting, being foreign multinationals, domestic multinationals, purely domestic firms). We observe several superior characteristics of globally engaged firms with respect to domestic non exporting firms but particularly it is worth underlining that foreign firms outperform national firms, even domestic multinationals, in productivity levels and in many other dimensions (higher size, age, productivity and profit margin, lower collateral and indebtedness and higher solvency). This preliminary finding justifies developing our analysis on potential spillovers from FDI.
49
We also tried further variables such as: liquidity ratio, degree of coverage of passive interests, interests over turnover (like in Gorg and Alvarez, 2007), and a proxy for leverage (like in Becchetti and Trovato 2002; and Guariglia and Bridges 2007) obtained by dividing the short term and long term debts with banks over total assets. However, these variables were less robust. 50
It is quite common in the literature to proxy the ‘technology gap’ through measures of ‘productivity gap’ between the foreign and the domestic firm. We also tested for another proxy for technology gap: the gap in intangible assets, which would be a better proxy of the difference in technologies adopted. However, the variable was not significant.

61
Category Variables Description Source Exp. Sign
FIRM LEVEL COVARIATES
SIZE Firm size measured by the number of employees. AIDA -
RELATIVE SIZE Firm employment relative to mean employment at 2 digit Ateco level. AIDA -
CLASS41, CLASS42, CLASS43, CLASS$$
Dummies for size groups: Class41=small firms (<20) Class42=medium firms (between 20 and 50), Class43= large firms (50-100); Class44=.
+/-
AGE Firm age measured by the number of years since establishment. AIDA -
PRODUCTIVITY Firm productivity measured by value added per employee. AIDA -
CAPINTENSITY Real capital stock on employees. AIDA -
WAGE Ratio between total personnel cost and total employment AIDA
FINANCIAL VARIABLES
PROFIT MARGIN (PTPM) Firm profits before tax over turnover (%) AIDA -
SOLVENCY_RATIO Company's post-tax net profit and depreciation divided by the quantity of long-term and short-term liabilities (%) .
AIDA -
COLLATERAL Firm ratio of its tangible assets to its total assets (%,) AIDA -
DEBTS WITH BANKS OVER TURNOVER
Firm short and long term debts with banks over turnover (%). AIDA +/-
INTERNATIONALISATION VARIABLES
INWFDI (OWN2) Foreign ownership dummy that takes on the value 1 if the firm is foreign-owned, 0 otherwise.
AIDA +/-
OUTFDI (OWN3) Domestic multinational ownership dummy that takes on the value 1 if the firm is an Italian owned-MNE, 0 otherwise.
AIDA +/-
EXPORT Dummy variable equal to 1 if the firm exports over the entire period 2002-2009.
MINT-ITALY +/-
INNOVATION VARIABLES
GAP Difference between the mean productivity of foreign firms in 2 digit Ateco sectors and the productivity of each firm in the same sector.
AIDA +/-
GAP_class Dummies for two technology gap classes: gap_1=low technology gap firms; gap_2 =high technology gap firms;
+/-
RAND R&D intensity defined as the ratio of R&D expenditure on sales AIDA +/-
INDUSTRY LEVEL COVARIATES
FDI LINKAGES
FDI_OWNIND Foreign firms turnover on total sector turnover. Proxy of FDI competitors in the same Ateco 2 digit industries.
EUROSTAT +/-
FDI_UP FDI in upstream industries k which affect plant or firm i in industry j through providing intermediate inputs to industry j.
EUROSTAT AND ISTAT
+/-
FDI_DOWN FDI in downstream industries k which affect plant or firm i in industry j through buying intermediate inputs by industry j.
EUROSTAT AND ISTAT
+/-
FDI SHARE BY REGION Rratio between the production of foreign firms to the production of all firms in region r at year t.
AIDA -
HIGH FOREIGN Dummy for firms belonging to sectors with low or high foreign presence and is equal to 1 if the percentage of foreign multinationals turnover over total turnover in the industry exceeds the 50th percentile, 0 otherwise.
AIDA -
EXPSHARE Ratio of 3 digit Ateco 2007 industry j’s total exports over total output at year t. ISTAT +
IMPSHARE Ratio of 3 digit Ateco industry j’s total imports over total output at year t. ISTAT +
OUTPUT GROWTH_ Annual output growth rate by 2 digit Ateco. ISTAT +
ENTRY RATE Ratio between the number of firms which enter the business registry and the total number of active firms in industry j at year t.
ISTAT -
MES Minimum efficient scale of the industry measured as the ratio of firms’ sales above the average sales for the industry on total industry sales (Comanor and Wilson 1967)
AIDA +/-
HERF Herfindahl index of turnover by 2 digit Ateco, proxy for the level of concentration within the sector.
AIDA +/-
LOCATION DUMMY Dummy =1 if firm located in South of Italy otherwise =0
ATECO SECTORS 2 digit Ateco 2002 classification ISTAT
TECH_clas Technology macrosector dummies (tech_class=1,2) for firms belonging to low, medium-low and to medium high and high technology respectively (OCSE taxonomy)
OCSE
Table 3.3.1 Definition of variables, data sources and expected relationships with firm exit

62
Variables name ALL FIRMS DOMESTIC FIRMS EXPORTING
FIRMS NOT EXPORTING
FIRMS FOREIGN
MULTINATIONAL DOMESTIC
MULTINATIONAL
FIRM LEVEL COVARIATES Mean SD
Mean SD Mean SD Mean SD Mean SD Mean SD
GROWTH EMPL. 20,18 924,6
20,95 943,67 26,01 1068,82 3,13 120,31 1,61 49,4 15,47 327,86
GROWTH EMPL. LOG -0,02 0,33
-0,02 0,32 -0,02 3,40E-01 -0,03 0,29 -0,04 0,38 -0,01 0,35
SIZE 162,7 492,86
150,56 478,74 163,53 487,6 160,3 507,82 491,81 709,1 603,71 1091,99
RELATIVE SIZE 1,08 2,63
1,01 2,52 1,1 2,68 1 2,48 2,77 4,31 3,58 5,44
CLASS 41 (20) 0,18 0,38
0,18 0,39 0,17 0,38 0,18 0,39 0,04 0,19 0,01 0,11
CLASS 42 (20-50) 0,28 0,45
0,29 0,45 0,27 0,44 0,3 0,46 0,1 0,3 0,08 0,27
CLASS 43 (50-100) 0,24 0,43
0,25 0,43 0,25 0,44 0,22 0,41 0,17 0,38 0,15 0,36
CLASS 44 (>100) 0,3 0,46
0,29 0,45 0,3 0,46 0,3 0,46 0,69 0,46 0,76 0,43
AGE 27,6 15,78
27,64 1,57E+01 27,8 15,89 27 15,46 26,45 17,98 30,58 19,12
PRODUCTIVITY 72395,63 1,19E+06
64832,73 4,58E+05 76772,58 1,38E+06 59708,92 39818,33 2,77E+05 5,85E+06 73263,83 91988,35
SOUTH AND ISLAND 0,16 0,37
0,16 3,70E-01 0,16 3,60E-01 0,16 0,37 0,1 0,29 0,06 0,24
CAPINTENSITY 72649,78 8,19E+05
70131,83 7,15E+05 76692,99 9,48E+05 60930,41 96607,39 1,41E+05 2,24E+06 62569,98 1,73E+05
WAGE 38232,49 1,51E+05
37939,05 1,53E+05 38981,55 1,74E+05 36045,54 19845,79 46279,61 19961,82 42720,58 60403,06
PROFIT MARGIN 3 13,42
3,02 13,41 2,95 1,44E+01 3,14 10,16 2,47 13,77 4,3 17,04
SOLVENCY RATIO 30,26 19,7
30,26 19,67 30,35 19,75 29,98 19,55 30,26 20,58 32,91 19,59
COLLATERAL 0,77 0,26
0,77 0,26 0,77 0,26 0,77 0,26 0,72 0,29 0,56 0,28
DEBTS WITH BANKS OVER TURNOVER 21,91 21,42
22,41 21,44 21,69 21,25 22,56 21,9 8,36 15,71 23,34 21,05
INWFDI (OWN2) 0,04 0,19
0 0 0,04 0,19 0,04 0,18 1 0 0 0
OUTFDI (OWN3) 0,08 0,27
0,08 0,28 0,08 0,27 0,08 0,27 0 0 1 0
EXPORT 0,74 0,44
0,74 0,44 1 0 0 0 0,75 0,44 0,75 0,43
GAP CLASS HIGH 0,49 0,5
0,5 0,5 0,5 0,5 0,48 0,5 0,38 0,49 0,38 0,49
RAND 0,01 0,14
0,01 0,15 0,01 0,17 0,01 0,03 0 0,01 0,01 0,49
INDUSTRY LEVEL COVARIATES
FDI_OWNIND 0,16 0,12
0,16 0,12 0,17 0,13 0,16 0,12 0,25 0,15 0,18 0,12
FDI_UP 10,58 3,59
10,56 3,58 10,49 3,53 10,83 3,74 11 3,7 10,86 3,31
FDI_DOWN 8,86 2,88
8,83 2,9 8,81 2,87 9,01 2,91 9,68 2,38 9,11 2,79
FDI SHARE BY REGION 0,12 0,1
0,12 0,1 0,12 0,1 0,12 0,1 0,16 0,1 0,12 0,08
EXPSHARE 0,01 0,01
0,01 0,01 0,01 0,01 0,01 0,01 0,01 0,01 0,01 0,01
IMPSHARE 0,01 0,01
0,01 0,01 0,01 0,01 0,01 0,01 0,01 0 0,01 0,01
OUTPUT GROWTH_ -0,03 0,09
-0,03 0,09 -0,03 0,09 -0,03 0,09 -0,04 0,1 -0,02 0,09
ENTRY RATE 3,99 1,49
4,02 1,49 3,99 1,49 4,01 1,49 3,32 1,42 3,99 1,43
MES 0,77 0,04
0,77 0,04 0,77 0,04 0,77 0,04 0,79 0,04 0,77 0,04
HERF 0 0,01
0 0,01 0 0,01 0 0,01 0 0,02 0 0,02
TECH CLASS LOW 0,7 0,46
0,71 0,46 0,7 0,46 0,7 0,46 0,42 0,49 0,54 0,5
N. OBSERVATIONS 23859
23010 17739 6120 849 1900
Table 3.3.2 Descriptive statistics (all firms, domestic firms, exporting firms, non exporting firms, foreign multinationals, domestic multinationals, 2007)
Source Own elaborations.

63
3.3.3 Modelling and estimation results
3.3.3.1 Non-parametric estimates of the survivor functions
The focus of our work is to examine whether foreign firms affect domestic firms’ probability of survival. We first provide a Kaplan-Meier non-parametric estimate of survival patterns for the whole sample and also distinguishing for different types of firms (see section 3.2.2. for a description of the Kaplan-Meier survival function). Figg. 3.3.1-3.3.8. presents this preliminary evidence. First, we may have a look at the survivor function for all firms. The rate of survival up to age 10 is 91% while only 61% of firms in our sample survive up to 50 years.
Fig. 3.3.1 Kaplan-Meier survival estimate
Figure 3.3.2 Kernel density estimates
0
.01
.02
.03
.04
Density
0 50 100 150 age
kernel = epanechnikov, bandwidth = 1.4338
0.00
0.25
0.50
0.75
1.00 Survival Probability
0 50 100 150 Age

64
However, the negative and decreasing slope of survival functions shows that the probability of interruption is greater in the first few years of life, while the risk of failure gradually declines as firms are longer lasting (older). This is confirmed by the Kernel density function of age. It is also worth observing that firms in high medium technology sectors endure better survival prospects than firms in medium-low tech sectors. In particular, about 70 percent of domestic firms in sectors with a higher technology survive up to 50 years, whereas for firms in higher technology sectors the probability of surviving up to that age is more than 95 percent. This is in line with our expectation of higher volatility of behaviour of foreign and of domestic firms in low technology sectors following the literature on creative destruction (Audretsch, 1991; 1995) according to which the major factor impacting on firm survival is a firm's ability to innovate.
Figure 3.3.3 Kaplan-Meier survival estimates by technology clusters
Figure 3.3.4. presents the Kaplan-Meier estimates of the survivor function for domestic firms, foreign multinationals and domestic multinationals. The figures reveal that these two latter firm types endure better survival prospects, while domestic firms have much lower survival ratios. This result confirms what we have found in section 3.2.2. on a different dataset and suggests that the resilience of multinational firms is a robust finding obtained by non parametric testing. In this smaller dataset, the gap in survival is higher: only 75 percent of domestic firms survive up to 25 years, whereas the same probability of survival is more than 93 percent for foreign-owned firms and 90 per cent for domestic multinationals. In order to check for the significance of the differences in survival functions we also run the log-rank non-parametric tests of homogeneity across the three groups of firms.This allows us to reject the hypothesis that the survival functions across the different firms are equal. In order to focus on the key question of our analysis, i.e. whether foreign firms are likely to affect domestic firms’ probability of survival, we carry out this test: we compare survival rates of domestic firms in sectors respectively with high and low presence of foreign firms using our dummy for foreign penetration, high_foreign. We do not get a clear pattern (see the graph 3.3.5.) and the log-rank test does not allow us to reject the hypothesis that the survival functions across the firms in sectors with different foreign penetration are equal.
0.00
0.25
0.50
0.75
1.00 Survival Probability
0 50 100 150 Age
Low and Medium-Low Tech High and Medium High Tech
Log-rank test: 10.31*** Wilcoxon (Breslow)t:7.42***

65
Figure 3.3.4 Kaplan-Meier survival estimates by ownership
Figure 3.3.5 Kaplan-Meier survival estimates by foreign investment
0.00
0.25
0.50
0.75
1.00
Survival Probability
0 50 100 150 Age
HIGH_FOREIGN=0 HIGH_FOREIGN=1
Log-rank test:1.90 Wilcoxon (Breslow)t: 0.21
0.00
0.25
0.50
0.75
1.00 Survival Probability
0 50 100 150 Age
Domestic non multinationals firms Foreign Multinationals
Domestic Multinationals
Log-rank test: 13.55*** Wilcoxon (Breslow): 8.23**

66
However, when we disaggregate by high-medium high and low-medium low tech industries we observe two different patterns (Fig. 3.3.6. and Fig. 3.3.7.). Firms in high-medium high tech industries with above average rates of presence of foreign multinationals (high_foreign = 1) have lower survival probabilities. Conversely, the disparity in survival rates between firms in high or low FDI industries is not clear-cut if the industry is classified as low and medium low tech. This preliminary finding although do not provide us with a straightforward picture yet suggest that the impact of foreign presence on domestic firm survival might depend on the technological environment and is potentially more dangerous in more technology intensive industries. 51
Figure 3.3.6 Kaplan-Meier survival estimates by foreign investment (High and Medium-High Tech)
Finally, we compare survival rates of domestic firms with low and high technology gap with respect to foreign firms respectively. We observe that firms with a low gap endure better survival prospects than firms with high gaps. In particular, less than 75 percent of domestic firms with a high technology gap with respect to foreign firms survive up to 50 years, whereas the probability of survival up to that age is more than 95 percent for firms with low technology gap (see Fig. 3.3.5).
51
Although, it must be said hat the accompanying Log-rank tests shows that the difference in firm survival rates according to the foreign presence is not significant.
51
0.00
0.25
0.50
0.75
1.00 Survival Probability
0 20 40 60 80 100 Age
HIGH_FOREIGN=0 HIGH_FOREIGN=1 Log-rank test: 0.34 Wilcoxon (Breslow)t: 0.33

67
Figure 3.3.7 Kaplan-Meier survival estimates by foreign investment (Low and Medium-Low Tech)
Figure 3.3.8 Kaplan-Meier survival estimates by technology gap
0.00
0.25
0.50
0.75
1.00 Survival Probability
0 50 100 150 Age
Low Technology Gap High Technology Gap
Log-rank test: 34.46*** Wilcoxon (Breslow): 27.85***
0.00
0.25
0.50
0.75
1.00 Survival Probability
0 50 100 150 Age
HIGH_FOREIGN=0 HIGH_FOREIGN=1
Log-rank test: 0.10 Wilcoxon (Breslow): 1.33

68
3.3.3.2 Empirical model: FDI impact on firm duration
The Kaplan-Meier survivor functions do not consider other factors that may affect plant survival, i.e. plant-, firm-, and industry-specific factors. So we turn to the econometric estimates of an hazard function:
e iti,t f ( D W D , , , i t,, it) [6]
where exit of firm i in industry j at time t (see Appendix AII. Methodological notes: for the definition of firm exit) is related to FDI within the sector and within the region, which captures the competition and knowledge spillover effects of FDI (horizontal spillover), and is also related to upstream and downstream FDI, which in turn capture the forward and backward vertical linkages effects; Xi,j,t is a vector of firm and industry characteristics (see section 3.3.2.
and table 3.3.1. for the full list of the firm and industry covariates), is the error term accounting for stochastic shocks at a firm level. The Cox proportional hazard model imposes the restriction that the hazard functions for different values of the explanatory variables are proportional to each other and their coefficients are constant over time (“firm age” in our case). We tested the proportional hazards assumption for each explanatory variable by the Schoenfeld test and found that the hypothesis of proportional effect is rejected for wage. Therefore, the age-varying interactions of this variable is added in the model. We estimated both the continue hazard model (Cox) and the discrete time version of it: i.e. the Complementary log-log or “clog-log” model (Jenkins, 2005).52 However, in the Clog-log estimates the rho parameter (fraction of the error variation due to variation in the unobservable individual effects, which enables us to detect the unobservable heterogeneity in our model) does not allow us to reject the null hypothesis of no existence of unobservable heterogeneity. Thus, the adoption of a continuous model such as the Cox, does not entail a problem of biased estimators or spurious negative duration dependence. Since the estimation results of the two models were qualitatively same, we present here the results for only the Cox proportional hazard model (see section 3.2.2 for a formalized description of this model).53 The results of the econometric estimates are presented in Table 3.3.3. All models are stratified by year (so that each year is permitted to have a different age-dependent baseline hazard function). In this way we take into account the effects of the business cycle and other macroeconomic shocks on survival. All standard errors are clustered on firms. We could not stratify by industries as we had few observations by sectors and also many control variables at sector level which dropped out most of our sector dummies. Sector level variables, in addition to macro sector dummies, should account for possible productivity differences across macro sectors. In estimating the hazard model using data for all manufacturing industries, we implicitly assume that the effect of the explanatory variables is uniform across different firm types. This is arguably quite a restrictive assumption, given that we pool firms with different technology features and working in different technological environment. Hence, we check for two sources of potential heterogeneity in our data: the link between technology gap and spillovers, like in Girma and Gong (2008), and the link between the level of technology of the sector and spillovers, like in Görg and Strobl (2003) and Kosovà (2010). As a preliminary
52
Our estimate of the hazard function had to cope with the choice between continuous and discrete models. Firm survival is a continuous variable (a firm can exit after two and a half years). However, data are grouped by years due to balance sheet reporting (i.e. we only have annual observations on firm exit), and the majority of the covariates are time-varying. Even if we know the exact moment when the event takes place (interruption of firm activity), it is recorded in specific time-discrete intervals (annual balance sheet data). This could result in a considerable number of tied survival times, implying the risk of biased estimation of coefficients and standard errors. Secondly, in continuous models it is difficult to properly control for the existence of unobservable heterogeneity (frailty), which would lead not only to biased estimators but also to spurious negative duration dependence. Based on these considerations we estimated both a continuous and a discrete hazard model. See Jenkins “Survival analysis”(2005) for an overview of complementary log-log and proportional hazard models. 53
As according to Jenkins (2005) any standard model for binary dependent variables can be applied to estimate discrete time hazard models we also tested our results using logit and probit.

69
check we introduce a dummy variable to capture the different behaviour of firms in low technology sectors versus high technology ones in terms of survival. The coefficients are statistically significant and below one, revealing that the hazard rates is substantially lower. A dummy variable has also been introduced to capture the different behaviour of firms which have a high technology gap (proxy for firm absorptive capacity) with respect to foreign firms, identifying two categories (low technology gap firms, i.e. gap_1=1; high technology gap firms, i.e. gap_2 =1, see the list of variables in section 3.3.2 for the construction of these two dummies). The coefficient in this case is statistically not significant. Then, we adopt a sub-samples strategy.54 We first check for the sensitivity of the model to alternative ranges of technology gap between foreign and domestic firms. These estimations provide a test for the absorptive capacity hypothesis (Glass and Saggi, 1998) and can be compared to the literature on the link between technology gap and productivity spillovers.55 Then, we have splitted our sample according to clusters of technology56to which firms belong distinguishing two groupings: i) high and medium-high technology industries and ii) low and medium-low technology ones.57 In table 3.3.3. aside the estimates for the pooled sample we also present the coefficient for the subsamples.The coefficients are presented in exponential form to express the ratio in which the dependent variable (likelihood of failure) changes as the explanatory variable goes up one unit (hazard ratio).58
54
In the splitted samples both the baseline hazard and the effect of the explanatory variables can be dissimilar for each firm group considered. In order to check whether these differences in the covariates are significant, a likelihood ratio test of differences which compare the restricted and the unrestricted model coefficients was performed which entails the null hypothesis that both coefficients are equal. The resultant likelihood ratio test statistics were highly statistically significant, allowing us to reject the null hypothesis that the data can be pooled across the different firm types. 55
See Cantwell, 1989; Kokko, 1994; Takii, 2005; Dimelis, 2005; Hamida and Gugler, 2009, which find a negative relationship, and Jordaan, 2008 and Jabbour and Mucchielli, 2007, which find a positive relationship. 56
For a detailed list of these sectors along with their ATECO codes, see tab. 3.2.7. 57
We first re-ran the hazard model including interaction terms of the high-tech dummies with the FDI related variables, thus allowing the coefficients of the FDI variables to vary across these two firm types. The results not reported for shortness, show that the interaction terms are insignificant. Hence we proceeded to investigate whether all coefficients should (jointly) vary across firm technology type. The likelihood ratio test of differences which compare the restricted and the unrestricted model coefficients (41.62) was highly statistically significant, allowing us to reject the hypothesis that the data can be pooled across these two firm types. 58
Values below (above) the unit indicate negative (positive) impact of the explanatory variable on the hazard rate. In the case of a dummy variable covariate, the hazard ratio can be interpreted as the increase in the overall hazard rate for the firm when the dummy is equal to 1 while holding all other variables constant.

70
Pooled sample Gap low Gap high
Low-Medium Low Tech
High-Medium High Tech
Variables firm-level HazardRatio
Robust Std. err.
Hazard Ratio
Robust Std. err.
HazardRatio
Robust Std. err.
HazardRatio
Robust Std. err.
Hazard Ratio
Robust Std. err.
ldipendenti 1.055 0.140 0.681 0.209 1.477 0.247 1.293 * 0.197 0.508 ** 0.189
lproductivity 0.498 *** 0.105 1.221 1.362 0.423 * 0.093 0.415 *** 0.090 1.342 0.313
lwage 6.110 * 6.282 8.841 17.320 12.065 25.785 1.477 1.315 719.080 3356.513
lwage*lage 0.935 ** 0.030 0.851 * 0.073 0.952 0.057 0.749 ** 0.109
capintensity 1.000 0.000 1.000 0.000 1.000 0.000 1.000 0.008 1.000 0.000
collateral 0.553 0.330 0.715 0.563 1.951 2.088 0.977 0.013 0.620 0.605
ptpm (profitability) 0.997 0.009 0.984 0.090 0.996 0.008 0.998 0.008 1.007 0.142
solvency_ratio 0.979 ** 0.011 0.959 0.025 0.984 0.012 0.977 * 0.013 0.991 0.022
deb_bank/turnover 0.992 0.007 0.974 0.019 0.995 0.009 0.988 0.008 1.012 0.016
domestic multinationals 0.373 0.321 0.623 0.637 0.403 0.496 0.224 0.280 1.832 1.798
impshare 1.056 0.094 1.022 0.149 0.966 0.121 1.024 0.096 0.018 0.056
expshare 0.939 0.046 0.860 ** 0.062 0.993 0.064 0.927 0.050 4.626 6.473
FDI_own 0.000 ** 0.002 0.000 *** 0.000 0.316 1.758 0.000 ** 0.000 0.000 0.000
FDIUP 0.841 0.122 0.294 *** 0.106 0.907 0.175 0.714 * 0.137 0.467 0.712
FDIDOWN 0.927 0.108 1.213 0.229 0.952 0.131 0.947 0.141 4.881 13.393
FDI_share_region 1.633 3.139 0.000 0.003 82.552 ** 191.77 1.948 3.812 1.155 6.807
esportatrici03 1.266 0.459 2.202 2.324 1.072 0.446 1.284 0.541 1.549 1.350
out_growthrate 0.948 * 0.030 0.959 0.035 0.950 0.038 0.898 0.034 0.926 0.066
entryrate 1.038 0.224 0.712 ** 0.188 1.066 0.283 1.096 0.204 0.864 0.974
MES 1.010 0.011 1.130 *** 0.038 0.988 0.013 1.010 0.011 0.917 0.068
HERF 0.931 0.043 0.486 *** 0.138 1.012 0.060 1.041 0.084 1.298 0.303
gapclass2 (high gap) 0.688 0.362 0.594 0.307 0.928 0.701
techclass1 (low tech) 0.419 0.081 0.003 *** 0.004 0.705 0.948
Mezz 1.326 0.634 0.222 0.273 3.305 * 2.131 1.118 0.600 2.996 4.336
Number of obs 20335 10247 10177 14130 6209
Wald chi2(25) 90.07 137.81 83.48 66.34 62.78
Prob > chi2 0 0 0 0 0
Log pseudolikelihood -
168.305 -35.236 -88.967
-111.020 -25.626
Table 3.3.3 Regression estimates of firm exit: Cox Proportional Hazard Model (pooled sample and sub-samples, 2002-2010)
Notes Coefficients are expressed as hazard ratios. *** = statistically significant at 0.01 per cent level.** = statistically significant at 0.05 per cent level. * = statistically significant at 0.10 per cent level. All models includes time dummies. Random effects are included.
71
The overall results provide strong evidence of horizontal intra-industry spillovers: firm survival is strongly affected by the increased presence of foreign MNEs within the same industry. An alternative explanation of the positive effect could also be that multinationals locate in industries that have higher productivity, as argued by Aitken and Harrison (1999), and hence higher survival rates. In this case, of course, the positive result would not necessarily indicate spillovers. However, Wang (2010) argues that although FDI tend to be endogenous at the aggregate level, when the effects of industry-level FDI are examined at the firm level, as in our case, the potential endogeneity tends to disappear. Besides, the inclusion of other industry covariates along with those at the firm level, already control for the possible endogeneity of FDI. So we deem that the potential endogeneity issue of FDI at the aggregate level is not a problem at the micro-level.59 However, a caveat is worthwhile regarding the limitation of the spillover measures we use. As spillovers cannot be measured at the firm level, due to the lack of data on inter-firm linkages, vertical spillovers are calculated using input-output tables and the sectoral classification allowed by the input-output tables, which is quite broad (NACE classifications at 2-digit level). Hence, the variation in the data is quite limited and this could lead to weaker results. Our findings are consistent with positive intra-industry spillovers for manufacturing firms survival shown in Görg and Strobl (2003) for Ireland, Burke et al. (2008) for UK, Kosovà (2010) for the Czech Republic and Wang’s (2010) for Canada. Focusing on the splitted sample, our results are quite different. In the group of firms with a low technology gap we find not only positive and significant horizontal spillovers but also upstream spillovers. Conversely, in the case of high technology gap firms the horizontal and backward FDI spillover variables keep the same signs but are both not significant. The existence of positive upstream spillovers when the technological gap is low suggests that this type of domestic firms have a higher absorptive capacity which allow them to benefit from supplies of intermediate goods and machinery from MNEs. In other words, our findings suggest that being a customer of foreign companies has a beneficial effect on a more productive firm’s survival, but only domestic firms with at least a basic level of technology are enabled to adapt to better foreign technologies. These results point to a sensible economic interpretation: MNEs in upstream industries may provide inputs to domestic firms that were previously unavailable in the country, or provide them with technologically more advanced or less expensive ones, or ensure that they are accompanied by the provision of complementary services (Javorcik, 2004). However, in the case of firms with a high productivity gap, inputs produced locally by foreign firms can be more expensive and less adapted to local requirements as foreign firms are too technologically advanced compared to local enterprises.60 We may conclude that a certain level of absorptive capacity is needed for domestic firms to assimilate the technology brought in by the foreign affiliates. The analysis confirms that the magnitude of spillovers is crucially dependent on the technological sophistication of local firms both at horizontal and at vertical level. We observe that only Italian firms with a low technology gap are actually able to exploit spillovers from foreign competitors (both horizontally and via forward linkages between MNEs and local buyers of intermediate goods). Less efficient firms are not able to catch this opportunity. Hence, when the gap is large MNEs face some difficulty in interacting with domestic suppliers and customers. On the other hand, there is no evidence of vertical downstream spillovers. If this is not the case, foreign firms may be relatively self-sufficient and collaborate little with local firms (foreign firm ‘enclaves’). Under these circumstances, downstream foreign firms might come with fully integrated upstream supply, or upstream foreign firms with fully integrated downstream distribution. We may also conjecture that when foreign firms act as customers of Italian local firms they are probably quite selective and this makes competition among local suppliers more fierce and lowers prices. Turning to the disaggregation by technology sectors, we have ambiguous a priori on the expected outcome.
59
Most of the literature on FDI spillovers treat the level of FDI as exogenous (see Jovarcik, 2004; Blalock and Gertler, 2008). Only Lileeva (2010) tests for endogeneity of industry level FDI but reject the hypothesis. 60
Girma and Gong (2008) and Ayyagari and Kosová (2010) studies of no evidence of spillovers in the same industry and no vertical spillovers of any kind in manufacturing for two emerging countries (China and Czech R.) might be interpreted as due to high technology gap/low absorptive capacity of domestic firms.

72
Domestic firms in high tech sectors are more likely to benefit from positive spillovers as they can be assumed to have relatively high levels of technology themselves and thus to have some level of absorptive capacity i.e., the necessary stock of knowledge which allows them to utilise spillovers from multinationals. This may not be the case for domestic plants operating in low-tech sectors (Görg and Strobl, 2003). However, on the other hand, high tech sectors are more competitive and MNEs might have more incentives to prevent technology leakages to their competitors which may reduce above all horizontal spillovers. Besides, according to Burke et al. (2008), differences in innovation represent the focal point for competition in dynamic industries, then foreign ownership is more likely to lower the firm survival rate in dynamic industries, while in static industries firms are more imitative and hence have more scope to benefit from knowledge spillovers from foreign firms. In our estimates for the technology sub-samples we find that the presence of multinationals within the same sector and in upstream sectors has a positive effect on plant survival only for firm operating in low-medium low tech sectors, while in the high_medium high tech sub-sample both horizontal and vertical spillovers are statistically insignificant, suggesting that survival for this group is not affected by FDI linkages. The reason of this quite unexpected result might be that in less advanced sectors Italian firms are less disadvantaged with respect to foreign firms in terms of productivity and therefore more able to absorb the knowledge spillovers spreading from foreign firms. Our results differ from Görg and Strobl (2003) and Kosovà (2010) which find that intra-industry technology spillovers are more likely in technologically advanced industries for Ireland and Czech R. respectively. Turning to the other sector and firm specific variables, both sector and firm specific variables appear to have the expected signs. Once controlling for several firm and industry covariates, size do not appear a significant determinant of exit in the overall sample but it is significant once splitting the sample according to the technology intensity. It is interesting to observe that in low tech sectors small firms experience lower exit rates whereas it is the opposite in high tech sectors. Productivity consistently reduces firm exit (by about 50 per cent). This result is mainly related to firms in low and medium-low tech sectors and to firms with a high technological gap. The change in the wage variable (wage interacted with age) is significant and consistently reduce exit for firms operating in high tech sectors or with low productivity gap. These results are not surprising if we think of the stronger link between productivity and wages which exist in some sectors and in more efficient firms.61 The sector export intensity reduces the risk of dying but only for those firms with low productivity gap. In addition, firms with low technology gap benefit of industries high entry rates getting a risk of dying which decreases by about 29 per cent with each percentage increase in entry rate. These firms also benefit of industry concentration (the Herfindhal index) with about a 50 per cent lowering in the hazard rate. Conversely, the minimum efficient scale has a negative impact: firms entering into sectors characterized by the existence of large firms are less likely to survive, maybe due to stronger competition.
61
This variables allow to take into account the skill level at the firm level, as firms employing more skilled workers are expected to pay higher wages. The higher wage/skill in the firms would improve the probability of surviving of the firm.

73
3.3.4 Conclusions
FDI affiliates in a host country interact with its indigenous plants in many ways—as competitors, input suppliers and customers. FDI affiliates compete for market shares with domestic-owned plants in the same industry (intra-industry economic linkages), they supply intermediate inputs to domestic-owned plants (the upstream inter-industry linkages), and they purchase products produced by domestic-owned plants (the downstream inter-industry linkages). Through these intra- and inter-industry economic linkages FDI generates significant impact on indigenous plants. These effects can be shown through productivity changes, plant /firm death/survival and employment adjustment. Here, we have examined the effects of FDI on the survival of manufacturing firms located in Italy. In the following section we will also focus on employment changes. The study finds that the presence of FDI in Italy exerts contrasting effects on manufacturing firms. These tend to be affected posively by competition from FDI affiliates operating in the same industry, and also benefit from FDI affiliates operating in upstream industries through inter-industry economic linkages while end up with shorter lives (and more deaths) due to FDI in downstream industries. We may conclude that the effects of FDI mostly come from those industries with which plants closely interact as competitors or as input suppliers. Conversely there is no evidence that foreign firms facilitate knowledge transfer to local firms to enable them to produce intermediate inputs more efficiently, thereby making them available to foreign firms upstream at a lower cost. We verify the relevance of spillovers in relation also to the absorptive capacity of domestic firms from MNEs: the level of technological gap matters considerably for the spillover effect and only the Italian firms with a low technological gap are in fact able to exploit spillovers. Finally, also the technology of the sector influences spillover: firms in low -medium low tech sectors seem to take advantage of positive externalities from MNEs (in the upstream sectors and in the same sector). This might suggest that domestic firms are more imitative in these sectors and therefore more able to absorb the knowledge spillovers from foreign firms. There is scope to enhance the results of this investigation but this would entail more detailed data on foreign investment. First of all, it would important to test for the differential impact of Greenfield FDI (increased capacity and lowering of prices) versus M&As. Second important task might be to test for the impact of the country/region of origin of FDI. Then, it would also be important to disentangle between horizontal and vertical FDI to test for the market orientation of FDI (export platforms FDI and market seeking FDI versus cost saving FDI) like in Girma and Wang (2008). Last but not least, instead of using quite aggregated input-output data it would be useful to get firm level data able to catch the firm-to firm exchanges, and therefore also foreign and local firms linkages within and across industries and sectors
3.4 Foreign ownership and firm growth*
In this part of the report, we will analyze the effects of foreign ownership and the presence of foreign firms on the growth process. We first carry out a visual description of average size of foreign versus domestic firms. Figure 3.4.1. depicts the average relative size of firms according to their age. Since “relative size” is defined as log difference between firm size and sector average, the relative size of a firm at the sector average is equal to zero. The average firm size according to age suggests that entrants start small: the relative size in the first years of age is lower than the average size in years following entry, as relative size after entry is increasing. However, quite surprisingly the relative size of firms decreases rapidly after age 4 of life, and converges towards sector average. There is a rapid increase in the relative average size only after age 37 of firms’ life. This trend is verified both in high and low technology sectors and in firms with a high and low technology gap. This quite specific pattern of firm average size in Italy could be due to two related factors: first, the model of specialization is strongly biased toward small and medium firms, secondly, growth is quite weak on average (dwarf firms). However, apparently size matters in order to survive longer: the exit of small firms and the survival of the more dynamic in terms of growth might explain the clear upward trend of relative size as a function of age after some years of life.
* Coauthored by Anna Maria Ferragina and Fernanda Mazzotta.

74
Figure 3.4.1 Average firms’ size by age and technology (2002-2010)
The patterns of average size of foreign and domestic firms is depicted in Figure 3.4.2. The relative size of foreign firms is much higher than the relative size of domestic firms. The average relative size of both foreign and domestic firms tend to increase with firms’ age. However, the distance between the two is more or less constant.
Figure 3.4.2 Average size of foreign and domestic firms (2002-2010)
In order to analyze the relation between exit and average size, we classify all firms into two categories: exitors and survivors. Exitors are those firms that exited from the market by the end of the observation period (January 2010). Survivors are those firms that survived until the end of observation period. Of course, some of the survivors would have exited afterwards, but their exit has not been observed because of truncation of the data at 2010. The relative sizes of domestic exitors are shown in Figure 3.4.3.. It is clearly visible that:
exitors have lower relative size
the visual description of the exit process provide evidence that a part of the increase in the relative size which firms exhibit after a certain age can be explained by the exit process because firms with a lower relative size tend to exit first.
the higher relative size of domestic survivors shows that surviving firms grow more.
0
1
2
3
4
5
6
7
1 5 9 13 17 21 25 29 33 37 41 45 49 53 57 61 65 69 73 77 81 85 89 93
R
e
l
a
t
i
v
e
s
i
z
e
Age
Gaplow Gaphigh Techlow Techhigh
0
10
20
30
40
50
0
8
16
24
32
40
48
56
64
72
80
88
96
10
4
11
3
12
1
12
9
13
7
R
e
l
a
t
i
v
e
S
i
z
e
Age
Foreign Domestic

75
Figure 3.4.3 Average size of survivors and exitors by survival duration (2002-2010)
3.4.1 Econometric model
In this section we will use regression analysis of firm employment growth to check for two things: first, to test if there is any statistically significant difference between growth rates of domestic and foreign firms, and secondly, whether spillovers from foreign firms have any effect on the growth rates of domestic firms. The growth rate of firms follows a stochastic process that, following Gibrat (1931), 62 could be expressed as:
[7]
Ei,t+1 is the size of firm i at time t+1 and Ei,t is the size of firm i in some previous period t. is
some constant growth rate (drift rate) which is common to all firms. i,t is the random shock, assumed to be identically and independently distributed. Taking natural logarithms and rearranging the terms in [7], results in an equation of the following form:
[8]
where 0 =ln and ui,t+1 =ln i,t+1 In such a situation the value of 0 (the constant growth rate) determines whether the average size of firms is increasing or contracting, a negative value suggests contraction while a positive value suggest that firms on average are tending to grow.
The represents the effects of initial size on the subsequent rates of firms growth. If = 1 then firm size has no effect on growth and the law of proportionate effect holds. If < 1 this implies that small firms on average grow faster than their larger counterparts.63 If > 1 then large firms tend to grow faster than smaller firms.64 We can transform the [8] as follows:
[9]
62
Gibrat’s law (1931) is a prominent model of firm growth according to which the growth rate of a given firm is independent of its size at the beginning of the period examined. In other words, “the probability of a given proportionate change in size during a specified period is the same for all firms in a given industry - regardless of their size at the beginning of the period” (Mansfield, 1962, p. 1031), Therefore the actual firm size should be independent from the previous size. Gibrat’s Law can be empirically tested in at least two different ways. Firstly, one can assume that it holds for all firms in a given industry, including those which have exited the industry during the period examined (setting the proportional growth rate of disappearing firms equal to minus one). Secondly, one can postulate that it holds only for firms that survive over the entire time period. 63
This situation is termed ‘regression’ to the mean and it indicates a tendency for firm size to return to the mean size for the population (Weiss, 1998). 64
This latter outcome would imply that the time path of the size measure is explosive, which is possible over a short period of time but not over a longer period of time (Wilson et al., 2000).
0
5
10
15
20
25
30
35
40
45
50
0
8
16
2
4
32
4
0
48
5
6
64
7
2
80
8
8
96
1
04
1
13
1
21
1
29
1
37
R
e
l
a
t
i
v
e
S
i
z
e
Age
survivor exitors

76
That can be written as:
[10]
Controlling for other variables X we have:
[11]
Three traditional econometric issues arise in employment growth estimates. The first concerns the heteroskedasticity, which may occur when the Gibrat’s Law is not confirmed (i.e. if small firms grow faster than their larger counterparts, the variance of growth should tend to decrease with size). Secondly, there is a crucial problem of sample selection: if survival is not independent of firm’s initial size, i.e., if smaller firms are more likely to exit than their larger counterparts, empirical tests can be affected by a sample selection bias and estimates must take account of this possibility. A third issue was first discussed in a seminal paper by Chesher (1979) and concerns the fact that, when there is serial correlation in growth rates, ordinary least squares (OLS) estimators are inconsistent. Several studies have dealt jointly with one or more of these econometric problems now discussed (see Lotti et al., 2003, for a survey). For the Italian context, Contini and Revelli (1989) using data from a panel of manufacturing firms located in the Northern Italian region of Piedmont demonstrated that the departures from Gibrat’s Law were “modest”. Another study based on Italian data has been conducted by Solinas (1995) and in this case, smaller firms turned out to grow faster than larger ones (once the original sample had been limited to companies with at least one employee). Lotti et al. (2003) using data set from the Italian National Institute for Social Security (INPS) and controlling for sample selection and heteroskedasticiy found that in some (but not in all) selected industries in Italian manufacturing Gibrat’s Law fails to hold in the years immediately following start-up, when smaller firms have to rush in order to achieve a size large enough to enhance their likelihood of survival. Conversely, in subsequent years the patterns of growth of smaller firms do not differ significantly from those of larger ones, and the Law is therefore confirmed. To estimate our growth model (which can be assimilated to a labor demand model) we use dynamic panel data techniques. We adopt specifically the GMM-system method developed by Blundell and Bond. The GMM-system method takes into account unobserved firm-specific effects and the endogeneity of the lagged dependent variable (log(Et)) in the model.65 The main limitation of the GMM-system method in our context is the fact that there could be attrition bias because some firms exit from the market and exit is not a random process. As discussed in Hall (1987), Evans (1987), Mata (1994), Dunne and Hughes (1994), Sutton (1997) and Weiss (1998), the appropriate econometric method to deal with this problem of selection bias is the two-step procedure suggested by Heckman (1979)66 (see also Maddala, 1983; Amemiya, 1984; Greene, 1993). Moreover, in this contest we have panel data, consequently we have to deal with a Heckman sample selection with panel data (see Wooldridg, 1995). See section A.II in Appendix A for a detailed description of this method. We estimate an unbalanced panel as we consider both surviving and non surviving firms to take into account the so called “survivorship bias”. In fact, since growth can only be
65
The idiosyncratic shock may adopt an autoregressive form, capturing factors such as omitted characteristics that persist or non-instantaneous adjustment. By performing a Sargan test the hypothesis of correlation between residuals and lagged value of the dependent variable could not be rejected. For this reason we turned to GMM method using GMM instruments (1-3 lags) for all firm level variables. This estimation method allows us to assume that firm characteristics are endogenous variables and use them as instruments. The System-GMM is derived from the estimation of a system of two simultaneous equations, one in levels (with lagged levels as instruments) and the other in first differences (with lagged first differences as instruments). We decided to use the GMM (Generalized Method of Moments) technique (GMM-System) as Blundell and Bond (1998 and 2000) show that, when the dependent variable follows a path close to a random walk, the differenced-GMM (Arellano and Bond, 1991) has poor finite sample properties, and it is downwards biased, especially when T is small. 66
The Heckman selection model is based on estimating two equations, the first one is the selection model (the determinants of survival), and the second one is the growth model that includes a selectivity-bias correction term derived from the estimates of the selection model.See section A.II in appendix A for a detailed description.

77
measured for firms which have survived over the entire examined period, and since slow growing firms are more likely to exit, small fast growing firms may be over-represented in the surviving sample and this may bias the results of the empirical research.67 All explanatory variables used in the Cox proportional hazard model are also used in the growth model but we also add (log) age of the firm into the model.68
3.4.2 Results
As the GMM-system model and the Heckman model results are quite similar we will only comment the former. However, the Heckman estimation results for the growth model are presented in the Appendix A (Table A.III.1). First of all, in the overall sample we find that foreign ownership does not have a significant impact on growth. Furthermore, foreign spillover variables have generally a not significant impact on growth rates neither on firms competing in the same sector nor on buyer and sellers. Therefore, it seems that both competing with foreign firms and buying or selling inputs from them has no detrimental effect on the growth prospects of domestic firms. However, the share of foreign firms in the same industry (FDI_OWN) has a negative impact on firms with higher technology gap. Moreover, the share of foreign firms in buyer industries (FDI_DOWN) has a a negative impact on firms belonging to low tech sectors. Besides, firms located in regions where the share of foreign firms increase rapidly are less likely to grow. Hence, local spillovers are not at work and there is a strong local displacement. These results are consistent with those shown in the Heckman model in Appendix. As expected in the Heckman model the effect of size is lower given that the selectivity-bias correction term derived from the estimates of the selection model is meant to correct for an overestimate of growth for the surviving firms. Turning to the other sector-specific variables we observe that they have a strong impact on the growth rates of firms. Firms operating in sectors that experience high growth rates in output also grow more. Firm growth rates are also higher in more concentrated sectors (Herfindhal). Hence, the lack of competition has a positive impact on the growth rates of firms. However, firms tend to grow less in sectors characterized by high minimum efficient scale (MES). This could be due to the need to reach minimum efficient scale sooner to be competitive in the market. Firm-specific variables also have the expected effects. Firm size was expected to have a negative impact on growth (that means, the coefficient of current size variables is expected to be less than one). This result is confirmed as the coefficient of current size variable (llab) is positive but less than one, adding another evidence in support of the stylized fact that small firms growth faster. Then the Gibrat law (elasticity equal to 1) should be rejected. This is consistent with what was also found in Lotti et al. (2003) and in most previous empirical research. The inverse relationship between age and growth is confirmed: mature firms have lower growth rates consistenly with the theory, and also with previous studies (among all Lotti et. al., 2009). Firms paying higher wages (presumably due to the fact that higher wages mean also higher skilled workers) and firms with higher productivity grow faster. Capital-intensive firms tend to grow less in low tech sectors possibly because of the complementarities between capital and skilled labor. More indebted firm achieve faster growth. The variable for R&D is not shown as it have positive but statistically insignificant coefficients possibly because the panel is short for that dataset and unobserved firm-specific effects dominate the contribution of the R&D variable that do not change much over time.
67
Albeit many empirical studies often select a sample of only surviving firms, such a choice may bias the results. If the investigation would be carried out only on surviving firms the selection of the sample might be correlated with the same variable which may affect firm growth. For instance, small firms may be more likely to fail and may not be more likely to grow than larger firms. This would lead to an underestimation of the estimated impact of size. Similarly, the results might be biased in favour of foreign-owned firms if they present higher survival probabilities, leading to the conclusion that foreign ownership has a significant explanatory power upon firm performance measures (Alvarez and Görg, 2009). 68 Note that the Cox proportional hazard model also includes the age of the firm in the nonparametric part (baseline hazard function).

78
GMM-system estimates, dependent variable: fllab= employment at time t+1
Pooled sample Gap low Gap high Low-Medium Low Tech High-Medium High Tech
L.fllab 0.905*** 0.907*** 0.902*** 0.887*** 0.898***
(0.0134) (0.0185) (0.0201) (0.0169) (0.0248)
lage -0.0222** -0,0206 -0.0396*** -0.0221* -0,0262
(0.0105) (0.0143) (0.0136) (0.0132) (0.0160)
lproductivity 0.0939*** 0.0521* 0.141*** 0.0937*** 0.153***
(0.0274) (0.0290) (0.0386) (0.0306) (0.0501)
lwage 0.573*** 0.540*** 0.622*** 0.625*** 0.336**
(0.0745) (0.102) (0.0939) (0.0927) (0.155)
capintensity -0,000135 0,0000864 0,0000363 -0,000187 0,000274
(0.000120) (0.000222) (0.0000896) (0.000118) (0.000293)
collateral -0,00136 -0,0533 -0,012 0,0173 -0,0986
(0.0465) (0.0636) (0.0576) (0.0484) (0.0754)
ptpm -0,000133 0,000877 -0,000699 -0,000583 -0,00076
(0.000712) (0.000835) (0.000994) (0.000809) (0.00118)
solvency_ratio 0,00024 0.00195* 0,00108 -0,000198 0.00219*
(0.000710) (0.00102) (0.00109) (0.000874) (0.00128)
deb_banc_fatt 0.00133*** 0.00190** -0,000021 0,000932 0.00191*
(0.000497) (0.000769) (0.000586) (0.000585) (0.00107)
FDIIN -0,00391 0,0021 -0,000761 -0,0137 -0,0362
(0.0263) (0.0359) (0.0364) (0.0251) (0.0646)
FDIOUT 0,00161 -0,00358 -0,00918 -0.0227* 0,029
(0.0117) (0.0145) (0.0212) (0.0133) (0.0198)
imp -0,000219 0,000108 -0,00234 -0,0015 0,00259
(0.00171) (0.00200) (0.00222) (0.00180) (0.00763)
exp 0.00248*** 0.00311*** 0.00374*** 0.00390*** -0,00544
(0.000853) (0.000871) (0.00106) (0.00101) (0.00446)
FDI_OWN -0,0741 -0,149 -0.214** -0,0875 -0,249
(0.0698) (0.0987) (0.0831) (0.136) (0.191)
FDIUP 0,000903 -0,00105 0,00284 0,00313 -0,00953
(0.00215) (0.00292) (0.00253) (0.00221) (0.0103)
FDIDOWN -0,00225 0,00177 0,00106 -0.00604** 0,0104
(0.00285) (0.00362) (0.00347) (0.00299) (0.0123)
FDI_SHARE_BYREGION -0.156*** -0.187*** -0.222*** -0.209*** -0,0397
(0.0446) (0.0527) (0.0577) (0.0568) (0.0750)
out_growth -0.00113** -0,0011 -0.00134** -0,000377 0,000914
(0.000563) (0.000781) (0.000623) (0.000647) (0.00107)
Entryrate 0,00574 0,00468 0,0048 0,00678 0,023
(0.00494) (0.00644) (0.00586) (0.00498) (0.0151)
Mes -0.000575*** -0.000434* -0,000372 -0.000575*** -0,00054
(0.000168) (0.000238) (0.000229) (0.000178) (0.000563)
Herfhindal 0.00364*** 0.00378*** 0.00313** 0.00548** 0,0000239
(0.00112) (0.00135) (0.00140) (0.00254) (0.00226)
gap1_2 0.0208***
0.0196*** 0,00487
(0.00685)
(0.00724) (0.0156)
_cons -6.198*** -5.597*** -7.249*** -6.659*** -4.266**
(0.758) (1.056) (0.733) (0.802) (2.016)
N 15269 7811 7458 10552 4717
Table 3.4.1 Determinants of employment growth: GMM-system estimates
Legend * p<.1; ** p<.05; *** p<.01Robust standard errors in brackets All models include time dummies.

79
3.5 The impact of the global crisis on firms’ survival and employment growth of foreign and domestic firms*
In this last part of the study for Italy we investigate upon the effects of the recent crisis on firms’ survival and employment growth according to firm ownership status. Following the New-New Trade Theory multinational firms are more productive, have higher technological, managerial and human capabilities and, therefore, should also exhibit better financial health and less bankruptcy risk. Therefore, as a result of higher financial stability they should also face less liquidity constraints and have higher capacity to face adverse external conditions (Melitz, 2003). The empirical evidence on these matters is still scarce (see section 3.2.3. for a review of the literature). We examine both the determinants of firm survival (extensive margin of firm adjustment) and employment growth (intensive margin of firm adjustment). We use the database obtained by matching and merging three firm level datasets: Capitalia, AIDA and Mint-Italy (see section A.1. in Appendix A). To check for the determinants of firm survival we first apply a descriptive unconditional analysis comparing surviving firms to exiting ones and then we use two conditional Probit on these two groups of firms. We further study the differences in firms’ employment adjustments to macroeconomic shocks according to firm ownership and to other characteristics. To this purpose, we use a difference-indifference approach by estimating employment growth equations allowing the crisis to impact differently on firms growth trajectories according to the ownership status. Table 3.5.1. contains the mean of a set of variables distinguished by three groups of firms: a) firms which do not fail over the whole period (2004-2010), b) firms which exit before the crisis (2004 – 2008), c) firms which exit during the crisis (2008-2010). In table A.II in Appendix A, details are provided on the year by year number of firms which exited over 2002-2010 and on the type of procedure which led to firm exit. There is clear evidence of an increase in failure and liquidation in 2008 and 2009. The test of mean differences between surviving and failing firms show that the share of affiliates of foreign firms (inward FDI dummy) among the surviving firms is significantly higher that the share which fail both before the crisis and during it. For domestic multinationals (outward FDI dummy) the share of surviving firms is significantly higher that the share of firms failing before the crisis, while it is not significantly different than the share of firms failing over the crisis. More than 50% of surviving firms are exporters, while only 14 and 2% respectively within the two groups of failed firms before and after the crisis on average are exporters. Besides, it appears that on average firms failing during the crisis are younger, smaller, with lower R&D, higher debts and lower collaterals, solvency and profits, with respect to not failing firms.
* Authored by Anna Maria Ferragina.

80
Surviving
firms (0)
Firms exited over
2002-2008 (1)
Firms exited
over 2008-10 (2)
Difference in mean test (t
statistics) (0)-(1)
Difference in mean test (t
statistics) (0)-(2)
Difference in mean test (t
statistics) (1)-(2)
Age 28.95 25.76 26.82 2.00** 2.56*** -0.59
Size 147.02 30.13 96.41 1.96** 2.05** -2.05
Productivity 62744 14517 42188 7.25*** 6.37*** -4.12***
Profit margin 3.99 2.98 -16.04 0.19 8.87*** 1.04
Collateral 0.76 0.75 0.71 0.34 3.84*** 0.88
Debts with banks over turnover 22.11 15.44 35.39 1.73** -9.49*** -4.11***
Solvency ratio 29.60 29.06 15.77 0.14 2.58*** 11.24***
Export dummy 0.52 0.02 0.14 9.71*** 14.61*** 2.11**
Inward FDI dummy 0.04 0.01 0.02 1.45* 2.11** -0.52
Outward FDI dummy 0.04 0.00 0.03 2.13** 1.07 -1.82*
Specialisation index 0.43 0.38 0.44 0.98 -0.20 0.98
RD 0.005 0.002 0.01 1.18 -3.64 -2.05
Pavitt 1 0.43 0.55 0.55 -2.20** -4.13 0.04
Pavitt 2 0.18 0.20 0.13 -0.53 2.27** 1.67*
Pavitt 3 0.33 0.22 0.26 2.25** 2.83*** -0.77
Pavitt 4 0.06 0.03 0.06 1.03 -0.58 -1.20
Centre-north Area 0.84 0.81 0.80 0.80 2.23** 0.30
Southern area 0.16 0.19 0.20 -0.80 -2.23** -0.30
Table 3.5.1 Descriptive statistics: variable means (2007)
Notes ***significance at the 1% level; ** significance at the 5% level; * significance at the 10% level.

81
In the next section we turn to a conditional analysis of firms’ failure and growth over the recent crisis to check for the determinants related to foreign firms holding all the other factors constant.
3.5.1 Estimates of the exit rates before and after the crisis
In this section we estimate if foreign firms reacted differently to the severity of the economic crisis compared to other firms along the intensive margin of adjustment: exit. Hence, we estimate the probability of “failure” of a firm (exit dummy) in two periods: before 2008 and during the crisis (2008-2010), as a function of firm ownership controlling for a wide set of firms’ and sector characteristics taken at the beginning of the period in which the failure occurred. The control variables are firm’s size, age, productivity and firm’s financing characteristics such as profit margin and indicators of liquidity and leverage (indebtedness, solvency ratio, collateral ratio). For a detailed description of these variables see section 3.3.2. Furthermore, we include variables for trade specialisation, dummies for Pavitt cluster of innovations, a location dummy and a set of sectoral (2-digit Ateco 91) dummies (δs) to control for differences in regional economic growth and sector specific changes which may have played an important role over the crisis. In addition, our model includes a full set of time dummies accounting for common trends and business cycle effects. In line with the literature (e.g., Greenaway et al., 2008; Zingales, 1998) we use a maximum likelihood probit model of the firm's survival prospects. As a robustness test we also use a Cox proportional hazard model.We observe the company status variable (yit), which is either failure (yi = 1) or survival (yi = 0). The model can be defined by:
[12]
where Pr(yit = 1|Xit) is the probability function for yit = 1 conditional on Xit, X is a vector of explanatory variables, and β the corresponding vector of coefficients. The probit model uses standard normal cumulative density function. G(.) is a function taking on values strictly between zero and one, i.e., 0 < G(z) < 1, for all real numbers z. yit is exit in 2002-2008 or exit in 2008-2010, the x variables are taken at the beginning of the exit period (2003 and 2007, respectively), the slope it is a normally distributed error term.
3.5.2 Results of the estimates of firm exit
We present the estimation results in table 3.5.2.. In order to provide an interpretation of the estimated coefficients we report the marginal changes, evaluated at the sample means for each independent variable.69
69
For a continuous variable the marginal effects show the increase in the predicted probability when there is a one-unit increase in the covariate (when the values of all variables in the model are at the mean of the sample used for the estimation of the model). The marginal effect associated with a dummy tells us the change in the predicted probability of failure when the variable changes from zero to one (when the values of all the other exogenous variables in the model are fixed at the sample mean).

82
Probit model Cox proportional hazard model
Firm exit pre-crisis Firm exit post-
crisis Firm exit pre-crisis Firm exit post-crisis
Size -0.0018 -0.0021 0.7633 0.7979
(-1.79)* (-0.58) (-2.40)** (-2.79)***
Age -0.0038 0.0155 - -
(-2.42)** (2.06)** - -
Prod -0.0086 -0.0137 0.4289 0.9082
(-4.13)*** (-1.99)** (-4.60)*** (-0.63)
Export -0.0328 -0.0584 0.0511 0.2846
(-6.58)*** (-7.07)*** (-5.54)*** (-7.07)***
Inwfdi 0.0032 0.0053 1.4982 1.3028
(0.37) (0.24) (0.49) (0.60)
Outfdi 0.0042 0.0149 1.3587 1.0754
(0.72) (0.83) (0.65) (0.22)
Collateral -0.0086 -0.0107 1.6251 0.4736
(-1.65)* (-0.69)* (0.85) (-2.72)***
Profit -0.00001 -0.0002 0.9964 1.000
(-0.33) (-0.57) (-1.87)* (0.09)
Solvency -0.0002 -0.0010 0.9734 0.9681
(-2.42)** (-3.81)*** (-3.54)*** (-5.40)***
Debt with banks/turnover 0.00003 0.0006 0.9975 1.0109
(0.50) (4.04)*** (-0.50) (3.33)***
Specialisation 0.0012 0.0196 0.9965 1.2221
(0.41) (2.16)** (0.9990) (1.00)
Pavitt traditional 0.0012 0.0094 1.7938 2.8763
(-0.13) (0.29) (0.586) (1.44)
Pavitt scale intensive -0.0061 -0.0012 1.047 1.6912
(-0.80) (0.04) (0.966) (0.69)
Pavitt high-tech -0.0163 -0.0680 -0.000 3.0000
(-6.34)*** (0.96) (-13.53)*** (1.10)
South location dummy -0.0030 0.0094 1.2660 1.7911
(-1.10) (0.91) (0.76) (2.79)***
Industry dummies (2 digit Ateco) Yes Yes Yes Yes
Const 33.564 0.1194
(2.66)* (0.11)
Number of observations 2582 2461 2905 3190
Log likelihood -285.10 -482.69 -504.09 -1346.86
Pseudo R2 0.20 0.18
Pred. P (at x bar) 0.0070 0.0365
No. of subjects
2905 3190
No. of exits
81 212
762.89*** 354.15***
Table 3.5.2 The likelihood of exit before and after the crisis: Probit and Cox proportional hazard model
Notes Robust t-statistics are presented in parentheses. * significant at 10%; ** significant at 5%; *** significant at 1%. ***significance at the 1% level; ** significance at the 5% level; * significance at the 10% level.

83
The two models adopted (Probit and Cox) give very consistent results. Therefore, we focus in the comment on the Probit estimates. We see that the affiliates of a foreign firm exhibit no different exit probabilities than domestic firms both before and after the crisis. The same is observed for the Italian multinationals. So we find no evidence of different behavior of multinationals with respect to domestic firms. The strongest result which emerges from our estimates is a strong negative relationship between export status and exit hazard: exporters experience exit probabilities by 3.2 percentage points lower over the pre-crisis period, and by 5.8 lower over the crisis period. Exporting can be considered a form of risk diversification through spread of sales over different markets with different business cycle conditions or in a different phase of the product cycle. Therefore, exports might provide a chance to substitute sales at home by sales abroad when a negative demand shock hits the home market.70 Turning to the other variables, we also find that before the crisis a 1 per cent increase in the number of employees reduces the firm’s probability of failure by 0.2 percentage points.71 Hence, before the crisis shock, larger firms are significantly more likely to experience lower exit. However, over the crisis larger firms have not benefited of higher chances of survival. Firm age also returns negative coefficients before the crisis, with a reduction in failure risk of 0.3 percentage points72 while, over the crisis older firms experience a higher failure risk. Productivity reduces the risk of failure both before and over the crisis period with a quite high marginal effect (0.8 and 1.4). The profit margin displays a not significant association with the probability of failure before the crisis, a result which is confirmed in the crisis period. Conversely, having higher collateral and solvency is associated with a lower exit risk both before and after the crisis shock,while higher levels of debts with banks over turnover (not significant before the crisis) is a highly significant determinant of firm exit over the crisis, which suggests liquidity constraints and more serious financial tights. Belonging to a high technology sector (according to the Pavitt taxonomy) is a significant determinant of lower exit before the crisis (1.63 percentage points lower) with respect to firms belonging to the reference category (specialised suppliers) but it is not significant over the crisis. Finally, the sectors of national specialisation are more at risk of failure over the crisis.
3.5.3. Firm employment growth estimates
Adjustment over the crisis also occured along the “intensive margin”, i.e. along the scale of operations via reduction or increase. We check whether there was a differential adjustment in employment between foreign and domestic firms during the crisis. In tab. 3.5.3. we preliminary focus on some descriptive statistics on employment growth for the whole sample and for different size subgroups of firms (small-medium, medium-high and large), taking both the whole period 2002-2009 average and the crisis years (2008-2009). To answer our question we distinguish firms groups by ownership. We also enrich the analysis presenting in the table firm groups according to firms’exporting, location, age, financial health. First of all, we may see in the table how seriously the crisis affected employment. Over the entire period the average employment growth was positive and equal to 15.2 percent. Over the crisis, employment growth turned negative (-2.58). Over the crisis, if we consider firms above 50 employees the decrease of employment in foreign firms was higher than in national firms (-4.43 versus -2.47 per cent).73 A robust evidence confirmed across size classes is the higher rate of growth of employment for exporters with respect to non exporters both in the entire periods and during the crisis. Furthermore, on average, young firms, firms with the lowest level of debts with
70
However, exporters are especially affected by higher sunk costs and are more concentrated on economies of scale and as such might be less flexible in adapting to an economic downturn. Furthermore, due to their scale of operation they might be more reliant on credit and bank lending and perceived as more exposed to international risk conditions. 71
This marginal impact, compared with the predicted probability of exit, evaluated at the mean of the independent variables (0.7) implies a reduction in the predicted exit probability by 25% (0.2/0.7). 72
This corresponds to a reduction in the predicted exit probability by 42% (0.3/0.7). 73
Employment growth appears lower in foreign multinationals with respect to the other firm categories also over 2002-2009 (below 1 percent, against +16 percent in national firms).
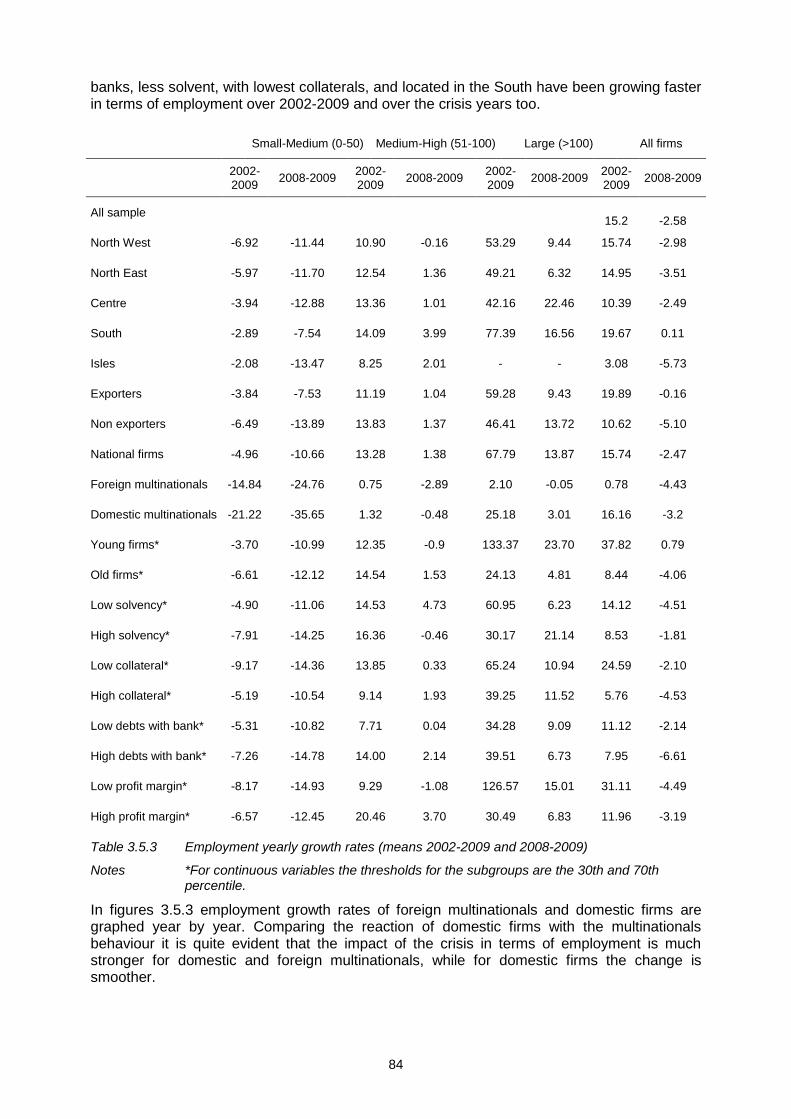
84
banks, less solvent, with lowest collaterals, and located in the South have been growing faster in terms of employment over 2002-2009 and over the crisis years too.
Small-Medium (0-50) Medium-High (51-100) Large (>100) All firms
2002-2009
2008-2009 2002-2009
2008-2009 2002-2009
2008-2009 2002-2009
2008-2009
All sample
15.2 -2.58
North West -6.92 -11.44 10.90 -0.16 53.29 9.44 15.74 -2.98
North East -5.97 -11.70 12.54 1.36 49.21 6.32 14.95 -3.51
Centre -3.94 -12.88 13.36 1.01 42.16 22.46 10.39 -2.49
South -2.89 -7.54 14.09 3.99 77.39 16.56 19.67 0.11
Isles -2.08 -13.47 8.25 2.01 - - 3.08 -5.73
Exporters -3.84 -7.53 11.19 1.04 59.28 9.43 19.89 -0.16
Non exporters -6.49 -13.89 13.83 1.37 46.41 13.72 10.62 -5.10
National firms -4.96 -10.66 13.28 1.38 67.79 13.87 15.74 -2.47
Foreign multinationals -14.84 -24.76 0.75 -2.89 2.10 -0.05 0.78 -4.43
Domestic multinationals -21.22 -35.65 1.32 -0.48 25.18 3.01 16.16 -3.2
Young firms* -3.70 -10.99 12.35 -0.9 133.37 23.70 37.82 0.79
Old firms* -6.61 -12.12 14.54 1.53 24.13 4.81 8.44 -4.06
Low solvency* -4.90 -11.06 14.53 4.73 60.95 6.23 14.12 -4.51
High solvency* -7.91 -14.25 16.36 -0.46 30.17 21.14 8.53 -1.81
Low collateral* -9.17 -14.36 13.85 0.33 65.24 10.94 24.59 -2.10
High collateral* -5.19 -10.54 9.14 1.93 39.25 11.52 5.76 -4.53
Low debts with bank* -5.31 -10.82 7.71 0.04 34.28 9.09 11.12 -2.14
High debts with bank* -7.26 -14.78 14.00 2.14 39.51 6.73 7.95 -6.61
Low profit margin* -8.17 -14.93 9.29 -1.08 126.57 15.01 31.11 -4.49
High profit margin* -6.57 -12.45 20.46 3.70 30.49 6.83 11.96 -3.19
Table 3.5.3 Employment yearly growth rates (means 2002-2009 and 2008-2009)
Notes *For continuous variables the thresholds for the subgroups are the 30th and 70th percentile.
In figures 3.5.3 employment growth rates of foreign multinationals and domestic firms are graphed year by year. Comparing the reaction of domestic firms with the multinationals behaviour it is quite evident that the impact of the crisis in terms of employment is much stronger for domestic and foreign multinationals, while for domestic firms the change is smoother.

85
Figure 3.5.1 Unemployment rate in Italy (2002-2009) Source OECD, Key Economic Indicators Database.
Figure 3.5.2 Annual real GDP growth rates in Italy (2002-2009) Source OECD, Country Statistical Profile, 2009.
66
.57
7.5
88
.5
une
mplo
ym
ent ra
te
2002 2004 2006 2008 2010year
-6-4
-20
2
real G
DP
gro
wth
rate
2002 2004 2006 2008 2010year

86
Figure 3.5.3 Emplopyment growth rates for domestic firms, foreign firms and domestic multinationals (2002-2009, in log)
In the following, we test these descriptive results by three panel models: a Fixed Effects Panel, a Random Effects Panel, to take into account observation-specific effects, and a System-GMM model, to take into account both unobserved firm-specific effects and the endogeneity of the lagged dependent variable (log(Et)). Our estimation strategy is to consider the economic crisis in 2008-2009 and investigate both its direct effect on firm level employment and its impact on growth trajectories according to firms being foreign multinationals, domestic multinationals, exporters. Hence, for each model we reestimate two versions of equation 11 over the period 2002-2009: one which adds a dummy for the period of economic crisis (2008-2009) (Dcrisis) and another which also adds a dummy crisis interacted with the ownership variables and with the export dummy. So we estimate:
ln (Eit+1) = 0 + 1 ln (Eit+1) + ’it + own2it + own3 it +Exp it +Dcrisis+
+own2it*Dcrisis+own3it*Dcrisis+Expit*Dcrisis
[13]
where the control variables in vector ’it are taken in log. We test the suitability of within-groups and between-groups estimators by the Hausman test. For all the estimations, the Hausman test rejected the hypothesis of null covariance between the regressors and the individual effects, thus a fixed effect estimator (FEM) is the most appropriate static panel model, being unbiased, consistent and asymptotical normal. However, we also present the Random effects model results as a disadvantage of the fixed effects method of estimation is that only the time-varying variables are included, and so the precision of those variables with negligible or no variance across time, such as exporting, in our case is compromised. Finally, we estimated the dynamic panel model, the GMM-system.
-.2
-.15
-.1
-.05
0
.05
2002 2004 2006 2008 2010years
(mean) ldipendentivar1_domestic firms (mean) ldipendentivar1_foreignmult.
(mean) ldipendentivar1_domestic multinationals

87
(1) (2) (3) (4) (5) (6)
dependent variable: fllab= employment at
time t+1 FIXED EFFECT
RANDOM EFFECT
GMM-SYSTEM
ldipendenti2 0.358*** 0.358*** 0.959*** 0.959***
(0.00758) (0.00758) (0.00213) (0.00213)
L.fllab 0.920*** 0.923***
(0.0135) (0.0126)
lage -0.0916*** -0.0900*** -0.00902** -0.00950** -0.0209** -0.0201*
(0.0183) (0.0184) (0.00389) (0.00389) (0.0106) (0.0104)
lproductivity 0.0583*** 0.0584*** 0.0748*** 0.0744*** 0.0817*** 0.0792***
(0.00875) (0.00875) (0.00722) (0.00723) (0.0269) (0.0267)
Mezz . . 0.0285*** 0.0280*** . .
. . (0.00692) (0.00692) . .
lwage 0.154*** 0.154*** 0.201*** 0.201*** 0.581*** 0.586***
(0.0105) (0.0105) (0.00913) (0.00913) (0.0730) (0.0732)
Capintensity 0.00000751*** 0.00000750*** 0.0000461*** 0.0000461*** -0.0000929 -0.000103
(0.00000234) (0.00000234) (0.00000265) (0.00000265) (0.000122) (0.000125)
d_crisis -0.0250*** -0.0219*** -0.0148** -0.0166** -0.0147* -0.0164*
(0.00815) (0.00849) (0.00717) (0.00800) (0.00885) (0.00919)
Collateral 0.0339** 0.0350** 0.0257*** 0.0255*** 0.00699 0.0114
(0.0157) (0.0157) (0.00921) (0.00920) (0.0431) (0.0430)
ptpm 0.000458 0.000470* 0.000559** 0.000567** -0.000183 -0.000223
(0.000282) (0.000282) (0.000270) (0.000269) (0.000686) (0.000675)
solvency_ratio -0.000454* -0.000504* -0.000491*** -0.000500*** 0.000316 0.000343
(0.000275) (0.000276) (0.000139) (0.000139) (0.000695) (0.000687)
deb_banc_fatt 0.000303 0.000279 0.0000171 0.00000605 0.00141*** 0.00131**
(0.000194) (0.000194) (0.000123) (0.000123) (0.000515) (0.000513)
own2 -0.00398 0.00837 -0.000237 0.0126 -0.0106 -0.0101
(0.0150) (0.0156) (0.0120) (0.0128) (0.0255) (0.0232)
own3 0.00610 0.00533 0.0413*** 0.0426*** 0.00200 0.00421
(0.00900) (0.00916) (0.00820) (0.00844) (0.0116) (0.0115)
imp -0.0107*** -0.0106*** -0.000428 -0.000506 0.000557 0.000621
(0.00265) (0.00266) (0.000776) (0.000776) (0.00161) (0.00159)
exp 0.0111*** 0.0108*** 0.00194*** 0.00193*** 0.00223*** 0.00204**
(0.00278) (0.00281) (0.000406) (0.000406) (0.000846) (0.000837)

88
FDIOWN -0.235 -0.237 -0.0757** -0.0746** -0.0878 -0.0941
(0.150) (0.150) (0.0376) (0.0375) (0.0642) (0.0641)
FDIUP 0.00756 0.00750 0.000905 0.000799 0.000192 -0.000146
(0.00564) (0.00580) (0.00108) (0.00108) (0.00197) (0.00196)
FDIDOWN -0.0118** -0.0119** 0.000403 0.000426 -0.000906 -0.000818
(0.00542) (0.00542) (0.00137) (0.00137) (0.00285) (0.00280)
esportatrici_03 . . 0.00404 0.00124 . .
. . (0.00514) (0.00531) . .
FDI_SHARE_BYREGION -0.0104 -0.0116 -0.0261 -0.0372 -0.171*** -0.195***
(0.0294) (0.0300) (0.0272) (0.0277) (0.0409) (0.0465)
out_growth 0.000706 0.000704 -0.000215 -0.000279 -0.00113** -0.00120**
(0.000522) (0.000523) (0.000352) (0.000354) (0.000510) (0.000508)
entryrate -0.0110** -0.0110** 0.000145 0.0000186 0.00380 0.00316
(0.00455) (0.00455) (0.00198) (0.00198) (0.00358) (0.00363)
mes 0.000275* 0.000257 -0.000202* -0.000226* -0.000592*** -0.000635***
(0.000160) (0.000160) (0.000118) (0.000118) (0.000176) (0.000177)
herfhind -0.000760 -0.000689 0.00194*** 0.00204*** 0.00358*** 0.00369***
(0.00149) (0.00149) (0.000491) (0.000492) (0.00117) (0.00116)
gap1_2 -0.00548 -0.00500 0.0108** 0.0111** 0.0108 0.00931
(0.00501) (0.00501) (0.00514) (0.00514) (0.00661) (0.00666)
tech1_1 . . -0.000878 -0.00113
. . (0.00768) (0.00768)
dcrisisown2 -0.0743*** -0.0824*** 0.0145
(0.0251) (0.0296) (0.0330)
dcrisisown3 0.0126 -0.00267 -0.00327
(0.0232) (0.0271) (0.0205)
dcrisisexp 0.000813 0.0142** 0.00999
(0.00659) (0.00681) (0.00715)
_cons 0.554*** 0.567*** -2.642*** -2.619*** -6.200*** -6.203***
(0.157) (0.159) (0.116) (0.116) (0.728) (0.727)
N 19020 19020 19020 19020 15269 15269
Table 3.5.4 Determinants of employment growth over the crisis: FEM, REM and GMM-system estimates
Legend * p<.1; ** p<.05; *** p<.01Robust standard errors in brackets All models include time dummies.
89
Equation 13 catches the potential differences in employment growth between foreign and domestic multinationals respectively and purely domestic firms through the estimation of the
parameter and respectively, and between exporters and non exporters, through the
estimation of the parameter In the case that multinationals and exporters, independent of
the years considered, tend to grow faster we expect to be positive. The overall effect of
the economic crisis is given by the coefficient on the dummy Crisis which takes on the value 1 for the years 2008 and 2009. This coefficient is expected to be negative. If exporters and multinationals are more able to absorb negative shocks (e.g., because they are less likely to be financially constrained or because of higher risk diversification), growth in these firms should be higher for them in the crisis period with respect to their counterparts. In such a case,
we expect the coefficient on the dummies for ownership status interacted with the crisis dummy to be positive. On the other hand, a negative coefficient on these dummies may suggest that firms face more adverse conditions on the export markets than on domestic markets and that multinationals are more footloose than national firms and therefore more likely to contract employment in the crisis period. Table 3.5.4. presents the different regression results for employment annual growth rates. These are estimated both using a baseline model, and an enlarged model obtained by interacting the globalisation variables with the crisis variable. The sign and significance of the coefficients associated with most variables are quite different between the static and dynamic model. We will comment both models,. However, we deem the GMM estimates more reliable. In line with our expectations, in all models we find a negative coefficient on the crisis dummy, which indicates that employment growth slowed down during the years 2008 and 2009 (the employment growth is almost 1.5-1.6 per cent less in the GMM model). As for the foreign multinationals behaviour, in the static panel model (REM and FEM) foreign firms show an employment growth trajectory lower than domestic firms (the coefficient on own2 interacted with the dummy crisis is negative and significant across the two static panel models). Conversely, in the GMM estimates we do find evidence that over 2002-2009 foreign firms have not increased employment more than domestic firms (the coefficient on own2 is not significant). Over the crisis the growth pattern of foreign firms is also not significantly different from domestic firms. This result is in line with Varum and Rocha (2011), which find no significant difference between domestic and foreign firms in employment growth over two downturns in Portugal. Alvarez and Görg (2011) instead find that surviving foreign firms experienced lower employment reductions than domestic enterprises during a downturn in Chile. The pattern of employment for exporters and domestic multinationals is also not significantly different from their counterparts (non exporters and national firms respectively). Finally, the impact of other firm and industry level variables over the crisis are completely in line with our previous growth results. Productivity and wages coefficients are positive and significant, and younger and smaller firms grow more than older and larger ones, on the other hand, firms more indebted with banks have experienced higher employment growth. Finally, in terms of industrial level variables there is only one important and not expected exception with respect to our previous estimates: a negative sign on the sectoral growth coefficient, which is quite puzzling.

90
3.5.4 Conclusions
One of the most visible threats from the 2008 financial and real crisis was the closure of firms and the resulting employment and sales losses, which hit particularly hard the Italian economy. We looked at the impact of the recent crisis on two measures of Italian firms’ performance: exit and employment. To sum up, foreign multinational firms did not act as stabilizers in Italy, unlike in other contexts of crisis (Desai et al., 2008; Blalock et al., 2008; Tong and Wei, 2010; Kolasa et al., 2010; Alfaro and Chen, 2012). Our results are robust to estimating Probit and Cox proportional hazard models, for exit behaviour, while differ between static and dynamic panel estimates of employment growth. The analysis of firm growth reinforces the conclusions about the lack of evidence of a positive “multinationality effect” per se on firm performance. Further research is needed though to control for other relevant characteristics to better explain the heterogeneous response of multinationals enterprises and affiliates of foreign firms to the impact of a crisis. Firms behaviour is influenced by a complex network of relationships and responses of firms to changes in their domestic and international environment are not only a function of firm characteristics but also depend on complex ties and international linkages. In particular, the affiliates’ position in the MNEs’ network, the country of origin of investors and the investment motivations in a specific host economy may indeed determine different outcomes.

91
Appendix A
A.I. Data construction: the databases adopted for Italy
First dataset: covers the period 2004-2008 and regards corporate enterprises in both manufacturing and service sectors. Firm level data are taken from AIDA (ANALISI INFORMATIZZATA DELLE AZIENDE), a dataset provided by Bureau Van Dijk SpA. AIDA collects annual accounts of all the Italian firms obliged to submit the balance sheet to the Italian Chambers of Commerce.74 Since 2004, AIDA reached a wider coverage of corporate enterprises operating in both the manufacturing and services sectors. Hence, our sample is highly representative of the entire universe of corporate companies: in 2007, it covers about 87 percent of total employees declared by the Italian National Institute of Statistics in 2008. Secondly, our dataset reflects quite well the actual size distribution of firms in the Italian economy characterised, as is well known, by a large weight of small and medium-sized enterprises (around 95 percent of firms present in our database have less than fifty employees, close to the official statistics of 98.5 percent in 2006 for the entire universe - ISTAT, 2008). This is a very important aspect in the analysis of duration, as the over-sampling of large firms underestimates the real number of movements in an economy, since entry and exit are typically a small-sized firm phenomenon. AIDA collects annual accounts of Italian corporate enterprises and contains information on a wide set of economic and financial variables such as sales, costs and number of employees, value added, fixed tangible assets, start-up year, as well as legal and ownership status. In the specific case, the legal status (i.e. active, into liquidation, inactive) allows us to identify the exit of the firm. We end up with an unbalanced panel of more than 900.000 observations. Second dataset: this is based on a merge between three dataset: AIDA-CAPITALIA- MintItaly. This smaller sample has three advantages: allows to expand the time span back and forward (2002-2010), to identify the firms in the sample that were exporters over the period 2002-2010 and to include the crisis years. The Capitalia database was a survey in waves on samples of more than 4,000 firms drawn from Italian manufacturing and run by UNICREDIT. We use the IXth Capitalia survey, i.e. the wave 2001-2003 of the survey which was run in 2004 through questionnaires distributed to a sample of 4289 firms with more than 10 employees. The sample is stratified and randomly selected (it reflects sector’s geographical and dimensional distribution of Italian firms) for firms with 11 to 500 employees. It is by census for firms with more than 500 employees. In order to have a long panel we build up a “catch-up” panel, where the Capitalia dataset units of analysis are located in the present by subsequent observations drawn from another dataset, AIDA. Most of information useful for the aim of the Report come from the rich firm level database AIDA. By matching all firms in the 2001-2003 Capitalia dataset with AIDA information we have obtained a sample of 4066 firms (that is 94,8 per cent of the Capitalia sample) which were followed through 2004-2010.75 The third dataset we adopt is a firm level database of Italian companies, banks and insurance companies with variables on export and import activities. The ownership status in AIDA allows us to separate the firms in our sample into domestic multinationals (DMNEs), foreign multinationals (FMNEs) and purely domestic firms (NMNEs).
In particular, using the ownership status variable in AIDA, we define domestic multinationals (DMNEs) as non foreign-owned firms with a share of direct ownership greater/equal to 10 percent in firms located in countries other than Italy; foreign multinationals (FMNEs) are defined as Italian firms whose Global Ultimate Beneficial Owner (UBO) is foreign.76 Information related to the export activity of the firms is drawn from a merge between Capitalia and Mint-
74 AIDA data set reports the unconsolidated balance sheets of corporate firms with a value added of more than 800.000 euro. 75
Firms which did not have complete records on some of the variables fundamental for our analysis were dropped, Moreover, the dataset was carefully cleaned excluding firms with abnormal values. 76
Although AIDA database offers a flexible definition of ultimate ownership (over 25% or over 50%), in our analysis we considered a share of 25%.

92
Italy. The merge between Capitalia and Mint-Italy allowed us to identify the firms in the sample that were exporters over the entire period 2002-2010. Each variable included in the database was deflated through the price index provided by ISTAT (Italian Institute of Statistics). Omitting all observations that do not fit the definition of exit (see Appendix A.II. below for the definition of exit), as well as firm for which data needed in the empirical analysis are incomplete we end up with an unbalanced sample of 32.131 observations. Firms which did not have complete records on some of the variables fundamental for our analysis were dropped, Moreover, the dataset was carefully cleaned excluding firms with abnormal values. In cases where the value of the variable was missing although the main variables like sales, production or labour were reported we considered that non-reported value to be zero values. In the final dataset each foreign initiative is reported by sector, degree of ownership and capital invested and there are information at firm level on a wide set of economic and financial variables such as sales, costs and number of employees, value added, fixed tangible assets, start-up year, sector of activity, as well as legal and ownership status.
A.II. Methodological notes
1. Definition of firm exit
To identify the exit of firms we followed this procedure. We consider as exited firms whose legal status variable in AIDA dataset was failure, liquidation, bankruptcy. We consider when a firm enters a liquidation or bankruptcy process, whichever started earlier. We rely on the start (rather than the end) of these processes, since when a firm enters any such process, it no longer freely operates in the market. In order to identify with accuracy the timing of any legal cessation of a firm’s activity we complement these variables by checking for the balance sheet data. If a firm is out of the register, it must have already been liquidated and its record deleted from the register. So we assign firm exit in the year in which it reports the last sales or the last balance sheet if sales are missing. Also, we allow for a two-year prior exit window to incorporate the reporting delays or mismatch between calendar and fiscal years. For example, if a firm started a liquidation process in 2009 but the last reported sales are in 2007, we assume that a firm exits in 2007. Then Exitit = 1 in the year when a firm exits, 0 in all prior years and missing in the years following exit. We further control firm status by also considering AIDA information on the type of procedure a firm is undergoing.77 This information allows us to not consider as exited firms which change denomination due to a process of Merger and Acquisition or to change of location or sector. Hence we catch the “true exit”.78 By using this detailed information on exit, we avoid to a great extent the problem of “the catch-all meaning of the exit events recorded in business registries” (Bottazzi et al. 2011) i.e. the fact that these events are often associated with a simple relabelling of the economic subject, following changes of ownership, incorporations, change of sector or province.
77
Failure, Voluntary liquidation, Administrative/juridic. Liquidation, Liquidation, Extraordinary administration, Cancellation from business registry, Closing due to failure/liquidation, Insolvency, End of activity, Closure agreement. 78
This might still correspond to both negative (bankruptcy) and positive (voluntary liquidation) outcomes. However, liquidation and bankruptcy represent the most common legal status we observe. Therefore, we can say that our main focus is on the firms’ death as a consequence of firm business failure, not voluntary exit.

93
Type of procedure /year 2004 2005 2006 2007 2008 2009 2010
Failure - 2 2 12 20 29 40
Voluntary liquidation - 8 3 9 11 17 11
Administrative/juridic. liquidation 1 2 - 1 - 1 1
Liquidation 2 20 6 11 14 18 14
Extraordinary administration - - - 2 3 -
Cancellation from business registry - - - 8 11 7
Closing due to failure/liquidation - 10 - 16 4 3 7
Insolvency - - - 3 - -
End of activity - - - - 2 -
Closure agreement - - - - 26 3
Totale 3 42 11 49 70 110 83
Table A.2 Firms exit by type of procedure and year
2. Growth estimates by Heckman procedure
Following Wooldridge (1995a) who extend Heckman’s (1976) test to the unobserved effects panel data context and considering the Mundlak (1978) approach, we may write the equation of interest as:
yit1 = xit1 b1 + xi 1 + ci1 + uit1 t 1, ……. (1)
Initially, suppose that yit1 is observed only if the binary selection indicator, sit2, is unity. Let xit denote the set of all exogenous variables at time t; we assume that these are observed in every time period, and xit1 is a subset of xit. Suppose that, for each t, sit2 is determined by the probit equation
sit2 = 1 [xit b2 + xi 2+ ci2 + ait2 ]>0 t=1, …….T (2)
Thus, let it2 be the estimated Mills ratios from estimating equation (3) by pooled probit across
i and t. Then a valid test of the null hypothesis is a t statistic on it2 in the FE estimation on the unbalanced panel (2). Unfortunately, under any assumptions that actually allows for an unobserved effect in the
underlying selection equation, adding it2 to equation (2) and using FE does not produce consistent estimators
But, we can consistently estimate b1 by first estimating a probit of sit2 on xi for each t and then
saving the inverse Mills ratio, it2, for all i and t. Next, run the following pooled OLS regression using the selected sample:
yit1 on xit1; xi; it2; d2tit2; . . . ; dTt it2 for all sit =1 (3)
where d2t through dTt are time dummies.
Finally, the selectivity-bias correction terms (it2,) added to Equation (4) are nonlinear transformations of the explanatory variables included in Equations (4). Thus, from a purely mathematical viewpoint it is theoretically possible to identify the parameters of (2) without any further restrictions on the model, in particular without the necessity of excluding any exogenous variables from xi.. We decided to use the relative size in the selection (survival) equation (3) and we exclude in the equation (4) where we used the absolute size (log). The model could be improved considering and solving the problem of endogeneity of the lagget employment variables, heteroskedasticity and serial correlation (Semychina and Wooldridge, 2010, 2011).

94
A.III. Appendix tables
HECKMAN-system estimates, dependent variable: fllab: employment at time t+1
(1) (2) (3) (4) (5)
Pooled sample Gap low Gap high Low-Medium Low Tech High-Medium High Tech
ldipendenti2 0.605*** 0.772*** 0.561*** 0.741*** 0.503***
(0.0353) (0.0466) (0.0548) (0.0502) (0.0540)
lage -0.137*** -0.301** -0,0779 -0.265*** -0,0123
(0.0454) (0.152) (0.0519) (0.0951) (0.0775)
lproductivity 0.0391*** 0.0232* 0.0408** 0,00187 0.0591**
(0.0134) (0.0133) (0.0202) (0.0168) (0.0260)
Mezz -0,00947 -0.0343** 0,00687 -0,00724 -0,00281
(0.00703) (0.0136) (0.0104) (0.0101) (0.0160)
lwage 0.289*** 0.462*** 0.269*** 0.445*** 0,112
(0.0481) (0.0646) (0.0843) (0.0555) (0.0794)
capintensity -0,00000998 -0,0000107 0.000348** 0,000117 0.000276**
(0.0000659) (0.0000810) (0.000165) (0.0000982) (0.000139)
collateral 0,00729 -0.0554* 0,0146 0,0107 0,00598
(0.0251) (0.0325) (0.0397) (0.0376) (0.0406)
ptpm 0,000244 -0,000472 -0,000135 -0,000647 0,00000796
(0.000374) (0.000871) (0.000825) (0.000601) (0.00176)
solvency_ratio 0,000218 0,000838 -0,000286 0,000241 -0,000813
(0.000470) (0.000591) (0.000843) (0.000551) (0.00130)
deb_banc_fatt 0,000162 0,000151 0,000165 0,000274 0,000567
(0.000250) (0.000356) (0.000384) (0.000350) (0.000432)
own3 -0,00626 0,00724 -0,00522 0,00367 0,00149
(0.00700) (0.00815) (0.0129) (0.0115) (0.0109)
imp -0,00179 0,00807 -0,00437 0,00621 0,0235
(0.00421) (0.00839) (0.00706) (0.00967) (0.0229)
exp -0,00173 -0,00795 0,00154 -0,00457 -0,0164
(0.00371) (0.00713) (0.00618) (0.00690) (0.0191)
FDI_own_ind_t -0,205 0,137 -0,371 -0,419 -0.735*
(0.161) (0.347) (0.252) (0.340) (0.418)
FDIUP -0,00163 0,000902 -0,00132 -0,0123 0,0192
(0.00865) (0.0248) (0.0142) (0.0187) (0.0316)
FDIDOWN -0.0129** -0.0277** -0.0282*** -0.0163* 0,00262
(0.00524) (0.0138) (0.00822) (0.00972) (0.0209)
Esportatrici 0,00128 0,00115 0,00781 0,00225 0,00419
(0.00368) (0.00616) (0.00601) (0.00558) (0.00678)
FDI_share_byregion -0,0102 -0,0124 0,0404 0,0355 0,0912
(0.0404) (0.0723) (0.0480) (0.0408) (0.0695)
out_growth 0,000623 0,00122 0,000931 0,000525 0,000359
(0.000525) (0.00101) (0.000733) (0.000769) (0.00123)
Entryrate 0,00595 -0,00919 0,00829 0,000538 0.0462*
(0.00597) (0.0104) (0.0106) (0.00776) (0.0272)
mes 0,0000963 -0,0000351 -0,000289 0,0000325 0,00103
(0.000174) (0.000303) (0.000284) (0.000239) (0.000800)
herfhind -0,000408 0,00366 -0,00292 -0,00415 -0,00392
(0.00256) (0.00289) (0.00725) (0.00295) (0.00426)
gap1_2 0,00173 0 0 0,00161 0,000426
(0.00565) (0) (0) (0.00744) (0.0165)
tech1_1 -0,0061 0,000753 -0,00626 0 0
(0.00625) (0.0123) (0.00977) (0) (0)
_cons 0,291 -0,31 1.011*** 0,27 -1,347
(0.268) (0.347) (0.362) (0.369) (1.580)
N 16259 5970 6763 7556 3416
Table A.III.1 Determinants of growth HECKMAN-system estimates (dependent variable: fllab:employment at time t+1)
Robust Standard errors in parentheses. * p < 0.10, ** p < 0.05, *** p < 0.01
All models include time dummies, mean variables and estimated inverse Mills ratio interacted with time dummies.

95
4. The Turkish Case79
4.1 Data and Stylized Facts About FDI in Turkey
As a background to the empirical analysis, we will first start with a section on Turkish economy and the FDI inflows to Turkey over the last two decades. Following this brief overview, we will undertake a descriptive statistical analysis. This section concentrates on total inward and outward FDI flows since 1990s, sectoral patterns of inward and outward FDI flows, distinguishing the manufacturing from the service sector (real estate, tourism, telecommunication, banking and insurance). Among the main factors that shape the characteristics of inward FDI in Turkey we consider the mode of entry, the origin and sectoral composition of FDI, the MNEs’ strategies and objectives, the changes in the institutional and economic structure of Turkey and the government policies to attract more FDI. We conclude the section with a review of databases we will use in the analysis.
4.1.1 Stylised Facts about FDI in Turkey
Turkey followed an inward-looking, import-substituting development strategy during the 1960s and 1970s. Although this strategy worked well throughout the 1960s, it proved impossible to follow in the wake of oil price hikes in 1974 and 1979. After a severe balance of payments crisis in 1979 and a jump in the inflation rate to 64 percent, an IMF-backed stabilization program was launched in January 1980. These measures marked the adoption of an outward-oriented growth strategy. In order to accomplish the external adjustment, export-oriented growth became the key policy objective and the government used export subsidies to promote exports. Starting from 1984, export-oriented policies had later been coupled with a gradual reduction in tariffs and nontariff barriers, and finally culminated in the Customs Union (CU) with the European Union (EU) in 1996. As a result of the outward-oriented growth strategy, Turkish exports increased from $2.9 billion in 1980 to reach $13 billion and $28 billion in 1990 and 2000, respectively. Turkey adopted its first FDI legislation in 1954. Although the Law provided a quite liberal framework of general principles designed to create a favorable environment for FDI, inward foreign investment remained at low levels until the early 1980s, and the cumulative total of FDI authorized from 1950 to 1980 reached only US$229 million (Öniş, 1994), partly because of some barriers for inward FDI and weak enforcement of rules and regulations. After the elimination of local equity participation and minimum export requirements in the 1980s (Erdilek, 1986), and complete liberalization of Turkey’s capital accounts in 1989, annual inflows of FDI reached almost US$1 billion in the 1990s. The manufacturing industry alone accounted for 55 percent of cumulative authorized FDI in the 1980s and 1990s (see Taymaz and Ozler, 2009). Turkey missed the opportunity to benefit from the first two waves of the increase in international FDI flows, in the 1980s and the 1990s, respectively. In the first wave, the international FDI flows increased from $54 billion in 1980 to $207 billion in 1990 (See Figure 4.1.1). In the 1980s, the inward FDI flows to Turkey fluctuated around $100 million (See Figure 4.1.2). During the second wave, the FDI flows increased even faster to reach $1.4 trillion by 2000. Turkey missed this opportunity, too. As can be seen in Figure 4.1.2, in the 1990s the FDI inflows moved up to fluctuate within the band between $500 million and $1 billion.
79
Coauthored by Erol Taymaz and Kamil Yilmaz.

96
Figure 4.1.1 Global FDI Flows (1990-2011, trillion USD)
It was mostly developed countries that were benefitting from the increased FDI flows during the first wave of the 1980s (Figure 4.1.1). For that reason, whatever policy Turkey implemented during the period might not be sufficient to convince foreign investors to invest in a developing country. However, during the second wave, inward FDI flows in developing countries increased from $35 billion in 1990 to reach $256 billion in 2000.
Figure 4.1.2 Turkey - Inward and Outward FDI Flows (1990-2011, billion USD)
The poor performance of Turkey in attracting FDI inflows was also due to the political and economic instability that haunted the Turkish economy throughout the period. Competition among the political parties led to increasing budget deficits. As a result, the country suffered from an inflation rate that averaged around 60 percent. The GDP followed boom-bust cycles throughout the period. Consequently, the high country-risk also helped keep foreign investors at bay. Inward FDI flows to Turkey also suffered from governance and institutional problems in the areas of rule of law and competition. As of the early 2000s, Turkey lagged behind in terms of providing a level playing field for all companies (see Dutz, Us, and Yılmaz, 2005). In 2000, Turkey was ranked among the top contenders, after Iceland and Canada, based on OECD’s FDI restrictiveness index. The 2001 economic crisis was the turning point for the prospects of the Turkish economy. First, immediately after the crisis an IMF-backed stabilization program was implemented, along with key macroeconomic reforms that had been delayed for more than a decade. Second, the November 2002 general elections brought the country much
0
0,2
0,4
0,6
0,8
1
1,2
1,4
1,6
1,8
2
1980 1985 1990 1995 2000 2005 2010
10
00
bill
ion
USD
Developing Transition Developed
0
5
10
15
20
25
1990 1995 2000 2005 2010
Bill
ion
USD
inflows outflows

97
needed political stability. In addition, throughout the 2000s Turkish government had undertaken significant measures to improve the investment climate for domestic as well as foreign investors. A new Foreign Direct Investment Law was enacted in 2003. Turkey finally benefitted from the third wave of the global FDI flows that started again in 2003 and lasted until the global financial crisis of 2008. Even, then improvements in the inward FDI flows did not take place immediately. The increase in inflows after the implementation of macroeconomic and institutional reforms in 2001 and 2002 was rather limited.80 For a couple of years after the crisis, the FDI inflows stayed above $1 billion but not significantly higher. FDI inflows to the country had increased significantly only after the EU Council decision of December 2004 that approved the initiation of membership negotiations with Turkey. After this decision, both the M&A deals and real estate purchases undertaken by European citizens and corporations increased immediately. FDI inflows including real estate sales to foreigners increased to $10 billion in 2005, followed by a doubling of that amount in three consecutive years from 2006 to 2008. Even though, the inflows declined after the global financial crisis, they nevertheless recovered to reach $16 billion in 2011.
Figure 4.1.3. Italy and Turkey: Inward FDI Flows (1990-2011, billion USD)
Given that this project is about the FDI inflows to Turkey and Italy, it would be relevant to compare two countries’ FDI performance over the period. The comparison reveals some similarities over the long-term inward FDI inflows (See Figure 4.1.3). In the 1990s FDI inflows in Italy were also quite low. Given that Italy has quite high outward FDI flows in the 1980s and 1990s, having rather low inflows differentiates Italy from its counterparts. In the case of Italy, the upward trend in inward FDI flows started in 2000, and continued all the way up to $44 billion in 2007. The similarity of the two countries in terms of inward FDI flows ended in 2008, the year of global financial crisis. Inward FDI flows to Italy plunged in 2008. Actually, it turns out that foreign investors started to leave the country, bringing the total inward FDI flows to a negative $10 billion. Unlike Italy, FDI inflows to Turkey did not decrease in 2008. The decline came a year later when the FDI inflows dropped to $8.4 billion in 2009. After the plunge in 2008, FDI inflows to Italy recovered in 2009 and reached $20 billion. After a decline in 2010 to $10 billion in 2010, it went up to reach $30 billion in 2011. From 2005 through 2011 foreign direct investment in Turkey (excluding real estate purchases and loans to affiliated firms) amounted to a total of $87 billion. In comparison, FDI inflows over three years from 2002-2004 amounted to $2.5 billion only.
80
In the year of crisis, the inward FDI flows increased to $3.3 billion, but this was mostly due a one-time sale of mobile telecommunication license to a Turkish-Italian consortium.
-20
-10
0
10
20
30
40
50
1990 1995 2000 2005 2010
bill
ion
USD
Italy Turkey
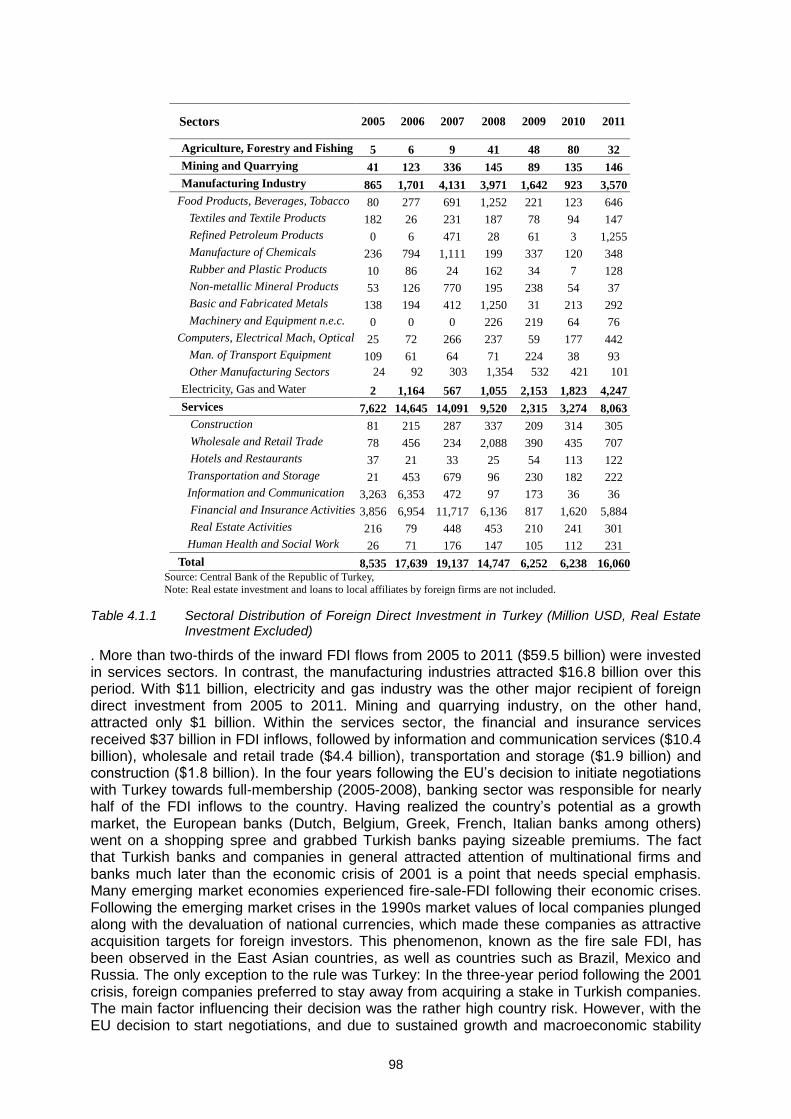
98
Table 4.1.1 Sectoral Distribution of Foreign Direct Investment in Turkey (Million USD, Real Estate Investment Excluded)
. More than two-thirds of the inward FDI flows from 2005 to 2011 ($59.5 billion) were invested in services sectors. In contrast, the manufacturing industries attracted $16.8 billion over this period. With $11 billion, electricity and gas industry was the other major recipient of foreign direct investment from 2005 to 2011. Mining and quarrying industry, on the other hand, attracted only $1 billion. Within the services sector, the financial and insurance services received $37 billion in FDI inflows, followed by information and communication services ($10.4 billion), wholesale and retail trade ($4.4 billion), transportation and storage ($1.9 billion) and construction ($1.8 billion). In the four years following the EU’s decision to initiate negotiations with Turkey towards full-membership (2005-2008), banking sector was responsible for nearly half of the FDI inflows to the country. Having realized the country’s potential as a growth market, the European banks (Dutch, Belgium, Greek, French, Italian banks among others) went on a shopping spree and grabbed Turkish banks paying sizeable premiums. The fact that Turkish banks and companies in general attracted attention of multinational firms and banks much later than the economic crisis of 2001 is a point that needs special emphasis. Many emerging market economies experienced fire-sale-FDI following their economic crises. Following the emerging market crises in the 1990s market values of local companies plunged along with the devaluation of national currencies, which made these companies as attractive acquisition targets for foreign investors. This phenomenon, known as the fire sale FDI, has been observed in the East Asian countries, as well as countries such as Brazil, Mexico and Russia. The only exception to the rule was Turkey: In the three-year period following the 2001 crisis, foreign companies preferred to stay away from acquiring a stake in Turkish companies. The main factor influencing their decision was the rather high country risk. However, with the EU decision to start negotiations, and due to sustained growth and macroeconomic stability
Sectors 2005 2006 2007 2008 2009 2010 2011
Agriculture, Forestry and Fishing 5 6 9 41 48 80 32
Mining and Quarrying 41 123 336 145 89 135 146
Manufacturing Industry 865 1,701 4,131 3,971 1,642 923 3,570
Food Products, Beverages, Tobacco 80 277 691 1,252 221 123 646
Textiles and Textile Products 182 26 231 187 78 94 147
Refined Petroleum Products 0 6 471 28 61 3 1,255
Manufacture of Chemicals 236 794 1,111 199 337 120 348
Rubber and Plastic Products 10 86 24 162 34 7 128
Non-metallic Mineral Products 53 126 770 195 238 54 37
Basic and Fabricated Metals 138 194 412 1,250 31 213 292
Machinery and Equipment n.e.c. 0 0 0 226 219 64 76
Computers, Electrical Mach, Optical 25 72 266 237 59 177 442
Man. of Transport Equipment 109 61 64 71 224 38 93
Other Manufacturing Sectors 24 92 303 1,354 532 421 101
Electricity, Gas and Water 2 1,164 567 1,055 2,153 1,823 4,247
Services 7,622 14,645 14,091 9,520 2,315 3,274 8,063
Construction 81 215 287 337 209 314 305
Wholesale and Retail Trade 78 456 234 2,088 390 435 707
Hotels and Restaurants 37 21 33 25 54 113 122
Transportation and Storage 21 453 679 96 230 182 222
Information and Communication 3,263 6,353 472 97 173 36 36
Financial and Insurance Activities 3,856 6,954 11,717 6,136 817 1,620 5,884
Real Estate Activities 216 79 448 453 210 241 301
Human Health and Social Work 26 71 176 147 105 112 231
Total 8,535 17,639 19,137 14,747 6,252 6,238 16,060 Source: Central Bank of the Republic of Turkey,
Note: Real estate investment and loans to local affiliates by foreign firms are not included.

99
Turkey’s country risk declined substantially by early 2005. As a result, Turkish companies, especially in the financial sector, had become more attractive acquisition targets in 2005. While FDI inflows amounted to less than 1% of the GDP before, it reached record levels of 9.6 billion USD in 2005, in part due to privatizations. It is interesting to note that automotive industry that has grown considerably over the last decade and became the leading export sector attracted very little inward FDI flows. From 2005 to 2011, it attracted only $660 million in FDI, 0.7% of total inward FDI flows over the period. An important characteristic of the Turkish economy has been its inability to develop indigenous technology. As of 2011, high-tech industries accounted less than 2 of exports of Turkey. As a result, it is important for Turkey to attract investment in high technology sectors. Inward FDI flows in the high-tech computers, electronic-electrical and optical equipment industry, Turkey attracted $1.28 billion in FDI since 2002, a mere 1.45% of the total inward FDI flow over the period.
Figure 4.1.4 Share of foreign firms in Turkish manufacturing (%)
The share of foreign firms81 in the total number of firms in manufacturing increased continuously from about 1.5 % in 1984 up to 4 % in the late 1990s (Figure 4.1.3). Their employment share of foreign firms was 9 % in 1984, with about 55,000 employees. The share of foreign firms in employment increased especially after 1988 to reach 13 % in 2001, with about 128,000 employees. The share of foreign firms in the value-added of the manufacturing industry increased faster than the employment share. Starting around 20% in 1984, the foreign firms increased their share in manufacturing value-added to 32% by 2001. The value-added share of foreign firms has always been higher than their employment share, because foreign firms tend to use more capital-intensive technologies. As we will discuss later, Turkey experienced a discontinuity in 2002 in the collection of firm-level data. As part of the government’s efforts to harmonize its statistical data collection methodologies with the EU, there was a major revision in the surveys of manufacturing. As a result the coverage of firms in the manufacturing industry increased substantially. As most foreign firms were large firms, the increase in the number of foreign firms was not as significant. As a result, in 2003 there was a drop in the value-added, employment and number of firms share of foreign firms (see Figure 4.1.4). In the 2000s, the number of foreign firms stabilized around 3%, whereas the employment and value-added shares increased by 3 and 5 percentage points, respectively. Close to 90 percent of the cumulative inward FDI flows (2002-2011) to Turkey originated from developed countries. Europe alone accounts for $70 billion out of $91 billion worth of FDI inflows Turkey attracted during the period. With $15.6 billion investment, companies from Netherlands invested the most in Turkey from 2002 to 2011, followed by the U.S. ($8.1 bn.), Belgium ($7.3 bn.), Austria ($7.1 bn.), Greece ($6.6 bn.), France ($6 bn.), Luxembourg ($5.4
81
Following the usual convention, “foreign firms” are defined as those joint ventures where foreign ownership is 10 percent or more. Joint ventures with more than 50 percent foreign ownership are “majority-owned foreign firms”.

100
<$50 $50 - $200 $200 – $500 > $500 Total
All Sectors
2004 1,468 462 102 97 2,129
2005 1,838 720 162 125 2,845
2006 1,976 863 241 208 3,288
2007 2,049 994 269 317 3,629
2008 1,704 953 349 331 3,337
2009 1,516 961 223 236 2,936
2010 1,506 1,164 289 350 3,309
2011 1,864 1,719 366 408 4,357
Manufacturing Industry
2004 211 90 31 37 369
2005 258 132 37 29 456
2006 253 128 32 56 469
2007 265 155 40 32 492
2008 202 135 68 66 471
2009 171 135 39 43 388
2010 153 151 50 73 427
2011 155 173 54 80 462
Source: Undersecretariat of Treasury
bn.), Germany ($5 bn.), and the United Kingdom ($4.6 bn.). During this period, the cumulative FDI inflow to Turkey from Italy was $1.9 billion. Among the top ranking investors outside of the Europe and the U.S. are the United Arab Emirates, Russia and Azerbaijan. The rapid increase in the number of foreign owned new establishments was certainly a reflection of the increased attractiveness of Turkey as a destination for FDI flows. The number of foreign-owned establishments was 4192 as of the end of 1999. In 2000 through 2002, the number of new foreign-owned establishments was less than 500. This number increased rapidly in the period 2003-2007, reaching 3,629 in 2005 (Table 4.1.3). During the crisis period the number of new foreign-owned establishments declined to 2,936 in 2009, and recovered afterwards to reach 4,357 in 2011. The statistics on the number of newly established foreign-owned establishments depict such an optimistic panorama that it is used by politicians to substantiate the increase how much foreign interest in Turkey has increased during recent years. However, it is not correct to use this data without complementing it with figures demonstrating the size of the foreign-owned companies. According to Table 4.1.2, in 2004 and 2005 approximately 95% of the new foreign-owned establishments had less than $500,000 equity capital each and, therefore, were small establishments. The number of new foreign-owned establishments with over $500,000 in equity capital was 97 in 2004, this figure has increased to 208 in 2006 and to 408 in 2011. This data, which demonstrates company sizes, matches with the UNCTAD data we have presented above: Even though, the increase in FDI inflows was mostly due to several big ticket M&A deals in the banking sector, over time Turkey has experienced robust increase in the number of greenfield projects and the number of large newly-established foreign-owned companies.
Table 4.1.2 Breakdown of Newly Established Companies with Foreign Capital (Grouped According
to Equity Capital, 1000 USD)
In 2004, Turkey was not considered as a center of attraction for FDI in indices issued by A.T. Kearney and UNCTAD. In other words, it could not make to the top 25 list based on the score it received in the calculation of these indices. Since then Turkey traveled a long road. In 2007 Turkey was ranked 20th based on the A.T. Kearney’s FDI Confidence index. Even though, it fell slightly behind to the 23rd slot in 2010, it is ranked 13th in 2012. With this ranking Turkey proves to be a destination for foreign direct investment better than countries like Japan, France, South Korea, Canada, Switzerland and Spain.

101
Figure 4.1.5 Inward FDI Regulatory Restrictiveness and Inward FDI Stock
As of 2012, inward FDI stock of Turkey reached to a level, which is just 18 percent of its GDP. This is a level much higher than what it used to be. Yet, it is still quite low. Every year, OECD prepares a graph where it plots the FDI stock/GDP ratio with the regulatory restrictiveness of the economic environment, which is reproduced in Figure 4.1.5. There is a negative association between the two: Countries that have more restrictive regulatory environment tend to attract lower amounts of FDI inflows and end up having lower stocks of inward FDI relative to GDP. Turkey is one of the outliers to this relationship: Even though it has a low regulatory restrictiveness index (0.07), its inward FDI stock/GDP ratio is just 0.18, much lower than 0.41, the ratio that is implied by the estimated relationship.
Table 4.1.3 Sectoral Distribution of Outward FDI Flows from Turkey (Million USD)
Sectors 2005 2006 2007 2008 2009 2010 2011
Agriculture, Forestry and Fishing 1 0 2 8 3 53 19
Mining and Quarrying 506 456 343 264 254 233 298
Manufacturing Industry 419 810 230 1,382 281 444 517
Food Products, Beverages, Tobacco 13 216 35 811 54 66 58
Textiles and Textile Products 169 485 45 54 46 58 32
Chemicals, Chemical Prod.,Pharma. 12 4 4 156 7 31 40
Other Non-Metallic Mineral Prod. 106 11 22 42 11 37 35
Basic Metals, Fabricated Metal Prod. 1 14 13 29 12 74 42
Machinery and Equipment n.e.c. 0 0 20 110 100 99 215
Computers, Electrical Mach, Optical 39 53 58 158 4 9 14
Electricity, Gas and Water 0 0 0 2 17 21 246
Services 139 411 1,700 948 1,485 1,072 1,575
Construction 11 54 75 94 122 158 149
Wholesale and Retail Trade 8 42 21 20 22 35 20
Transportation and Storage 19 9 100 211 63 63 585
Information and Communication 28 78 125 362 245 110 17
Financial and Insurance Activities 52 202 1,352 175 694 549 588
Financial Services 1 190 165 101 485 457 338
Activities of Holding Companies 46 4 1,149 46 148 91 221
Real Estate Activities 1 1 12 13 267 66 114
Human Health and Social Work 0 0 7 11 34 34 38
Total 1,065 1,677 2,275 2,604 2,040 1,823 2,659
Source: Central Bank of the Republic of Turkey,

102
Outward FDI is a recent phenomenon for Turkey. As early as 1994, total outward FDI flows from Turkey amounted to less than $100 million. However, in the aftermath of the 2001 crisis and the macroeconomic structural reforms implemented Turkish investors increased their economic relations with outside world. First, the exports recorded a rapid increase from 2002 onwards. Then came the investments by Turkish businesses in their target markets such as the EU members, Eastern European countries, Russia, Caucasus, Central Asia and the Middle East. From $250 million in 2002, the outward FDI increased to one billion dollars in 2005, and $2.66 billion in 2011. Following the global financial crisis of 2008 and the sovereign debt and banking problems in the EU, Turkey entered a new phase of diversifying its export markets to Asia, Africa and beyond. In this new phase, the outward FDI flows are likely to follow the increase in exports, as the Turkish businesses will try to solidify their presence in these markets. The industrial and service sectors almost equally shared the Turkish outward FDI stock of $15.7 billion, accumulated from 2002 through 2011. Among the service sectors, financial and insurance activities, including the investments undertaking by holding companies, accounted $3.9 billion of the outward Turkish FDI stock. Almost half of this amount ($1.9 bn.) was invested by the Turkish holding companies in foreign countries. The banking sector, on the other hand, invested $1.77 bn. in foreign companies over the period from 2002 to 2011. Information and communications services, and transportation and storage services, each accounted for $1.1 billion of the outward FDI undertaken during the 2002-2011 period. They are followed by the construction sector ($700 million) and the real estate activities ($474 million). Out of the $7.7 billion attracted by industrial sectors, $4.3 bn. is accounted by the manufacturing industry, $3.1 billion by mining and quarrying, and $300 million by electricity, gas and water. Among the manufacturing sectors, food products, beverages and tobacco ($1.29 bn.), textiles and textile products ($915 million), machinery and equipment ($544 million) and computers, electronic-electrical and optical equipments ($458 million) were the sectors that invested abroad the most over the 2002-2011 period. In their search for investment opportunities in alternative destinations Turkish investors have mostly chosen the European countries. Close to two-thirds of outward FDI flows from Turkey ($10.1 billion) went to Europe. Netherlands and Germany attracted $3 and $1.1 billion of these funds, respectively. With $1.07 billion Turkish investment in 2007 only, Malta was the third among the European countries in attracting Turkish investments. Eastern European countries including Russia altogether attracted $1.16 billion worth of investments from Turkey. Outside of Europe, the most important destination for outward Turkish FDI flows was Asia. Out of $4.1 billion that went to the Asian countries from 2002-2011, $2.95 billion was received by Azerbaijan. Azerbaijan is the second among the outward oriented Turkish FDI flows. Actually, given that the bulk of the investment that went to Netherlands was in the financial sector, the bulk of the Turkish investments in Azerbaijan took place in the manufacturing industry. The United States was the country that was ranked after Germany. Turkish FDI in the U.S. was approximately $1 billion. Ireland attracted $742 million worth Turkish FDI over the period, followed by Luxembourg ($675 million) and Switzerland ($609 million). Perhaps the most surprising figure in the outward FDI flows table, is the one for China. Outward Turkish FDI in China over the last decade was negligible. From 2002 through 2011, officially recorded Turkish investment in China added up to $50 million only.
4.1.2 TURKSTAT’s Industrial Analysis Database: 1983-2001
Data for Turkey will be obtained from the Turkish Statistical Institute Databases. As TURKSTAT does not permit the database to be removed from its premises the empirical analysis will be conducted in Ankara at the premises of the TURKSTAT. In this study, for the period from 1983 to 2001 we will use the TURKSTAT’s Industrial Analysis Database. From 1980 to 2001 TURKSTAT periodically (every 5 years) conducted Census of Industry and Business Establishments (CIBE) for all establishments and Annual Surveys of Manufacturing Industries (ASMI) for establishments with 10 or more employees. The set of addresses used during ASMI is obtained through CIBE. In addition, every non-census year, addresses of newly opened private establishments with 10 or more employees are obtained

103
from the chamber of industry. For this study, we will use a sample that matches plants from CIBE and ASMI for the 1990–2001 period. The data set for 1982-2001 is assembled at the plant level and does not take into account the organic link between different plants that are under the ownership of the same firm. There are multi-plant firms in the Turkish industry. However, the number of these firms is rather limited. Therefore, considering only the data at the plant level does not cause any bias for our estimations. The data is well suited for our purposes because it contains information on variables that are commonly used in estimation of plant level production functions as well as on a diverse set of plant characteristics that can be used in the estimation of the hazard function for the survival of the firm. CIBE does not include plant with less than 10 employees. Even though, not all the key variables needed for this study have been collected for establishments in the 10-24-size group. Thus our sample for the 1983-2001 period consists of plants with 10 or more employees.
4.1.3 TURKSTAT’s Annual Industry and Service Statistics Database: 2002-2009
TURKSTAT revised its industrial survey approach in 2001. Starting in 2002, TURKSTAT started to collect data for establishments in the service sectors along with the ones in the industry. As the aim was to reach to a wider sample of establishments, TURKSTAT simplified the survey questionnaires. As a result, the data series in the database are no longer comparable to the series in the database in 2001 and before. For that reason, we worked with both datasets, but the analyses had to be conducted separately.
4.2 Previous studies on productivity and FDI in Turkish Manufacturing Industry
There is a voluminous literature on Turkish manufacturing industry. This literature makes use of both plant level and industry level data to study many diverse topics such as the productivity, employment, export performance, foreign direct investment, etc. We will provide a brief overview of the literature in order to prepare the background for our own empirical analysis. Among the papers that use sectoral data to obtain measures of total factor productivity, Saygılı, Cihan and Yurtoğlu (2001) use the growth accounting framework to calculate total factor productivity for the Turkish economy over the 1972-1997 period. They, then, analyze the TFP level and growth for Turkey in comparison with other OECD member countries. Their results reveal that unlike many other OECD member countries, Turkey was not able to achieve convergence in terms of the TFP level over the period from 1970 to 1993. While the TFP growth was the major source of growth in many OECD member countries, the Turkish growth over the period mostly (70%) relied on capital accumulation. They conclude that Turkey was not successful in channeling the scarce resources to sectors that create higher value added, utilize knowledge- and technology-intensive production techniques, and invest heavily on R&D activities. Instead, investments had been channeled to those sectors that utilize lower levels of technology. Altuğ and Filiztekin (2006), also use growth accounting approach to study the contribution of different factors to growth in 20 subsectors of the manufacturing industry over the period from 1970 to 2000. Their results are similar in spirit to those of Saygılı, Cihan and Yurtoğlu (2001): The growth of value added had mostly been a result of the increases in factors of production and the capital deepening. According to their results, during the period the contribution of the total factor productivity growth was negative (-29%). There have been an increasing number of research papers that use panel dataset at the firm level to measure and analyze the dynamics of productivity and technological change in the Turkish manufacturing industry. Among these we can count Taymaz and Saatçi (1997), Gökçekuş (1997), Yaşar, Rejesus and Mintemur (2004), Taymaz (2005), Özler and Yılmaz (2009), Taymaz and Yılmaz (2007), Taymaz, Voyvoda and Yılmaz (2008, 2009, and 2010).

104
Taymaz and Saatci (1997) used the stochastic production frontier estimation method to analyze the direction and size of the technical change in the textiles, cement and motor vehicles industries over the period from 1987 to 1992. Their results show that there were significant differences among the sectors analyzed in terms of the factors determining the direction and the size of technical change. The presence of direct links among the firms emerges as an important factor affecting the technical efficiency positively. At the firm level, however, the source of technology and the legal status of the firm appear to be the factors affecting technical efficiency at the firm level. The type of ownership and the source of technology are important determinants of plant-level efficiency. Saygılı and Taymaz (2001) examine the effect of ownership and privatization on technical efficiency in the cement industry. The results suggest that neither ownership nor privatization had a significant impact on technical efficiency. Yaşar, Rejessus and Mintemur (2004) decompose and analyze total factor productivity growth at the aggregate industry-level for the textile, apparel and motor vehicles and parts industries. They seek to find evidence of the Schumpeterian creative destruction process. The estimations show that productivity improvements in existing firms are the main source of productivity growth in these industries. In contrast, exiting firms do not seem to be less productive than entering firms. Using quantile regressions techniques, Yaşar, Rejesus and Nelson (2003) study the productivity effects of the exporting status. The empirical results indicate that the productivity effect of exporting increases as one move from the lower tail to the upper tail of the conditional output distribution. Exporting firms that continuously exported throughout the time-period have more pronounced productivity effects compared to firms in other categories (i.e. new exporting firms, exporting firms that exit, and exporting firms that switch exporting practices). More recently, Yaşar and Rejesus (2007) try to determine the existence of self-selection and/or learning-by-exporting in using propensity score matching techniques and difference-in-difference estimators. They find the existence of a learning-by-exporting effect that explains the positive correlation between exporting status and firm performance. Özler and Yılmaz (2009) show that during the 1983-2001 period there were substantial differences in the TFP growth performance of the Turkish manufacturing industry over the sub-periods. TFP growth rate accelerated after the trade liberalization in 1984 and as a result of public sector wage hikes in 1988-1993 period. In the aftermath of the 1994 crisis, however, the productivity growth stalled, despite the fact the Customs Union decision between Turkey and the EU went into effect in 1996. Taymaz, Voyvoda and Yılmaz (2010) showed that productivity growth performance varied substantially over groups of manufacturing firms based on ownership and size. Taymaz, Voyvoda and Yılmaz (2009) specifically focus on the relation between the rapid increase in real wages and the productivity growth over the 1988-1993 period. Their analysis showed that the increase in real wages led firms to improve on total factor productivity over the period. In particular, they showed that the causality runs from real wage hikes to productivity increases rather than the other way around. Finally, Taymaz, Voyvoda and Yılmaz (2010) examine direct and indirect contributions of foreign firms and small and medium-sized enterprises (SMEs) to aggregate productivity growth. Using the data for Turkish manufacturing plants, they estimate production functions for all ISIC 4-digit level industries for the 1983-2001 period. Decomposing the productivity growth into structural change, entry and exit, technical change, efficiency change, and scale effects, the authors identify the factors that contribute to the productivity growth of foreign firms and small firms. There have been few papers on the performance of foreign-affiliated firms in Turkey relative to their counterparts. Taymaz and Özler (2009) show that foreign firms were more productive compared to their Turkish counterparts. However, their productivity advantage disappears once the size is controlled for. Large domestic firms are also as productive as foreign firms. Taymaz and Yılmaz (2009) analyze the horizontal and vertical productivity spillovers from foreign firms to their domestic counterparts. Using data on intermediate inputs and products for each plant they identify the horizontal and vertical linkages between domestic and foreign firms. Their results clearly show that there are backward spillovers from foreign to domestic firms. In other words, domestic firms that sell products to foreign firms are able to increase their productivity. Recently, Köymen and Sayek(2010) study the role of human capital in productivity spillovers from foreign firms to domestic firms. Their econometric tests point to the presence of dynamic

105
effects. The spillover effects may take place with a lag. Horizontal linkages matter positively only for local firms with more human capital/skilled labor while it acts as a limiting absorptive capacity when it comes to the realization of vertical linkages.
4.3 Foreign ownership and firm survival
4.3.1 Empirical strategy
In this section, we will analyze the difference in survival probabilities between domestic and foreign firms, and the effects of foreign presence on domestic firms' survival probabilities. We will first look at descriptive statistics on survival to visualize the survival process. We will then estimate models of survival to test which variables have significant impact on survival. Figure 4.3.1 summarizes survival rates of domestic and foreign firms in Turkey in the period 1984-2001. The survivals rates are calculated also for the 2003-2009 period, but the results are qualitatively the same.82
Figure 4.3.1 Survival rates by ownership and size (1983-2001 data)
The survival rates (the proportion of firms that survived until a certain age) indicate that there is a substantial difference between domestic and foreign firms. For example, 5-year survival rate is only 61 % for domestic firms, i.e., about 40 % of domestic firms exit from the market before they reach age 5. Foreign firms are more likely to survive, and their 5-year survival rate is much higher (78 %). As discussed in the preceding section, the entrance characteristics of new domestic and foreign firms are different. For example, foreign firms start larger presumably because of their access to financial sources, and experience in other countries. Moreover, foreign firms seem to adopt more capital-intensive technologies, employ more skilled labor and pay higher wages. If these characteristics matter for survival, one would expect differences in survival rates. The survival rates of large domestic firms are also depicted in the same figure.83 Interestingly, there is not much difference in survival rates of foreign firms and domestic large scale
82 Since the 2003-2009 dataset is shorter, we prefer to depict the survival rates for the longer (1984-2001) period. The 5-year survival rates in these two time periods are almost the same for foreign and large domestic firms. For small domestic firms, 5-year survival rate is about 61% in the 1984-2001 dataset, and 43% in the 2003-2009 dataset. The difference in the survival rates is likely to be caused by difference in survey methodologies. 83 “Large” refers here to firms employing 150 or more peoples.

106
enterprises (LSEs). This finding shows that firm size is certainly a significant determinant of survival, and a part of the difference between domestic and foreign firms could be explained by their size differential. Therefore, in order to determine the effects of ownership on survival, we need to control for the effects of all other factors. There are various methods that can be used to test the effects of economic variables on the survival probabilities of firms. The Cox proportional hazards model is used frequently in empirical studies. It defines the probability of exit in a certain time period as a function of a set of time-varying covariates, conditional on surviving until that time period. A functional is assumed for the hazard function in the empirical implementation of the model. A proportional hazard function is defined by
hij(t) = hj(t)exp(Xijtβ) (14)
where where hj(t) is the industry-specific baseline hazard function, X is a vector of explanatory variables, and β is a corresponding vector of coefficients. The β parameters are estimated by the maximization of the partial likelihood function that does not require the specification of hj(t). Subscripts i, j, and t denote “firm”, “industry”, and “time”, respectively. Note that the Cox proportional hazards model estimates the probability of hazard, i.e., exit. Time is measured after entry, i.e., it is equal to the age of the firm. Therefore, we can add time dummies into the model to control for the effects and common time-specific effects (for example, macroeconomic conditions). The change in the hazard rate by age is incorporated into the underlying, non-parametric hazard function, hj(t). Since exit is a discrete event (exit or not, or its opposite, continue or not), binary choice models such as logit and probit models are also frequently used. These models are defined by
Pr(yit = 1|Xit) = G(Xitβ) (15)
where Pr(yit = 1|Xit) if the probability function for yit = 1 conditional on Xit, X is a vector of explanatory variables, and β the corresponding vector of coefficients. G(.) is a function taking on values strictly between zero and one, i.e., 0 < G(z) < 1, for all real numbers z. In the case of logit model, a logistic cumulative density function is used for G(.), whereas the probit model uses standard normal cumulative density function. In this study, we estimated Cox proportional hazard, logit and probit models. Since the estimation results of all models are qualitatively same, we present the results for only the Cox proportional hazard model. The dependent variable in the Cox proportional hazard model is the event of a firm's exit at a particular age t, conditional on the fact that the establishment survived until that age. The exit of those firms that survived until the end of the dataset (2001 for 1984-2001 dataset and 2009 for 2003-2009 dataset) is not observed, i.e., the distribution of the dependent variable is censored at that year. In the estimation of the Cox proportional hazards function, we included a dummy variable that denotes if the firm is foreign-owned or domestic. This variable is used to check if the hazard probability of foreign firms is different from that of domestic firms. However, since domestic and foreign firms could react to external conditions differently, we run also separate regressions for domestic and foreign plants, and compare the differences between the determinants of survival. Domestic firms dominate the sample of firms in the datasets (more than 95 % of firms are domestic), and estimation results for the whole sample (including the foreign firm dummy) are almost identical to the results obtained for the subset of domestic firms. Therefore, we present the results for the whole sample, because the coefficient of the foreign firm dummy can be used directly to test survival differences between domestic and foreign firms. There are three sets of explanatory variables. The first set includes sector-specific variables that measure various aspects of spillovers from foreign firms. There are two variables for horizontal spillovers: fdiqs and fdiqr are output shares of foreign firms in the sector (defined at the 4-digit level)84, and region85, respectively. If there are horizontal sectoral spillovers emanating from foreign firms, those firms operating in sectors in which foreign firms produce a large part of output are more likely to benefit from these
84For sectoral classification, ISIC Rev 2 is used for the 1984-2001 dataset, and NACE Rev. 1 for the 2003-2009 dataset. 85“Region” is defined at the province level for the 1984-2001 dataset and at the NUTS 2-level regions for the 2003-2009 dataset.

107
spillovers. If spillovers have a regional dimension and are not sector-specific, or if foreign firms help to attract resources to the region (agglomeration effects), than the regional spillovers variable (fdiqr) would have a positive impact on domestic (and other foreign firms). These two variables could also capture competitive pressures foreign firms exert on others. If foreign firms intensify competition in the sector (because of their higher quality products, more productive technologies, etc.), or in the region (for example, by increasing the demand for scarce resources such as skilled labor), domestic firms would find it more difficult to survive. If the competition effects dominate spillover effects, the coefficients of these variables will be positive in the Cox proportional hazards model. Note that these two variables (sectoral and regional shares of foreign firms) could capture only static effects, if any. However, one may conjecture that the level of foreign presence may not be so important, but the change in foreign share could have dynamic impact on domestic firms. In order to test if the dynamic effects are significant, we included two additional variables, the change in the sectoral and regional shares of foreign firms (cdiqs and cfdiqr, respectively) in percentage points. Spillovers from foreign firms are likely to move towards vertically related domestic firms. Therefore, we define two variables for vertical spillovers that measure the share of foreign firms in user sectors (fdisupp_q), and the share of foreign-firms in supplier industries (fdibuy_q). Since there is no data on inter-firm linkages, we used input-output tables to calculate shares of foreign firms in supplier and buyer industries. These variables are defined by
fdisupp_qjt = ΣkЄKsktωkj (16)
where fdisupp_qjt is the share of foreign firms among the suppliers to sector j at time t (t here denotes calendar time), skt the share of foreign firms in sector k's output at time t, ωkj the share of sector k in sector j's inputs, and K the set of supplier sectors, and
fdibuy_qit = ΣlЄLbltωli. (17)
where fdibuy_qit is the share of foreign firms among the purchasers from sector i's at time t, blt the share of foreign firms in sector l at time t, ωli the share of sector l in sector i's output, and L the set of user sectors. The ω values are calculated from Input-Output tables (1990 table for the 1984-2001 dataset and the latest available one, the 2002 table, for the 2003-2009 dataset), and s and b values are calculated from aggregated firm-level data (annual surveys). A number of firm-level and sector-level control variables are included into Cox proportional hazards models. It is a stylized fact that large firms are more likely to survive. We included relative size, relsize, to control for if size matters in Turkey, too. The relsize variable is defined as the log ratio between the number of employees in the firm and the geometric average number of employees per firm in the sector:
relsizeijt = log(Eit/Sjt) = log(Eijt) - log(Sjt) (18)
where Eijt is the number of employees in firm i operating in sector j at time t, log(Sjt) = ΣjЄJlog(Eijt)/Njt, and Njt the number of firms in sector j at time t. We use the size variable relative to the sector average because there are substantial differences between average firm sizes across sectors. However, we experimented with the absolute firms size, and the results were similar. The quality of labor could also be a factor that affects the survival prospects of a firm. Since we do not have a variable consistently available for two datasets to measure the skill level at the firm level, we use the logarithm of average wage rate in the firm (lw) as a proxy variable, because firms employing more skilled workers are expected to pay higher wage. If the skill level in the firm improves the survival probability of the firm, the coefficient of the lw variable in the Cox model is expected to be negative. Firms' main objective is to earn profit, and long-term profitability could be a decision factor in exit decision. We use profit margin (the share of gross profits in output), pmargin, as a proxy for long-term profitability. There are two variables that are used to capture the effects of inter-firm linkages: subinput and suboutput. The subinput variable is measured as the share of inputs subcontracted to other firms, and the suboutput is the share of output produced as a subcontractor. If a firm gets all of its output from other firms on subcontracting relations, then the value of subinput will be equal to 1. The value of subinput will be higher for firms that behave as main contractor. The suboutput variable is an indicator for subcontractors, and the value of that variable will be

108
equal to one for a pure subcontractor that produces all of its output according to a contract signed with the main contractor. If the subcontracting relationship transfers the risks and costs into subcontractors, and if a firm can increase its survival prospects by subcontracting some of its processes to subcontractors, than the coefficient of the subinput variable is expected to be negative, and the coefficient of the suboutput variable positive. The exit probability of a firm is likely to be lower where durable specific (sunk) capital costs are more important. Capital intensity (kl) is used to capture the effects of specific capital costs, and it is defined as the (log) capital/labor ratio where “capital” is measured by annual depreciation allowances (deflated by the private sector investment deflator). Thus, we expect a negative coefficient for the kl variable in the survival model. In order to measure the level of technological sophistication of the firm, two dummy variables are used: ttrans and rrdum. The ttrans variables takes the value one if the firm transferred technology from abroad in terms of know-how agreement, licensing, etc., and zero otherwise. The rddum variable denotes if the firm performed any Research and Development (R&D) activity in that year. If higher technology improves survival probabilities, these two variables would have negative coefficients. There are a number of sector-specific control variables included in the model. The exit rate is expected to be higher when a sector experiences a large number of entries because of two factors. First, entry intensifies competition in the market, and forces some firms to exit. Second, it is observed that many entrepreneurs are likely to overestimate their performance, and could not sustain competitive pressures for a long time period (the so-called “revolving door” hypothesis). We defined entry rate as the share of entrants in total employment, and use its lagged value in the model (lentrate). Firms are likely to stay in the market if the market performs well. We use two measures of market performances, the growth rate of sectoral output (sectgr), and the rate of sectoral price inflation (sectgrpr). The growth rate of sectoral output is an indicator for current market opportunities, whereas the growth rate of sectoral price index could reflect that supply could not satisfy existing demand, i.e., there are unrealized opportunities in the market. Therefore, these two variables are expected to have a negative impact on exit. Finally, there are two variables that are related to the structure of the market. The first one is the so-called Herfindahl-Hirschman index (hhi) of concentration that is defined as the sum of the squares of the market shares of all firms in the market. The value of the index is equal to one if there is monopoly in the market, and will approach zero if the market is perfectly competitive (if there are a large number of small firms in the market). If the higher levels of concentration in the market make survival more difficult (the competitive pressure argument), we may expect a negative effect of the level of concentration on survival. However, if the oligopolistic firms raise the product price above the competitive level, new firms could find more opportunities to survive in highly concentrated markets. Therefore, the effect of concentration on survival could be ambiguous. The second market structure variable is minimum efficient scale that is defined here as the sectoral median (log) level of firm size in terms of employment (mes). The mes variable will have a negative coefficient if new firms can find niches for themselves in markets where large firms operate (high mes), but find it difficult to compete in markets dominated by similar, small firms (low mes).
4.3.2 Econometric results
Cox proportional hazards model estimates are presented in Tables 4.4.1-4.4.2. All models are stratified by 2-digit industries so that each industry at the 2-digit level is permitted to have a different age-dependent baseline hazard function, which is then estimated nonparametrically. All models also include annual dummy variables to take into account the effects of the business cycles and other macroeconomic shocks on survival. The models are estimated for only new firms established in the period under investigation, because our focus is on immediate post-entry performance86.
86 Since we do not have the data on the year of establishment of the firm in the 1984-2001 dataset, it is not possible to estimate the survival model for all firms.

109
Variables Models
1 2 3 4 5 6 7
fdi -0.778*** -0.778*** -0.720*** 0.241** 0.241** 0.285*** 0.270**
[0.098] [0.098] [0.099] [0.102] [0.102] [0.102] [0.118]
fdiqs 0.250** 0.208* 0,128 -0,107 -0,126 -0,112 0,001
[0.112] [0.115] [0.119] [0.126] [0.128] [0.128] [0.149]
fdiqr 0,119 0.153* 0,110 0.302*** 0.334*** 0.282*** 0,165
[0.081] [0.091] [0.091] [0.084] [0.095] [0.096] [0.110]
fdisupp_q 0,135 0,177 -0,107 0,146 0,161 0,108 0,373
[0.473] [0.474] [0.474] [0.507] [0.508] [0.509] [0.601]
fdibuy_q -1.036*** -1.006*** 0,030 0,311 0,321 0,273 -0,459
[0.371] [0.371] [0.383] [0.405] [0.405] [0.404] [0.478]
cfdiqs
0,371 0.430*
0,192 0,154 0,272
[0.258] [0.249]
[0.279] [0.280] [0.316]
cfdiqr
-0,189 -0,157
-0,144 -0,116 -0.461**
[0.189] [0.189]
[0.185] [0.187] [0.222]
lentrate
-0,033 0.808*** 0.808*** 0.709*** 0.754***
[0.215] [0.215] [0.216] [0.220] [0.281]
sectgr
-0.208*** -0,100 -0,105 -0,101 -0.193*
[0.074] [0.079] [0.079] [0.079] [0.099]
sectgrpr
-0.289** -0.276** -0.277** -0.283** -0,242
[0.118] [0.125] [0.125] [0.126] [0.158]
hhi
0.670*** 0.514** 0.520** 0.497** 0,149
[0.184] [0.202] [0.202] [0.203] [0.259]
mes
-0.307*** -0.516*** -0.517*** -0.467*** -0.386***
[0.035] [0.039] [0.039] [0.039] [0.052]
relsize
-0.678*** -0.678*** -0.657*** -0.661***
[0.019] [0.019] [0.019] [0.023]
lw
-0.281*** -0.281*** -0.252*** -0.274***
[0.022] [0.022] [0.022] [0.032]
pmargin
-0,041 -0,042 0,016 -0,050
[0.066] [0.066] [0.066] [0.078]
subinput
0,095 0,094 0,096 0,036
[0.102] [0.102] [0.101] [0.110]
suboutput
0.283*** 0.283*** 0.246*** 0.236***
[0.046] [0.046] [0.046] [0.049]
kl
-0.079*** -0.092***
[0.007] [0.008]
ttrans
0.487***
[0.179]
rddum
-0.148***
[0.045]
N 87956 87956 87956 84014 84014 84012 56921
Log likelihood -68859 -68857 -68801 -59084 -59084 -59029 -37086
Table 4.4.1 Determinants of exit (1983-2001 dataset)
Note Robust standard errors in brackets. All models include time dummies*** p<0.01 ** p<0.05 * p<0.1

110
Variables Models
1 2 3 4 5 6 7
fdi -1.138*** -1.140*** -
1.108*** -0.460*** -0.462*** -0.395** -0.351**
[0.152] [0.152] [0.152] [0.148] [0.148] [0.157] [0.155]
fdiqs -0.056 -0.073 0.113 0.131 0.078 0.047 0.069
[0.096] [0.100] [0.107] [0.125] [0.130] [0.180] [0.182]
fdiqr -0.365*** -0.070 0.032 0.042 0.013 -0.001 -0.046
[0.094] [0.148] [0.150] [0.118] [0.186] [0.229] [0.233]
fdisupp_q 21.059*** 21.150*** 15.090** 25.283*** 26.106*** 42.750*** 43.049***
[6.991] [6.997] [7.054] [9.040] [9.060] [13.199] [13.179]
fdibuy_q -7.576** -7.697** -6.156* -5.674 -6.508 -7.849 -8.141
[3.536] [3.554] [3.591] [4.643] [4.687] [6.437] [6.471]
cfdiqs
0.029 0.223
0.546* 0.731* 0.773*
[0.254] [0.262]
[0.320] [0.415] [0.420]
cfdiqr
-0.514*** -
0.534***
0.052 0.236 0.173
[0.182] [0.184]
[0.230] [0.305] [0.309]
lentrate
0.180 1.255*** 1.229*** 1.627*** 1.597***
[0.241] [0.321] [0.321] [0.503] [0.501]
sectgr
0.045 -0.094 -0.090 -0.058 -0.047
[0.060] [0.068] [0.068] [0.100] [0.098]
sectgrpr
-0.134 -0.364** -0.378** -0.446** -0.489**
[0.138] [0.155] [0.155] [0.213] [0.211]
hhi
-0.457*** -0.862*** -0.874*** -0.875*** -0.863***
[0.153] [0.195] [0.195] [0.270] [0.270]
mes
-0.182*** -0.323*** -0.327*** -0.374*** -0.363***
[0.015] [0.022] [0.022] [0.033] [0.033]
relsize
-0.511*** -0.512*** -0.575*** -0.566***
[0.013] [0.013] [0.018] [0.018]
lw
0.012 0.012 0.066* 0.015
[0.027] [0.027] [0.037] [0.038]
pmargin
-0.000*** -0.000*** -0.000*** -0.000***
[0.000] [0.000] [0.000] [0.000]
subinput
0.100 0.101 0.270 0.135
[0.138] [0.138] [0.177] [0.187]
suboutput
0.392*** 0.391*** 0.192*** 0.238***
[0.037] [0.037] [0.053] [0.054]
kl
-0.045*** -0.059***
[0.011] [0.011]
ttrans
0.345***
[0.048]
rddum
-0.241
[0.263]
N 18230 18223 18223 16305 16305 12829 12829 Log likelihood -31656 -31640 -31590 -22654 -22653 -12796 -12777
Robust standard errors in brackets
*** p<0.01 ** p<0.05 * p<0.1
All models include time dummies
Table 4.4.2 Determinants of exit (2003-2009 dataset)
There are seven models estimated for each dataset. The first model includes only the fdi dummy variable and horizontal and vertical spillover variables. The second model adds changes in sectoral and regional foreign share variables (cfdiqs and cfdiqr). The sector-specific and firm-specific variables (with the exception of kl, ttrans and rddum variables) are included in the third and fifth models. The fourth model is same as the fifth one, but excludes cfdiqs and cfdiqr variables. This model is used to check if correlations between fdiqs and cfdiqs on the one hand, and fdiqr and cfdiqr on the other have caused any estimation problem. In the sixth mode, we include the capital intensity variable, and finally the last model has all variables including ttrans and rddum. We added kl and ttrans/rddum variables separately because there are many missing values for the kl variables especially in the 2001-2009 dataset, whereas the ttrans and rddum variables are available only after 1992 in the 1984-2001 dataset. There are basically three sets of regressions: the first set includes only foreign

111
firm variables (models 1 and 2). The second set adds sector-specific variables, because these are certainly exogenous to the foreign firm variables (model 3). Finally we add firm-specific variables, some of which could be endogenous (for example, profit margin) (models 4-7). The estimation results provide strong evidence that foreign firms (fdi) have higher survival probabilities than domestic firms when firm-specific variables are not included in the estimation model, i.e., the “foot-loose multinational” hypothesis is rejected by the data. Adding sector-specific variables does not change the degree of impact of foreign ownership on survival. However, when we include firm-specific variables, the coefficient of the foreign-ownership variable, fdi, changes its sign and becomes positive and statistically significant for the 1984-2001 dataset. In the case of the 2003-2009 dataset, the coefficient on the fdi variable remains negative and statistically significant even after the firm-specific effects are controlled for, but its absolute value declines sharply. These results indicate that foreign firms are more likely to survive than domestic firms operating in a similar sector, but when we control for firm-specific characteristics, we get a different result. Foreign firms seem to be foot-loose in the late 1980s and 1990s compared to domestic firms that have similar characteristics (same size, same wage rate, same profit margin, etc.). The foreign ownership itself may not have a significant impact on survival, but other firm-level characteristics (size, skill level, etc) are more important. Foreign firms have higher survival probability than domestic firms, not because of their foreign ownership, but because of their characteristics shared by some domestic firms, too. We can conjecture that foreignness does not matter for survival, but multinational experience does because multinational firms start with larger size and could employ more capital-intensive technologies thanks to their superior financial strength and experience in other markets. Horizontal FDI spillover variables (fdiqs and fdiqr) have weak and ambiguous impact on survival probabilities. Sectoral share of foreign firms has a positive impact on hazards rate in the 1984-2001 dataset when no sector-specific variables are included. But once these variables are included, its coefficient becomes statistically insignificantly different from zero. Therefore one cannot rigorously claim that the presence of foreign ownership in the sector reduces the survival probability of domestic firms, because this correlation could be caused by other sector-specific factors. For example, if foreign firms enter mainly to the sectors characterized by high concentration, low growth rates, and low minimum efficient scale, we could observe a similar correlation between sectoral foreign share and survival probability. Change in the sectoral share of foreign firms (cfdiqs, the dynamic effect of the existence of foreign firms) has negative impact on survival of domestic firms in all models, although the effect is statistically significant at the 10% level in some models. Considering these results together with the findings on static effects, one could conjecture that what matters for the survival or domestic firms is the increasing sectoral share of foreign firms, not the level of foreign presence in the sector. In other words, domestic firms will feel the competitive pressures while foreign firms are increasing their market share (through growth or entry), but the level of foreign share itself does not matter much. Regional share of foreign firms (fdiqr) seems to increase the exit of domestic firms, but only in the 1984-2001 dataset. We do not observe a similar effect in the 2003-2009 dataset. This could also be a result of the differences in policy regimes and macroeconomic conditions during these two periods. Change in regional share of foreign firms (cfdiqr) has also a weak and ambiguous effect on survival. The coefficient of the regional foreign share variable (cfdiqr) is negative in all models (but statistically significant in only one model) for the 1984-2001 dataset, and negative and significant for the 2003-2009 dataset only when sector-specific variables are not controlled for. Sector-specific variables usually have strong and consistent effects on survival. Entry rate (lentrate) has strong positive impact on the hazard rate. The probability of exit increases when more firms enter into their sector. Growth rates of sectoral output and prices (sectgr and sectgrpr) help to reduce exit probabilities, and the impact of growth rate of prices is stronger than that of sectoral output. Interestingly, the minimum efficient scale (mes) has a positive impact on survival: firms entering into sectors characterized by the existence of large firms are more likely to survive, possibly because they enter into market niches. However, the level of concentration (hhi) has statistically significant but opposite effect on survival in 1984-2001 and 2003-2009 dataset. The level of concentration increases the exit probability in the first period whereas it reduces the exit probability in the second period. The change in the effect of concentration could also be explained by changes in the macroeconomic conditions. Survival

112
could be more difficult for small firms in more concentrated markets under the conditions of economic turbulence and high inflation of the 1990s, but small firms could benefit from higher prices in more concentrated markets under economic stability and rapidly declining inflation rates in the 2000s. This is an issue that needs further investigation.87 Firm-specific variables have also strong and consistent impact on survival probabilities. As found in almost all empirical studies on survival, firm size (relsize) is very important: large firms are more likely to survive. This finding is robust to using various size measures (relative size, absolute size, entry size, etc.). Capital intensity (kl) too has a strong and consistent impact on survival: firms using more capital-intensive technologies are more likely to survive. The skill level of the workforce, as measured by wage rate (lw), has a strong positive impact on survival in the first database, but its effect is not statistically significant in the second time period. Profit margin (pmargin) has also a positive impact on survival although it is statistically significant only in the 2003-2009 period. Subcontracting is also one of the main determinants of survival. Subcontractors (suboutput) are more likely to exit. This result indicates that subcontracting, on average, could be an unequal relationship between subcontractors and main contractors through which risks and costs are transferred to subcontractors. However, subcontracting production does not help to raise survival probability of main contractors. The coefficient on suboutput is very high. It is important to note that since 2003 subcontracting has been widely utilized by manufacturing firms as a means of procuring services. Technology variables reveal an interesting strong and consistent pattern. Those firms that rely on technology transfer from abroad (ttrans) are less likely to survive whereas those firms that develop their own technology (rddum) through in-house R&D activities are more likely to survive.88 It seems that Turkish firms transfer labor-saving (process) technologies from abroad through license and know-how agreements, whereas the technologies they develop in-house through R&D are labor-using (product) technologies. Thus, those firms that use transferred technology employ less labor, and those firms that conduct R&D employ more labor.
4.3.3 Conclusions
The results of the Cox proportional hazards model suggest that foreign firms are more likely to survive than domestic firms, but the difference between domestic and foreign firms could be explained to a large extent by their firm-specific characteristics. Once firm-specific characteristics are controlled for, it is ambiguous if foreign firms can survive more or if they are foot-loose. It seems that foreign firms have advantages over domestic firms not because they are foreign, but they are multinational. It is also possible that foreign firms decided to quit the Turkish market in the face of higher volatility in large proportions compared to domestic ones. Foreign spillover variables have usually weak and ambiguous impact on survival probabilities. This is partly due to the limitation of spillover measures we use. Horizontal spillovers are calculated at the 4-digit sector level, and vertical spillovers are calculated using Iinput-output tables. The sectoral classification of input-output tables is even much broader than 4-digit industry classifications used to calculate horizontal spillovers (ISIC and NACE classifications at 4-digit level). Since spillovers are not measured at the firm level, the variation in the data is quite restricted and this could lead to weak and ambiguous results. Given the data restrictions, the estimation results suggest that there is a negative correlation between sectoral share of foreign firms and survival probability, but this correlation could be caused by other sector-specific factors (level of concentration, sectoral growth rates, etc.). Regarding horizontal spillovers, there is weak evidence that imply that change in the sectoral share of foreign firms (the dynamic effect of the existence of foreign firms) has a negative impact on survival of domestic firms in all. Domestic firms feel the competitive pressures while foreign firms are increasing their market share (through growth or entry), but the level of foreign share itself does not matter much.
87There is also a major change in the way the Herfindahl-Hirschman indices are calculated for these time periods. The statistical unit is “establishment” in the 1984-2001 dataset whereas it is “enterprise” in the 2003-2009 dataset. 88The coefficient of the rddum variable is negative in both time periods, but statistically significant only for the 1984-2001 dataset.

113
4.4 Foreign ownership and firm growth
4.4.1 Empirical Model
The determinants of firm growth have attracted the attention of economists and policy makers for a long time because growing firms play an increasingly important role in the job creation process. In this part of the report, we will analyze the effects of foreign ownership and the presence of foreign firms on growth process. Figures 4.4.1 and 4.4.2 depicts the average relative size of new domestic firms after entry. Each line represents the average relative size of a particular cohort of entrants. Since “relative size” is defined as log difference between firm size and sector average, the relative size of a firm that is at the sector average is equal to zero.
Figure 4.4.1 Average size of new firms by cohort (1983-2001 dataset)
Figure 4.4.2 Average size of new firms by cohort (2003-2009 dataset)
As expected, entrants start small: the entry size is much lower than the average size so that relative size at the time of entry (age 0) is negative for all cohorts. However, the relative size of new firms increases rapidly over time, and converges towards sector average. The rapid increase in the average size can be explained by two factors: exit of small firms, and growth of new firms. The first process (exit) has been studied in detail in the preceding section, and it was found that small firms are more likely to exit. If small firms exit, than the average size of remaining firms will increase even if they do not grow at all. The second process, new firm growth, will be studies in detail in the following subsection.The pattern of growth of new foreign firms is depicted in Figures 4.4.3-4.4.4. As it is obvious, the entry size of foreign firms is much higher than the entry size of domestic firms especially in the 1984-2001 period. The average relative size of new foreign firms also tends to increase over time, as observed in the case of domestic firms.
-1,4
-1,2
-1,0
-0,8
-0,6
-0,4
-0,2
0,0
0 2 4 6 8
Rela
tive
siz
e (
%)
Age
2003 2004 2005

114
Figure 4.4.3 Average size of new foreign firms by cohort (1983-2001 dataset)
Figure 4.4.4 Average size of new foreign firms by cohort (2003-2009 dataset)
In order to analyze the effects of exit and growth processes, we classify all new firms into two categories: exitors and survivors. Exitors are those new firms that exited from the market until the end of the observation period (2001 for the 1984-2001 dataset and 2009 for 2003-2009 dataset). Survivors are those firms that survived until the end of observation period. Of course, some of the survivors would have exited afterwards, but their exit has not been observed because of truncation of the data at 2001 and 2009. The relative sizes of domestic exitors are shown in Figures 4.4.5-4.4.6. It is clearly visible that
exitors do not grow much after entry,
the smaller the entry size, the shorter the duration of survival,
exitors tend to become even smaller in a few years preceding their exit. The visual description of the exit process of domestic firms provide evidence that a part of the increase in the relative size of new firms can be explained by the exit process because smaller firms tend to exit first.89
89The corresponding figure for foreign firms is not provided because the number of foreign exitors in each cohort is too small.

115
Figure 4.4.5 Average size of exitors by survival duration (1983-2001 dataset)
Figure 4.4.6 Average size of exitors by survival duration (2003-2009 dataset)
The relative size of domestic survivors is shown in Figures 4.4.7-4.4.8. The relative size of foreign survivors is shown in Figures 4.4.9-4.4.10. It is apparent that surviving new firms grow really quite fast and reach sector average in about 5-6 years. In other words, new firms, if they survive, eliminate size disadvantages in 5-6 years after entry.
Figure 4.4.7 Average size of survivors by age (1983-2001 dataset)
-0,8
-0,7
-0,6
-0,5
-0,4
-0,3
-0,2
-0,1
0,0
0 2 4 6 8 10
Re
lative
siz
e (
%)
Age
1 2 3 4 5

116
Figure 4.4.8 Average size of survivors by age (2003-2009 dataset)
Figure 4.4.9 Average size of foreign survivors by age (1983-2001 dataset)
Figure 4.4.10 Average size of foreign survivors by age (2003-2009 dataset)
-0,8
-0,6
-0,4
-0,2
0,0
0,2
0,4
0 2 4 6 8 R
ela
tive
siz
e (
%)
Age
2008 2007 2006 2005 2004 2003

117
These figures provide visual evidence on the differences between growth patterns of new domestic and foreign firms. We will use regression analysis to test if there is any statistically significant difference between growth rates of domestic and foreign firms, and to check if spillovers from foreign firms have any affect on the growth rates of domestic firms. A simple econometric model of firm growth can be defined by
lgrit+1 = Xitβ (19)
where lgrit+1 is the growth rate of firm i from time t to t+1, X is a vector of variables and β the corresponding vector of parameters. The growth rate can be defined in logarithmic form:
lgrit+1 = log(Lt+1/Lt) = log(Lt+1) - log(Lt) (20)
where L is a size variable (we use the number of employees to measure the size of the firm). One of the main variables included in the firm growth models is the current size of the firm. The relationship between growth and current size has been studied extensively at least since Gibrat's influential study published in 1931. Gibrat suggested that the size of a firm and its growth rate are independent (the “Gibrat law”), i.e., the coefficient of the size variable in the firm growth model should be equal to zero. There are a large number of empirical studies that tested the Gibrat law, but the results are quite mixed. In this study, we also include the current size into the model to check if there is any impact of current size on the growth rate. The model then becomes
lgrit+1 = log(Lt+1) – log(Lt) = β0log(Lt) + Xitβ (21)
This equation is the same as standard empirical labor demand equation that is defined by
log(Lt+1) = α0log(Lt) + Xitβ (22)
where α0 = (1+β0) The growth model (or, similarly, the labor demand model) can be estimated by GMM-system method developed by Blundell and Bond. The GMM-system method takes into account unobserved firm-specific effects and the endogeneity of the lagged dependent variable (log(Lt)) in the model. The main limitation of the GMM-system method in our context is the fact that there could be attrition bias because some firms exit from the market through a process, which is not necessarily random. Therefore, we experimented with the Heckman selection model to take into account the selection (attrition) bias. The Heckman model is based on estimating two equations, the first one is the selection model (the determinants of survival), and the second one is the growth model that includes a selectivity-bias correction term derived from the estimates of the selection model. Since the selectivity-bias correction term is a nonlinear transformation of the explanatory variables, it is possible to identify the parameters without any further restrictions on the model, in particular without the necessity of adding more exogenous variables into the selection model. However, in many practical applications, if the selection model does not include some additional exogenous variables, the growth model could suffer from multicollinearity problem because the selection correction term could be almost linear. In other words, the Heckman model could be a viable alternative if one can find some exogenous variables that affect selection but not growth. Unfortunately, it is neither theoretically nor empirically easy to find such variables. We experimented with using relative size in the selection (survival) equation, and absolute size in the growth regression, but the results seem not so reasonable (see Tables 4.4.3-4.4.4). Therefore, we focus our attention in this study on GMM-system results.

118
Table 4.4.3 Determinants of survival and growth (Heckman model)
As mentioned before, the dependent variable of the growth model is the log number of employees at time t+1. All explanatory variables used in the Cox proportional hazards model are also used in the growth model with two exceptions. First, we use absolute log size instead of relative size in the growth model. Second, we add (log) age of the firm into the model because young firms, as observed in Figures 4.4.7 and 4.4.8, are likely to grow faster.90 The effects of explanatory variables on growth are expected to be similar to those discussed in the case of survival model with two exceptions. Firm size is expected to have a positive impact on survival but it could have a negative impact on growth (that means, the coefficient of current size variables is expected to be less than one) if small firms grow faster. Likewise, the age of the firm could have a positive impact on the hazard rate for exit (young firms have a higher exit probability than mature firms), but its impact on growth could be negative (young firms are likely to grow faster).
90Note that the Cox proportional hazard model also includes the age of the firm in the nonparametric part (baseline hazard function).
1983-2001 dataset
2003-2009 dataset
Growth Survival Growth Survival
llab 0.962***
0.904***
[0.002]
[0.008]
relsize
0.389***
0.710***
[0.008]
[0.018]
lage -0.025*** -0.005
-0.227*** 0.130***
[0.001] [0.007]
[0.012] [0.024]
fdi 0.014* -0.077**
0.111*** 0.320***
[0.007] [0.036]
[0.023] [0.101]
fdiqs 0.001 -0.197***
0.083* -0.055
[0.012] [0.059]
[0.043] [0.131]
fdiqr -0.030*** -0.625***
-0.041 -0.117
[0.010] [0.049]
[0.056] [0.150]
fdisupp_q -0.097** -2.185***
0.939 -12.806*
[0.045] [0.227]
[2.878] [7.095]
fdibuy_q 0.078** 1.158***
-1.170 0.802
[0.037] [0.180]
[1.455] [3.567]
cfdiqs -0.008 -0.238*
0.048 -0.390
[0.024] [0.125]
[0.089] [0.268]
cfdiqr 0.048** 1.411***
-0.098 0.299
[0.023] [0.103]
[0.090] [0.198]
lentrate 0.069*** 0.081
-0.349 -0.002
[0.024] [0.123]
[0.225] [0.481]
sectgr 0.049*** 0.171***
0.062 0.042
[0.007] [0.035]
[0.042] [0.081]
sectgrpr 0.028** -0.825***
0.127** 0.017
[0.012] [0.059]
[0.063] [0.133]
hhi -0.032 -0.075
0.032 0.883***
[0.021] [0.102]
[0.064] [0.203]
mes 0.008** 0.214***
0.040*** 0.519***
[0.004] [0.016]
[0.013] [0.029]
lw 0.027*** -0.054***
0.029** -0.062**
[0.002] [0.010]
[0.015] [0.027]
pmargin 0.033*** -0.073**
-0.013 0.035
[0.007] [0.031]
[0.020] [0.028]
subinput 0.056*** 0.102**
-0.067 -0.145
[0.013] [0.050]
[0.059] [0.129]
suboutput -0.016*** -0.208***
-0.038** -0.030
[0.006] [0.023]
[0.017] [0.037]
kl 0.027*** 0.018***
0.053*** 0.017**
[0.001] [0.004] [0.004] [0.007]
N 106776
20261
Log likelihood
-56958
-16206
Robust standard errors in brackets *** p<0.01
All models include time dummies

119
4.4.2. Econometric results
GMM-system estimation results for the growth model are presented in Tables 4.4.4-4.4.5.91 As expected, the coefficient of current size variable (llab) is positive but less than one, adding another evidence in support of the stylized fact that large firms have lower growth rates than small firms. However, the coefficient gets closer to one as other firm-specific variables are included in the model. In other words, the impact of the firm size on growth rates declines when firm-specific variables are included in the model.
Table 4.4.4 Determinants of growth (1983-2001 dataset)(GMM-system estimates)
91All models include time dummies to control for macroeconomic conditions.
Variables Models
1 2 3 4 5
llab 0.471*** 0.694*** 0.694*** 0.667*** 0.630***
[0.009] [0.006] [0.007] [0.006] [0.007]
fdi
0.316*** 0.276*** 0.229*** 0.131***
[0.032] [0.034] [0.034] [0.041]
fdiqs -0.105** -0.055 -0.074** -0.071* -0.055
[0.053] [0.035] [0.038] [0.037] [0.038]
fdiqr 0.057 0.035 0.043 0.093*** 0.146***
[0.043] [0.030] [0.032] [0.032] [0.034]
fdisupp_q -0.269** -0.384*** -0.393*** -0.552*** -0.642***
[0.127] [0.094] [0.095] [0.091] [0.095]
fdibuy_q 0.141 0.151 0.186* 0.201* 0.137
[0.158] [0.111] [0.113] [0.111] [0.113]
cfdiqs 0.025
0.058** 0.048* 0.062*
[0.033]
[0.029] [0.029] [0.032]
cfdiqr -0.007
-0.099*** 0.013 -0.101**
[0.042]
[0.035] [0.036] [0.045]
lentrate 0.194*** 0.092*** 0.124*** 0.194*** 0.194***
[0.039] [0.027] [0.031] [0.031] [0.042]
sectgr 0.054*** 0.071*** 0.071*** 0.046*** 0.047***
[0.009] [0.008] [0.008] [0.008] [0.009]
sectgrpr 0.043*** 0.151*** 0.155*** 0.060*** 0.108***
[0.014] [0.012] [0.013] [0.013] [0.015]
hhi -0.295*** -0.335*** -0.318*** -0.317*** -0.480***
[0.090] [0.063] [0.064] [0.062] [0.071]
mes 0.378*** 0.192*** 0.197*** 0.181*** 0.194***
[0.014] [0.010] [0.010] [0.011] [0.012]
lage
-0.070*** -0.070*** -0.051*** 0.030***
[0.004] [0.004] [0.004] [0.005]
lw
0.086*** 0.086*** 0.023*** 0.125***
[0.006] [0.006] [0.006] [0.008]
pmargin
0.046*** 0.049*** 0.013 0.026*
[0.011] [0.011] [0.011] [0.014]
subinput
0.132*** 0.106*** 0.078*** 0.040
[0.020] [0.022] [0.022] [0.027]
suboutput
-0.128*** -0.131*** -0.141*** -0.121***
[0.019] [0.020] [0.019] [0.023]
kl
0.089*** 0.089***
[0.003] [0.004]
ttrans
0.056*
[0.033]
rddum
0.034***
[0.006]
N 70425 68350 68350 68348 47856
Standard errors in brackets *** p<0.01 * p<0.1
All models include time dummies fllab: Employment growth rate at time t+1, fllab=ln(Lt+1/Lt)

120
Variables Models
1 2 3 4 5
llab 0.741*** 0.791*** 0.795*** 0.835*** 0.831***
[0.035] [0.028] [0.028] [0.028] [0.027]
fdi
0.804*** 0.806*** 0.385** 0.201
[0.219] [0.221] [0.182] [0.152]
fdiqs 0.267*** -0.055 -0.067 -0.018 -0.009
[0.067] [0.072] [0.077] [0.071] [0.065]
fdiqr 0.024 -0.195*** -0.170** -0.176** -0.148**
[0.070] [0.071] [0.072] [0.072] [0.069]
fdisupp_q -0.014 -0.387 -0.384 -0.924*** -0.866***
[0.307] [0.350] [0.351] [0.332] [0.304]
fdibuy_q -0.224 -0.282 -0.270 -0.041 -0.050
[0.168] [0.175] [0.175] [0.161] [0.150]
cfdiqs -0.038
0.058 0.079 0.064
[0.080]
[0.079] [0.077] [0.074]
cfdiqr 0.049
-0.356** -0.351** -0.387**
[0.175]
[0.168] [0.173] [0.169]
lentrate 0.072 -1.487*** -1.477*** -1.313*** -1.251***
[0.159] [0.219] [0.219] [0.213] [0.209]
sectgr 0.065** -0.036 -0.038 0.046 0.056*
[0.033] [0.034] [0.034] [0.034] [0.033]
sectgrpr 0.176*** 0.203*** 0.205*** 0.172** 0.187***
[0.062] [0.072] [0.072] [0.072] [0.070]
hhi -0.265*** -0.077 -0.070 -0.112 -0.123*
[0.097] [0.082] [0.082] [0.076] [0.074]
mes 0.089*** 0.018 0.016 0.001 0.006
[0.023] [0.017] [0.017] [0.017] [0.016]
lage
-0.457*** -0.466*** -0.465*** -0.454***
[0.026] [0.026] [0.027] [0.026]
lw
0.277*** 0.274*** 0.210*** 0.218***
[0.052] [0.053] [0.051] [0.049]
pmargin
0.510*** 0.505*** 0.405*** 0.401***
[0.052] [0.052] [0.057] [0.056]
subinput
0.113 0.117 0.116 0.125
[0.092] [0.092] [0.100] [0.096]
suboutput
0.047 0.045 0.081** 0.080**
[0.033] [0.033] [0.034] [0.034]
kl
0.050*** 0.052***
[0.009] [0.009]
ttrans
0.038
[0.023]
rddum
0.015
[0.060]
N 8617 8437 8437 7450 7450
Standard errors in brackets *** p<0.01 * p<0.1
All models include time dummies
fllab: Employment growth rate at time t+1, fllab=ln(Lt+1/Lt)
Table 4.4.5 Determinants of growth (2003-2009 dataset)(GMM-system estimates)

121
Foreign ownership has a strong impact on growth. The coefficient of the foreign ownership dummy (fdi) has a positive and statistically significant coefficient in all but one model. Although foreign firms start larger than domestic entrants, they achieve faster growth rates than comparable domestic firms. Two foreign spillover variables have strong and rather consistent impact on growth rates. First, the share of foreign firms in supplier industries (fdisupp_q) has a negative impact on buyer firms. It seems that buying inputs from local foreign firms has a detrimental effect on the growth prospects of domestic firms. Moreover, the change in regional share of foreign firms (cfdiqr) has also a negative impact on growth. Firms located in regions where the share of foreign firms increase rapidly are faced with some restrictions on growth. This could be due to the allocation of local resources towards foreign firms. Other spillover variables have either weak or ambiguous effect on growth. Other sector-specific variables have usually strong impact on the growth rates of firms. Firms operating in sectors that experience high growth rates in output (sectgr) and prices (sectgrpr) also grow faster (“riding on the wave” effect). Firm growth rates are lower in more concentrated sectors (hhi). The lack of competition has a negative impact on the growth rates of firms. However, firms tend to grow faster in sectors characterized by high minimum efficient scale (mes). This could be due to the need to reach minimum efficient scale sooner to be competitive in the market. Entry rate (lentrate) has an ambiguous effect. Its impact on growth is positive in the 1984-2001 dataset, but negative in the 2003-2009 dataset. New firms are likely to enter in boom years and exit during the bust years, which happened to be more frequent during the 1984-2001 period. Firm-specific variables have expected effects. Mature firms have lower growth rates (lage), whereas firms paying higher wages (presumably to their more skilled workers) (lw) grow faster. Capital-intensive (kl) firms tend to grow faster possibly because of the complementarities between capital and skilled labor. Profitable firms (pmargin) also achieve faster growth. This result suggests that there could be external financial constraints on firm growth. Those firms that accumulate capital are able to finance their growth. Subcontracting variables support the hypothesis on unequal relationship between subcontractors and main contractors. Subcontractors (suboutput) have lower growth rates but contracting out production (subinput) increases growth rates for main contractors (but the last effect is not statistically significant in the 2003-2009 period). Technologically more dynamic firms achieve higher growth rates. Firms transferring technology from abroad (ttrans) and conducting in-house R&D (rddum) grow faster than others. These variables have positive but statistically insignificant coefficients for the 2003-2009 dataset, possible because the panel is short for that dataset and unobserved firm-specific effects dominate the contribution of ttrans and rddum variables that do not change much over time.

122
4.4.3 Conclusions
Estimation results for the growth model suggest strongly that foreign firms have higher growth rates than domestic firms, even after controlling for a number of firm-specific variables, including unobserved firm-specific factors. The presence of foreign firms has a detrimental impact on the growth rate of domestic firms that either use more inputs from foreign-dominated sectors, or operate in regions where the share of foreign firms in regional output is increasing. The first case, foreign presence in supplier industries has also a negative impact on the survival of domestic firms purchasing inputs from foreign firms. This is an unexpected result, because it can be argued that foreign firms could produce higher quality products or sell their products at a lower price thanks to their productivity, so that their corporate customers should benefit from using inputs produced by foreign firms, and achieve faster growth and survive longer.
4.5 The impact of economic crises on firm survival and employment growth
4.5.1 The Turkish economic crises: 1994 and 2001
Turkish manufacturing industry came under severe pressure during the 1994 and 2001 crises that hit the Turkish economy. Both incidences were specific to Turkish economy, and did not create any contagious effects on other countries. In both cases, Turkish Lira depreciated sharply. Within a year the Turkish economy started to come out of the crises thanks to the real depreciation of the Lira and the external demand. The contraction of the domestic demand pushed Turkish firms to search for markets abroad. In 1994, from peak to trough real output contracted by 11.7%. Private investment expenditures were the worst affected as evidenced by a 25.7% decline, followed by 10.3% drop in private consumption expenditures. Immediately after the crisis hit, the exports declined by 20 percent in the first quarter of 1994. However, once the Lira devalued as part of the stabilization program of April 7, exports recovered fully by the third quarter of 1994. Exports continued the upward trend afterwards and recorded a growth rate of 25% within a year and a half. In a matter of a year, real wages declined by more than 35%, enabling the government to keep its real expenditures under control and lower the inflation rate to double digits in a year. Despite some gains over the subsequent 5 years, the average real wage in 2000 was still 20% lower than the one in 1993. In between the 1994 and 2001 crises, Turkish economy experienced another episode of serious economic slowdown due to external and domestic shocks. The Russian debt crisis of 1998 had contagion effects on the Turkish financial markets and the economy through financial and trade channels. As a result, GDP started to slow down in the first half of 1999. Then on August 17, 1999, the country was devastated by a powerful earthquake in the Marmara region that left more than 20,000 people dead and billions of dollars in physical damage. As a result of the two consecutive shocks the industrial production contracted by 6.3% one year after the third quarter of 1998. GDP contracted by 3.4% in 1999. The 2001 crisis was the most systemically important and severe. It was a turning point in the Turkish economic prospects. The impact of the 2001 crisis on Turkish economy was larger than the 1999 shock. GDP contracted by 5.7 percent in 2001. While, the unemployment did not increase much during the 1994 crisis, the 2001 crisis put a major pressure on firms and led to substantial increase in the unemployment rate. The unemployment rate increased steadily from 6.5 percent at the end of 2000 to 8.4 at the end of 2001 and 10.3 percent at the end of 2002. The industrial production contracted close to 10 percent. Similar to what was observed in 1994, real wages declined during the 2001 crisis, but by 18 percent this time. Following the crisis significant institutional and macroeconomic structural reforms were undertaken. These reforms are critical to develop an understanding of the Turkish economic performance in the aftermath of the 2001 crisis. Thanks to the rapidly depreciating Lira and robust international economic conditions, Turkey was able to bounce back easily within one year of the initial shock, achieving a robust GDP growth of 6.2 percent in 2002. Domestic producers were able to direct their production to export markets in the wake of rapidly falling domestic demand. The Turkish economy achieved exceptionally high growth rates after 2001. From 2002 to 2006, GDP grew at an

123
average annual rate of 7.2 percent. Exports increased at phenomenal rates during and after the crisis in 2001: the average annual growth rate of the value of exports (in U.S. dollars) was about 25 percent in the period 2001–06. From 2001 to 2008, the production of the manufacturing industry increased by 57 percent.
4.5.2 The global economic crisis of 2008
After achieving a stellar growth performance between 2002 and 2006, the Turkish economy started to slow down in 2007 and 2008. Several factors played critical role in the slowdown. First, as expected, the impact of structural macroeconomic reforms on growth dynamics diminished over time. As time went on, it became possible to identify second-generation supply-side structural reforms that enhanced the competitiveness of the private sector. It was not very difficult to identify the areas that needed structural reforms. However, since the economy was already growing at 7%, it was not possible to convince the government about the need for structural reforms. The second factor was a temporary worsening in the external environment in 2006. Following the Federal Reserve’s decision to increase its policy rate to the highest level in six years, there was a reversal of the capital flows from emerging market economies in June through August 2006. In order to stem the tide of capital outflows from Turkey the Central Bank of the Republic of Turkey (CBRT) had to increase the policy rate (the overnight interest rate) by 4.25% to 17.5% within two months. However, it soon became evident that the capital outflows were temporary and had limited impact on domestic demand. Consumption growth (seasonally adjusted) declined from 7.9% in 2005 to 4.6% in 2006, but domestic investment continued to grow at double digits and the GDP growth rate was 6.9%. The third factor was related to domestic politics. The showdown between the government and the secular bureaucratic elites in the first half of 2007 led to a short period of political uncertainty. Policy interest rates that were still high at 17.5% combined with political uncertainty had its effect on expectations and hence on the behavior of firms and households. After years of double-digit growth rates, the total investment almost stalled with a 3.1% growth rate in 2007, followed by a 6.2% contraction in 2008. The private sector led the downward move in total investment with a 9% drop, and total investment dropped in spite of a 12.7% year-on-year increase in public-sector investment. As a result, the growth rate in 2007 was 4.7%, significantly lower than 7.2%, the average growth rate achieved from 2002 through 2006. In the meantime, the early tremors of the global financial crisis were being felt all around the world. Turkey was no exception. In addition, the price of oil, along with the prices of other commodities, increased sharply in the first half of 2008. From an average of $93 per barrel in January 2008, the price of light crude oil gradually went up to $105 in March and $134 in June. A 44% increase in oil prices within six months increased the cost of living for households and curtailed domestic spending, leading to a mild recession. In the second and third quarters of 2008 real year-on-year GDP growth rate declined to 1.7%. However, once the financial crisis hit on a global scale after the collapse of Lehman Brothers, its impact on the Turkish economy, as well as other economies, was devastating. GDP declined by 5.6% in the fourth quarter of 2008 and 4.4% in the first quarter of 2009. Combining the mild early recession with the rather severe contraction, the cumulative decline in GDP reached to 13.8% year over year from the first quarter of 2008. The severity of the impact of the global financial crisis of 2008-09 can be grasped better when compared with the local crises of 1994 and 2001. From peak to trough, the decline in GDP was 11.7% and 9.8% during the 1994 and 2001 crises, respectively. The recession of 2008-09 lasted longer than previous ones because it was a combination of an earlier, milder domestic recession (2.7% cumulative decline in GDP) with a subsequent severe contraction due to the external shock. The contraction in Turkey’s real output was even higher than that of Russia (11%), an economy that is heavily dependent on the export of oil and other commodities. The average share of exports of goods and services in Turkish GDP between 2007 and 2010 was 22%, which was lower compared to many emerging markets close to its own level of development and size. Yet, the Turkish economy was one of the worst hit emerging markets during the 2008-09 financial crisis in terms of the contraction in real output. During the 2008-09 recession, from peak to trough, the cumulative decline in total investment and private consumption expenditures was 28% and

124
8.4%, respectively. While the cumulative decline in GDP was higher compared with the 1994 and 2001 crises, the cumulative decline in total investment expenditures was lower compared with the corresponding decline during the 2001 crisis (38.3%) and more than the corresponding decline during the 1994 crisis (25.4%). In the case of private consumption expenditures, the cumulative decline was lower in absolute value than the one in 2001 crisis but higher than the cumulative decline during the 1994 crisis.
4.5.3 The effects of economic crises on firms’ survival and employment growth
The effects of economic crises on firms' survival probabilities and growth rates can be identified through two variables. First, all models include sectoral output growth rates as an explanatory variable. For example, the coefficient of the sectoral output growth rate variable is about 0.05 in growth models. If the sectoral growth rate declines 10 percentage points (from 5% to -5%), than the employment growth rate will decline, on average, by 0.5 percentage points. Second, all models include time dummies that capture the effects of all other time-varying effects. We will look at these variables in detail to obtain a measure for the effects of economic crises Turkey experienced in 1994, 1999, 2001 and 2009 on firm growth and survival. We estimated separate regressions of our preferred model for domestic and foreign firms (Model 5 for survival and Model 3 for growth)92 because we would like to check if the effects of economic crises differ for domestic and foreign firms. Then, we normalized the coefficients of time dummies for each model and time period to have comparable magnitudes for coefficients with zero mean and unit standard deviation. Moreover, the coefficient estimates from the Cox hazards model are multiplied by minus one so that they will have the same sign as those of the growth model (negative values will imply negative impact). The standardized coefficients of time dummies for the survival model are presented in Figure 4.5.1. Since the number of exits of foreign firms is small especially in the 2003-2009 dataset, the results for foreign firms should be interpreted cautiously. The data summarized in the figure show that the survival probabilities decline during the economic crises for domestic firms, but the impact on foreign firms is somewhat lower. Indeed, the survival probability of foreign firms seems to increase during the 1994 crisis. Although the number of observations on foreign firms and exits is low, the results provide some weak evidence for the resilience of foreign firms against crises.
92 These are the preferred models because they include most of the firm-specific variables without any significant loss of observations. The data for ttrans and rrdum variables are available since 1992 for the 1984-2001 model, and there are many missing observations for the kl variable in the 2003-2009 dataset. Therefore, we have chosen the model without these variables to have more observations in the sample. We experimented with other models, but the results were similar.

125
Figure 4.5.1 Impact of economic crises on survival
The growth effects of economic crises are depicted in Figure 4.5.2. The values for domestic and foreign firms are quite similar with the exception of early 1990s. The coefficient values are almost the same for domestic and foreign firms in 1994 and 2009, and somewhat lower for foreign firms in 1999 and 2001. These results show that both domestic and foreign firms' growth rates declined significantly during the economic crises93, and the impact on foreign firms is at least as strong as the impact experienced by domestic firms.
Figure 4.5.2 Impact of economic crises on growth
5. Conclusions and policy implications
This research was expected to contribute to the existing literature by presenting new evidence on exit and growth patterns of domestic and foreign firms in the context of Turkish and Italian industries. The question at the core of our analysis was related to the issue of firm exit behaviour and more specifically to understand among the several causes of firm survival and employment, what role FDI are likely to play. In other words, whether foreign direct investment might imply less stable and rooted firms in the economy and might further increase the high rate of mortality of national firms and affect employment negatively. These topics of research have strong relevance to policy given that incentives to FDI and enterprise survival are essential targets of industrial policies. Foreign firms are generally viewed as having potential for both displacement/competition effect as well as spillovers on domestic firms due to linkages effects. Although our results cannot be generalized across countries, periods and sectors, overall, they help us reach a set of conclusions.
There is some evidence of higher hazard of exit of foreign firms relative to domestic ones. Foreign firm’s exit decisions are the result of strategic choices based on opportunity costs, and on sunk investment costs incurred at the initial entry stage. As both these costs (on average) are lower in more traditional sectors the likelihood of foreign firms’ exit tends to be higher in low tech and less knowledge-intensive sectors than in more technology-and knowledge-intensive ones.
FDI influence the quantity of domestic entrepreneurship both in terms of extensive margin (number of firms) and of intensive margin (output and employment growth).
Our results do not support the broad conclusion that FDI have a positive impact on firms’ indigenous survival and growth dynamics. The net effect of foreign firms on domestic establishments’ survival crucially depends on the technological gap, i.e. on
93Note that these are the effects after controlling for the decline in sectoral growth rates during the economic crises.

126
the absorptive capacity of domestic firms. Positive externalities only arise when certain conditions are met regarding the quality/competitiveness of local input suppliers and customers. If this is not the case, foreign firms may be relatively self-sufficient and collaborate little with local firms (foreign firm ‘enclaves’). Under these circumstances, downstream foreign firms might come with fully integrated upstream supply, or upstream foreign firms with fully integrated downstream distribution.
Our study also highlights the role of high knowledge intensity versus low technology intensity. The displacement impact of foreign competition on domestic firms’ survival tends to be higher in high-tech industries compared to low-tech industries due to the higher concentration, more fierce competition and stronger market share/control which characterise more technology intensive sectors.
To sum up, the exit behavior of foreign firms and the impact of FDI on domestic firms is conditional upon some critical features of the host economy and of sectors and firms. In terms of policy, the following implications and reccommendations may be drawn:
First of all, it is crucial to enhance the “resilience” of foreign direct investment, by implementing investment incentives designed to attract more stable foreign multinationals and discourage volatile ventures of foreign investors. Incentive measures should be selective and targeted to the more promising potential investors in terms of duration and of potential knowledge spillovers otherwise policy incentives would only have a temporary effect in terms of economic growth and of job creation. Temporary and volatile FDI have a cost not only in terms of loss of the higher productivity and innovation stimulus brought in but also in terms of sizeable employment destruction in the host country due to the large size of foreign firms typically.
The results for Italy and Turkey, likewise those from analogous studies on other countries, indicate that foreign ownership does not play a positive effect on the likelihood of firm survival “per se”. More than foreignness what matters for survival is the multinational experience because multinational firms start with larger size and employ more capital-intensive technologies thanks to their financial strength, experience in other markets and to other superior firm-level characteristics (skill, wages etc). Policies aimed at increasing firm survival rates hence need to be calibrated taking into account differences in the capacity of firms to survive and to adopt and develop new foreign technologies. Industrial policy should target firm-specific characteristics that are crucial determinants of performance gaps in survival and in firm absorptive capacity: primarily firm size, productivity, innovation and multinational activities.
As we find that the displacement effect is concentrated on high-tech firms, in terms of industrial policy, the target of attracting foreign investment in strategic technology intensive sectors should be combined with the target of developing “domestic” strategic sectors. Technology, innovation and knowledge diffusion are specific complementary policy measures needed for benefitting from FDI spillovers.
Fair market competition policy enforcement and reforms of the institutional setting also appear crucial. The contrast between the experiences of Turkey in the pre-2002 and post-2002 period underline the importance of the institutional setting for firm survival and growth. During the boom-and-bust cycles of the 1990s, the volatility was so high that foreign firms had to exit along with domestic firms. During the more tranquil period of the 2000s, the advantages of foreign firms matter for their higher likelihood of survival. Subsidies and various measures of attraction are conditional on the presence of market impefections and on failure of market mechanisms able to select the better and faster growing enterprises and to building a business system able to attract stable foreign competitors.
These considerations should help policy makers to target specific sectors and priorities and hence on selecting and conditioning FMNE entry. The widespread diffusion of general attraction incentives for FDI as policy instruments is unfortunate. Policy makers need to be able to disentangle the drivers of higher domestic firms survival chances and business growth: local firm features in the host country, firm technological capability, sectors to be targeted, and

127
local conditions need to be carefully examined. This is crucial to enhance spillover effects and to avoid competition/crowding out. Italy and Turkey are two excellent case studies for analyzing to what extent FDI contributes to firm survival, an issue which has received not much attention with respect to other topics related to FDI. Hence, this project was expected to fill a gap in the literature. The studies on the effects of MNEs on domestic firms survival are still poor both with respect to these two countries and to the whole Mediterranean region. Generally, we may consider the countries under investigation as quite representative of the South Mediterranean region in terms of the dynamic of inward FDI over recent years and of their potential consequences on firm structure. Turkey and Italy share many similarity with the countries within the region: recent increasing role of FDI as a source of investment starting from very low levels, large presence of foreign take overs, expecially of public firms by privatizations but more recently also of private domestic enterprises, production systems structure strongly biased towards small and medium enterprises, often belonging to the informal sector, high rate of firm mortality, low ability to compete with foreign investors and on foreign markets, only limited access to external capital, scarce propensity to innovate, a relevant technological gap with respect to foreign firms. The large presence of micro and small firms makes Italy and Turkey an interesting case for analysing the hypothesis according to which small enterprises are hampered in their ability to absorb new technology from inward FDI-related spillovers because of a lack of scientific and technical staff or experience. The firm structure is certainly reducing on the one hand the attractiveness for foreign investors, especially of long term and productive investment, on the other hand,it affects the ability of domestic firms to compete successfully with foreign investors. Therefore, FDI is a potential factor of increase of the already high rate of firm mortality. The small size of firms implies the difficulty of meeting the up-front cost of R&D with only limited access to external capital. The scarce propensity to innovate may suggest the presence of a relevant technological gap with respect to foreign firms that may affect the capacity of firms to exploit technological spillovers from MNEs. Therefore the Italian and the Turkish economy are two interesting case-studies in order to test the effects of inward FDI-related spillovers from MNEs on the absorptive capacity of domestic firms. This is quite relevat to make our results easy to be generalised. Hence, the investigation of this topic for Italy and Turkey might have an important value added for further research on the impact of FDI on South mediterranean countries. The better economic performance and level of development of Italy and Turkey also provide us with a benchmark for future research on the region. Therefore, our results for Turkey and Italy are of pivotal importance for the whole Mediterranean region. Being the volatility of FDI a typical feature of the region, the issue of the footloose behaviour of foreign firms may be extended to it and have important knowledge spillovers. FDI flows within this region vary greatly both across countries and within countries from year to year, depending on investment opportunities including privatisation plans. Hence, the issues under investigation have several implications in terms of policy perspectives and recommendations for the whole Mediterranean region. More specifically, the “footloose” behaviour and the extreme volatility of foreign owned firms, in addition to potential displacement of domestic firms due to a stronger competition effect, is likely to cause a larger firm turn over in the economy. On the one hand, this can be considered a “creative destruction” process, on the other hand, it might worsen the weakness of national and local productive systems. These are relevant policy questions at different levels. Firms shutdowns play a major role in the dynamics of employment and industrial restructuring. Besides, firm’s birth and death contribute to industry productivity growth and shape industry competition. Firm exit is the end point of its life cycle, by ceasing production and displacing workers, firm death/survival directly affects the dynamics of the industry and workers‘ welfare. Therefore, how indigenous firms adjust to the presence of FDI is of great interests to both policy makers and academics.

128
Research questions Methodology Main literature Results for Italy Results for Turkey Conclusions
Policy implications &
measures
Test the hypothesis of foreign multinational enterprises (FMNEs) “foot-loose” behavior in Italy and Turkey comparing survival patterns of foreign owned and domestic firms and identifying distinctive patterns of survival in manufacturing and services, and in high- versus low-technology industries.
Hazard rates for foreign affiliates (FAs) and indigenous firms by Cox proportional hazard models controlling for heterogeneity of both MNEs and domestic firms (global engagement, dimension, productivity, profitability, R&D intensity) and for sectoral variables (market concentration, technology).
Mata and Portugal, 1994 and 2002 for Portugal; Bernard and Sjöholm, 2003 for Indonesia; Görg and Strobl, 2003 for Ireland; Girma and Görg, 2004 for UK; Alvarez And Görg, 2009 for Chile; Bandick, 2010 for Sweden; Van Beveren, 2007 and Blanchard et al. 2012 for Belgium;
-Foreign firms more “foot-loose” compared to their domestic counterparts both in manufacturing and in services, and in low technology intensive as well as in high technology intensive industries. -The likelihood of foreign firms’ exit is higher in low-tech and less knowledge-intensive sectors than in more technology- and knowledge-intensive.
The estimates for the 1983-2001 period reveal that once firm-specific variables are included in the hazard function model, foreign firms appear to be more “foot-loose”. In the 2003-2009 period foreign firms are more likely to survive than domestic firms, but the inclusion of firm-specific variables reduces the impact of foreign ownership on the likelihood of survival.
-Evidence of higher hazard of exit of foreign firms relative to domestic ones. - Foreign firm’s exit decisions are the result of strategic choices based on opportunity costs and on sunk investment costs incurred at the initial entry stage. -The likelihood of foreign firms’ exit tends to be higher in low tech and less knowledge-intensive sectors than in more technology-and knowledge-intensive ones.
-Enhance the “resilience” of foreign direct investment by
incentive measures selective and targeted to the more promising potential investors in terms of duration and of potential knowledge spillovers.
- Discourage volatile ventures of foreign investors.
- Reforms of the institutional setting.
Test the effects of FDI on domestic firms survival and growth disentangling horizontal and vertical spillovers (presence of foreign multinationals in the same sectors or in upstream and downstream industries as input suppliers and customers). Spillover effects or competition/displacement?
Hazard models, GMM system estimates, Heckman selection model.
Caves, 1974; Blomström and Sjöholm, 1998; Görg and Strobl, 2003; De Backer and Sleuwaegen, 2003; Burke, Görg and Hanley, 2008; Girma and Gong, 2008; Bandick, 2010; Wang, 2010; Kosovà, 2010.
-No evidence of significant horizontal and vertical spillovers on survival and on growth. -Foreign firms do not have higher growth rates than domestic firms.
-A higher regional share of foreign firms and an increase in the share of foreign firms in a sector have a negative impact on survival in the 2003-2009 period. - Negative effect on survival if downstream firms are foreign.
FDI influence the quantity of domestic entrepreneurship both in terms of extensive margin (number of firms) and of intensive margin (output and employment growth). But no clearcut evidence that FDI have a positive impact on firms’ indigenous survival and growth dynamics.
-Target firm-specific characteristics crucial determinants of performance gaps in survival and growth: firm size, productivity, innovation and multinational activities.
-Fair market competition policy enforcement.

129
Research questions Methodology Main literature Results for Italy Results for Turkey Conclusions
Policy implications &
measures
Test for the firm absorptive capacity: how the impact of FAs on domestic firms survival and growth varies with technology gap between domestic and foreign firms?
Hazard models, GMM system estimates, Heckman selection model applied to high and low technology gap subsamples of firms.
Studies on FDI spillovers on productivity : Findlay, 1978, Wang and Blomstrom, 1992; Glass and Saggi, 1998; Jabbour and Mucchielli, 2007; Jordaan, 2008.
-Domestic firms that have smaller technology gap vis-à-vis foreign firms benefit from significant horizontal and vertical (upstream) spillovers on survival. -A higher technology gap with respect to foreign firms is found in medium and high tech industries. -Negative impact on domestic firms employment growth if the foreign firm employment share in the sector and in the region increases and if domestic firms have a high technology gap with respect to foreign firms.
The net effect of foreign firms on domestic establishments’ survival crucially depends on the technological gap, i.e. on the absorptive capacity of domestic firms. Positive externalities only arise when certain conditions are met regarding the quality/competitiveness of local input suppliers and customers.
-Detect the drivers of higher domestic firms survival chances and business growth: local firm features in the host country, firm technological capability, sectors to be targeted.
-No general attraction incentives for FDI. Subsidies and various measures of attraction conditional on market impefections and on failure of market mechanisms able to select the better and faster growing enterprises.
How the impact of FAs on domestic firms survival and growth varies with the technological intensity of production?
Hazard models, GMM system estimates, Heckman selection model applied to the two subsamples of firms belonging to high and low technology industries.
Görg and Strobl, 2003; De Backer and Sleuwaegen, 2003; Burke, Görg and Hanley, 2008.
- In low- and medium-tech industries the survival of domestic firms is positively affected by the increased presence of foreign firms within the same industry -Domestic firms in medium-high tech industries have not enough absorptive capacity to benefit from FDI spillovers.
Crucial role of knowledge intensity versus low technology intensity. The displacement impact of foreign competition on domestic firms’ survival tends to be higher in high-tech industries compared to low-tech ones due to the higher technology gap and to more fierce competition and stronger market share/control which characterise more technology intensive sectors.
Technology, innovation and knowledge diffusion as specific complementary policy measures.
Table 5.1 Overview
130
References
Agosin, M., Mayer, J. (2000) Foreign Investment in Developing Countries: does it crowd in domestic investment?, UNCTAD Discussion Paper no. 146.
Aitken, B. J., Harrison, A. (1999) "Do Domestic Firms Benefit from Direct Foreign Investment? Evidence from Venezuela," American Economic Review, American Economic Association, vol. 89(3), June, 605-618
Alfaro, L., Chen, M. (2012) Surviving the global financial crisis: foreign ownership and establishment performance, American Economic Journal: Economic Policy, 4(3): 30-55.
Altomonte, C., Aquilante T. and G.I.P. Ottaviano (2012) “The Triggers of Competitiveness: The EFIGE Cross-Country Report” Bruegel Blueprint n.17.
Alvarez, R., Görg, H. (2009) Multinationals and plant exit: evidence from Chile, International Review of Economics and Finance, 18 (3), 45-51.
Alvarez, R., Görg, H. (2012) “Multinationals as stabilisers? Economic crisis, access to finance and employment growth”, Journal of Development Studies, vol. 48 (7), 847-863.
Amemiya T (1984) “Tobit Models: A Survey." Journal of Econometrics, 24, 3-61.
Antonioli D., Bianchi A., Mozzanti, M., Montresor, S., Pini P. (2011) Economic crisis, innovation strategies and firm performance. Evidence from Italian firm-level data, Paper presented to the SIE annual meeting, 2011.
Athukorala, P. (2003) “FDI in crisis and recovery: lessons from the 1997–1998 Asian crisis”, Australian Economic Review, 43(2) 197–213, doi: 10.1111/1467-8446.t01-1-00051.
Audretsch D.B., Houweling, P., Thurik A. (2000) “Firm Survival in the Netherlands”, Review of Industrial Organization 16(1), 1-11.
Audretsch, D. B. (1991) “New-Firm Survival and the Technological Regime”, Review of Economics and Statistics, Vol. 60, 441-450.
Audretsch, D.B., Mahmood, T. (1995) “New-Firm Survival: New Results using a Hazard Function”, Review of Economics and Statistics, 77 (1), 97-103.
Ayyagari, M., Kosová, R. (2010) “Does FDI Facilitate Domestic Entry? Evidence from the Czech Republic,” Review of International Economics 18:1, 14–29.
Baden-Fuller, C. (1989) “Exit from declining industries and the case of steel castings”, The Economic Journal, 99, 949-961.
Baldwin, J., Beiling Y. (2011) “The death of Canadian manufacturing plants: heterogeneous responses to changes in tariffs and real exchange rates”, Review of World Economics 147 (1), 131-167.
Bandick, R. (2010) “Multinationals and plant survival”, Review of World Economics, 146 (4), 609–634.
Bandick, R., Görg, H. (2010) "Foreign acquisition, plant survival, and employment growth", Canadian Journal of Economics, Canadian Economics Association, vol. 43(2), May, 547-573.
Bandick, R., Karpaty, P. (2011) "Employment effects of foreign acquisition," International Review of Economics & Finance, Elsevier, vol. 20(2), April, 211-224.
Barney, J.B., Wright, M., Ketchen Jr., D.J. (2001), “The resource-based view of the firm: ten years after 1991”, Journal of Management, 27 (6), 625–641.
Basile R., Benfratello L., Castellani D. (2005) “Attracting foreign direct investments in Europe: are Italian regions doomed?”, Rivista di Politica Economica, 95 (1-2), 319-354.
131
Becchetti, L., Trovato G. (2002) “The Determinants of growth for small and medium sized firms: the role of the availability of external finance”, Small Business Economics, 19(4), 291-306.
Bernard, A. B., Jensen J.B. (1999) ”Exceptional exporter performance: cause, effect, or both?”, Journal of International Economics, 47, 1–25.
Bernard, A., Jensen, B. (2007) “Firm structure, multinationals and manufacturing plant deaths”, Review of Economics and Statistics, 89, 193-204.
Bernard, A., Sjöholm, F. (2003) “Foreign owners and plant survival”, NBER working paper 10039.
Blalock, G., Gertler P., Levine, D. (2008) “Financial constraints on investment in an emerging crisis”, Journal of Monetary Economics, 55, 568-591.
Blalock, G., Gertler, P. (2008) “Welfare Gains from Foreign Direct Investment through Technology Transfer to Local Suppliers”, Journal of International Economics, 74, 401-21.
Blanchard, P., Dhyne, E., Fuss, C. and Mathieu, C. (2012) ‘(Not so) easy come, (still) easy go? Footloose multinationals revisited’, National Bank of Belgium, Working Paper No. 223.
Blomström, M. (1986) “Foreign Investment and Productive Efficiency: The Case of Mexico,” Journal of Industrial Economics, 35, 97–110.
Blomström, M., Kokko, A. (1998) “Multinational Corporations and Spillovers”, Journal of Economic Surveys 112, 247-77.
Blomström, M., Sjöholm, F. (1999) “Technology Transfer and Spillovers: Does Local Participation with Multinationals Matter?” European Economic Review 43, 4–6, 915–923.
Borensztein, E., De Gregorio, J., Lee, J. W. (1998) “How Does Foreign Investment Affect Growth?” Journal of International Economics, 45, 115–135.
Bottazzi, G., Grazzi, M., Secchi A., Tamagni, F. (2011) “Financial and economic determinants of firm default”, Journal of Evolutionary Economics, 21(3), 373-406.
Bottazzi, G., Tamagni, F. (2011) “Big and fragile: when size does not shield from default”, Applied Economics Letters, First published on: 15 March 2011, 1-4, doi: 10.1080/13504851.2010.539529.
Bridges, S., Guariglia A. (2008) “Firms in financial distress, a survival model analysis”, Scottish Journal of Political Economy, 55 (4), 444-464.
Bugamelli, M., Cristadoro R., Zevi, G. (2009) “La crisi internazionale e il sistema produttivo italiano: un’analisi su dati a livello di impresa”, Questioni di Economia e Finanza (Occasional Papers), 58, Bank of Italy, Economic Research Department.
Bunn, P., Redwood V. (2003) Company Accounts based modelling of business failures and the implications for financial stability, Bank of England Discussion Paper, n. 210.
Burke, A., Görg, H., Hanley, A. (2008) The impact of foreign direct investment on new firm survival in the UK: evidence for static versus dynamic industries, Small Business Economics, 31, 395-407.
Cantwell, J. (1989) Technological Innovation and Multinational Corporations. Oxford: Basil Blackwell.
Castellani, D., Zanfei, A. (2007) Multinational companies and productivity spillovers: is there a specification error?, Applied Economics Letters, 14, 1047–1051.
Caves, R., 1998. ‘Industrial organization and new findings on the turnover and mobility of firms’, Journal of Economic Literature, 36(4), 1947-1982.
Caves, R.E. (1974) “Multinational Firms, Competition and Productivity in Host Country Markets,” Economica 41, 176–193.
Chung, C., Lu, J. and Beamish, P. (2008) ‘Multinational networks during times of economic crisis versus stability’, Management International Review, 48: 279-296.

132
Cingano, F., Torrini, R., Viviano, E. (2010) “The crisis and employment in Italy”, Questioni di Economia e Finanza (Occasional Papers), 68, Bank of Italy, Economic Research Department.
Colombo, E. (2001) “Determinants of corporate capital structure: evidence from Hungarian firms”, Applied Economics, 33 (13), 1689–701.
Colombo, M. G., Delmastro, M. (2000) “A note on the relation between size, ownership status and plant’s closure: sunk costs vs. strategic size liability”, Economic Letter, 69 (3), 421-427.
Comanor, W.S., Wilson, T.A. (1967) “Advertising, market structure, and performance”, The Review of Economics and Statistics, 9 (4), 423–440.
Contini, B., Revelli, R. (1989) “The Relationship Between Firm Growth and Labor Demand”, Small Business Economics, 1(4), 309-314.
Cox, D. R. (1972) ‘‘Regression Models and Life Tables,’’ Journal of the Royal Statistical Society, Series B, 34, 187–220.
Criscuolo, C., Martin, R. (2009) “Multinationals and U.S. productivity leadership: evidence from Great Britain”, The Review of Economics and Statistics, 91, 263-281.
De Backer, K., Sleuwaegen, L. (2003) "Does Foreign Direct Investment Crowd Out Domestic Entrepreneurship?," Review of Industrial Organization, Springer, vol. 22(1) February, 67-84.
De Santis R., Vicarelli, C. (2001) "Fattori di attrazione degli investimenti diretti esteri nell’Unione Europea: il ruolo del contesto istituzionale e la competitività dell’Italia," Rivista di Politica Economica, SIPI Spa, vol. 91(3) March, 3-32.
Desai, M. A., Foley, C., Forbes, K.J. (2008) “Financial constraints and growth: multinational and local firm responses to currency depreciations”, Review of Financial Studies, 21(6), 2857-2888.
Desai, M. A., Foley, C., Forbes, K.J. (2004) “Financial constraints and growth: multinational and local firm responses to currency crises”, National Bureau of Economic Research, Working Paper No. 10545, 19.
Dimelis, S. (2005) “Spillovers from Foreign Direct Investment and Firm Growth: Technological, Financial and Market Structure Effects”, International Journal of the Economics of Business, 12, 85–104.
Disney, R., Haskel, J., Heden Y. (2003) “Entry, exit and establishment survival in UK manufacturing”, Journal of Industrial Economics, 51(2), 91–112.
Dixit, A., Pindyck, R. (1994) Investment under Uncertainty, Princeton University Press, Princeton.
Djankov, S., Hoekman, B. (2000) “Foreign Investment and Productivity Growth in Czech Enterprises,” World Bank Economic Review, 14, 49–64.
Doms, M., Jensen, B. (1998) “Comparing wages, skills, and productivity between domestically and foreign-owned manufacturing establishments in the United States”’, in Baldwin, R, Lipsey, R. and Richardson, D. (1998) Comparing wages, skills, and productivity between domestically and foreign-owned manufacturing establishments in the United States. Chicago: University of Chicago press.
Dunne, T., Roberts, M.J., Samuelson, L. (1989) “The growth and failure of US manufacturing plants”, Quarterly Journal of Economics, 104 (4), 671–698.
Dunne, T., Roberts, M. J., Samuelson, L. (1988) “Patterns of firm entry and exit in US manufacturing industries”, Rand Journal of Economics, 19, 495-515.
Dutz, M., Us, M., Yılmaz, K. (2005) “Foreign direct investment challenges: Competition, the rule of law, and EU accession,” (In B. Hoekman, & S. Togan (Eds.) Turkey: Economic reform and accession to the European Union (pp.261-293) Washington D.C.: The World Bank, & CEPR).
Erdilek, A. (1986) “Turkey’s new open-door policy of direct foreign investment: A critical analysis of problems and prospects,” METU Studies in Development, 13, 171-191.

133
Esteve Pérez, S., Mañez Castillejo, J. (2008) “The resource-based theory of the firm and firm survival“, Small Business Economics, 30, 231-249.
Esteve Pérez, S., Sanchis Llopis, A., Sanchis Llopis, J. A. (2004) “The determinants of survival of spanish manufacturing firms”, Review of Industrial Organization, 25, 251-73.
EUROSTAT (2009) “Business Demography: Employment and Survival“, Statistics in focus, 70.
Fabbri, F., Haskel, J. E., Slaughter, M. J. (2003) “Does Nationality of Ownership Matter for Labor Demands?”, Journal of the European Economic Association, 1 (2-3), 698-707.
Fabiani, S., Sabatini, R. (2011) “Wage adjustment by Italian firms: any difference during the crisis? A survey-based analysis”, Questioni di Economia e Finanza (Occasional Papers), 58, Bank of Italy, Economic Research Department. Banca d’Italia, Occasional Papers, Number 94, June 2011.
Ferragina, A., Pittiglio, R., Reganati, F. (2011) “Multinational status and firm exit in the Italian manufacturing and service sectors”, Structural Change and Economic Dynamics, doi:10.1016/j.strueco.2011, 10.002.
Findlay, R. (1978) “Relative backwardness, direct foreign investment and the transfer of technology: a simple dynamic model”, Quarterly Journal of Economics, 92, 1-16.
Flamm, K. (1984) “The volatility of offshore investment”, Journal of Development Economics, 16(3), 231–248.
Fotopoulos, G., Louri, H. (2000) “Determinants of hazard confronting new entry: does financial structure matter?”, Review of Industrial Organization, 17(3), 285- 300.
Fukao, K. (2001) “How Japanese subsidiaries in Asia responded to the regional crisis—an empirical analysis based on the MITI survey”, in T. Ito and A. Kruger (Eds.) Regional and global capital flows: Macroeconomics causes and consequences, NBER-EASE vol. 10 NBER Books.
Gelübcke, W., John P. (2011) “The Performance of Foreign Affiliates in German Manufacturing: Evidence from a new Database”, University of Lüneburg, Working Paper Series in Economics, No. 216, October.
Geroski, P. A. (1995) "What do we know about entry?," International Journal of Industrial Organization, Elsevier, vol. 13(4), December, 421-440.
Gibrat, R.(1931) Les Inegalites Economiques, Paris, Librairie du Recueil Sirey.
Gibson, J. K., Harris, R. I.D. (1996) “Trade Liberalisation and Plant Exit in New Zealand Manufacturing”, The Review of Economics and Statistics, MIT Press, 78, 521- 29.
Giovannetti, G., Ricchiuti, G., Velucchi, M. (2009) “Size, innovation and internationalization: a survival analysis of Italian firms”, Applied Economics, 41, 1466-4283.
Girma, S., Gong, Y. (2008) “Putting People First? Chinese State-Owned Enterprises' Adjustment to Globalisation”, International Journal of Industrial Organization, 26(2), 573-85.
Girma, S., Görg, H. (2004) “Blessing or Curse? Domestic Plants‘ Survival and Employment Prospects after Foreign Acquisition”, Applied Economics Quarterly, 50(1), 89-110.
Glass, A.J., Saggi, K.(1998) "International technology transfer and the technology gap," Journal of Development Economics, Elsevier, vol. 55(2), pages 369-398, April.
Godart, O., Görg H., Hanley, A. (2012) “Surviving the crisis: foreign multinationals vs domestic firms in Ireland”, The World Economy, doi: 10.1111/j.1467-9701.2012.01485.x., also published in CEPR, DP8596, October 2011
Gokcekus, O. (1997) “Trade Liberalization and Productivity Growth: New Evidence from the Turkish Rubber Industry”, Applied Economics, 29, 639-645.

134
Görg H., Strobl, E. (2005) “Foreign direct investment and local economic development: beyond productivity spillovers”, in Does Foreign Direct Investment Promote Development? (Eds.) T.H. Moran, E. M.Graham and M. Blomström, PIIE, Washington D.C.
Görg, H., Greenaway, D. (2004) “Much Ado about Nothing? Do Domestic Firms Really Benefit from Foreign Direct Investment”, World Bank Observer, 19.
Görg, H., Spaliara M.E. (2009) “Financial health, exports and firm survival: A comparison of British and French firms” Kiel Working Paper, No. 1568, October.
Görg, H., Strobl, E. (2003) “Footloose multinationals?”, The Manchester School, 71(1), 1-19.
Görg, H., Strobl, E. (2003) “Multinational companies, technology spillovers and plant survival”, Scandinavian Journal of Economics, 105, 581–595.
Görg, H., Strobl, E. (2004) “Foreign direct investment and local economic development: beyond productivity spillovers”,. GEP The Leverhulme Centre for Research on Globalisation and Economic Policy, University of Nottingham.
Gorodnichenko, Y., Svejnar, J., Terrell, K., (2007) "When Does FDI Have Positive Spillovers? Evidence from 17 Emerging Market Economies", IZA Discussion Papers 3079, Institute for the Study of Labor (IZA)
Greenaway, D., Guariglia, A., Kneller, R. (2007) “Financial factors and exporting”, Journal of International Economics, 73(2), 377-395.
Greenaway, D., Gullstrand, J., Kneller, R. (2008) “Surviving globalisation”, Journal of International Economics 74(2), 264-277.
Greene, W. H. (2008) Econometric analysis, 7th edition, Stern.
Guariglia, A., Mateut, S. (2005) “Inventory investment, global engagement and financial constraints in the UK: evidence from micro data”, GEP Research Paper 05/23, Leverhulme Centre for Research on Globalization and Economic Policy, University of Nottingham.
Haddad, M., Harrison, A.E.(1993) “Are There Positive Spillovers from FDI? Evidence from Panel Data for Morocco”, Journal of Development Economics 42, 51–74.
Hamida, L.B., Gugler, P. (2009) “Are there demonstration-related spillovers from FDI? Evidence from Switzerland”, International Business Review, 18, 494–508.
Hanousek, J., Kočenda E., Maurel, M. (2010) Direct and Indirect Effects of FDI in Emerging European Markets: A Survey and Meta-analysis.
Harrison, A., McMillan, M. (2003) “Does direct foreign investment affect domestic firms credit constraints?”, Journal of International Economics, 61(1), 73-100.
Heckman, J. J. (1976) ‘‘The Common Structure of Statistical Models of Truncation, Sample Selection, and Limited Dependent Variables and a Simple Estimator for Such Models’’, Annals of Economic and Social Measurement 5, 475–492.
Helpman, E., Melitz, M. J., Yeaple, S. R. (2004) “Export vs. FDI with heterogeneous firms”, American Economic Review, 94, 300-316.
Hopehayn, R. (1992) “Entry, exit and firm dynamics in long run equilibrium”, Econometrica, 60, 1127-1155.
ICE (2010) “L’Italia nell’economia internazionale”, Rapporto ICE, 2009-2010.
Imbriani, C., Reganati, F. (2002) “Do multinational enterprises affect domestic firms’ productivity”, Studi Economici, 5-18.
Inui, T., Kneller, R., Matsuura, T., McGowan, D. (2009) Globalization, productivity and plant exit - evidence from Japan, E.S.R.I., Cabinet Office and Nihon University.

135
ISTAT (2008) “Archivio Statistico delle Imprese Attive”, Italian National Institute of Statistics, Roma.
ISTAT (2008) “La demografia d’impresa. Anni 2001-2006”, Statistiche in breve, Roma.
ISTAT (2009) “Struttura e attività delle imprese a controllo estero - Anno 2009”. Statistiche in breve, Italian National Institute of Statistics, Roma.
ISTAT (2010) “Struttura e attività delle imprese a controllo estero - Anno 2008”. Italian National Institute of Statistics, Roma.
Jabbour, L., Mucchielli, J.L. (2007) “Technology transfer through vertical linkages: the case of the Spanish manufacturing industry”. Journal of Applied Economics X, 115-136.
Javorcik B.S., Spatareanu, M. (2008) “To Share or not to Share: Does Local Participation Matter for Spillovers from Foreign Direct Investment?” Journal of Development Economics, 85(1-2), 194-217.
Javorcik, B.S. (2004) “Does Foreign Direct Investment Increase the Productivity of Domestic Firms?” In Search of Spillovers through Backward Linkages, American Economic Review, 94(3): 605-627.
Jenkins, S.P. (2005) Survival Analysis, mimeo, University of Essex.
Jordaan, J.A. (2008) “Intra- and inter-industry externalities from foreign direct investment in the Mexican manufacturing sector: new evidence from Mexican regions”, World Development 36, 2838–54 43, 574–655.
Jovanovic, B. (1982) “Selection and the evolution of industry”, Econometrica, 50, 649-70.
Kimura F., Fujii, T. (2003) “Globalizing activities and the rate of survival: panel data analysis on Japanese firms”, Journal of Japanese International Economies, 17(2), 538–560.
Kimura, F., Kiyota, K. (2006) “Exports, FDI, and productivity: dynamic evidence from Japanese Firms”, Review of World Economics , 142, 695-719.
King, G., Zeng, L. (2001a) “Explaining rare events in international relations. International Organization”, 55, 693–715.
King, G., Zeng, L. (2001b) “Logistic regression in rare events data”, Political Analysis, 137–63.
Kokko, A. (1994) “Technology, market characteristics, and spillovers”, Journal of Development Economics, 43, 279– 293.
Kolasa, M., Rubaszek, M., Taglioni D. (2010) “Firms in the great global recession: the role of foreign ownership and financial dependence”, National Bank of Poland, Working Paper, n. 77.
Konings, J. (2001) “The Effects of Foreign Direct Investment on Domestic Firms: Evidence from Firm Panel Data in Emerging Economies”, Economics of Transition 9, 619–33.
Kosová, R. (2010) “Do Foreign Firms Crowd Out Domestic Firms? Evidence from the Czech Republic”, Review of Economics and Statistics, November 2010, Vol. 92, No. 4, 861-881.
Kosová, R., Ayyagari, M. (2010) “Does FDI facilitate Domestic Entrepreneurship? Evidence from the Czech Republic”, Review of International Economics, Volume 18, Issue 1, February, 14–29.
Köymen, S., Sayek, S. (2010) “The Role of Human Capital in Productivity Spillovers from FDI:AN Empirical Analysis on Turkish Manufacturing Firms”, Bilkent University, Department of Economics, Discussion papers, no: 10-03.
Kronborg, D., Steen T. (2009) “Foreign Ownership and Long-Term Survival”, Strategic Management Journal, 30 (2), 207-219.
Kugler, M. (2008) “Spillovers from Foreign Direct Investment: Within or Between Industries?” Journal of Development Economics, 80 (2006), 444–77.
136
Langer, A., Taymaz, E. (2006) “To innovate or to transfer? A study on spillovers and foreign firms in Turkey”, Journal of Evolutionary Economics, 16, 137-153.
Li, G., Guisinger S. (1991) “Comparative Business Failures of Foreign-Controlled Firms in the United States”, Journal of International Business Studies, 22 (2), 209-224.
Lileeva, A. (2010) “Global links: the benefits to domestically controlled plants from inward direct investment – the role of vertical linkages” Canadian Journal of Economics, 01/2010, 43(2), 574-603.
Lipsey, R. (2001) “Foreign investment in three financial crisis”, NBER Working Papers 8084, Cambridge, MA: National Bureau of Economic Research.
Lipsey, R. (2002) “Home and Host Country Effects of FDI”, NBER Working Paper, No. W9293.
Lotti, F., Santarelli, E., Vivarelli, M. (2003) "Does Gibrat's Law hold among young, small firms?," Journal of Evolutionary Economics, Springer, August, vol. 13(3), 213-235.
Lotti, F., Santarelli, E., Vivarelli, M. (2009) “Defending Gibrat’s Law as a long-run regularity”, Small Business Economics, 32, 31–44.
Maddala, G. S. (1983) Limited Dependent and Qualitative Variables in Econometrics, Cambridge: Cambridge University Press.
Mansfield, E. (1962) “Entry, Gibrat’s Law, Innovation, and the Growth of Firms”, American Economic Review, 52, 1023–1051.
Markusen, J R., Venables, A. J. (1999) "Foreign direct investment as a catalyst for industrial development", European Economic Review, Elsevier, February , vol. 43(2), 335-356.
Markusen, J. R. (2002) "Multinational Firms and the Theory of International Trade", MPRA Paper 8380, University Library of Munich, Germany.
Mata J., Portugal, P. (1994) “Life duration of new firms”, Journal of Industrial Economics, 42, 227–246.
Mata, J., Portugal, P. (2002) “The survival of new domestic and foreign-owned firms”, Strategic Management Journal, 23, 323-343.
McAleese, D., Counahan, M. (1979) “Stickers or snatchers? Employment in multinational corporations during recessions”, Oxford Bulletin of Economics and Statistics, 41, 345–358.
Melitz, M. J. (2003) “The Impact of trade on intra-industry reallocations and aggregate industry productivity”, Econometrica, 71(6), 1695-1725.
Monducci, R., Anitori, P., Oropallo F., Pascucci C. (2010) “Crisi e ripresa del sistema industriale italiano: tendenze aggregate ed eterogeneità delle imprese”, Economia e Politica Industriale, 37 (3), 93-116.
Mundlak, Y. (1978) “On the Pooling of Time Series and Cross Section Data’’, Econometrica 46, 69–85.
Narjoko, D., Hill, H. (2007) “Winners and losers during a deep economic crisis: firm-level evidence from Indonesian manufacturing” Asian Economic Journal 21(4), 343–368.
Nicolini, M., Piscitello, L. (2009) "Esternalita' e spillovers verticali indotti dall'ingresso di imprese estere nei settori dei servizi in Italia", Rivista Italiana degli Economisti, SIE - Societa' Italiana degli Economisti (I), August, vol. 14(2), 234-266.
Öniş, Z. (1994) “Liberalization, transnational corporations and foreign direct investment in Turkey: The experience of the 1980s,” (In Ş. Fikret (Ed.) Recent industrialization experience of Turkey in a global context, Westport, Connecticut and London: Greenwood Press, 91-109.
Özler, S., Taymaz, E. (2004) “Does foreign ownership matter for survival and growth? Dynamics of competition and foreign direct investment”, Economic Research Centre Working Paper no. 04/06.

137
Özler, S., Taymaz, E. (2007) “Foreign ownership, competition and survival dynamics”, Review of Industrial Organization 31 (1), 23-42.
Özler, S., Yilmaz, K. (2009) “Productivity Response to Reduction in Trade Barriers: Evidence from Turkish Manufacturing Plants”, Review of World Economics, July, Vol. 145, No. 2, 339-360.
Pérez, S.E., Sanchis Llopis, A. Sanchis Llopis J.A. (2004) “The Determinants of Survival of Spanish Manufacturing Firms”, Review of Industrial Organization, 25 (3), 251-273.
Pittiglio, R., Reganati, F., Sica, E.(2008) Horizontal and Vertical Spillovers from FDI in the Italian Productive System, Quaderni DSEMS 08-2008, University of Foggia.
Reganati, F., Sica, E. (2007) “Horizontal and Vertical Spillovers from FDI: Evidence from panel data for the Italian manufacturing sector”, Journal of Business Economics and Management, 8, 259-266.
Rodriguez-Clare, Andres (1996), “Multinationals, linkages and economic development”, American Economic Review 86, 852–73.
Santarelli E., Vivarelli M. (2007) "Entrepreneurship and the process of firms’ entry, survival and growth”, Industrial and Corporate Change, Oxford University Press, June, vol. 16(3), 455-488.
Sato, Y. (2000) “How did the crisis affect small and medium sized enterprises? From a field study of the metal-working industry in Java”, The Developing Economies, XXXVIII (4), 572–595.
Scuola Superiore della Pubblica Amministrazione (2008) “Foreign Direct Investment (FDI) in Italy: What are the causes of the current low levels?”, in collaboration with the London School of economics and with the Dipartimento della Funzione Pubblica e Laboratorio di Regolazione, Pubblica Amministrazione e Sviluppo socio-economico in Europa RePALab, Final Report Draft, Rome, 30 January 2008.
Semykina, N. Wooldridge, M. (2010), “Estimating Panel Data Models in the Presence of Endogeneity and Selection”, Journal of Econometrics 157, August 2010, 375-380.
Semykina, N. Wooldridge, M. (2011) “Estimation of Dynamic Panel Data Models with Sample Selection” forthcoming in the Journal of Applied Econometrics.
Simpson, H. (2008) “Investment Abroad and Adjustment at Home: evidence from UK multinational firms”, The Centre for Market and Public Organization 08/207, Dept. of Economics, University of Bristol.
Solinas, G. (1995) “Le imprese nuove nate e la legge di Gibrat”, Economia e Lavoro, 26(1), 117-139.
Strotmann, H. (2007) “Entrepreneurial survival”, Small Business Economics, 28, 87-104.
Takii, S. (2005) “Productivity spillovers and characteristics of foreign multinational plants in Indonesian manufacturing 1990–1995”, Journal of Development Economics, 76, 521– 542.
Taymaz, E. (2005) “Are small firms really less productive? An analysis of productivity differentials and firm dynamics.” Small Business Economics, 25, 429-445.
Taymaz, E., Suiçmez, H. (2005) “Türkiye’de Verimlilik, Büyüme ve Kriz, 4”, Verimlilik Raporu, MPM, Ankara.
Taymaz, E., Yilmaz, K. (2007) “Trade Orientation and Productivity: Turkish Manufacturing Industry Before and After the Customs Union,” Journal of International Trade and Diplomacy, 1(1), 127-154.
Taymaz, E., Ozler, S. (2009) “Foreign ownership, competition, and survival dynamics”, Journal of Industrial Economics.
Taymaz, E., Saatçi, G. (1997) “Technical Change and Efficiency in Turkish Manufacturing Industries”, Journal of Productivity Analysis, 8, 461-475.
Taymaz, E., Voyvoda, E., Yilmaz, K. (2008) Türkiye İmalat Sanayiinde Yapısal Dönüşüm ve Teknolojik Değişme Dinamikleri, (Structural Transformation and the Dynamics of Technological

138
Change in the Turkish Manufacturing Industry) ERC - Economic Research Center, Middle East Technical University, Working Papers 0804, June 2008.
Taymaz, E., Voyvoda, E., Yilmaz, K. (2009) “Transition to Democracy, Real Wages and Productivity: Evidence from the Turkish Manufacturing Industry”, METU and Koc University.
Taymaz, E., Voyvoda, E., Yilmaz, K. (2010) “Global Links and Local Bonds: The Role of Ownership and Size in Productivity Growth,” TUSIAD-Koç University Economic Research Forum, Working Paper, 1020, June.
Taymaz, E., Yilmaz, K. (2009) “Foreign Direct Investment and Productivity Spillovers Identifying Linkages through Product-based Measures,” mimeo, Koc University.
Tong, H., Wei S.J. (2010) “The composition matters: capital inflows and liquidity crunch during a global economic crisis”, Hong Kong Institute For Monetary Research, Working Paper No.17/2010, June.
UNCTAD (2009) World Investment Report, Geneve.
UNCTAD (2012) World Investment Report, Geneve.
Van Beveren, I. (2007) “Footloose multinationals in Belgium?”, Review of World Economics, 143, 483-507.
Vartia, L. (2004) Assessing plant entry and exit dynamics and survival – Does firms’ financial status matter? Mimeograph, European University Institute.
Varum, C. A., Rocha, V. C. (2011) “Do foreign and domestic firms behave any different during economic slowdowns?” International Business Review, 20(1) 48–59.
Wagner, J. (1994) “The Post-entry performance of new small firms in German manufacturing industries”, Journal of Industrial Economics, 42(2) 141-54.
Wagner, J. (2011) “Exports, imports and firm survival: first evidence for manufacturing enterprises in Germany”, University of Lüneburg, Working Paper Series in Economics, No. 211, August, also published as IZA Discussion Paper, No. 5924.
Wagner, J., Gelübcke, W., Philipp J. (2011) "Foreign Ownership and Firm Survival: First Evidence for Enterprises in Germany", IZA Discussion Papers6207, Institute for the Study of Labor (IZA).
Wang, J., Blomstrom, M. (1992) "Foreign investment and technology transfer: A simple model," European Economic Review, Elsevier, vol. 36(1), 137-155, January.
Wang, H., Huang, H., Bansal, P. (2005) “What determined success during the Asian economic crisis? The importance of experiential knowledge and group affiliation” Asia Pacific Journal of Management, 22(1), 89–106.
Wang, Y. (2010) “Exposure to FDI and New Plant Survival: Evidence in Canada” CEP 10-05, Carleton Economic Papers, Carleton University.
Wang, Y. (2010) “FDI and Productivity Growth: The Role of Inter-Industry Linkages” Canadian Journal of Economics.
Wengel, J., Rodriguez, E. (2006) SME export performance in Indonesia after the crisis. Small Business Economics, 26(1), 25–37.
Wooldridge, J. M. (2002) Econometric Analysis of Cross-Section and Panel Data. Cambridge: MIT Press.
Wooldridge, J.M. (1995) “Selection corrections for panel data models under conditional mean independence assumptions”, Journal of Econometrics, 68, 115- 132.
World Economic Forum (2012) “Global Trade Enabling 2012”.

139
Yasar M., Rejesus R. M., Nelson C. (2003) “Productivity and exporting status of manufacturing firms: Evidence from quantile regression”, Emory University Department of Economics Working Paper 03-23, October.
Yasar, M., Garcia, P., Nelson, C. H., Rejesus, R. M. (2007) “Is there evidence of learning-by-exporting in Turkish manufacturing industries”, International Review of Applied Economics, 21(2) 293–305.
Yaşar, M., Rejesus, R. M., Mintemur, I. (2004) “Is there Evidence of Creative Destruction in the Turkish Manufacturing Sector? Lessons from a Cross-industry Analysis of Aggregate Productivity Growth”, Applied Economics, 36, 1937-1945.
Zingales, L. (1998) “Survival of the fittest or the fattest? Exit and financing in trucking industry”, Journal of Finance, 53(3), 905-938.

140
CELPE’s Discussion Papers
2013, 126 Adalgiso Amendola, Roberto Dell’Anno
Social Exclusion and Economic Growth: An Empirical Investigation in European Economies
2013, 125 Anna PAPACCIO
Bilateralism and Multilateralism: a Network Approach
2013, 124 Claudio PINTO
Complexity of Treatment, and Changes in Efficiency and Productivity for Directly Managed Italian Hospitals
2012, 123 Giorgia IOVINO
Il Mezzogiorno e la sfida delle energia rinnovabili
2012, 122 Roberto DELL’ANNO, Stefania VILLA
Growth in Transition Countries: Big Bang versus Gradualism
2012, 121 Lavinia PARISI
The Determinants of First and Second Marital Dissolution. Evidence from Britain
2010, 120 Salvatore FARACE, Fernanda MAZZOTTA
Bivariate Probit Models for Analysing how “Knowledge” Affects nnovation and Performance in Small and Medium Sized Firms
2010, 119 Marcello D’AMATO, Christian DI PIETRO
The Evolution of Wealth Distribution in a Model of Educational Investment with Heterogenous Agents
2010, 118 Paolo COCCORESE
Banks as 'fat cats': Branching and Price Decisions in a Two-Stage Model of Competition
2010, 117 Sergio DESTEFANIS, Giovanni PICA
The Wage Curve an Italian Perspective
2010, 116 Adalgiso AMENDOLA, Joshy EASAW, Antonio SAVOIA
Inequality in Developing Economies: The Role of Institutional Development
2010 115 Gianluigi COPPOLA
Health, Lifestyle and Growth
2010 114 Teresa AMODIO
Methods of Analysis of Local Tourist Systems
2009 113 Fernanda MAZZOTTA
The Effect of Parental Background on Youth Duration of Unemployment
2009 112 Matteo FRAGETTA
Identification in Structural Vector Autoregressions Through Graphical Modelling and Monetary Policy: A Cross-Country Analysis
2009 111 Bruna BRUNO, Damiano FIORILLO
Why without Pay? The Intrinsic Motivation between Investment and Consumption in Unpaid Labour Supply
2009 110 Maria Rosaria GAROFALO, Annamaria NESE
Social Preferences and the Third Sector: Looking for a Microeconomic Foundation of the Local Development Path
2008 109 Giorgia IOVINO
Gis, ricerca geografica e pianificazione urbanistica: un’applicazione sul centro storico di Benevento
2008 108 Bruna BRUNO
La donna flessibile e il lavoro opportuno
2008 107 Damiano FIORILLO
Offerta di Attività Gratuita in Italia: una analisi micro-econometrica

141
2007, 106 Shane Niall O'HIGGINS, Marcello D'AMATO, Floro Ernesto CAROLEO, Adriana BARONE
Gone for Good? Determinants of School Dropout in Southern Italy
2007, 105 Ugo COLOMBINO, Annamaria NESE
Preference Heterogeneity in Relation to Museum Services
2007, 104 Giuseppe CELI, Mario SPORTELLI
Harrod’s Dynamics and the Kaldor-Thirlwall Export-led Growth
2007, 103 Francesca BETTIO, Fernanda MAZZOTTA, Giovanni SOLINAS
Costs and prospects for home based Long Term Care in Northern Italy: the Galca survey
2007, 102 Lisa CROSATO, Sergio DESTEFANIS, Piero GANUGI
Technology and Firm Size Distribution: Evidence from Italian Manufacturing
2007, 101 Guglielmo Maria CAPORALE, Alexandros KONTONIKAS
The Euro and Inflation Uncertainty in the european Monetary Union
2006, 100 Francesco Paolo VOLPE
Principio democratico e giustizia nell'amministrazione
2006, 99 Niall O’HIGGINS
Still With Us After All of These Years: Trends in Youth Labour Market Entry, Home-Leaving And Human Capital Accumulation in Italy 1993-2003
2005, 98 Floro Ernesto CAROLEO, Gianluigi COPPOLA
The Impact of the Institutions on Regional Unemployment Disparities
2005, 97 Carlo ALTAVILLA, Antonio GAROFALO, Concetto Paolo VINCI
Is the Discouraged Worker Effect Time-Varying?
2005, 96 F. BUSATO, B. CHIARINI, P. DE ANGELIS, E. MARZANO
Capital Subsidies and Underground Production
2005, 95 Lucio Valerio SPAGNOLO, Mario CERRATO
o euro please, We’re British!
2005, 94 Roberto BASILE, Mauro COSTANTINI, Sergio DESTEFANIS
Unit root and cointegration tests for cross-sectionally correlated panels. Estimating regional production functions
2005, 93 Sergio DESTEFANIS, Raquel FONSECA
Matching Efficiency and Labour Market Reform in Italy. A Macroeconometric Assessment
2005, 92 Cesare IMBRIANI, Antonio LOPES
Banking System Efficiency and the Dualistic Development of the Italian Economy in the Nineties
2005, 91 Carlo ALTAVILLA, Antonio GAROFALO, Concetto Paolo VINCI
Designing the Optimal Lenght of Working Time
2005, 90 Marco MANACORDA, Barbara PETRONGOLO
Regional Mismatch and Unemployment: Theory and Evidence from Italy, 1977-1998
2004, 89 Roberta TROISI
eoria dell’impresa e responsabilità parapenale: le implicazioni organizzativo-gestionali
2004, 88 Roberta TROISI
Enti non profit: tipologie ed opzioni organizzative
2004, 87 Lavinia PARISI
La povertà: una rassegna sul confronto tra due approcci. Capability vs. Unidimensionalità
2004, 86 Giuseppe CELI
Quality Differentiation, Vertical Disintegration and the Labour Market Effetcs of Intra-Industry Trade
2004, 85 Niall O’HIGGINS
Recent Trends in Youth Labour Martkets and Employment Policy in Europe and Central Asia

142
2004, 84 Carlo ALTAVILLA, Floro Ernesto CAROLEO
Evaluating Asimmetries in Active Labour Policies: The Case of Italy
2004, 83 Floro Ernesto CAROLEO, Francesco PASTORE
La disoccupazione giovanile in Italia. La riforma dei sistemi d'istruzione e di formazione professionale come alternativa alla flessibilità numerica per accrescere l'occupabilità
2004, 82 Francesco PASTORE, Izabela MARCINKOWSKA
The Gender Wage Gap among Young People in Italy
2004, 81 Elisabetta MARZANO
Dual Labour Market Theories And Irregular Jobs: IsThere a Dualism Even in The Irregular Sector?
2004, 80 Corrado ANDINI
Unemployment and Welfare Partecipation in a Structural VAR: Rethinking the 1990s in the United States
2004, 79 Floro Ernesto CAROLEO
Fondamenti teorici della rigidità salariale nell'ambito dei "Non Market clearing Models"
2004, 78 Adalgiso AMENDOLA, Floro Ernesto CAROLEO, Gianluigi COPPOLA
Regional Disparities in Europe
2003, 77 Fernanda MAZZOTTA
Flessibilità, povertà e istruzione: un approccio Sen – istituzionale
2003, 76 Adalgiso AMENDOLA, Annamaria NESE
Mobilità intergenerale nel livello d'istruzione nella società femminile italiana ed endogenità del titolo di studio in un modello di partecipazione alla Forza Lavoro.
2003, 74 Antonio LOPES
Innovazione nel Sistema Creditizio del Mezzogiorno negli Anni Novanta
2003, 73 Sergio DESTEFANIS, Vania SENA
Public Capital and Total Factor Productivity New Evidence from the Italian Regions
2003, 72 Giuseppina AUTIERO, Bruna BRUNO
Social Preferences in Wage Bargaining: a Neocorporatist Approach
2003, 71 Gianluigi COPPOLA, Maria Rosaria GAROFALO, Fernanda MAZZOTTA
Industrial Localisation and Economic Development. A Case Study
2002, 70 Francesco GIORDANO, Fernanda MAZZOTTA
alario di iserva, Probabilità di ccupazione ed Efficacia dell’ struzione niversitaria: un’Analisi sugli tudenti dell’ niversità di alerno
2002, 69 Giuseppe RUSSO
stituzioni del Mercato del Lavoro e ccupazione: dai Costi di Aggiustamento all’Appropriabilità
2002, 68 Floro Ernesto CAROLEO, Francesco PASTORE
Training Policy for Youth Unemployed in a Sample of European Countries
2002, 67 Maria Rosaria GAROFALO, Maria Rosaria SUPINO
Il Disegno Normativo del Welfare Municipale in Italia come Strumento per lo Sviluppo Economico e l’Allargamento delle pportunità ccupazionali. na Lettura eoistituzionale della L. 328/00
2002, 65 Pietro SENESI
Cyclical dynamics under continuous time equilibrium
2001, 64 Marcello D'AMATO, Vincenzo GALASSO
E' la Riforma Dini Politicamente Sostenibile?
2001, 63 Sergio DESTEFANIS, Ornella Wanda MAIETTA
Assessing the Productive Efficiency of Non-Profit Organisations: a Comparative Analysis
2001, 62 Floro Ernesto CAROLEO, Francesco PASTORE
How fine targeted is ALMP to the youth long term unemployed in Italy?
143
2001, 61 Paolo COCCORESE
Strategic Advertising for Entry Deterrence Purposes
2001, 60 Alessandra AMENDOLA
Modelling Asymmetries in Unemployment Rate
2001, 59 Sergio DESTEFANIS
Differenziali Territoriali di Produttività ed Efficienza negli Anni '90: i Livelli e l'Andamento
2001, 58 Giuseppina AUTIERO, Fernanda MAZZOTTA
Job Search Methods: the Choice between the Public and the Private Sector
2001, 57 Giuseppina AUTIERO, Bruna BRUNO, Fernanda MAZZOTTA
A Correspondence Analysis of Labour Market Institutions
2000, 56 Giuseppina AUTIERO
Governmental Organized Learning and Coordination Problems: The case of Japan in1950s
2000, 55 Giuseppina AUTIERO, Fernanda MAZZOTTA
The Choice of Search Methods: Some Empirical Evidence from Italy
2000, 54 Giuseppe CELI
The Impact of International Trade on Labour Markets. The Case of Outward Processing. Traffic between the European Union and Central Eastern European Countries.
2000, 53 Giuseppe RUSSO, David VEREDAS
Institutional Rigidities and Employment on the Italian Labour Market: the Dynamic of the Employment in the Large Industrial Firms.
2000, 52 Floro Ernesto CAROLEO
Le Politiche per l'Occupazione in Europa: una Tassonomia Istituzionale
2000, 51 Andrew NEWELL, Francesco PASTORE
Regional Unemployment and Industrial Restructuring in Poland
1999, 50 Giuseppe CELI, Alasdair SMITH
Quality Differentiation and the Labour Market Effects of International Trade.
1999, 49 Giuseppe CELI
Vertical and Horizontal Intra-Industry Trade: What is the Empirical Evidence for the UK? 1999, 48 Cesare IMBRIANI, Filippo REGANATI
Productivity spillovers and regional differences: some evidence on the italian manufacturing sector.
1999, 47 Adalgiso AMENDOLA, Annamaria NESE
L’impatto del background familiare sul livello d’istruzione dei figli.
1998, 46 Adalgiso AMENDOLA, Annamaria NESE
Mobilità intergenerazionale nella società femminile italiana.
1998, 45 Floro Ernesto CAROLEO, Fernanda MAZZOTTA
Youth Unemployment and youth employment policies in Italy.
1997, 44 Annamaria NESE
Mobilità intergenerazionale in Italia
1997, 43 Adriana BARONE, Concetto Paolo VINCI
Fairness: un concetto relativo nell’analisi del mercato del lavoro
1997, 42 Adriana BARONE, Concetto Paolo VINCI
Wage differentials and factor intensity reversals
1997, 41 Rosa CAPOLUPO
L’ipotesi di convergenza nel recente dibattito sulle teorie della crescita
1997, 40 Rosa CAPOLUPO
Endogenous Vs exogenous models of growth: the convergenze debate

144
1997, 39 Fernanda MAZZOTTA, Annamaria NESE
ransizioni " n and ut" il mercato del lavoro in talia: un’analisi microeconometrica
1997, 38 Fernanda MAZZOTTA
Disoccupazione e probabilità di occupazione in talia: un’analisi su microdati
1997, 37 Maria Rosaria GAROFALO, Bruna BRUNO
Equivalenza istituzionale" dei modelli di contrattazione sul salario: oltre il dibattito tra centralizzazione e decentramento
1997, 36 Adalgiso AMENDOLA, Floro Ernesto CAROLEO, Gianluigi COPPOLA
Differenziali territoriali nel mercato del lavoro e sviluppo in Italia
1996, 35 Adalgiso AMENDOLA
Istituzioni e mercato del lavoro. Deregolazione, occupazione e paradigma istituzionale
1996, 33 Annamaria NESE
Modelli microeconometrici per l'analisi della domanda abitativa
1996, 32 Annamaria NESE
Test semiparametrici per modelli parametrici
1996, 31 Giuseppe CELI
Vertical intra-industry trade and skill intensity in Europe: a cross sector analysis
1996, 30 Sergio DESTEFANIS
Nominal rigidities and real activity. A cross-industry analysis for Italy, 1951-93
1996, 29 Cesare IMBRIANI, Filippo REGANATI
International technology transfer into the italian manufacturing sector
1996, 28 Stefania di SERAFINO, Alberto GANDOLFI
The choice of the Government optimal procurement mechanism: the first-price sealed bid auction with one and/or two winners.
1996, 27 Raul de LUZENBERGER
Redistribution, and public debt with liquidity constraints
1996, 26 Bruno CHIARINI
Un modello VAR per la domanda di lavoro
1995, 25 Maria Rosaria CARILLO, Alberto ZAZZARO
Innovazione tecnologica e distruzione di capitale umano in un modello neo- shumpeteriano di crescita.
1995, 24 Raul de LUZENBERGER
Macroeconomia e politiche redistributive: il caso di vincoli di liquidità
1995, 23 Annamaria NESE
Tenure choice and demand for housing in Italy
1995, 22 Filippo REGANATI
La struttura delle preferenze per prodotti orizzontalmente differenziati.
1995, 21 Sergio DESTEFANIS, Michele LA ROCCA, Cosimo VITALE
Forecasting train ticket sales with linear model-based approaches and with edats
1995, 20 Stefania di SERAFINO
Bounded rationality and incomplete contracts
1995, 19 Adalgiso AMENDOLA, Floro E. CAROLEO, Maria Rosaria GAROFALO
Istituzioni, mercato del lavoro e decentramento delle decisioni.
1995, 18 Niall O’HIGGINS
Why did the youth training scheme reduce the wages of young people? A story of human capital formation, reservation wages and job offers.
1994, 17 Antonio CARDONE
Misure di efficienza: alcuni aspetti teorici

145
1994, 16 Maria Rosaria GAROFALO, Luisa ZANCHI
Neo-corporativismo, centralizzazione e dispersione inter-settoriale dei salari.
1994, 15 Sergio DESTEFANIS
Allowing for frequency of negotiation in the aggregate wage equation. A study for Italian manufacturing, 1973/92.
1994, 14 Marcello D'AMATO
Tariffs for a foreign industry with market power under incomplete information on demand
1994, 13 Raul DE LUZENBERGER, Cesare IMBRIANI, Giancarlo MARINI
Sustainability Issues in the process of European Integration
1994, 12 Riccardo MARSELLI, Antonio CARDONE
Interdipendenza tra regioni: un'analisi su dati di Panel
1993, 11 Adriana BARONE, Concetto Paolo VINCI
Dilemma del prigioniero e persistenza della disoccupazione involontaria
1993, 10 Maria Rosaria CARILLO
Mutamenti strutturali ed offerta di lavoro.
1993, 9 Niall O'HIGGINS
The effectiveness of YTS in Britain: an analysis of sample selection in the determination of employment and earnings
1993, 8 Giuseppe CELI
Politiche valutarie ed integrazione commerciale: l'esperienza dello SME negli anni '80
1992, 7 Paolo COCCORESE
Attività innovativa e configurazione industriale
1992, 6 Maria Rosaria GAROFALO, Gian Luigi CORINTO
La Razionalità dell'Allocazione del Tempo di Lavoro in Agricoltura. Con un'Applicazione Empirica ad un Sistema Locale attraverso la PL.
1992, 5 Adalgiso AMENDOLA, Maria SCATTAGLIA
Disoccupazione e Tassi di Attività nel Mezzogiorno
1992, 4 Floro Ernesto CAROLEO
La Disoccupazione Strutturale
1991, 3 Giovanni URGA
Dynamic Models of Labour Demand in the Italian Industrial Sector: Theories and Evidence from Panel Data
1991, 2 Adalgiso AMENDOLA
Teoria dei Contratti Impliciti. Rigidità del Salario e Disoccupazione
1991, 1 Guido CELLA
Sulla Integrazione Produttiva Interregionale: il Caso del Mezzogiorno

146
CELPE – Centro di Economia del Lavoro e di Politica Economica
Università degli Studi di Salerno ISSN 1970-4259 ISBN 978-88-95406-26-8 Depositato ai sensi di Legge