the impact of dividend policy on share price volatility in the malaysian stock market
TRANSCRIPT
Journal of Business Studies Quarterly
2012, Vol. 4, No. 1, pp. 111-129 ISSN 2152-1034
The Impact of Dividend Policy on Share Price Volatility in
the Malaysian Stock Market
Mohammad Hashemijoo, Multimedia University, Malaysia
Aref Mahdavi Ardekani, Multimedia University, Malaysia
Nejat Younesi, Multimedia University, Malaysia
Abstract
The purpose of this study was to examine the relationship between dividend policy and share
price volatility with a focus on consumer product companies listed in Malaysian stock market.
For this purpose, a sample of 84 companies from 142 consumer product companies listed in
main market of Bursa Malaysia were selected and the relationship between share price volatility
with two main measurements of dividend policy, dividend yield and payout ,were examined by
applying multiple regression for a period of six years from 2005 to 2010. The primarily
regression model was expanded by adding control variables including size, earning volatility,
leverage, debt and growth. The empirical results of this study showed significant negative
relationship between share price volatility with two main measurements of dividend policy which
are dividend yield and dividend payout. Moreover, a significant negative relationship between
share price volatility and size is found. Based on findings of this study, dividend yield and size
have most impact on share price volatility amongst predictor variables.
Keywords: Dividend policy, Share Price, Corporate Finance, Risk Management
Introduction
Dividend Policy refers to a company’s policy which determines the amount of dividend
payments and the amounts of retained earnings for reinvesting in new projects. This policy is
related to dividing the firm’s earning between payment to shareholders and reinvestment in new
opportunities. In corporate finance, one of the most important decisions is concerned with the answer of
this question that should the profits of firm be distributed to the shareholders as dividend or it
must be reinvested in new opportunities and if it must be distributed, what proportion of profit
must be paid to shareholder and what proportion must be returned to the business?. For
answering this question, managers must consider which dividend policy will lead to
maximization of shareholder’s wealth and they should not only concentrate on this question that
Journal of Business Studies Quarterly
2012, Vol. 4, No. 1, pp. 111-129
112
how much of firm’s income are required for investment. Instead, they also must consider the
impact of their decision on stock’s price. Dividend policy is also related to capital structure indirectly and different dividend policies
may require different capital structures. Since both of capital structure and dividend policy can
have impact on the wealth of shareholders and dividend policy can affect capital structure too,
decision about dividend policy is complex. In preliminary corporate finance, dividend policy was just concerned with selecting
between payments of earnings to shareholder as cash dividend or retaining the profit in firm. It
only determined the incidence of dividend payments and the amount dividends. However, in
today’s corporate finance, dividend policy addresses more issues such as how firms can attract
investors in different tax brackets and how firms can increase the market value of firm and share
repurchase instead of cash dividends and etc. Nevertheless, the current critical questions concerned with dividend policy have many
similarities to those questions asked by manager in the 1950s. These questions were determined
by (Lintner, 1956) as follows:
a. Is it better to keep dividend payments at the present amount or alter it?
b. Do shareholders want to have fixed dividend payments, or they prefer dividend payments
updated with earnings?
c. What kind of investor dividend policy should attract? Younger or older?
So the dividend policy was a popular research topic amongst financial researchers more
than 50 years and it dealt with many critical corporate issues such as agency cost ,clientele effect
and share assessment. Many researchers have attempted to relate the dividend policy to share
price of firm but they had conflicting results and still, there is no consensus among researchers
about the impact of dividend policy on share price.
Moreover, many researchers have been investigating the association between share price
volatility and dividend policy. The common stock’s volatility is a benchmark for measuring risk.
It indicates the changing pace in the stock’s price over a determined period; the more
considerable volatility implies that the possibility of gain or loss is higher in short-term. So the
price of volatile stock would differ considerably over time and it is very difficult to predict the
future price of this stock. Investors usually choose less risky investment and less risky
investments are better than those with higher risk (Kinder, 2002).
Different researchers have investigated the association between dividend policy and
volatility of share price at different times (Allen & Rachim, 1996; Baskin, 1989; Hussainey,
Mgbame, & Chijoke-Mgbame, 2011; Kinder, 2002; Nazir, Nawaz, Anwar, & Ahmed, 2010;
Nishat & Irfan, 2004; Suleman, Asghar, Ali Shah, & Hamid, 2011). But their findings are not
consistent. (Baskin, 1989) reported significant negative association between dividend yield and
volatility of stock’s price. Findings of (Hussainey et al., 2011) also failed to support the study of
(Baskin, 1989). Since there is no consensus between researchers on the impact of dividend policy
on volatility of stock’s price, this research examines the impact of dividend policy on share price
volatility in Malaysian stock market based on (Baskin, 1989)’s theoretical frame work. Since
most previous studies on the impact of dividend policy on share price volatility have been done
in developed stock markets, the Malaysia stock market is selected as an emerging market. Based
on (Pandey, 2003)’s study, consumer product manufacturing companies have the most amount of
dividend payments after plantation companies amongst companies listed in Bursa Malaysia.
Therefore, consumer product manufacturing companies listed on the main board of Kuala
©JBSQ 2012 113
Lumpur Stock Exchange (KLSE) are selected as a sample and the impact of dividend policy on
share price volatility is examined for a period of 2005 to 2010.
Literature Review 2.1 Irrelevance of dividend policy
(Miller & Modigliani, 1961) proposed irrelevance theory suggesting that the wealth of
the shareholders is not affected by dividend policy. It is argued in their theory that the value of
the firm is subjected to the firm’s earning, which comes from company’s investment policy. The
literature proposed that dividend does not affect the shareholders’ value in the world without
taxes and market imperfections. They argued that dividend and capital gain is two main ways
that can contribute profits of firm to shareholders. When a firm chooses to distribute its profits as
dividends to its shareholders, then the stock price will be reduced automatically by the amount of
a dividend per share on the ex-dividend date. So, they proposed that in a perfect market, dividend
policy does not affect the shareholder’s return.
There are some voices of researchers supporting the irrelevance dividend hypothesis
which will be reviewed as follows:
(Brennan, 1971) supported the irrelevancy theory of Miller and Modigliani and
concluded that any rejection of this theory must be based on the denying of the principle of
symmetric market rationality and the assumption of independence of irrelevant information. He
suggested that for rejection of latter assumption, one of these following conditions must exist:
firstly, Investors do not behave rationally. Secondly, Stock price must be subordinate of past
events and expected future prospect.
(Black & Scholes, 1974) created 25 portfolios of common stock in New York Stock
Exchange for studying the impact of dividend policy on share price from 1936 to 1966. They
used capital asset pricing model for testing the association between dividend yield and expected
return. Their findings showed no significant association between dividend yield and expected
return. They reported that there is no evidence that difference dividend policies will lead to
different stock prices. Their findings were consistent with dividend irrelevance hypothesis.
(Hakansson, 1982) supported the irrelevance theory of Miller and Modigliani and
claimed that dividends, whether informative or not, is irrelevant to firm’s value when investors
have homogeneous belief and time additive utility and market is fully efficient.
(Uddin & Chowdhury, 2005) selected 137 companies which were listed on Dhaka Stock
Exchange (DSE) and studied the relationship between share price and dividend payout. The
results implied that dividend announcement does not provide value gain for investors and
shareholders experience approximately 20 % loss of value during thirty days before the
announcement of dividend to thirty days following the announcement. He suggested that current
dividend yield can reimburse the diminished value to some extents. Generally, his findings
supported the irrelevancy of dividend policy.
However, some empirical results of different researches were consistent with irrelevance
dividend theory. There are many researches challenging the dividend irrelevance hypothesis.
(Ball, Brown, Finn, & Officer, 1979) studied the relationship between dividends and
stock price in Australian stock market from 1960 to 1969. They found significant relationship
between return of stock and dividend yield in the next year after dividend payment. However,
their findings failed to support the irrelevance dividend theory.
(Baker, Farrelly, & Edelman, 1985) did a survey among the 603 Chief Financial Officers
(CFOs) of 562 companies which were listed on the New York Stock Exchange (NYSE). The
Journal of Business Studies Quarterly
2012, Vol. 4, No. 1, pp. 111-129
114
results of their survey showed that respondents strongly agreed that stock prices will be affected
by dividend policy.
(Baker & Powell, 1999) conducted a survey among 603 Chief Financial Officers of US
companies which were listed on the NYSE. They reported that majority of respondents (90
percent) agreed that dividend policy has impact on value of firm and affect firm’s cost of capital
too.
2.2 Relevance of dividend policy
2.2.1. Relevance of dividend policy based on Uncertainty of future dividends
(Gordon, 1962) suggested a valuation models relating the market value of the stock with
dividend policy. Gordon studied dividend policy and market price of the shares and proposed
that the dividend policy of firms affects the market value of stocks even in the perfect capital
market. He stated that investors may prefer present dividend instead of future capital gains
because the future situation is uncertain even if in perfect capital market. Indeed, he explained
that many investors may prefer dividend in hand in order to avoid risk related to future capital
gain. He also proposed that there is a direct relationship between dividend policy and market
value of share even if the internal rate of return and the required rate of return will be the same.
In (Gordon, 1962)’s constant growth model, the share price of firm is subordinate of discounted
flow of future dividends.
(Diamond, 1967) selected 255 US based firms as a sample and studied the association of
firm’s value with dividends and retained earnings in 1961 and 1962. (Diamond, 1967) reported
that there is only weak evidence that investors prefer dividends to future capital gain. His
findings also showed a negative association between growth of company and preference of
dividend.
2.2.2. Relevance of dividend policy based on information content of dividend
(Miller & Modigliani, 1961) suggested that in imperfect market, dividend may affect the
share price. So dividend announcements can be interpreted as a signal of future profitability of
firm. (Asquith & Mullins Jr, 1983) used a sample of 168 companies paying dividend for the first
time or paying dividend after at least 10-year interruption and studied the relationship between
market reaction and dividend announcement. They analyzed the daily abnormal stock returns for
the ten-day period prior and ten-day period following the dividend announcement. Their findings
implied an approximate abnormal return of +3.7 percent for a period of two days after
announcement. Furthermore, they used cross-sectional regression and reported that first
dividends’ amount has significant positive impact on the excess returns on the day of dividend
announcement. They concluded that the magnitude of changes in dividends can be also
important.
(Amihud & Murgia, 1997) used 200 German firms as sample and studied the stock price
response to dividend announcement for the period of 1988 to 1992. They considered 255 cases of
raise in dividend and 51 cases of decline in dividend. Their results reinforced this statement that
dividend changes may be a signal of future prospect of firms. They presented the abnormal
return of + 0.965 percent for dividend increase and abnormal return of –1.73 percent for dividend
decrease.
(Travlos, Trigeorgis, & Vafeas, 2001) studied the stock price response to announcement
of stock dividend and dividend increase in the Cyprus Stock Exchange over 1985 to 1995. They
considered 41 announcements of cash dividend and 39 events of dividend increase. Their results
©JBSQ 2012 115
provided strong evidence for supporting the signaling hypothesis. They reported prominent
excess returns for both cash dividend announcement and cash dividend increase.
2.2.3. Relevance of dividend policy based on agency cost
(Jensen, Solberg, & Zorn, 1992) studied the determinants of cross-sectional differences in
insider ownership, debt and dividend policy by using three-stage least squares. They considered
565 companies as sample for the year 1982 and used 632 companies as sample for the year 1987.
They reported that high insider ownership companies adopt lower dividend payment and
proposed that insider ownership and dividend payment have negative association. Their findings
supported agency cost theory.
By studying a sample of 477 US firms, Holder, (Holder, Langrehr, & Hexter, 1998)
stated that insider ownership and dividend payout have negative association thorough 1980 to
1990. They also concluded that the number of shareholders and dividend payout are positively
related. Their findings were consistent with agency cost hypothesis.
(Saxena, 1999) studied the determinants of dividend in US firms over the period of 1981
to 1990. He used 333 companies listed on the NYSE as sample. In line with Holder et al.’s
findings, they found significant negative relationship between insider ownership and dividend
payout. Their findings proposed that agency cost is one of the important determinants of
dividend policy. Their findings were in line with Holder et al.’s findings.
(Chen & Dhiensiri, 2009) used 75 Zelanian companies as sample and studied the factors
influencing dividend policy through 1991 to 1999. They concluded that insider ownership has
negative impact on dividend payout. Their findings were consistent with agency cost hypothesis.
2.2.4. Relevance of dividend policy based on clientele effects
(Pettit, 1977) investigated on what extent transaction costs and taxes can affect the
investor’s portfolios in USA. His findings provided empirical proof supporting the clientele
effect theory. He studied 914 investors’ portfolios and reported that investors’ ages and their
portfolios’ dividend yield are positively related. He also reported that investors’ incomes and
dividend yield are negatively related. Pettit proposed that aged investors with low-income are
more dependent to their portfolios for financing their current consumption. Therefore, they prefer
investing in stock with high-payout for avoiding the transaction costs of selling stock. He also
demonstrated that investors who have portfolios with low un-diversifiable risk prefer high-
dividend stocks. His findings also supported the tax-induced clientele effect. In a similar study,
(Lewellen, Stanley, Lease, & Schlarbaum, 1978) used a sample derived from identical database
applied by (Pettit, 1977) and evaluated clientele effect hypothesis. But their findings provide
very weak proof for supporting the dividend clientele effect theory. In another similar research,
(Scholz, 1992) used self- reported data from 400 individuals in the survey of consumer finance
(SCF) and developed an empirical model for testing the dividend clientele effect through
analyzing the information of investors’ portfolios. His findings showed that difference between
tax rate for capital gains and tax rate for dividends has effect on traders’ preference for having
high-payout stock in their portfolio or low-payout stock.
(Dhaliwal, Erickson, & Trezevant, 1999) studied 133 dividend initiations from the period
of 1982 to 1995 in US. They examined changes in institutional shareholders due to dividend
initiations. Their findings showed that after dividend initiations, there are significant increases in
institutional shareholders for 80 percent of their sample. Their findings provided strong support
for the theory of tax-induced clienteles. They reported that clientele effect can affect the
investors’ decisions.

Journal of Business Studies Quarterly
2012, Vol. 4, No. 1, pp. 111-129
116
2.3 Impact of dividend policy on firm’s risk
(Ben-Zion & Shalit, 1975) studied the impact of size, leverage and firm’s dividend
records on the risk of common stock. They selected the 1000 largest US industrial corporations
in 1970 as sample and examined the relationship between alternative risk measures with size,
leverage and dividend records. The results of their research showed that the firm's size and
leverage and dividend have significant relationship with firm’s risk measures and are important
determinants of firm’s risk. They reported that firm’s risk has significant negative relationship
with both dividend yield and size, but leverage has significant negative impact on firm’s risk.
(Rozeff, 1982) studied the determinants of dividend payout ratios. He suggested that beta,
agency cost and growth determine the optimal dividend payout. He argued that higher beta
coefficients are related to lower dividends pay out showing that there is a negative association
between firm’s risk and dividend payout. He explained that since firms with high beta may have
higher external financing cost, they are more likely to choose lower dividend payout policy.
(Eades, 1982) studied the relationship between dividend yield and firm’s risk in US stock
market. He used a sample of firms common to the 20 year annual COMPUSTAT files
(1960_1979) and the monthly stock return files from the Centre for Research in Security Prices
(CRPS). He regressed the dividend yield against firm’s beta. The results of his study discovered
a clearly significant negative relationship between dividend yield and firm’s beta showing that
riskier firms may have lower dividend paid.
2.4 Impact of dividend policy on share price volatility
(Baskin, 1989) used a different method and examined the association between dividend
policy and stock price volatility rather than returns. He added some control variables for
examining the association between share price volatility and dividend yield. These control
variables are earning volatility, firm’s size, debt and growth. These control variables do not only
have clear effect on stock price volatility but they also affect dividend yield. For instance, the
earning volatility has effect on share price volatility and it affects the optimal dividend policy for
corporations. Moreover, with assumption that the operating risk is constant, the level of debt
might have positive effect on dividend yield. Size of firm would be expected that affect share
price volatility as well. That is, the share price of large firms is more stable than those of small
firms as the large firm tend to be more diversified. Furthermore, small firms have limited public
information and this issue can lead to irrationally react of their investors.
(Baskin, 1989)’s work was based on following fundamental models that connect
dividends to risk of stock. The models are the duration effect, the rate of return effect, the
arbitrage pricing effect and the information effect.
(Baskin, 1989) proposed that fluctuation in the discount rate has less impact on high
dividend yield stocks because high dividend yield can be a signal of more near-term cash flow so
the firm with high dividend yield would be expected to have less volatility in share price. This is
then being named as duration effect. (Baskin, 1989) used the Gordon growth model for
demonstrating this effect. Moreover, he explained that based on the rate of return effect, it is
possible that firms with low dividend yield and low pay out to be assessed more valuable than
their assets in place due to their growth opportunities. Since forecasts of earning from growth
opportunity have more error than prediction of earning from assets in place, companies with low
pay out and low dividend yield are expected to have more volatility in their share price. He also
proposed that higher dividend yield will lead to higher arbitrage profit because the excess return
is subordinate of dividend yield and price discount rate. Baskin also argued that managers can
©JBSQ 2012 117
controls the stock price volatility and stock risk by dividend policy and Distribution of dividend
at the time of earning announcement may be interpreted as signal about stability of firm.
(Baskin, 1989) studied the 2344 U.S. firms over a period of 1967 to 1986 and he reported
a significant negative correlation between dividend yield and stock price volatility which was
greater than correlation between share price volatility and any of other variables. He suggested
that dividend policy can be used for controlling the share price volatility. He reported that if
dividend yield increases by 1 %, the annual standard deviation of stock price movement
decreases by 2.5 %.
(Nazir et al., 2010) used 73 firms listed in Karachi Stock Exchange (KSE) as sample and
studied the relationship between share price volatility and dividend policy for the period of 2003
to 2008. They applied fixed effect and random effect models on panel data. They reported that
share price volatility has significant negative association with dividend yield and dividend
payout. They also reported that size and leverage have non-significant negative effect on share
price volatility.
(Suleman et al., 2011) studied the association of dividend policy with share price
volatility in Pakistan. They extracted data from Karachi Stock Exchange regarding five
important sectors for the period of 2005 to 2009. They used multiple regressions model for their
analysis. Contrary to (Baskin, 1989)’s results, their findings showed that share price volatility
has significant positive relationship with dividend yield. They also reported that share price
volatility has significant negative relationship with growth.
(Hussainey et al., 2011) examined the relationship between share price volatility and
dividend policy in UK. They selected 123 English companies and the period of their study was
from 1998 to 2007. Their work was based on (Baskin, 1989). Similar to Baskin (1989), they used
multiple regression analyses for exploring the relationship of share price with dividend yield and
dividend payout ratio. They added size, level of debt, Earning volatility and level of growth as
control variables to their model.
Consistent to (Allen & Rachim, 1996) Australia results, (Hussainey et al., 2011) found a
significant negative relationship between share price volatility and payout ratio. They also found
a negative relationship between share price volatility and dividend yield. Their findings
discovered that the payout ratio is the predominant determinant of the share price volatility and
size and debt have the strongest relationship with price volatility amongst control variables.
Contrary to (Allen & Rachim, 1996), (Hussainey et al., 2011)’s findings showed that a firm’s
size has significant negative impact on volatility of stock price and firm’s size. They also
reported a debt has significant positive impact on share price volatility.
Methodology
3.1 Hypothesis of Study
3.1.1 Hypothesis 1
H0: There is no significant association between share price volatility and dividend yield.
H1: There is a significant association between share price volatility and dividend yield.
It is expected that share price volatility is being affected negatively by dividend yield.
(Baskin, 1989) explained negative impact of dividend yield on share price volatility based on the
duration effect, the rate of return effect, the arbitrage effect and the information effect. He used
Gordon growth model for demonstrating the duration effect. (He presumed that equity discount
Journal of Business Studies Quarterly
2012, Vol. 4, No. 1, pp. 111-129
118
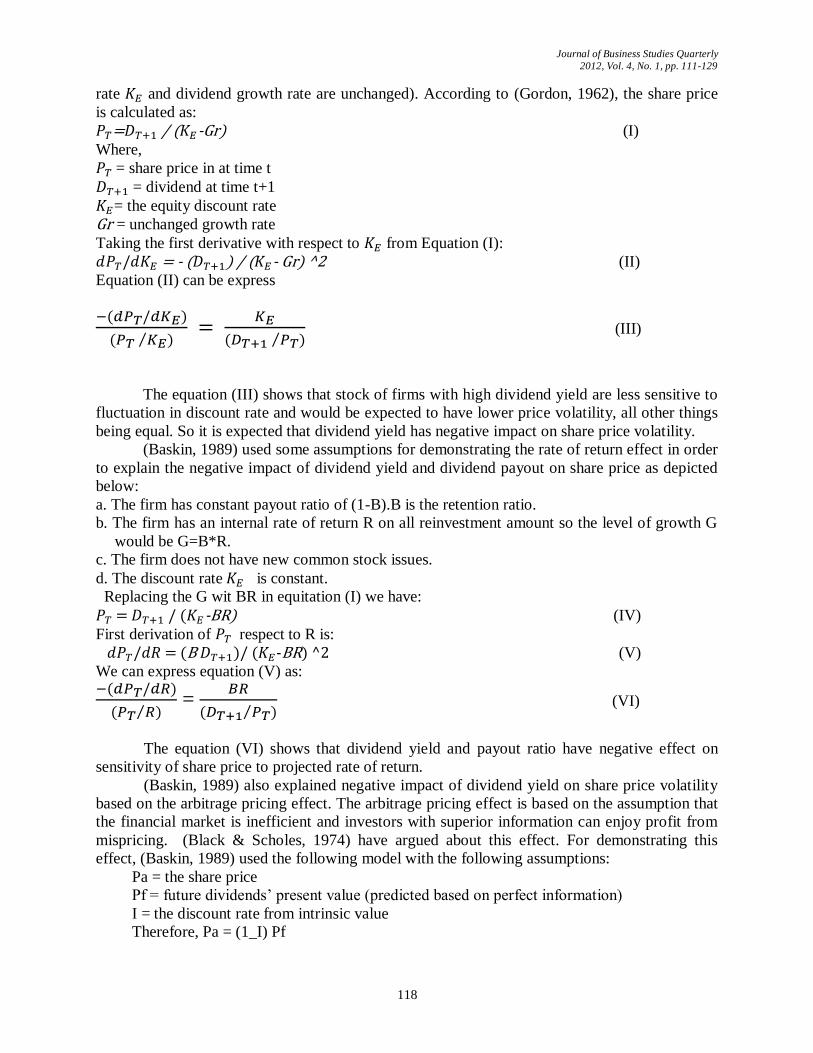
rate and dividend growth rate are unchanged). According to (Gordon, 1962), the share price
is calculated as:
= / ( -Gr) (I)
Where, = share price in at time t
= dividend at time t+1
= the equity discount rate
Gr = unchanged growth rate
Taking the first derivative with respect to from Equation (I):
= - ( ) / ( - Gr) ^2 (II)
Equation (II) can be express
(III)
The equation (III) shows that stock of firms with high dividend yield are less sensitive to
fluctuation in discount rate and would be expected to have lower price volatility, all other things
being equal. So it is expected that dividend yield has negative impact on share price volatility.
(Baskin, 1989) used some assumptions for demonstrating the rate of return effect in order
to explain the negative impact of dividend yield and dividend payout on share price as depicted
below:
a. The firm has constant payout ratio of (1-B).B is the retention ratio.
b. The firm has an internal rate of return R on all reinvestment amount so the level of growth G
would be G=B*R.
c. The firm does not have new common stock issues.
d. The discount rate is constant.
Replacing the G wit BR in equitation (I) we have:
= / ( -BR) (IV)
First derivation of respect to R is:
= (B )/ ( -BR) ^2 (V)
We can express equation (V) as:
=
(VI)
The equation (VI) shows that dividend yield and payout ratio have negative effect on
sensitivity of share price to projected rate of return. (Baskin, 1989) also explained negative impact of dividend yield on share price volatility
based on the arbitrage pricing effect. The arbitrage pricing effect is based on the assumption that
the financial market is inefficient and investors with superior information can enjoy profit from
mispricing. (Black & Scholes, 1974) have argued about this effect. For demonstrating this
effect, (Baskin, 1989) used the following model with the following assumptions:
Pa = the share price
Pf = future dividends’ present value (predicted based on perfect information)
I = the discount rate from intrinsic value
Therefore, Pa = (1_I) Pf
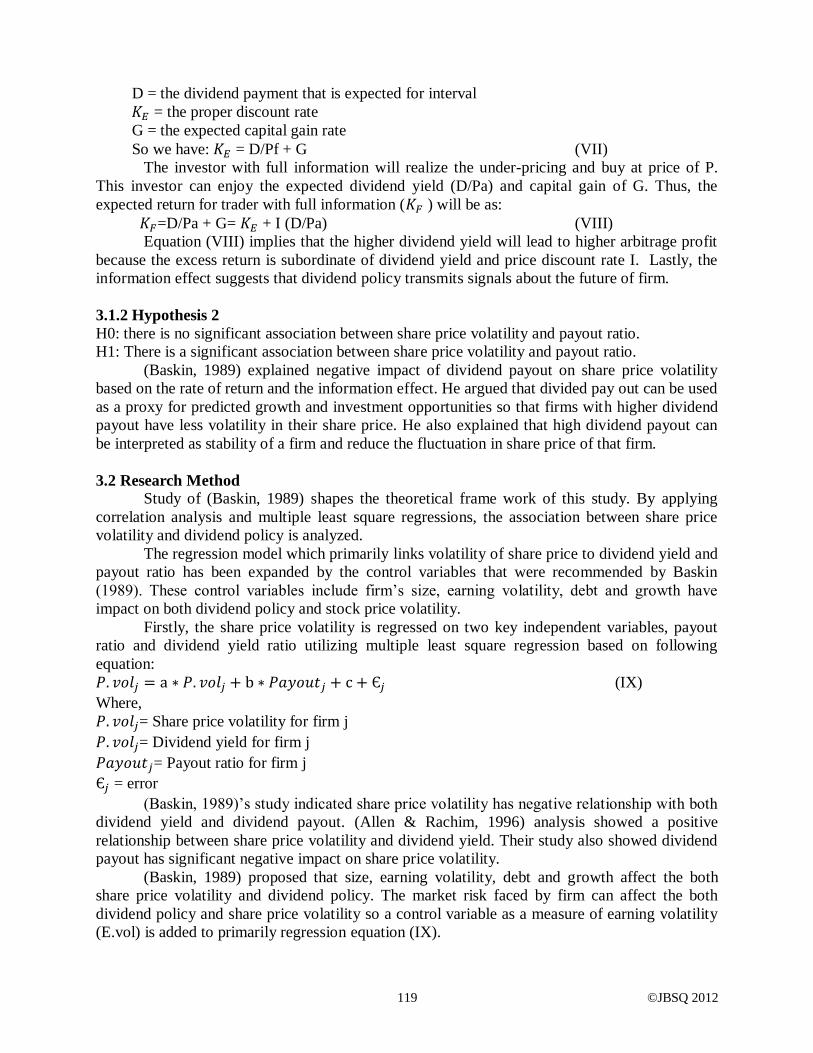
©JBSQ 2012 119
D = the dividend payment that is expected for interval
= the proper discount rate
G = the expected capital gain rate
So we have: = D/Pf + G (VII)
The investor with full information will realize the under-pricing and buy at price of P.
This investor can enjoy the expected dividend yield (D/Pa) and capital gain of G. Thus, the
expected return for trader with full information ( ) will be as:
=D/Pa + G= + I (D/Pa) (VIII)
Equation (VIII) implies that the higher dividend yield will lead to higher arbitrage profit
because the excess return is subordinate of dividend yield and price discount rate I. Lastly, the
information effect suggests that dividend policy transmits signals about the future of firm.
3.1.2 Hypothesis 2
H0: there is no significant association between share price volatility and payout ratio.
H1: There is a significant association between share price volatility and payout ratio.
(Baskin, 1989) explained negative impact of dividend payout on share price volatility
based on the rate of return and the information effect. He argued that divided pay out can be used
as a proxy for predicted growth and investment opportunities so that firms with higher dividend
payout have less volatility in their share price. He also explained that high dividend payout can
be interpreted as stability of a firm and reduce the fluctuation in share price of that firm.
3.2 Research Method
Study of (Baskin, 1989) shapes the theoretical frame work of this study. By applying
correlation analysis and multiple least square regressions, the association between share price
volatility and dividend policy is analyzed.
The regression model which primarily links volatility of share price to dividend yield and
payout ratio has been expanded by the control variables that were recommended by Baskin
(1989). These control variables include firm’s size, earning volatility, debt and growth have
impact on both dividend policy and stock price volatility.
Firstly, the share price volatility is regressed on two key independent variables, payout
ratio and dividend yield ratio utilizing multiple least square regression based on following
equation:
(IX)
Where,
= Share price volatility for firm j
= Dividend yield for firm j
= Payout ratio for firm j
= error
(Baskin, 1989)’s study indicated share price volatility has negative relationship with both
dividend yield and dividend payout. (Allen & Rachim, 1996) analysis showed a positive
relationship between share price volatility and dividend yield. Their study also showed dividend
payout has significant negative impact on share price volatility.
(Baskin, 1989) proposed that size, earning volatility, debt and growth affect the both
share price volatility and dividend policy. The market risk faced by firm can affect the both
dividend policy and share price volatility so a control variable as a measure of earning volatility
(E.vol) is added to primarily regression equation (IX).
Journal of Business Studies Quarterly
2012, Vol. 4, No. 1, pp. 111-129
120
Additionally, it is possible that size of firm affects the price volatility because small firms
usually have less diversification in their activities. Moreover, it is possible that small firms have
less information available to investors about their stock market. Another reason for impact of
size on share price volatility is that small firms’ stock may be more liquid, so their share price
can be more volatile than larger firms. (Baskin, 1989) proposed that firms which have more
scatter body of shareholders are more likely to use dividend as a signaling device, so the size can
affect the dividend policy too. For counting the size, a control variable (Size) is added to
primarily regression equation (IX).
Moreover, dividend policy may have an inverse relationship with growth because firms
in their growth stage are more likely to keep their income for investing in new investment
opportunities. Based on arbitrage effect and equation (VIII), the level of growth and share price
volatility could be inversely related. So, a control variable (Growth) is added to primarily
regression equation as a measure of growth.
Furthermore, because of operating risk, leverage could have negative impact on share
price volatility. Furthermore, if there is asymmetric information, borrowing and dividend policy
can be related .So, leverage is (DEBT) added to primarily regression equation as a control
variable.
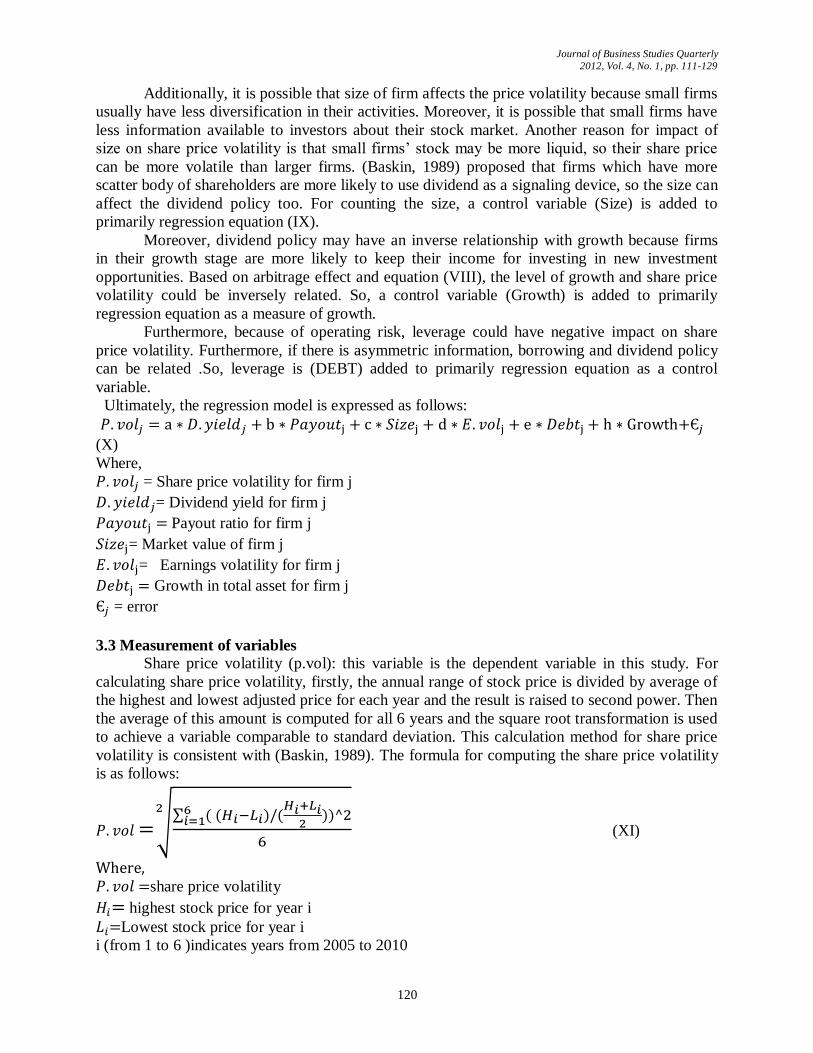
Ultimately, the regression model is expressed as follows:
(X)
Where, = Share price volatility for firm j
= Dividend yield for firm j
Payout ratio for firm j
= Market value of firm j
= Earnings volatility for firm j
Growth in total asset for firm j
= error
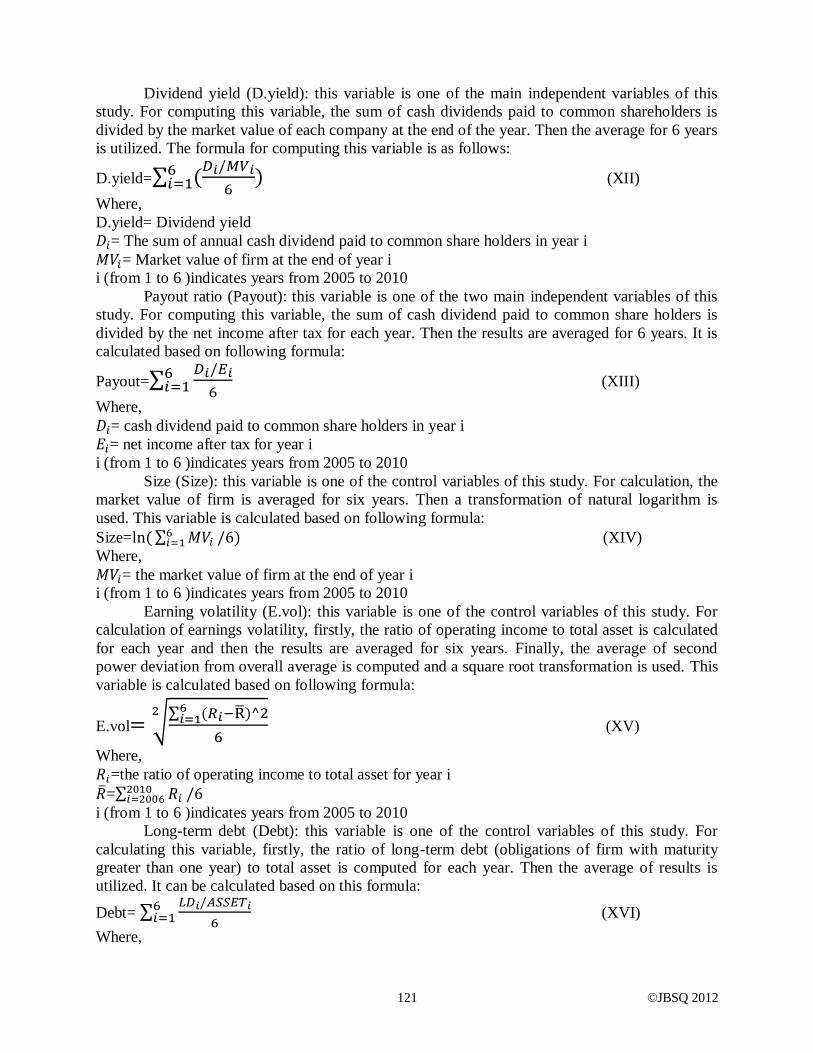
3.3 Measurement of variables
Share price volatility (p.vol): this variable is the dependent variable in this study. For
calculating share price volatility, firstly, the annual range of stock price is divided by average of
the highest and lowest adjusted price for each year and the result is raised to second power. Then
the average of this amount is computed for all 6 years and the square root transformation is used
to achieve a variable comparable to standard deviation. This calculation method for share price
volatility is consistent with (Baskin, 1989). The formula for computing the share price volatility
is as follows:
=
(XI)
Where, =share price volatility
= highest stock price for year i =Lowest stock price for year i
i (from 1 to 6 )indicates years from 2005 to 2010
©JBSQ 2012 121
Dividend yield (D.yield): this variable is one of the main independent variables of this
study. For computing this variable, the sum of cash dividends paid to common shareholders is
divided by the market value of each company at the end of the year. Then the average for 6 years
is utilized. The formula for computing this variable is as follows:
D.yield=
(XII)
Where,
D.yield= Dividend yield
= The sum of annual cash dividend paid to common share holders in year i
= Market value of firm at the end of year i
i (from 1 to 6 )indicates years from 2005 to 2010
Payout ratio (Payout): this variable is one of the two main independent variables of this
study. For computing this variable, the sum of cash dividend paid to common share holders is
divided by the net income after tax for each year. Then the results are averaged for 6 years. It is
calculated based on following formula:
Payout=
(XIII)
Where,
= cash dividend paid to common share holders in year i
= net income after tax for year i
i (from 1 to 6 )indicates years from 2005 to 2010
Size (Size): this variable is one of the control variables of this study. For calculation, the
market value of firm is averaged for six years. Then a transformation of natural logarithm is
used. This variable is calculated based on following formula:
Size= (XIV)
Where,
= the market value of firm at the end of year i
i (from 1 to 6 )indicates years from 2005 to 2010
Earning volatility (E.vol): this variable is one of the control variables of this study. For
calculation of earnings volatility, firstly, the ratio of operating income to total asset is calculated
for each year and then the results are averaged for six years. Finally, the average of second
power deviation from overall average is computed and a square root transformation is used. This
variable is calculated based on following formula:
E.vol=
(XV)
Where, =the ratio of operating income to total asset for year i
=
i (from 1 to 6 )indicates years from 2005 to 2010
Long-term debt (Debt): this variable is one of the control variables of this study. For
calculating this variable, firstly, the ratio of long-term debt (obligations of firm with maturity
greater than one year) to total asset is computed for each year. Then the average of results is
utilized. It can be calculated based on this formula:
Debt=
(XVI)
Where,
Journal of Business Studies Quarterly
2012, Vol. 4, No. 1, pp. 111-129
122
= Long-term debt at the end of year i
= Total asset at the end of year i
i (from 1 to 6 )indicates years from 2005 to 2010
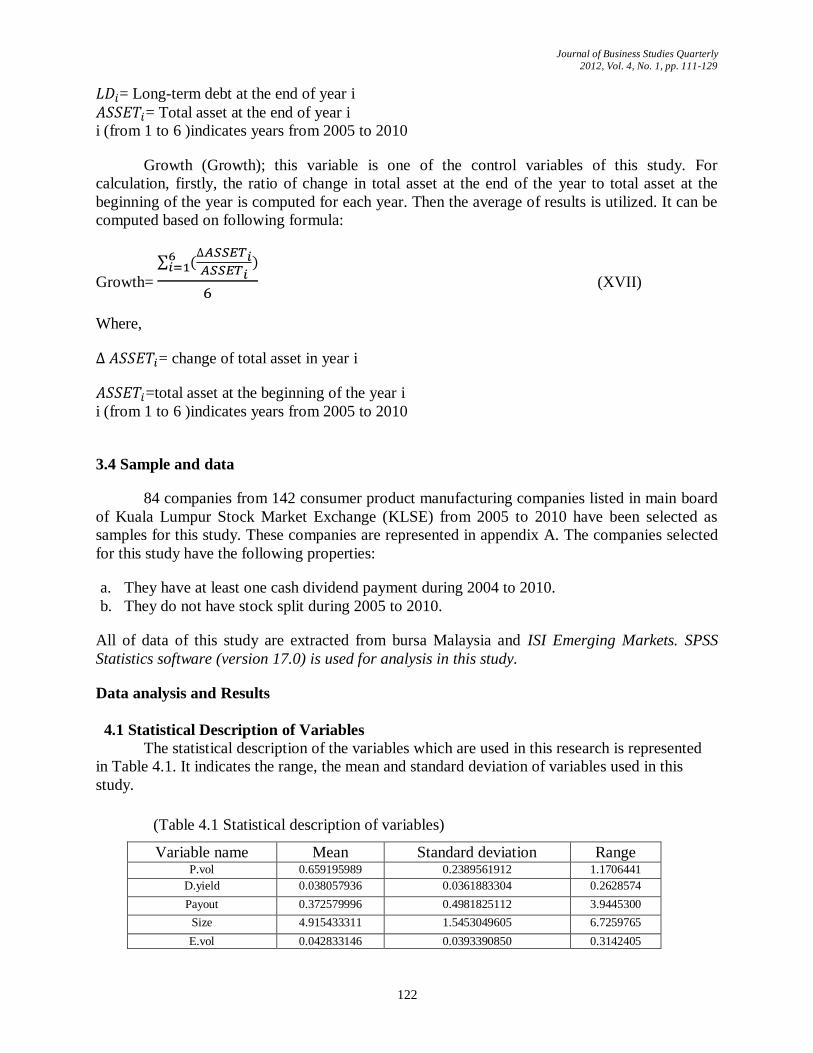
Growth (Growth); this variable is one of the control variables of this study. For
calculation, firstly, the ratio of change in total asset at the end of the year to total asset at the
beginning of the year is computed for each year. Then the average of results is utilized. It can be
computed based on following formula:
Growth=
(XVII)
Where,
= change of total asset in year i
=total asset at the beginning of the year i
i (from 1 to 6 )indicates years from 2005 to 2010
3.4 Sample and data
84 companies from 142 consumer product manufacturing companies listed in main board
of Kuala Lumpur Stock Market Exchange (KLSE) from 2005 to 2010 have been selected as
samples for this study. These companies are represented in appendix A. The companies selected
for this study have the following properties:
a. They have at least one cash dividend payment during 2004 to 2010.
b. They do not have stock split during 2005 to 2010.
All of data of this study are extracted from bursa Malaysia and ISI Emerging Markets. SPSS
Statistics software (version 17.0) is used for analysis in this study.
Data analysis and Results
4.1 Statistical Description of Variables
The statistical description of the variables which are used in this research is represented
in Table 4.1. It indicates the range, the mean and standard deviation of variables used in this
study.
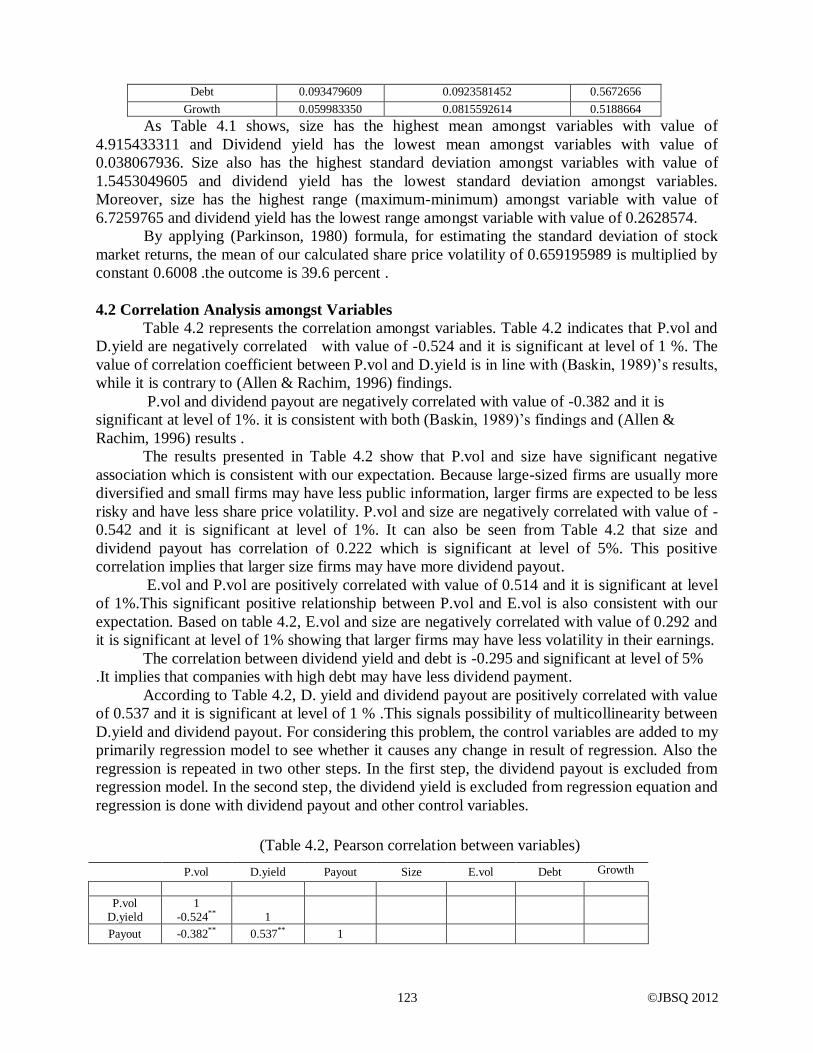
(Table 4.1 Statistical description of variables)
Variable name Mean Standard deviation Range P.vol 0.659195989 0.2389561912 1.1706441
D.yield 0.038057936 0.0361883304 0.2628574
Payout 0.372579996 0.4981825112 3.9445300
Size 4.915433311 1.5453049605 6.7259765
E.vol 0.042833146 0.0393390850 0.3142405
©JBSQ 2012 123
Debt 0.093479609 0.0923581452 0.5672656
Growth 0.059983350 0.0815592614 0.5188664
As Table 4.1 shows, size has the highest mean amongst variables with value of
4.915433311 and Dividend yield has the lowest mean amongst variables with value of
0.038067936. Size also has the highest standard deviation amongst variables with value of
1.5453049605 and dividend yield has the lowest standard deviation amongst variables.
Moreover, size has the highest range (maximum-minimum) amongst variable with value of
6.7259765 and dividend yield has the lowest range amongst variable with value of 0.2628574.
By applying (Parkinson, 1980) formula, for estimating the standard deviation of stock
market returns, the mean of our calculated share price volatility of 0.659195989 is multiplied by
constant 0.6008 .the outcome is 39.6 percent .
4.2 Correlation Analysis amongst Variables
Table 4.2 represents the correlation amongst variables. Table 4.2 indicates that P.vol and
D.yield are negatively correlated with value of -0.524 and it is significant at level of 1 %. The
value of correlation coefficient between P.vol and D.yield is in line with (Baskin, 1989)’s results,
while it is contrary to (Allen & Rachim, 1996) findings.
P.vol and dividend payout are negatively correlated with value of -0.382 and it is
significant at level of 1%. it is consistent with both (Baskin, 1989)’s findings and (Allen &
Rachim, 1996) results .
The results presented in Table 4.2 show that P.vol and size have significant negative
association which is consistent with our expectation. Because large-sized firms are usually more
diversified and small firms may have less public information, larger firms are expected to be less
risky and have less share price volatility. P.vol and size are negatively correlated with value of -
0.542 and it is significant at level of 1%. It can also be seen from Table 4.2 that size and
dividend payout has correlation of 0.222 which is significant at level of 5%. This positive
correlation implies that larger size firms may have more dividend payout.
E.vol and P.vol are positively correlated with value of 0.514 and it is significant at level
of 1%.This significant positive relationship between P.vol and E.vol is also consistent with our
expectation. Based on table 4.2, E.vol and size are negatively correlated with value of 0.292 and
it is significant at level of 1% showing that larger firms may have less volatility in their earnings.
The correlation between dividend yield and debt is -0.295 and significant at level of 5%
.It implies that companies with high debt may have less dividend payment.
According to Table 4.2, D. yield and dividend payout are positively correlated with value
of 0.537 and it is significant at level of 1 % .This signals possibility of multicollinearity between
D.yield and dividend payout. For considering this problem, the control variables are added to my
primarily regression model to see whether it causes any change in result of regression. Also the
regression is repeated in two other steps. In the first step, the dividend payout is excluded from
regression model. In the second step, the dividend yield is excluded from regression equation and
regression is done with dividend payout and other control variables.
(Table 4.2, Pearson correlation between variables)
P.vol D.yield Payout Size E.vol Debt Growth
P.vol D.yield
1 -0.524**
1
Payout -0.382** 0.537** 1
Journal of Business Studies Quarterly
2012, Vol. 4, No. 1, pp. 111-129
124
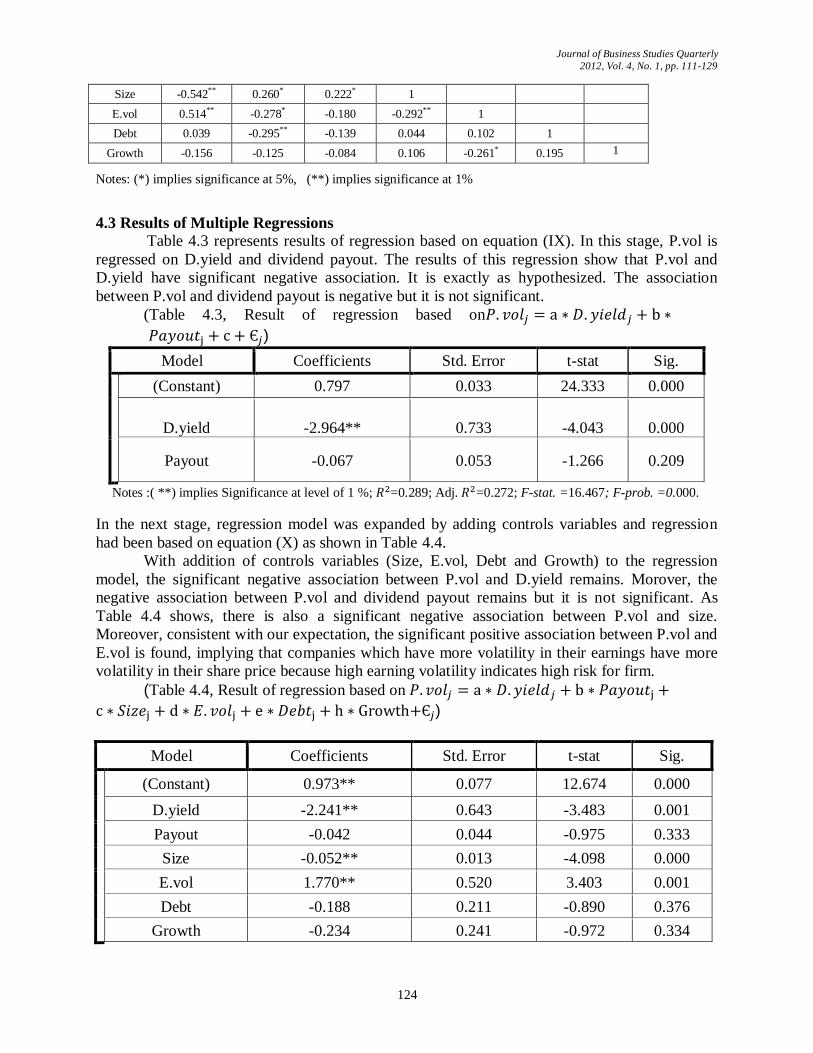
Size -0.542** 0.260* 0.222* 1
E.vol 0.514** -0.278* -0.180 -0.292** 1
Debt 0.039 -0.295** -0.139 0.044 0.102 1
Growth -0.156 -0.125 -0.084 0.106 -0.261* 0.195 1
Notes: (*) implies significance at 5%, (**) implies significance at 1%
4.3 Results of Multiple Regressions
Table 4.3 represents results of regression based on equation (IX). In this stage, P.vol is
regressed on D.yield and dividend payout. The results of this regression show that P.vol and
D.yield have significant negative association. It is exactly as hypothesized. The association
between P.vol and dividend payout is negative but it is not significant.
(Table 4.3, Result of regression based on
)
Model Coefficients Std. Error t-stat Sig.
(Constant) 0.797 0.033 24.333 0.000
D.yield
-2.964**
0.733
-4.043
0.000
Payout -0.067 0.053 -1.266 0.209
Notes :( **) implies Significance at level of 1 %; =0.289; Adj. =0.272; F-stat. =16.467; F-prob. =0.000.
In the next stage, regression model was expanded by adding controls variables and regression
had been based on equation (X) as shown in Table 4.4.
With addition of controls variables (Size, E.vol, Debt and Growth) to the regression
model, the significant negative association between P.vol and D.yield remains. Morover, the
negative association between P.vol and dividend payout remains but it is not significant. As
Table 4.4 shows, there is also a significant negative association between P.vol and size.
Moreover, consistent with our expectation, the significant positive association between P.vol and
E.vol is found, implying that companies which have more volatility in their earnings have more
volatility in their share price because high earning volatility indicates high risk for firm.
(Table 4.4, Result of regression based on
)
Model Coefficients Std. Error t-stat Sig.
(Constant) 0.973** 0.077 12.674 0.000
D.yield -2.241** 0.643 -3.483 0.001
Payout -0.042 0.044 -0.975 0.333
Size -0.052** 0.013 -4.098 0.000
E.vol 1.770** 0.520 3.403 0.001
Debt -0.188 0.211 -0.890 0.376
Growth -0.234 0.241 -0.972 0.334
©JBSQ 2012 125
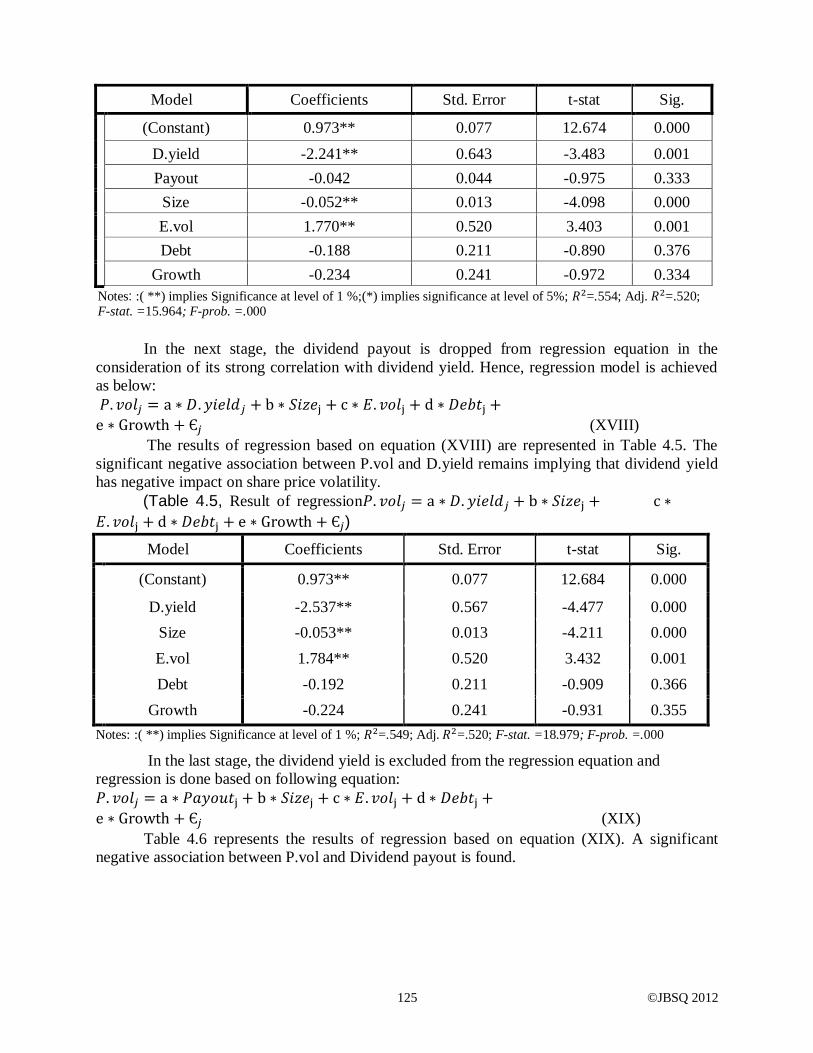
Model Coefficients Std. Error t-stat Sig.
(Constant) 0.973** 0.077 12.674 0.000
D.yield -2.241** 0.643 -3.483 0.001
Payout -0.042 0.044 -0.975 0.333
Size -0.052** 0.013 -4.098 0.000
E.vol 1.770** 0.520 3.403 0.001
Debt -0.188 0.211 -0.890 0.376
Growth -0.234 0.241 -0.972 0.334
Notes: :( **) implies Significance at level of 1 %;(*) implies significance at level of 5%; =.554; Adj. =.520; F-stat. =15.964; F-prob. =.000
In the next stage, the dividend payout is dropped from regression equation in the
consideration of its strong correlation with dividend yield. Hence, regression model is achieved
as below:
(XVIII)
The results of regression based on equation (XVIII) are represented in Table 4.5. The
significant negative association between P.vol and D.yield remains implying that dividend yield
has negative impact on share price volatility.
(Table 4.5, Result of regression
)
Model Coefficients Std. Error t-stat Sig.
(Constant) 0.973** 0.077 12.684 0.000
D.yield -2.537** 0.567 -4.477 0.000
Size -0.053** 0.013 -4.211 0.000
E.vol 1.784** 0.520 3.432 0.001
Debt -0.192 0.211 -0.909 0.366
Growth -0.224 0.241 -0.931 0.355
Notes: :( **) implies Significance at level of 1 %; =.549; Adj. =.520; F-stat. =18.979; F-prob. =.000
In the last stage, the dividend yield is excluded from the regression equation and
regression is done based on following equation:
(XIX)
Table 4.6 represents the results of regression based on equation (XIX). A significant
negative association between P.vol and Dividend payout is found.
Journal of Business Studies Quarterly
2012, Vol. 4, No. 1, pp. 111-129
126
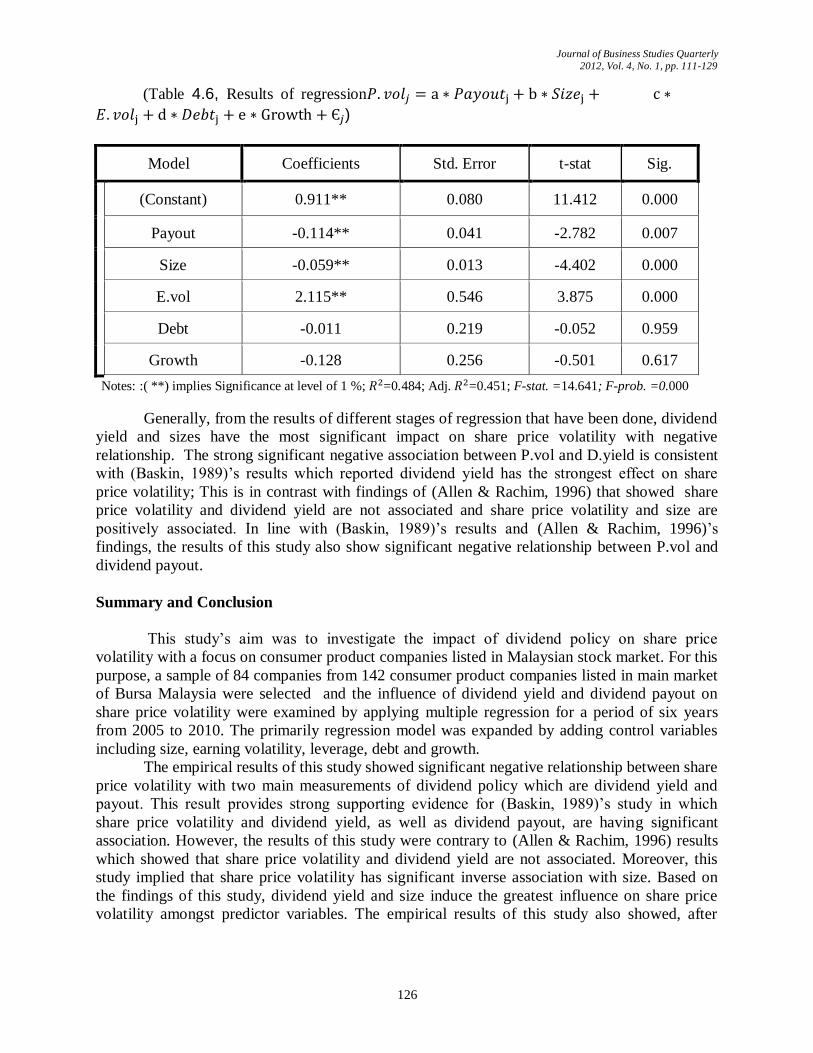
(Table 4.6, Results of regression
)
Model Coefficients Std. Error t-stat Sig.
(Constant) 0.911** 0.080 11.412 0.000
Payout -0.114** 0.041 -2.782 0.007
Size -0.059** 0.013 -4.402 0.000
E.vol 2.115** 0.546 3.875 0.000
Debt -0.011 0.219 -0.052 0.959
Growth -0.128 0.256 -0.501 0.617
Notes: :( **) implies Significance at level of 1 %; =0.484; Adj. =0.451; F-stat. =14.641; F-prob. =0.000
Generally, from the results of different stages of regression that have been done, dividend
yield and sizes have the most significant impact on share price volatility with negative
relationship. The strong significant negative association between P.vol and D.yield is consistent
with (Baskin, 1989)’s results which reported dividend yield has the strongest effect on share
price volatility; This is in contrast with findings of (Allen & Rachim, 1996) that showed share
price volatility and dividend yield are not associated and share price volatility and size are
positively associated. In line with (Baskin, 1989)’s results and (Allen & Rachim, 1996)’s
findings, the results of this study also show significant negative relationship between P.vol and
dividend payout.
Summary and Conclusion
This study’s aim was to investigate the impact of dividend policy on share price
volatility with a focus on consumer product companies listed in Malaysian stock market. For this
purpose, a sample of 84 companies from 142 consumer product companies listed in main market
of Bursa Malaysia were selected and the influence of dividend yield and dividend payout on
share price volatility were examined by applying multiple regression for a period of six years
from 2005 to 2010. The primarily regression model was expanded by adding control variables
including size, earning volatility, leverage, debt and growth.
The empirical results of this study showed significant negative relationship between share
price volatility with two main measurements of dividend policy which are dividend yield and
payout. This result provides strong supporting evidence for (Baskin, 1989)’s study in which
share price volatility and dividend yield, as well as dividend payout, are having significant
association. However, the results of this study were contrary to (Allen & Rachim, 1996) results
which showed that share price volatility and dividend yield are not associated. Moreover, this
study implied that share price volatility has significant inverse association with size. Based on
the findings of this study, dividend yield and size induce the greatest influence on share price
volatility amongst predictor variables. The empirical results of this study also showed, after
©JBSQ 2012 127
dividend yield, earnings volatility has the most impact on share price volatility and induces
significant positive influence on volatility of share price.
The significant negative linkage between share price volatility and dividend yield
provides empirical supporting evidence for the duration effect, the rate of return effect, the
pricing arbitrage effect and the information effect. In addition, significant negative impact of pay
out on share price volatility supports the rate of return and the information effect.
Based on the duration effect, it is expected that share price of companies with high
dividend yield be less responsive to fluctuation in discount rate because high dividend yield
implied near-term cash flow. Therefore, an inverse association between dividend yield and share
price volatility is expected which is in line with this study’s results.
Moreover based on the rate of return effect, companies which have small dividend yield
and small dividend payout are possible to be assessed more valuable than their assets in place
due to their growth potential. Since forecasts of earning from growth opportunity have more
error than prediction of earning from assets in place, firms with low pay out and low dividend
yield may show higher volatility in their share price. Hence, it is expected that share price
volatility and dividend yield, as well as dividend payout, are associated inversely which is
consistent with this study’s results.
Furthermore, based on the pricing arbitrage effect, since excess return is subordinate of
dividend yield and discount rate, higher dividend yield will lead to higher arbitrage profit. Hence
it is expected that share price volatility and dividend yield are associated inversely which is in
line with this study’s results.
Additionally, based on information effect, high dividends may signal stability of firm.
Therefore it is expected that dividend yield and dividend payout have negative impact on share
price volatility which is consistent to this study’s results.
Based on results of this study, it can be concluded that managers of companies may be able
to change their volatility of their share prices by altering their dividend policy. Indeed, it may be
possible for them to use dividend policy as a device for controlling their share price volatility.
They may be able to reduce their share price volatility by increasing their dividend payout.
The results of this study are only limited to consumer product companies listed in main
market of Kuala Lumpur Stock Exchange and further studies in different sectors of Malaysian
stock market is needed for expanding the results to other sectors and the entire Malaysian stock
market .
References
Allen, D. E., & Rachim, V. S. (1996). Dividend policy and stock price volatility: Australian
evidence. Applied Financial Economics, 6(2), 175-188.
Amihud, Y., & Murgia, M. (1997). Dividends, taxes, and signaling: evidence from Germany.
Journal of Finance, 397-408.
Asquith, P., & Mullins Jr, D. W. (1983). The impact of initiating dividend payments on
shareholders' wealth. Journal of Business, 77-96.
Baker, H. K., Farrelly, G. E., & Edelman, R. B. (1985). A survey of management views on
dividend policy. Financial management, 78-84.
Baker, H. K., & Powell, G. E. (1999). How corporate managers view dividend policy. Quarterly
Journal of Business and Economics, 17-35.
Journal of Business Studies Quarterly
2012, Vol. 4, No. 1, pp. 111-129
128
Ball, R., Brown, P., Finn, F. J., & Officer, R. (1979). Dividends and the value of the firm:
evidence from the Australian equity market. Australian Journal of Management, 4(1), 13-
26.
Baskin, J. (1989). Dividend policy and the volatility of common stocks. The Journal of Portfolio
Management, 15(3), 19-25.
Ben-Zion, U., & Shalit, S. S. (1975). Size, leverage, and dividend record as determinants of
equity risk. The Journal of Finance, 30(4), 1015-1026.
Black, F., & Scholes, M. (1974). The effects of dividend yield and dividend policy on common
stock prices and returns. Journal of Financial Economics, 1(1), 1-22.
Brennan, M. (1971). A note on dividend irrelevance and the Gordon valuation model. The
Journal of Finance, 26(5), 1115-1121.
Chen, J., & Dhiensiri, N. (2009). Determinants of dividend policy: The evidence from New
Zealand. International Research Journal of Finance and Economics, 34, 18-28.
Dhaliwal, D. S., Erickson, M., & Trezevant, R. (1999). A test of the theory of tax clienteles for
dividend policies. National Tax Journal, 52, 179-194.
Diamond, J. J. (1967). Earnings distribution and the evaluation of shares: Some recent evidence.
Journal of Financial and Quantitative Analysis, 2(01), 15-30.
Eades, K. M. (1982). Empirical evidence on dividends as a signal of firm value. Journal of
Financial and Quantitative Analysis, 17(4), 471-500.
Gordon, M. J. (1962). The Investment, Financing, and Valuation of the Corporation
(Homewood, Illinois: Irwin Publishers.
Hakansson, N. H. (1982). To pay or not to pay dividend. The Journal of Finance, 37(2), 415-
428.
Holder, M. E., Langrehr, F. W., & Hexter, J. L. (1998). Dividend policy determinants: An
investigation of the influences of stakeholder theory. Financial management, 73-82.
Hussainey, K., Mgbame, C. O., & Chijoke-Mgbame, A. M. (2011). Dividend policy and share
price volatility: UK evidence. Journal of Risk Finance, The, 12(1), 57-68.
Jensen, G. R., Solberg, D. P., & Zorn, T. S. (1992). Simultaneous determination of insider
ownership, debt, and dividend policies. Journal of Financial and Quantitative Analysis,
27(2), 247-263.
Kinder, C. (2002). Estimating Stock Volatility: mimeo.
Lewellen, W. G., Stanley, K. L., Lease, R. C., & Schlarbaum, G. G. (1978). Some direct
evidence on the dividend clientele phenomenon. The Journal of Finance, 33(5), 1385-
1399.
Lintner, J. (1956). Distribution of incomes of corporations among dividends, retained earnings,
and taxes. The American Economic Review, 46(2), 97-113.
Miller, M. H., & Modigliani, F. (1961). Dividend policy, growth, and the valuation of shares. the
Journal of Business, 34(4), 411-433.
Nazir, M. S., Nawaz, M. M., Anwar, W., & Ahmed, F. (2010). Determinants of stock price
volatility in karachi stock exchange: The mediating role of corporate dividend policy.
International Research Journal of Finance and Economics(55).
Nishat, M., & Irfan, C. M. (2004). Dividend Policy and Stock Price Volatility in Pakistan.
Pandey, I. (2003). Corporate dividend policy and behaviour: the Malaysian evidence. Asian
Academy of Management Journal, 8(1), 17-32.
Parkinson, M. (1980). The extreme value method for estimating the variance of the rate of return.
Journal of Business, 61-65.
©JBSQ 2012 129
Pettit, R. R. (1977). Taxes, transactions costs and the clientele effect of dividends. Journal of
Financial Economics, 5(3), 419-436.
Rozeff, M. (1982). Growth, beta and agency costs as determinants of dividend payout ratios.
Journal of Financial Research, Vol. 5, No. 3, pp. 249-259, Fall 1982.
Saxena, A. K. (1999). Determinants of dividend payout policy: regulated versus unregulated
firms. Journal of Applied Topics in Business and Economics.
Scholz, J. K. (1992). A direct examination of the dividend clientele hypothesis. Journal of Public
Economics, 49(3), 261-285.
Suleman, M., Asghar, M., Ali Shah, S., & Hamid, K. (2011). Impact of Dividend Policy on
Stock Price Risk: Empirical Evidence from Equity Market of Pakistan.
Travlos, N., Trigeorgis, L., & Vafeas, N. (2001). Shareholder wealth effects of dividend policy
changes in an emerging stock market: The case of Cyprus. Multinational Finance
Journal, 5(2), 87-112.
Uddin, M. H., & Chowdhury, G. M. (2005). Effect of Dividend Announcement on Shareholders’
Value: Evidence from Dhaka Stock Exchange. Journal of Business Research, 1.