the impact of comprehensive allocation and flow-through
TRANSCRIPT
Louisiana State UniversityLSU Digital Commons
LSU Historical Dissertations and Theses Graduate School
1987
The Impact of Comprehensive Allocation andFlow-Through Method of Accounting for theIncome Taxes on the Investment Decision: A FieldExperiment.Zafar Ullah KhanLouisiana State University and Agricultural & Mechanical College
Follow this and additional works at: https://digitalcommons.lsu.edu/gradschool_disstheses
This Dissertation is brought to you for free and open access by the Graduate School at LSU Digital Commons. It has been accepted for inclusion inLSU Historical Dissertations and Theses by an authorized administrator of LSU Digital Commons. For more information, please [email protected].
Recommended CitationKhan, Zafar Ullah, "The Impact of Comprehensive Allocation and Flow-Through Method of Accounting for the Income Taxes on theInvestment Decision: A Field Experiment." (1987). LSU Historical Dissertations and Theses. 4455.https://digitalcommons.lsu.edu/gradschool_disstheses/4455

INFORMATION TO USERS
The most advanced technology has been used to photograph and reproduce this manuscript from the microfilm master. UMI films the original text directly from the copy submitted. Thus, some dissertation copies are in typewriter face, while others may be from a computer printer.
In the unlikely event that the author did not send UMI a complete manuscript and there are missing pages, these will be noted. Also, if unauthorized copyrighted material had to be removed, a note will indicate the deletion.
Oversize m aterials (e.g., maps, drawings, charts) are reproduced by sectioning the original, beginning at the upper left-hand comer and continuing from left to right in equal sections with small overlaps. Each oversize page is available as one exposure on a standard 35 mm slide or as a 17" x 23" black and white photographic print for an additional charge.
Photographs included in the original manuscript have been reproduced xerographically in this copy. 35 mm slides or 6" x 9" black and white photographic prints are available for any photographs or illustrations appearing in this copy for an additional charge. Contact UMI directly to order.
I UMIA ccessing th e World's Information s in ce 1938
300 North Z eeb Road, Ann Arbor, Ml 48106-1346 USA


O rder N u m b er 8811415
The im pact o f comprehensive allocation and flow-through m ethod o f accounting for the income taxes on the investment decision: A field experiment
Khan, Zafar Ullah, Ph.D.
The Louisiana State University and Agricultural and Mechanical Col., 1987
C opyright © 1 9 8 8 b y K h an , Zafar U lla h . A ll r igh ts reserved.
UMI300 N. Zeeb Rd.Ann Arbor, MI 48106


PLEASE NOTE:
In all cases this material has been filmed in the best possible way from the available copy. Problems encountered with this document have been identified here with a check mark V .
1. Glossy photographs or pages______
2. Colored illustrations, paper or print_______
3. Photographs with dark background_____
4. Illustrations are poor copy_______
5. Pages with black marks, not original copy i /
6. Print shows through as there is text on both sides of p a g e _______
7. Indistinct, broken or small print on several pages
8. Print exceeds margin requirements______
9. Tightly bound copy with print lost in sp ine_______
10. Computer printout pages with indistinct print_______
11. Page(s)___________ lacking when material received, and not available from school orauthor.
12. Page(s) _ _ seem to be missing in numbering only as text follows.
13. Two pages num bered . Text follows.
14. Curling and wrinkled pages______
15. Dissertation contains pages with print at a slant, filmed a s received_________
16. Other_______________________________________________________________________
UMI

THE IMPACT OF COMPREHENSIVE ALLOCATION AND FLOW-THROUGH METHOD OF ACCOUNTING FOR THE INCOME TAXES ON THE
INVESTMENT DECISION: A FIELD EXPERIMENT
A DissertationSubmitted to the Graduate Faculty of the
Louisiana State University and Agricultural and Mechanical College
in partial fulfillment of the requirements for the degree of
Doctor of Philosophy
inThe Department of Accounting
byZafar Ullah Khan
B.Sc., Aligarh Muslim University, India, 1972 M.S., Indian Institute of Technology, Madras, 1974 .B .A ., University of North Carolina, Chapel Hill, 1983
December, 1987

©1988
Z A F A R ULLA H KHAN
All Rights Reserved

ACKNOWLEDGEMENTS
I would like to express my sincere appreciation to the members of my dissertation committee: Dr. Nicholas G.Apostolou, Dr. Thomas R. Gulledge, Jr., Dr. Michael J.R. Hoffman, Dr. William G. Mister, and Dr. David B. Vicknair.I would like to express a special thank you to Dr. Apostolou, my chairman, and to Dr. Mister. I am grateful to all my committee members for their valuable suggestions, guidance, and encouragement. I would also like to say a very special thank you to professor Bart P. Hartman for his help and encouragement throughout the program. Finally, a thank you to Dr. Charles R. O'Neal for some very helpful comments on the questionnaire and to Dr. Dale J. Hockstra for his support and encouragement.
Most importantly, I offer special appreciation to my parents, Mr. and Mrs. Shujaat U. Khan, for their love, support, and encouragement. I dedicate this research to the loving memory of my father, who left for his heavenly abode on July 27, 1987.

TABLE OF CONTENTSPage
ACKNOWLEDGEMENTS ...................................... iiLIST OF T A B L E S ........................................ viA BSTRACT................................. vii
CHAPTERI INTRODUCTION AND OVERVIEW OF STUDY ........... 1
Historical Background ...................... 3Purpose of Research ........................ 7Research Methodology ........................ 9Contributions of the S t u d y .................. 11Endnotes...................................... 13
II LITERATURE REVIEW ............................. 15Introduction ................................. 15Growth of Deferred Taxes .................... 17
Davidson Studies .......................... 17Livingstone Studies ...................... 20Voss S t u d y ................................. 22Other S t u d i e s ............................. 23
Relative Accuracy Approach .................. 25Greenball Study ........................... 25
Market Association .......................... 26Beaver and Dukes Studies .................. 26Archibald Study .......................... 27Kaplan and Roll S t u d y .................... 28
Prediction of Bond R a t i n g s .................. 29Huss S t u d y ................................. 29
Behavioral Studies .......................... 30Kreuze Study ............................... 30
Limitations of Prior Research ............. 31Endnotes...................................... 33
iii

PageCHAPTER
III RESEARCH METHODOLOGY .......................... 35Introduction ................................. 35Behavioral Science Experimental Approach . . 35Research Questions........... 1 ............ 37Design of Research Instrument ............. 38Experimental T a s k ..................... 41The Subjects . . . . ...................... 44
Financial Analysts . . '.................... 44V a r i a b l e s ................................... 46
The Independent Variables ............... 46The Dependent Variables .................. 47
Hypotheses and Expectations ............... 49Experimental Design ........................ 58Statistical Analysis ........................ 61Reliability and Validity .................... 65Endnotes..................................... 69
IV DATA A N A L Y S I S ................................. 72Introduction ................................. 72The Response R a t e .......................... 72Statistical Analysis ........................ 77
Test of the Assumptions of the Model . . . 77MANOVA Results ............................. 80ANOVA Main E f f e c t s ........................ 83Multiple Comparisons for the METHOD Effect 85Tests of the Accuracy Hypotheses 13 and 14 87Statistical Analysis of the
Perception Variables .................... 90Characteristics of Subjects ............. 96
Summary of the Re s u l t s...................... 98Endnotes..................................... 104
V SUMMARY AND CONCLUSIONS ...................... 108S u m m a r y ..................................... 108Research Implications ...................... 113L i m i t a t i o n s ................................. 117Future R e s e a r c h ........................ 118Endnotes..................................... 120
iv

PageBIBLIOGRAPHY .......................................... 121APPENDIX
A. Sample Questionnaire for High CompanyUsing D M C A ................................. 137
B. Sample Questionnaire for High CompanyUsing the FT M e t h o d ....................... 144
C. Sample Questionnaire for High CompanyUsing the FTD M e t h o d ....................... 151
D. Sample Questionnaire for Low CompanyUsing D M C A ................................. 158
E. Sample Questionnaire for Low CompanyUsing the FT M e t h o d ....................... 165
F. Sample Questionnaire for Low CompanyUsing the FTD M e t h o d ....................... 172
G. Sample Cover Letter for the First Mailing . 179H. Sample Post Card R e m i n d e r ............. 181I. Sample Cover Letter for the Second Mailing . 183
V I T A .................................................. 185
v

747676818284868990
93
94959799
LIST OF TABLES
Response to Telephone Follow-up . . . .MANOVA Results for Early/Late Test . .Distribution of Subjects Within Cells .MANOVA Results for Unranked Data . . .MANOVA Results for Ranked Data . . . .Univariate Analysis of Variance ResultsMean Scores of the Decision Variables .Group Means (MSE) for NIAC and SPAC . .Hypotheses H13 and H14 ANOVA ResultsAdjusted Frequency (%) of the Responses
on the Perception Variables .........Descriptive Statistics of the
Perception Variables ...............ANOVA Results for the INFO Variable . .MANOVA Results for RATING Variable . .Demographic Data ......................Hypotheses Tests Summary .............
vi

ABSTRACT
The purpose of this study was to determine whether investment decisions are affected by (1) alternative methods of accounting for income taxes and (2) the magnitude of deferred tax credits in the balance sheet. Financial analysts were asked to estimate net income and stock price, and to provide equivalence intervals as measures of uncertainty. The subjects based their predictions upon financial statements of a real company and selected financial information. Six different forms of the information cue set were used-- three accounting methods (deferred method of comprehensive allocation, flow-through, and flow-through with footnote disclosure of deferred taxes as under the deferred method of comprehensive allocation) and two levels of deferred tax credits (high and low). The responses were analyzed using multivariate analysis of variance (MANOVA) in a 3 X 2 factorial experimental design. In addition, the mean square error (MSE) was used as a dependent variable to determine the effect of the accounting methods on the accuracy of the subjects' net income and stock price predictions.
The research found evidence that the different methods of accounting for income taxes affect financial analysts'

prediction of net income as well as their confidence in their net income predictions. However, the effect did not carryover to the analysts' prediction of stock price and their confidence in their stock price predictions. The magnitude of deferred tax credits in the balance sheet affects stock price prediction, but not net income prediction and the two confidence intervals. Also, financial analysts who received financial statements based on the deferred method of comprehensive allocation made more accurate net income predictions and had greater confidence in their net income predictions. There were no significant differences in the responses of financial analysts who received financial statements based on the flow-through method or flow-through method with footnote disclosure of deferred taxes as under the deferred method of comprehensive allocation.

CHAPTER IINTRODUCTION AND OVERVIEW OF STUDY
INTRODUCTION
Financial accounting for federal income taxes has been a controversial issue from its inception. Reconsideration of Accounting Principles Board Opinion No. 11 (APB 11), Accounting for Income Taxes [AICPA, 1967], and other related authoritative pronouncements has been on the Financial Accounting Standard Board (FASB) technical agenda since January, 1982. Recently, the Board issued an Exposure Draft, Accounting for Income Taxes, which proposes to continue with comprehensive allocation, but requires the liability method instead of the cleferred method [FASB, 1986].
Despite a plethora of articles on the subject, the fact remains that the question of allocation of income taxes has not been adequately studied. A review of the related literature revealed that most writers have adopted an a priori deductive approach. This approach is rarely successful when apparently reasonable and informed people differ, and pure deductive logic alone cannot resolve this very perplexing issue [Wolk, Francis and Tearney, 1984, p.430].
1

2
Accounting is an empirical discipline, and as such accounting hypotheses ultimately must be verified empirically [Yu, 1976, p.276]. Unfortunately, few empirical studies on the subject of income tax allocat_on have been conducted and the results of those studies that have been reported are not conclusive.-*- Several empirical studies have attempted to identify classes of asset expenditures or investment patterns (such as linear, nonlinear, cyclical and bunched) and determine whether the resultant tax differences, due to timing differences, are permanent or temporary [Davidson, 1958; Livingstone, 1969; McGee, 1984; Voss, 1968]. These studies have concluded that payback of deferred taxes is the exception and that comprehensive tax allocation based on the reversal of tax deferrals may not be valid. Alternately, a few efficient market and other studies have employed a predictive ability criterion. These studies have suggested that comprehensive income tax allocation using the deferred method is most consistent with the information set used in setting security prices [Beaver and Dukes, 1972], and also more accurate with respect to the internal rate of return (IRR) criterion [Greenball, 1969]. These apparent contradictory conclusions offer little practical help in resolving the income tax allocation question.
Given the FASB's stated objective of financial reporting for individual investors, creditors and other external users,
3
and the focus on decision usefulness of reported information, it is surprising that no behavioral studies on accounting for income taxes have been undertaken. Behavioral or decision- oriented methodologies have been applied successfully to many areas of accounting and appear to be particularly appropriate for studying the impact of alternative income tax accounting methods on individual decision makers. This study is a behavioral experiment designed to examine the effect of alternative income tax accounting methods on the investment decisions of financial statement users.
HISTORICAL BACKGROUND
The income tax allocation controversy seems to have begun with the prescribed treatment of "Unamortized Discount and Redemption Premium on Bonds Refunded" in Accounting Research Bulletin No. 2 (ARB 2) published in September 1939 [Chamberlain, 1958, p.23]. However, the first explicit reference to income tax allocation was in ARB 18, a supplement to ARB 2 , published in December, 1942. ARB 18 proposed a charge to income equal to the reduction in current income taxes resulting from the refunding of bonds with unamortized discount and redemption premium [Chamberlain, 1958].

4
Income tax allocation found additional support in ARB 23 [AICPA, 1944]. Paragraph 1 of ARB 23 states that "income taxes are an expense which should be allocated, when necessary and practicable, to income and other accounts, as other expenses are allocated." According to Black [1966], the point of contention has been the meaning of the phrase "when necessary and practicable." While the advocates of comprehensive allocation view tax allocation as always necessary and practicable, the advocates of flow-through adopt the opposite view. Proponents of partial allocation adopt a more pragmatic view, proposing tax allocation based on the probability of reversal of individual timing differences.
The general allocation approach of ARB 23 was continued in ARB 43. However, ARB 43 also stated that this treatment would not apply when particular timing differences were expected to recur regularly over a comparatively long period of time [Carr, 1963]. The amendment of the Internal Revenue Code in 1954 to allow accelerated depreciation methods for tax purposes [Schwartz, 1981] and the requirement to defer income taxes for depreciation with indefinite timing reversals, in ARB 44 (Revised) [AICPA, 1958], revived the debate. The debate was heated and l i v e l y , 2 and evoked strong senti- ments--"Accounting is complex enough in its own right without being plagued by devious and far fetched concoctions such as

5
deferred tax liabilities and interest free loans [Dohr,1959, p.19]."
Despite the conceptual problems implicit in comprehensive allocation of income taxes, Accounting Research Study No. 9 (ARS 9) recommended comprehensive interperiod income tax allocation for all material timing differences [Ditkoff, 1977]. Accounting Principles Board Opinion No. 11 (APB 11) [AICPA, 1967] adopted comprehensive income tax allocation, as recommended in ARS 9 , and the deferred method. However,APB 11 was not unanimously accepted by all members of the Board or by all practicing accountants [Nurnberg, 1969].APB 11 was approved by a bare two-thirds majority of the Board (14 members), the minimum needed for passage.
The attention currently being paid the income tax allocation issue has resulted from the recent resurgence of criticism of comprehensive allocation [Beechy, 1985].Further, guidance in some of the numerous official pronouncements dealing with income tax allocation is both contradictory [Bohan, 1979], and inconsistent with the basic
f
principles in APB 11 [Beresford, 1982]. Ditkoff has concluded that "financial tax accounting is now a bewildering amalgam of theoretical anomalies, inconsistencies and specious assumptions [1977, p.78]." Income tax allocation remains a subject of debate and controversy [Wyatt, et al., 1984] .

6
In response to criticism and calls for reconsideration of APB 11, the FASB added the income tax project to its technical agenda in January, 1982.3 jn April, 1984 the Board held public hearings. The hearings highlighted the persistent and considerable disagreement among the diverse interest groups. However, most of the 45 interest groups which presented testimony favored comprehensive income tax allocation. ̂ Citing sharp differences based on company size and ownership, the FASB scheduled three special meetings in Hay, 1984 to obtain the views of preparers, users and auditors associated with the financial statements of small companies. The Board addressed the issue of the extent of interperiod tax allocation (i.e., no allocation, partial allocation, and comprehensive allocation) at its meeting in June 1984, and tentatively concluded that comprehensive interperiod tax allocation should be required [FASB, 1984]. In subsequent deliberations the Board has concluded that the liability (or asset) method should be required for all companies and has recently issued an exposure draft of a proposed statement of financial accounting standards [FASB, 1986].

7
PURPOSE OF RESEARCH
The Discussion Memorandum issued by the FASB [1983] identifies six broad issues. Issue 1A, "Should the effects of income taxes recognized in financial reporting income be the amount of taxes payable for the period as determined by the tax return?" is the threshold issue, which must be resolved before other issues can be considered. The present study investigated this threshold issue.5
Empirical research to date has provided little information on the decision usefulness of comprehensive tax allocation to financial statement users [Kreuze, 1983]. To assess the decision usefulness of deferred tax information, this study employed a behavioral experiment to observe changes in the investment decisions of financial statement users provided with accounting information under alternative methods of accounting for income taxes. The major research question addressed by the study is: What is the effect onthe investment decisions of financial statement users of financial information prepared using (1) the deferred method of comprehensive income tax allocation, and (2) the flowthrough method of accounting for income taxes? Evidence was also gathered to assess whether footnote disclosure of deferred tax information is equivalent to formal recognition in the body of the financial statements.®

3
The subjects for this study were a random sample of financial analysts from the membership Directory of the Financial Analysts Federation (FAF). The membership directory of the FAF provides information based on several classifications, including functional. The choice of subjects was restricted to the appropriate class(es) of financial analysts, such as portfolio managers, research directors, and investment counselors. Several studies have used financial analysts to represent sophisticated users of financial statements [Buzby, 1974; Corless and Norgaard, 1974; Dyckman, 1969; Farrelly, Ferris and Reichenstein, 1985; Godwin, 1975; and Oliver, 1974]. The decision to use financial analysts as subjects was made after extensive discussions with investment and portfolio managers in banks and insurance companies, other researchers, and officials of the FAF.^
A major objective of the study was to determine whether financial statements based on the deferred method of comprehensive income tax allocation would result in different net income and stock price expectations than financial statements based on the flow-through method of accounting for income taxes. Stated another way, the study attempted to determine whether financial analysts vary their expectations, and consequently their investment decisions, as a result of receiving different types of income tax information? Based on the results of the study, inferences were drawn about the
9
usefulness of various types of income tax information.
RESEARCH METHODOLOGY
A randomized control group posttest-only [Campbell and Stanley, 1963] research design was used. The subjects were randomly assigned to one of the six experimental or control groups. Each subject received one set of financial statements and summary information based on three levels of income tax information disclosure: (1) comprehensive income taxallocation using the deferred method; (2) the flow-through method of accounting for income taxes; and (3) the flowthrough method with footnote disclosure of deferred taxes as per (1) above, and two levels of the magnititude of deferred tax credits in the balance sheet (high and low).
The information presented to the subjects was drawn from financial statements and other financial and market information of an actual company. Subjects were asked to predict the company's net income and common stock price and to provide equivalence intervals as measures of uncertainty. The equivalence interval was defined as the range of values considered by the subjects as essentially equivalent to their point estimate of the characteristic in question.

10
Risk and return assessments are fundamental to investment decision making. Since return is a function of stock price [Brealy “-id Myers, 1981, p.242], prediction of future stock price is necessary for an assessment of the ex ante rate of return. Comprehensive allocation and the flowthrough method of income tax accounting affect net income, its variability, and leverage of a company. Further, research has shown that these accounting variables (net income, its variability, and leverage) may provide useful information to investors interested in arriving at an estimate of future return, and an ex ante measure of risk [Farelly, Ferris and Reichenstein, 1985].
Thus, the net income and common stock price expectation (which includes an implicit assessment of future cash flows) and the related equivalence intervals were the four main dependent variables.® In addition, two perception variables were used: (1) the level of information; and (2) the importance of certain information cues. Demographic data was also collected.
Multivariate Analysis of Variance (MANOVA) is the appropriate statistical technique to analyze the data from the 3 X 2 factorial experiment because the four dependent variables were, as expected, highly correlated. Appropriate follow-up techniques, such as univariate analysis of variance (ANOVA) [Hummel and Sligo, 1971] and a posteriori multiple

11
comparisons, were conducted. Testr, for MANOVA assumptions were also conducted. Further, a nonparametric technique, the rank transformation [Conover, 1980], was used because of the non-orthogonal design and violation of MANOVA assumptions.9
CONTRIBUTIONS OF THE STUDY
Little is known about the effect of alternative income tax allocation methods or the magnititude of deferred tax credits in the balance sheet on the decisions of financial statement users. This study provides potentially useful information about the effect of alternative methods of accounting for income taxes and the magnititude of deferred tax credits on the investment decision. The results should be of interest to business, the accounting profession, the FASB, and financial statement users.
Inferences regarding the usefulness of the alternative income tax allocation methods and user perceptions of the behavior of deferred tax account could provide information useful to the FASB in setting accounting standards. This study provided empirical evidence based on a methodology that had not been applied to the income tax allocation issue. Because the controversy over equal usefulness of information disclosed in financial statements and footnotes to different

12
types of users is far from settled, H this study also examined the impact of footnote disclosure of deferred tax information versus formal recognition in the accounts on the investment decision.
To summarize, this research has made an important contribution to the very limited body of empirical research on the subject of interperiod income tax allocation. This study has provided some evidence of the effect of income tax allocation on the investment decision and the perceptions of sophisticated users of accounting information.

13
CHAPTER I ENDNOTES
1. Empirical research on accounting for income taxes is discussed and summarized in Chapter II.
2. For example see Chamberlain [1958], Dohr [1959], Hylton [1959], Graham [1959a and 1959b], and Johns [1958].
3. Several other reasons have been suggested that require areconsideration of accounting for income taxes. These include: the changing tax environment and the passageof the Economic Recovery Tax Act (ERTA) allowing ACRS depreciation [Phillips, 1984]; complexity and difficulty in understanding current requirements of deferred taxes [Volkan and Rue, 1985]; the need for international harmonization of accounting principles and the adoption of the liability method in the United Kingdom [Beresford, 1982]? and the issuance in 1980 of the Statement of Financial Accounting Concepts No. 3, "Elements of Financial Statements of Business Enterprises," which states that the current deferred method does not confirm to the definition of a liability.
4. For a report on the hearings see Liebtag [1984]. Also, comprehensive allocation under APB 11 has the greatest number of supporters among the Big 8 [Miller, 1984],The response in favor of maintaining the status quo for income tax accounting was so overwhelming that Donald Kirk, FASB chairman, dubbed it as "an example of a previous silent majority speaking out [Randall, 1984, p.12]." Further, the proponents of the status quo contend that elimination or modification of present deferred tax treatment would result in sharply increased earnings, and there is concern that this may lead to higher taxes, to union demands for pay increases, and to shareholder demands for higher dividends [Chazen, 1984].
5. Rosenfield and Dent [1983] also come to the conclusion that the threshold issue (whether to allocate income taxes at all) has not been adequately studied.
6 . The Board has rejected the argument that financial

14
information disclosed in footnotes is adequate for all users of financial statements [FASB, 1985, par.112].
7. In a behavioral study, the choice of subjects is important. While there may be no questions about financial analysts representing sophisticated financial statement users, there seems to be concern about the adequateness of their participation in research studies to insure acceptable results. For further justification of subjects see chapter III.
8. Several alternative decision tasks were considered, including earning power and cash flow assessment. Cash flow prediction has conceptual problems because of several alternative definitions. As mentioned in Chapter III stock price prediction has been used by earlier studies as a surrogate for an investment decision and moreover, it provides an objective criterion to assess the quality of the decision. Further, stock price is often conceptualized as discounted future cash flows in finance literature.
9. For detailed discussion of research methodology see Chapter III.
10. Livingstone [1967b] did a post-facto analysis of the rate setting decision of Electric Utilities and found significant differences in equivalent rates of return, under alternative tax allocation methods, for the original-cost rate base class, but not in the fair-value and reproduction-cost classes. Another exception is a Ph.D. dissertation, Comprehensive Income Tax Allocation: A Study Investigating The Extent To Which The Form And Content Of Disclosure Impact Upon Investment Analysis, by Jerry Glenn Krueze [1983] .
11. See note 6, above.

CHAPTER IILITERATURE REVIEW
INTRODUCTION
The fundamental question of income tax allocation is one of measurement,1 that is, which method of accounting for income taxes results in the "correct net income." The answer to this question involves the evaluation of alternative methods against a criterion to determine the "best method." Unfortunately, many accounting research problems lack a "true" criterion. As a result, it is frequently necessary to resort to a surrogate criterion. The criteria that have been commonly employed for assessing the "best" accounting method are: (1) cost; (2) objectivity; and (3) validity.2 Thesethree criteria are also included in the FASB concepts statements.
Studies about income tax allocation have been concerned primarily with validity. Greenball [1971] defines validity as "the degree to which the method actually measures that property it purports to measure" [p.l] and identifies two basic approaches that have been employed to assess validity:(i) direct; and (ii) indirect.
15

16
The direct approach of assessing validity of alternative accounting methods attempts to compare alternative accounting methods to vaguely-defined properties, such as earnings and depreciation, and often leads to confusion and disagreement [Greenball, 1971]. The vast majority of published literature on accounting for income taxes falls into the above category, and may be classified as belonging to the syntactical level of theory construction. These articles, based on the threshold issue (the extent of interperiod tax allocation), can be divided into three groups: (1) those proposing comprehensive interperiod taxallocation; (2) those opposing any interperiod tax allocation (e.g., proponents of the flow-through method); and (3) those proposing partial allocation.-* Because the three views can be supported by strong theoretical arguments [McGoldrick, 1984] it is very difficult to make a choice based on a priori deductive reasoning alone. The various alternatives and the arguments and reasons to support each alternative in the literature have been summarized in Research Report - Accounting for Income Taxes, A Review of Alternatives [Beresford et al., 1983], and will not be discussed further.
The indirect approach of assessing validity of alternative accounting methods attempts to make use of some outside "criterion which is thought to be more definite, such as

17
usefulness, fairness, relevance, or predictive-ability [Greenball, p.2, 1971]." A limited number of research studies on accounting for income taxes have employed this approach and may be classified as belonging to the semantical or interpretational level of theory construction. A major concern of these studies is the behavior of the deferred tax account. These studies are reviewed below.
GROWTH OF DEFERRED TAXES
Davidson StudiesThe main concern generated by ARB No. 44 (Revised)
[AICPA, 1958] was the potential for ever-increasing dollar amounts of deferred tax credits on the balance sheet. Using a simulation approach Davidson [1958] showed that with continued liberal tax rules for depreciation and a management policy of regular investment in assets there will indeed be ever-increasing tax savings for a static or growing firm.
I
Alternately, in the case of a firm with a declining asset base there was a possibility of substantial tax liability. However, the tax liability would result only if the declining years of the firm were profitable, a circumstance which is highly unlikely. Subsequent empirical research findings tend to support Davidson's prediction of significant growth in

18
deferred tax credits and the small probability of their net reversal.
Davidson, Skelton and Weil (DSW) [1977] examined the deferred tax account of companies on the COMPUSTAT tapes for the period 1954 - 1973. During this 20 year period they found that 7 8.6 percent of the annual change entries to the deferred tax account were credits and 21.4 percent were debits. Moreover, the dollar amount of the deferred tax credits exceeded the dollar amount of the debits, by more than 650 percent.
DSW also investigated the question of how depreciation timing differences and reversals affected the deferred tax account. They attempted to verify Davidson's [1958] conclusion that reversal of depreciation timing differences is unlikely to result in a tax liability for a company with a declining asset base (because the company is not likely to be profitable and have any taxable income). DSW found that in 688 out of 3,896 (17.7%) cases (companies) where the deferred tax account decreased, there was also a decrease in the gross plant account. Further, in 168 of these 688 (24.4%) cases the company paid no income taxes in the year the balance in the deferred tax credit account declined. Thus, the data showed that at most 520 companies had a positive net taxable income in the year the deferred tax account decreased together with a decline in the gross plant account. This
19
represented only 2.9 percent of all the companies that had changes in the deferred tax credit account.
In an update of the DSW study, Davidson, Rasch and Weil (DRW) [1984] extended the analyses to data for the period 1973 - 1982. Despite the severe economic contraction of the early 1980s, the results were similar to those of the earlier period. DRW further recognized that the effect of a decrease in the gross plant account on the depreciation timing difference may be delayed for several years. Accordingly, DRW's calculations showed that about 7.5 percent of the companies had a tax liability along with a decrease in the deferred tax account and also a decrease in the gross plant account during the previous four years.
The 7.5 percent substantially exceeds the 2.9 percent reported in the DSW study which was based on a decrease in the gross plant account only in the year of a decrease in the deferred tax account. The comparable percentage for the DRW study was 2.8 percent. Further, the data showed that the recession had a minimal effect on the reversals. Thus, DSW concluded that "the deferred credit tax account is seldom decreased by tax payments arising from the reversals of depreciation timing differences [p. 142]."
Skekel and Fazzi (S&F) [1984] extended the DRW study'sanalyses to capital-intensive companies. The study's sample was selected on the premise that accelerated depreciation is

20
the largest source of deferred taxes and that capital- intensive companies have the greatest potential for such depreciation timing differences. The results of the analysis were more extreme than the DRW study, indicating that the capital-intensive segment of the companies reported on COMPUSTAT were less likely to incur a tax liability because of reversals of depreciation timing differences and reductions in the deferred tax account than the general population.
S&F believed that the results of the Davidson studies and their own study suggested that the probability of an outflow of resources from reversal of depreciation timing differences was low. Hence, there is no liability, as defined in FASB Concepts Statement No. 3, for deferred taxes resulting from depreciation timing differences. S&F, therefore, proposed replacement of comprehensive allocation with some form of partial allocation.
Livingstone StudiesThe question of repayment of deferred tax liability
(credits) resulting from depreciation timing differences has also been investigated by Livingstone [1967a, 1969]. Livingstone studied the effects of cyclical asset expenditures on deferral of income tax associated with use of accelerated depreciation for tax purposes and straight line

21
depreciation for reporting purposes. He used a simulation approach and considered both linear and nonlinear expenditure trends.
Livingstone [1967a] used a general algebraic model of asset expenditures and depreciation. The cyclical asset expenditures were represented mathematically by a sine function combined with a linear trend. The model had a very good fit with actual asset expenditure data for the electric power industry for the years 1947 - 1964. Considering the industry as a single firm, the analysis indicated that there is no deferred tax liability arising from the use of sum-of- the-years-digits depreciation (SYD) for tax purposes and straight line depreciation (SL) for financial reporting.
For individual firms, the model had a good fit with the data for only two out of ten randomly chosen electric utility companies. The results for the two companies were consistent with the analysis for the industry as a whole. Livingstone concluded that the ratio of the trend to the cycle amplitude of asset expenditures was critical in determining the existence of the deferred tax liability. Thus, a sufficiently strong upward trend could offset the impact of regular periodic cycles in asset expenditures.
In a second study, Livingstone [1969] extended his original analysis to include both nonlinear and linear trends as well as four possible asset expenditure patterns. The

22
study also incorporated actual investment data, for the period 1948 - 1967, of Fortune 500 companies who were clients of Price Waterhouse and Company. The data for the 20 year period spanned several recessions in the US economy and had substantial year to year fluctuations.
Even under these highly conducive conditions (recessions and fluctuating investment pattern) for deferred tax repayments, paybacks of deferred tax credits were an exception. Based on the findings of his studies Livingstone concluded that paybacks are the exception rather than the rule and that those who argue in favor of blanket tax allocation are on shaky grounds.
Voss StudyVoss [1968] studied a sample of 217 firms which had
deferred tax credit accounts during the period 1954 - 1965.He hypothesized that small firms are more likely to repay deferred taxes because of higher probability of repayment associated with a bunched investment pattern. Although the results were consistent with the hypothesis, they were not sufficient to validate any comprehensive tax allocation rule. Smaller firms did have a higher number of reversals of deferred taxes as compared to larger firms, however, overall partial repayments were infrequent. The frequency of repayment of deferred taxes arising from reversal of

23
depreciation timing differences was only 1.1 percent (18 reversals out of a possible 1633). Moreover, the dollar amount of these repayments was small. As a result, Voss concluded that repayment can hardly be considered the expected event and he proposed adoption of a selective income tax allocation policy based upon the probability of repayment.
Other StudiesA number of other studies have also documented the
growing materiality of the deferred tax credit account on the balance sheets of an increasingly large number of companies. One of the earliest was a Price Waterhouse and Company study that examined the deferred tax accounts of 100 corporations for the period 1954 - 1965. The study found that only 2 percent of the deferred tax credit accounts reversed during the ten year period e x a m i n e d . ^
Beresford [1982] reported that a survey of 1980 annual reports of the top 'Fortune 250' companies revealed deferred
I
taxes in excess of 20 percent of stockholders' equity for 27 companies. The 1971 amount for the same companies was less than 10 percent compared to the current average of 26 percent. Thus, the deferred tax account had increased at a rate nearly two and one-half times faster than stockholders' equity.

24
Cress and Green (C&G) [1983] have suggested that the1981 Economic Recovery Tax Act (ERTA) and the 1982 Tax Equity and Fiscal Responsibility Act (TEFRA) are likely to further increase the deferred tax accounts and bring within the purview of deferred taxes numerous small companies. C&G have pointed out that ERTA and TEFRA provisions result in substantial tax savings. For example, ERTA and TEFRA omit salvage value from depreciation calculations, allow for a more rapid write-off of the cost of the asset, and permit reduction of the basis by one-half the investment tax credit.5 Thus, it may no longer be desirable for small and medium sized companies to avoid deferred taxes by adopting the same policies for both financial reporting and tax purposes.
McGee [1984] examined 2,027 companies from ten industry groups on the COMPUSTAT tape. To determine the materiality of the deferred tax account, he computed the ratio of deferred taxes to various financial statement items, including assets, net plant, liabilities, equity and net income. The results suggested that the deferred tax account has become more significant over time for a majority of companies in several industries.
To determine whether the deferred tax account is growing at a faster rate than other balance sheet accounts, McGee compared the compound growth rate of the deferred tax account

25
for the years 1973 - 1982 to the compound growth rate of assets, net plant, liabilities and equity. He found that a majority of companies had experienced a higher compound growth rate of their deferred tax account than their assets, net plant, liabilities, or equity.
RELATIVE ACCURACY APPROACH
Greenball StudyWhile most empirical research on accounting for income
taxes attempted to show that deferred credits related to depreciation timing differences will never reverse or identify the conditions under which they are likely to reverse, Greenball [1969] used a new approach. He attempted to assess the alternative methods of accounting for accelerated tax depreciation using a dual criterion of earnings and rate of return accuracy, as determined by the internal rate of return (IRR) model.
Three accounting treatments of accelerated tax depreciation were considered: (1) the flow-through method; (2) thedeferred method (with the deferred tax account balance treated as a contra asset account, rather than as deferred credit); and (3) the accelerated method (defined by Greenball as accelerated depreciation used for both tax and book

26
purposes). Using a multiple asset scenario, after-tax earnings and accounting rates of return were computed under the three methods and compared with the criterion earnings and rate of return given by the IRR model. The findings suggest that the deferred method is more consistent with the IRR earnings model.
Greenball's findings are limited by his restrictive assumptions regarding asset structure, IRR, gross spending on depreciable assets, and benefit flows, which risk oversimplifying the complex real world situation. For example, Beaver and Dukes [p. 320, 1972] have pointed out that correlated measurement errors in earnings make unconditional generalizations about the relative efficacy of deferral or nondeferral methods impossible, and any isolated analysis should be viewed as suspect.
MARKET ASSOCIATION
Beaver and Dukes StudiesBeaver and Dukes (B&D) [1972] proposed another method
for selecting alternative accounting methods. B&D postulated that the association between alternative earnings numbers and security prices should indicate which method is most closely associated with the information set used in setting

27
equilibrium prices. Accordingly, the income tax allocation method whose earnings have the highest association with security prices is the appropriate method.
In their study of association between security prices and earnings based on alternative methods of accounting for interperiod income tax allocation, Beaver and Dukes [1972] came to the unexpected conclusion that deferral earnings are most consistent with the information set used in security prices. Although they interpreted their findings as an endorsement of the APB 111s advocacy of comprehensive income tax allocation, they were reluctant to say that deferral earnings is a better measure of "true" earnings.
In a subsequent study, B&D [1973] treated tax allocation as a form of depreciation. Based on the results of the study, B&D qualified their support for comprehensive allocation by advocating recognition of a wide range of depreciation methods consistent with the underlying benefit flow patterns— a quasi support for the net-of-tax method of deferred income tax accounting.
Archibald StudyArchibald [1972] examined the stock market reaction to
65 firms which had changed from accelerated depreciation methods to the straight-line method for financial reporting purposes after approximately two years of adverse conditions,

28
while continuing to use accelerated methods for income tax purposes. As a result of the accounting change, the firms had to provide for deferred taxes per APB 11. Consequently, there was a significant increase in reported net income. Though Archibald found some support for the "naive investor hypothesis," i.e., the investors were deceived by the significant reported increase in net income, in general there was no substantial effect on the stock market performance of the investigated firms.
Kaplan and Roll StudyKaplan and Roll (K&R) [1972] examined the stock market
performance of 71 companies that had changed from an accelerated method of depreciation to the straight line method for financial reporting purposes, but not for income tax purposes (during 1962-68). The effect of the change was an increase in reported net incomes and deferred tax credit accounts in the balance sheets. K&R used the Sharpe and Lintner capital asset pricing model (CAPM) to examine the abnormal returns and cumulative abnormal returns around the critical event date. They concluded that firms which changed depreciation methods were, on average, dismal performers and there was no significant change in a statistical sense. Although a temporary positive effect could be discerned, there was no lasting effect.

29
PREDICTION OF BOND RATINGS
Huss StudyHuss [1982] investigated the effects of alternative
treatments of deferred income tax credits on the predictive ability of financial ratios in a bond rating context. Financial rati< a for 91 firms were restated for the liability method, the flow-through method and the net-of-tax method. Multiple discriminant analysis was used to examine the effects of these alternative treatments on the predictive ability of the financial ratios. The bond ratings were taken from Moody's Bond Survey.
The results indicated no statistically significant differences in the predictive ability of the three methods.In addition, Huss found no differences in the tendencies of the models to misclassify observations of various bond rating categories. Huss proposed two possible explanations for the results: (1) no single method of accounting for income taxesis employed exclusively in setting bond ratings, and(2) deferred income tax credits are not considered in the decision-making processes of bond raters.

30
BEHAVIORAL STUDIES
Kreuze StudyKreuze [1983] studied the impact on user decisions of no
allocation, partial allocation and comprehensive allocation of income taxes. Questionnaires based on the above income tax allocation methods, and one providing footnote disclosure of all items of difference between taxable income and pre-tax accounting income were sent to 500 North American investment firms. The questionnaires included financial statements for two hypothetical firms.
The main decision task was to allocate $10,000 among the two firms. In addition, the subjects were required to evaluate the two firms based upon nine investment criteria items. The results indicated no statistically significant differences in the evaluation of the investment desirability of one firm over the other as a function of the tax allocation information presented. However, the results are limited by the study's low response rate of 8 percent. Further, there appear to be inconsistencies in the task and information presentated; the main task appears secondary, and the price- earnings ratio and net income per share numbers give conflicting signals.

31
LIMITATIONS OF PRIOR RESEARCH
While the aforementioned studies provide evidence concerning the magnititude and growth of the deferred tax credit account, they do not address the question as to whether the deferred tax credit account is useful to financial statement users. Dickinson [p. 23, 1984] reports that in a recent FASB survey, several users of financial statements indicated that accounting requirements for income taxes are too complex. Many, like Schwartz [1981] and Savoie [1981] have assumed, without any empirical support, that most financial statement users do not fully understand what the deferred tax credit balance represents.®
The "predictive-ability" criterion used by Beaver and Dukes [1972, 1973], and Greenball [1969] to assess alternative accounting methods was severely criticized by Greenball [1971]. Greenball concluded that "in a predictive-ability study, the results do not reflect on the predictive ability of the accounting method tested, but only upon the predictive ability of the products of such methods when used in conjunction with the particular prediction model selected by the investigator [p. 7]." As there is obviously no one universal model that is used by all, the findings of such studies have limited usefulness. Beaver and Dukes [1972] have also recognized that it is more appropriate to interpret the findings

32
within the context of the prediction model used.7The behavioral study by Kreuze [1983] also suffers from
several limitations. These include: low response rate, lack of control over who responds, degree of comprehension of the task, and the extent to which the task represents an actual situation.

33
CHAPTER II ENDNOTES
1. See Beaver and Dukes [p.320, 1972] and Greenball [p.263, 1969]. Deferred tax allocation adds to the problem of using accounting income as a surrogate for economic income and there may be a distortion of the "true" net income. However, as Nurnberg [p.260, 1969] points out, in order to resolve the issue we must examine the effects of tax allocation on the analysis of financial statements.
2. For a detailed discussion of the criteria and approaches, etc., see Greenball [1971].
3. Those who support comprehensive allocation include Baylis [1971], Black [1966], Blough [1958], Carr [1963], Graham [1959a and b], Milburn [1982], Moonitz [1957], Shield [1957] and Spacek [1968]. Those who oppose any allocation include Barton [1970] , Chamberlain [1958] , Chambers [1968], Dohr [1959], Drummond and Wiggle [1981] , Hill [1957], Hylton [1959] , Johns [1958], Khan[1981] , Rosenfield and Dent [1983] , Smith [1984], andVolkan and Rue [1985]. Proponents of partial allocation include Beechy [1985], Dewhirst [1972], Pointer [1973], and Schwartz [1981].
4. Price Waterhouse and Company, Is Generally Accepted Accounting for Income Taxes Possibly Misleading Investors? New York, 1967, mentioned in Kreuze [p. 24, 1983].
5. Also see Oxner and Moore [1984].6. This is not to say that financial statement users fully
understand the implications of comprehensive allocation.On the contrary, the fact that there are several articles (for example see Norgaard [1969], and Lasman and Weil [1978]) addressed to financial analysts, a sophisticated user group, outlining the implications of comprehensive tax allocation for financial analysis suggests that Schwartz, Savoie and others may be right in their assumption. The point made is that there is a lack of empirical evidence.

34
7. For detailed discussion of the limitations of the predictive-ability criterion vis-a-vis accounting research see Ashton [1974] and Beaver et al. [1968].Abdel-Khalik and Keller [1979], and Gonedes and Dopuch [1974] offer further criticism of using efficient market studies to evaluate alternative accounting methods.

CHAPTER IIIRESEARCH METHODOLOGY
INTRODUCTION
This chapter discusses the methodology that was used to test the study's hypotheses concerning the effect of the alternative methods of accounting for income taxes and the magnitude of deferred tax credits in the balance sheet on individual investment decisions. The methodological topics presented in this chapter include the research method, the research questions, the design of research instrument, the experimental task, the subjects, the variables, the hypotheses and expectations, the experimental design, the statistical analysis and, reliability and validity.
BEHAVIORAL SCIENCE EXPERIMENTAL APPROACH ..
This study employed a behavioral science experimental approach to investigate differences in the investment decisions of financial statement users provided with financial information under alternative methods of accounting for
35

36
income taxes. A behavioral approach was deemed appropriate because empirical research to date has not focused on the decision usefulness of., income tax allocation to financial statement users. Further, considerable uncertainty exists concerning how financial statement users make their investment, credit and other decisions. To circumvent the lack of knowledge about the decision process, behavioral science methodologies [Rhode, 1972] are being increasingly adopted in behavioral accounting studies.
An advantage of the behavioral experimental approach is that it permits the researcher to ignore the problem of specifying a single valuation model by allowing a direct comparison of the decision-maker's subjective assessment of returns (or stock price) based on controlled differences in portfolios (or financial statements) [Abdel-Khalik and Keller, 1979, p.18]. The exact method employed by the decision-maker in combining the information to make the judgment is irrelevant [Abdel-Khalik and Keller, 1979, p.18]. Another advantage of the behavioral science experimental approach is that it can be used to evaluate proposed accounting methods, that is, to create conditions that do not exist now and address hypothetical questions [Swieringa and Weick, 1983, p.57].
In an ex post facto study, the impact of a new or proposed accounting method on the decision process or

37
decision outcome of financial statement users cannot be assessed because of a lack of data. This is not a problem with the experimental approach since the effect of the proposed accounting method can be communicated to the subject and its impact on the decision studied.
A number of accounting studies have tested and measured the usefulness of new or added information by observing decisions made by individuals before and after information is provided.1 Although behavioral studies have limitations,2 the methodology is appropriate for investigating questions concerning the usefulness of accounting reports and measurements.
RESEARCH QUESTIONS
The major research question addressed by this study is:1. Does the method of accounting for income taxes
(e.g., deferred method of comprehensive allocation versus the flow-through method) affect the net income and common stock price expectations (and consequently the investment decisions) of financial statement users?
In addition to the above major research question, the following ancillary questions were also examined:
2. Does the form of disclosure (e.g., footnote versus recognition in the body of the financial statements) of income tax information affect the net income and common stock price expectations of financial statement users?

38
3. Does the magnitude (e.g., high or low) of deferred tax credits affect the net income and common stock price expectations and the confidence therein of financial statement users?
4. Which method of accounting for income taxes leads to the most accurate predictions of net income and common stock prices by financial statement users?
5. Do alternative methods of accounting for income taxes affect the confidence of financial statement users in their net income and common stock price predictions?
DESIGN OF RESEARCH INSTRUMENT
This study of alternative accounting methods for income taxes was limited to (1) the deferred method of comprehensive allocation (DMCA); (2) the flow-through method (FT); and(3) the flow-through method with footnote disclosure of all deferred taxes and deferred tax credit balances as under the DMCA (FTD).3
Specimen financial statements based on actual (1977-81) data of Raytheon Company were prepared for two companies hereafter designated as High Company and Low Company, respectively. The name Associated Company was used in the test instrument so as not to sensitize the subjects to high and low. The deferred tax credit balance of High Company was approximately 29 percent of stockholder's equity and 13 per

39
cent of total assets. Alternately, the deferred tax credit balance of Low Company was approximately 5 percent of stockholder's equity and 3 percent of total assets. These two basic sets of financial statements were compiled using the deferred method of comprehensive tax allocation (DMCA financial statements) and served as the control groups.
The above two basic sets of DMCA financial statements (High and Low) were then adjusted to reflect use of the flowthrough method (FT financial statements) by eliminating the deferred tax credits of both companies with a debit to deferred taxes and a credit to retained earnings. The adjustment resulted in a greater increase in net income and higher interperiod fluctuation for High Company as compared to the Low Company vis-a-vis the DMCA financial statements.
The third set of financial statements, flow-through with disclosure (FTD financial statements), were similar to the FT financial statements. The only difference was that the summary notes fully disclosed the amount of current deferred taxes and the deferred tax credit balance as in the DMCA financial statements.
Each of the six sets of financial statements included comparative Income Statements (with important ratios) and Statements of Financial Position for a five year period.^ A one page summary of notes to financial statements was also included. In similar behavioral studies, it has been quite

40
common to design the financial statements so that one company appeared to be a better investment under one method and the other company appeared a better investment under the second method [Elias, 1972; Hendricks, 1976; Kreuze, 1983]. Also, the above approach is generally used together.with a within- subject design. However, this approach was rejected here because in a change from comprehensive allocation to the flow-through method the relative order or ranking was not likely to change for most actual c o m p a n i e s . ̂ Additional reasons for not having a subject analyze all or some of the different sets of financial statements (i.e. a within-subject or nested design) are discussed later under experimental design.
The complete research instrument consisted of: (1) acover letter, (2) instructions (including information on the company and stock market trend), (3) financial statements (discussed above), and (4) demographic questionnaire.Besides the four major task responses and perception variables (discussed below), certain demographic data, such as number of years of experience in financial statement analysis for investment purposes, professional certification(s), level of education, and time taken, was also collected. Examples of the complete test instruments are included in the Appendices A through F.

41
EXPERIMENTAL TASK
The study's principal experimental task was to analyze the financial statements and provide ex ante estimates of net income and common stock price one year later based on the selected accounting and financial information given in the research instrument. Prediction of stock price was used as a generalized surrogate for the investment decision.^ As mentioned in Chapter I, risk and return assessments are fundamental to investment decision making. An ex ante estimate of stock price is required for computing the expected rate of return necessary for an informed investment decision. Use of stock price prediction avoids confounding by extraneous variables such as investor characteristics and level of diversification, etc. It is reasonable to assume that, ceteris paribus, different stock price predictions will lead to different investment decisions.
Slovic [1969] considers stock price prediction important because hundreds of thousands of decisions involving millions of dollars are made daily in the market. Moreover, the task is interesting because it is extremely difficult and complex. An additional advantage of using stock price prediction, as an experimental task, is that it can be compared to the actual, market determined stock price for assessing the quality of the predictions.

42
The second major experimental task in this study- required the subjects to provide an equivalence interval surrounding their point estimates of future net income and stock price of the company. The equivalence interval was defined as the range of values considered by the subjects as essentially equivalent to their point estimate of the characteristic in question.
Investment decisions are characterized by uncertainty. The perception of uncertainty plays a central role in investment decisions. Financial statement data should help the investor in assessing the risk of the investment [Beaver, 1973]. The FASB [1980, par.49] considers information relevant not only if the information leads to a different decision, but also if the information alters the degree of uncertainty about the result of the decision. Thus, investigation of the subjects’ confidence in their prediction of future net income and stock price (or assessment of perceived risk) was a valid concern.
Financial theory labels this uncertainty as risk or beta and it is generally measured as the covariance between the security's return and the return of the market portfolio divided by the variance of the market portfolio. Unfortunately, beta is an ex post measure of risk, and could not be used within the context of this study. However, "people formulate some intuitive analog of the statistical properties

43
of events that are relevant to them, and (they) use these uncertainty estimates in combination with other information as a basis for action [Howell and Burnett, 1978, p.45]."
At present no consensus exists concerning the operational definition of subjective probability or the most appropriate way to measure it [Howell and Burnett, 1978]. There is, however, some evidence that human subjects are not always intuitive statisticians. Rather, they often employ convenient "heuristics" or "rules of thumb" that are not fully consistent with the formal rules of probability [Tversky and Kahneman, 1974] . Because people appear ill- equipped to deal intuitively with complex probabilistic tasks, use of the 90 percent (or some other) statistical confidence interval for measuring subjective uncertainty may be inappropriate.
Several recent investigators have suggested the use of an equivalence interval as a subjective measure of uncertainty. The evidence suggests that the equivalence interval can be used as a measure of uncertainty about quantitative judgments.
Larson and Reenan [1979] found that the size of the equivalence interval can be taken as a measure of uncertainty and is highly correlated with ratings of confidence in the accuracy of a judgment. Beach et al. [1974] suggested that equivalence intervals placed around estimates reflect

44
differential information, that is, they narrow as information increases and widen as information decreases. Further, Crocker, Mitchell and Beach [1978] found that the widths of the equivalence intervals are affected by source credibility and disorderliness in the information and that there is no effect for the order of presentation of information or sequential versus final judgment process.
In order to control for source credibility, the subjects were told that the financial statements have been audited by one of the "big eight" accounting firms. The test instrument was refined through pretests before the final experiment.
THE SUBJECTS
Financial AnalystsSeveral studies using student surrogates have been
criticized regarding validity of the results in the real world [Dickhaut et al., 1972; Ebbesen and Konecni, 1980]. Accordingly, the experimental subjects in this study were professional financial analysts. The FASB [1978, par.24 and par.35] considers investors and creditors and their advisors as the major financial statement users. Professional financial analysts are often used as surrogates for investors^ and appear to have an enormous influence in the modern investment

45
market [Honea, 1981]. Financial analysts generally act as advisors to investors and routinely use financial statements as a significant source of information in performing their job [Arnold and Moizer, 1984]. Mautz [1968], for example, considers financial analysts as representing the views of all those who read and rely on financial reporting data.
The sample in this study was drawn from the members of the Financial Analysts Federation (FAF) listed in the 1986 membership Directory. The selection was restricted to the appropriate functional classifications, such as portfolio managers, research directors, analysts and investment counselors. Several researchers [Buzby, 1974; Corless and Norgaard, 1974; Dyckman, 1969; Farrelly, Ferris and Reichenstein 1985; Godwin, 1975; Oliver, 1974] have used the membership Directory of the FAF for selecting a random sample of financial analysts to represent sophisticated users of financial statements. The response rate in these studies has varied from 21.3 percent [Buzby, 1974] to 47 percent [Farrelly, Ferris and Reichenstein 1985].
A systematic random selection process was used to draw an adequate number of financial analysts from all of the U.S. memeber societies of the FAF. The process resulted in a sample that was proportional to the actual membership of the different societies. Thus, a large number of the financial analysts in this national sample were from the east coast

46
(New York, Boston, Philadelphia) and the west coast (Los Angeles, San Fransisco), where the majority of the financial analysts are located.
VARIABLES
The Independent VariablesThe main independent variable was the method of account
ing for income taxes. Three levels were considered: (1) thedeferred method of comprehensive income tax allocation (DMCA); (2) the flow-through method (FT) and; (3) the flowthrough method with footnote disclosure of current deferred taxes and deferred tax credits as under the DMCA (FTD).8 The first method requires comprehensive interperiod tax allocation for all timing differences between financial reporting and taxable income. In contrast, the second method requires no allocation of income taxes. The income tax expense under the flow-through method is set equal to the actual income tax assessed for the year. The third method was designed to determine whether the form of disclosure of deferred tax information is significant to financial statement users.
A secondary independent variable was the magnititude of deferred tax credit account. Two levels (high and low)9 were represented by the High and Low company. The high level

47
equaled 29 percent of stockholder's equity while the low level equaled 5 percent of stockholder's equity, and both were based on a survey of 10K reports of Fortune 250 Companies. The range of deferred tax credit balances for 1982 was approximately 5 percent to 30 percent of stockholder's equity and 2 percent to about 15 percent of total assets. The maximum possible range for the amount of deferred tax credits was selected to provide a potent manipulation and capture the impact, if any, on the investment decision.
The Dependent VariablesThe main dependent variables or decision variables
included: (1) the predicted common stock price or priceexpectation in dollars (SP); (2) the predicted net income ornet income expectation in millions of dollars (NI); (3) theconfidence subjects placed in their expectation of the common stock price measured in terms of an upper and lower bound for an equivalence interval (SPEI); and (4) the confidence sub-
t
jects placed in their expectation of future net income measured in terms of an upper and lower bound for an equivalence interval (NIEI). The choice of the decision variables has been justified earlier in the experimental task section.
An analysis of subjects' predictions of net income and common stock price based on the selected accounting and fi-

48
nancial information supplied to them would show whether the treatment levels of the independent variables had any impact on the subjects' expectations and, consequently, on their investment decisions. Similarly, an analysis of the subjects' size of equivalence interval would indicate whether the different treatment levels had any effect on their confidence in the net income and common stock price predictions.
Two perception variables were also employed: (1) thelevel of information (INFO) and (2) the importance of certain information items (RATING). Subjects were requested to indicate on a scale of 0 to 10 (0: not adequate and 10: fully adequate) whether the information in the test instrument was adequate for their estimates of the decision variables. The response for the INFO variable was used to assess the overall perception of the adequacy of the information in the test instrument for the experimental task. The response was also used to test for any differential information perceptions across the six control and experimental groups.
For the RATING variable also, subjects were requested to indicate on a scale of 0 to 10 (0: not important and 10: very important) the importance of 12 information items in estimating the decision variables. The RATING variable was intended to help assess the importance of the deferred tax information with respect to the decision variables without sensitizing the subjects to the issue. The response was also used to

49
draw general conclusions about the perceived importance of the various information items for the investment decision.
HYPOTHESES AND EXPECTATIONS
The study's major research question concerns whether individual investment decisions are affected by the method of accounting for income taxes. The first four hypotheses deal with the impact of the main manipulative variable— the method of accounting for income taxes— on the investment decision.
As long as a company does not change the depreciation method for tax purposes and its taxes and net cash flows do not change, the underlying 'true' earnings or economic condition of the company is not affected by the change in financial reporting method [Archibald, 1972] . In an efficient market-*-® the change in income tax allocation method is viewed as merely a change in reporting method, with no cash flow or economic consequences. Thus, there should be no change in investors' expectations or in their investment decision or prediction of common stock price as a result of the accounting change.
On the other hand, in studies of individual decision making behavior— as opposed to aggregate (market) behavior—
several information and/or subject related limitations, such

50
as availability of information, substance over form, susceptibility to different cue-forms and experimental tasks, anchoring and functional fixation, etc., have been reported as possible constraints on the decision outcome.H Thus, the increase in reported net income for the High and Low companies arising from a change to the FT method may be perceived by some individual financial statement users as more attractive without affecting the aggregate market.
The increase in variability of earnings and a lower return on equity in the FT method, should reflect the opposite result. However, it is difficult to predict what the net effect on stock price would be because of the impact of the change in the accounting method on other variables, such as total debt to stockholder's equity, and because of a lack of knowledge of the decision process.
The above discussion suggests the following four null hypotheses:
HI: There are no significant differences betweenthe average common stock price expectations of financial analysts under the three alternative methods of accounting for income taxes.
H2: There are no significant differences betweenthe average size of the stock price equivalence intervals of financial analysts under the three alternative methods of accounting for income taxes.
H3: There are no significant differences betweenthe average net income expectations of financial analysts under the three alternative methods of accounting for income taxes.

51
H4: There are no significant differences betweenthe average size of the net income equivalence intervals of financial analysts under the three alternative methods of accounting for income taxes.
The implication of the efficient market argument is that HI and H2 should not be rejected. On the other hand, as briefly discussed above, the extant theory of individual decision making does not provide any guidance as to whether HI and H2 will be rejected or not. However, if investors use accounting information in a naive manner (i.e., higher net income should lead to higher stock price) without regard to the accounting method or cash flow implications, then HI and H2 were expected to be rejected.
The flow-through method generally results in both higher and more variable net income. Therefore, H3 and H4 were expected to be rejected.
Failure to reject HI and H2 would suggest that the subjects did not perceive any difference in the three sets of financial statements prepared under the three alternative methods of accounting for income taxes. This would suggest that discussion of alternate income tax allocation methods is not worthwhile and that the most practical and least costly method should be required [Beaver, 1973]. Alternately, rejection of HI and H2 would indicate that the subjects perceive differences in the three sets of financial statements and suggest further analysis.

52
In the event that hypotheses HI through H4 are rejected, it was expected that the FT method would yield a higher average predicted net income, stock price, and average range of equivalence intervals as compared to the DMCA. This was because the FT method results in both a higher net income and greater variability in net income for the two companies. The above argument suggests the following null hypotheses:
H5: There is no significant difference between thecommon stock price predictions of the financial analysts who received DMCA financial statements and the financial analysts who received FT financial statements.
H6: There is no significant difference between thecommon stock price equivalence interval expectations of the financial analysts who received DMCA financial statements and the financial analysts who received FT financial statements.
H7: There is no significant difference between thenet income predictions of the financial analysts who received DMCA financial statements and the financial analysts who received FT financial statements.
H8: There is no significant difference between thenet income equivalence interval expectationsof the financial analysts who received DMCA financial statements and the financial analysts who received FT financial statements.
The following four hypotheses were designed to test whether the form of disclosure of deferred tax information affects the expectations of financial analysts:
H9: There is no significant difference between thecommon stock price predictions of the financial analysts who received DMCA financial statements and the financial analysts who received FTD financial statements.

53
H10: There is no significant difference between the common stock price equivalence interval expectations of the financial analysts who received DMCA financial statements and the financial analysts who received FTD financial statements .
Hll: There is no significant difference between the net income predictions of the financial analysts who received DMCA financial statements and the financial analysts who received FTD financial statements.
H12: There is no significant difference between the net income equivalence interval expectations of the financial analysts who received DMCA financial statements and the financial analysts who received FTD financial statements.
The DMCA financial statements incorporate the deferred tax information into the body of the financial statements as a deferred tax credit in the balance sheet. Alternately, the FTD financial statements disclose the same deferred tax information in the notes to the financial statements. If the form of presentation of deferred tax information has no effect on individual decision making, then the expectation was that H9 through H12 would not be rejected. On the other hand, if the form of disclosure was important then the ex- pectation was that H9 through H12 would be rejected.
The availability of a criterion (actual or market determined stock price) allows for a gross measure of accuracy of the alternative methods of accounting for income taxes. However, this can be done only for the High Company responses. The following hypotheses were designed to test

54
for accuracy of stock price and net income predictions:H13: There are no significant differences between
the average accuracy of financial analysts' stock price predictions under the three alternative methods of accounting for income taxes.
H14: There are no significant differences between the average accuracy of financial analysts' net income predictions under the three alternative methods of accounting for income taxes.
The next four hypotheses were designed to test for the effect of the second independent variable— the magnitude of deferred tax credit account (high and low)— on the investment decision.
H15: There is no significant difference between the average common stock price predictions of financial analysts for the two levels of deferred tax credits (High and Low).
H16: There is no significant difference between the average size of the common stock price equivalence intervals of financial analysts for the two levels of deferred tax credits.
H17: There is no significant difference between the average net income predictions of financial analysts for the two levels of deferred tax credits.
H18: There is no significant difference between the average size of the net income equivalence intervals of financial analysts for the two levels of deferred tax credits.
The only difference between High Company and Low Company was the magnitude of deferred tax credits in the balance sheet. The crucial question is whether, as the accounting profession insists, the deferred tax credits represent future cash outflows in the form of higher future income taxes. If

55
the financial analysts perceive the larger deferred tax credit account balance of High Company to imply greater future cash outflows as compared to the Low Company, then the expectation would be to reject H15 and H16. The predicted stock price for the Low Company should be greater than that of the High Company. Since the reported net incomes of High Company and Low Company were the same or only slightly different,^2 H17 and H18 were not expected to be rejected.
Failure to reject H15 and H16 would imply that the magnitude of deferred tax credits did not affect subjects' predictions of common stock price and related confidence interval. Such a finding would suggest that deferred taxes are probably not a factor in investment decisions. Alternately, rejection would suggest that the subjects perceive the set of financial statements for the high and low levels of deferred tax credits differently.
The greater the amount of deferred taxes, the greater the difference in net earnings and its variability between the comprehensive allocation and flow-through methods. Also, the greater the deferred taxes, the greater is the impact on the financial ratios of the two companies. If financial statements prepared under the DMCA, FT, and FTD methods are perceived differently by the financial analysts for High and Low Company, then one would suspect a significant interaction effect because of the differential impact. If interaction

56
between the independent variables is significant, it would imply that companies with high levels of deferred tax credits should be more concerned with which income tax allocation method is adopted than companies with low amounts of deferred tax credits. Significant interaction would also be an indication of configural 'judgment process being used by the subjects [Slovic, Fleissner and Bauman, 1972]. The following hypothesis tests for a significant accounting method by magnitude of deferred tax credits interaction:
H19: There is no significant interaction effect between the two independent variables— method of accounting for income taxes and the magnitude of deferred tax credits.
Should financial analysts view the different methods of accounting for income taxes differently for the High and Low Company, or be unable to adjust for differential income tax information, the expectation would be to reject H19. In view of the findings of prior empirical research that deferred tax credits keep growing, rejection of H19 should be cause for concern.
The following hypotheses test the effect of the two independent variables— method of accounting for income taxes and the magnitude of deferred tax credits— on the two perception variables.
H20: There are no significant differences between financial analysts' perceptions of the level of information under the three alternative methods of accounting for income taxes.

57
H21: There is no significant difference between financial analysts' perceptions of the level of information for the two levels of deferred tax credits.
H22: There are no significant differences between financial analysts' perceptions of the importance of the 12 information items under the three alternative methods of accounting for income taxes.
H23: There is no significant difference between financial analysts' perceptions of the importance of the 12 information items for the two levels of deferred tax credits.
Looking at the situation from the deferred taxes point of view only, the FT financial statements do provide less information than the DMCA financial statements. The FTD financial statements provide the same information as in the DMCA financial statements, but in a different format.However, the present understanding is that deferred taxes play a minimal role, if any, in the investment decision.Thus, H20 and H21 were not expected to be rejected. On the other hand, rejection of H20, in particular, should suggest that the subjects gave considerable importance to the deferred tax information with respect to their predictions and expectations.
There is no a priori reason to expect that H22 and H23 would be rejected. Rejection of H22 and H23 should be some cause for concern— especially if H20 and H21 are not re- jected--because it would suggest that any significant differences on the decision variables could be attributed to the
58
differential perceptions (of the importance of the information items or cues) of the subjects in the six control and experimental groups. In other words, the random assignment of the subjects to the different treatments was not effective and the groups were not equal before the treatments. Failure to reject H22 and H23 should, however, enhance the internal validity of the experiment.
EXPERIMENTAL DESIGN
The research design employed by this study was a randomized control group posttest-only [Campbell and Stanley, 1963]. If extended to more than two groups and if capable of answering the specific research question asked, the above design has been termed as the ideal design by Kerlinger [1964]. Practical considerations precluded the use of the more rigorous three or (Solomon) four group pretest-posttest designs in the study. The posttest-only design did have the advantage of avoiding some of the shortcomings associated with one or two group pretest-posttest designs, such as sensitization due to pretest or measurement, history, maturation and regression (though the last three are not of much concern with short time intervals between measurements and high expected correlation between pretest and posttest measures).

59
Randomization served two main functions: (1) to enable asample to be drawn that was representative of a known population and (2) to make the samples drawn comparable to each other. It is the second function that facilitates causal inferences [Cook and Campbell, 1979, p.341]. Random assignment of subjects to treatments assures, for all practical purposes, equality of groups before treatments and is a sine qua non for a true experiment. Statistical inferences cannot be made concerning populations that have not been randomly sampled. However, statistical analysis with nonrandomly selected subjects can still be conducted, with statistical inferences applying only to the subjects actually used in the experiment and only nonstatistical inferences, based on logical considerations, made about persons not used in the experiment [Edgington, 1966] .
Another consideration was whether to use a between- subjects or within-subjects design. Within-subject designs, where the same subjects form the control and experimental group or are exposed to more than one treatment, are quite prevalent in behavioral research. The main advantages are economy of subjects and elimination of individual difference variance which makes the design more efficient. However, Grice [1966] has pointed out that the nature of an observed empirical relationship depends upon the source of variance, and that for concepts designed to predict the effects of

60
experimental variables upon behavior the between-subjects design is more appropriate. Further, when deferred taxes are included in stockholder's equity, as under the FT method of accounting, only a few financial statement items are affected. Therefore, it was not desirable to have one subject evaluate the three alternative methods (DMCA, FT, and FTD) of accounting for income taxes because the experiment may be too transparent. The same holds for the other dependent variable, magnitude of deferred tax credits, as well.
The choice of three levels for the method of accounting for income taxes (DMCA, FT, FTD) and two levels of magnitude of deferred tax credits (high and low) implies a 3 X 2 factorial design. Factorial designs permit simultaneous study of several factors and yield as much information on each factor as if the factor alone had been varied. Furthermore, valuable additional information is obtained by the ability to check for interactions and if no interactions are found, there is a much broader base for generalizing conclusions on the main effect of a factor (since the effects have been observed in a variety of experimental conditions) [Steinberg and Hunter, 1984].
The research design is illustrated in Figure 1. The financial analysts were randomly assigned to one of the six treatment cells. Financial analysts in groups one through three received the financial statements of High Company for

61
the DMCA, FT, and FTD methods of accounting for income taxes, respectively. Financial analysts in groups four through six received the financial statements of Low Company for the DMCA, FT, and FTD methods of accounting for income taxes, respectively.
STATISTICAL ANALYSIS
Analysis of variance (ANOVA) can be used for describing and understanding the complex judgment processes in the financial analysis task used in this study [Hoffman, Slovic and Rorer, 1968; Slovic 1969]. Multivariate analysis of variance (MANOVA), the multivariate counterpart of the univariate ANOVA, was the appropriate statistical technique because the four main dependent variables (SP, NI, SPEI, and NIEI) are not independent. For example, one would expect that the farther the predicted stock price (or net income) deviates from the current stock price (or net income), the larger the equivalence interval surrounding it and vice versa. Furthermore, a statistical relationship between accounting net income (earnings) data and stock prices has been demonstrated by several empirical studies.13 it is generally accepted that earnings expectations are a significant determinant of common stock prices [Hawkins, Chamberlin, and Daniel, 1984].

62
RESEARCH DESIGN Figure-1
HighMagnitude of Deferred Tax Credit Account
Low
Method of Accounting for Income Taxes
DMCA FT FTD
Gr.1 Gr.2 Gr.3
Gr.4 Gr.5 Gr.6
DMCA - Deferred Method of Comprehensive Allocation.FT - Flow-through Method.FTD - Flow-through Method With Foot-note Disclosure of
Comprehensive Deferred Tax Information.

63
The main effects of the two independent variables (method of accounting and magnitude of deferred tax credits) and their interaction (H19) can be directly tested by using Wilks's Lambda criterion. However, following Barker and Barker [1984, p.24] it may be desirable to report all four MANOVA tests of statistical significance: 1) Wilks's Lambda criterion; 2) Lawley-Hotelling trace criterion; 3) Roy's greatest characteristic root criterion? and 4) Pillai's trace criterion.
Further, if the MANOVA test is significant, separate univariate analysis of variance (ANOVA) can be performed for each dependent variable--SP, NI, SPEI, and NIEI [Hummel and Sligo, 1971]. Thus, the above null hypotheses (HI through H4 and H15 through H18) can be tested directly, using appropriate F statistic at the conventional five percent level of significance. For testing H13 and H14, the mean square error (MSE) may be used as the dependent variable [Wright, 1982].In the event that the above hypotheses are rejected, a posteriori multiple comparison tests, Tukey-Kramer and/or Scheffe can be conducted to test hypotheses H5 through H12. The hypotheses relating to the two perception variables (H20 through H23) can be similarly tested using MANOVA and ANOVA techniques.
Besides orthogonality of factors, the two basic assumptions of ANOVA are: 1) normality of distribution in the

64
population of the dependent variable; and 2) homogeneity of variance of the sources from which the error term is derived. The assumptions of MANOVA closely parallel those of ANOVA. MANOVA assumes multivariate normality of distribution and homogeneity of dispersion matrices. However, univariate normality for population of each dependent variable is generally considered sufficient for practical purposes.
ANOVA is robust with respect to violations of its underlying assumptions [Barker and Barker, 1984, p.25]. Further, Ito and Schull [1964] and Ito [1969] have shown that MANOVA is robust with respect to lack of homogeneity of dispersion matrices and that there should be little concern, especially when each treatment unit has equal number of observations. Since it is difficult to ensure equal observations in each cell in a field experiment, it may be desirable to test for homogeneity of variance and dispersion matrices. This can be done using Bartlett's tests for homogeneity of variance and homogeneity of variance-covariance matrices. An appropriate transformation can be used in case Bartlett's test(s) is significant. However, Bartlett's test is sensitive to departures from normality and is not recommended when populations depart substantially from normality [Box, 1953;Neter, Wasserman and Kutner, 1985, p.622]. In case of severe violation of normality assumption, the rank transformation may be used [Conover, 1980].

65
RELIABILITY AND VALIDITY
Concerns about reliability were mitigated to some extent by providing the financial information and instructions in the instrument as clearly, precisely, and unambiguously as possible [Kerlinger, 1964, p.287]. Pretesting of the instrument helped considerably in this regard. Additionally, information provided on the stock market trend and statement that financial statements were audited by a 'big eight' accounting firm should have removed another possible source of error.
As mentioned earlier, the experimental task of predicting stock price is complex and challenging. This should have motivated the subjects to conduct a more careful analysis of the information presented in the financial statements. Random selection of the subjects and use of the posttest-only design should enhance generalizability, and the creation of equivalent comparison groups through random assignment should enhance the internal validity of the study [Cherulnik, 1983, pp.268-273]. However, even though subjects were requested to analyze the financial statements and not discuss their responses with others until after completion of the task, it is difficult to ensure compliance in a field experiment. Thus, the limited control that a researcher can exercise over extraneous events, makes standardization of

66
procedures from one subject to another very difficult in a field setting [Cherulnik, 1983].
Another concern was with ecological validity. Ecological validity of field studies is generally higher than that of laboratory studies. However, it has been pointed out that even in a field study the researcher may create a particular context in the choice of stimuli presented to the subjects that may have no real world counterpart and thus raise ecological validity concerns [Cherulnik, 1983, p.118]. As financial analysts are involved in financial statement analysis and stock price prediction decisions, ecological validity should not be a major concern in this research.15 However, perfect ecological validity may, perhaps, be achieved only through unobtrusive measures in a natural setting. This was impossible in the present context of studying alternative income tax accounting methods.
Perhaps the most serious concern about behavioral studies employing mail questionnaires is the risk of low response. A low response could affect the study's external validity because of possible systematic differences in the populations of respondents and non-respondents. Since nonresponse is nonrandom, the results of studies with high nonresponse rates cannot be taken as representative of the original selected sample. Because of this nonresponse bias, valid statistical inferences concerning the target population

67
cannot be made.However, in accounting for this nonresponse bias it is
necessary to make some assumptions about the responses of the non-respondents. Oppenheim [1966, p.34] suggested that the non-respondents have been found to have similar characteristics to the late respondents. A comparison of the responses of the early respondents to those of the late respondents (often after one or several reminders) can give some idea about the nature of the nonresponse bias and was used in this study.
Fortunately, there are methods to improve response rates. Several researchers have investigated alternative procedures and their impact on the response rate. Veiga [1974] found that use of a stamped envelope, as opposed to business reply envelope, has a higher response rate. Etzel and Walker [1974] found that a follow-up without duplicates was best, but some other researchers found a higher response rate for a follow-up with a duplicate copy of the questionnaire [Heberlein and Baumgartner, 1981]. Use of monetary inducements also increases response rate [Huck and Gleason, 1974]. Fuller [1974] investigated the effect of anonymity on the response rate and response bias. Use of a personalized letter results in higher response rate and prior contact on telephone does not increase response rate [Dillman and Frey, 1974]. Matteson [1974] also found a higher response rate for

68
a semipersonal letter and a higher response rate for colored questionnaires used with form letters.
Every effort was made to increase response rate. The length of the questionnaire was kept as short as possible so that time demand on the subjects was minimal. Standard follow-up procedures were employed. These included a postcard reminder three days after the initial mailing and a duplicate mailing two weeks later. The transmittal letter and cover were personalized and individually stamped. Questionnaires were printed on colored paper. In addition, a telephone follow-up was made for a randomly selected group of nonrespondents.
Since an altruistic appeal seems to work better [Miller, 1983, p.Ill] the cover letter mentioned that money from two $50 cash awards would be sent to the charity indicated by the respondents who made the most accurate net income and stock price predictions. As an added incentive, the respondents were offered a complimentary copy of the research findings. The subjects were also assured about confidential treatment of their responses, and respondents who did not wish to participate in the cash awards had the option of returning the questionnaire anonymously.

69
CHAPTER III ENDNOTES
1. The behavioral accounting studies are in several different accounting areas, such as Human Resource Accounting [Elias, 1972; Hendrick, 1976], Human Information Processing [Dermer, 1983; Driver and Mock, 1975], Current Cost Accounting [Mcintyre, 1973], Leases [Hartman and Sami, 1984; Wilkins and Zimmer, 1983] and, Expectancy Theory [Rockness, 1977], etc.
2. Pertinent limitations of behavioral studies are discussed later. A point to note is that all research methods have different degrees of strength and reliability [Abdel-Khalik and Ajinkya, 1979] and there is no perfect method. Consequently, only limited confidence can be placed in the conclusions of any single study and extreme care needs to be exercised in extrapolating results for practical implications. However, with several studies or a research program addressing the same problem using different methods, or "triangulation," sufficient confidence can be placed in the consistent findings of such studies [Drew and Hardman, 1985, p.121].
3. In view of the FASB's decision to continue with comprehensive interperiod tax allocation and further review of the appropriate treatment of deferred taxes, the net of tax and the liability methods may also be of interest. However, as pointed out earlier the threshold question has not been adequately studied and the question of whether to recognize the effects of any timing differences at all must be resolved before appropriate treatment of such timing differences can be considered. Consequently, this study only addressed the threshold question of interperiod tax allocation versus no allocation. The deferred method was used because it serves as a control, or no treatment group, in assessing the impact of the flow-through method. The third group, flow-through method with disclosure, was used to ascertain whether the form in which deferred tax information is disclosed makes a difference.

70
4. The ratios were presented, based on financial theory and prior studies, in order to minimize the time requirement for the subjects and thus increase the response rate. Further, a five year period was used to highlight the fluctuations in operating income under the flow-through method.
5. In behavioral experimental studies it is very important that the information provided be realistic and representative. Brunswik [1955] was the first to emphasize the importance of representative design. Following Brunswik, several researchers have emphasized this representativeness requirement and studied the impact of ecological validity on prediction achievement [Hursch, Hammond and Hursch, 1964; Dudycha and Naylor, 1966; Beach, 1967; Brehmer, 1978; Libby, 1981]. The findings are consistent: subjects' achievement is limited by the statistical characteristics of the environmental system. Consequently, actual financial statements were provided as far as practicable.
6. Several studies have used stock price assessment and related tasks for an investment decision, e.g., Ebert and Kruse [1978], Slovic et al. [1972], Wright [1979]. Also see the Research Methodology section and endnote 8 in Chapter I.
7. Many Accounting research studies have employed financial analysts for determining the needs of the users of financial statements. For example, see Asebrook and Carmichael [1973], Barrett [1971], Boatsman and Robertson [1974], Bradish [1965], Brenner [1970], Buzby [1974], Copeland et al. [1973], Corless and Noorgard [1974], Dyckman [1969], Elias [1972] , Goodwin [1975], Harried [1973], Oliver [1974]. The decision to use financial analysts as subjects was made after extensive discussions with investment and portfolio managers in banks and insurance companies, other researchers and officials of the FAF. Also see endnote 7 in Chapter I.
8. See note 3, above.9. Use of only two levels with such a wide range may not
allow a determination of the threshold level of deferred taxes where the decision is affected. However, there are practical limitations on the number of groups and sample size in a field experiment. In case this study finds a significant effect for magnitude of deferred tax credit account, a subsequent study employing Brunswick's lens methodology can further explore the question.

71
10. For efficient market research and its implications see any of the several reviews, such as Beaver [1981], Gonedes and Dopuch [1974], Kaplan [1978], etc.
11. Several psychology and human information processingstudies have indicated the limited capacity ofindividuals to process large amounts of information andthe effect of information related and subject related limitations on the decision outcome. For example see Ashton [1976], Dyckman, Gibbins and Swieringa [1978], Dyckman, Hoskin and Swieringa [1982], Einhorn [1980], Ijiri, Jaedicke and Knight [1966], McC. Miller [1971], Payne [1980], Slovic, Fischhoff and Lichtenstein [1977], Stenson [1974], Tversky and Kahneman [1974], and Wright [1974]. However, differences in individual decisions because of alternative reporting methods do not imply market inefficiency because of sufficient arbitrage activity [Dyckman, Gibbins and Swieringa, 1978, p. 76].
12. This is strictly true for the deferred method of comprehensive allocation (DMCA) only. The restatement of the DMCA financial statements to the flow-through (FT) method results in a small, about 5%, difference in the final year's reported net income for the High and Low company.
13. For example see Ball and Brown [1968]; Beaver [1968] and; Beaver, Clarke and Wright [1979].
14. Unequal number of observations or responses in each cellcreate another problem. Because there is no unique wayto analyze the data for the resultant nonorthogonal factorial design, the results may vary depending upon the chosen analysis [Herr and Gaebelein, 1978] . In the absence of any a priori reasons for choosing one of the several alternative analyses, it is best to analyze the data using all of the commonly used models.
15. See note 5 above.

CHAPTER IVDATA ANALYSIS
INTRODUCTION
This chapter presents the data and the statistical analysis employed to determine the effect of (1) alternative methods of accounting for income taxes and (2) the magnitude of deferred tax credit account on individual investment decisions. The major topics, in order of presentation, are: the response rate; statistical analysis and hypotheses tests; the characteristics of subjects; and summary of the results.
THE RESPONSE RATE
The subjects for the experiment were financial analysts listed in the 1986 FAF membership Directory. The subjects were drawn from 33 states (all of the listed U.S. member societies). As discussed in Chapter III, a systematic random sampling process was used. The six differently colored test instruments were mailed to the subjects, along with personalized cover letters (Appendix G), in individually stamped

73
envelopes. Three days after the initial mailing, a post card reminder (Appendix H) was sent to each subject. Two weeks after the initial mailing a second copy of the test instrument along with another cover letter (Appendix I) was mailed to those subjects who had not responded to the first mailing. The subjects were requested to disregard the second questionnaire if they had already responded.
A total of 277 responses were received. A response rate of 23.1 percent. However, of these 277 responses only 154 were usable. The majority of the 123 unusable responses were received from financial analysts who were no longer employed by the institution listed in the FAF Directory (72), or who did not feel qualified to respond because they were not actively engaged in financial statement analysis for investment purposes (23), or who had retired (17). Eight respondents did not complete the questionnaire because of insufficient time and two because they could guess the actual company.One respondent only made the net income prediction.
A telephone follow-up was conducted in order to increase the number of usable responses and to ascertain differences in the characteristics of the respondents and nonrespondents. A random sample of 100 nonrespondents (approximately 11%) was selected and each subject contacted by telephone to ascertain the exact reason(s) for not responding. The results of the telephone follow-up are presented in Table IV-1.

74
TABLE IV-1 RESPONSE TO TELEPHONE FOLLOW-UP
Outcome N % adjusted %
Could not be contacted (3 calls) 11 11.0Will try to respond 15 15.0 16.9Too busy to respond 4 4.0 4.5Questionnaire needs too much time 2 2.0 2.3Simply not interested 2 2.0 2.3Death in the family 1 1.0 1.1Inaccessible:
No longer at listed institution 27 27 .0 30.3Dead 1 1.0 1.1On vacation 1 1.0 1.1
Found ineligible: Retired 3 3.0 3.3Not doing F/S analysis 33 33.0 37.1
Total follow-up sample 100 100.0 100.0
Analysis of the telephone follow-up indicated that a large percentage of the total selected sample was either inaccessible (32.5%) or ineligible (40.4%). Therefore, the adjusted response rate, i.e., percentage usable responses from the subjects who were both accessible and eligible (actively involved in financial statement analysis), was 37.1 percent. This adjusted response rate compares favorably to the response rates of similar studies using mail questionnaires.
75
Only a small percentage of the nonrespondents ( 9.1%) indicated that they were too busy to respond, not interested, or found the questionnaire to be too time consuming— characteristics that might differentiate them from the respondents. Thus, the chances of a significant nonresponse bias appear minimal. Nevertheless, the commonly employed early/late comparison for nonresponse bias, as suggested by Oppenheim [1966], was conducted.^
For the purpose of the early/late test, early respondents were defined as those subjects whose responses were received within two weeks of the initial mailing. All other responses were treated as late responses. The early and late responses were compared using the response time as a blocking factor in the MANOVA models used for hypothesis testing. The MANOVA results for the blocking factor are presented in Table IV-2 and provide no evidence of any significant difference in the responses of the early and late respondents.2
The distribution of subjects among the six control and experimental groups is presented in Table IV-3. Two usable responses were dropped from all analyses because the subjects indicated that they were aware of the actual company.2 Thus, a total of 152 responses were used for the statistical analysis.

75
TABLE IV-2MANOVA RESULTS FOR EARLY/LATE BLOCKING FACTOR
MULTIVARIATE TESTS OF SIGNIFICANCE ( S = l , M = l , N = 6 7 . 5 )
TEST NAME VALUE APPROX. F HYPOTH. DF ERROR DF PROB.> F
PILLAIS .015 . 506 4.0 137.0 .732HOTELLINGS .015 .506 4.0 137.0 .732WILKS .985 .506 4.0 137.0 .732ROYS .015
TABLE IV-3 DISTRIBUTION OF SUBJECTS WITHIN CELLS
Method of Accounting for Income Taxes
DMCA FT FTD
High 28 32 26Magnitude ofDeferred Tax ---------------------------------------Credit Account
Low 20 22 24

77
STATISTICAL ANALYSIS
The focus of this study was on whether alternative methods of accounting for income taxes affect investment decisions. To test for this effect, financial analysts were provided a set of financial statements, other financial data, and some background information about the company and the market. The subjects were requested to analyze the information and predict the common stock price and net income of the company for the following year. The subjects were also requested to provide equivalence intervals for their predictions (see sample test instruments included in Appendices A through F).
Chapter III discussed the selection of factors or independent variables and their levels. Two factors, the method of accounting for income taxes (METHOD) and the magnitude of deferred tax credits in the balance sheet (DFTAX) were used. The main model used to analyze the effect of these factors on the dependent variables was a 3 X 2 factorial MANOVA.
Test of The Assumptions of The ModelAs discussed in Chapter III, the assumptions of MANOVA
closely parallel those of ANOVA. The two main assumptions of MANOVA are: (1) multivariate normality of distribution in thepopulation of dependent variables and, (2) homogeneity of the

78
dispersion matrices from which the SSCPerror is pooled.Also, MANOVA is robust with respect to moderate violations of the above mentioned normality and homoscedasticity assumptions, especially when there are an equal number of observations in each cell. However, it is important that tests for assumptions be made when there are unequal number of observations in each cell. This is because, in nonorthogonal designs, violation of the assumptions has a complicated effect on the MANOVA tests [Barker and Barker, 1984].
The Kolmogorov-Smirnov test [Conover, 1980] was used to test for the normality assumptions. Normality was tested for each of the four decision variables in each of the six groups. The null hypothesis (that the distribution is normal) was rejected for only four of the 24 cells at an alpha level of .05.
Examination of the standardized residuals indicated that there were a few outliers (>3.5) in each of the dependent variables. The Box-plots for the variables also suggested the existence of outliers. Furthermore, the residual plots suggested that there were problems with the homoscedasticity assumption as well.
Several different transformations were tried for the net income (NI), net income equivalence interval (NIEI) and the stock price equivalence interval (SPEI) data. Since there did not appear to be any problem with either normality or

79
homoscedasticity for the common stock price (SP), the SP data was not transformed.
The natural log and square root transformation were used for the NIEI and SPEI data, respectively. These transformations reduced the ratio of nonnormal cells from 4 out of 24 to 2 out of 24.4 transformations also stabilized thevariances. No transformation was effective for the NI data. Thus, the univariate homogeneity of variance tests, Cochrans C and Bartlett-Box F [SPSS, 1981, p.65], were significant (at the .05 level) for the NI variable only. However, the Box'sM multivariate test of homogeneity of dispersion matrices wassignificant at the .05 level (p = .001).
Tests for the assumptions of MANOVA suggested that nonnormality was not a problem. The assumption of homogeneity of dispersion matrices was not tenable. If there had been an equal number of observations in each cell, violation of the homoscedasticity assumption would probably not matter, and the usual parametric analysis would have been valid. However, in view of the nonorthogonal design and the presence of outlier error components, the results of the usual parametric analysis may be biased [Barker and Barker, 1984, p.25].
An alternative, suggested by Conover [1980, p.337], is to rank the data and then run the usual parametric analysis. If the two sets of analysis give essentially similar results, then there is no problem and the usual parametric analysis is

80
valid. However, when the two analyses give substantially different results, the results of the analysis on ranks is probably more valid. Conover's suggestion was adopted for this study. Thus, both the analyses (MANOVA on data and ranks) were conducted and the results are reported in the following section.
MANOVA ResultsA seperate MANOVA was run for the four decision varia
bles. ̂ As mentioned in the earlier section, the NIEI and SPEI data was transformed. Thus, the actual responses were used for the NI and SP variables and the natural logarithm of NIEI data and Square root of the SPEI data was used for the responses on the two equivalence intervals.
The first test in a MANOVA analysis is for the interaction between the independent variables. If the interaction is not significant, then the interaction term may be omitted from the model. The sum of squares (SS;) and the degrees of freedom (df) for the effect are pooled with the within cell error sum of squares (SSE) and the error degrees of freedom (dfe). None of the four multivariate tests of significance (Wilks's Lambda, Lawley-Hotelling trace, Pillai's trace, and Roy's greatest characteristic root criterion) were significant at the .05 level. Consequently, the interaction term was dropped from the MANOVA model.^

81
Table IV-4 presents the results of the MANOVA for the unranked data.^ All four multivariate tests for the METHOD effect were significant at the .05 level. On the other hand, none of the multivariate tests were significant (alpha = .05) for the second independent variable, DFTAX.
TABLE IV-4 MANOVA RESULTS FOR UNRANKED DATA
EFFECT — METHODMULTIVARIATE TESTS OF SIGNIFICANCE (S = 2, M = .5, N = 70.5)
TEST NAME VALUE APPROX. F HYPOTH. DF ERROR DF PROB.>F
PILLAISHOTELLINGSWILKSROYS
.266*
.345*
.739*
. 243*
5.5306.1235.828
8.08.08.0
288 . 0284.0286.0
.000
.000
.000
EFFECT — DFTAXMULTIVARIATE TESTS OF SIGNIFICANCE (S = 1 , M = 1, N = 70.5)
TEST NAME VALUE APPROX. F HYPOTH. DF ERROR DF PROB.> F
PILLAISHOTELLINGSWILKS
.049
.051
.9511.823 1. 823 1. 823
4.04.04.0
143.0143.0143.0
.128
.128
.128ROYS .049
* significant at alpha equal to .05

82
Table IV-5 presents the results of the MANOVA for the ranked data. The METHOD by DFTAX interaction was not significant at the .05 level and the interaction SS and df was pooled with SSE and dfe.^ As shown in Table IV-5 both the METHOD and DFTAX effects were significant at the .05 level.
TABLE IV-5 MANOVA RESULTS FOR RANKED DATA
EFFECT — METHODMULTIVARIATE TESTS OF SIGNIFICANCE (S = 2, M = .5, N = 70.5)
TEST NAME VALUE APPROX. F HYPOTH. DF ERROR DF PROB.>F
PILLAIS .448* 10.400 8.0 288 . 0 .000HOTELLINGS .752* 13.356 8.0 284.0 .000WILKS .564* 11.863 8.0 286.0 .000ROYS .420*
EFFECT — DFTAXMULTIVARIATE TESTS OF SIGNIFICANCE (S = 1, M = 1, N = 70.5)
TEST NAME VALUE APPROX. F HYPOTH. DF ERROR DF PROB.> F
PILLAIS .089* 3.487 4.0 143.0 .009HOTELLINGS .098* 3.487 4.0 143.0 . 009WILKS .911* 3.487 4.0 143.0 .009ROYS .089*
* significant at alpha equal to .05

83
In view of the nonsignificant interaction effect for both the ranked and unranked data hypothesis H19 could not be rejected. Furthermore, a comparison of Table IV-4 and IV-5 shows that the DFTAX effect was not significant at the .05 level for the unranked data, but was significant at the .05level for the ranked data.
Based on the violation of the assumptions of MANOVA in the study's nonorthogonal factorial design, and the substantially different results for the unranked data (Table IV-4) and ranked data (Table IV-5), further analysis was conducted on the ranked data.^ The ANOVA results reported in subsequent sections are based on the more appropriate ranked data.
ANOVA Main EffectsFollowing Hummel and Sligo [1971], the significant
MANOVA was followed-up by seperate univariate ANOVAs to determine which response variables accounted for the significant effects. That is, a 3 X 2 factorial ANOVA was performed on each of the four decision variables. As mentioned above, the analysis was performed on ranked data.I®
Table IV-6 presents the summary results of the univariate ANOVAs. Table IV-6 indicates that the predicted NI and NIEI expectations were significantly different at the .05 level for at least two of the three METHODS. Also, the SP and SPEI expectations were not significantly different at the

84
.05 level for the three METHODS of accounting for income taxes used in the study.
TABLE IV-6 UNIVARIATE ANALYSIS OF VARIANCE RESULTS
VARIABLE F VALUE PROB. > F
NET INCOME (NI)METHOD EFFECT 35.992* .000DFTAX EFFECT 1.621 .205METHOD BY DFTAX EFFECT .643 .527
STOCK PRICE (SP)METHOD EFFECT .075 .928DFTAX EFFECT 7.432* .007METHOD BY DFTAX EFFECT 1.257 .287
NET INCOME IEQUIVALENCE INTERVAL (NIEI)METHOD EFFECT 8.264* .001DFTAX EFFECT .543 .463METHOD BY DFTAX EFFECT 2.935 .056
STOCK PRICE EQUIVALENCE INTERVAL (SPEI)METHOD EFFECT . 866 . 423DFTAX EFFECT .096 .757METHOD BY DFTAX EFFECT 1.804 .168
* significant at alpha equal to .05

85
The second main effect, DFTAX, was significant for only the SP prediction. That is, the predicted SP was significantly different for the high and low levels of deferred taxes. However, the expectations of the subjects receiving the High and Low company financial statements were not significantly different for NI, NIEI and SPEI. The interaction effect was not significant at the .05 level for any of the decision variables.
The univariate ANOVA results discussed above suggest that there was no evidence to reject hypotheses HI and H2. Hence there was no evidence to reject hypotheses H5, H5, H9 and H10 as well. On the other hand, hypotheses H3 and H4 were rejected. Hypothesis H15 was also rejected. There was, however, no evidence to reject hypotheses H16 through H18.
Multiple Comparisons For The METHOD EffectSince there were three levels of the METHOD factor
(DMCA, FT, and FTD), multiple comparison techniques were used to see which factor levels differed significantly. Four multiple comparison tests, Fisher's LSD, Tukey-Kramer HSD, LSDMOD, and SCHEFFE, were u s e d . 12 The results of all the four tests were consistent. Table IV-7 presents the mean scores of the subjects 1 responses and the results of the multiple comparisons.12

86
TABLE IV-7 MEAN SCORES OF THE DECISION VARIABLES
FACTOR NI SP NIEI SPEI
METHODCA 369.34 47.93*] 39.21 15. 53*1FT 411.54*1 47.22 61.31*1 14.08FTD 406.60J 48.40J 52.62J 17.79
«4
DFTAXHIGH 398.067 46.34 55.24*1 16.07*1LOW 393.59j 49.43 46.85J 15.53j
Note: Means linked by a common bracket do not significantly differ from each other. Means not linked together significantly differ at an alpha level of .05.
Table IV-7 indicates that the NI and NIEI expectations of the subjects who received the DMCA financial statements were significantly different from the expectations of the subjects who received the FT or FTD financial statements.The NI and NIEI expectations of the subjects who received the FT financial statements were not significantly different from the expectations of subjects who received the FTD financial statements. Thus, hypotheses H7, H8, Hll and H12 were rejected. As shown in Table IV-7, the mean NI and NIEI increased for the FT and FTD methods. However, the SP and SPEI were

87
not affected by the method of accounting for income taxes. Both the SP and SPEI showed a very small decrease under the FT method. Although the two variables were highest for the FTD method, their differences were not statistically significant (alpha = .05) and, therefore, appear to be due to chance.
As expected, Low Company (low level of deferred tax credits) had a higher predicted stock price than High Company (high level of deferred tax credits). Thus, hypothesis H15 was rejected. One possible explanation of this result is that the subjects viewed the higher deferred tax credits for High Company as an indication of higher future cash outflows in the form of higher future taxes. While High Company did have a higher predicted NI, NIEI, and SPEI, the differences were not significant and, thus, are attributable to chance.
Tests Of The Accuracy Hypotheses 13 And 14Hypotheses H13 and H14 examined the effect of the
different methods of accounting for income taxes on the mean square error (MSE) of subjects' stock price and net income predictions. The MSE was calculated as:
MSEP = [ S (Ysi - Ye)2] / nP (1)i s i x
Where:Ysi = it*1 subject's prediction of NI or SP;Ye = actual NI or SP;

88
nP = number of subjects in group p; and p = method of accounting for taxes (1,2, or 3).
The tests of hypotheses H13 and H14 were conducted using the same procedure (Hummel and Sligo [1971]) used for the analysis of the decision variables. That is, seperate univariate ANOVAs were performed following a significant MANOVA. A summary of group means on the dependent variables net income accuracy (NIAC) and stock price accuracy (SPAC) is presented in Table IV-8.
All four MANOVA tests were consistent and showed a significant METHOD effect at the .05 level (p = .000 for Pillai's, Wilks's, and Hotelling's tests). Seperate univariate ANOVAs were performed on the NIAC and SPAC variables to determine which variable resulted in the significant MANOVA. The ANOVA results are presented in Table IV-9.
As shown in Table IV-9, the NIAC variable significantly seperated the three accounting method groups at the .05 level of significance. On the other hand, the SPAC variable failed to seperate the three method groups significantly. In other words, while there were significant differences in the accuracy (MSE) of the net income predictions for at least two of the three groups, there were no significant differences in the MSE of the stock price predictions for the alternative methods of accounting for income taxes used in the study. Thus, while hypothesis H14 was rejected, there was no

89
evidence to reject hypothesis H13.
TABLE IV-8 GROUP MEANS (MSE) FOR NIAC AND SPAC
METHOD
VARIABLE DMCA FT FTD
NIAC 4,951 18,297___________ 19, 519
SPAC 70.79____________ 91.06____________ 76 . 50
Note: Means linked by a common line beneath them indicates that they are not significantly different from each other. Means not linked together, significantly differ at an alpha level of 0.05.
In order to see which of the three accounting methods differed significantly for the NIAC, multiple comparisons were performed. The four multiple comparison tests, LSD,
I
HSD, LSDMOD and SCHEFFE, provided consistent results. The results, presented in Table IV-8, show that the accuracy of net income prediction under the DMCA method was significantly higher (lower MSE) than under the FT or FTD methods. NIAC under the FT method was somewhat higher than under the FTD method, but the difference was not significant. The accuracy

90
of stock price prediction (SPAC) was greatest for the DMCA method and least for the FT method. However, the differences between the SPAC under the three methods were not statistically significant at the .05 level.
TABLE IV-9 HYPOTHESES H13 AND H14 ANOVA RESULTS
VARIABLE F VALUE PROB. > F
NET INCOME ACCURACY (NIAC) METHOD EFFECT 15.007* . 000
STOCK PRICE ACCURACY (SPAC) METHOD EFFECT .299 .743
* significant at alpha equal to .05
Statistical Analysis Of The Perception VariablesAs discussed in Chapter III, the study also used two
perception variables: (1) the importance of certain information items or cues (RATING) and (2) the overall level of information (INFO). The RATING and INFO variables were measured on an 11-point scale. The questions used for eliciting the responses were the following:

91
Q1. Rate (not rank) each of the following information items independently as to how important they are to your above estimates on a scale of 0 to 10 (0: not important and 10: very important):Item RatingNet Income (NI) ______Earnings per Share (EPS) ______Cash Dividends (CDIV) ______Current Taxes (CURTX) ______Stock Price (SP)_____________________ ______P/E Ratio (P/E)______________________ ______Net Sales (N-S) ______Deferred Taxes (DT) ______S&P 500 Index (S&P)________________________Total Debt/Equity (TD/EQ) ______Book Equity per Share (BKEQ) ______Current Ratio (CR) ______
Q2. To what extent the presented information was adequate for your estimates (please circle one):
Not FullyAdequate 0 1 2 3 4 5 6 7 8 9 10 Adequate
Table IV-10 presents the frequency distribution of the perception variables. For half of the information cues (NI, EPS, SP, P/E, N-S, and S&P) the most frequent weight (mode) given by the financial analysts was ten, the maximum possible weight. However, for the INFO variable the modal weight was only three.
The mean, median, standard deviation, and rank of the information cues is presented in Table IV-11. The net income information provided in the test instrument was the most important cue with respect to the decision variables (pre

92
dieting NI, SP, and their equivalence intervals). The NI cue was followed by EPS, P/E, N-S, and SP. In light of the alleged popularity of dividend based stock valuation models [Fuller and Hsia, 1984], cash dividend information had a surprisingly low mean weight (4.55) and rank (10). The CDIV cue was ranked higher than only the CR and DT cues.
Although deferred tax information had the lowest mean (3.76) and rank (12), it was still considered useful information. Only 10.6 percent of the subjects gave it a weight of zero. 3.5 percent gave it the highest possible weight of ten and 37.3 percent gave it a weight of five or more. It appears that the deferred tax information was considered important by the subjects and that they did not completely ignore it in making their predictions.
Since information provided to the subjects was primarily accounting information in the form of financial statements, it is not surprising that many subjects did not consider it as adequate for their investment decision. The mean weight for the INFO variable was 4.91. About 5 percent gave it a weight of zero, while 3 percent gave it the highest weight (fully adequate). Approximately 46 percent considered the information as adequate, a weight of six or more.

93
TABLE IV-10ADJUSTED FREQUENCY (%) OF THE RESPONSES
ON THE PERCEPTION VARIABLES
RESPONSE WEIGHT
0 1 2 3 4 5 6 7 8 9 10
NI 0.0 0.7 1.4 0.0 0.7 5.6 0.7 9.7 16.7 11.1 53_._5EPS 0.7 1.4 1.4 2.1 0.0 6.9 5.5 5.5 19.3 13.1 44.1CDIV 6 . 3 7.6 12.5 9.0 4.9 25.7 10.4 10.4 9 . 0 2.1 2.1CURTX 6.3 2.1 9.1 8.4 9.8 23.1 8.4 9.8 13.3 4.2 5.6SP 2.1 4.9 3.5 2.1 4.2 11.8 5.6 18.1 16.0 11.8 20 .1P/E 0.7 1.4 0.0 4.2 1.4 6.9 2.1 13. 9 25.7 13.2 30 . 6N-S 0.0 0.0 3.4 4.1 3.4 13.1 6.2 12.4 15.9 12.4 29 . 0DT 10.6 9.2 15.5 20.4 7.0 14.1 4.9 8.5 4.9 1. 4 3.5S&P 4.2 4.9 3.5 7.6 4.9 11.8 8.3 12.5 16.0 9.7 16 .7TD/EQ 4.2 3.5 6.9 13.9 6.9 22.2 12.5 14.6 7.6 6.3 1.4BKEQ 7.6 8.3 6.9 11.8 6.9 16.0 11.8 14.6 6.3 6.3 3 . 5CR 11.2 10.5 13.3 9.1 11.9 14.0 9.1 9.1 7.7 1.4 2.8INFO 5.4 4.7 10.7 17.4 11.4 4.7 10.1 14.1 12.1 6.7 2.7
Note: A line beneath the response frequency indicates the mode for the variable, i.e., the mode for NI and DT was 10 and 3, respectively.

94
TABLE IV-11DESCRIPTIVE STATISTICS OF THE PERCEPTION VARIABLES
VARIABLE MEAN MEDIAN STD. DEV. RANK
NI 8.74 9.57 1.82 1EPS 8.30 9.05 2.21 2CDIV 4.55 4.89 2.52 10CURTX 5.19 5.12 2.63 7SP 6.89 7.39 2.71 5P/E 7.94 8.26 2.15 3N-S 7.55 7.96 2.41 4DT 3.76 3.22 2.62 12S&P 6.34 6. 89 2.92 6TD/EQ 5.06 5.16 2.37 8BKEQ 4.79 5. 02 2.75 9CR 4.02 4.00 2.71 11INFO 4.91 4.57 2.72 -
The tests for hypotheses H20 through H23, regarding the perception variables, were performed in the same manner as for the decision variables. An ANOVA was performed for the INFO variable. The results of the ANOVA are presented in

95
Table IV- 1 2 .^ As shown in Table IV-12, none of the main effects, DFTAX, METHOD, or the METHOD by DFTAX interaction, was significant at the .05 level. In other words, the responses of the subjects did not significantly differ for the three methods of accounting for income taxes and the two levels of deferred tax credits. Thus, there was no evidence to reject hypotheses H20 and H21.
TABLE IV-12 ANOVA RESULTS FOR THE INFO VARIABLE
EFFECT F VALUE PROB. > F
METHOD EFFECT 0.386 . 680DFTAX EFFECT 0.013 . 911METHOD BY DFTAX EFFECT 0.996 . 372
A separate MANOVA was performed for the 12 information cues for the RATING variable. ^ That is, the RATING responses for NI, EPS, CDIV, CURTX, SP, P/E, N-S, DT, S&P, TD/EQ, BKEQ, and CR were treated as dependent variables.The results of the MANOVA are presented in Table IV-13. All four MANOVA tests were consistent in that there was no significant effect for the METHOD, DFTAX, or the METHOD by

96
DFTAX interaction. The perceptions of subjects in the six groups concerning the importance of the 12 information items or cues were not different. Therefore, there was no evidence to reject hypotheses H22 and H23.
CHARACTERISTICS OF SUBJECTS
Financial analysts from 30 states participated in the study.3-9 More chan 98 percent of the respondents had earned a college degree; 28.3 percent (43 count) had earned a Bachelors degree; and 70.4 percent (107 iount) had earned a Masters or higher degree.
The mean experience was 16.2 years and the mode was 20 years. The range in experience was from one to fifty years. The standard deviation was 10.9 years. The experience indicated here denotes actual experience in evaluating financial statements for investment p u r p o s e s . ^0

TABLE IV-13 MANOVA RESULTS FOR RATING VARIABLES
EFFECT — METHOD BY DFTAXMULTIVARIATE TESTS OF SIGNIFICANCE (S = 2, M = 4.5, N = 60)
TEST NAME VALUE APPROX. F HYPOTH. DF ERROR DF PROB.> F
PILLAIS .165 0.923 24.0 246.0 . 571HOTELLINGS .183 0.924 24.0 242.0 .569WILKS . 840 0 . 924 24.0 244.0 . 570ROYS .118
EFFECT — METHODMULTIVARIATE TESTS OF SIGNIFICANCE (S = 2, M = 4.5, N = 60)
TEST NAME VALUE APPROX. F HYPOTH. DF ERROR DF PROB.> F
PILLAIS .213 1.224 24.0 246.0 .221HOTELLINGS .246 1.241 24.0 242.0 .208WILKS .795 1.233 24.0 244.0 .214ROYS .157
EFFECT — DFTAXMULTIVARIATE TESTS OF SIGNIFICANCE (S = 1 , M = 5, N = 60)
TEST NAME VALUE APPROX. F HYPOTH. DF ERROR DF PROB.> F
PILLAIS .127 1.474 12.0 122.0 .143HOTELLINGS .145 1.474 12.0 122.0 .143WILKS . 873 1.474 12.0 122.0 .143ROYS .127

98
The sophisticated nature of the respondents was further evidenced by their professional certifications. A majority, 55.3 percent, of the respondents were chartered financial analysts (CFAs); five respondents (3.3%) were certified public accountants (CPAs); and eleven (7.2%) had other professional certifications. Thus, the sampling procedure appears to have been successful in reaching experienced financial analysts who were familiar with the task.
The fact that the respondents took the task seriously is also reflected in the time devoted to the response. The mean time taken was 18.5 minutes, and the mode was 20 minutes. A majority, 51.7 percent, took 11 to 20 minutes. The demographic data is summarized in Table IV-14.
Summary Of The Results
The results of the hypotheses tested are summarized in Table IV-15. An alpha level of .05 was used throughout the analysis. Therefore, all of the hypotheses shown as rejected in Table IV-15 were significant at the .05 level of significance.

99
TABLE IV-14 DEMOGRAPHIC DATA
MEASURE COUNT PERCENTAGE
FORMAL EDUCATIONHIGH SCHOOL 1 0.7SOME COLLEGE 1 0.7BACHELORS DEGREE 43 28.2MASTERS DEGREE OR HIGHER 107 70.4
EXPERIENCE1 to 3 years 21 13.84 to 7 years 21 13.88 to 15 years 37 24 . 3
16 to 30 years 59 38.8over 30 years 14 9.3
CERTIFICATIONCFA 84 55.3CPA 5 3.3OTHER 11 7.2NONE 52 34 .2
TIME TAKEN 5 to 10 minutes 42 27 . 8
11 to 20 minutes 78 51.721 to 40 minutes 23 15.2over 40 minutes 8 5.3

100
In conclusion, the subjects for this experiment were experienced financial analysts engaged in financial statement analysis for investment purposes. The method of accounting for income taxes affected the net income prediction of the subjects and their confidence therein. The flow-through method resulted in a higher predicted net income, and lower confidence therein, than the deferred method of comprehensive allocation.
The disclosure of deferred tax information in the footnotes reduced predicted net income (and increased the confidence therein), but the predicted net income was still significantly higher (lower confidence) than under the deferred method of comprehensive allocation. Thus, as far as prediction of net income (and subjects confidence therein) is concerned, the form in which deferred tax information is disclosed has a significant affect. However, as discussed below, the effect did not carry-over to the stock price prediction.
The different methods of accounting for income taxes used in the study did not affect financial analysts' stock price predictions. There was also no affect on financial analysts' confidence in their stock price predictions. The significant effect on net income prediction, together with the nonsignificant effect on stock price prediction, suggests that the financial analysts did not naively predict a higher

101
stock price for the higher predicted net income. The financial analysts were apparently able to adjust their stock price prediction for the fact that the different accounting methods do not have any differential cash flow implications.
TABLE IV-15 HYPOTHESES TESTS SUMMARY
HYPOTHESES DEPENDENT VARIABLE OUTCOME
HI : METHOD EFFECT SP FAIL TO REJECTH2 : METHOD EFFECT SPEI FAIL TO REJECTH3 : METHOD EFFECT NI REJECTH4 : METHOD EFFECT NIEI REJECTH5 : (CA VS . FT) SP FAIL TO REJECTH6 : (CA VS . FT) SPEI FAIL TO REJECTH7 : (CA VS . FT) NI REJECTH8 : (CA VS . FT) NIEI REJECTH9 : (CA VS . FTD) SP FAIL TO REJECTH10: (CA VS . FTD) SPEI FAIL TO REJECTHll: (CA VS . FTD) NI REJECTH12: (CA VS . FTD) NIEI REJECTH13 : METHOD EFFECT SPAC FAIL TO REJECTH14 : METHOD EFFECT NIAC REJECTH15: DFTAX EFFECT SP REJECTH16: DFTAX EFFECT ' SPEI FAIL TO REJECTH17 : DFTAX EFFECT NI FAIL TO REJECTH18 : DFTAX EFFECT NIEI FAIL TO REJECTHI 9: INTERACTION SP, SPEI, NI, NIEI FAIL TO REJECTH20 : METHOD EFFECT INFO FAIL TO REJECTH21: DFTAX EFFECT INFO FAIL TO REJECTH22 : METHOD EFFECT RATING FAIL TO REJECTH23: DFTAX EFFECT RATING FAIL TO REJECT

102
A comparison of the average predicted net income to the actual net income for the appropriate accounting method indicated that the deferred method of comprehensive allocation had a lower mean square error (or higher accuracy). The predicted net income and stock price was higher than the actual net income and stock price for both deferred method of comprehensive allocation and the flow-through method.However, the difference for stock price was much smaller, and the mean square error was not significantly different for the deferred method of comprehensive allocation and the flowthrough method.
The magnitude of deferred tax credit account affected only the stock price prediction. There was no significant affect on the prediction of net income and the two confidence (equivalence) intervals. The significantly lower predicted stock price for the company with the high level of deferred taxes suggests the financial analysts may view deferred tax credits as future cash outflows in the form of higher future income taxes.
Analysis of the perception variables indicated that, although most of the subjects would have liked more inform a t i o n a l a substantial number of the subjects found the information adequate for the given task. That there were no differential perceptions of the level of information presented across the six treatment groups suggests that deferred

103
tax information was not perceived as very important by the financial analysts, even though it significantly affected their net income prediction.
Also, the perceptions of the different subject groups concerning the importance of various information cues did not significantly differ. This suggests good control and effectiveness of the random assignment. The deferred tax information ranked 12*-*1 (last) in importance compared to the other information cues. However, about 40 percent of the subjects gave it a weight of five or more and about 4 percent gave it the highest weight.

104
CHAPTER IV ENDNOTES
1. The problem of nonresponse bias and the difficulty of assessing the same has been discussed at length in chapter III. In order to account for the nonresponse bias it is generally assumed that the responses of the late respondents are similar to the nonrespondents. In other words the late respondents are used as a surrogate for nonrespondents. This obviously may not hold true for all studies.
2. Repeat analyses were done for transformed and ranked data. None of the analyses indicated any significant differences for the early/late blocking factor.Further, the first 52 responses were also compared to the last 52 responses but no significant early/late effect was found (p = .295 for Wliks1s Lambda).
3. The several analyses and hypotheses tests, discussed later, were repeated after including these two responses. There was no change in the significance of any of the results.
4. This result is based on the Kolmogorov-Smirnov test at alpha = .05.
5. There are several reasons why the decision variables and the perception variables were analyzed seperately. Most importantly, the number of usable responses for the perception variables were less than the usable responses for the decision variables. All subjects did not answer all the questions. Also, the perception variables were not expected to be correlated with the decision variables, and thus no need for a single MANOVA. This was tested by computing spearman rank correlation coefficients for the four decision variables with the perception variable, INFO. None of the coefficients were significant at the .10 level.
6. The significance of the results was not affected by keeping the interaction term in the models. The p values for the model with the interaction term were .330 for the interaction, .000 for the METHOD, and .114 for

105
the DFTAX effect.7. As mentioned in endnote 14 of Chapter III, nonorthogonal
designs can be analyzed in different ways. That is, the SS can be partitioned in more than one logical way and the results may differ for the different partitions [Herr and Gaebelein, 1978]. The results reported here are based on the method called "unweighted means."Under this method the results do not depend upon the cell sizes (the differences are attributed to chance), and is the preferred method especially if interaction is not significant. This partitioning of the SS, where each term is adjusted for every other term in the model is obtained by specifying SSTYPE(UNIQUE) [SPSS, 1981,p.65]. The other option in SPSS is a SEQUENTIAL decomposition of the SS. In this method, a term is corrected for all terms entered before it in the model. This is the "hierarchical" model, where one effect (row or coloumn) is more important. The MANOVAs were repeated for the two possible hierarchical models (1) METHOD first and (2) DFTAX first. However, there was no change in the significance of the results reported here.
8. For the model with the interaction term, the interaction had a p value of .122 (Wilks's Lambda), METHOD p = .000, and DFTAX p = .008 (not much different from the pooled model). Also, there was no change in the significance of the reported results (alpha = .05) for the alternative hierarchical models. The p value for the DFTAX effect increased a little from the .009 reported here to .013 for the hierarchical analysis with the DFTAX effect as the first term in the model.
9. As mentioned in the earlier section (p. 80), under suchcircumstances the analysis on ranked data is probably more valid [Conover, 1980].
10. As a matter of fact, ANOVAs were performed on the unranked data also. The results were essentially the same as reported for the ranked data. That is, a significant METHOD effect for the NI (p = .000) and NIEI (p = .001) was obtained, and also a significant DFTAX effect for the SP (p = .018) . Further, the p value of the interaction effect for the NIEI was .08 as compared to .056
’ for the ranked data (see Table IV-6). The lower p value for the interaction may be an artifact of the rank transform procedure [Hora and Conover, 1984, p.668].
11. The results reported here are for the standard parametric analysis (STP). An advantage of the STP analysis

106
is that the results do not depend upon the cell sizes [Herr and Gaebelein, 1978, p.212]. However, repeat ANOVAs were performed for the other options available in SPSS. These included — each main effect adjusted for the other (EAD); hierarchical with rows first, then columns adjusted for rows (HRC); and hierarchical with columns first, then rows adjusted for colums (HCR).There was no difference in the significance of the effects (p values did change a little) for the STP, EAD, and HCR models. The only significant change was for the DFTAX effect in the HRC model. DFTAX, which was significant at the .05 level in the STP, EAD and HCR models, was not significant (p = .188) in the HRC model (Rows: DFTAX; Columns: METHOD). In a hierarchical model a term is corrected for all terms to its left, and is confounded with all terms to its right [SPSS, 1981, p.65]. Thus, in the HRC model the first term DFTAX was confounded with the second term, METHOD.
12. Fisher's LSD is the most powerful and least strict (or safe). Tukey-Kramer's HSD has sufficient power (less than LSD) and also holds the experimentwise error rate to alpha. Though widely used, the HSD is conservative for unequal group sizes [Kleinbaum and Kupper, 1978].The LSDMOD is less powerful than the HSD but more safe and is also exact for unequal group sizes. The SCHEFFE test is the least powerful but stricter (safe) than all the other tests. It is called a confirmatory test and is exact, even for unequal group sizes. All the above multiple comparison tests were consistent in the results reported here.
13. The results of the multiple comparisons on unranked data were consistent with the results of the multiple comparisons on ranked data that are reported here.
14. The normality assumtion for the NIAC and SPAC was tested using the Kolmogorov-Smirnov test. The null hypothesis of normality was rejected in one of the three cells for NIAC and in all the three cells for SPAC. The square root transformation corrected for the nonnormality of SPAC. The natural logarithm transformation corrected for the nonnormality in one of the cells for NIAC, but it adversely affected the homogeneity of variances assumption and, therefore, could not be used. The homo- scedasticity assumption was valid. Both the Cochran's C and Bartlett- Box's F tests were not significant for NIAC and square root of SPAC. Box's M, the multivariate test for homogeneity of dispersion matrices was also not significant (p = .376). Thus, there did not seem to be

107
a problem with the assumptions of MANOVA and ANOVA for the accuracy variables. However, the analyses were repeated for ranked data and the results were consistent with the reported results for unranked data.
15. The Kolmogorov-Smirnov test for normality was not rejected in any of the six cells. The Cochran C and Bartlett-Box F tests for homogeneity of variances were also not rejected (p = .19 and .376). Thus, there seemed to be no problem with the assumptions of the ANOVA for the INFO variable.
16. The results of the other nonorthogonal analysis models were consistent with the results of the EAD model reported here.
17. The Kolmogorov-Smirnov test for normality was rejected in only eight of the 72 cells. The main problem seemed to be with the NI and EPS variables. Use of the square of the NI and EPS responses reduced the nonnormal cells to six. The Cochran C test for homogeneity of variances was not rejected for any of the 12 variables (alpha equal to .05). Thus, there did not seem to be much of a problem with the assumptions of the MANOVA.
18. The Bartlett test of spherecity, a measure of association between the dependent variables was significant (p = .000), indicating a need for performing a single MANOVA, rather than seperate ANOVAs.
19. When the respondent did not identify himself or herself, the location was determined from the return envelope.
20. See question five in the test instruments, Appendices A to F.
21. Responses to the open ended question regarding additional required information (see Q3, Appendices A to F) indicated that the most sought after information was detailed segment information. Other frequently mentioned information included industry outlook and related industry data. A few subjects also asked for detailed tax rates and affect of federal tax changes.

CHAPTER VSUMMARY AND CONCLUSIONS
This chapter presents the summary and major implications of this research project. The topics discussed in this chapter are: a summary of the research; the implications ofthe research findings; and some suggestions for future research.
SUMMARY
In November 1986, the r’ASB issued an exposure draft of a proposed statement of financial accounting standards, Accounting for Income Taxes. The exposure draft is the result of a five year project to review the financial reporting requirements of income taxes. Contrary to expectations, the FASB decided that comprehensive interperiod income tax allocation should be continued. However, the Board has decided to replace the existing deferred method with the liability method.
Two alternatives to comprehensive interperiod allocation of income taxes, flow-through and partial allocation, have
108

109
been proposed. Within comprehensive allocation itself, several alternatives have been suggested in lieu of the current deferred method. There is, however, no consensus on any single alternative [FASB, 1986, p.l]. A review of the related literature revealed that most writers had adopted an a priori deductive approach. Traditional arguments concerned with "true" income and "intrinsic value" of the firm added fuel to the controversy, and it is virtually impossible to resolve the controversy with these traditional sorts of arguments [Beaver and Dukes, 1972].
There have been only a few empirical studies on the subject of income tax allocation. One group of empirical studies focused on the growth of deferred tax credits and whether resultant deferred taxes, due to timing differences, are permanent or temporary. These studies have concluded that payback of deferred taxes is the exception and that comprehensive income tax allocation, which is based on the belief that tax deferrals will reverse, may not be valid [Davidson, 1958; Livingstone, 1969; McGee, 1984; Voss, 1968].
A second group of empirical studies suggests that comprehensive allocation using the deferred method is most consistent with the information set used in setting security prices, and is more accurate with respect to the IRR criterion [Beaver and Dukes, 1972; Greenball, 1969]. Both groups of studies have limitations .

110
The focal point of this study was to determine whether alternative methods of accounting for income taxes (deferred method of comprehensive allocation versus flow-through) affect investment decisions. The underlying motivation for this research was that prior research had not sufficiently examined the impact of income tax allocation on individual financial statement users' decisions.
Behavioral science methodologies are particularly appropriate for answering questions about usefulness or relevance of information. Therefore, to test the effect of deferred method of comprehensive allocation and the flow-through method of accounting for income taxes, and also whether the form of disclosure of deferred tax information makes a difference, the behavioral science experimental approach was used.
Subjects were asked to predict future net income, common stock price, and the related equivalence interval for each prediction. The subjects based their predictions on actual company financial statements and selected financial information cues. The financial statements were restated to reflect the flow-through method of accounting for income taxes and two levels (high and low) of deferred taxes. Test instruments were mailed to a random sample of professional financial analysts. The study's data was drawn from 154 usable responses. The data was analyzed using multivariate analysis

Ill
of variance followed by univariate analysis of variance and a posteriori multiple comparisons.
The results of the research showed that the method of accounting for income taxes did affect financial analysts' net income predictions and their confidence therein. Financial analysts who received the FT financial statements made a higher net income prediction and had lower confidence in their net income prediction than financial analysts who received the DMCA financial statements.
The form of disclosure of deferred tax information also affected financial analysts' net income prediction and the confidence they placed in their prediction of net income. Financial analysts who received the deferred tax information (based on comprehensive allocation) as a footnote to the flow-through financial statements (i.e., FTD financial statements) made a significantly higher net income prediction (and had lower confidence therein) than financial analysts who received the same deferred tax information in the body of the financial statements (i.e., DMCA financial statements).
The different methods of accounting for income taxes and the form of disclosure of deferred tax information did not result in significantly different stock price predictions nor in significantly different confidence in the predicted stock price. In other words, there was no evidence to suggest that the differences in predicted stock price and confidence

112
therein could be attributed to any factor other than chance.The magnitude of the deferred tax credit account, the
second independent variable in the 3 X 2 factorial experiment, significantly affected only stock price predictions. More specifically, financial analysts who received Low Company financial statements (low level of deferred tax credits) made a significantly higher stock price prediction than financial analysts who received High Company financial statements (high level of deferred tax credits). The predicted stock price for High Company was closer to the actual stock price.
The study also investigated the effect of the alternative methods of accounting for income taxes on the ability of financial analysts to correctly predict net income and stock price using mean square error as the dependent variable. Financial analysts who received DMCA financial statements made more accurate net income prediction than financial analysts who received the FT financial statements or FTD financial statements. Net income prediction accuracy of financial analysts who received the FT financial statements was not significantly different from that of financial analysts who received the FTD financial statements. The deferred method of comprehensive allocation also led to the most accurate stock price prediction but the predicted stock price was not significantly (statistically) different from
113
the predicted stock price for the flow-through or flowthrough with footnote disclosure method.
Analysis of subjects' perceptions showed that financial analysts ranked the net income, earnings per share, and price to earnings ratio as the top three most important information cues provided in the test instrument. The deferred tax information, however, was not perceived as very important by financial analysts in making their predictions. However, it was important enough to make a significant difference in the predictions of net income and stock price. Also, financial analysts in the six treatment groups did not have any significant differential perceptions about the importance of twelve selected information cues, nor with regard to the overall level of information provided in the test instruments.
RESEARCH IMPLICATIONS
The results of this study suggest that the alternativeI
methods of accounting for income taxes (DMCA versus FT) significantly affect net income prediction. However, the alternative methods do not significantly affect the stock price prediction. The subjects of the study, financial analysts, were able to adjust the stock price prediction to the underlying economic situation despite apparent differences in

114
reported accounting income. In other words, the financial analysts, consistent with the accounting method employed, did predict a higher net income under the flow-through method, but did not naively follow-up with a higher stock price prediction. The financial analysts rightly acted as if the different methods of accounting for income taxes had no differential cash flow implications.
Thus, if the investment decision is considered solely a function of future stock price, then the results of the research suggest that the alternative methods of accounting for income taxes do not affect the investment decision. Such a conclusion would imply that, as argued by Beaver [1973], the deferred tax controversy lacks substance. The implications would be same as suggested by Krueze [1983]. That is, if differences between the alternative mechods of accounting for income taxes are not material, from a usefulness perspective, then the less complex and probably less costly flow-through method may be best.
However, putting much faith in the above conclusion and implication would be rather naive and simplistic. The investment decision is a complex decision and has several dimensions. Focus on future stock price alone may be inappropriate. The significant differences in net income prediction and accuracy, as well as the significant affect of the magnitude of deferred tax credit account on stock price

115
prediction need to be considered.The significant difference in predicted stock price for
the magnitude of deferred tax credit account (high versus low) implies that the financial analysts probably consider the magnitude of deferred tax credits as having differential cash flow implications. ̂ The above finding, together with the finding that the comprehensive allocation method results in more accurate net income prediction,^ suggests that the FASB is correct in continuing with comprehensive allocation of deferred taxes. Further, the FASB seems to be moving in the right direction, (i.e., requiring the liability method) by removing any ambiguity in the interpretation of the deferred taxes that was there under the deferred method.
The significant difference in net income prediction for DMCA and the FTD method, and the greater net income accuracy under DMCA, suggest that even experienced professional financial analysts have difficulty in integrating footnote information in their predictions. Thus, for certain complex decision tasks footnote disclosure does not appear to be an adequate substitute for recognition in the body of the financial statements.
The significantly higher uncertainty (larger equivalence interval) in net income prediction under the flow-through method also suggests that the use of comprehensive allocation may be best. This follows if, ceteris paribus, reduction of

116
uncertainty in user assessments is accepted as a valid objective of financial reporting. The smaller equivalence interval for the comprehensive allocation method, as against that for the flow-through method, implies that comprehensive allocation provides greater information than flow-through, at least, so far as net income prediction is c o n c e r n e d . ̂ The significantly higher uncertainty of net income prediction under the flow-through method offers a possible explanation for the nonsignificant differences in stock price prediction despite significantly different net income predictions. It is very likely that the subjects receiving the flow-through method financial statements used a higher discount rate (because of the greater uncertainty) in arriving at the stock price than the subjects receiving the comprehensive allocation financial statements.
Results of the analyses on subjects' perceptions suggest that financial analysts did not perceive any differential information for the different methods of accounting for income taxes. Whereas the comprehensive allocation method provides more (deferred tax) information than the flowthrough method and there was a significant manipulation effect. The results are consistent with prior research findings that the subjects are often unaware that the stimulus has affected their response, especially when stimuli are not salient (as in this study)® [Nisbett and Wilson,

117
1977].® Further, the ranking of certain information cues based on perceived importance suggests that financial analysts focus more on historical net income, earnings per share, and price/earnings ratio in predicting future net income and stock price. There was little focus on cash dividends and other balance sheet items.
LIMITATIONS
The findings of this research are subject to all of the common limitations of similar behavioral studies. Prior behavioral research has found that subjects' responses are affected by the nature of the task [Biggs et al., 1985]? time pressure, the precise form of the prediction required, subject motivation and data presentation formats [Wright, 1982]. In general, the generalizability of the results and implications of any experimental study to subjects, tasks, or situations, other than those used in the experiment, should be made with utmost caution.
Another limitation results from the use of the mail process to obtain responses from real world subjects in a natural setting. That is, the possibility of nonresponse bias. This research had a response rate of 37.1 percent. Although low, the response rate is comparable to the response

118
rates of similar studies using mail questionnaires. However, there was no evidence of nonresponse bias based on the results of the commonly employed early-late test.
FUTURE RESEARCH
The findings of this research do provide some evidence of the effect of deferred taxes on the investment decision and the superiority of comprehensive allocation. However, the need for further empirical research on the subject exists.
The limitations of this study, mentioned in the earlier section, provide several points of departure for future research on the subject. This study examined only one user group (i.e., financial analysts) and the investment decision. Other user groups and uses of accounting information need to be examined. Future research should focus on other decision situations (such as a lending decision) and research designs using more than one company information. In this context, multiple-cue probability studies,^ using the Brunswik Lense framework, should provide insight into how the deferred tax information is used by the decision makers.
The present research served only as a first step in studying the overall effect of income tax allocation on the

119
investment decision. The effect of partial allocation and alternative treatments of deferred taxes should be studied. Finally, it is important that future behavioral studies employ multiple decision tasks and manipulate all of the relevant factors, as far as practicable.
f

120
CHAPTER V ENDNOTES
1. For detailed discussion of the different approaches and their limitations see Chapter II.
2. Jan E. Jerston [1965, p.813], a member of the New YorkSociety of Security Analysts, indicates that deferred tax information can assist analysts in a better projection of future cash generation.
3. As mentioned earlier, the comprehensive allocation method also had the most accurate stock price prediction but the difference (with other methods) was not statistically significant. See Table IV-8.
4. As mentioned in Chapter III, Beach et al. [1974] foundthat equivalence intervals placed around estimates narrow as information increases and widen as information decreases.
5. Thus, there is no evidence to suggest that the effort to not to sensitize the subjects to the deferred tax issueor its levels, etc., was not successful.
6. Several other studies have also found that subjects exhibit lack of self-knowledge about decision processes. For a review of such studies see Griffin [1982, pp.99- 121] .
7. For methodological considerations in the design of multiple-cue probability studies, among others, see Hursch, Hammond and Hursch [1964].

BIBLIOGRAPHY
Abdel-Khalik, A. Rashad and Ajinkya, Bipin B., EmpiricalResearch in Accounting: A Methodological Viewpoint, American Accounting Association, Sarasota,Florida 33583, 1979.
Abdel-Khalik, A. Rashad and Keller, Thomas F., "Earnings Or Cash Flows: An Experiment On Functional Fixation And The Valuation Of The Firm," Studies In Accounting Research No. 16, American Accounting Association, Sarasota, Florida 33583, 1979.
American Institute of Accountants, Committee on Accounting Procedure, ARB No. 23, Accounting for Income Taxes, New York: AIA, December 1944, (AICPA, 1944).
American Institute of Accountants, Committee on Accounting Procedure, ARB No. 43, Restatement and Revision of Accounting Research Bulletins, New York: AIA,June 1953, (AICPA, 1953).
American Institute of Accountants, Committee on Accounting Procedure, ARB No. 44 (Revised), Declininq-Balance Depreciation, New York: AIA, July 1958, (AICPA,1958).
American Institute of Certified Public Accountants, APB Opinion No. 11, Accounting for Income Taxes, New York: AICPA, December 1967, (AICPA, 1967).
Archibald, T. Ross, "Stock Market Reaction to theDepreciation Switch-Back", The Accounting Review, January 1972, pp. 22-30
Arnold, John, and Moizer, Peter, "A Survey of the Methods Used by UK Investment Analysts to Appraise Investments in Ordinary Shares", Accounting and Business Research. Summer, 1984, pp. 195-207.
Asebrook, Richard J. and Carmichael, D.R., "Reporting onForecastes: A Survey of Attitudes", The Journal of Accountancy, August 1973, pp. 38-48.
121

122
Ashton, Robert H., "The Predictive-Ability Criterion and User Prediction Models", The Accounting Review, October, 1974, pp. 719-732.
Ashton, Robert H., "Cognitive Changes Induced by Accounting Changes: Experimental Evidence on the Functional Fixation Hypothesis", Studies in Human Information Processing in Accounting, Supplement to Journal of Accounting Research, Vol.14, Supp. 1976, pp. 1-17.
Ball, Ray and Brown, Philip, "An Empirical Evaluation ofAccounting Income Numbers", Journal of Accounting Research, Autumn 1968, pp. 159-178.
Barker, Harry R. and Barker, Barbara M., MultivariateAnalysis of Variance (MANOVA), A Practical Guide toits Use in Scientific Decision Making, The University of Alabama Press, Alabama University, 1984.
Barret, M. Edgar, "Accounting for Intercorporate Investments: A Behavioral Field Experiment", Journal of Accounting Research, Supplement to Volume 9, 1971, pp. 50-92.
Barton, A. D., "Company Income Taxes and InterperiodAllocation", Abacus (Australia), September 1970, pp. 3-24.
Baylis, A. W., "Income Tax Allocation — A Defence", Abacus (Australia), December 1971, pp. 161-172.
Beach, Lee Roy, "Multiple Regression as a Model for HumanInformation Utilization", Organizational Behavior and Human Performance, Vol. 2, 1967, pp. 276-289.
Beach, Lee Roy, Beach, Barbara H., Carter, William B., and Barclay, Scott, "Five Studies of Subjective Equivalence", Organizational Behavior And Human Performance, Vol. 12, No. 3, December 1974, pp. 351- 371.
Beaver, William H., Kenelly, John W. and Voss, William M.,"Predictive Ability as a Criterion for the Evaluation of Accounting Data", The Accounting Review, October 1968, pp. 675-683.
Beaver, William H. and Dukes, Roland E., "Interperiod TaxAllocation, Earnings Expectations, and the Behavior of Security Prices", The Accounting Review, April 1972, pp. 320-332.

123
________ . , "Interperiod Tax Allocation and Delta-DepreciationMethods: Some Empirical Results", The Accounting Review, July 1973, pp. 549-559.
Beaver, William H., Clarke, Roger and Wright, William F.,"The Association Between Unsystematic Security Returns and the Magnitude of Earnings Forecast Errors", Journal of Accounting Research, Autumn 1979, pp. 316-340.
Beaver, William H., "The Information Content of Annual Earnings Announcements", Journal of Accounting Research, Supplement 1968, pp. 67-92.
________ . , "What Should Be the FASB1s Objectives?", Journalof Accountancy, August 1973, pp. 49-56.
________ . , Financial Reporting: An Accounting Revolution,Prentice Hall, Inc., 1981.
Beechy, Thomas H., "Partial Allocation: Variations on aTheme", CA Magazine (Canada), March 1985, pp. 82-86.
Beresford, Dennis R., "Deferred Tax Allocation Should be Changed", The CPA Journal, June 1982, pp. 16-23.
Beresford, Dennis R., Best, Lawrence C., Craig, Paul W., and Weber, Joseph H., Research Report — Accounting for Income Taxes, A review of Alternatives, FASB:Stamford, 1983.
Biggs, Stanley F., Bedard, Jean C., Gaber, Brian G. andLinsmeier, Thomas J., "The Effects Of Task Size And Similarity On The Decision Behavior Of Bank Loan Officers", Management Science, Vol. 31, No. 8, August 1985, pp. 970-987.
Black, Homer A., Accounting Research Study No. 9, Interperiod Allocation of Corporate Income Taxes, New York: AICPA, 1966.
Blough, Carman G., "Effect of Loss Years Upon Deferred Income Taxes", Journal of Accountancy, June 1958, pp. 74-76.
Boatsman, James R. and Robertson, Jack C., "Policy-Capturing On Selected Materiality Judgments", Accounting Review. April 1974, pp. 342-352.
Bohan, Michael P., "The Concept of APB Opinion No. 11 isBeing Whittled Away", Journal of Accounting, Auditing

124
and Finance, Fall 1979, pp. 76-82.Box, G.E.P., "Non-Normality and Tests on Variances",
Biometrica, Vol. 40, 1953, pp. 318-335.Bradish, Richard D., "Corporate Reporting and the Financial
Analyst", The Accounting Review, October 1965, pp. 757-766.
Brealy, Richard and Myers, Stewart, Principles of Corporate Finance, McGraw-Hill, Inc., 1981.
Brehmer, Berndt, "Response Consistency in ProbabilisticInference Tasks", Organization Behavior and Human Performance, Vol. 22, 1978, pp. 103-115.
Brenner, Vincent C., "Financial Statement Users' Views of the Desirability of Reporting Current Cost Information", Journal of Accounting Research, Vol. 8, No. 2, Autumn 1970, pp. 159-166.
Brouard, Nathalie and Ligault, Michael, "Another Perspective on Deferred Income Taxes", CA Magazine (Canada),May 1984, pp. 52-
Brunswik, E., "Representative Design and Probabilistic Theory in a Functional Psychology", Psychological Review,Vol. 62, 1955, pp. 193-217.
Buzby, Stephen L., "Selected Items for Inf' ;mation and Their Disclosure in Annual Reports", Accounting Review,July 1974, pp. 423-35.
Campbell, Donald T. and Stanley, Julian C. Experimental and Quasi-Experimental Desgns for Research. Handbook of Research on Teaching. Skokie, 111.: Rand McNally, 1963.
Carr, G. Kenneth, "Accounting for Income Taxes", The Canadian Chartered Accountant, October 1963, pp. 238-244.
Chamberlain, Henry T., "Tax Allocation Controversy", Journal of Accountancy, October 1958, pp. 23-28.
Chambers, R. J., "Tax Allocation and Financial Reporting", Abacus (Australia), December 1968, pp. 99-123.
Chazen, Charles, "Income Taxes — Reporting and Accounting", Outlook (California Society of CPA’s), Summer 1984, p. 55.

125
Cherulnik, Paul D., Behavioral Research: Assessing theValidity of Research Findings in Psychology. New York: Harper and Row, 1983.
Conover, W\ J., Practical Nonparametric Statistics, New York: John Wiley, 1980.
Cook, Thomas D. and Campbell, Donald T., Quasi-Experimentation: Design and Analysis Issues for Field Settings. Skokie, 111.: Rand McNally College Publishing, 1979.
Copeland, Ronald M., Francis, Arthur J., and Strawser, Robert H., "Students as Subjects in Behavioral Business Research", Accounting Review, April 1973, pp. 365-372.
Corless, John C., and Norgaard, Corine T., "User Reactions to CPA Reports on Forecasts", Journal of Accountancy, August 1974, pp. 46-54.
Cress, William P. and Green, Kenneth L., "Tax Allocation No Longer Avoidable By Smaller Business", Michigan CPA, Spring 1983, pp. 33-36.
Crocker, Olga L. K., Mithhell, Terence R., and Beach, Lee Roy, "A Further Examination of Equivalence Intervals", Organizational Behavior And Human Performance, Vol. 22, 1978, pp. 253-261.
Davidson, Sidney, "Accelerated Depreciation and theAllocation of Income Taxes", The Accounting Review, April 1958, pp. 173-180.
Davidson, Sidney, Skelton, Lisa and Weil, Roman L., "AControversy Over the Expected Behavior of Deferred Tax Credits" (Professional Notes), The Journal of Accountancy, April 1977, pp. 5 3 - 5 9 .
Davidson, Sidney, Rasch, Steven F. and Weil, Roman L.,"Behavior of the Deferred Tax Credit Account, 1973- 82" (Professional Notes), The Journal of Accountancy, October 1984, pp. 138-142.
Dermer, Jerry D., "Cognitive Characteristics and thePerceived Importance of Information", The Accounting Review, July 1983, pp. 511-519.
Dewhirst, John F., "Tax Allocation Reconsidered", The Canadian Chartered Accountant, February 1972, pp. 40-48.

126
Dickhaut, John W., Livingstone, John Leslie and Watson, David J. H •, "On the Use of Surrogates in Behavioral Experimentation", Research Methodology in Accounting, Scholars Book Co., 1972, pp. 75-89.
Dickinson, Harry D., "Accounting for Income Taxes: YourChance to Help Decide How", The Virginia Accountant, Vol. 36, June 1984, pp. 18-23.
Dillman, Don A. and Frey, James H., "Contribution ofPersonalization to Mail Questionnaire Response as an Element of a Previously Tested Method", Journal of Applied Psychology, Vol. 59, No. 3, June 1974, pp. 297-301.
Ditkoff, James H., "Financial Tax Accounting at theCrossroads", Journal of Accountancy, August 1977, pp. 69-80.
Dohr, James L., "Tax Allocation", Journal of Accountancy, February 1959, pp. 19-20.
Drew, Clifford J. and Hardman, Michael L., Designing andConducting Behavioral Research, Pergamon Press Inc., 1985
Driver, Michael J. and Mock, Theodore J., "Human Information Processing, Decision Style Theory and Accounting Information Systems", The Accounting Review, July 1975, pp. 409-509.
Drummond, Christina S. R. and Wigle, Seymor L., "Let's Stop Taking Comprehensive Tax Allocation for Granted",CA Magazine (Canada), October 1981, pp. 56-61.
Dudycha, Linda Weathers and Naylor, James C., "Characteristics of the Human Inference Process in Complex Choice Behavior Situations", Organizational Behavior and Human Performance, Vol. 1, 1966, pp. 110-128.
Dyckman, Thomas R., Investment Analysis and General Price-Level Adjustments: A Behavioral Study, AAA Accounting Research Study No. 1 , American Accounting Association, 1969.
Dyckman, Thomas R., Gibbins, Michael and Swieringa,Robert J., "Experimental and Survey Research in Financial Accounting: A Review and Evaluation", in The Impact of Accounting Research on Practice and Disclosure, eds., Abdel-Khalik, A. Rashad and Keller,

127
Thomas F., Duke University Press, Durhahm, N.C., 1978.Dyckman, Thomas R., Hoskin, Robert E. and Swieringa, Robert
J., "An Accounting Change and Information Processing Changes", Accounting, Organizations and Society,Vol. 7, No. 1, 1982, pp. 1-11.
Ebbesen, Ebbe B., and Konecni, Vladimir J., "On the External Validity of Decision-Making Research: What Do We Know About Decisions in the Real World?", Cognitive Processes in Choice and Decision Behavior, ed. Wallsten, Thomas S., Lawrence Erlbaum Associates, Publishers, New Jersy, 1980.
Ebert, R. J. and Kruse, T. E., "Bootstrapping the Security Analysts", Journal of Applied Psychology, October 1974, pp. 562-571.
Edgington, Eugene S., "Statistical Inference and Nonrandom Samples", Psychological Bulletin, Vol. 66, No. 6, December 1966, pp. 485-487.
Einhorn, H., "Learning from Experience and Suboptimal Rulesin Decision Making", in Cognitive Processes in Choice and Decision Behavior, T. Wallsten, ed., Earlbaum, 1980, pp. 1-20.
Elias, Nabil, "The Effects of Human Asset Statements on the Investment Decision: An Experiment", Empirical Research in Accounting, Selected Studies - 1972, pp. 215-233.
Etzel, Michael J. and Walker, Bruce J., "Effects ofAlternative Follow-up Procedures on Mail Survey Response Rates", Journal of Applied Psychology,Vol. 59, No. 2, April 1974, pp. 219-221.
Farrelly, Gail E., Ferris, Kenneth R., and Reichenstein, William R., "Perceived Risk, Market Risk, and Accounting-Determined Risk Measures", Accounting Review, April 1985, pp. 278-288.
Financial Accounting Standards Board, "Objectives of Financial Reporting by Business Enterprises,"Statement of Financial Accounting Concepts No. 1 , Stamford: FASB, November 1978, (FASB, 1978).
Financial Accounting Standards Board, "QualitativeCharacteristics of Accounting Information," Statement of Financial Accounting Concepts No. 2, Stamford:

128
FASB, May 1980, (FASB, 1980a).Financial Accounting Standards Board, "Elements of Financial
Statements of Business Enterprises," Statement of Financial Accounting Concepts No. 3, Stamford: FASB, December 1980, (FASB, 1980b).
Financial accounting Standards Board, FASB Discussion Memorandum: An analysis of issues related to Accounting for Income Taxes, Stamford: FASB,August 1983, (FASB, 1983).
Financial Accounting Standards Board, FASB Status Report No. 161, Stamford: FASB, October 9, 1984, (FASB,1984).
Financial Accounting Standards Board, Employers1 Accountingfor Pensions, (Exposure Draft), Stamford: FASB, 1985, (FASB, 1985).
Financial Accounting Standards Board, Accounting for IncomeTaxes, (Exposure Draft), Stamford: FASB, September 2, 1986, (FASB, 1986).
Fuller, Carol, "Effect of Anonymity on Return Rate andResponse Bias in a Mail Survey", Journal of Applied Psychology, Vol. 59, No. 3, June 1974, pp. 292-296.
Fuller, Russell J. and Hsia, Chi-Cheng, "A Simplified Common Stock Valuation Model", Financial Analysts Journal, September-October 1984, pp. 49-56.
Godwin, Larry B., "CPA and User Opinions on IncreasedCorporate Disclosure", The CPA, July 1975, pp. 31-35.
Gonedes, N. and Dopuch, N., "Capital Market Equilibrium, Information Production, and Selecting Accounting Techniques: Theoretical Framework and Review of Empirical Work", Studies on Financial Accounting Objectives; 1974, Supplement to the Journal of Accounting Research (1974), pp. 48-129.
Graham, Willard J., "Allocation of Income Taxes", Journal of Accountancy, January 1959a, pp. 57-67.
________ ., "Income Tax Allocation", The Accounting Review,January 1959b, pp. 14-27.
Greenball, M. N., "Appraising Alternative Methods ofAccounting for Accelerated Tax Depreciatiori: A

129
Relative Accuracy Approach", Journal of Accounting Research, Autumn 1969, pp. 262-289.
________ ., "The Predictive Ability Criterion: Its Relevancein Evaluating Accounting Data", Abacus (Australia), December 1971, pp. 1-7.
Grice, G. Robert, "Dependence of Empirical Laws Upon the Source of Experimental Variation", Psychological Bulletin, Vol. 66, No. 6, December 1966, pp. 488-498.
Griffin, Paul A., Usefulness to Investors and Creditors ofInformation Provided by Financial Reporting: A Review of Empirical Accounting Research, Financial Accounting Standards Board, Stamford, Connecticut 06905, 1982.
Haried, Andrew A., "Measurement of Meaning in Financial Reports", Journal of Accounting Research, Spring 1973, pp. 117-145.
Hartman, Bart P. and Sami, Heibatollah, "The Impact of the Accounting Treatment of Leasing Contracts On User Decision Making: A Field Experiment", Working Paper, Department of Accounting, Louisiana State University, Baton Rouge, 1984.
Hawkins, Eugene H., Chamberlin, Stanley C. and Daniel,Wayne E., "Earnings Expectations and Security Prices", Financial Analysts Journal, September- October 1984, pp. 24-27, 30-38 and 74.
Heberlein, T. A. and Baumgartner, R., "Is a Questionnaire Necessary in a Second Mailing?", Public Opinion Quarterly, Spring 1981, pp. 102-108.
Hendricks, James A., "The Impact of Human Resource Accounting Information on Stock Investment Decision - An Empirical Study", The Accounting Review, April 1976, pp. 292-305.
Herr, David G. and Gaebelein, Jacquelyn, "Nonorthogonal Two- Way Analysis of Variance", Psychological Bulletin, Vol. 85, No. 1, 1978, pp. 207-216.
Hill, Thomas M., "Some Arguments Against the InterperiodAllocation of Income Taxes", The Accounting Review, July 1957, pp. 357-361.
Hoffman, Paul J., Slovic, Paul and Rorer, Leonard G., "AnAnalysis-of-Variance Model for the Assessment of Cue

130
Utilization in Clinical Judgment", Psychological Bulletin, May 1968, Vol. 69, No. 5, pp. 338-349.
Honea, James H. An Empirical Study of Usefulness andCommunicative Ability of Segment Disclosures Among Sophisticated Users of Corporate Financial Statements, A Dissertation Proposal in Accounting, Louisiana State University, Baton Rouge, 1981.
Hora, Stephen C. and Conover, W.J., "The F Statistic in the Two-Way Layout With Rank-Score Transformed Data", Journal of The American Statistical Association, Vol. 79, No. 387, September 1984, pp. 668-673.
Howell, William C. and Burnett, Sarah A., "UncertaintyMeasurement: A Cognitive Taxonomy", Organizational Behavior And Human Performance, Volume 22, 1978, pp. 45-68.
Huck, Schuyler W. and Gleason, Edwin M. , "Using MonetaryInducements to Increase Response Rates From Mailed Surveys: A Replication and Extension of Previous Research", Journal of Applied Psychology, Vol. 59,No. 2, April 1974, pp. 222-225.
Hummel, T.J. and Sligo, R.J. "Empirical Comparisons ofUnivariate and Multivariate Analysis of Variance Procedures", Psychological Bulletin, Vol. 76, No. 1, 1971, pp. 49-57.
Hursch, Carolyn J., Hammond, Kenneth R. and Hursch,Jack L., "Some Methodological Considerations in Multiple-Cue Probability Studies", Psychological Review, Vol. 71, No. 1, January 1964, pp. 42-60.
Huss, Harry Fenwick, The Effects of Alternative Treatments of Deferred Income Tax Credits on the Predictive Ability of Financial Ratios in Bond Ratings, Doctoral Dissertation, The University of Tennessee, Knoxville, December 1982.
Hylton, Delmer P., "No Tax Allocation", Journal of Accountancy, May 1959, pp. 25-26.
Ijiri, Yuji, Jaedicke, Robert K. and Knight, Kenneth E, "The Effects of Accounting Alternatives on Management Decisions", In Jaedicke, Robert K., Ijiri, Yuji and Nielsen, Oswald (eds.), Research in Accounting Measurement, American Accounting Association, Evanston, Illinois, 1966.

131
Ito, K. and Schull, W. "On Robustness of the Test in Multivariate Analysis of Variance When Variance- Covariance Matrices Are Not Equal", Biometrika, 1964, Vol. 51, pp. 71-82.
Ito, K. "On the Effect of Heteroscedasticity and Non-Normality Upon Some Multivariate Test Procedures", In Krishnaiah, P.R. (ed.), Multivariate Analysis II,New York: Academic Press, 1969.
Jerston. Jan E., "Analyst's View of Deferred Income Taxes", Accounting Review, October 1965, pp. 812-813.
Johns, Ralph S., "Allocation of Income Taxes", Journal of Accountancy, September 1958, pp. 41-50.
Kaplan, Robert S. and Roll, Richard, "Investor Evaluation of Accounting Information: Some Empirical Evidence", The Journal of Business, April 1972, pp. 225-257.
Kaplan, Robert S., "The Information Content of FinancialAccounting Numbers: A Survey of Empirical Evidence", in The Impact of Accounting Research on Practice and Disclosure, Abdel-khalik and Keller, eds., Duke University Press, 1978, pp. 134-173.
Kerlinger, Fred N., Foundations of Behavioral Research., New York: Holt, Rinehart and Winston, 1964.
Khan, Faheem A., "Deferred Taxes — Should We Allocate", Cost and Management (Canada), January/February 1981, pp. 53-56.
Kleinbaum, David G. and Kupper, Lawrence L., AppliedRegression Analysis and Other Multivariate Methods, Duxbury Press, Mass., 1978.
Kreuze, Jerry Glenn, Comprehensive Income Tax Allocation: A Study Investigating The Extent To Which The Form And Content Of Disclosure Impact Upon Investment Analysis, Doctoral Dissertation, University of Missouri - Columbia, 1983.
Larson, James R. Jr., and Reenan, Andrew M. , "The Equivalence Interval as a Measure of Uncertainty", Organizational Behavior And Human Performance, Vol. 23, No. 1, 1979, pp. 49-55.
Lasman, Daniel A. and Weil, Roman L., "Adjusting the Debt-Equity Ratio", Financial Analysts Journal, September-

132
October, 1978, pp. 49-58.Libby, Robert, Accounting and Human Information Processing:
Theory and Applications, Prentice Hall, Inc., New Jersey 07632, 1981.
Liebtag, Bill, "FASB Income Tax Hearings Show DiverseOpinions Still Exist on 1960s APB Opinion", Journal of Accountancy, June 1984, pp. 46-54.
Livingstone, John Leslie, "Accelerated Depreciation, Cyclical Asset Expenditures, and Deferred Taxes", Journal of Accounting Research, Spring 1967a, pp. 79-94.
________ ., "A Behavioral Study of Tax Allocation in ElectricUtility Regulation", The Accounting Review,July 1967b, pp. 544-552.
_., "Accelerated Depreciation, Tax Allocation, andCyclical Asset Expenditures of Large Manufacturing Companies", Journal of Accounting Research,Autumn 1969, pp. 245-256.
Matteson, Michael T. , "Type of Transmittal Letter andQuestionnaire Color as Two Variables Influencing Response Rates in a Mail Survey", Journal of Applied Psychology, Vol. 59, No. 4, August 1974, pp. 535-536.
Mautz, Robert K., "Financial Reporting by Conglomerate Companies", Financial Executive, February 1968, pp. 52-65.
McC. Miller, Patrick, "Do Labels Mislead? A Multiple Cue Study, Within The Framework of Brunswik's Probabilistic Functionalism", Organizational Behavior and Human Performance, Vol. 6, July 1971, pp. 480-500.
McGee, Robert W., "The Growth of the Deferred Tax Account", Management Accounting, August 1984, p. 18.
McGoldrick, Beth, "The Controversy Over Deferred Taxes", Institutional Investor, September 18, 1984, pp. 247-253.
McIntyre, Edward V., "Current-cost Financial Statements and Common Stock Investment Decision", The Accounting Review, July 1973, pp. 575-585.
Milburn, J. Alex, "Comprehensive Tax Allocation: Lets StopTaking Some Misconceptions for Granted", CA Magazine,

133
April 1982, pp. 40-46.Miller, Delbert C., Hand Book of Research Design and Social
Measurement, Fourth Edition, Longman Inc., New York, 1983.
Miller, Stephanie, "Accounting for Income Taxes: an NAA Conference", Management Accounting, May 1984, pp. 68-69.
Mocnitz, Maurice, "Income Taxes in Financial Statements",The Accounting Review, April 1957, pp. 175-183.
Neter, John, Wasserman, William and Kutner, Michael H.,Applied Linear Statistical Models, Richard D. Irwin, Inc., Homewood, Illinois, 1985.
Nisbett, Richard E. and Wilson, Timothy DeCamp, "Telling More Than We Can Know: Verbal Reports on Mental Processes", Psychological Review, Vol. 84, No. 3, May 1977, pp. 231-259.
Norby, William C., "Accounting for Financial Analysis", Financial Analysts Journal, March/April 1982, pp. 22-23, 79-80.
Norgaard, Corine T., "Financial Implications of Comprehensive Income Tax Allocation", Financial Analysts Journal, January-February 1969, pp. 81-85.
Nurnberg, Hugo, "A Note on the Financial Reporting ofDepreciation and Income Taxes", Journal of Accounting Research, Autumn 1969, pp. 257-261.
Oliver, Bruce L., "The Semantic Differential: A Device for Measuring the Interprofessional Communication of Selected Accounting Concepts", Journal of Accounting Research, Autumn 1974, pp. 299-316.
Oppenheim, Abraham Naftali, Questionnaire Design and Attitude Measurement, Basic Books, New York, 1966.
Oxner, Thomas H. and Moore, P. Michael, "Tax Simplification and Reform: More Deferred Income Taxes?", The Ohio CPA Journal, Winter 1984, pp. 33-38.
Payne, John W., "Information Processing Theory: Some Concepts and Methods Applied to Decision Research", in Cognitive Processes in Choice and Decision Behavior, T.S. Wallsten, ed., Earlbaum, 1930, pp. 95-116.

134
Phillips, Mary Ellen, "Deferred Tax Accounting", The Woman CPA, January 1984, pp. 3-9.
Pointer, Larry Green, "Disclosing Corporate Tax policy", Journal of Accountancy, July 1973, pp. 50-61.
Randall, Robert F., "'Silent Majority' Supports the Tax Status Quo on Income Taxes", (Data Sheet), Management Accounting, June 1984, p. 12.
Rhode, John Grant, "Behavioral Science Methodologies With Application For Accounting Research: Reference and Source Material", Research Methodology in Accounting, Scholars Book Co., 1972.
Rockness, Howard 0., "Expectancy Theory in a BudgetarySetting: An Experimental Examination", The Accounting Review, October 1977, pp. 893-903.
Ronen, Joshua and Sadan, Simcha, Smoothing Income Numbers:Objectives, Means, and Implications, Addison - Wesley Publishing Company, 1981.
Rosenberg, Barr, "The Current State and Future of Investment Research", Financial Analysts Journal, January/ February 1982, pp. 43-50.
Rosenfield, Paul and Dent, William C., "No More Deferred Taxes", Journal of Accountancy, February 1983, pp. 44-55.
Savoie, Leonard M., "The Impact of the Federal Income Tax on Accounting Principles", Accounting Forum, Baruch College, New York, Vol. 51, No. 1, December 1981, pp. 44-51.
Schwartz, Bill N., "Income Tax Allocation, It is Time for aChange", Journal of Accounting, Auditing and Finance, Spring 1981, pp. 238-247.
________ ., "Deferred Taxes: Compliance and Understand-ability", Journal of Accounting, Auditing and Finance, Spring 1983, pp. 244-253.
Shield, Hans J., "Allocation of Income Taxes", Journal of Accountancy, April 1957, pp. 53-60.
Skekel, Ted D. and Fazzi, Charles, "The Deferred TaxLiability: Do Capital-Intensive Companies 'Pay it?",

135
The Journal of Accountancy, October 1974, pp. 142- 150.
Slovic, Paul, "Analyzing The Expert Judge: A DescriptiveStudy Of A Stockbroker's Decision Process", Journal of Applied Psychology, August 1969, pp. 255-263.
Slovic, Paul, Fischhoff, Baruch and Lichtenstein, Sarah, "Behavioral Decision Theory", Annual Review of Psychology, Vol. 28, 1977, pp. 1-39.
Slovic, Paul, Fleissner, Dan, and Bauman, W. Scott,"Analyzing the Use of Information in Investment Decision Making: A Methodological Proposal", Journal of Business, April 1972, pp. 283-301.
Smith, Jack L., "Income Taxes: They Should be Disclosed Not Allocated", Financial Executive, April 1984, pp. 28- 31.
Spacek, Leonard, "The Case for Income Tax Deferral", The New York Certified Public Accountant, April 1968, pp. 271-276.
Satistical Package for the Social Sciences, SPSS UPDATE 7-9, New Procedures and Facilities for Releases 7-9, Hull, C. Hadlai and Nie, Norman H. (eds.), McGraw-Hill Book Company, New York, 1981 (SPSS, 1981).
Steinberg, and Hunter, "Factorial Designs", Technometrics,May 1984, pp. 71-
Stenson, H. H., "The Lens Model With Unknown Cue Structure", Psychological Review, Vol. 81, 1974, pp. 257-264.
Swieringa, Robert J. and Weick, Karl E., "An Assessment of Laboratory Experiments in Accounting", Journal of Accounting Research, Vol. 29, Supplement 1983, pp. 56-101.
Tversky, A and Kahneman, D., "Judgment Under Uncertainty: Heuristics and Biases", Science, Vol. 185, 1974, pp. 1124-1131.
Veiga, John F., "Getting The Mail Questionnaire Returned:Some Practical Research Considerations", Journal of Applied Psychology, Vol. 59, No. 2, April 1974, pp. 217-218.

136
Volkan, Ara G. and Rue, Joseph C., "The Case Against Deferred Taxes", Management Accounting, March 1985, pp. 30-35.
Voss, William M., "Accelerated Depreciation and Deferred Tax Allocation", Journal of Accounting Research, Autumn 1968, pp. 263-269.
Wilkins, Trevors and Zimmer, Ian, "The Effect of Leasing and Different Methods of Accounting for Leases on Credit Evaluation", The Accounting Review, October 1983.
Wolk, Harry I., Francis, Jere R., and Tearney, Michael G., Accounting Theory, Kent Publishing Company,A Division of Wadsworth, Inc., 1984.
Wright, Peter, "The Harassed Decision Maker: Time Pressures, Distractions, and the Use of Evidence", Journal of Applied Psychology, Vol. 59, NO. 5, October 1974, pp. 555-561.
Wright, William F., "Properties of Judgment Models in aFinancial Setting", Organization Behavior and Human Performance, Vol. 23, 1979, pp. 73-85.
________ ., "Comparison of the Lens and Subjective ProbabilityParadigms for Financial Research Purposes", Accounting, Organizations and Society, Vol. 7, No. 1, 1982, pp. 66-75.
Wyatt, Arthur R., Dieter, Richard, and Stewart, John E., "Tax Allocation Revisited", The CPA Journal, March 1984,pp. 10-18.
Yu, S. C., The Structure of Accounting Theory, The University Presses of Florida, 1976.

APPENDIX A SAMPLE QUESTIONNAIRE FOR HIGH
COMPANY USING DMCA
137

138INSTRUCTIONS;The enclosed five year comparative Income Statements and Balance Sheets represent actual historical performance of a U.S. company audited by a "big eight" accounting firm. Associated (not real name) is among the nation's 250 largest industrial companies. A diversified, technology based company. Associated is engaged in four main business areas: Electronics; Aircraft Products; Major Appliances; and Energy Services.Your task is to analyze the financial information and using your personal investment decision model predict Associated company's:
(1) net income for one year in the future (19X6);(2) indicate the range (£) in which you are reasonably certain
that the adtual net income will in fact lie;(3) predict stock price for one year in the future (19X6); and,(4) indicate the range (1) in which you are reasonably certain
that the actual stock price will in fact lie.The year end S&P 500 for the past five years (19X1-19X5) was 95, 96, 108, 136, and 123, respectively. The projected S&P 500 at end of 19X6 is 140. It is important that you restrict your analysis exclusively to the information presented, and not discuss the study or your analysis with anyone until after you have finished.THE FOLLOWING IS ONLY AN EXAMPLE OF HOW TO INDICATE YOUR RESPONSEIf, after analyzing the data for Example Company, you think that the 19X6 (1) net income will be $400 million; (2) your assessment of the equivalence interval is $395 to $410 million; (3) the stock price will be $30.00; and (4) your assessment of the corresponding equivalence interval is $28.00 to $33.00, then you will make the following response.1. What is your best estimate (in millions) of Example Company's net
income for 19X6? $4002. What is the range in which you are reasonably certain that the
actual 19X6 net income will in fact lie:(i) The upper bound is $410(ii) The lower bound is $395
3. What is your best estimate of Example Company's stock price for 19X6? $30.00
*
4. What is the range in which you are reasonably certain that the actual 19X6 ‘stock price will in fact lie:
(i) The upper bound is $33.00(ii) The lower bound is $28.00
INSTRUCTIONS: YOUR RESPONSES SHOULD BE PLACED IN THE APPROPRIATE SPACE PROVIDED AFTER THE FINANCIAL STATEMENTS. THANK YOU VERY MUCH.
(Continued next page)

139
Balance sheetsAssociated Company and Subsidiaries Consolidated (Millions)December 31
19X5 19X4 19X3 19X2 19X1AssetsCurrent assets:
Cash $ 50 $ 16 S 23 3 6 8 9Marketable securities 573 511 639 824 697Accounts receivable 603 517 464 287 235Contracts in process 383 301 153 121 185Inventories 719 688 615 319 254Prepaid expenses 11 11 15 15 36Total current assets 2,339 2,044 1,909 1,572 1,416
Property, plant and equipment (net) 818 712 575 394 307Other assets 206 173 140 95 89Total Assets 83,363 $2 ,929 $2 ,624 82,061 81,812
Liabilities and Stockholder's Equity Current liabilities:
Notes payable and currentportion of long-term debt 8 65 3 61 8 60 8 38 8 16
Advance payments, less contracts in process 456 498 563 632 649
Accounts payable 334 251 228 173 136Accrued salaries and wages 126 119 100 75 64Federal and state income taxes,
principally deferred 508 442 348 233 176Other accrued expenses 263 177 153 98 67Total current liabilities 1,752 1,,548 1,452 1,249 1,108
Long-term debt 76 78 86 73 81Stockholder's equity:
Common stock and capital in excess of 81 par value 222 209 183 123 117
Retained earnings 1,313 1..094 903 616 506Total stockholder's equity 1,535 1,,303 1,086 739 623
Total Liab. & stockholder's equity S3,363 $2,,929 82.624 82,061 31,812
The accompanying notes are an integral part of these financial statements.
(Continued next page)

140
Statements of incomeAssociated Company and Subsidiaries ConsolidatedFor the years ended December 31, 19X1, 19X2, 19X3, 19X4, 19X5(Millions except per share amount)
19X5 19X4 19X3 19X2 19X1Net Sales S5.636 35,002 $4,354 $3,787 $2.818Cost of salesAdmin, and sel. expensesR and D expensesInterest expenseInterest and dividend incomeOther (income) expense
4,491531
, rt2 18 (99) (15)
3,977*47114319(78)(10)
3,51638111413(86)(2)
3,07833310114(68)(2)
2,3422515214(41)(1)
Total costs and expenses 5,098 4.522 3,936 3,456 2,617Income before taxes 538 480 418 331 201Federal and state taxes 214 198 178 144 89Net income S 324 S 282 S 240 S 187 S 112Earnings per common share S 3.86 S 3.40 S 2.91 $ 2.27 $ 1.84Cash dividends per common share S 1.25 S 1.05 S 0.85 S 0.65 S 0.50Stock price (last trading day) S37.38 S53.25 $33.00 $22.60 $16.94Ratios:Percentage change in net income Percentage change in net sales Net income/sales Net income/total assets Net income/stockholder's equity Working capital/total assets Current assets/current liabilities Total debt/stockholder's equity Stockholder's equity/total assets Stockholder's equity/common shares Price/earnings (P/E) ratio
15%13%
5.7%9.6%
21.1%0.171.331.190.46
$18.2510
18%15%
5.6%9.6%
21.6%0.171.321.250.44
$15.6416
28%15%
5.5%9.2%22.1%0.171.311.420.41
$13.3011
67%34%
4.9%9.1%25.3%0.161.261.790.36
$11.1210
4.0%6.2%
18.0%0.171.291.910.34
$10.0810
The accompanying notes are an integral part of the financial statements.
(Continued next page)

141
NOTES TO THE CONSOLIDATED FINANCIAL STATEMENTSAssociated Company and Subsidiaries Consolidated December 31, 19X1, 19X2, 19X3, 19X4 and 19X5
Summary of Significant Accounting PoliciesPrinciples of consolidation — The consolidated financial statements include the accounts of the parent company and all subsidiaries.Inventories — Inventories are valued at standard costs that approximate costs computed on a first-in, first-out basis, not in excess of market.Property, plant and equipment — is stated at cost. Additions, improvements and major renewals are capitalized. Depreciation is provided using accelerated methods, principally over the following useful lives: buildings and improvements, 15 to 40 years; hnd machinery and equipment, three to 10 years.
Accumulated depreciation and amortization at December 31 is:19X5 19X4 19X3 19X2 19X1
In millions S784 $689 $576 $441 $370
Income Taxes — The company and its subsidiaries provide for income taxes on pretax accounting income at rates in effect under existing tax law less investment tax credit, research and development and other tax credits recorded on a flow-through basis.
The provisions for income taxes consist of the following for theyears ended December 31:
Current tax expense Deferred tax expense TotalNet credit balance of
deferred taxes
19X5$156__58$214$443
19X4 19X3 19X2In millions
$118 $ 93 $ 77 80 85 67$198$385
$178$3-5
$144$215
19X1$ 34__55$ 89$151
Net earnings per share — is based upon the weighted average number of common shares outstanding during each year.Pension costs — The company and its subsidiaries have several pension and retirement plans covering the majority of employees. Annual charges to income are for costs of the plans including current service costs and interest on and amortization of unfunded prior service costs over periods from ten to thirty years.Research and Development expenses — Research and development expenditures for company-sponsored projects are expensed as incurred.
(Continued next page)

142
AFTER ANALYZING ASSOCIATED COMPANY'S FINANCIAL INFORMATION. INCLUDING SUMMARY NOTES. PLEASE INDICATE YOUR RESPONSE BELOW:
1. What is your best estimate (in millions) of Associated Company's net income for 19X6? 3______
2. What is the range in which you are reasonably certain that the actual 19X6 net income will in fact lie:
(i) The upper bound is 3______(ii) The lower bound is
3. What is your best estimate of Associated Company's stock price for 19X6? §______
4. What is the range in which you are reasonably certain that the actual 19X6 stock price will in fact lie:
(i) The upper bound is §______(ii) The lower bound is S
Answers to the following questions will help compare your responses .with other participants. Please complete the same before returning the questionnaire. Thank you.
1. Rate (not rank) each of the following information items independently as to how important they are to your above estimates on a scale of 0 to 10 (0: not important and 10: very importa^*-.) :
Item Rating Item RatingNet income ______ Net sales ______Earnings per share ______ Deferred taxes ______Cash dividends ______ S&P 500 index ______Current taxes ______ Total debt/equity ______Stock price___________ ______ Book equity per share ______P/E ratio____________________ Current ratio_________ ______
2. To what extent the presented information was adequate for your estimates (please circle one):
Not FullyAdequate 0 1 2 3 4 5 6 7 8 9 10 Adequate
(Continued next page)

143
3. What other in£ormation would have helped your estimates (please be specific) _____________________________________________________
4. Please circle your highest educational level:a. high School;b. some college;c. bachelors degree Major/concentration_______________d. Masters Degree/Ph.D. Major/concentration_______________
5. How many years experience do you have in evaluating financialstatements for investment purposes? ______ years.
6. Approximately how much time (in minutes) did it take you to complete the questionnaire? ______ minutes.
7. Please circle your professional certification(s):a. CFA b. CPAc. other (please specify)___________________
8. a. Are you interested in the cash awards? ____ yes; no.b. Do you want a complimentary copy of the findings? yes; no.
Please use the space below for writing your name and address ifyou answer yes to either 8a or 8b above.
End of Questionnaire. Please return the questionnaire in the enclosed envelope. Thank you very much for your help and cooperation.

APPENDIX B SAMPLE QUESTIONNAIRE FOR HIGH COMPANY
USING THE FT METHOD
144

145INSTRUCTIONS:The enclosed £ive year comparative Income Statements and Balance Sheets represent actual historical performance of a U.S. company audited by a "big eight" accounting firm. Associated (not real name) is among the nation's 250 largest industrial companies. A diversified, technology based company, Associated is engaged in four main business areas: Electronics; Aircraft Products; Major Appliances; and Energy Services.Your task is to analyze the financial information and using your personal investment decision model predict Associated company's:
(1) net income for one year in the future (19X6);(2) indicate the range (±) in which you are reasonably certain
that the actual net income will in fact lie;(3) predict stock price for one year in the future (19X6); and,(4) indicate the range (£) in which you are reasonably certain
that the actual stock price will in fact lie.The year end S&P 500 for the past five years (19X1-19X5) was 95, 96, 108, 136, and 123, respectively. The projected S&P 500 at end of 19X6 is 140. It is important that you restrict your analysis exclusively to the information presented, and not discuss the study or your analysis with anyone until after you have finished.THE FOLLOWING IS ONLY AN EXAMPLE OF HOW TO INDICATE YOUR RESPONSEIf, after analyzing the data for Example Company, you think that the 19X6 (1) net income will be $400 million; (2) your assessment of the equivalence interval is $395 to $410 million; (3) the stock price will be $30.00; and (4) your assessment of the corresponding equivalence interval is $28.00 to $33.00, then you will make the following response.1. What is your best estimate (in millions) of Example Company's net
income for 19X6? $4002. What is the range in which you are reasonably certain that the
actual 19X6 net income will in fact lie:(i) The upper bound is $410(ii) The lower bound is $395
3. What is your best estimate of Example Company's stock price for 19X6? $30.00
4. What is the range in which you are reasonably certain that the actual 19X6 stock price will in fact lie:
(i) The upper bound is $33.00(ii) The lower bound is $28.00
INSTRUCTIONS: YOUR RESPONSES SHOULD BE PLACED IN THE APPROPRIATE SPACE PROVIDED AFTER THE FINANCIAL STATEMENTS. THANK YOU VERY MUCH.
(Continued next page)

146
Balance sheetsAssociated Company and Subsidiaries Consolidated (Millions)December 31 AssetsCurrent assets:
CashMarketable securities Accounts receivable Contracts in process Inventories Prepaid expenses Total current assets
Property, plant and equipment (net) Other assetsTotal Assets
Liabilities and Stockholder's EquityCurrent liabilities:
Notes payable and current portion of long-term debt
Advance payments, less contracts in process
Accounts payable Accrued salaries and wages Federal and state income taxes Other accrued expenses Total current liabilities
Long-term debtStockholder's equity:
Common stock and capital in excess of $1 par value
Retained earnings Total stockholder's equity
Total Liab. & stockholder's equity
19X5 19X4 19X3 19X2 19X1
$ 50 $ 16 $ 23 $ 6 3 9573 511 639 824 697603 517 464 287 235383 301 153 121 185719 688 615 319 25411 11 15 15 36
2,339 2,044 1,909 1, 572 1,416818 712 575 394 307206 173 140 95 89
33,363 32,929 $2 ,624 32,061 31,812
$ 65 $ 61 $ 60 3 38 3 16456 498 563 632 649334 251 228 173 136126 119 100 75 ■ 6465 57 43 18 25
263 177 153 98 671,309 1,163 1,147 1,034 957
76 78 86 73 81
222 209 183 123 1171,756 1.479 1, 208 831 6571,978 1.688 1 ,391 954 774
33,363 S2.929 ?2 ,624 32,061 31,812
The accompanying notes are an integral part of these financial statements.
(Continued next page)

147
Statements of incomeAssociated Company and Subsidiaries ConsolidatedFor the years ended December 31, 19X1, 19X2, 19X3, 19X4, 19X5(Millions except per share amount)
19X5 19X4 19X3 19X2 19X1Net Sales S5.636 •35.002 54,354 33,787 S2.818Cost of sales 4,491 3,977 3,516 3,078 2, 342Admin, and sel. expenses 531 471 381 333 251R and D expenses 172 143 114 101 52Interest expense 18 19 13 14 14Interest and dividend income (99) (78) (86) (68) (41)Other (income) expense (15) (10) (2) (2) (1)Total costs and expenses 5.098 4,522 3,936 3,456 2 , 617Income before taxes 538 480 418 331 201Federal and state taxes 156 118 93 77 34Net income S 382 3 362 3 325 3 254 3 167Earnings per common share S 4.55 3 4.37 3 3.95 3 3.09 S 2.74Cash dividends per common share S 1.25 S 1.05 3 0.85 S 0.65 3 0.50Stock price (last trading day) S37.38 353.25 333.00 322.60 316.94Ratios:Percentage change in net income 6% 11% 28% 52%Percentage change in net sales 13% 15% 15% 34% -Net income/sales 6.8% 7.2% 7.5% 6.7% 5.9%Net income/total assets 11.4% 12.4% 12.4% 12.3% 9.2%Net income/stockholder’s equity 19.3% 21.5% 23.4% 26.6% 21.6%Working capital/total assets 0.31 0.30 0.29 0.26 0.25Current assets/current liabilities 1.79 1.76 1.66 1.52 1.48Total debt/stockholder's equity 0.70 0.74 0.89 1.16 1.34Stockholder's equity/total assets 0.59 0.58 0.53 0.46 0.43Stockholder's equity/common shares $23.52 320.26 317.04 314.36 312.52Price/earnings (P/E) ratio 8 12 8 7 6
The accompanying notes are an integral part of the financial statements.
(Continued next page)

NOTES TO THE CONSOLIDATED FINANCIAL STATEMENTS
148
Associated Company and Subsidiaries Consolidated December 31, 19X1, 19X2, 19X3, 19X4 and 19X5
Summary of Significant Accounting PoliciesPrinciples of consolidation — The consolidated financial statements include the accounts of the parent company and all subsidiaries.Inventories — Inventories are valued at standard costs that approximate costs computed on a first-in, first-out basis, not in excess of market.Property, plant and equipment — is stated at cost. Additions, improvements and major renewals are capitalized. Depreciation is provided using accelerated methods, principally over the following useful lives: buildings and improvements, 15 to 40 years; and machinery and equipment, three to 10 years.
Accumulated depreciation and amortization at December 31 is:19X5 19X4 19X3 19X2 19X1
In millions $784 $689 $576 $441 $370
Income Taxes — The company and its subsidiaries provide for income taxes on a flow-through basis on pretax accounting income at rates in effect under existing tax law l'ess investment tax credits, research and development and other tax credits also recorded on a flow-through basis.
The provisions for income taxes consist of the following for the years ended December 31:
19X5 19X4 19X3 19X2 19X1In millions
Current tax expense $156 $118 $ 93 $ 77 $ 34Net earnings per share — is based upon the weighted average number of common shares outstanding during each year.Pension costs — The company and its subsidiaries have several pensionand retirement plans covering the majority of employees. Annual charges to income are for costs of the plans including current service costs andinterest on and amortization of unfunded prior service costs overperiods from ten to thirty years.Research and Development expenses '— Research and development expenditures for company-sponsored projects are expensed as incurred.
(Continued next page)

149
AFTER ANALYZING ASSOCIATED COMPANY'S FINANCIAL INFORMATION, INCLUDING SUMMARY NOTES. PLEASE INDICATE YOUR RESPONSE BELOW:
1. What is your best estimate (in millions) oC Associated Company's net income for 19X6? g______
2. What is the range in which you are reasonably certain that the actual 19X6 net income will in fact lie:
(i) The upper bound is g______(ii) The lower bound is g_
3. What is your best estimate of Associated Company's stock price for 19X6? g______
4. What is the range in which you are reasonably certain that the actual 19X6 stock price will in fact lie:
(i) The upper bound is g_(ii) The lower bound is g_
Answers to the following questions will help compare your responses with other participants. Please complete the same before returning the questionnaire. Thank you.
1. Rate (not rank) each of the following information items independently as to how important they are to your above estimates on a scale of 0 to 10 (0: not important and 10: very important):
Item Rating Item RatingNet income ______ Net sales ______Earnings per share ______ Deferred taxes ______Cash dividends ______ S&P 500 index ______Current taxes ______ Total debt/equity ______Stock price ______ Book equity per share ______P/E ratio ______ 1 Current ratio ______
2. To what extent the presented information was adequate for your estimates (please circle one):
Not FullyAdequate 0 1 2 3 4 5 6 7 0 9 10 Adequate
(Continued next page)

150
3. What other information would have helped your estimates (please be specific) _____________________________________________________
4. Please circle your highest educational level:a. high School;b. some college;c. bachelors degree Major/concentration_______________d. Masters Degree/Ph.D. Major/concentration_______________
5. How many years experience do you have in evaluating financialstatements for investment purposes? ______ years.
6. Approximately how much time (in minutes) did it take you to complete the questionnaire? ______ minutes.
7. Please circle your professional certification(s):a. CFA b. CPAc. other (please specify)___________________
8. a. Are you interested in the cash awards? ____ yes; no.b. Do you want a complimentary copy of the findings? yes; no.
Please use the space below for writing your name and address ifyou answer yes to either 8a or 8b above.
End of Questionnaire. Please return the questionnaire in the enclosed envelope. Thank you very much for your help and cooperation.

APPENDIX C SAMPLE QUESTIONNAIRE FOR HIGH COMPANY
USING THE FTD METHOD
151

152INSTRUCTIONS;The enclosed five year comparative Income Statements and Balance Sheets represent actual historical performance of a U.S. company audited by a "big eight" accounting firm. Associated (not real name) is among the nation's 250 largest industrial companies. A diversified, technology based company, Associated is engaged in four main business areas: Electronics; Aircraft Products; Major Appliances; and Energy Services.Your task is to analyze the financial information and using your personal investment decision model predict Associated company's:
(1) net income for one year in the future (19X6);(2) indicate the range (±) in which you are reasonably certain
that the actual net income will in fact lie;(3) predict stock price for one year in the future (19X6); and,(4) indicate the range (±) in which you are reasonably certain
that the actual stock price will in fact lie.The year end S&P 500 for the past five years (19X1-19X5) was 95, 96, 108, 136, and 123, respectively. The projected S&P 500 at end of 19X6 is 140. It is important that you restrict your analysis exclusively to the information presented, and not discuss the study or your analysis with anyone until after you have finished.THE FOLLOWING IS ONLY AN EXAMPLE OF HOW TO INDICATE YOUR RESPONSEIf, after analyzing the data for Example Company, you think that the 19X6 (1) net income will be $400 million; (2) your assessment of the equivalence interval is $395 to $410 million; (3) the stock price will be $30.00; and (4) your assessment of the corresponding equivalence interval is $28.00 to $33.00, then you will make the following response.1. What is your best estimate (in millions) of Example Company's net
income for 19X6? $4002. What is the range in which you are reasonably certain that the
actual 19X6 net income will in fact lie:(i) The upper bound is S410(ii) The lower bound is $395
3. What is your best estimate of Example Company's stock price for 19X6? $30.00
4. What is the range in which you are reasonably certain that the actual 19X6 stock price will in fact lie:
(i) The upper bound is $33.00(ii) The lower bound is $28.00
INSTRUCTIONS: YOUR RESPONSES SHOULD BE PLACED IN THE APPROPRIATE SPACE PROVIDED AFTER THE FINANCIAL STATEMENTS. THANK YOU VERY MUCH.
(Continued next page)

153
Balance sheetsAssociated Company and Subsidiaries Consolidated (Millions)December 31
19X5 19X4 19X3 19X2 19X1AssetsCurrent assets:
Cash $ 50 S 16 $ 23 S 6 3 9Marketable securities 573 511 639 824 697Accounts receivable 603 517 464 287 235Contracts in process 383 301 153 121 185Inventories 719 688 615 319 254Prepaid expenses 11 11 15 15 36Total current assets 2,,339 2,044 1, 909 1, 572 1,416
Property, plant and equipment (net) 818 712 57' 394 307Other assets 206 173 140 95 89Total Assets £3,,363 32,929 $2, 624 32,061 31,812
Liabilities and Stockholder's EauitvCurrent liabilities:
Notes payable and current portion of long-term debt 3 65 3 61 3 60 3 38 3 16
Advance payments, less contracts in process 456 498 563 632 649
Accounts payable 334 251 228 173 136Accrued salaries and wages 126 119 100 75 64Federal and state income taxes 65 57 43 18 25Other accrued expenses 263 177 153 98 67Total current liabilities 1,309 1,163 1,147 1,034 957
Long-term debt 76 78 86 73 81Stockholder's equity:
Common stock and capital in excess of 31 par value 222 209 183 123 117
Retained earnings 1,756 1,479 1,208 831 657Total stockholder's equity 1.978 1.688 1,391 954 774
Total Liab. & stockholder's equity 33,363 32,929 32.624 32,061 31,812
The accompanying notes are an integral part of these financial statements.
(Continued next page)
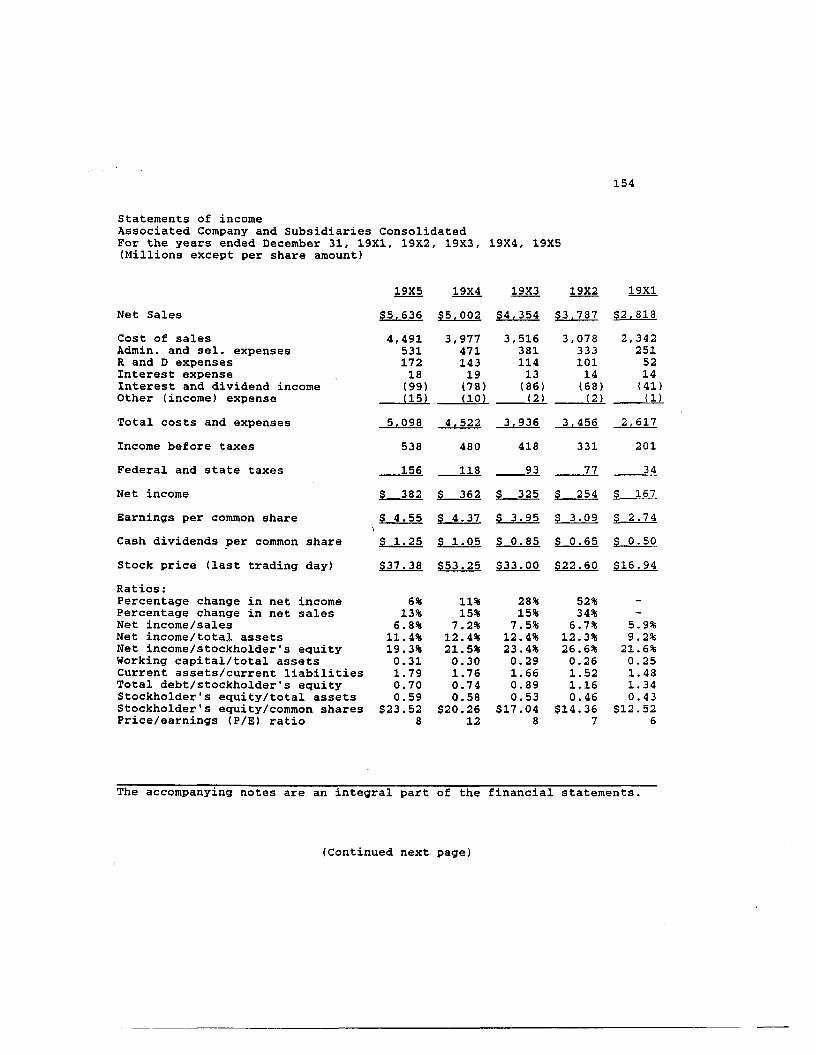
154
Statements of incomeAssociated Company and Subsidiaries ConsolidatedFor the years ended December 31, 19X1, 19X2, 19X3, 19X4, 19X5(Millions except per share amount)
19X5 19X4 19X3 19X2 19X1Net Sales S5.636 S5.002 $4,354 $3,787 $2,818Cost of salesAdmin, and sel. expensesR and D expensesInterest expenseInterest and dividend incomeOther (income) expense
4,49153117218(99)(15)
3,97747114319(78)(10)
3,51638111413(86)(2)
3,07833310114(68)(2)
2,3422515214(41)(1)
Total costs and expenses 5,098 4.522 3,936 3.456 2,617Income before taxes 538 480 418 331 201Federal and state taxes 156 118 93 77 34Net income S 382 S 362 S 325 S 254 S 167Earnings per common share S 4.55 S 4.37 $ 3.95 S 3.09 S 2.74Cash dividends per common share S 1.25 S 1.05 S 0.85 $ 0.65 S 0.50Stock price (last trading day) S37.38 $53.25 $33.00 $22.60 $16.94Ratios:Percentage change in net income Percentage change in net sales Net income/sales Net income/total assets Net income/stockholder's equity Working capital/total assets Current assets/current liabilities Total debt/stockholder's equity Stockholder's equity/total assets Stockholder's equity/common shares Price/earnings (P/E) ratio
6%13%
6.8%11.4%19.3%0.311.790.700.59
$23.528
11%15%
7.2%12.4%21.5%0.301.760.740.58
$20.2612
28%15%
7.5%12.4%23.4%0.291.660.890.53
$17.048
52%34%
6.7%12.3%26.6%0.261.521.160.46
$14.367
5.9%9.2%
21.6%0.251.481.340.43
$12.526
The accompanying notes are an integral part of the financial statements.
(Continued next page)

NOTES TO THE CONSOLIDATED FINANCIAL STATEMENTS155
Associated Company and Subsidiaries Consolidated December 31, 19X1, 19X2, 19X3, 19X4 and 19X5
Summary of Significant Accounting PoliciesPrinciples of consolidation — The consolidated financial statements include the accounts of the parent company and all subsidiaries.Inventories — Inventories are valued at standard costs that approximate costs computed on a first-in, first-out basis, not in excess of market.Property, plant and equipment — is stated at cost. Additions, improvements and major renewals are capitalized. Depreciation is provided using accelerated methods, principally over the following useful lives: buildings and improvements, 15 to 40 years; and machinery and equipment, three to 10 years.
Accumulated depreciation and amortization at December 31 is:19X5 19X4 19X3 19X2 19X1
In millions S784 $689 $576 $441 $370
Income Taxes — The company and its subsidiaries provide for income taxes on a flow-through basis on pretax accounting income at rates in effect under existing tax law less investment tax credits, research and development and other tax credits also recorded on a flow-through basis.
The provisions for income taxes had the company followed the Deferral method for allocation of all income taxes will consist of thefollowing for the vears ended December 31:
19X5 19X4 19X3 19X2 19X1In millions
Current tax expense $156 $118 $ 93 $ 77 $ 34Deferred tax expense 58 80 85 67 55Total $214 $198 $178 $144 S 89Net credit balance of
deferred taxes $443 $385 $305 $215 S151Net earnings per share — is based upon the weighted averagecommon shares outstanding during each, year.Pension costs — The company and its subsidiaries have several pension and retirement plans covering the majority of employees. Annual charges to income are for costs of the plans including current service costs and interest on and amortization of unfunded prior service costs over periods from ten to thirty years.Research and Development expenses — Research and development expenditures for company-sponsored projects are expensed as incurred.
(Continued next page)

156
AFTER ANALYZING ASSOCIATED COMPANY'S FINANCIAL INFORMATION. INCLUDING SUMMARY NOTES. PLEASE INDICATE YOUR RESPONSE BELOW:
1. What is your best estimate (in millions) of Associated Company's net income for 19X6? §______
2. What is the range in which you are reasonably certain that the actual 19X6 net income will in fact lie:
(i) The upper bound is 5______(ii) The lower bound is §______
3. What is your best estimate of Associated Company's stock price for 19X6? |______
4. What is the range in which you are reasonably certain that the actual 19X6 stock price will in fact lie:
(i) The upper bound is £______(ii) The lower bound is S______
Answers to the following questions will help compare your responses with other participants. Please complete the same before returning the questionnaire. Thank you.
1. Rate (not rank) each of the following information items independently as to how important they are to your above estimates on a scale of 0 to 10 (0: not important and 10: very important):
Item Rating Item RatingNet income ______ Net salesEarnings per share ______ Deferred taxesCash dividends ______ S&P 500 indexCurrent taxes ______ Total debt/equityStock price___________ ______ Book equity per shareP/E ratio ______ Current ratio
2. To what extent the presented information was adequate for your estimates (please circle one):
Not FullyAdequate 0 1 2 3 4 5 6 7 8 9 10 Adequate
(Continued next page)

157
3. What other information would have helped your estimates (please be specific) _____________________________________________________
4. Please circle your highest educational level:a. high School;b. some college;c. bachelors degree Major/concentration_______________d. Masters Degree/Ph.D. Major/concentration_______________
5. How many years experience do you have in evaluating financialstatements for investment purposes? ______ years.
6. Approximately how much time (in minutes) did it take you to complete the questionnaire? ______ minutes.
7. Please circle your professional certification(s):a. CFA b. CPAc. other (please specify)__________________
8. a. Are you interested in the cash awards? ____ yes; no.b. Do you want a complimentary copy of the findings? yes; no.
Please use the space below for writing your name and address ifyou answer yes to either 8a or 8b above.
End of Questionnaire. Please return the questionnaire in the enclosed envelope. Thank you very much for your help and cooperation.

APPENDIX D SAMPLE QUESTIONNAIRE FOR LOW
COMPANY USING DMCA
158

159INSTRUCTIONS;The enclosed five year comparative Income Statements and Balance Sheets represent actual historical performance of a U.S. company audited by a "big eight" accounting firm. Associated (not real name) is among the nation's 250 largest industrial companies. A diversified, technology based company, Associated is engaged in four main business areas: Electronics; Aircraft Products; Major Appliances; and Energy Services.Your task is to analyze the financial information and using your personal investment decision model predict Associated company's:
(1) net income for one year in the future (19X6);(2) indicate the range (±) in which you are reasonably certain
that the actual net income will in fact lie;(3) predict stock price for one year in the future (19X6); and,(4) indicate the range (±) in which you are reasonably certain
that the actual stock price will in fact lie.The year end S&P 500 for the past five years (19X1-19X5) was 95, 96, 108, 136, and 123, respectively. The projected S&P 500 at end of 19X6 is 140. It is important that you restrict your analysis exclusively to the information presented, and not discuss the study or your analysis with anyone until after you have finished.THE FOLLOWING IS ONLY AN EXAMPLE OF HOW TO INDICATE YOUR RESPONSEIf, after analyzing the data for Example Company, you think that the 19X6 (1) net income will be $400 million; (2) your assessment of the equivalence interval is $395 to $410 million; (3) the stock price will be $30.00; and (4) your assessment of the corresponding equivalence interval is $28.00 to $33.00, then you will make the following response.1. What is your best estimate (in millions) of Example Company's net
income for 19X6? $4002. What is the range in which you are reasonably certain that the
actual 19X6 net income will in fact lie:(i) The upper bound is $410(ii) The lower bound is $395
3. What is your best estimate of Example Company's stock price for 19X6? $30.00
4. What is the range in which you are reasonably certain that the actual 19X6 stock price will in fact lie:
(i) The upper bound is $33.00(ii) The lower bound is $28.00
INSTRUCTIONS: YOUR RESPONSES SHOULD BE PLACED IN THE APPROPRIATE SPACE PROVIDED AFTER THE FINANCIAL STATEMENTS. THANK YOU VERY MUCH.
(Continued next page)

160
Balance sheetsAssociated Company and Subsidiaries Consolidated (Millions)December 31AssetsCurrent assets:
19X5 19X4 19X3 19X2 19X1
Cash $ 50 $ 16 $ 23 $ 6 $ 9Marketable securities 573 511 639 824 697Accounts receivable 603 517 464 287 235Contracts in process 383 301 153 121 185Inventories 719 688 615 319 254Prepaid expenses 11 11 15 15 36Total current assets 2,339 2,044 1,909 1, 572 1,416
Property, plant and equipment (net) 818 712 575 394 307Other assets 206 173 140 95 89Total Assets $3,363 $2,929 $2,624 $2,061 $1,812
Liabilities and Stockholder's EquityCurrent liabilities:
Notes payable and current portion of long-term debt $ 65 $ 61 $ 60 $ 38 $ 16
Advance payments, less contracts in process 456 498 563 632 649
Accounts payable 334 251 228 173 136Accrued salaries and wages 126 119 100 75 64Federal and state income taxes,
principally deferred 157 110 86 44 47Other accrued expenses 263 177 153 98 67Total current liabilities 1,401 1,216 1,190 1,060 979jng-term debt 76 78 86 73 81:ockholder's equity:Common stock and capital
in excess of $1 par value 222 209 183 123 117Retained earnings 1.664 1, 426 1,165 805 635Total stockholder's equity 1. 886 1,635 1,348 928 752
Total Liab. & stqckholder's equity S3.363 S2.929 $2.624 $2.061 $1.812
The accompanying notes are an integral part of these financial statements.
(Continued next page)

161
Statements of incomeAssociated Company and Subsidiaries ConsolidatedFor the years ended December 31, 19X1, 19X2, 19X3, 19X4, 19X5(Millions except per share amount)
19X5 19X4 19X3 19X2 19X1Net Sales S5.636 S5,002 $4,354 $3,787 $2,818Cost of salesAdmin, and sel. expensesR and D expensesInterest expenseInterest and dividend incomeOther (income) expense
4,49153117218(99)(15)
3,97747114319(78)(10)
3,51638111413(86)(2)
3,07833310114(68)(2)
2,3422515214(41)(1)
Total costs and expenses 5,098 4.522 3,936 3,456 2,617Income before taxes 538 480 418 331 201Federal and state taxes 214 198 178 144 89Net income S 324 S 282 S 240 $ 187 $ 112Earnings per common share S 3.86 S 3.40 S 2.91 $ 2.27 S 1.84Cash dividends per common share S 1.25 S 1.05 S 0.85 S 0.65 $0.50Stock price (last trading day) S37.38 S53.25 $33.00 $22.60 $16.94Ratios:Percentage change in net income Percentage change in net sales Net income/sales Net income/total assets Net income/stockholder's equity Working capital/total assets Current assets/current liabilities Total debt/stockholder's equity Stockholder's equity/total assets Stockholder's equity/common shares Price/earnings (P/E) ratio
15%13%
5.7%9.6%
17.2%0.281.670.780.56
$22.4210
18%15%
5.6%9.6%
17.3%0.281.680.790.56
$19.6216
28%15%
5.5%9.2%
17.8%0.271.600.950.51
$16.5111
67%34%
4.9%9.1%
20.2%0.251.481.220.45
$13.9610
4.0%6.2%
14.9%0.241.451.410.42
$10.2710
The accompanying notes are an integral part of the financial statements.
(Continued next page)

162
NOTES TO THE CONSOLIDATED FINANCIAL STATEMENTSAssociated Company and Subsidiaries Consolidated December 31, 19X1, 19X2, 19X3, 19X4 and 19X5
Summary of Significant Accounting PoliciesPrinciples of consolidation — The consolidated financial statements include the accounts of the parent company and all subsidiaries.Inventories — Inventories are valued at standard costs that approximate costs computed on a first-in, first-out basis, not in excess of market.Property, plant and equipment — is stated at cost. Additions, improvements and major renewals are capitalized. Depreciation is provided using accelerated methods, principally over the following useful lives: buildings and improvements, 15 to 40 years; and machinery and equipment, three to 10 years.
Accumulated depreciation and amortization at December 31 is:19X5 19X4 19X3 19X2 19X1
In millions S784 S689 S576 $441 $370
Income Taxes — The company and its subsidiaries provide for income taxes on pretax accounting income at rates in effect under existing tax law less investment tax credit, research and development and other tax credits recorded on a flow-through basis.
The provisions for income taxes consist of the following for theyears ended December 31:
19X5 19X4 19X3 19X2 19X1In millions
Current tax expense $175 $188 $161 $140 $ 85Deferred tax expense 39 10 17 4 4Total $214 $198 $178 $144 $ 89Net credit balance of
deferred taxes S 92 $ 53 S- 43 $ 26 $ 22Net earnings per share — is based upon the weighted averagecommon shares outstanding during each year.Pension costs — The company and its subsidiaries have several pensionand retirement plans covering the majority of employees. Annual charges to income are for costs of the plans including current service costs andinterest on and amortization of unfunded prior service costs overperiods from ten to thirty years.Research and Development expenses — Research and development expenditures for company-sponsored projects are expensed as incurred.
(Continued next page)

163
AFTER ANALYZING ASSOCIATED COMPANY'S FINANCIAL INFORMATION. INCLUDING SUMMARY NOTES. PLEASE INDICATE YOUR RESPONSE BELOW;
1. What is your best estimate (in millions) of Associated Company's net income for 19X6? 3______
2. What is the range in which you are reasonably certain that the actual 19X6 net income will in fact lie:
(i) The upper bound is 3.(ii) The lower bound is §_
3. What is your best estimate of Associated Company's stock price for 19X6? 3______
4. What is the range in which you are reasonably certain that the actual 19X6 stock price will in fact lie:
(i) The upper bound is 3______(ii) The lower bound is 3_
Answers to the following questions will help compare your responses with other participants. Please complete the same before returning the questionnaire. Thank you.. Rate (not rank) each of the following information items independently as to how important they are to your above estimates on a scale of 0 to 10 (0: not important and 10: very important):
Item Rating Item RatingNet income ______ Net sales ______Earnings per share ______ Deferred taxes ______Cash dividends ______ S&P 500 index ______Current taxes ______ Total debt/equity ______Stock price___________ ______ Book equity per share ______P/E ratio____________________ Current ratio_________ ______
2. To what extent the presented information was adequate for your estimates (please circle one):
Not FullyAdequate 0 1 2 3 4 5 6 7 8 9 10 Adequate
(Continued next page)

164
3. What other information would have helped your estimates (please be specific) _____________________________________________________
4. Please circle your highest educational level:a. high School;b. some college;c. bachelors degree. Major/concentration_______________d. Masters Degree/Ph.D. Major/concentration_______________
5. How many years experience do you have in evaluating financialstatements for investment purposes? ______ years.
6. Approximately how much time (in minutes) did it take you to complete the questionnaire? ______ minutes.
7. Please circle your professional certification(s):a. CFA b. CPAc. other (please specify)__________________
8. a. Are you interested in the cash awards? ____ yes; no.b. Do you want a complimentary copy of the findings? yes; no.
Please use the space below for writing your name and address ifyou answer yes to either 8a or 8b above.
End of Questionnaire. Please return the questionnaire in the enclosed envelope. Thank you very much for your help and cooperation.

A PPE N D IX E
SAMPLE Q U ESTIO N N A IR E FOR LOW COMPANY
U SIN G THE FT METHOD
165

166INSTRUCTIONS:The enclosed five year comparative Income Statements and Balance Sheets represent actual historical performance of a U.S. company audited by a "big eight” accounting firm. Associated (not real name) is among the nation's 250 largest industrial companies. A diversified, technology based company. Associated is engaged in four main business areas: Electronics; Aircraft Products; Major Appliances; and Energy Services.Your task is to analyze the financial information and using your personal investment decision model predict Associated company's:
(1) net income for one year in the future (19X6);(2) indicate the range (±) in which you are reasonably certain
that the actual net income will in fact lie;(3) predict stock price for one year in the future (19X6); and,(4) indicate the range (±) in which you are reasonably certain
that the actual stock price will in fact lie.The year end S&P 500 for the past five years (19X1-19X5) was 95, 96, 108, 136, and 123, respectively. The projected S&P 500 at end of 19X6 is 140. It is important that you restrict your analysis exclusively to the information presented, and not discuss the study or your analysis with anyone until after you have finished.THE FOLLOWING IS ONLY AN EXAMPLE OF HOW TO INDICATE YOUR RESPONSEIf, after analyzing the data for Example Company, you think that the 19X6 (1) net income will be $400 million; (2) your assessment of the equivalence interval is $395 to $410 million; (3) the stock price will be $30.00; and (4) your assessment of the corresponding equivalence interval is $28.00 to $33.00, then you will make the following response.1. What is your best estimate (in millions) of Example Company's net
income for 19X6? $4002. What is the range in which you are reasonably certain that the
actual 19X6 net income will in fact lie:(i) The upper bound is $410(ii) The lower bound is $395
3. What is your best estimate of Example Company's stock price for 19X6? $30.00
4. What is the range in which you are reasonably certain that the actual 19X6 stock price will in fact lie:
(i) The upper bound is $33.00(ii) The lower bound is $28.00
INSTRUCTIONS: YOUR RESPONSES SHOULD BE PLACED IN THE APPROPRIATE SPACE PROVIDED AFTER THE FINANCIAL STATEMENTS. THANK YOU VERY MUCH.
(Continued next page)

167
Balance sheetsAssociated Company and Subsidiaries (Millions)December 31AssetsCurrent assets:
CashMarketable securities Accounts receivable Contracts in process Inventories Prepaid expenses Total current assets
Property, plant and equipment (net) Other assetsTotal Assets
Consolidated
19X5 19X4 19X3 19X2 19X1
$ 50 $ 16 $ 23 S 6 $ 9573 511 639 824 697603 517 464 287 235383 301 153 121 185719 688 615 319 25411 11 15 15 36
2,339 2,044 1,909 1, 572 1,416818 712 575 394 307206 173 140 95 89
53,363 $2,929 $2,624 S2.061 SI,812
Liabilities and Stockholder's EquityCurrent liabilities:
Notes payable and currentportion of long-term debt
Advance payments, less contracts in process
Accounts payable Accrued salaries and. wages Federal and state income taxes Other accrued expenses Total current liabilities
Long-term debtStockholder's equity:
Common stock and capital in excess of $1 par value
Retained earnings Total stockholder's equity
Total Liab. & stockholder's equity
$ 65 $ 61 $ 60 $ 38 $ 16456 498 563 632 649334 251 228 173 136126 119 100 75 6465 57 43 18 25
263 177 153 98 671,309 1,163 1,147 1,034 957
76 78 86 73 81
222 209 183 123 1171,756 1, 479 1.208 831 6571,97.8 1.688 1,391 954 774
S3', 363 $2,929 $2,624 S2.061 SI.812
The accompanying notes are an integral part of these financial statements.
(Continued next page)

168
Statements of incomeAssociated Company and Subsidiaries ConsolidatedFor the years ended December 31, 19X1, 19X2, (Millions except per share amount)
, 19X3, 19X4, 19X5
19X5 19X4 19X3 19X2 19X1Net Sales S5.636 55,002 54,354 33,787 S2,818Cost of salesAdmin, and sel. expensesR and D expensesInterest expenseInterest and dividend incomeOther (income) expense
4,49153117218(99)(15)
3,97747114319(78)(10)
3,51638111413(86)(2)
3,07833310114(68)(2)
2,3422515214(41)(1)
Total costs and expenses 5,098 4,522 3,936 3,456 2,617Income before taxes 538 480 418 331 201Federal and state taxes 175 188 161 140 85Net income S 363 S 292 S 257 S 191 S 116Earnings per common share S 4.32 S 3.53 S 3.12 S 2.32 S 1.90Cash dividends per common share S 1.25 S 1.05 S 0.85 S 0.65 S 0.50Stock price (last trading day) S37.38 S53.25 S33.00 S22.60 S16.94Ratios:Percentage change in net income 6% 11% 28% 52% -
Percentage change in net sales 13% 15% 15% 34% -Net income/sales 6.4% 5.8% 5.9% 5.0% 4.1%Net income/total assets 10.8% 10.0% 9.8% 9.3% 6.4%Net income/stockholder's equity 18.4% 17.3% 18.5% 20.0% 15.0%Working capital/total assets 0.31 0.30 0.29 0.26 0.25Current assets/current liabilities 1.79 1.76 1.66 1.52 1.48Total debt/stockholder's equity 0.70 0.74 0.89 1.16 1.34Stockholder's equity/total assets 0.59 0.58 0.53 0.46 0.43Stockholder's equity/common shares $23.51 $20.26 $17.04 $14.34 $10.59Price/earnings (P/E) ratio 9 15 11 10 9
The accompanying notes are an integral part of the financial statements.
(Continued next page)

169
NOTES TO THE CONSOLIDATED FINANCIAL STATEMENTSAssociated Company and Subsidiaries Consolidated December 31, 19X1, 19X2, 19X3, 19X4 and 19X5
Summary of Significant Accounting PoliciesPrinciples of consolidation — The consolidated financial statements include the accounts of the parent company and all subsidiaries.Inventories — Inventories are valued at standard costs that approximate costs computed on a first-in, first-out basis, not in excess of market.Property, plant and equipment — is stated at cost. Additions, improvements and major renewals are capitalized. Depreciation is provided using accelerated methods, principally over the following useful lives: buildings and improvements, 15 to 40 years; and machinery and equipment, three to 10 years.
Accumulated depreciation and amortization at December 31 is:19X5 19X4 19X3 19X2 19X1
In millions $784 $689 $576 $441 $370
Income Taxes — The company and its subsidiaries provide for income taxes on a flow-through basis on pretax accounting income at rates in effect under existing tax law less investment tax credits, research and development and other tax credits recorded on a flow-through basis.
The provisions for income taxes consist of the following for the years ended December 31:
19X5 19X4 19X3 19X2 19X1In millions
Current tax expense $175 $188 $161 $140 $ 85Net earnings per share — is based upon the weighted average number of common shares outstanding during each year.Pension costs — The company and its subsidiaries have several pension and retirement plans covering the majority of employees. Annual charges to income are for costs of the plans including current service costs and interest on and amortization of unfunded prior service costs over periods from ten to thirty years.Research and Development expenses — Research and development expenditures for company-sponsored projects are expensed as incurred.
(Continued next page)

170
AFTER ANALYZING ASSOCIATED COMPANY'S FINANCIAL INFORMATION. INCLUDING SUMMARY NOTES, PLEASE INDICATE YOUR RESPONSE BELOW:
1. What is your best estimate (in millions) of Associated Company's net income for 19X6? g______
2. What is the range in which you are reasonably certain that the actual 19X6 net income will in fact lie:
(i) The upper bound is g______(ii) The lower bound is S
3. What is your best estimate of Associated Company's stock price for 19X6? g______
4. What is the range in which you are reasonably certain that the actual 19X6 stock price will in fact lie:
(i) The upper bound is g______(ii) The lower bound is g______
Answers to the following questions will help compare your responses with other participants. Please complete the same before returning the questionnaire. Thank you.
1. Rate (not rank) each of the following information items independently as to how important they are to your above estimates on a scale of 0 to 10 (0: not important and 10: very important):
Item Rating Item RatingNet income ______ Net salesEarnings per share ______ Deferred taxesCash dividends ______ S&P 500 indexCurrent taxes ______ Total debt/equityStock price__________________ Book equity per shareP/E ratio______________ ______ Current ratio
2. To what extent the presented information was adequate for your estimates (please circle one):
Not FullyAdequate 0 1 2 3 4 5 6 7 8 9 10 Adequate
(Continued next page)

171
3. What other information would have helped your estimates (please be specific) _____________________________________________________
4. Please circle your highest educational level:a. high School;b. some college;c. bachelors degree Major/co'ncentration_______________d. Masters Degree/Ph.D. Major/concentration_______________
5. How many years experience do you have in evaluating f i n a n c i a l
statements for investment purposes? ______ years.6. Approximately how much time (in minutes) did it take you to
complete the questionnaire? ______ minutes.7. Please circle your professional certification(s):
a. CFA b. CPAc. other (please specify)___________________
8. a. Are you interested in the cash awards? ____ yes; no.b. Do you want a complimentary copy of the findings? yes; no.
Please use the space below for writing your name and address ifyou answer yes to either 8a or 8b above.
End of Questionnaire. Please return the questionnaire in the enclosed envelope. Thank you very much for your help and cooperation.

A PPE N D IX F
SAMPLE Q U ESTIO N N A IR E FOR LOW COMPANY
U SIN G THE FTD METHOD
172

173INSTRUCTIONS;The enclosed five year comparative Income Statements and Balance Sheets represent actual historical performance of a U.S. company audited by a "big eight" accounting firm. Associated (not real name) is among the nation's 250 largest industrial companies. A diversified, technology based company, Associated is engaged in four main business areas: Electronics; Aircraft Products; Major Appliances; and Energy Services.Your task is to analyze the financial information and using your personal investment decision model predict Associated company's:
(1) net income for one year in the future (19X6);(2) indicate the range (±) in which you are reasonably certain
that the actual net income will in fact lie;(3) predict stock price for one year in the future (19X6); and,(4) indicate the range (■£) in which you are reasonably certain
that the actual stock price will in fact lie.The year end S&P 500 for the past five years (19X1-19X5) was 95, 96, 108, 136, and 123, respectively. The projected S&P 500 at end of 19X6 is 140. It is important that you restrict your analysis exclusively to the information presented, and not discuss the study or your analysis with anyone until after you have finished.THE FOLLOWING IS ONLY AN EXAMPLE OF HOW TO INDICATE YOUR RESPONSEIf, after analyzing the data for Example Company, you think that the 19X6 (1) net income will be $400 million; (2) your assessment of the equivalence interval is $395 to $410 million; (3) the stock price will be $30.00; and (4) your assessment of the corresponding equivalence interval is $28.00 to $33.00, then you will make the following response.1. What is your best estimate (in millions) of Example Company's net
income for 19X6? S4002. What is the range in which you are reasonably certain that the
actual 19X6 net income will in fact lie:(i) The upper bound is $410(ii) The lower bound is $395
3. What is your best estimate of Example Company's stock price for 19X6? $30.00
(4. What is the range in which you are reasonably certain that the actual 19X6 stock price will in fact lie:
(i) The upper bound is $33.00(ii) The lower bound is $28.00
INSTRUCTIONS: YOUR RESPONSES SHOULD BE PLACED IN THE APPROPRIATE SPACE PROVIDED AFTER THE FINANCIAL STATEMENTS. THANK YOU VERY MUCH.
(Continued next page)

174
Balance sheetsAssociated Company and Subsidiaries Consolidated (Millions)December 31
19X5 19X4 19X3 19X2 19X1AssetsCurrent assets:
Cash $ 50 $ 16 $ 23 $ 5 $ 9Marketable securities 573 511 639 824 697Accounts receivable 603 517 464 287 235Contracts in process 383 301 153 121 185Inventories 719 688 615 319 254Prepaid expenses 11 11 15 15 36Total current assets 2,339 2, 044 1,909 1, 57 2 1, 416
Property, plant and equipment (net) 818 712 575 394 307Other assets 206 173 140 95 89Total Assets $3,363 $2, 929 $2,624 $2,061 $1,812
Liabilities and Stockholder's EquityCurrent liabilities:
Notes payable and currentportion of long-term debt $ 65 $ 61 $ 60 $ 38 $ 16
Advance payments, lesscontracts in process 456 498 563 632 649
Accounts payable 334 251 223 173 136Accrued salaries and wages 126 119 100 75 64Federal and state income taxes 65 57 43 18 25Other accrued expenses 263 177 153 98 67Total current liabilities 1,309 1, 163 1,147 1,034 957
Long-term debt 76 78 86 73 81Stockholder's equity:
Common stock and capitalin excess of $1 par value 222 209 183 123 117
Retained earnings 1,756 1, 479 1,208 831 657Total stockholder's equity 1,978 1, 688 1, 391 954 774
Total Liab. & stockholder's equity 53,363 $2, 929 $2,624 $2,061 $1,812
The accompanying notes are an integral part of these financial statements.
(Continued next page)

175
Statements of incomeAssociated Company and Subsidiaries ConsolidatedFor the years ended December 31, 19X1, 19X2, 19X3, 19X4, 19X5(Millions except per share amount)
19X5 19X4 19X3 19X2 19X1Net Sales S5.636 55,002 $4,354 $3 ,787 S2,818Cost of salesAdmin, and sel. expensesR and D expensesInterest expenseInterest and dividend incomeOther (income) expense
4,49153117218(99)(15)
3,97747114319(78)(10)
3,51638111413(86)(2)
3,07833310114(68)(2)
2,3422515214(41)(1)
Total costs and expenses 5,098 4,522 3,936 3 , 456 2,617Income before taxes 538 480 418 331 201Federal and state taxes 175 188 161 140 85Net income S 363 S 292 S 257 $ 191 S 116Earnings per common share S 4.32 S 3.53 S 3.12 $ 2.32 S 1.90Cash dividends per common share S 1.25 S 1.05 $ 0.85 $ 0.65 S 0.50Stock price (last trading day) S37.38 S53.25 S33.00 S22.60 S16.94Ratios:Percentage change in net income Percentage change in net sales Net income/sales Net income/total assets Net income/stockholder's equity Working capital/total assets Current assets/current liabilities Total debt/stockholder's equity Stockholder's equity/total assets Stockholder's equity/common shares Price/earnings (P/E) ratio
6% 11% 28% 52% -
13% 15% 15% 34% -6.4% 5.8% 5.9% 5.0% 4.1%
10.8% 10.0% 9.8% 9.3% 6.4%18.4% 17.3% 18.5% 20.0% 15.0%0.31 0.30 0.29 0.26 0.251.79 1.76 1.66 1.52 1.480.70 0.74 0.89 1.16 1.340.59 0.58 0.53 0.46 0.43
$23.51 $20.26 $17.04 $14.34 $10.599 15 11 10 9
The accompanying notes are an integral part of the financial statements.
(Continued next page)
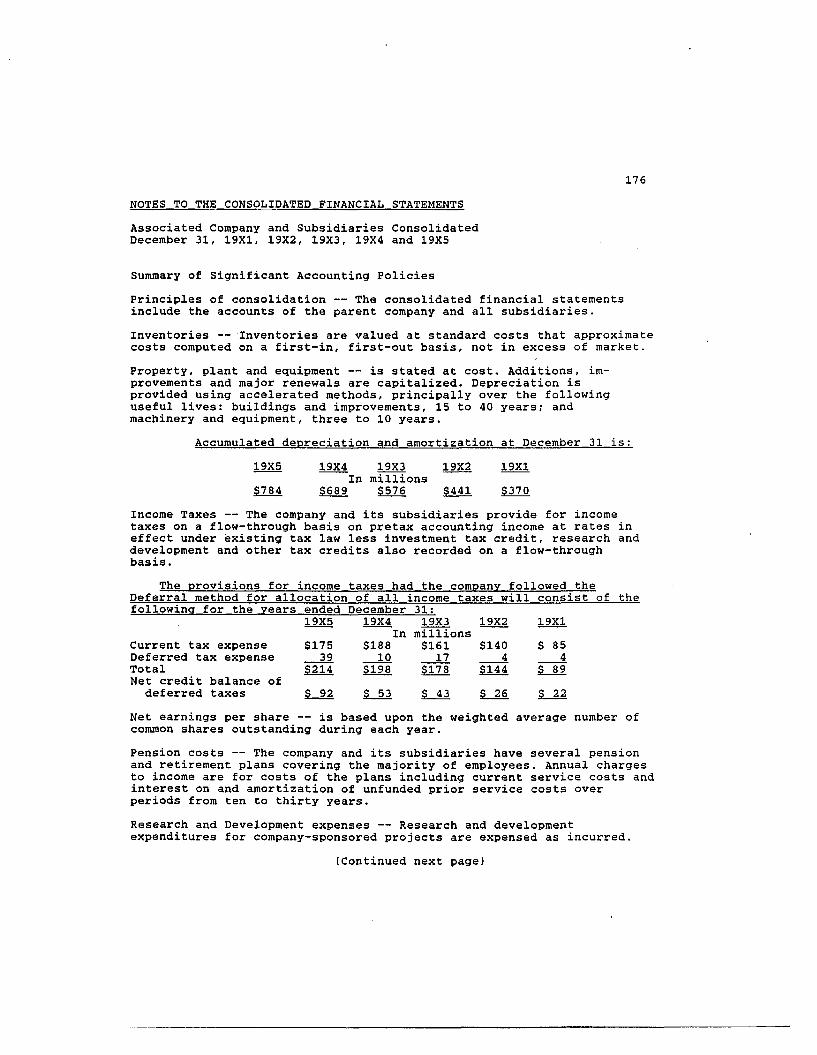
176NOTES TO THE CONSOLIDATED FINANCIAL STATEMENTSAssociated Company and Subsidiaries Consolidated December 31, 19X1, 19X2, 19X3, 19X4 and 19X5
Summary of Significant Accounting PoliciesPrinciples of consolidation — The consolidated financial statements include the accounts of the parent company and all subsidiaries.Inventories — Inventories are valued at standard costs that approximate costs computed on a first-in, first-out basis, not in excess of market.Property, plant and equipment — is stated at cost. Additions, improvements and major renewals are capitalized. Depreciation is provided using accelerated methods, principally over the following useful lives: buildings and improvements, 15 to 40 years; and machinery and equipment, three to 10 years.
Accumulated depreciation and amortization at December 31 is:19X5 19X4 19X3 19X2 19X1
In millions $784 $689 $576 $441 $370
Income Taxes — The company and its subsidiaries provide for income taxes on a flow-through basis on pretax accounting income at rates in effect under existing tax law less investment tax credit, research and development and other tax credits also recorded on a flow-through basis.
The provisions for income taxes had the company followed the Deferral method for allocation of all income taxes will consist of thefollowina for the years ended December 31:
19X5 19X4 19X3 19X2 19X1In millions
Current tax expense $175 $188 $161 $140 $ 85Deferred tax expense 39 10 17 4 4Total $214 $198 $178 $144 $ 89Net credit balance of
deferred taxes $ 92 £_53 $ 43 $ 26 $-22Net earnings per share — is based upon, the weighted averagecommon shares outstanding during each year.Pension costs — The company and its subsidiaries have several pension and retirement plans covering the majority of employees. Annual charges to income are for costs of the plans including current service costs and interest on and amortization of unfunded prior service costs over periods from ten to thirty years.Research and Development expenses — Research and development expenditures for company-sponsored projects are expensed as incurred.
(Continued next page)

177
AFTER ANALYZING ASSOCIATED COMPANY'S FINANCIAL INFORMATION. INCLUDING SUMMARY NOTES. PLEASE INDICATE YOUR RESPONSE BELOW:
1. Hhat is your best estimate (in millions) of Associated Company's net income for 19X6? §______
2. Hhat is the range in which you are reasonably certain that the actual 19X6 net income will in fact lie:
(i) The upper bound is(ii) The lower bound is §_
3. What is your best estimate of Associated Company's stock price for 19X6? §______
4. Hhat is the range in which you are reasonably certain that the actual 19X6 stock price will in fact lie:
(i) The upper bound is(ii) The lower bound is
Answers to the following questions will help compare your responses with other participants. Please complete the same before returning the questionnaire. Thank you.
1. Rate (not rank) each of the following information items independently as to how important they are to your above estimates on a scale of 0 to 10 (0: not important and 10: very important):
Item Rating Item RatingNet income ______ Net sales ______Earnings per share ______ Deferred taxes ______Cash dividends ______ S&P 500 index ______Current taxes ______ Total debt/equity ______Stock price ______ Book equity per share ______“P/E ratio ______ Current ratio ______
2. To what extent the presented information was adequate for your estimates (please circle one):
Not FullyAdequate 0 1 2 3 4 5 6 7 8 9 10 Adequate
(Continued next page)

178
3. What other information would have helped your estimates (please be specific) _____________________________________________________
4. Please circle your highest educational level:a. high School;b. some college;c* bachelors degree Major/concentration_______________d. Masters Degree/Ph.D. Major/concentration_______________
5. How many years experience do you have in evaluating financialstatements for investment purposes? ______ years.
6. Approximately how much time (in minutes) did it take you to complete the questionnaire? ______ minutes.
7. Please circle your professional certification(s):a. CFA b. CPAc. other (please specify)__________________
8. a. Are you interested in the cash awards? ____ yes; no.b. Do you want a complimentary copy of the findings? yes; no.
Please use the space below for writing your name and address ifyou answer yes to either 8a or 8b above.
End of Questionnaire. Please return the questionnaire in the enclosed envelope. Thank you very much for your help and cooperation.

APPENDIX GSAMPLE COVER LETTER FOR THE FIRST MAILING
179

January 26, 1987
Mr. John J. McElroy, III Drexel Burnham Lambert Inc.3 Mellon Bank Center, 32nd FI.Philadelphia, PA 19102Dear Mr. McElroy:We are conducting a study to determine ways in which analysts use financial information for earnings and stock price estimation. Your name was selected from a list provided by the Financial Analysts Federation. The findings of our research will aid the accounting profession and accounting standard setting bodies to design financial statements which will better suit your needs.The enclosed questionnaire involves prediction of net income and stock price. In a pretest, analysts completed the questionnaire in an average time of less than 15 minutes. A postage-paid, preaddressed envelope is enclosed for return of the completed questionnaire.Your response is crucial for the study. It is so important, we are offering two $50.00 cash awards to the respondents who make the most accurate net income and stock price predictions. We realize we cannot compensate you for your time and effort. However, should you win, we will be happy to send the prize check to you or to a designated charity. We would also be pleased to send you a complimentary copy of the findings of this research. If you are interested in the cash award and/or research findings, please indicate with a (✓) and write your name, address, and the name of your favorite charity in the space provided.on the lf.st page of the questionnaire.Your response is strictly confidential and, except for determining the award recipients, will be used only in combination with those of other analysts.Once again, will you please find a little time and complete the questionnaire. Your response means a lot to us. Thank you very much for your help.Sincerely,
Nick. Apostolou, Ph.D Associate Professor
Z. Kahn, MBA Assistant Professor

A PPE N D IX H
SAMPLE POST CARD REMINDER
181

A few days ago you received a questionnaire for a study on how analysts use financial information for earnings & stock price estimation.If you have already returned it, thank you very much for your promptness. If you temporarily put it aside, like we do sometime, will you please complete the questionnaire and return it at your earliest convenience. Your response is crucial and will be greatly appreciated. Thank you very much for your help.
Nick. Apostolou Z . Kahn

APPENDIX ISAMPLE COVER LETTER FOR THE SECOND MAILING
%
183

February 9, 1987
Dear Financial Analyst:About two weeks ago, Dr. Nicholas Apostolou and I wrote to you seeking your participation in a study to determine ways in which analysts use financial information for earnings and stock price estimation. This research is for my Ph.D. dissertation, and your support is necessary for its successful completion.In case you have already returned the questionnaire, thank you very much. Your assistance is deeply appreciated.However, if you have not returned the questionnaire, will you please complete the enclosed duplicate questionnaire and return it in the postage-paid, preaddressed envelope. The enclosed questionnaire involves prediction of net income and stock price. In a pretest, analysts completed the questionnaire in an average time of less than 15 minutes.Your response is crucial for the study. It is so important, I am offering two $50.00 cash awards to the respondents who make the most accurate net income and stock price predictions. I realize I cannot compensate you for your time and effort. However, should you win, I will be happy to send the prize check to you or to a designated charity. I would also be pleased to send you a complimentary copy of the findings of this research. If you are interested in the cash award and/or research findings, please indicate with a (✓! and write your name, address, and the name of your favorite charity in the space provided on the last page of the questionnaire.Your response is strictly confidential and, except for determining the award recipients, will be used only in combination with those of other analysts.Should you have any questions or clarifications, it would be mypleasure to respond to the same. Please write or call. Thetelephone number is (812)479-2859.Once again, will you please find a little time and complete the questionnaire. Your response means a lot to me. Thank you very much for your valuable assistance.Sincerely,
Z . KahnAssistant Professor

VITA
Zafar Ullah Khan, son of Shujaat U. Khan and Manzurun Nisa Begum, was born on January 27, 1950, in Bareilly, India. He resided there until 1966, attending a private convent school and the Government Intermediate College.
In 1966, he enrolled at The Aligarh Muslim University.He received a B.Sc. degree in Mechanical Engineering in March, 1972. In July 1971, he entered the M.S. in Aeronautical Engineering program at Indian Institute of Technology, Madras. This degree was awarded in September, 1974.
In 1974, he accepted an Engineer Trainee position with the Indian Oil Corporation. When he left the corporation, in 1981, he was working as a Senior Engineer (cost control and project management) at the Mathura Refinery Project.
He resumed his education in August 1981 at The University of North Carolina, Chapel Hill and completed requirements for an M.B.A. in May 1983. In August 1983 he entered the Doctoral program in Accounting at Louisiana State
IUniversity and received the Ph.D. degree in December, 1987.
Married in 1974 to Rizwana Moin Khan, he is presently Assistant Professor of Accounting at the University of Evansville. He is a member of the American Accounting Association and National Association of Accountants.
185

DOCTORAL EXAMINATION AND DISSERTATION REPORT
Candidate: Zafar U. Khan
Major Field: Accounting
Title of Dissertation: The Impact of Comprehensive Allocation and Flow-ThroughMethod of Accounting for The Income Taxes On The Investment Decision: A Field Experiment
Approved:
Major Professor and Chairman
Dean of the Graduate School
alrrna
ifatAe Ijrchot
EXAMINING COMMITTEE:
Date of Examination:
July 17, 1987