the impact of competition in the mobile voice … mtr presentation.pdf · in the mobile voice...
TRANSCRIPT

THE IMPACT OF COMPETITION IN THE MOBILE VOICE MARKET ON TELECOMMUNICATIONS SECTOR AND MACRO ECONOMY IN KENYA
Presented to Communications Commission of Kenya (CCK)
By Prof Kieyah JD., PhD
Kenya Institute for Public Policy Research and Analysis
November 19, 2012

Overview
• Terms of Reference• Interpretation of TOR• Economic of Competition policy• Role of MTR• Effect of Competition on Tax Revenue• Effect of competition on Profits• Effect of competition on Macroeconomy• Effect of competition on Safaricom Stock• Proposed Retail price floor

Objectives of the Study
• Evaluate the impacts of competition in the mobile voice telephony market on exchequer revenues and recommend appropriate fiscal remedies to address volatility in tax revenues;
• Evaluate the impact of competition in the mobile voice market on profitability and financial performance of the sector;
• Evaluate the effects of competition for telecommunications services on Government Macro Economic agenda such as investments, employment creation, inflation, business process outsourcing, access and affordability of telecommunication service;
• Using accurate data and plausible modeling approach, isolate the effects of the ongoing competition in the mobile voice market on the performance of Safaricom Stock in the Nairobi Stock exchange and any threats to the stability of the stock market; and
• Based on sound micro economic judgment and best practices from progressive telecommunications jurisdictions, evaluate the economic soundness of introducing retail price floor for mobile voice services pegged at 50% above the prevailing wholesale prices.
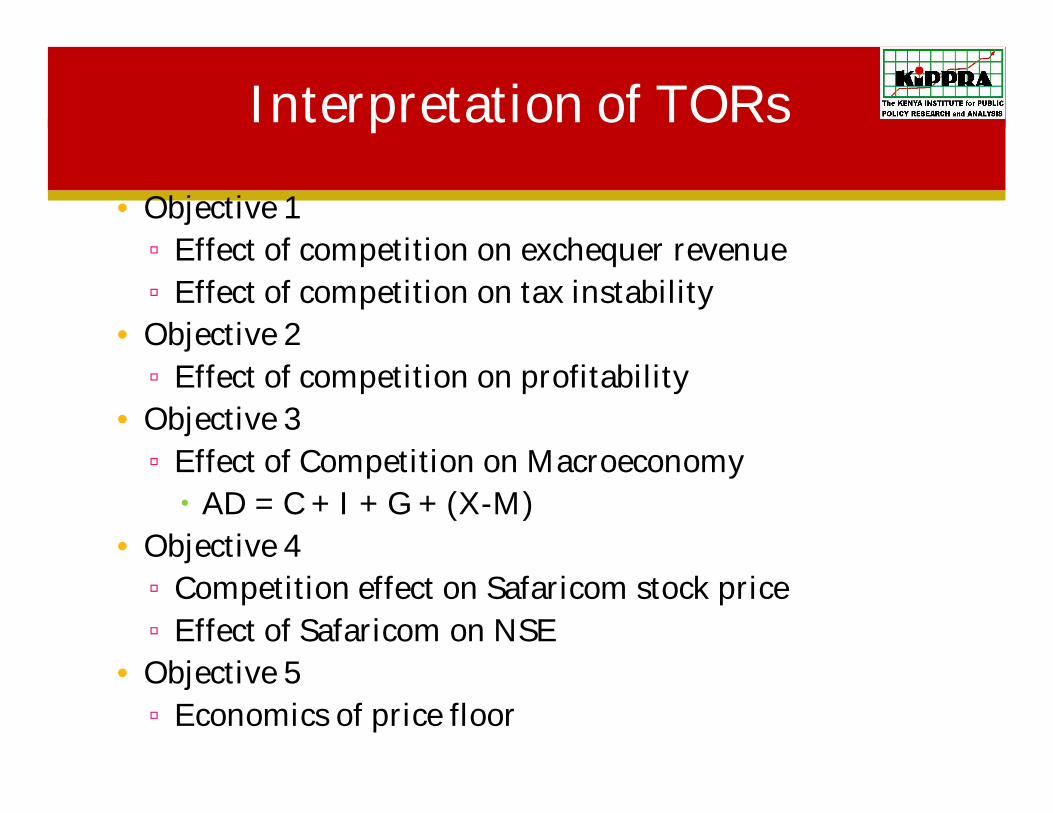
Interpretation of TORs
• Objective 1▫ Effect of competition on exchequer revenue▫ Effect of competition on tax instability
• Objective 2▫ Effect of competition on profitability
• Objective 3▫ Effect of Competition on Macroeconomy AD = C + I + G + (X-M)
• Objective 4▫ Competition effect on Safaricom stock price▫ Effect of Safaricom on NSE
• Objective 5▫ Economics of price floor
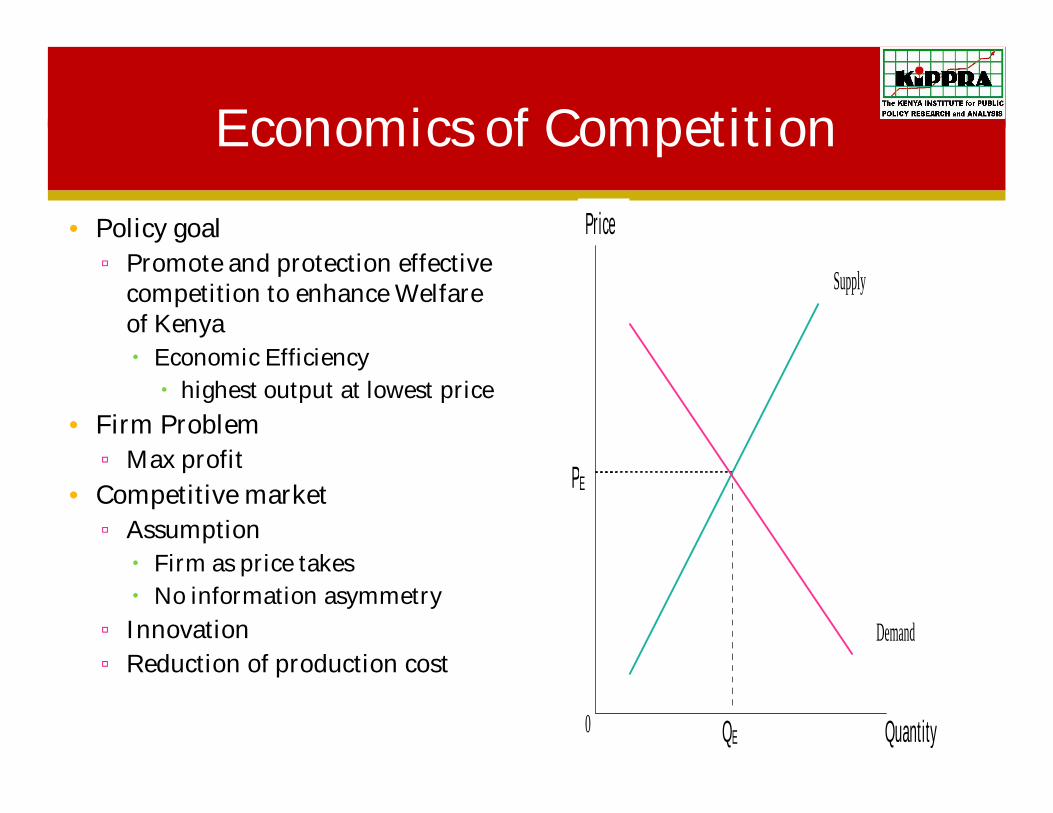
Economics of Competition
• Policy goal ▫ Promote and protection effective
competition to enhance Welfare of Kenya Economic Efficiency highest output at lowest price
• Firm Problem▫ Max profit
• Competitive market▫ Assumption Firm as price takes No information asymmetry
▫ Innovation▫ Reduction of production cost
Price
Quantity
Supply
Demand
0
PE
QE

Role of MTR
• Comparative analysis• Role MTR
▫ Firm problem Limit access
• Solution▫ Regulate access price▫ Internalize positive
externalities• Analogous problem
▫ Mandatory vaccination▫ Creation of easement to
public facilities
0.0
2.0
4.0
6.0
8.0
10.0
12.0
0.00
0.10
0.20
0.30
0.40
0.50
0.60
0.70
0.80
Q1-
Sep
06
Q2-
Dec
06
Q3-
Mar
07
Q4
-Ju
ne0
7Q
1-S
ep0
7Q
2-D
ec0
7Q
3-M
ar0
8Q
4-J
un
e08
Q1-
Sep
08
Q2-
Dec
08
Q3-
Mar
09
Q4
-Ju
ne0
9Q
1-S
ep0
9Q
2-D
ec0
9Q
3-M
ar10
Q4
-Ju
ne1
0Q
1-S
ep10
Q2-
Dec
10Q
3-M
ar11
Q4
-Ju
ne1
1Q
1-S
ep11
Q2-
Dec
11Q
3-M
ar12
Q4
-Ju
ne1
2
Inte
rcon
nect
ion
rate
(KES
)
HH
I
HHIInterconnection rate

Competition effect on Tax Revenue
• Issue▫ Competition on Tax Revenue
• Methodology▫ Trend Analysis HHI v Total Tax revenue HHI v forms of taxes Revenue
• Findings HHI ↓ v Total Tax revenue ↑ HHI ↓ v forms of taxes Revenue
• Interpretation▫ Competition enhances consumption and thus
consumption taxes

Competition effect on tax Revenue
0
0.1
0.2
0.3
0.4
0.5
0.6
0.7
0.8
-
5,000
10,000
15,000
20,000
25,000
30,000
35,000
2006/7 2007/082008/092009/10 2010/11 2011/12
KE
S m
illi
on
s
Annual tax revenue from mobile operators, 2006/7 to 2011/12
Corporate Withholding PAYE
VAT Airtime HHI
0
0.1
0.2
0.3
0.4
0.5
0.6
0.7
0.8
0
5,000
10,000
15,000
20,000
25,000
30,000
35,000
HH
IKsh
. Mil
lio
ns
TOTAL HHI
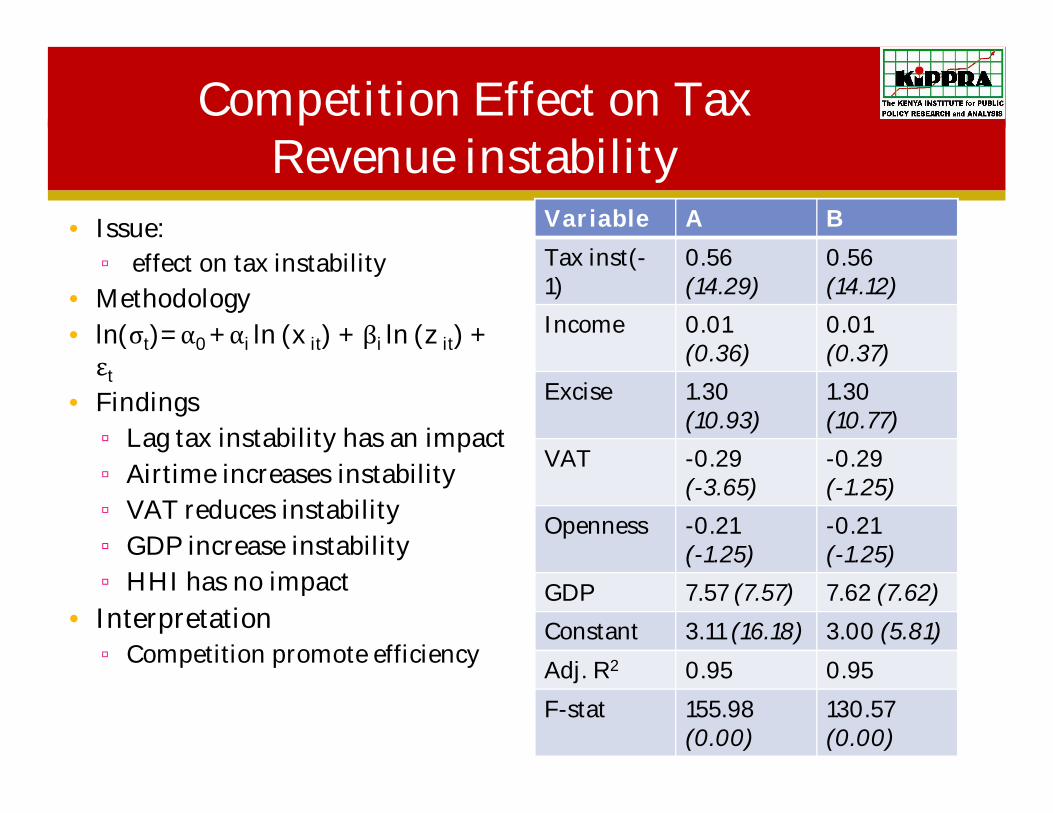
Competition Effect on Tax Revenue instability
• Issue:▫ effect on tax instability
• Methodology• ln(σt)=α0 +αi ln (x it) +βi ln (z it) + εt
• Findings▫ Lag tax instability has an impact▫ Airtime increases instability▫ VAT reduces instability ▫ GDP increase instability▫ HHI has no impact
• Interpretation▫ Competition promote efficiency
Variable A B
Tax inst(-1)
0.56 (14.29)
0.56(14.12)
Income 0.01 (0.36)
0.01(0.37)
Excise 1.30 (10.93)
1.30 (10.77)
VAT -0.29 (-3.65)
-0.29 (-1.25)
Openness -0.21 (-1.25)
-0.21 (-1.25)
GDP 7.57 (7.57) 7.62 (7.62)
Constant 3.11 (16.18) 3.00 (5.81)
Adj. R2 0.95 0.95
F-stat 155.98 (0.00)
130.57 (0.00)

Competition effect on Profitability
• Issue:▫ Competition effect on Profits
• Methodology▫ Granger causality test Revenue(profit proxy) was
regressed on past values of itself and HHI
Used monthly data-Jan. 2009-June 2012
• Findings▫ Coefficient on first lag of HHI
significant (t=2.59)
• Interpretation ▫ Competition is useful for
predicting profitability
Variable coefficient t
Profit Lag 1 -0.3045 -1.82
Profit Lag 2 -0.4303 -2.76
HHI Lag 1 1.80e^10 -2.57
HHI Lag 2 -1.69e^8 -0.02
HHI Lag 3 -8.75e^9 -1.29
HHI Lag 4 1.06e^10 1.73
HHI LAG 5 3.56e^9 0.53
F-statistic(7,28)Prob>F
3.25(0.0119)

Effect on Macroeconomy
• Issue:▫ Effect on Employment
• Methodology▫ Trend analysis of direct,
indirect and HHI
• Findings▫ Total employment increased
with competition • Interpretation
▫ In competitive environment the firm faces elastic demand thus to increase revenue firm must reduce variable cost
0
0.1
0.2
0.3
0.4
0.5
0.6
0.7
0.8
0
10,000
20,000
30,000
40,000
50,000
60,000
70,000
80,000
90,000
100,000
110,000
120,000
2007 2008 2009 2010 2011 2012
Direct employment
Dealers/agents
Indirect first tier workers
Employment in communication sectorHHI
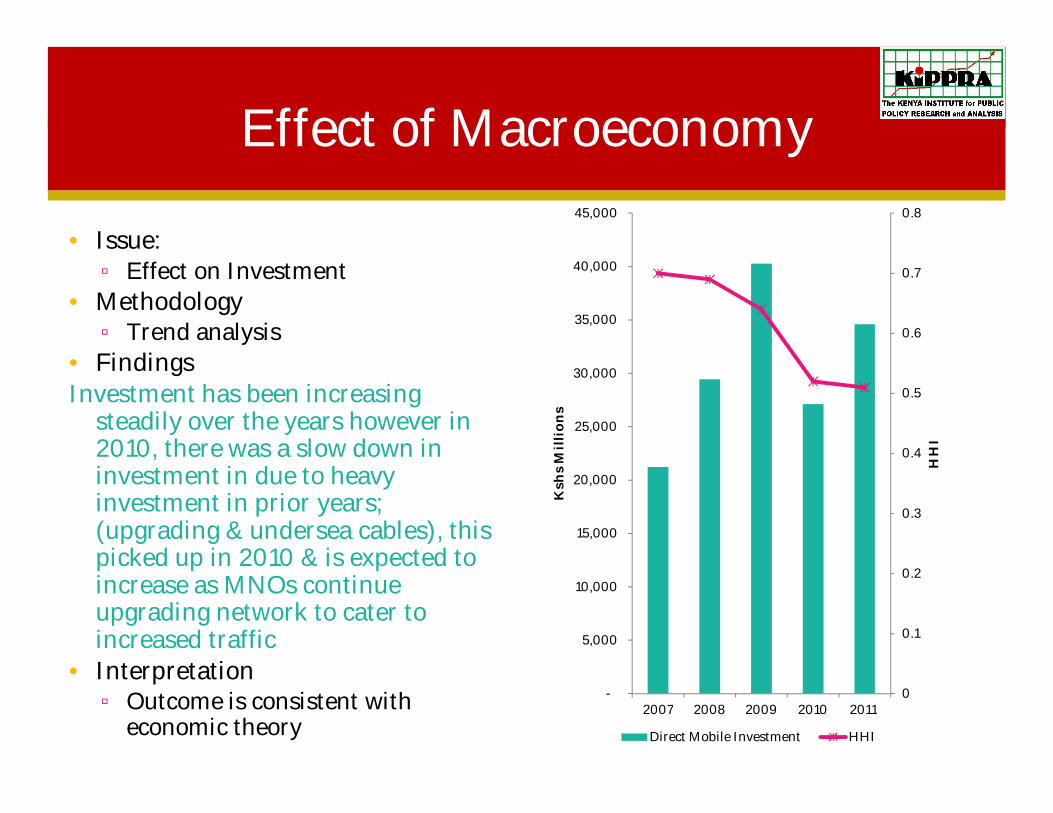
Effect of Macroeconomy
• Issue:▫ Effect on Investment
• Methodology▫ Trend analysis
• FindingsInvestment has been increasing
steadily over the years however in 2010, there was a slow down in investment in due to heavy investment in prior years; (upgrading & undersea cables), this picked up in 2010 & is expected to increase as MNOs continue upgrading network to cater to increased traffic
• Interpretation▫ Outcome is consistent with
economic theory
0
0.1
0.2
0.3
0.4
0.5
0.6
0.7
0.8
-
5,000
10,000
15,000
20,000
25,000
30,000
35,000
40,000
45,000
2007 2008 2009 2010 2011
HH
I
Ksh
s M
illi
on
s
Direct Mobile Investment HHI
Effect on Macroeconomy
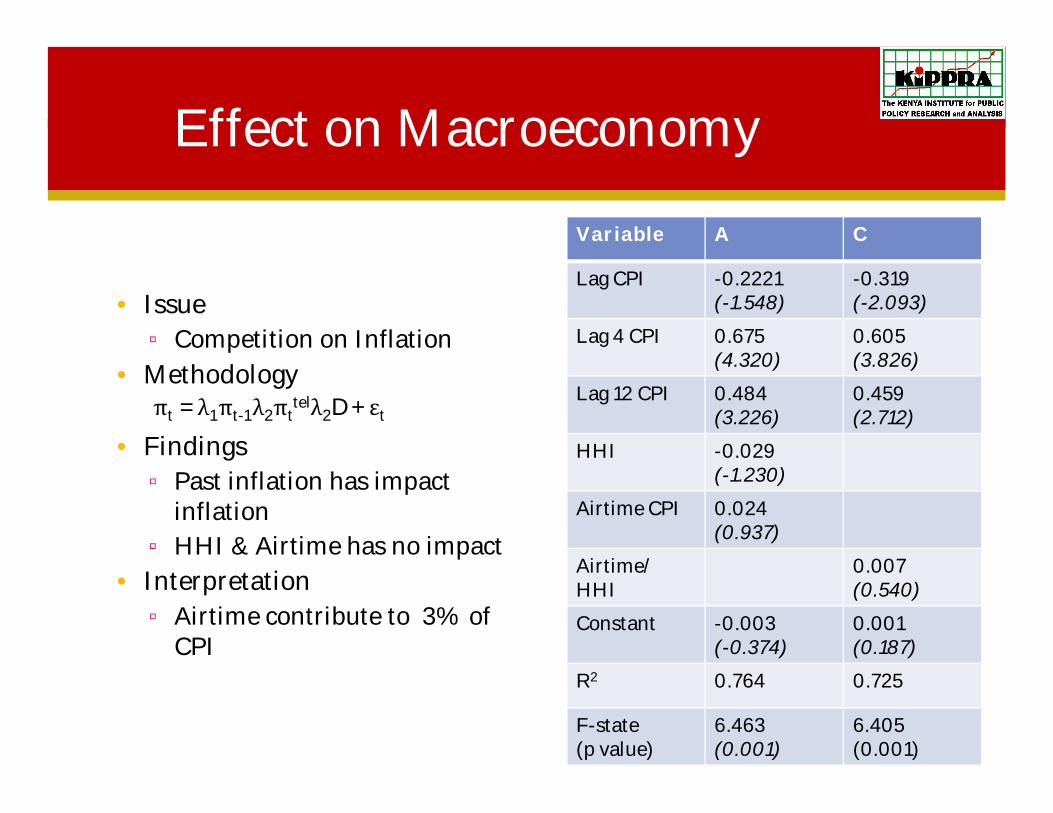
• Issue▫ Competition on Inflation
• Methodology
• Findings▫ Past inflation has impact
inflation▫ HHI & Airtime has no impact
• Interpretation▫ Airtime contribute to 3% of
CPI
Variable A C
Lag CPI -0.2221(-1.548)
-0.319(-2.093)
Lag 4 CPI 0.675(4.320)
0.605(3.826)
Lag 12 CPI 0.484(3.226)
0.459(2.712)
HHI -0.029(-1.230)
Airtime CPI 0.024(0.937)
Airtime/HHI
0.007(0.540)
Constant -0.003(-0.374)
0.001(0.187)
R2 0.764 0.725
F-state(p value)
6.463(0.001)
6.405(0.001)
πt =λ1πt-1λ2πttelλ2D +εt
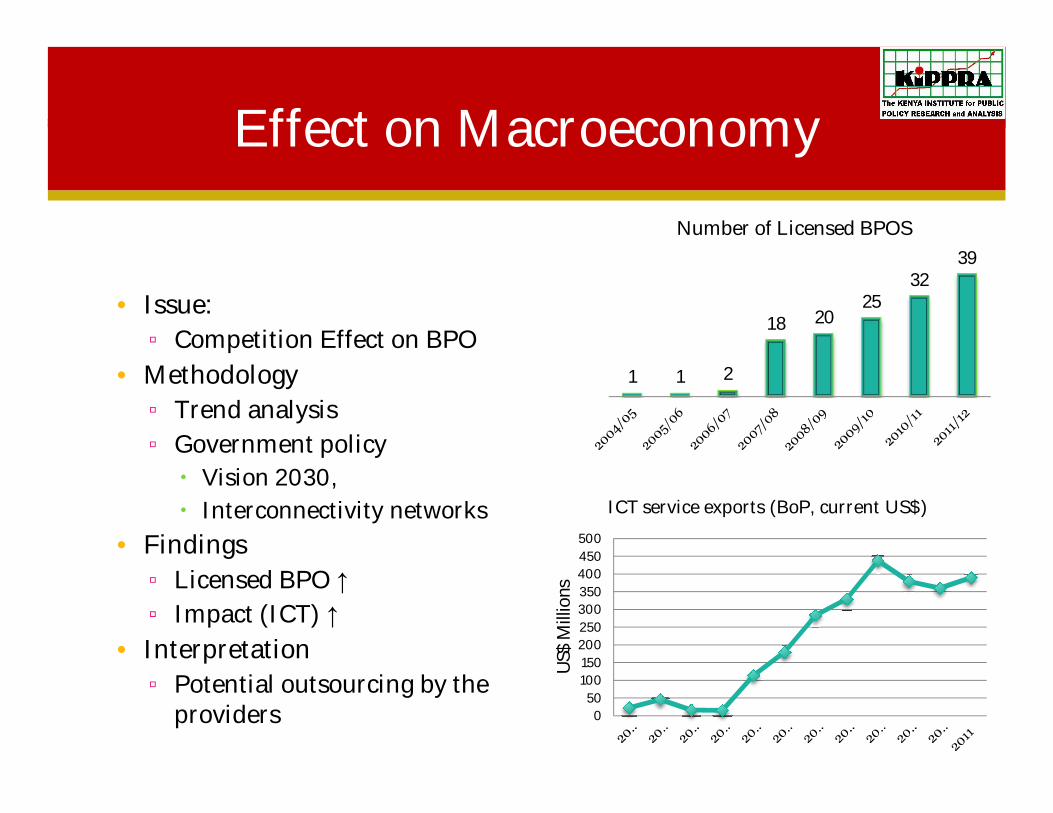
Effect on Macroeconomy
• Issue:▫ Competition Effect on BPO
• Methodology▫ Trend analysis▫ Government policy Vision 2030, Interconnectivity networks
• Findings▫ Licensed BPO ↑▫ Impact (ICT) ↑
• Interpretation ▫ Potential outsourcing by the
providers
1 1 2
18 2025
3239
Number of Licensed BPOS
050
100150200250300350400450500
US$
Mill
ions
ICT service exports (BoP, current US$)
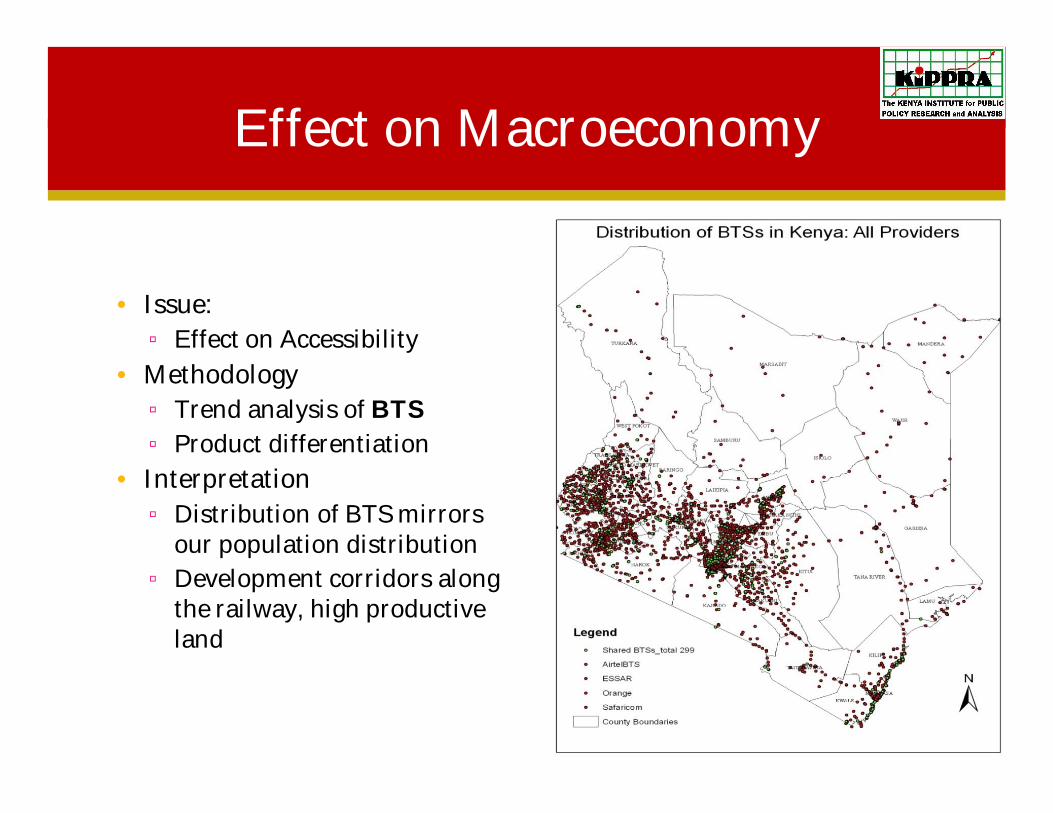
Effect on Macroeconomy
• Issue: ▫ Effect on Accessibility
• Methodology▫ Trend analysis of BTS ▫ Product differentiation
• Interpretation ▫ Distribution of BTS mirrors
our population distribution▫ Development corridors along
the railway, high productive land
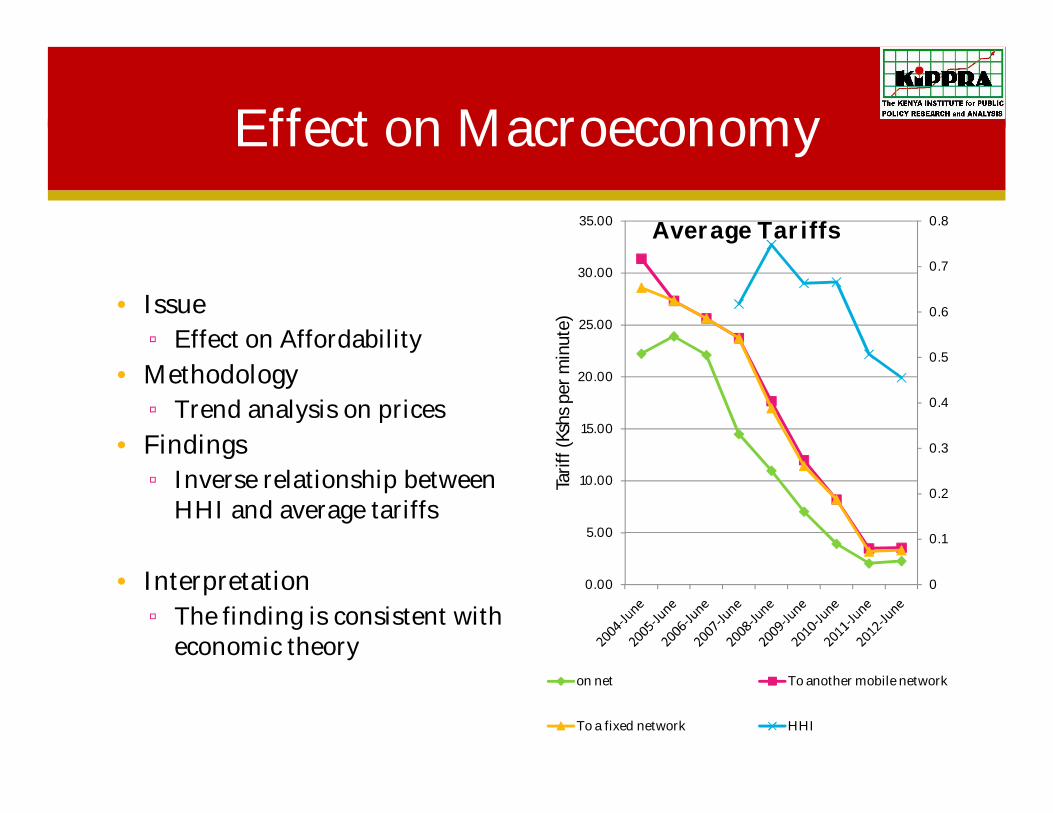
Effect on Macroeconomy
• Issue▫ Effect on Affordability
• Methodology▫ Trend analysis on prices
• Findings ▫ Inverse relationship between
HHI and average tariffs
• Interpretation▫ The finding is consistent with
economic theory
0
0.1
0.2
0.3
0.4
0.5
0.6
0.7
0.8
0.00
5.00
10.00
15.00
20.00
25.00
30.00
35.00
Tarif
f (Ks
hs p
er m
inut
e)
Average Tariffs
on net To another mobile network
To a fixed network HHI

Effect on Macroeconomy
MNO Airtimesharing
Airtime credit
Mobile money
Safaricom √ sambaza
√ OkoaJahazi
√ MPESA
Airtel √ Me2U √ Kopacredo advance
√ Airtelmoney
Essay (yu) √ Shareairtime
√ yuCredo
√Yu cash
TelkomOrange
√ Credittransfer
pewa √Orangecash
Product Differentiation• Short messaging service (SMS)• Telephone Directory• Data/internet (98.9% of total
internet subscription)• Mobile tunes/music• Mobile money (transactions of
up to USD 14 million daily)▫ Facilitate trade▫ Pay utility bills & school fees▫ Bank transactions▫ top-up airtime▫ Charity
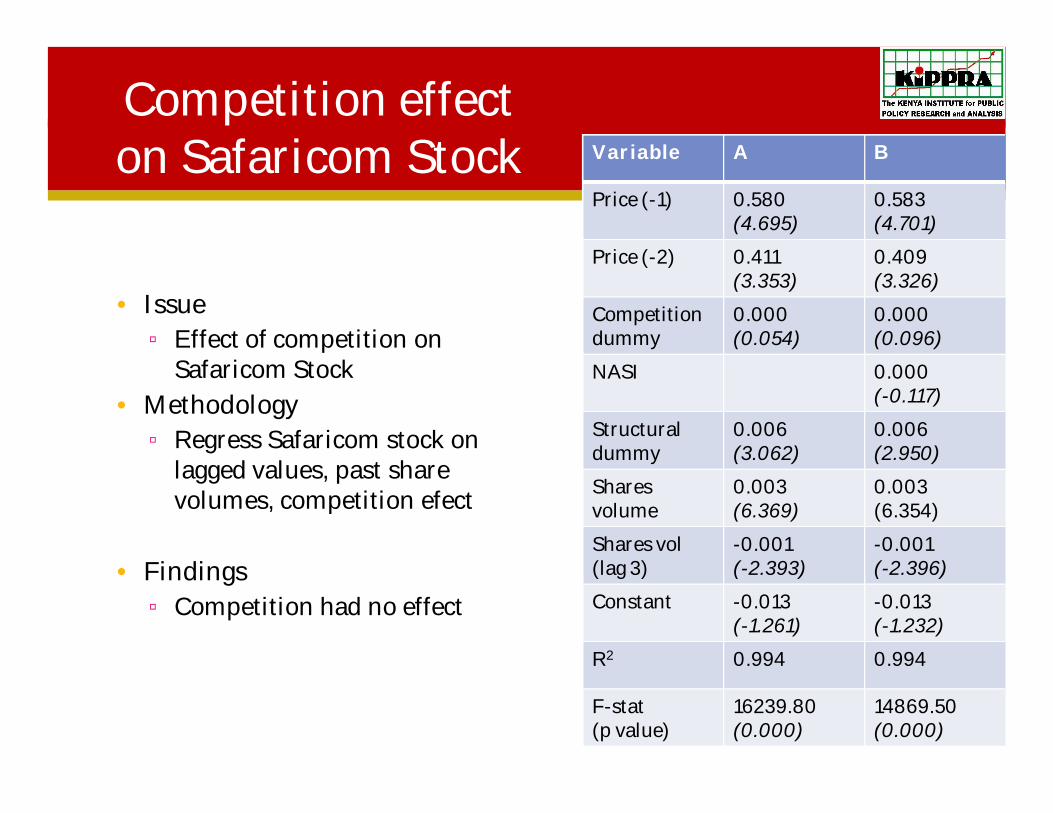
Competition effect on Safaricom Stock
• Issue▫ Effect of competition on
Safaricom Stock
• Methodology▫ Regress Safaricom stock on
lagged values, past share volumes, competition efect
• Findings▫ Competition had no effect
Variable A B
Price (-1) 0.580(4.695)
0.583(4.701)
Price (-2) 0.411(3.353)
0.409(3.326)
Competitiondummy
0.000(0.054)
0.000(0.096)
NASI 0.000(-0.117)
Structural dummy
0.006(3.062)
0.006(2.950)
Sharesvolume
0.003(6.369)
0.003(6.354)
Shares vol(lag 3)
-0.001(-2.393)
-0.001(-2.396)
Constant -0.013(-1.261)
-0.013(-1.232)
R2 0.994 0.994
F-stat(p value)
16239.80(0.000)
14869.50(0.000)

Impact of Competition Safaricom NSE Share
• Issue:▫ Impact on the stability of
NSE
• Methodology▫ Regress NASI on lag,
safaricom capitalization, competition proxy
• Findings▫ Safaricom stock had no
impact on stability of NSE▫ Competition proxy had no
impact• Interpretation
Variable A B
StandardDeviation Capitalization/NASA (-1)
0.003(1.034)
0.087(0.216)
SafaricomCapitilization
0.000(0.340)
0.012(0.508)
CompetitionProxy
0.000(0.178)
-0.008(-0.544)
Constant 0.003(1.034)
0.087(0.216)
R2 0.999 0.999
F-statistic(p-value)
125856.00(0.000)
178909.60(0.000)
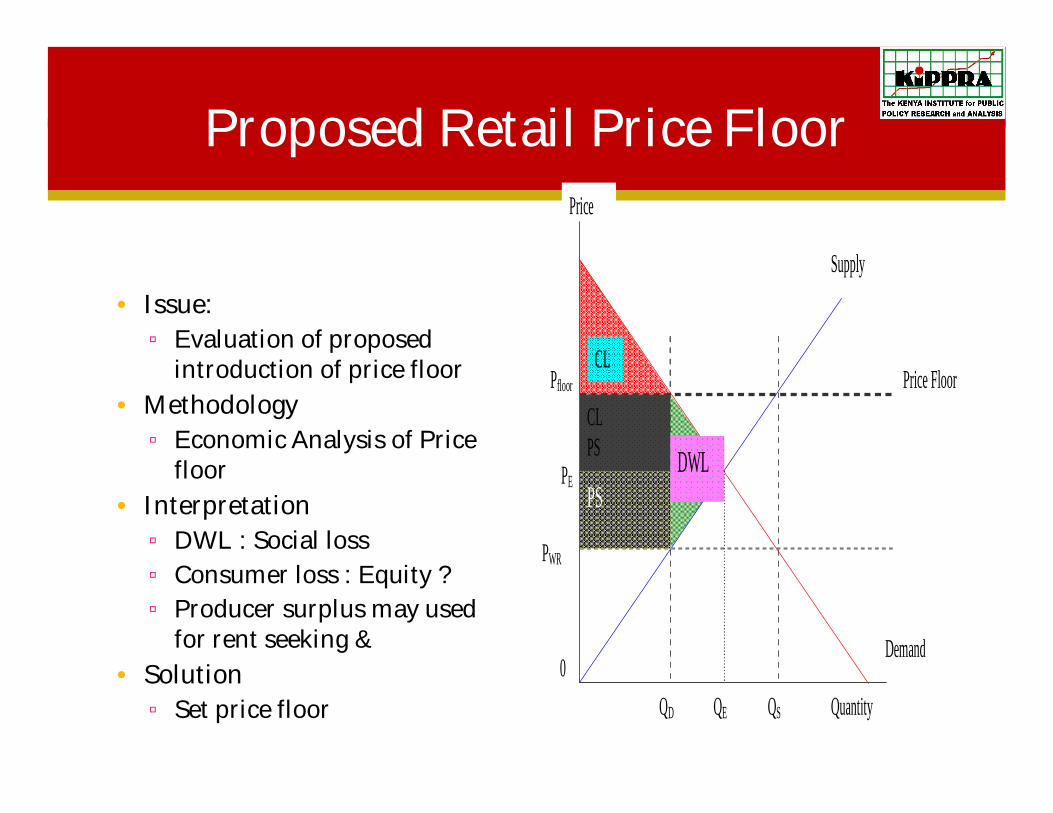
Proposed Retail Price Floor
• Issue:▫ Evaluation of proposed
introduction of price floor
• Methodology▫ Economic Analysis of Price
floor
• Interpretation ▫ DWL : Social loss▫ Consumer loss : Equity ?▫ Producer surplus may used
for rent seeking &
• Solution▫ Set price floor
PWR
Price
Quantity
Supply
Demand 0
Pfloor
PE
QE QD QS
Price Floor
CL PS
PS DWL
CL
Conclusion
• Conclusion▫ Trend analysis reveal a positive relationship
between total tax revenue and competition ▫ Based on regression analysis competition
had no impact on tax revenue instability▫ Based on causality test, competition was a
good predictor of voice market profitability▫ Trend analysis implies positive relationship
between total employment and competition proxy▫ Trend analysis implies positive relationship
between competition and investment with some qualification

Conclusion
• Competition and Airtime tariff had no impact on the inflation
• Trend analysis implies the direct relationship between affordability and competition
• The distribution of BTS suggest easy accessibility because it mirrors population distribution
• Regression analysis shows that competition had no impact of prices of safaricom stock
• Safaricom Stock and competition had no impact on the stability of NSE
• Price floor would be inefficient because it would create social cost