the hil based model validation paradigm - tools, challenges, and application...
TRANSCRIPT

The HIL Based Model Validation Paradigm - Tools, Challenges, and
Application ExamplesMichael “Mischa” Steurer
Leader Power Systems Research Group at FSU-CAPSEmail: [email protected], phone: 850-644-1629
39th Annual Conference of the IEEE Industrial Electronics Society
Nov 13, 2013, Vienna, Austria

Overview
• Role of Hardware-in-the-Loop (HIL)
• FSU-CAPS 5 MW power HIL (PHIL) facility
• De-risking of PHIL experiments
• Model Verification and Validation (V&V)
• PHIL examples
2
FSU-CAPS High Bay PHIL Lab
Basics of HIL Simulation Approach
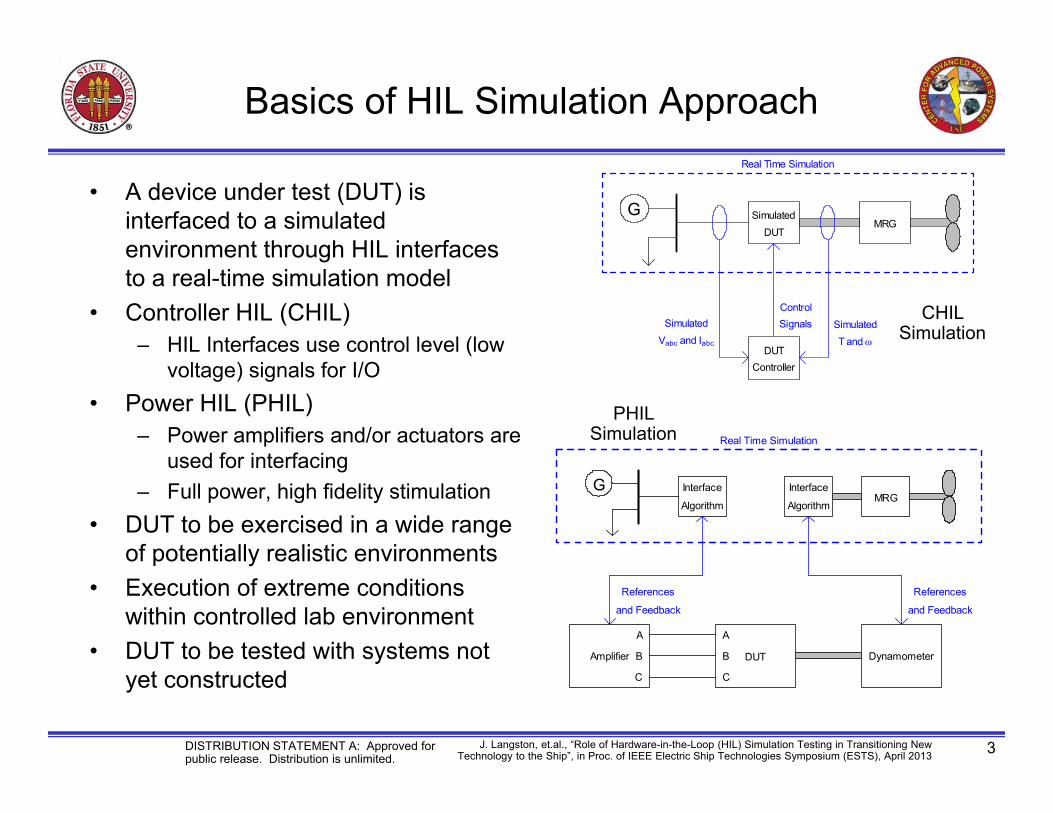
• A device under test (DUT) is interfaced to a simulated environment through HIL interfaces to a real-time simulation model
• Controller HIL (CHIL)– HIL Interfaces use control level (low
voltage) signals for I/O• Power HIL (PHIL)
– Power amplifiers and/or actuators are used for interfacing
– Full power, high fidelity stimulation• DUT to be exercised in a wide range
of potentially realistic environments• Execution of extreme conditions
within controlled lab environment• DUT to be tested with systems not
yet constructed
3
SimulatedDUT
GMRG
DUTController
ControlSignalsSimulated
VabcandIabc
SimulatedTand
Real Time Simulation
CHIL Simulation
Interface
Algorithm
G Interface
AlgorithmMRG
A
B
C
DUT
A
B
C
Amplifier Dynamometer
References
andFeedback
References
andFeedback
Real Time Simulation
PHIL Simulation
DISTRIBUTION STATEMENT A: Approved for public release. Distribution is unlimited.
J. Langston, et.al., “Role of Hardware-in-the-Loop (HIL) Simulation Testing in Transitioning New Technology to the Ship”, in Proc. of IEEE Electric Ship Technologies Symposium (ESTS), April 2013

Role of HIL Simulation throughout Technology Development
4
• Modeling and Simulation dominates the entire process
• CHIL contributes heavily from proof of concept through PHIL testing– De-risk early development of
• Hardware (fast) controller• Application (slow) controller
– De-risking PHIL experiments
• PHIL supports model building and integration phases– Experimental data for model
construction and validation– Stimulation of component through
controlled transients– Integration testing through emulation
of the target environment(s)
Modeling and Simulation
ControlHIL
LimitedHardwareTesting
PowerHIL HW
onlyLab
Testing
In situ
Proof ofConcept
IntegrationTesting
Development andModel Building
Time
RelativeEffort

FSU Center for Advanced Power Systems
• Established at Florida State University in 2000 under a grant from the Office of Naval Research
• Focusing on research and education related to application of new technologies to electric power systems
• Organized under FSU VP for Research• Affiliated with FAMU‐FSU College of
Engineering• Lead Member of ONR Electric Ship R&D
Consortium ‐ ESRDC• ~$8 million annual research funding from
ONR, DOE, Industry• DOD cleared facility at Secret level
Staffing• 50 Full‐time staff of scientists, engineers and technicians, post‐doc.’s and supporting personnel
• 7 FAMU‐FSU College of Engineering faculty• 45 StudentsFacility• 44,000 square feet, laboratories and offices, located in Innovation Park, Tallahassee;
• Over $35 million specialized power and energy capabilities funded by ONR, DOE
Research Groups• Electric Power Systems• Advanced Modeling and Simulation• Advanced Control Systems• Power Electronics Integration and Controls• Thermal management• High Temperature Superconductivity• Electrical Insulation/Dielectrics

Experimental Capabilities• Integrated 5 MW Hardware-in-the-Loop
(HIL) testbed– 5 MW variable voltage / variable frequency
converter: 4.16 kVac, 1.1 kVdc– 5 MW dynamometers
225/450, 1,800/3,600; -12,000/24,000 RPM– 5 MW MVDC converters: 6/12/24 kV– Real-time Digital Simulators (RTDS,
OPAL-RT)• <2 μs step in real-time
– Cyber-physical system simulation in RT
• Superconductivity and crogenics– AC Loss and Quench Stability Lab– Cryo-dielectrics High Voltage Lab– Cryo-cooled systems lab
• Low power and smart grid labs

FSU-CAPS PHIL Test Facility
S4 S5
SS1
4.16 kV Exp. Bus (Starboard)
=
~
=
~
~
=
~
=
M2
Substation
=
~
=
~
~
=
~
=
M1
=
~
=
~
~
=
~
=
B1
SS3 S
T1
C1 C2
T7T6
4.16 kV
B2FutureFeed
12.47 kV
4.16 kV Exp. Bus (Port)
Future
B5 B6
FutureFeed SP2 SP4
S10
B3 B4
S8
B12
B15
SP
=
~
=
~
~
=
~
=
C4
T9.1
5 MW VVF AC Bus
T10.1
=
~
=
~
~
=
~
=
B13
B14
5 MWMax
DC Bus
500-1150 VDC1.5MW @ 600VDC2.8MW @ 1150VDC
T10.2
T9.2
SCC 800 MVA @ 12.5 kV
7.5 MVA, 5%
~
=~
=~
=~
=
MVDC Experimental BusParallel: 6 kV, 0.8 kA, Series: 24 kV, 0.21 kA
3.5 / 4.16 kV
0.8 MW PCM44.16kV / 1 kV (DC)
NEW – 4 x MMC convertersDelivered : Oct 28, 2013
1.5 MVA480 V bus
PHIL…Power Hardware in the Loop
Fully Integrated with Real-Time Simulator
PHIL ChallengesAccuracy, Stability, Protection
84/2013
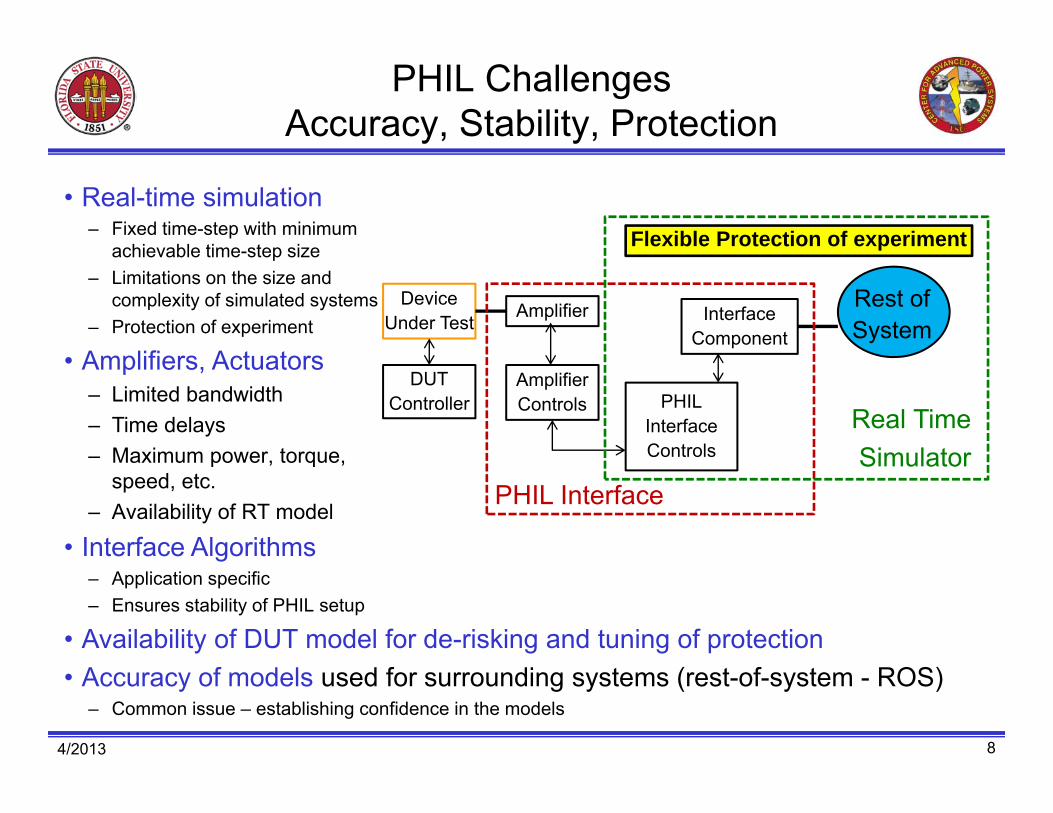
• Real-time simulation– Fixed time-step with minimum
achievable time-step size– Limitations on the size and
complexity of simulated systems– Protection of experiment
• Amplifiers, Actuators– Limited bandwidth– Time delays – Maximum power, torque,
speed, etc.– Availability of RT model
• Interface Algorithms– Application specific– Ensures stability of PHIL setup
• Availability of DUT model for de-risking and tuning of protection• Accuracy of models used for surrounding systems (rest-of-system - ROS)
– Common issue – establishing confidence in the models
InterfaceComponent
Rest ofSystem
PHILInterfaceControls
AmplifierControls
AmplifierDeviceUnder Test
DUTController
PHIL Interface
Real TimeSimulator
Flexible Protection of experiment
06/26/2007 9
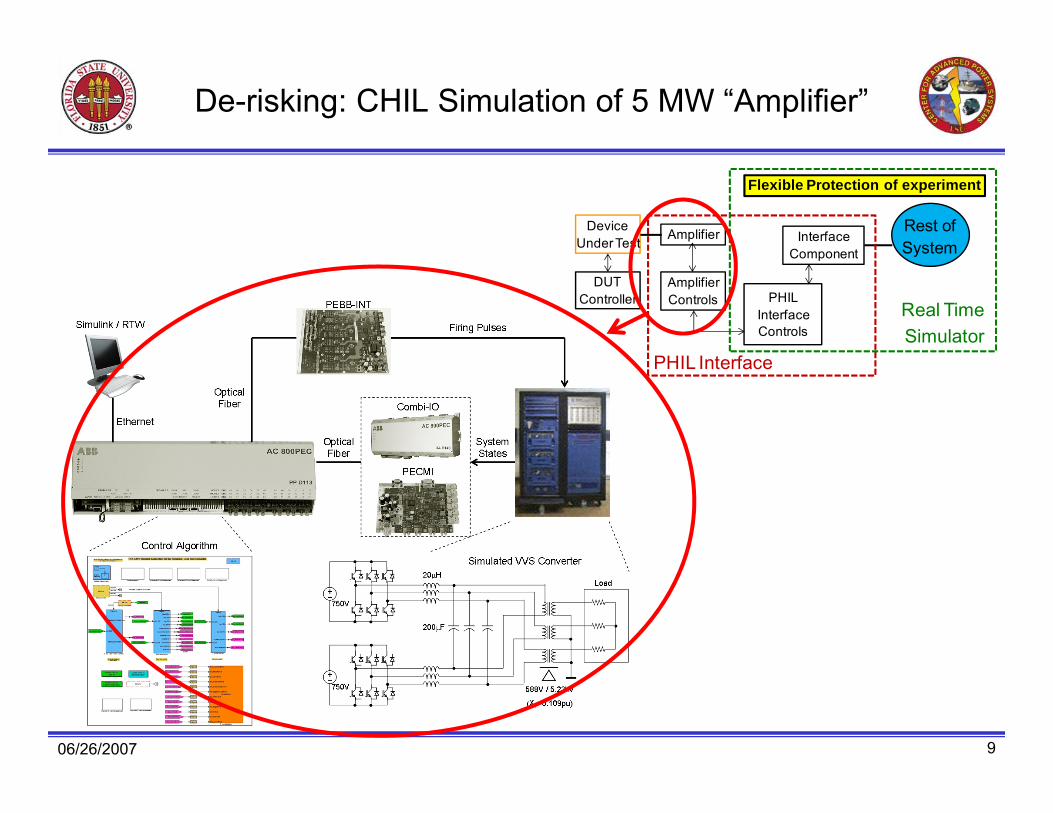
De-risking: CHIL Simulation of 5 MW “Amplifier”
InterfaceComponent
Rest ofSystem
PHILInterfaceControls
AmplifierControls
AmplifierDeviceUnder Test
DUTController
PHIL Interface
Real TimeSimulator
Flexible Protection of experiment

Simulated PHIL Experiment
10
InterfaceComponent
Rest ofSystem
PHILInterfaceControls
Real TimeSimulator
Flexible Protection of experiment
AmplifierControls
AmplifierDeviceUnder Test
DUTController
Hardware in Lab
AmplifierControls
AmplifierDeviceUnder Test
DUTController
Transition between modes for every change in the experimental setup
Real TimeSimulator

Model Verification and Validation
• Quantitatively Assess the predictive capability of models.
• Identify– Surroundings– Scenarios– Observable Quantities– Response Quantities
• In order to be of value, these must be carefully selected
• By standardizing for common classes of components, improve quality of results
11
A
B
C
Vsrc Lsrc
A
B
C
P
N
Active AC/DCRectif ier
Vr
Rload
DUT
Vr
Ia
Ib
Ic
Va
Vb
Vc
Idc
Vdc
Time
Voltage
Vmax
Tsettle
DISTRIBUTION STATEMENT A: Approved for public release. Distribution is unlimited.
J. Langston, et.al., “Role of Hardware-in-the-Loop (HIL) Simulation Testing in Transitioning New Technology to the Ship”, in Proc. of IEEE Electric Ship Technologies Symposium (ESTS), April 2013
Synergy Between Verification and Validation and HIL Simulation
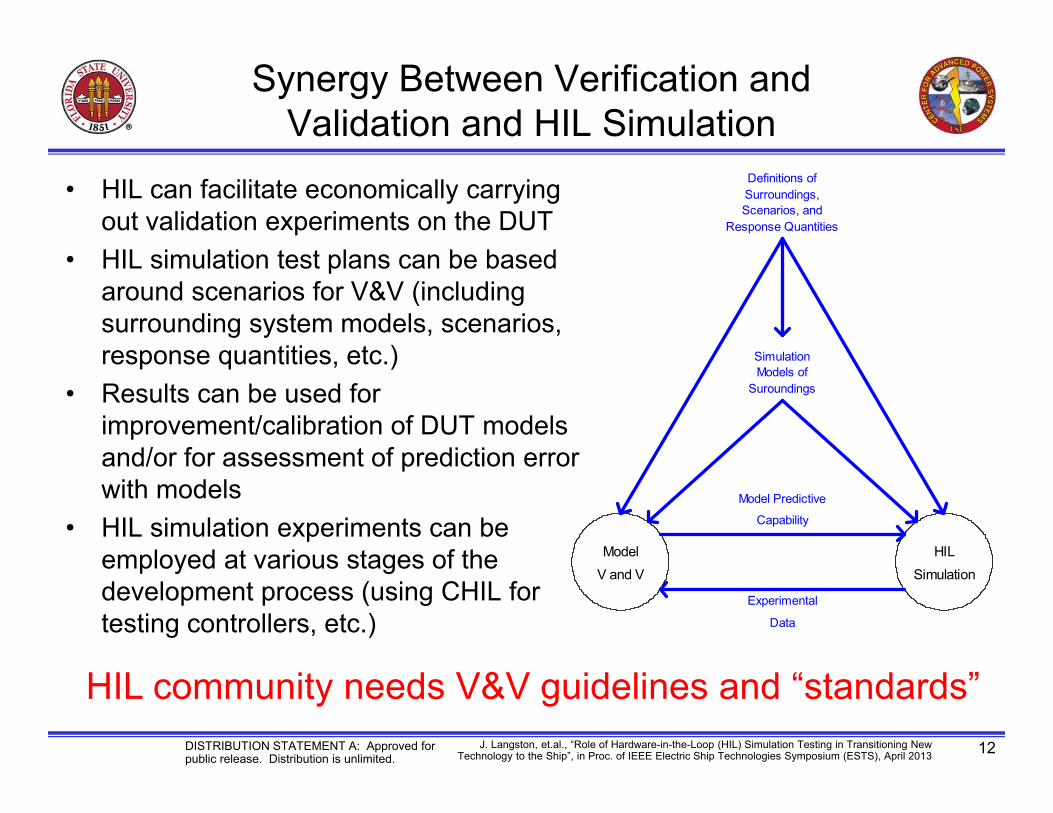
• HIL can facilitate economically carrying out validation experiments on the DUT
• HIL simulation test plans can be based around scenarios for V&V (including surrounding system models, scenarios, response quantities, etc.)
• Results can be used for improvement/calibration of DUT models and/or for assessment of prediction error with models
• HIL simulation experiments can be employed at various stages of the development process (using CHIL for testing controllers, etc.)
12
Definitions ofSurroundings,Scenarios, and
Response Quantities
SimulationModels of
Suroundings
ModelVandV
HILSimulation
ModelPredictive
Capability
Experimental
Data
DISTRIBUTION STATEMENT A: Approved for public release. Distribution is unlimited.
J. Langston, et.al., “Role of Hardware-in-the-Loop (HIL) Simulation Testing in Transitioning New Technology to the Ship”, in Proc. of IEEE Electric Ship Technologies Symposium (ESTS), April 2013
HIL community needs V&V guidelines and “standards”
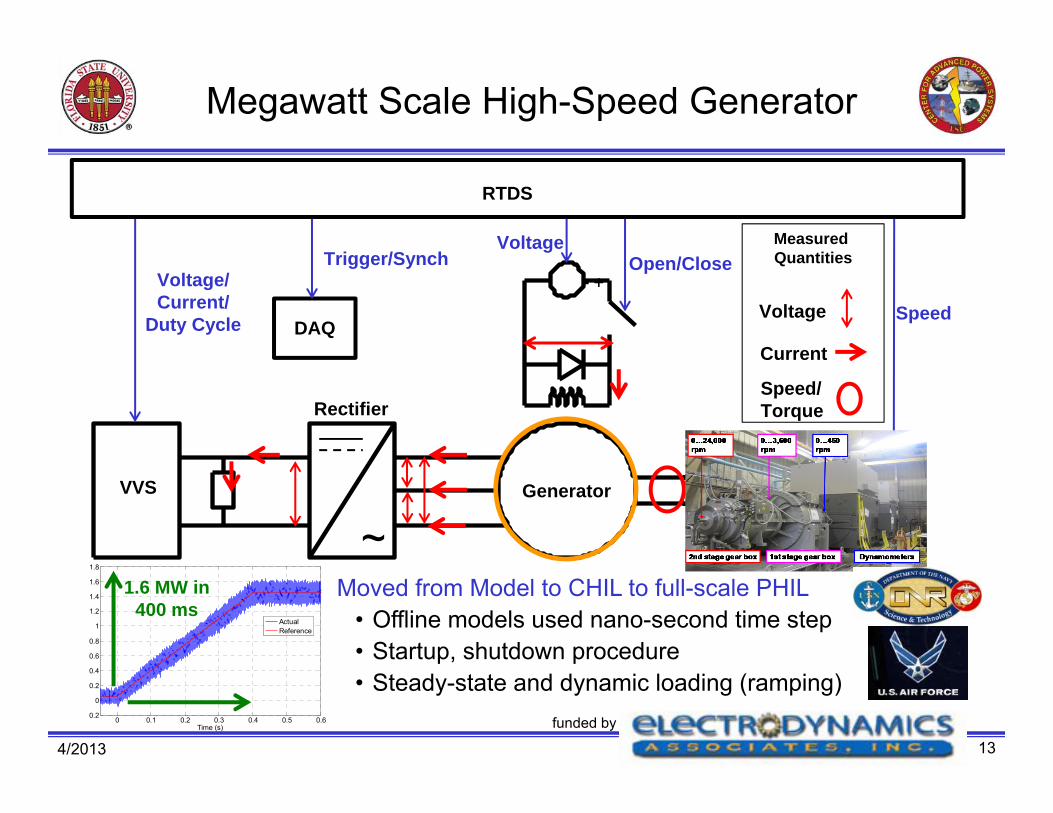
Megawatt Scale High-Speed Generator
134/2013
VVS
Rectifier
Gearbox DynoGenerator
+-
DAQ
~
RTDS
VoltageOpen/CloseTrigger/Synch
Voltage/Current/
Duty Cycle SpeedVoltage
Current
Speed/Torque
Measured Quantities
0 0.1 0.2 0.3 0.4 0.5 0.6-0.2
0
0.2
0.4
0.6
0.8
1
1.2
1.4
1.6
1.8
Time (s)
ActualReference
Moved from Model to CHIL to full-scale PHIL• Offline models used nano-second time step• Startup, shutdown procedure• Steady-state and dynamic loading (ramping)
1.6 MW in400 ms
funded by

SubstationB1
T1B2
S10
B15 4.16kV
T9.1
4.16kV AC Bus
T10.1
B13
B14
DC Bus: 0-1150VDCI max = +/- 2.5 kA
T9.2
=
~
~
=
=
~
=
=
PV Inverter
Power Grid Simulation
PV Array Simulation
6.3 MVA Variable Voltage Source (VVS)
Real Time Simulator RTDS
Real Time Simulator RTDS
VVS 1 VVS 2
=
~
4160/480V1.5MVAZ=5.86%
T5466/4160V3.93MVA Z=5.6%
B11
AC Bus1: 0-4.16 kVI max = 0.433 kA
AC Bus2: 0-0.48 kVI max = 1.8 kA
up to 1.5 MW
SubstationB1
T1B2
S10
B15 4.16kV
T9.1
4.16kV AC Bus
T10.1
B13
B14
DC Bus: 0-1150VDCI max = +/- 2.5 kA
T9.2
=
~
~
=
=
~
=
=
PV Inverter
Power Grid Simulation
PV Array Simulation
6.3 MVA Variable Voltage Source (VVS)
Real Time Simulator RTDS
Real Time Simulator RTDS
VVS 1 VVS 2
=
~
4160/480V1.5MVAZ=5.86%
T5466/4160V3.93MVA Z=5.6%
B11
AC Bus1: 0-4.16 kVI max = 0.433 kA
AC Bus2: 0-0.48 kVI max = 1.8 kA
up to 1.5 MW
14
Dynamic HIL Testing of Large Inverters
PHIL testing of MW-scale converters is possible today!
4/2013
Low voltage ride throughFault current contributionUnbalanced voltageAnti-islanding
funded by
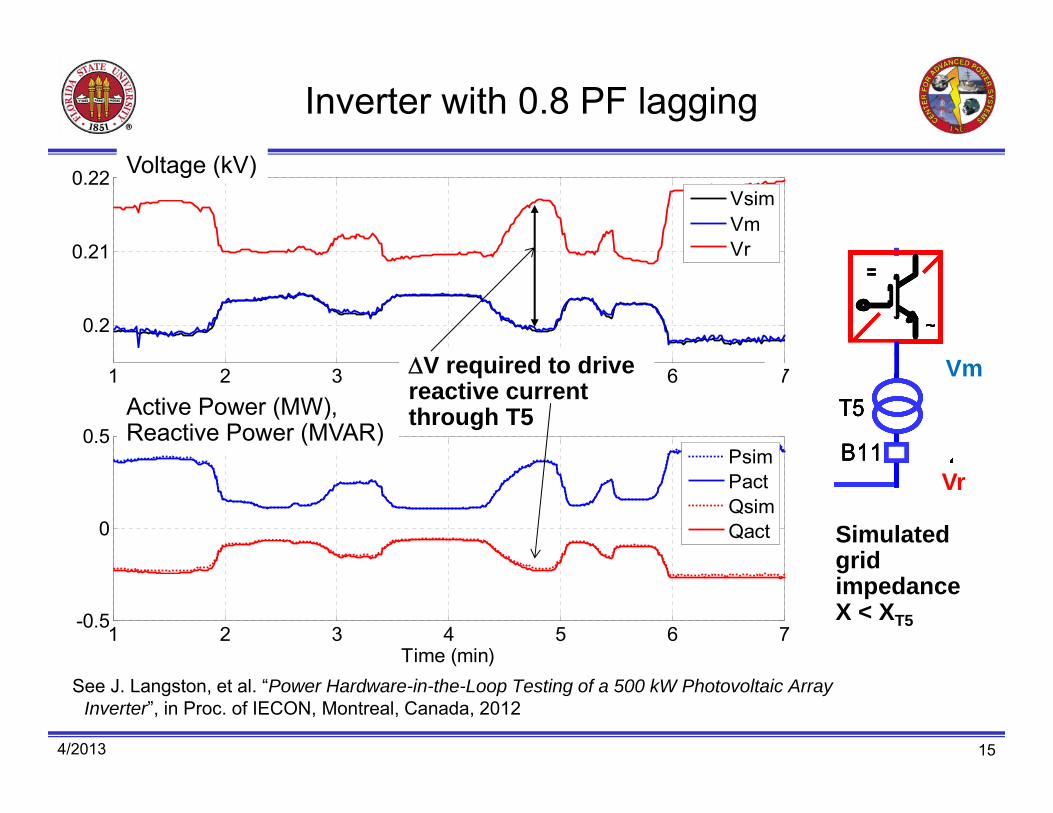
Inverter with 0.8 PF lagging
154/2013
See J. Langston, et al. “Power Hardware-in-the-Loop Testing of a 500 kW Photovoltaic Array Inverter”, in Proc. of IECON, Montreal, Canada, 2012
1 2 3 4 5 6 7
0.2
0.21
0.22
Time (min)
VsimVmVr
1 2 3 4 5 6 7-0.5
0
0.5
Time (min)
PsimPactQsimQact
Active Power (MW), Reactive Power (MVAR)
Voltage (kV)
Vr
I m
=
~
4
Z
T5
B11
I m
=
~
4
Z
T5
B11
I m
=
~
4
Z
T5
B11
I m
=
~
4
Z
T5
B11
VmV required to drive reactive current through T5
Simulated grid impedance X < XT5

16
T9.1
B13
B14
PHIL testing of SiC converter4.16 kVAC-1 kVDC
4.16 kV
VVS 1
T10.1
T9.2
=
~
=
~=
~
=
~=
~
=
~=
~
=
~
0…466 V
385 V
0…4160 V438 A max (cont.)45 Hz – (approx.) 100 HzSmall signal bandwidth limit approx. 1 kHz
VVS 2
0…1150 V2.5 kA max0…approx. 100 HzSmall signal bandwidth limit approx. 1 kHz
AC side DC side
RTDS
Voltage & Current
Fdbk
Voltage Ref
(Vab (t), Vbc (t))
Voltage & Current
Fdbk
Current Ref
(duty cycle)
Device under test
• Simulates surrounding system (sources, loads)
• Provides ultra-fast protection
funded by

17
Concluding Remarks
• PHIL testing is advancing rapidly– A tool to address several challenges associated with
transitioning technology (de-risking)– Emulate a wide range of surroundings and scenarios,
simulate yet unrealized systems
• Impact of PHIL interface more pronounced at MW scale experiments– Aim for close coupling between reference and amplifier but
acknowledge the limitations in the simulated PHIL setup– Develop affordable faster switching amplifiers– Improve real time simulation of models– Proper model construction and validation is key to success
• Simulation based preparation of MW scale experiments expected to save time and money– Improve development cycle– Discover hidden issues early
• Need to develop common guidelines and “standards” to accelerate adoption of HIL paradigm
500 kW PV converter in FSU-CAPS lab
Team at work in FSU-CAPS control room
4/2013

• http://www.caps.fsu.edu/documentcontrol.html

V&V: Quantification and Assessment of Model Predictive Capability
19
o oo
o ox
X
x1
x2
Simulation
Errx
Uncertainty
Numerical
Error
Prediction
y
Pyy
y
Pyy
In order to provide confidence bounds on predictions, combine • model uncertainty• numerical error• predicted model form errorinto prediction at untested operating point
DISTRIBUTION STATEMENT A: Approved for public release. Distribution is unlimited.
J. Langston, et.al., “Role of Hardware-in-the-Loop (HIL) Simulation Testing in Transitioning New Technology to the Ship”, in Proc. of IEEE Electric Ship Technologies Symposium (ESTS), April 2013

DC-side: Photovoltaic Emulation
Ensure that DC-amplifier controls allow PV-emulation in conjunction with PV inverter dynamics.
4/2013 20
0.30 0.32 0.34 0.36 0.38 0.40
0.0
0.1
0.2
0.3
0.4
0.5
Voltage (kV)
-0.05 0 0.05 0.1 0.15 0.2 0.25 0.3 0.35 0.40
0.2
0.4
0.6
0.8
1
1.2
1.4
1.6
-0.05 0 0.05 0.1 0.15 0.2 0.25 0.3 0.35 0.4-0.1
0
0.1
0.2
0.3
0.4
0.5
0.6
0.7
Voltage (kV)
Power (MW)Current (kA)
Maximum power point
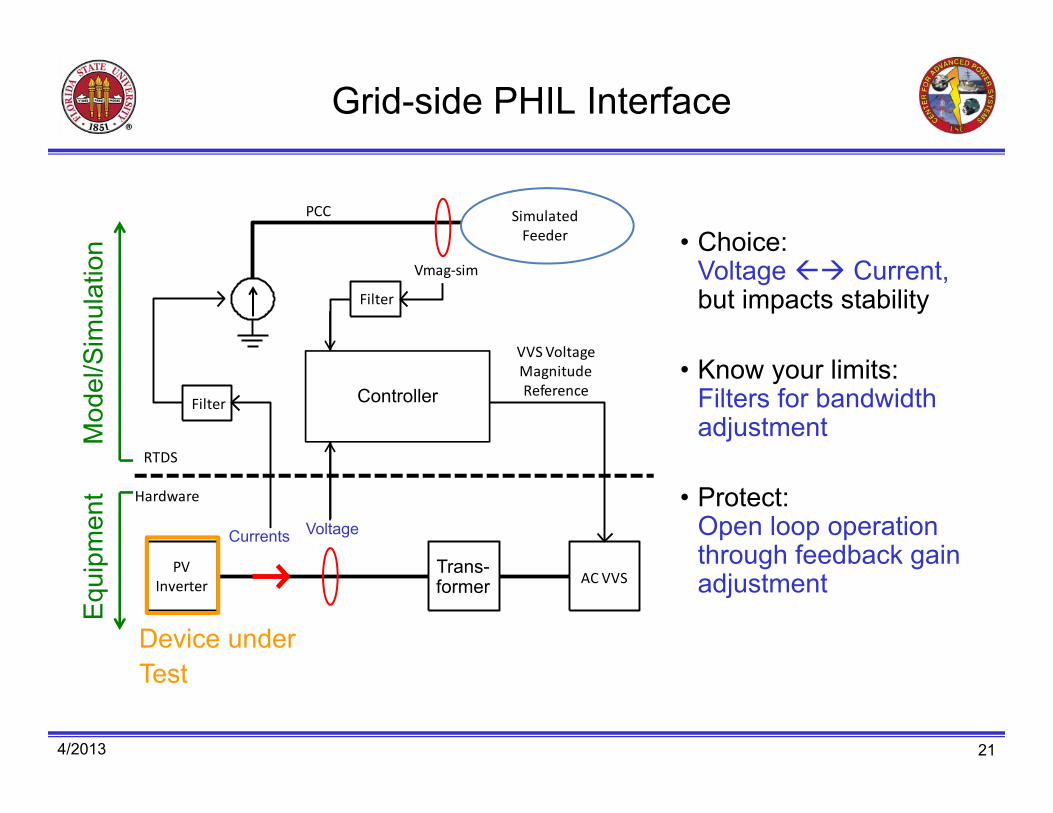
Grid-side PHIL Interface
4/2013 21
• Choice:Voltage Current, but impacts stability
• Know your limits:Filters for bandwidth adjustment
• Protect:Open loop operation through feedback gain adjustment
PV Inverter T5 AC VVS
Id, IqVmag
Vmag‐sim
Simulated Feeder
PCC
PI Controller+
‐Σ
VVS Voltage Magnitude Reference
RTDS
Hardware
Filter
Filter Controller
Currents Voltage
Trans-former
Device underTest
Mod
el/S
imul
atio
nE
quip
men
t
Trans-former

Cyber-Physical RT Simulation
Distributed Controls (DC) computing layer
Fast data links between DC and power components:
RT simulator specific
RT simulation of electric power system
RT simulation of Controls Communications