the golub capital altman index - new york universitypeople.stern.nyu.edu/ealtman/golub capital...
TRANSCRIPT

1
The Golub Capital Altman Index Edward I. Altman Max L. Heine Professor of Finance at the NYU Stern School of Business and a consultant for Golub Capital on this project
Robert Benhenni Executive Officer of QFA, Inc and a consultant for Golub Capital on this project
June 15, 2015
2
INTRODUCTION
The Golub Capital Altman Index measures the actual revenue and EBITDA (earnings before interest, taxes, depreciation and amortization) growth of U.S. middle market private companies for the first two months of each calendar quarter and provides insight into anticipated quarterly performance of US public companies. The Golub Capital Altman Index is based on aggregated data from approximately 150 companies in the loan portfolio of Golub Capital, a leading middle market lender.
Reported shortly before public company quarterly earnings season, the performance of the Golub Capital Altman Index has been highly correlated with the median growth rates in revenue and EBITDA of the companies in the S&P 500, S&P SmallCap 600, and Russell 2000 indexes, as well as quarterly Gross Domestic Product (GDP), since data began to be tracked in 2012.
Produced by Golub Capital in collaboration with Dr. Edward I. Altmani, the Max L. Heine Professor of Finance at the NYU Stern School of Business and a global authority on corporate credit investments, the index (1) is representative of the general performance of middle market companies, which are a major contributor to U.S. private sector output and employment,ii (2) can be easily compared to the performance of the public companies that make up major stock market indexes, (3) is relevant to the aggregate economic performance of the U.S. economy, and (4) provides timely information for the investment community.
THE MIDDLE MARKET SAMPLE
We define middle market firms as corporations with $5-75 million of EBITDA.iii The sample consists of private companies that have borrowed funds from Golub Capital, typically in connection with the purchase or expansion of the company by a private equity fund in a leveraged transaction. Companies represented in the Golub Capital Altman Index operate within the following General Industry Classification Standard (GICS) sectors: Consumer Discretionary, Consumer Staples, Healthcare, Industrials, Information Technology, Telecommunication Services, and a small number of “Other” firms from several sectors (Energy, Financials, Materials and Utilities). The Golub Capital Altman Index measures the year-over-year (Y-o-Y) growth rate of two financial performance variables, revenues and EBITDA, for the first two months of each calendar quarter. Our analysis demonstrates that the growth rates in revenue and EBITDA of the firms included in the Golub Capital Altman Index are highly correlated and similar to those of companies in widely followed stock market indexes.
3
The sample period for our initial analysis, Q1 2012 through Q1 2015, was selected due to data availability and consistency. In aggregate, the companies that comprise the Golub Capital Altman Index generated $18.1 billion of revenue and $3.2 billion of EBITDA during 2014. On an average monthly basis, the companies in aggregate generated $1.5 billion of revenue and $266 million of EBITDA in 2014. During the first three months of 2015, companies that comprise the Golub Capital Altman Index generated $4.3 billion of revenue and $719 million of EBITDA vs. $4.2 billion and $697 million, respectively, during the first three months of 2014.
DATA SET
Due to loan covenants, most of the companies included in the Golub Capital Altman Index report monthly financial data to Golub Capital within 30-45 days of month’s end. These reports include the financial standing of the loan as well as key income statement and balance sheet measures. Golub Capital receives this information directly from corporations or owners and reviews it for any potentially misreported items. It is then entered into a database and re-checked for any duplications or omissions. After resolving any potential issues, the data is downloaded for analysis.
Definition of Data
The Golub Capital Altman Index is based on the median firms’ two-month Y-o-Y growth rate of revenues and EBITDA. Unlike a mean or weighted-mean, a median value is not influenced by outliers and is a simple and widely-accepted measure of the sample’s performance. For example, when Standard & Poor’s reports the financial performance of global industrial companies by rating classification, it chooses the 50th percentile median firm as representative of the wider sample of rated companies.
In addition to the 50th percentile median, performance statistics on the 10th, 25th, 75th, and 90th percentile firms are provided below in order to demonstrate the entire distribution of our sample’s performance from 2012-2014.
Performance Statisticsiv
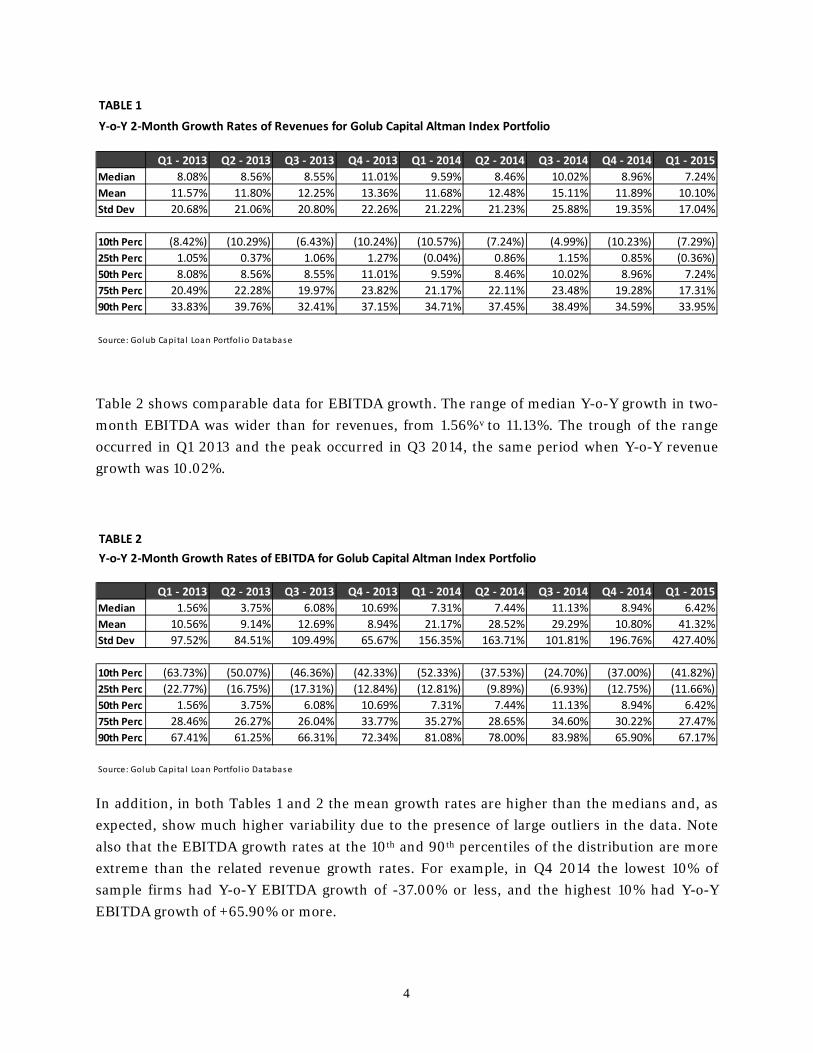
Table 1 shows the first two months of each quarter’s Y-o-Y median growth rate in revenues of the Golub Capital portfolio for Q1 2013 through Q1 2015. Notably, the median two-month rate of growth of revenues for the nine Y-o-Y periods had a narrow range between 7.24% and 11.01%. As noted above, in addition to the median growth rate, the distribution of revenue growth at the 10th, 25th, 75th, and 90th percentile levels is also provided. For example, in Q4 2014, the worst performing, lowest 10%, of sample firms had negative growth rates of -10.23% or less, and the best performing, highest 10%, had positive growth rates of +34.59% or more.
4
Table 2 shows comparable data for EBITDA growth. The range of median Y-o-Y growth in two-month EBITDA was wider than for revenues, from 1.56%v to 11.13%. The trough of the range occurred in Q1 2013 and the peak occurred in Q3 2014, the same period when Y-o-Y revenue growth was 10.02%.
In addition, in both Tables 1 and 2 the mean growth rates are higher than the medians and, as expected, show much higher variability due to the presence of large outliers in the data. Note also that the EBITDA growth rates at the 10th and 90th percentiles of the distribution are more extreme than the related revenue growth rates. For example, in Q4 2014 the lowest 10% of sample firms had Y-o-Y EBITDA growth of -37.00% or less, and the highest 10% had Y-o-Y EBITDA growth of +65.90% or more.
TABLE 1
Y-o-Y 2-Month Growth Rates of Revenues for Golub Capital Altman Index Portfolio
Q1 - 2013 Q2 - 2013 Q3 - 2013 Q4 - 2013 Q1 - 2014 Q2 - 2014 Q3 - 2014 Q4 - 2014 Q1 - 2015Median 8.08% 8.56% 8.55% 11.01% 9.59% 8.46% 10.02% 8.96% 7.24%Mean 11.57% 11.80% 12.25% 13.36% 11.68% 12.48% 15.11% 11.89% 10.10%Std Dev 20.68% 21.06% 20.80% 22.26% 21.22% 21.23% 25.88% 19.35% 17.04%
10th Perc (8.42%) (10.29%) (6.43%) (10.24%) (10.57%) (7.24%) (4.99%) (10.23%) (7.29%)25th Perc 1.05% 0.37% 1.06% 1.27% (0.04%) 0.86% 1.15% 0.85% (0.36%)50th Perc 8.08% 8.56% 8.55% 11.01% 9.59% 8.46% 10.02% 8.96% 7.24%75th Perc 20.49% 22.28% 19.97% 23.82% 21.17% 22.11% 23.48% 19.28% 17.31%90th Perc 33.83% 39.76% 32.41% 37.15% 34.71% 37.45% 38.49% 34.59% 33.95%
Source: Golub Capita l Loan Portfol io Database
TABLE 2Y-o-Y 2-Month Growth Rates of EBITDA for Golub Capital Altman Index Portfolio
Q1 - 2013 Q2 - 2013 Q3 - 2013 Q4 - 2013 Q1 - 2014 Q2 - 2014 Q3 - 2014 Q4 - 2014 Q1 - 2015Median 1.56% 3.75% 6.08% 10.69% 7.31% 7.44% 11.13% 8.94% 6.42%Mean 10.56% 9.14% 12.69% 8.94% 21.17% 28.52% 29.29% 10.80% 41.32%Std Dev 97.52% 84.51% 109.49% 65.67% 156.35% 163.71% 101.81% 196.76% 427.40%
10th Perc (63.73%) (50.07%) (46.36%) (42.33%) (52.33%) (37.53%) (24.70%) (37.00%) (41.82%)25th Perc (22.77%) (16.75%) (17.31%) (12.84%) (12.81%) (9.89%) (6.93%) (12.75%) (11.66%)50th Perc 1.56% 3.75% 6.08% 10.69% 7.31% 7.44% 11.13% 8.94% 6.42%75th Perc 28.46% 26.27% 26.04% 33.77% 35.27% 28.65% 34.60% 30.22% 27.47%90th Perc 67.41% 61.25% 66.31% 72.34% 81.08% 78.00% 83.98% 65.90% 67.17%
Source: Golub Capita l Loan Portfol io Database
5
CORRELATION WITH OTHER WELL-KNOWN INDICATORS
The Golub Capital Altman Index can be used by economists, financial analysts and other market practitioners in their analysis and forecasting of key financial measures.
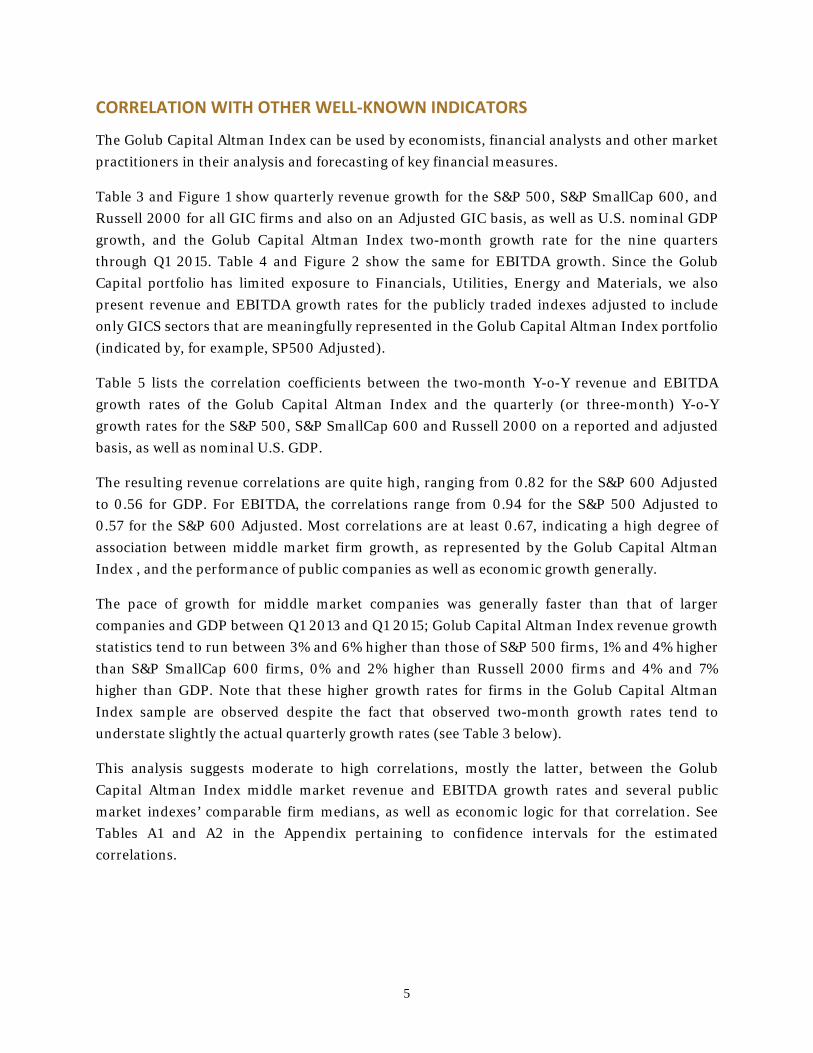
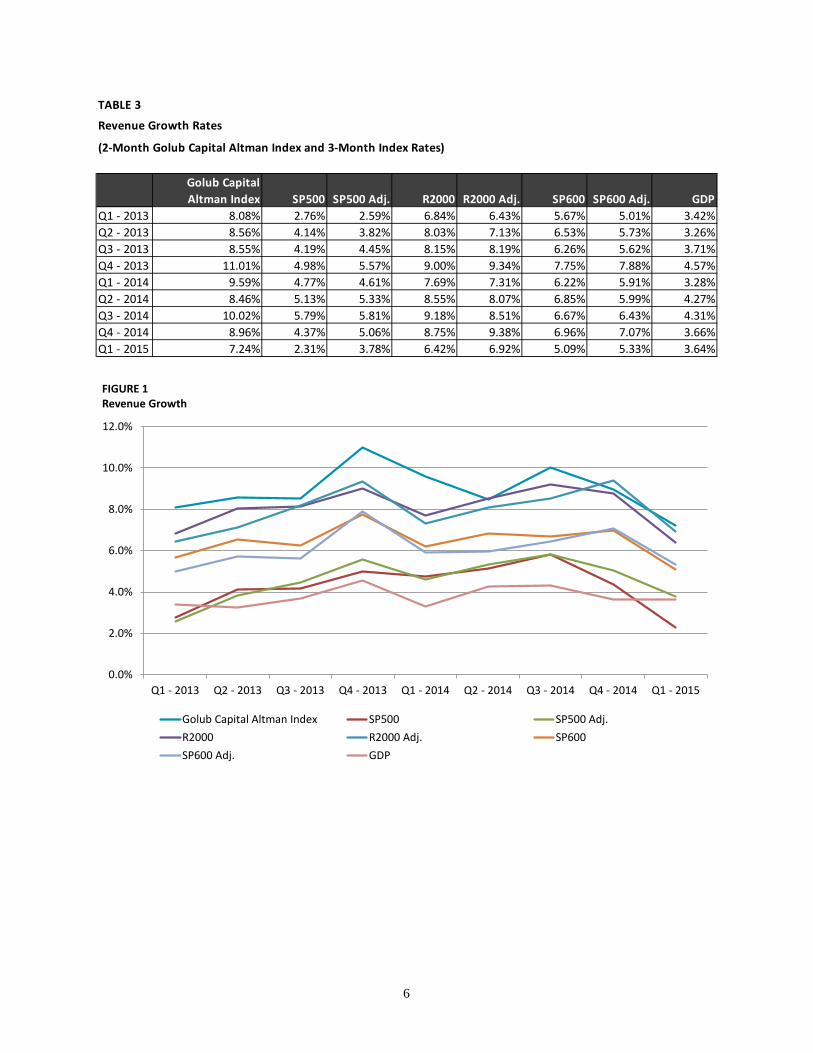
Table 3 and Figure 1 show quarterly revenue growth for the S&P 500, S&P SmallCap 600, and Russell 2000 for all GIC firms and also on an Adjusted GIC basis, as well as U.S. nominal GDP growth, and the Golub Capital Altman Index two-month growth rate for the nine quarters through Q1 2015. Table 4 and Figure 2 show the same for EBITDA growth. Since the Golub Capital portfolio has limited exposure to Financials, Utilities, Energy and Materials, we also present revenue and EBITDA growth rates for the publicly traded indexes adjusted to include only GICS sectors that are meaningfully represented in the Golub Capital Altman Index portfolio (indicated by, for example, SP500 Adjusted).
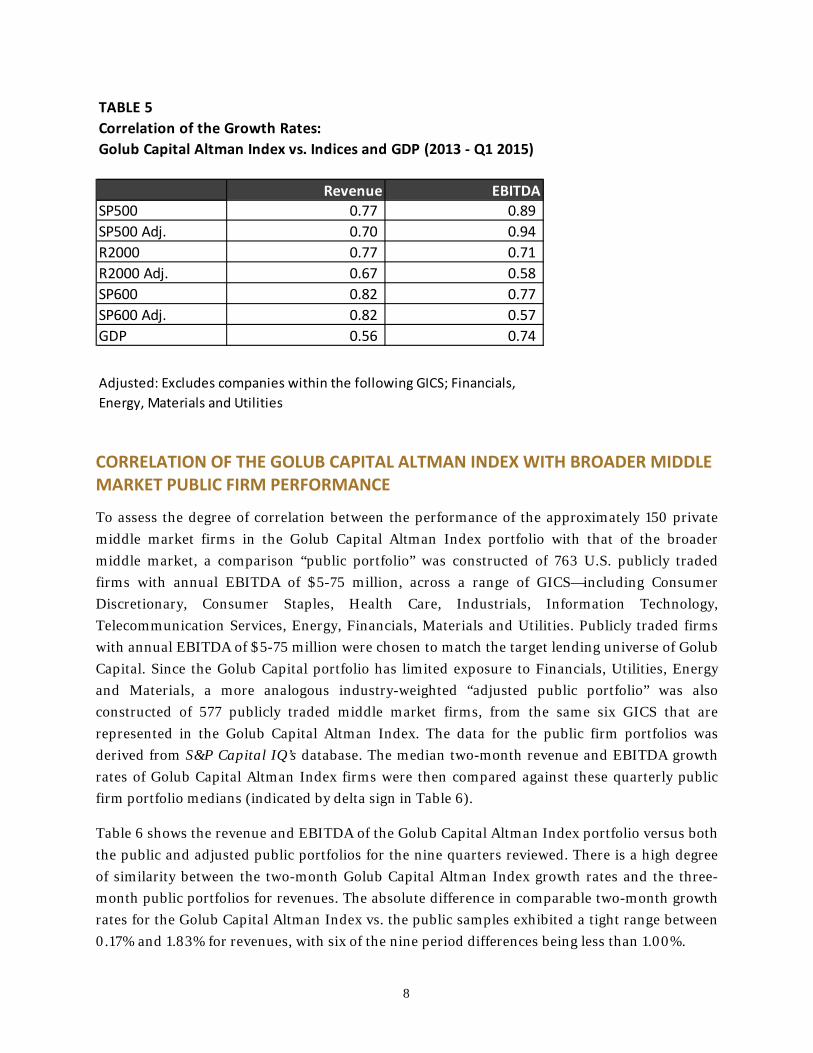
Table 5 lists the correlation coefficients between the two-month Y-o-Y revenue and EBITDA growth rates of the Golub Capital Altman Index and the quarterly (or three-month) Y-o-Y growth rates for the S&P 500, S&P SmallCap 600 and Russell 2000 on a reported and adjusted basis, as well as nominal U.S. GDP.
The resulting revenue correlations are quite high, ranging from 0.82 for the S&P 600 Adjusted to 0.56 for GDP. For EBITDA, the correlations range from 0.94 for the S&P 500 Adjusted to 0.57 for the S&P 600 Adjusted. Most correlations are at least 0.67, indicating a high degree of association between middle market firm growth, as represented by the Golub Capital Altman Index , and the performance of public companies as well as economic growth generally.
The pace of growth for middle market companies was generally faster than that of larger companies and GDP between Q1 2013 and Q1 2015; Golub Capital Altman Index revenue growth statistics tend to run between 3% and 6% higher than those of S&P 500 firms, 1% and 4% higher than S&P SmallCap 600 firms, 0% and 2% higher than Russell 2000 firms and 4% and 7% higher than GDP. Note that these higher growth rates for firms in the Golub Capital Altman Index sample are observed despite the fact that observed two-month growth rates tend to understate slightly the actual quarterly growth rates (see Table 3 below).
This analysis suggests moderate to high correlations, mostly the latter, between the Golub Capital Altman Index middle market revenue and EBITDA growth rates and several public market indexes’ comparable firm medians, as well as economic logic for that correlation. See Tables A1 and A2 in the Appendix pertaining to confidence intervals for the estimated correlations.
6
TABLE 3
Revenue Growth Rates
(2-Month Golub Capital Altman Index and 3-Month Index Rates)
Golub Capital Altman Index SP500 SP500 Adj. R2000 R2000 Adj. SP600 SP600 Adj. GDP
Q1 - 2013 8.08% 2.76% 2.59% 6.84% 6.43% 5.67% 5.01% 3.42%Q2 - 2013 8.56% 4.14% 3.82% 8.03% 7.13% 6.53% 5.73% 3.26%Q3 - 2013 8.55% 4.19% 4.45% 8.15% 8.19% 6.26% 5.62% 3.71%Q4 - 2013 11.01% 4.98% 5.57% 9.00% 9.34% 7.75% 7.88% 4.57%Q1 - 2014 9.59% 4.77% 4.61% 7.69% 7.31% 6.22% 5.91% 3.28%Q2 - 2014 8.46% 5.13% 5.33% 8.55% 8.07% 6.85% 5.99% 4.27%Q3 - 2014 10.02% 5.79% 5.81% 9.18% 8.51% 6.67% 6.43% 4.31%Q4 - 2014 8.96% 4.37% 5.06% 8.75% 9.38% 6.96% 7.07% 3.66%Q1 - 2015 7.24% 2.31% 3.78% 6.42% 6.92% 5.09% 5.33% 3.64%
0.0%
2.0%
4.0%
6.0%
8.0%
10.0%
12.0%
Q1 - 2013 Q2 - 2013 Q3 - 2013 Q4 - 2013 Q1 - 2014 Q2 - 2014 Q3 - 2014 Q4 - 2014 Q1 - 2015
FIGURE 1 Revenue Growth
Golub Capital Altman Index SP500 SP500 Adj.R2000 R2000 Adj. SP600SP600 Adj. GDP

7
TABLE 4EBITDA Growth Rates(2-Month Golub Capital Altman Index and 3-Month Index Rates)
Golub Capital Altman Index SP500 SP500 Adj. R2000 R2000 Adj. SP600 SP600 Adj. GDP
Q1 - 2013 1.56% 3.76% 3.65% 5.16% 4.31% 4.93% 5.16% 3.42%Q2 - 2013 3.75% 5.20% 5.04% 6.95% 6.44% 7.00% 6.32% 3.26%Q3 - 2013 6.08% 6.23% 6.33% 7.50% 6.67% 7.59% 6.18% 3.71%Q4 - 2013 10.69% 7.05% 8.19% 6.70% 5.17% 8.58% 7.05% 4.57%Q1 - 2014 7.31% 6.82% 6.03% 7.55% 5.54% 5.51% 3.65% 3.28%Q2 - 2014 7.44% 7.97% 7.94% 8.93% 7.74% 6.78% 5.43% 4.27%Q3 - 2014 11.13% 9.08% 8.33% 11.42% 10.19% 10.14% 9.40% 4.31%Q4 - 2014 8.94% 7.58% 7.58% 9.42% 9.42% 8.02% 8.17% 3.66%Q1 - 2015 6.42% 5.26% 6.85% 6.75% 7.27% 5.56% 6.78% 3.64%
Adjusted: Excludes companies within the following GICs; Financials, Energy, Materials and Utilities
0.0%
2.0%
4.0%
6.0%
8.0%
10.0%
12.0%
Q1 - 2013 Q2 - 2013 Q3 - 2013 Q4 - 2013 Q1 - 2014 Q2 - 2014 Q3 - 2014 Q4 - 2014 Q1 - 2015
FIGURE 2 EBITDA Growth
Golub Capital Altman Index SP500 SP500 Adj.R2000 R2000 Adj. SP600SP600 Adj. GDP
8
CORRELATION OF THE GOLUB CAPITAL ALTMAN INDEX WITH BROADER MIDDLE MARKET PUBLIC FIRM PERFORMANCE
To assess the degree of correlation between the performance of the approximately 150 private middle market firms in the Golub Capital Altman Index portfolio with that of the broader middle market, a comparison “public portfolio” was constructed of 763 U.S. publicly traded firms with annual EBITDA of $5-75 million, across a range of GICS—including Consumer Discretionary, Consumer Staples, Health Care, Industrials, Information Technology, Telecommunication Services, Energy, Financials, Materials and Utilities. Publicly traded firms with annual EBITDA of $5-75 million were chosen to match the target lending universe of Golub Capital. Since the Golub Capital portfolio has limited exposure to Financials, Utilities, Energy and Materials, a more analogous industry-weighted “adjusted public portfolio” was also constructed of 577 publicly traded middle market firms, from the same six GICS that are represented in the Golub Capital Altman Index. The data for the public firm portfolios was derived from S&P Capital IQ’s database. The median two-month revenue and EBITDA growth rates of Golub Capital Altman Index firms were then compared against these quarterly public firm portfolio medians (indicated by delta sign in Table 6).
Table 6 shows the revenue and EBITDA of the Golub Capital Altman Index portfolio versus both the public and adjusted public portfolios for the nine quarters reviewed. There is a high degree of similarity between the two-month Golub Capital Altman Index growth rates and the three-month public portfolios for revenues. The absolute difference in comparable two-month growth rates for the Golub Capital Altman Index vs. the public samples exhibited a tight range between 0.17% and 1.83% for revenues, with six of the nine period differences being less than 1.00%.
Revenue EBITDASP500 0.77 0.89 SP500 Adj. 0.70 0.94 R2000 0.77 0.71 R2000 Adj. 0.67 0.58 SP600 0.82 0.77 SP600 Adj. 0.82 0.57 GDP 0.56 0.74
TABLE 5Correlation of the Growth Rates:Golub Capital Altman Index vs. Indices and GDP (2013 - Q1 2015)
Adjusted: Excludes companies within the following GICS; Financials, Energy, Materials and Utilities

9
The Golub Capital Altman Index portfolio had higher revenue growth rates than the public portfolios in seven of the nine periods (eight of the nine when compared to the adjusted public portfolios). The differences are greater for the EBITDA comparisons, but here again the changes from one period to the next in our time series are highly correlated, indicating that the two metrics tend to move together. It can also be seen that the absolute EBITDA growth rates for the Golub Capital Altman Index sample were consistently greater than those of the publicly owned firm sample. A statistical analysis of these differences is presented in tables A3 and A4 in the Appendix.
The absolute and relative comparisons between the adjusted public sample and the Golub Capital Altman Index portfolio show some significant differences for both revenue and EBITDA growth, as shown in Table 6. However, the changes from one two-month growth period to the next are also moderately correlated (0.54 for revenue and 0.65 for EBITDA), indicating that the two metrics tend to move together. A statistical analysis of this is presented in tables A5 and A6 in the Appendix.
Two-Month Growth Rates are Predictive of Quarterly Rates
We conducted careful historical comparisons between the two-month and three-month growth rates in order to determine whether the performance captured by the Golub Capital Altman Index (i.e. two-month growth rates) offered useful projections of the quarterly revenue and earnings performance of the relevant portfolio.
Tables 7 and 8 (and A7 and A8 in the Appendix) show the Golub Capital Altman Index two-month calculations compared to the quarterly financials for the nine quarters between Q1 2013 and Q1 2015 for revenues and EBITDA, respectively. There is a high degree of correlation, 0.85,
Middle-Market Firm Comparison
Revenue EBITDAGCAI Public Public Adj. GCAI Public Public Adj.
Q1 - 2013 8.08% 7.22% 0.87% 6.68% 1.40% 1.56% (1.69%) 3.25% (2.83%) 4.39%Q2 - 2013 8.56% 7.83% 0.74% 7.52% 1.04% 3.75% 1.46% 2.30% 0.91% 2.84%Q3 - 2013 8.55% 8.37% 0.17% 7.11% 1.43% 6.08% 2.16% 3.92% 1.83% 4.25%Q4 - 2013 11.01% 9.31% 1.70% 8.15% 2.86% 10.69% 2.23% 8.46% 1.47% 9.22%Q1 - 2014 9.59% 7.76% 1.83% 7.19% 2.40% 7.31% (1.94%) 9.26% (3.13%) 10.45%Q2 - 2014 8.46% 8.65% (0.19%) 7.81% 0.65% 7.44% 4.15% 3.29% 3.88% 3.55%Q3 - 2014 10.02% 9.09% 0.93% 8.18% 1.84% 11.13% 8.15% 2.98% 6.85% 4.28%Q4 - 2014 8.96% 9.39% (0.43%) 9.49% (0.54%) 8.94% 5.41% 3.54% 6.33% 2.61%Q1 - 2015 7.24% 6.07% 1.17% 6.39% 0.85% 6.42% 2.05% 4.37% 2.08% 4.34%
Correlation 0.75 0.54 0.69 0.65
(Golub Capital Altman Index vs Publicly Owned Firms with EBITDA of $5 - $75 MM)
TABLE 6
10
between EBITDA figures. While the two-month and three-month figures are not independent and would therefore be expected to show small differences and reasonable correlations, the data confirms that this is indeed the case and to a very high degree for EBITDA growth. The comparisons, while relatively close in absolute percentages, show less correlation, 0.54, for revenue growth.
It appears that the Golub Capital Altman Index portfolio’s third-month growth rate is consistently higher than the average for the two-month period, especially for revenue growth. The mean difference in Y-o-Y growth rates was 1.5% and the growth was higher for the actual quarterly data than the two month calculation in every comparison. This could mean that for the constituents of the Golub Capital Altman Index there is a widespread tendency towards higher sales and earnings in the third month of the quarter, and/or that sales and earnings were growing over the sample period, even from month to month. We also note that this is currently only a comparison of actual numbers and not a forecasting model.
The two-month and three-month revenue growths are quite similar in their absolute levels but their average growth rates are statistically significantly different at the 5% significance level as shown in Table A7 in the Appendix, and exhibit only moderate correlation, whereas the two-month and three-month average EBITDA growth rates are not significantly different at the 5% significance level as shown in Table A8 in the Appendix and exhibit very high correlation. Tables A7 and A8 also show confidence intervals for the estimated correlations.
It can therefore be concluded that the EBITDA growth rate produced from the two-month period is closely representative of the three-month period. The relationship is less significant between the two and three months growth in revenues, where the correlations are moderate, but again, the absolute levels are for the most part, quite similar.

11
TABLE 7Growth Rate in Revenues(Golub Capital Altman Index - 2 Month vs. 3 Month)
3 Month 2 Month Q1 - 2013 8.14% 8.08% 0.05%Q2 - 2013 9.42% 8.56% 0.86%Q3 - 2013 11.83% 8.55% 3.28%Q4 - 2013 11.28% 11.01% 0.27%Q1 - 2014 11.10% 9.59% 1.50%Q2 - 2014 12.13% 8.46% 3.67%Q3 - 2014 10.54% 10.02% 0.52%Q4 - 2014 12.12% 8.96% 3.16%Q1 - 2015 7.40% 7.24% 0.17%
Mean 10.44% 8.94% 1.50%Correlation 0.54
Source: Golub Capital Loan Portfolio Database
Growth Rate in EBITDA(Golub Capital Altman Index - 2 Month vs. 3 Month)
3 Month 2 Month
Q1 - 2013 0.99% 1.56% (0.57%)
Q2 - 2013 4.81% 3.75% 1.05%
Q3 - 2013 8.68% 6.08% 2.60%
Q4 - 2013 9.57% 10.69% (1.12%)
Q1 - 2014 7.67% 7.31% 0.36%
Q2 - 2014 12.58% 7.44% 5.14%
Q3 - 2014 13.01% 11.13% 1.88%
Q4 - 2014 13.09% 8.94% 4.15%
Q1 - 2015 5.47% 6.42% (0.95%)
Mean 8.43% 7.04% 1.39%
Correlation 0.85
Source: Golub Capital Loan Portfolio Database
TABLE 8
12
SAMPLE SIZE
Consistent data requirements from our sample companies and the fact that we are calculating Y-o-Y growth rates precluded more data points from before the Q1 2012 period. The results look very promising for this sample size, and we are fairly confident that our conclusions will hold over time. We intend to add to our sample size and conduct additional tests as new data becomes available.
i. Dr. Altman and Dr. Benhenni would like to thank Mr. Scott Fishman of Golub Capital for his helpful assistance. ii. The U.S. Small Business Administration defines small businesses as those with less than 500 employees. According to the SBA, small
businesses account for 49.2% of U.S. private sector employment and 64% of net new private sector jobs. Most of the companies that comprise the Golub Capital Altman Index meet the definition of small business according the SBA.
iii. It was observed that a relatively small proportion—less than 10 percent—of Golub Capital’s loan portfolio of approximately 150 firms had EBITDA less than $5 million in the sample period 2012-2014.
iv. Data for the Golub Capital Altman Index as of 4/3/15. Data for all public companies as of 6/2/15. v. A single extreme outlier for EBITDA was removed from the data set in Q1-2013 as it distorted our calculations of the mean and standard
deviation. However, as expected, it had no effect on our main statistical metric (the median).
13
APPENDIX Supplemental Statistics on the Golub Capital Altman Index
and Comparisons with Others Indexes Statistical tests are now computed for the different data sets described in the text. They consist of: 1. Confidence Intervals for the correlations: In addition to the estimated correlations, confidence intervals at the 95% and 90% confidence levels (that is, how frequently the observed intervals contain the true correlation parameter) describing the reliability of our estimates are constructed specifying a range of values within which the true correlation is estimated to lie. Note that the length of the computed confidence intervals is large due to the small sample size of our data, but this will shrink once we increase our sample size as new data becomes available. Additionally, as the construction of the correlation confidence interval relies on an approximation whose precision is based on a larger sample size, a more accurate confidence interval will occur as new data is collected. 2. Hypothesis Testing for the Differences of Means: The widely known statistical t-test is used for testing the difference between the means of two samples. It measures the size of the differences relative to the variation in the sample data; the greater the magnitude of the t-statistic, the greater the evidence against the null hypothesis that there is no significant difference between the two means. A threshold value of 5%, representing the significance level of the test, is typically chosen. A p-value is a function of the observed t-statistic that can be directly compared to the significance level of 5%. If a p-value is less than the 5% significance level, it suggests that the observed data are inconsistent with the assumption that the two means are equal, and therefore the alternative hypothesis that the two means are different is accepted. A p-value greater than the 5% significance level indicates weak evidence against the hypothesis that the two means are equal and hence the hypothesis that the two means are equal cannot be rejected. On using the two-sample t-test, the usual conditions such as normally distributed populations are assumed to be held. For the difference between the means of the Golub Capital Altman Index 3 Month vs 2 Month, the proper t-test with dependent populations is used as we are dealing with the same population. For the difference between the means of the Golub Capital Altman Index Private and Public, the independence assumption can be made since the firms in the private Golub Capital Altman Index sample are different from the public Mid-Market firms and the corresponding t-test is computed accordingly.

14
At both the 95% and 90% confidence levels, we note that for the growth rates in revenues, it is statistically possible for the GDP to have negative correlation with Golub Capital Altman Index given the small sample size. However, we believe that this possibility of negative correlation will disappear as more data is collected. For the current sample size, we observe that all of the other confidence intervals do not cover negative correlations.
Revenues Growth CorrelationCorrelation 95% C.I.** 90% C.I.**
SP500 0.77 (0.22, 0.95) (0.34, 0.94)SP500 Adj.* 0.70 (0.06, 0.93) (0.19, 0.91)R2000 0.77 (0.22, 0.95) (0.34, 0.94)R2000 Adj.* 0.67 (0.01, 0.92) (0.14, 0.90)SP600 0.82 (0.33, 0.96) (0.44, 0.95)SP600-Adj.* 0.82 (0.33, 0.96) (0.44, 0.95)GDP 0.56 (-0.16, 0.89) (-0.04, 0.86)
* Excluding Financia ls , Energy, Materia ls and Uti l i ties
** Confidence Interva l
TABLE A1
Correlation of the Growth Rates in Revenues: Golub Capital Altman Index vs. Filing Companies of Popular Stock Market Indices and GDP
15
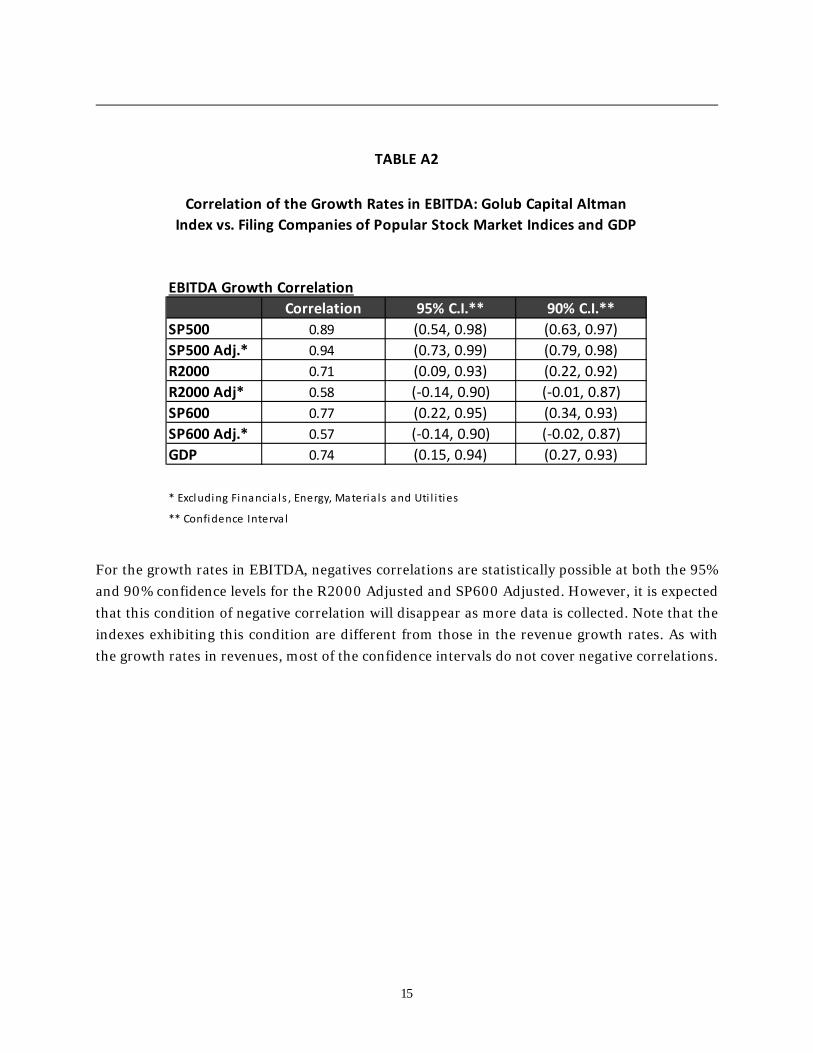
For the growth rates in EBITDA, negatives correlations are statistically possible at both the 95% and 90% confidence levels for the R2000 Adjusted and SP600 Adjusted. However, it is expected that this condition of negative correlation will disappear as more data is collected. Note that the indexes exhibiting this condition are different from those in the revenue growth rates. As with the growth rates in revenues, most of the confidence intervals do not cover negative correlations.
EBITDA Growth CorrelationCorrelation 95% C.I.** 90% C.I.**
SP500 0.89 (0.54, 0.98) (0.63, 0.97)SP500 Adj.* 0.94 (0.73, 0.99) (0.79, 0.98)R2000 0.71 (0.09, 0.93) (0.22, 0.92)R2000 Adj* 0.58 (-0.14, 0.90) (-0.01, 0.87)SP600 0.77 (0.22, 0.95) (0.34, 0.93)SP600 Adj.* 0.57 (-0.14, 0.90) (-0.02, 0.87)GDP 0.74 (0.15, 0.94) (0.27, 0.93)
* Excluding Financia ls , Energy, Materia ls and Uti l i ties
** Confidence Interva l
TABLE A2
Correlation of the Growth Rates in EBITDA: Golub Capital Altman Index vs. Filing Companies of Popular Stock Market Indices and GDP
16
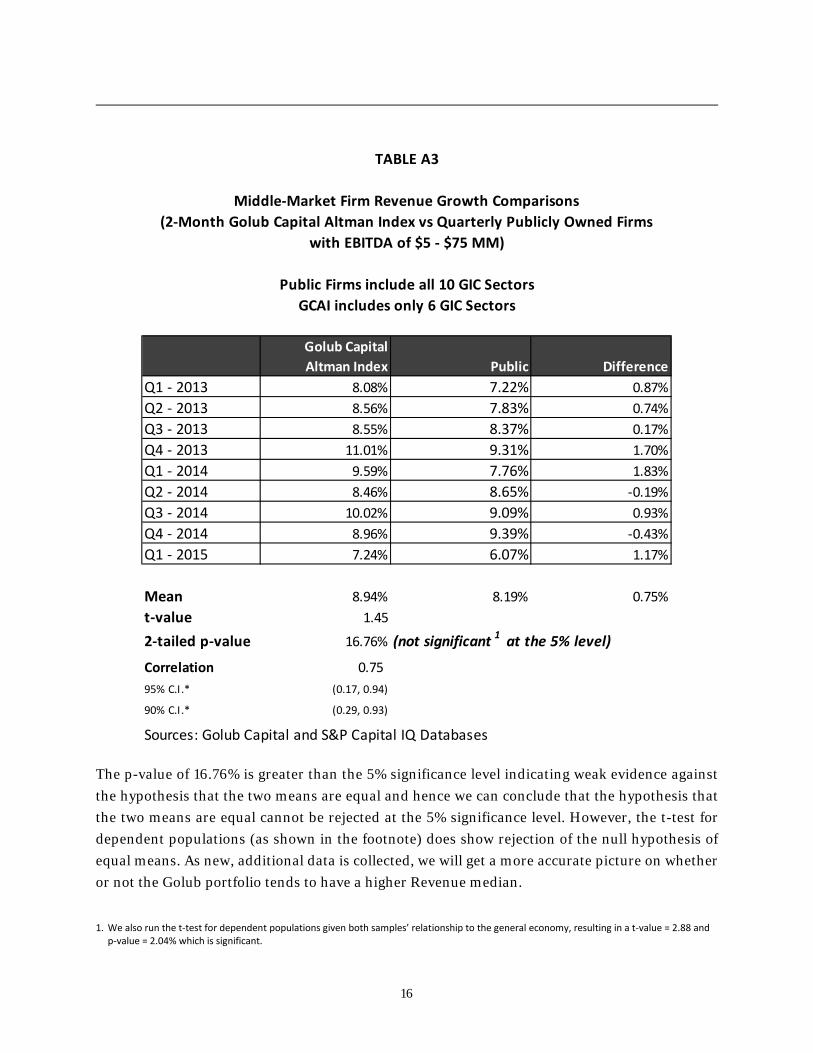
The p-value of 16.76% is greater than the 5% significance level indicating weak evidence against the hypothesis that the two means are equal and hence we can conclude that the hypothesis that the two means are equal cannot be rejected at the 5% significance level. However, the t-test for dependent populations (as shown in the footnote) does show rejection of the null hypothesis of equal means. As new, additional data is collected, we will get a more accurate picture on whether or not the Golub portfolio tends to have a higher Revenue median.
1. We also run the t-test for dependent populations given both samples’ relationship to the general economy, resulting in a t-value = 2.88 and p-value = 2.04% which is significant.
Middle-Market Firm Revenue Growth Comparisons(2-Month Golub Capital Altman Index vs Quarterly Publicly Owned Firms
with EBITDA of $5 - $75 MM)
Public Firms include all 10 GIC SectorsGCAI includes only 6 GIC Sectors
Golub Capital Altman Index Public Difference
Q1 - 2013 8.08% 7.22% 0.87%Q2 - 2013 8.56% 7.83% 0.74%Q3 - 2013 8.55% 8.37% 0.17%Q4 - 2013 11.01% 9.31% 1.70%Q1 - 2014 9.59% 7.76% 1.83%Q2 - 2014 8.46% 8.65% -0.19%Q3 - 2014 10.02% 9.09% 0.93%Q4 - 2014 8.96% 9.39% -0.43%Q1 - 2015 7.24% 6.07% 1.17%
Mean 8.94% 8.19% 0.75%t-value 1.45
2-tailed p-value 16.76% (not significant 1 at the 5% level)
Correlation 0.75 95% C.I.* (0.17, 0.94)
90% C.I.* (0.29, 0.93)
Sources: Golub Capital and S&P Capital IQ Databases
TABLE A3
17
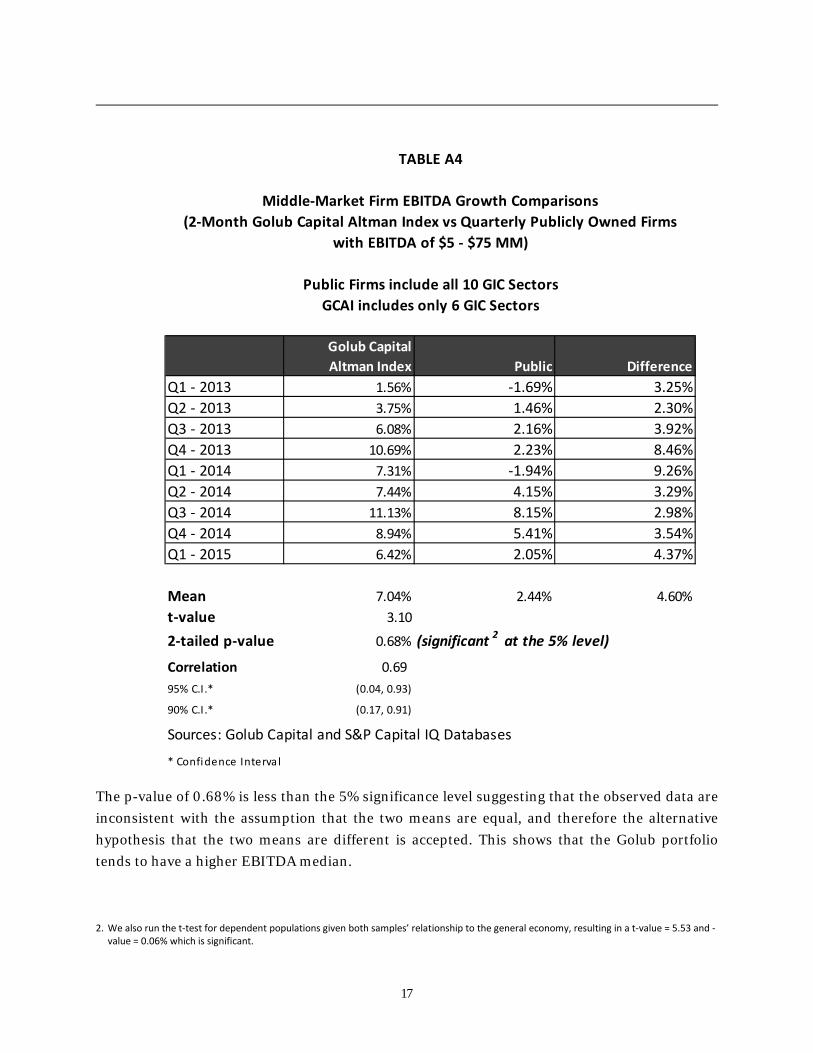
The p-value of 0.68% is less than the 5% significance level suggesting that the observed data are inconsistent with the assumption that the two means are equal, and therefore the alternative hypothesis that the two means are different is accepted. This shows that the Golub portfolio tends to have a higher EBITDA median.
2. We also run the t-test for dependent populations given both samples’ relationship to the general economy, resulting in a t-value = 5.53 and -
value = 0.06% which is significant.
Middle-Market Firm EBITDA Growth Comparisons(2-Month Golub Capital Altman Index vs Quarterly Publicly Owned Firms
with EBITDA of $5 - $75 MM)
Public Firms include all 10 GIC SectorsGCAI includes only 6 GIC Sectors
Golub Capital Altman Index Public Difference
Q1 - 2013 1.56% -1.69% 3.25%Q2 - 2013 3.75% 1.46% 2.30%Q3 - 2013 6.08% 2.16% 3.92%Q4 - 2013 10.69% 2.23% 8.46%Q1 - 2014 7.31% -1.94% 9.26%Q2 - 2014 7.44% 4.15% 3.29%Q3 - 2014 11.13% 8.15% 2.98%Q4 - 2014 8.94% 5.41% 3.54%Q1 - 2015 6.42% 2.05% 4.37%
Mean 7.04% 2.44% 4.60%t-value 3.10
2-tailed p-value 0.68% (significant 2 at the 5% level)
Correlation 0.69 95% C.I.* (0.04, 0.93)
90% C.I.* (0.17, 0.91)
Sources: Golub Capital and S&P Capital IQ Databases
* Confidence Interva l
TABLE A4
18
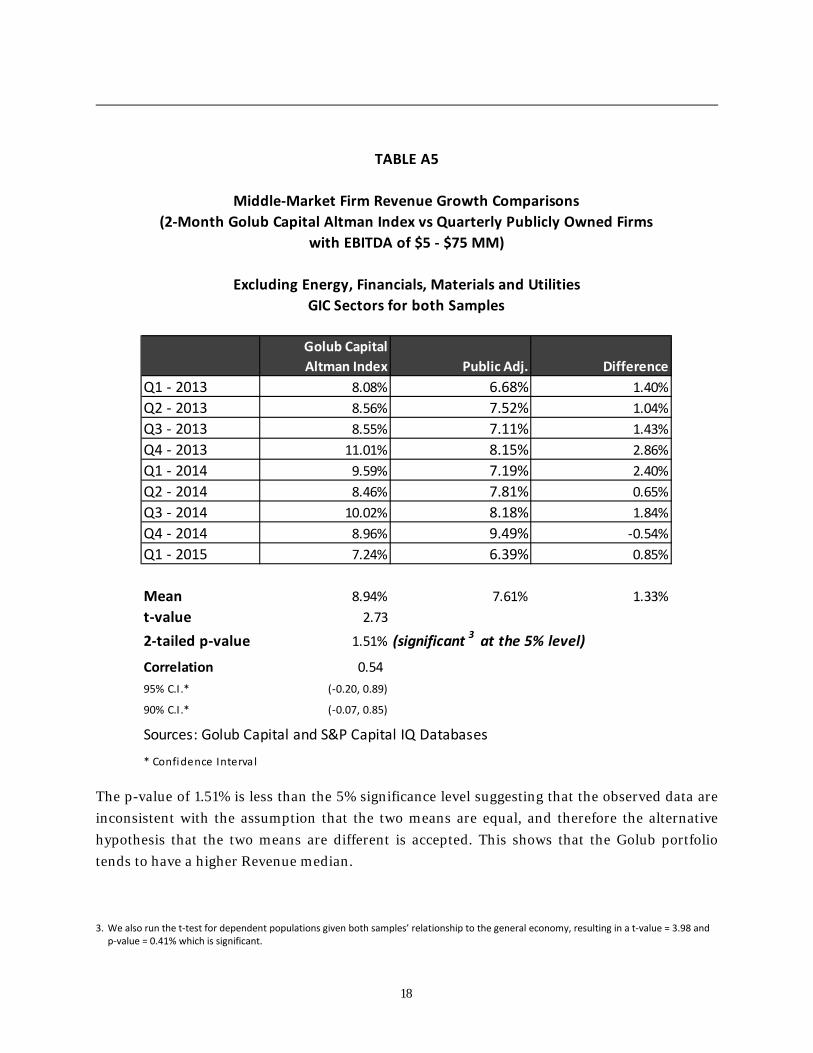
The p-value of 1.51% is less than the 5% significance level suggesting that the observed data are inconsistent with the assumption that the two means are equal, and therefore the alternative hypothesis that the two means are different is accepted. This shows that the Golub portfolio tends to have a higher Revenue median.
3. We also run the t-test for dependent populations given both samples’ relationship to the general economy, resulting in a t-value = 3.98 and p-value = 0.41% which is significant.
Middle-Market Firm Revenue Growth Comparisons(2-Month Golub Capital Altman Index vs Quarterly Publicly Owned Firms
with EBITDA of $5 - $75 MM)
Excluding Energy, Financials, Materials and UtilitiesGIC Sectors for both Samples
Golub Capital Altman Index Public Adj. Difference
Q1 - 2013 8.08% 6.68% 1.40%Q2 - 2013 8.56% 7.52% 1.04%Q3 - 2013 8.55% 7.11% 1.43%Q4 - 2013 11.01% 8.15% 2.86%Q1 - 2014 9.59% 7.19% 2.40%Q2 - 2014 8.46% 7.81% 0.65%Q3 - 2014 10.02% 8.18% 1.84%Q4 - 2014 8.96% 9.49% -0.54%Q1 - 2015 7.24% 6.39% 0.85%
Mean 8.94% 7.61% 1.33%t-value 2.73
2-tailed p-value 1.51% (significant 3 at the 5% level)
Correlation 0.54 95% C.I.* (-0.20, 0.89)
90% C.I.* (-0.07, 0.85)
Sources: Golub Capital and S&P Capital IQ Databases
* Confidence Interva l
TABLE A5

19
The p-value of 0.47% is less than the 5% significance level suggesting that the observed data are inconsistent with the assumption that the two means are equal, and therefore the alternative hypothesis that the two means are different is accepted. This shows that the Golub portfolio tends to have a higher EBITDA median. 4. We also run the t-test for dependent populations given both samples’ relationship to the general economy, resulting in a t-value = 5.51 and
p-value = 0.06% which is significant.
Middle-Market Firm EBITDA Growth Comparisons(2-Month Golub Capital Altman Index vs Quarterly Publicly Owned Firms
with EBITDA of $5 - $75 MM)
Excluding Energy, Financials, Materials and UtilitiesGIC Sectors for both Samples
Golub Capital Altman Index Public Adj. Difference
Q1 - 2013 1.56% -2.83% 4.39%Q2 - 2013 3.75% 0.91% 2.84%Q3 - 2013 6.08% 1.83% 4.25%Q4 - 2013 10.69% 1.47% 9.22%Q1 - 2014 7.31% -3.13% 10.45%Q2 - 2014 7.44% 3.88% 3.55%Q3 - 2014 11.13% 6.85% 4.28%Q4 - 2014 8.94% 6.33% 2.61%Q1 - 2015 6.42% 2.08% 4.34%
Mean 7.04% 1.93% 5.10%t-value 3.29
2-tailed p-value 0.47% (significant 4 at the 5% level)
Correlation 0.65 95% C.I.* (-0.03, 0.92)
90% C.I.* (0.10, 0.89)
Sources: Golub Capital and S&P Capital IQ Databases
* Confidence Interva l
TABLE A6
20
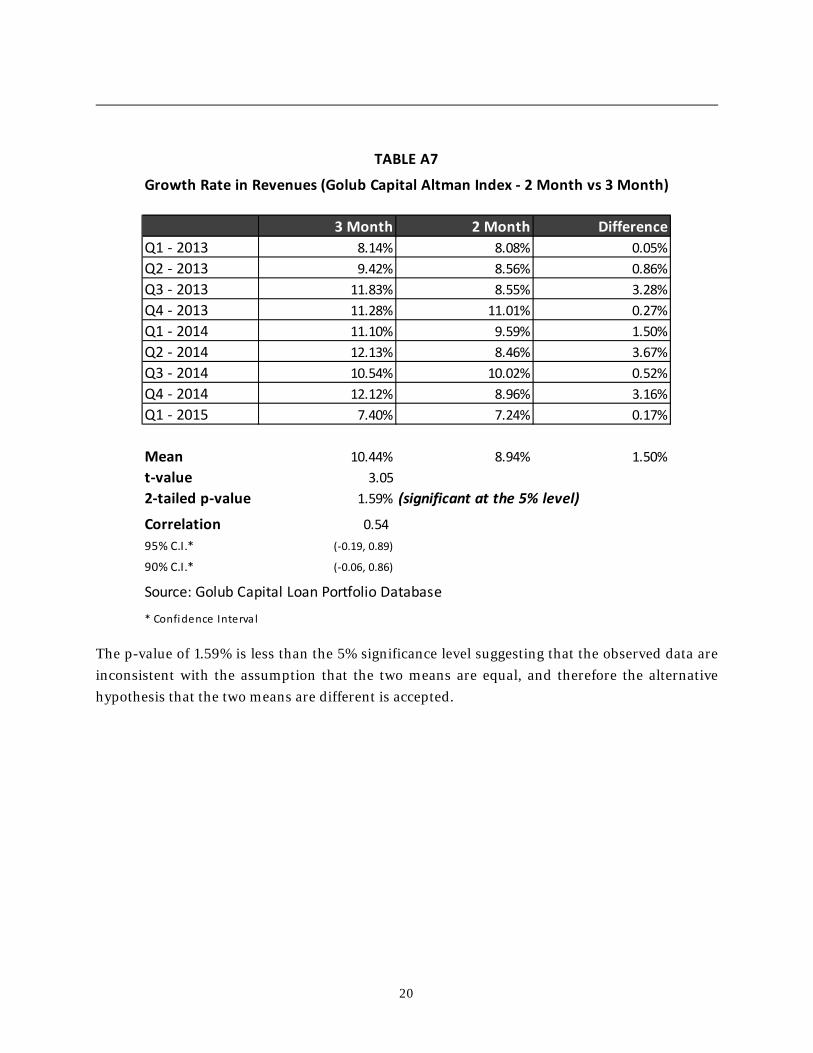
The p-value of 1.59% is less than the 5% significance level suggesting that the observed data are inconsistent with the assumption that the two means are equal, and therefore the alternative hypothesis that the two means are different is accepted.
Growth Rate in Revenues (Golub Capital Altman Index - 2 Month vs 3 Month)
3 Month 2 Month DifferenceQ1 - 2013 8.14% 8.08% 0.05%Q2 - 2013 9.42% 8.56% 0.86%Q3 - 2013 11.83% 8.55% 3.28%Q4 - 2013 11.28% 11.01% 0.27%Q1 - 2014 11.10% 9.59% 1.50%Q2 - 2014 12.13% 8.46% 3.67%Q3 - 2014 10.54% 10.02% 0.52%Q4 - 2014 12.12% 8.96% 3.16%Q1 - 2015 7.40% 7.24% 0.17%
Mean 10.44% 8.94% 1.50%t-value 3.052-tailed p-value 1.59% (significant at the 5% level)
Correlation 0.54 95% C.I.* (-0.19, 0.89)
90% C.I.* (-0.06, 0.86)
Source: Golub Capital Loan Portfolio Database
* Confidence Interva l
TABLE A7

21
The p-value of 9.92% is greater than the 5% significance level indicating weak evidence against the hypothesis that the two means are equal and hence we can conclude that the hypothesis that the two means are equal cannot be rejected at the 5% significance level.
Growth Rate in EBITDA (Golub Capital Altman Index - 2 Month vs 3 Month)
3 Month 2 Month DifferenceQ1 - 2013 0.99% 1.56% -0.57%Q2 - 2013 4.81% 3.75% 1.05%Q3 - 2013 8.68% 6.08% 2.60%Q4 - 2013 9.57% 10.69% -1.12%Q1 - 2014 7.67% 7.31% 0.36%Q2 - 2014 12.58% 7.44% 5.14%Q3 - 2014 13.01% 11.13% 1.88%Q4 - 2014 13.09% 8.94% 4.15%Q1 - 2015 5.47% 6.42% -0.95%
Mean 8.43% 7.04% 1.39%t-value 1.862-tailed p-value 9.92% (not significant at the 5% level)
Correlation 0.85 95% C.I.* (0.43, 0.97)
90% C.I.* (0.53, 0.96)
Source: Golub Capital Loan Portfolio Database
* Confidence Interva l
TABLE A8
22
DISCLAIMER
The information contained in this White Paper represents the current views of the authors and Golub Capital LLC (“Golub Capital”) on the issues discussed as of the date of this publication. The Golub Capital Altman Index is provided as an indicator only, and does not constitute investment advice or the offer to sell or a solicitation to buy any security, or offer any product or service to the reader of this White Paper. Some of these statements constitute forward-looking statements, which may be predictions about future events, future performance, or future financial conditions. Actual results could vary materially from those implied or expressed in such forward-looking statements for any reason. The Golub Capital Altman Index has been created on the basis of information provided by third-party sources that are believed to be reliable, but the information has not been verified independently by the authors or Golub Capital. THE AUTHORS AND GOLUB CAPITAL MAKE NO WARRANTY, WHETHER EXPRESS, IMPLIED OR STATUTORY, OR REPRESENTATION AS TO THE ACCURACY OR COMPLETENESS OF SUCH THIRD-PARTY INFORMATION OR THE INFORMATION IN THIS WHITE PAPER.