the global economic crisis: asia and the role of china
TRANSCRIPT

11
The Global Economic Crisis: The Global Economic Crisis: Asia and the role of ChinaAsia and the role of China
Elliott School of International Affairs,Elliott School of International Affairs,George Washington UniversityGeorge Washington University
March 31, 2009March 31, 2009
Anoop SinghAnoop SinghAsia and Pacific DepartmentAsia and Pacific Department
IMFIMF

22
Five key questionsFive key questions
Why has Asia been hit so hard?Why has Asia been hit so hard?
What is the outlook for Asia?What is the outlook for Asia?
What are the main risks to Asia?What are the main risks to Asia?
What is the role for policies in the region?What is the role for policies in the region?
Is China different?Is China different?

Why has Asia been hit so hard?Why has Asia been hit so hard? 33
A sharp and synchronized collapse in A sharp and synchronized collapse in global growth...global growth...
World Real GDP growthYear-on-year percent change
-2
-1
0
1
2
3
4
5
6
7
8
1970
1973
1976
1979
1982
1985
1988
1991
1994
1997
2000
2003
2006
2009
First oil price shock Banking crisis IT bust
Source: IMF, World Economic Outlook database.
Latin America debt crisis and contractionary policies in industrialized economies

Why has Asia been hit so hard?Why has Asia been hit so hard? 44
...has hit Asia more than we expected...has hit Asia more than we expected
-20
-15
-10
-5
0
G-2 Asia (excl. China and
India)
Asia (excl. China and
India)
2008Q4 GDP Growth1
Quarter-on-quarter percent change, SAAR
Sources: Haver Analytics; and IMF, World Economic Outlook database and staff estimates. 1 PPP GDP Weighted. Does not include New Zealand and Vietnam.
The surprise in actual G-2 growth overNov-08 WEO forecast
…would have implied this revision for Asia based on the model.
But the actual revision was much larger-30
-25
-20
-15
-10
-5
0
Euro
Are
a
Uni
ted
Stat
es
Hon
g Ko
ng S
AR
Japa
n
Sing
apor
e
Kore
a
Taiw
an P
rovi
nce
of C
hina
2008Q4 GDP GrowthQuarter-on-quarter percent change, SAAR
Sources: Haver Analytics; and IMF staff calculations.

Why has Asia been hit so hard?Why has Asia been hit so hard? 55
...reflecting its specialization in ...reflecting its specialization in advanced manufacturingadvanced manufacturing
Canada
United States
Japan
Korea
France
GermanyItalyUnited Kingdom
Netherlands Spain
Mexico
Australia
Taiwan Province of China
Singapore
Malaysia
-30
-25
-20
-15
-10
-5
00.0 2.5 5.0 7.5 10.0 12.5 15.0 17.5 20.0
Share of high and medium-high tech manufacturing value added in GDP
GD
P G
row
th Q
4/20
08 (
SAAR
)
Sources: Haver Analytics; OECD; and IMF staff estimates.
Q4 GDP Growth vs. Share of Advanced Manufacturing in GDP

Why has Asia been hit so hard?Why has Asia been hit so hard? 66
Exports have declined through the Asian Exports have declined through the Asian supply chain, and more than in other regionssupply chain, and more than in other regions
-40
-30
-20
-10
0
Asia (excl. China andIndia, Jan-09)
Major LatinAmerica (Dec-08)
Euro Area(Dec-08)
Exports of Goods1
Year-on-year change; US$ basis
Sources: Haver Analytics; and IMF, World Economic Outlook database and staff calculations. 1 Nominal export share weighted for Asia and Latin America.
-80
-60
-40
-20
0
20
40
60
Jan-
07
Mar
-07
May
-07
Jul-
07
Sep-
07
Nov
-07
Jan-
08
Mar
-08
May
-08
Jul-
08
Sep-
08
Nov
-08
Jan-
09High value-added exporters 1/
Low value-added exporters 2/
Asia: Exports of Goods 3-month percent change of 3-mma, SAAR; US$ basis
Sources: Haver Analytics; CEIC Data Company Ltd.; and IMF staff calculations. 1/ Japan, Hong Kong SAR, Korea, Singapore,Taiwan Province of China and Thailand. 2/ China, India, Indonesia, Malaysia, Philippines, and Vietnam.

Why has Asia been hit so hard?Why has Asia been hit so hard? 77
A double hit for Asia: itA double hit for Asia: it’’s s bothbothexports and domestic demandexports and domestic demand
-6
-4
-2
0
2
4
6
8
1991
Q1
1992
Q1
1993
Q1
1994
Q1
1995
Q1
1996
Q1
1997
Q1
1998
Q1
1999
Q1
2000
Q1
2001
Q1
2002
Q1
2003
Q1
2004
Q1
2005
Q1
2006
Q1
2007
Q1
2008
Q1
ExportsDomestic demand
Japan and NIEs: Contribution to GDP growthYear-on-year, in percent
Asian Crisis
Sources: Haver Analytics; and IMF, World Economic Outlook database and staff calculations.
2000-01 recession

What is the outlook?What is the outlook? 88
Global recovery is expected only in midGlobal recovery is expected only in mid--2010 and risks are on the downside2010 and risks are on the downside
3.5 to 4.53.5 to 4.52.0 to 2.52.0 to 2.56.16.1Emerging and Emerging and developing economiesdeveloping economies
0.10.1--5.85.8--0.70.7JapanJapan
0.20.2--2.62.61.11.1Euro AreaEuro Area
0.30.3--3.23.20.80.8USUS
1.0 to 2.01.0 to 2.0--1.5 to 1.5 to --0.50.53.23.2World OutputWorld Output
201020102009200920082008

What is the outlook?What is the outlook? 99
What does this mean for Asia? What does this mean for Asia? Growth will fall sharply this year and Growth will fall sharply this year and
recovery will be slowrecovery will be slow
0.6 to 3.1 0.6 to 3.1 --5.8 to 5.8 to --3.93.91.71.7NIEsNIEs
2.5 to 4.12.5 to 4.10.4 to 2.70.4 to 2.74.94.9ASEANASEAN--55
5.4 to 6.45.4 to 6.43.4 to 4.23.4 to 4.26.96.9EmergingEmerging
0.0 to 0.80.0 to 0.8--5.0 to 5.0 to --2.22.2--0.30.3IndustrialIndustrial
4.2 to 5.24.2 to 5.21.4 to 2.71.4 to 2.75.15.1AsiaAsia
201020102009200920082008y/yy/y in in percentpercent

What are the risks to Asia?What are the risks to Asia? 1010
Risk 1: A much slower recovery of the Risk 1: A much slower recovery of the G2G2
95
100
105
110
115
t=0
t=1
t=2
t=3
t=4
t=5
t=6
t=7
t=8
t=9
t=10
t=11
2008Q1-2010Q42001Q1-2003Q41997Q3-2000Q2
United States: Gross Domestic ProductRebased at the beginning of each time period = 100
Source: IMF, World Economic Outlook database.
95
100
105
110
115
t=0
t=1
t=2
t=3
t=4
t=5
t=6
t=7
t=8
t=9
t=10
t=11
2008Q1-2010Q42001Q1-2003Q41997Q3-2000Q2
Euro Area: Gross Domestic ProductRebased at the beginning of each time period = 100
Source: IMF, World Economic Outlook database.

What are the risks to Asia?What are the risks to Asia? 1111
Risk 2: Intensified feedback loop Risk 2: Intensified feedback loop between corporates and banksbetween corporates and banks
0
100
200
300
400
500
600
700
Jan-
08
Feb-
08
Mar
-08
May
-08
Jun-
08
Jul-08
Sep-
08
Oct
-08
Dec
-08
Jan-
09
Feb-
09
Asia excl. Japan
Japan
Credit Risk: iTraxx Indices1
Sources: Bloomberg LP; and Datastream. 1 iTraxx Indices are a set of credit default swap indices covering regions or sectors and contain the most liquid names in that market, based on a dealer poll.
0 0.5 1 1.5 2
Hong Kong SAR
Thailand
Philippines
Korea
Malaysia
India
Australia
Indonesia
Sources: CEIC Data Company Ltd; and IMF staff calculations. 1 A ratio greater than unity implies a higher relative loss for the financial sector stocks. A ratio between zero and one implies financial sector stocks losing less than market since January 2008.
Selected Asia: Drop in Financial Sector Stocks vis-à-vis Overall Stock MarketRatio of change since January 2008
Worse than marketBetter than market

What are the risks to Asia?What are the risks to Asia? 1212
Risk 3: Much larger unemployment Risk 3: Much larger unemployment lies aheadlies ahead
-50
-40
-30
-20
-10
0
10
20
30
-4.5
-3.6
-2.7
-1.8
-0.9
0
0.9
1.8
2.7
Industrialproduction (LHS) Employment(RHS)
Selected Asia: Industrial Production and EmploymentYear-on-year percent change; January 2006 to January 2009
Sources: CEIC Data Company Ltd; and IMF staff calculations.
Japan Korea Taiwan Province of China

What are the risks to Asia?What are the risks to Asia? 1313
Risk 4: LongRisk 4: Long--term consequences of the term consequences of the end of the easy credit finance eraend of the easy credit finance era
600
800
1000
1200
1400
Jan-04 Nov-04 Sep-05 Jul-06 May-07 Mar-08 Jan-0920000
22500
25000
27500
30000Japanese exports of motorvehicles (LHS)U.S. new car loans:financed amount (RHS)
Source: Haver Analytics.
Japanese Exports of Motor Vehicles vs. Auto FinancingIn billions of Japanese Yen (left scale); in U.S. dollars per car (right scale)
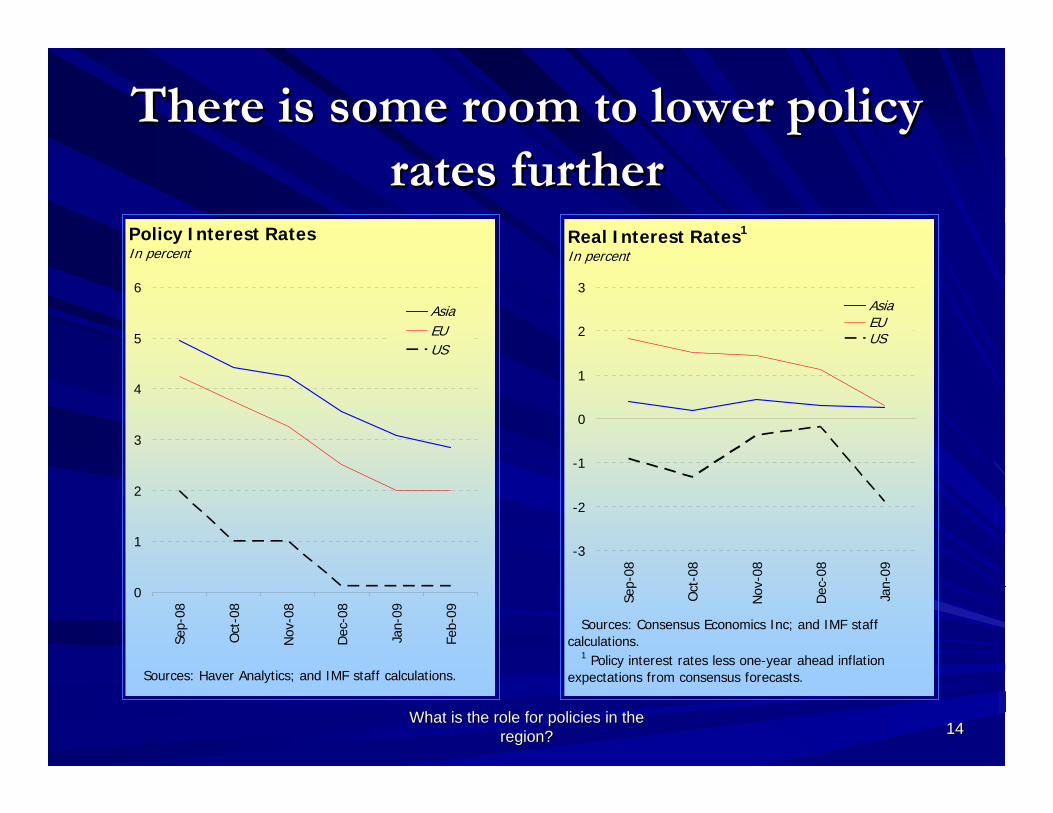
What is the role for policies in the What is the role for policies in the region?region? 1414
There is some room to lower policy There is some room to lower policy rates furtherrates further
Real Interest Rates1
In percent
-3
-2
-1
0
1
2
3
Sep-
08
Oct
-08
Nov
-08
Dec
-08
Jan-
09
AsiaEUUS
Sources: Consensus Economics Inc; and IMF staff calculations. 1 Policy interest rates less one-year ahead inflation expectations from consensus forecasts.
Policy Interest RatesIn percent
0
1
2
3
4
5
6
Sep-
08
Oct
-08
Nov
-08
Dec
-08
Jan-
09
Feb-
09
AsiaEUUS
Sources: Haver Analytics; and IMF staff calculations.

What is the role for policies in the What is the role for policies in the region?region? 1515
But unconventional policies may also But unconventional policies may also be neededbe needed
0
20
40
60
80
100
120
140
US Japan Korea
Domestic Assets on Central Bank Balance Sheets Change since June 2008, in percent
Sources: Haver Analytics; and IMF staff calculations.
3.5
4.5
5.5
6.5
7.5
8.5
9.5
Sources: CEIC Data Company Ltd; and IMF staff calculations.
Asia: Ratio of Base Money to Broad MoneyIn percent
Hong Kong SAR
Korea Japan

What is the role for policies in the What is the role for policies in the region?region? 1616
Strengthening bank capital would Strengthening bank capital would also helpalso help
0
1
2
3
4
5
6
7
Industrial Asia NIEs China and India ASEAN-4
Actual at end 2008
Expected 1-year ahead
Expected Increase in Bank Write-downs from Corporate Sector Loans1
In percent of banking sector loans
Source: IMF staff estimates. 1 Estimates are based on exposure to coporate sector loans and expected distress in corporate sector as indicated by credit default swap spreads.

What is the role for policies in the What is the role for policies in the region?region? 1717
Fiscal stimulus for 2009 is slightly Fiscal stimulus for 2009 is slightly above G20 average, butabove G20 average, but……
0
1
2
3
4
Indi
a
Indo
nesi
a
Japa
n
Aus
tral
ia
Kore
a
Chi
na
Ital
y
Braz
il
Fran
ce
Arg
entin
a
UK
Can
ada
Ger
man
y
Mex
ico
S. A
fric
a
US
Russ
ia
S. A
rabi
a
A v e r a g e ( P P P G D P w e i g h t e d )
G - 2 0 : D i s c r e t i o n a r y F i s c a l M e a s u r e s , 2 0 0 9I n p e r c e n t o f G D P
S o u r c e s : I M F , W o r l d E c o n o m i c O u t l o o k d a t a b a s e a n d s t a f f e s t i m a t e s a n d c a l c u l a t i o n s .

What is the role for policies in the What is the role for policies in the region?region? 1818
Further stimulus will be needed in Further stimulus will be needed in 20102010
- 1
0
1
2
3
4
Indi
a
Indo
nesi
a
Japa
n
Aust
ralia
Kore
a
Chin
a
Ital
y
Braz
il
Fran
ce UK
Cana
da
Ger
man
y
S. A
fric
a
US
Rus
sia
S. A
rabi
a
A v e r a g e ( P P P G D P w e i g h t e d )
G - 2 0 : D i s c r e t i o n a r y F i s c a l M e a s u r e s , 2 0 1 0I n p e r c e n t o f G D P
S o u r c e s : I M F , W o r l d E c o n o m i c O u t l o o k d a t a b a s e a n d s t a f f e s t im a t e s a n d c a l c u l a t i o n s .

1919
Is China different?Is China different?
What has its policy response been?What has its policy response been?
What is ChinaWhat is China’’s economic outlook? s economic outlook?
What are ChinaWhat are China’’s key mediums key medium--term term challenges?challenges?

Is China different?Is China different? 2020
China has not been immune to the China has not been immune to the crisiscrisis
0
5
10
15
20
25
Feb-07 Oct-07 Jun-08 Feb-09-40
-30
-20
-10
0
10
20
30
40
50
Value added
Exports (right axis)
Real Industrial Value Added and Exports(12-month growth rate)

Is China different?Is China different? 2121
But the authorities have responded But the authorities have responded proactivelyproactively
0.0
1.0
2.0
3.0
4.0
Jan-07 May-07 Sep-07 Jan-08 May-08 Sep-08 Jan-090.0
1.0
2.0
3.0
4.0
SHIBOR (7 days)
PBC Bill (3 months)
Interbank and Policy Rates
-4
-3
-2
-1
0
1
2001 2002 2003 2004 2005 2006 2007 2008 2009proj
2010proj.
0
7
14
21
Fiscal balance (left axis)
Government Debt
Debt and Fiscal Balance(In percent of GDP)

Is China different?Is China different? 2222
The stimulus is already working...The stimulus is already working...
Real Fixed Asset Investment Spending(Contribution to percent change, year-on-year)
-10
0
10
20
30
40
Jan-06 Jul-06 Jan-07 Jul-07 Jan-08 Jul-08 Jan-09-10
0
10
20
30
40
Non-SOESOETotal
-3
2
7
12
17
22
27
Jul-05 Jan-06 Jul-06 Jan-07 Jul-07 Jan-08 Jul-08 Jan-09-200
0
200
400
600
800
1,000
1,200
1,400
1,600
1,800
Loan growth (y-o-y, left axis)
Loan Growth and Monthly Loan

Is China different?Is China different? 2323
...and its spillovers are benefiting ...and its spillovers are benefiting householdshouseholds
8
10
12
14
16
18
20
Jan-06 Jul-06 Jan-07 Jul-07 Jan-08 Jul-08 Jan-09-30
-10
10
30
50
70
Retail sales (left axis)No. of passenger cars (right axis)
Real Retail Sales 1/(12-month growth rate)
(In percent)
1/ January and February data are averaged.

Is China different?Is China different? 2424
The policy action is expected to The policy action is expected to support Chinasupport China’’s growth s growth
-4
-2
0
2
4
6
8
10
12
14
1998 2000 2002 2004 2006 2008 2010proj.
-2
-1
0
1
2
3
4
5
6
7
Increase in deficit (right axis)GDP growth (left axis)
Growth and Increase in Fiscal Deficit(Percent change; percent of GDP)

Is China different?Is China different? 2525
...but the spillover to the region is ...but the spillover to the region is likely to remain small likely to remain small Capital Good Imports
(In percent change year-on-year)
-30
-20
-10
0
10
20
30
40
50
60
Feb-07 Jun-07 Oct-07 Feb-08 Jun-08 Oct-08 Feb-09-30
-20
-10
0
10
20
30
40
50
60
-40
-30
-20
-10
0
10
20
30
40
50
Feb-07 Jun-07 Oct-07 Feb-08 Jun-08 Oct-08 Feb-09-40
-30
-20
-10
0
10
20
30
40
50
ASEAN Asia
Imports from Asia(In percent change year-on-year)

Is China different?Is China different? 2626
ChinaChina’’s key medium term challenge: s key medium term challenge: rebalancing growthrebalancing growth
40
50
60
70
80
90
100
0 10,000 20,000 30,000 40,000 50,000 60,000 70,000
GDP per capita (US$, 2007)
China
IrelandSingapore
Malaysia
Consumption Expenditure(In percent of GDP, avereage for 2003–07)
KoreaThailandIndia
Japan
GDP Expenditure Components(In percent of GDP)
30
35
40
45
50
1997 1999 2001 2003 2005 20070
5
10
15
20
Private consumptionInvestmentNet exports
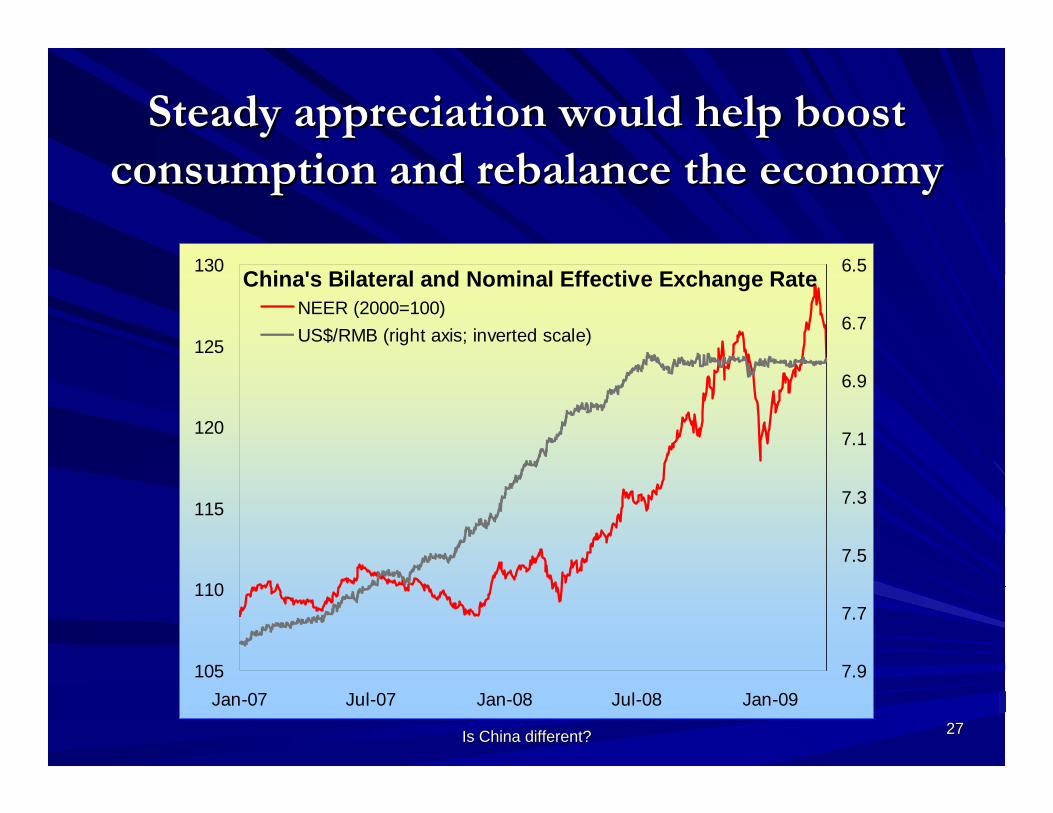
Is China different?Is China different? 2727
Steady appreciation would help boost Steady appreciation would help boost consumption and rebalance the economyconsumption and rebalance the economy
105
110
115
120
125
130
Jan-07 Jul-07 Jan-08 Jul-08 Jan-09
6.5
6.7
6.9
7.1
7.3
7.5
7.7
7.9
NEER (2000=100)US$/RMB (right axis; inverted scale)
China's Bilateral and Nominal Effective Exchange Rate

Is China different?Is China different? 2828
There is still scope for further fiscal stimulus There is still scope for further fiscal stimulus to reverse the decline in private consumptionto reverse the decline in private consumption
China: 2008–2010 Stimulus Package(In percent of 2008 GDP)
Infrastructure, 5.0
Healthcare and education, 0.5 Innovation and
structural adjustment, 1.2
Low-income housing support, 1.1
Environmental protection, 0.7
Rural incomes and infrastructure, 1.2Post-disaster
reconstruction, 3.3