the geography of radet in the european single...
TRANSCRIPT

The Geography of Trade in theEuropean Single Market
Shawn W. Tan
The World Bank
IMF/WB/WTO Trade Research WorkshopNovember 30, 2016
0 / 18

Borders within the European Single Market (ESM)
Trade should move freely within the ESM, unimpeded by tari�s andtrade barriers.
Yet trade is still impeded by spatial frictions: distance and borders
Many papers have estimated border e�ects in Europe
I Find that internal trade �ows higher than trade �ows that crossnational/regional borders
Issues with these studies
I International data may be a factor of geographical aggregationI Regional data are limited in coverage: Spanish regions trade with otherEU countries (e.g. Garmendia et al., 2012) and French and Germanregions (Helble, 2007)
1 / 18
What I do in My Paper
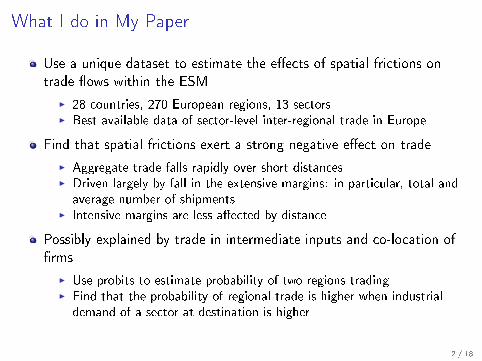
Use a unique dataset to estimate the e�ects of spatial frictions ontrade �ows within the ESM
I 28 countries, 270 European regions, 13 sectorsI Best available data of sector-level inter-regional trade in Europe
Find that spatial frictions exert a strong negative e�ect on trade
I Aggregate trade falls rapidly over short distancesI Driven largely by fall in the extensive margins: in particular, total andaverage number of shipments
I Intensive margins are less a�ected by distance
Possibly explained by trade in intermediate inputs and co-location of�rms
I Use probits to estimate probability of two regions tradingI Find that the probability of regional trade is higher when industrialdemand of a sector at destination is higher
2 / 18

Literature
Estimation of border e�ects
I Europe: Head and Mayer (2000), Nitsch (2000), Chen (2004),Minondo (2007), Gil-Pareja et al. (2005), Ghemawat et al. (2010),Requena and Llano (2010), Llano-Verduras et al. (2011), Garmendia etal. (2012)
I U.S. and Canada: McCallum (1995), Anderson and Van Wincoop(2003), Balistreri and Hillberry (2007)
Reasons behind border e�ects
I Omitted variable bias: Anderson and Van Wincoop (2003)I Intermediate inputs and co-location of �rms: Hillberry and Hummels(2008), Chen (2004)
3 / 18

Outline
1 Introduction
2 Empirical Framework
3 Data
4 Decomposing Trade Responses to Spatial Frictions
5 Trade in Intermediate Inputs and Co-location of Firms
6 Conclusion
4 / 18
Empirical Framework
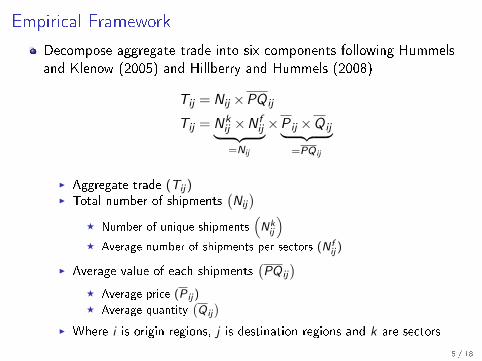
Decompose aggregate trade into six components following Hummelsand Klenow (2005) and Hillberry and Hummels (2008)
Tij = Nij ×PQ ij
Tij = Nkij ×N f
ij︸ ︷︷ ︸=Nij
×P ij ×Q ij︸ ︷︷ ︸=PQ ij
I Aggregate trade (Tij )I Total number of shipments
(Nij
)F Number of unique shipments
(Nkij
)F Average number of shipments per sectors (N f
ij )
I Average value of each shipments(PQ ij
)F Average price (P ij )F Average quantity
(Q ij
)I Where i is origin regions, j is destination regions and k are sectors
5 / 18
Estimation techniques
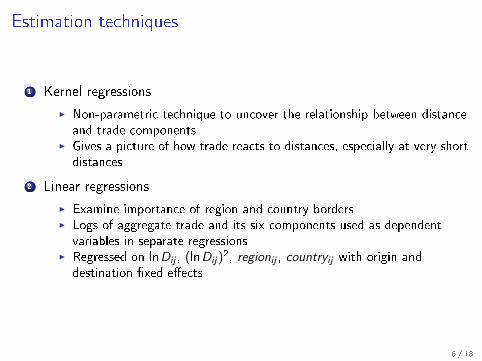
1 Kernel regressions
I Non-parametric technique to uncover the relationship between distanceand trade components
I Gives a picture of how trade reacts to distances, especially at very shortdistances
2 Linear regressions
I Examine importance of region and country bordersI Logs of aggregate trade and its six components used as dependentvariables in separate regressions
I Regressed on lnDij , (lnDij )2, regionij , countryij with origin and
destination �xed e�ects
6 / 18
Freight Data
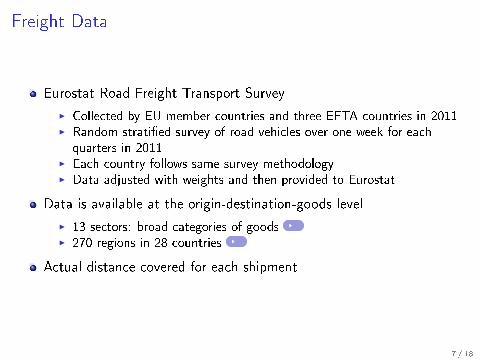
Eurostat Road Freight Transport Survey
I Collected by EU member countries and three EFTA countries in 2011I Random strati�ed survey of road vehicles over one week for eachquarters in 2011
I Each country follows same survey methodologyI Data adjusted with weights and then provided to Eurostat
Data is available at the origin-destination-goods level
I 13 sectors: broad categories of goodsI 270 regions in 28 countries
Actual distance covered for each shipment
7 / 18

Converting Quantity to Values
Freight data only has quantities expressed in kg
Solution: use 2011 unit prices from CEPII unit price dataset (Berthouand Emlinger, 2011)
I Unit prices between reporter and partner countries for products (HS 6)I Concordance between HS 6 and the 13 sectorsI Matched regions in freight data to countries
Shipment values obtained for each origin-destination-sector triad
8 / 18
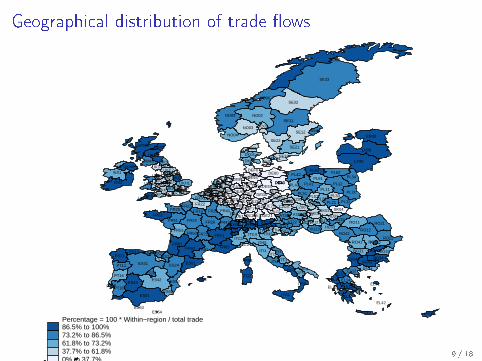
Geographical distribution of trade �ows
AT11AT12AT13
AT21AT22
AT31AT32AT33AT34
BE10BE21BE22BE23BE24BE25BE31BE32 BE33
BE34BE35
BG31 BG32BG33
BG34BG41BG42
CH01CH02
CH03CH04CH05CH06
CH07
CY00
CZ01CZ02CZ03
CZ04 CZ05
CZ06CZ07CZ08
DE11DE12
DE13DE14 DE21DE22
DE23DE24
DE25DE26
DE27
DE30DE40DE50
DE60
DE71DE72
DE73
DE80
DE91DE92
DE93DE94
DEA1DEA2
DEA3DEA4DEA5
DEB1DEB2DEB3DEC0
DED4DED5
DEE0
DEF0
DEG0
DK01DK02DK03
DK04
DK05
EE00
EL11EL12
EL13
EL14EL21
EL22EL23
EL24
EL25EL30
EL41
EL42
EL43
ES11ES12 ES13 ES21
ES22ES23
ES24
ES30
ES41
ES42ES43
ES51
ES52 ES53
ES61ES62
ES63ES64
ES70
FR10 FR21
FR22FR23
FR24
FR25
FR26
FR30
FR41FR42
FR43FR51FR52
FR53
FR61FR62
FR63FR71FR72
FR81FR82
FR83
HU10HU21HU22
HU23
HU31HU32
HU33
IE01
IE02
ITC1ITC2
ITC3
ITC4
ITF1ITF2
ITF3 ITF4ITF5
ITF6
ITG1
ITG2
ITH1ITH2
ITH3ITH4
ITH5
ITI1ITI2
ITI3
ITI4
LT00
LU00
LV00
NL11NL12NL13NL21
NL22NL23
NL31NL32
NL33NL34NL41
NL42
NO01
NO02
NO03
NO04
NO05
NO06
NO07
PL11PL12
PL21PL22
PL31
PL32
PL33
PL34
PL41
PL42
PL43
PL51PL52
PL61
PL62PL63
PT11
PT15
PT16
PT17PT18
RO11
RO12
RO21
RO22RO31RO32RO41
RO42
SE11SE12
SE21
SE22
SE23
SE31
SE32
SE33
SI01SI02
SK01SK02SK03 SK04
UKC1UKC2
UKD1
UKD6UKD7UKE1
UKE2UKE3UKE4UKF1
UKF2UKF3
UKG1UKG2UKG3 UKH1
UKH2UKH3UKI1UKI2UKJ1UKJ2UKJ3 UKJ4UKK1
UKK2UKK3
UKK4
UKL1UKL2
UKM2
UKM3
UKM5UKM6
UKN0
Percentage = 100 * Within−region / total trade86.5% to 100%73.2% to 86.5%61.8% to 73.2%37.7% to 61.8%0% to 37.7%
9 / 18
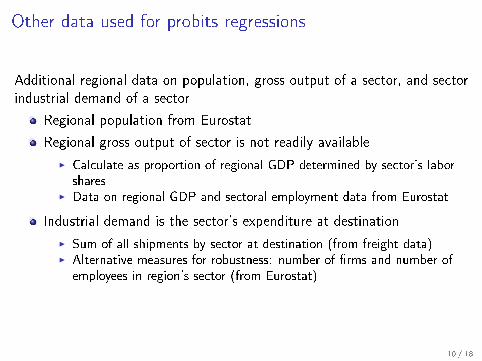
Other data used for probits regressions
Additional regional data on population, gross output of a sector, and sectorindustrial demand of a sector
Regional population from Eurostat
Regional gross output of sector is not readily available
I Calculate as proportion of regional GDP determined by sector's laborshares
I Data on regional GDP and sectoral employment data from Eurostat
Industrial demand is the sector's expenditure at destination
I Sum of all shipments by sector at destination (from freight data)I Alternative measures for robustness: number of �rms and number ofemployees in region's sector (from Eurostat)
10 / 18

Kernel regression results (Tij)
010
000
2000
030
000
4000
0M
illio
n U
SD
250 5000 1000 2000 3000 4000 5000Kilometers
Total Value on distance
11 / 18
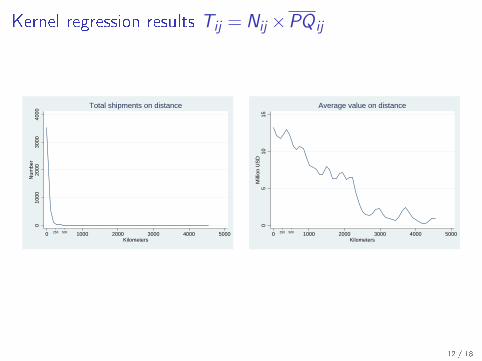
Kernel regression results Tij = Nij ×PQ ij0
1000
2000
3000
4000
Num
ber
250 5000 1000 2000 3000 4000 5000Kilometers
Total shipments on distance
05
1015
Mill
ion
US
D
250 5000 1000 2000 3000 4000 5000Kilometers
Average value on distance
12 / 18
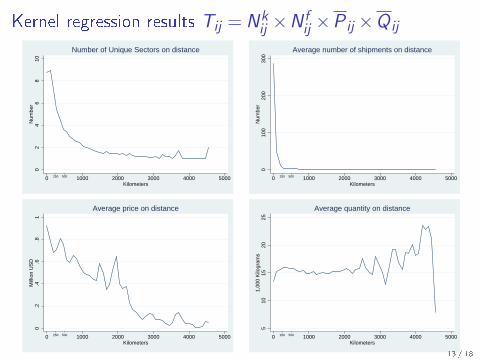
Kernel regression results Tij = Nkij ×N f
ij ×P ij ×Q ij0
24
68
10N
umbe
r
250 5000 1000 2000 3000 4000 5000Kilometers
Number of Unique Sectors on distance
010
020
030
0N
umbe
r
250 5000 1000 2000 3000 4000 5000Kilometers
Average number of shipments on distance
0.2
.4.6
.81
Mill
ion
US
D
250 5000 1000 2000 3000 4000 5000Kilometers
Average price on distance
510
1520
251,
000
Kilo
gram
s
250 5000 1000 2000 3000 4000 5000Kilometers
Average quantity on distance
13 / 18

Linear regression results
14 / 18
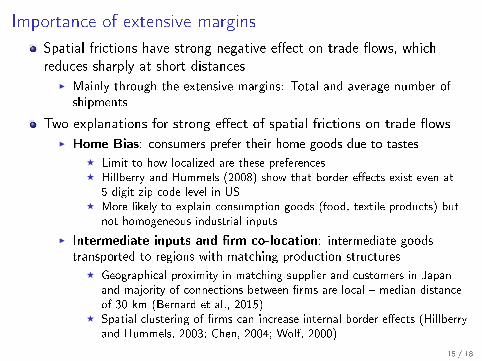
Importance of extensive margins
Spatial frictions have strong negative e�ect on trade �ows, whichreduces sharply at short distances
I Mainly through the extensive margins: Total and average number ofshipments
Two explanations for strong e�ect of spatial frictions on trade �owsI Home Bias: consumers prefer their home goods due to tastes
F Limit to how localized are these preferencesF Hillberry and Hummels (2008) show that border e�ects exist even at
5-digit zip code level in USF More likely to explain consumption goods (food, textile products) but
not homogeneous industrial inputs
I Intermediate inputs and �rm co-location: intermediate goodstransported to regions with matching production structures
F Geographical proximity in matching supplier and customers in Japanand majority of connections between �rms are local � median distanceof 30 km (Bernard et al., 2015)
F Spatial clustering of �rms can increase internal border e�ects (Hillberryand Hummels, 2003; Chen, 2004; Wolf, 2000)
15 / 18

Empirical setup for probit regressions
Test whether industrial demand a�ects likelihood of shipmentsbetween two regions
Control for other in�uences: distance, regional gross outputs, andconsumer demand
Pr(I kij = 1
)= Φ(β
k0
+ βk1lnDij + β
k2
(lnDij
)2
+ βk3Regionij + β
k4Countryij
+ βk5lnGOk
i + βk6lnGOk
j + βk7lnPopj + β
k8lnE k
j ) ∀k = 2, ...,13
I GOki and GOk
j is gross output of sector k of i and jI Popj is population of jI E k
j is industrial expenditure of sector in destinationI Note: distance is between centroids of regions.
16 / 18
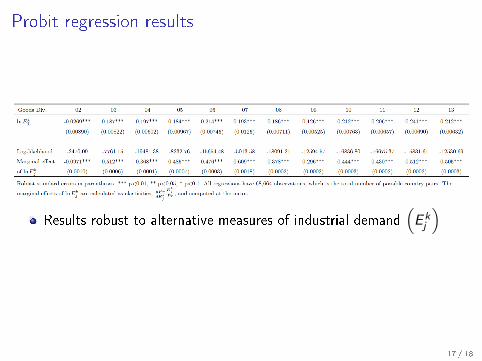
Probit regression results
Results robust to alternative measures of industrial demand(E kj
)
17 / 18

Conclusion
Using a unique dataset of freight shipments in the ESM, we �nd thataggregate trade responds sharply to spatial frictions
I Trade falls sharply over short distances (after 250 km)I Largely attributed to fall in total and average number of shipments
Role of extensive margins explained by trade in intermediate goods
I Firms locate near each other to avoid trade costsI Regions are more likely to ship products to other regions with ademand for that input
I Higher industrial demand increases probability of regional shipments
Policy makers concerned about lack of trade integration should worryless about trade barriers and examine roles of value chains.
18 / 18

Thank You
18 / 18

Sectors / Goods Classi�cation
18 / 18
Countries included in estimation
Austria, Belgium, Bulgaria, Cyprus, Czech Republic, Denmark,Estonia, France, Germany, Greece, Hungary, Ireland, Italy, Latvia,Lithuania, Netherlands, Norway, Poland, Slovakia, Slovenia, Spain,Sweden, Switzerland, and the United Kingdom.
Data includes Croatia but the country is dropped from the estimationbecause Croatia was not part of the ESM in 2011 and would havetari� barriers on shipments in and out of the country.
18 / 18

Summary statistics for probit regressions
18 / 18