the generation of design parameters for the use ... - wrc … hub documents/research... · wrc...
TRANSCRIPT

THE GENERATION OF DESIGN PARAMETERS
FOR THE USE OF THE LIMESTONE TEETER BED REACTOR
FOR POTABLE WATER STABILISATION AND THE TREATMENT OF CAPE COLOURED WATERS
Report to the
Water Research Commission
by
R G BATSON
WRC Report No 1594/1/08 ISBN 978-1-77005-779-1 December 2008

DISCLAIMER
This report has been reviewed by the Water Research Commission (WRC) and approved for publication. Approval does not signify that the contents necessarily reflect the views
and policies of the WRC, nor does mention of trade names or commercial products constitute endorsement or recommendation for use.
- i -
EXECUTIVE SUMMARY 1. AIMS OF THIS RESEARCH PROJECT 1.1 Main aims of the project
a) To demonstrate the use of the Limestone Teeter Bed Reactor (LTBR) in the treatment of Cape Coloured waters and the stabilisation of soft, corrosive surface waters.
b) To develop design parameters for the construction of full size plants based
upon the application of limestone teeter bed technology. 1.2 Secondary aims The aims further include demonstrating that the LTBR technology can:
a) Provide conditions in which the dissolution of the limestone particles can be optimised.
b) Increase the utilisation of the limestone to close to 100%. c) Overcome the limitations imposed by armouring of the limestone particles.
Armouring has tended to limit the application of limestone to low coloured water and waters that have low dissolved heavy metal concentrations.
d) Eliminate the use of automatic pH control systems, dry feeders, slurry preparation tanks and slurry dosing systems.
e) Provide a system that is simple and cheap to operate and maintain. f) Reduce the costs of producing drinking water, thereby making more money
available for urgent social needs. g) Provide technology that is appropriate for use in rural areas, using semi-
skilled labour, as well as in urban areas. h) Make use of equipment and water treatment chemicals that are locally
available. i) Reduce carbon dioxide emissions and hence global warming.
Achieving these aims is equivalent to demonstrating that limestone can effectively replace the use of lime in all drinking water installations, other than in applications that require the use of very high pH values, such as in lime softening and magnesium concentration reduction. 2. STRUCTURE OF THE RESEARCH PROJECT 2.1 Literature survey Information on the following types of equipment was obtained from manufacturers’ data sheets and from research papers: Hindered Bed Classifiers (Teetered Bed Separators), Fluidised Bed Reactors, Limestone Fluidised Bed Reactors, Limestone Contactors, Pulsed Limestone Beds, the Circulator Clarifier and the Gyractor.

- ii -
Although all the equipment studied had one or more of the features of the LTB, none of them operated under conditions of incipient fluidisation in a tapered vessel. No information could be found on the use of teeter bed reactors in any literature. 2.2 Trials on the small-scale limestone teeter bed reactor The main purposes for the construction of the small-scale limestone teeter bed reactor, in clear PVC, was to examination the flow patterns created within the teeter bed under operating conditions and to determine whether Ergun’s equation could be used to calculate the upflow velocities necessary to create conditions of incipient fluidisation throughout the bed. The main conclusions from the small-scale pilot plant trials, carried out at Sedgefield, were: At the design flowrate, the limestone teeter bed exhibited zones of static limestone particles, zones of particles in a condition of incipient fluidization and zones in which particles were fully fluidized. The flow patterns within the bed were far from steady, with occasional plumes of high velocity water lifting fairly coarse grains of limestone to levels above which they were theoretically stable, sometimes leaving these coarser limestone particles trapped in static regions, often against the sides of the teeter bed. However, after further, longer-term examination of the flow patterns within the LTBR, it was noted that:
The plumes of high velocity water carrying coarser grains of limestone into higher levels of the bed were fairly short in height and did not extend into the top levels of the bed.
The static regions of fairly coarse limestone particles trapped, at higher levels,
against the side of the teeter bed vessel, were soon demolished by the general water flow through the bed. A new, transient, static region would then form, in a different part of the bed.
The formation, collapse and reformation of these regions of coarser particles at
higher levels, occurred over and over again, at different locations around the teeter bed, in fairly regular cycles.
The pH of the water exiting the LTBR remained steady for long periods at
around 7.5, provided that there was sufficient limestone in the bed.
There were no signs of particle armouring occurring.
The volume of the teeter bed, as designed, is just sufficient when the plant is operated at 500 l/hour on Sedgefield water and the limestone is recharged once per day.

- iii -
It was therefore concluded that:
It is not necessary to create and maintain incipient fluidisation conditions throughout the whole teeter bed in order for the Limestone Teeter Bed Reactor to perform its designated function of dissolving the limestone to a sufficient extent and within a reasonable residence time to raise the pH of the feedwater to the required level, in a consistent manner.
In a full-scale teeter bed, the diameter of the bed is much greater than in a pilot
plant; therefore wall effects can be expected to be less significant and the frequency of the formation of static zones should be greatly reduced.
“Oversized” limestone particles which are not fluidized and which remain
“packed” near the bottom of the bed, are active, in that they are in contact with the feedwater where it is at its most reactive. Furthermore, these oversized limestone particles represent an in-process source of make-up limestone as they dissolve and become smaller and eventually become part of the teeter bed.
The rapid breakdown of each limestone particle into a range of smaller
particles as the original particle dissolves is related to the highly friable nature of the limestones found in parts of the Western Cape. These limestone fines, since they possess high surface areas, perform the essential task of raising the pH of the feedwater to close to its limestone contact equilibrium value. Given the increase in the diameter of the vessel with height, these fine limestone particles remain within the LTBR, provided that the vessel has not been overfilled or run at too high a flowrate.
Coarse, single-sized limestone with a nominal particle size of 2 to 4 mm
(Poultry Grit) may be used for the initial fill and for make-up of the teeter bed reactor.
Throughout the trials, a mixture of limestone particles of different sizes, from
coarse to very fine, existed within the teeter bed.
Aluminium hydroxide and aluminium/colour precipitates do not become trapped within the teeter bed, but are carried through the teeter bed into elutriation section and then into the clarifier. The teeter bed is here acting as a classifier.
2.3. The larger scale, 2 stage coloured water treatment pilot plant The larger scale coloured water treatment pilot plant contains two, distinct treatment stages. In the first stage, the colour removal stage, coagulant is added to the raw water, which is then blended with a portion of dilute sludge, recycled from the stage 2 settler. The ratio of stage 2 dilute sludge to raw water is adjusted manually so that the pH of the treated water leaving stage 1 is within the optimal range for colour removal. No solid limestone is added to the first stage.

- iv -
Rapid mixing, slow mixing, colour precipitation, the precipitation of aluminium and iron hydroxides/ hydrates and floc formation all take place within a coagulating cone mounted inside the stage 1 settler. The second stage incorporates a Limestone Teeter Bed Reactor, mounted within the stage 2 settler. Contact between the clarified overflow from stage 1 and the limestone particles in the LTBR, under conditions of high shear, ensures that stabilisation and settling are carried out at a pH close to the equilibrium pH. The equilibrium pH is generally around 7.5 for highly coloured feedwaters. At this pH, when alum is used as the coagulant, any residual aluminium from the first stage is precipitated in the second stage as aluminium hydroxide and this aluminium hydroxide assists in flocculating any precipitates carried over from stage 1. The second stage is followed by conventional rapid gravity sand filtration to remove any flocs and fine solids carried over from the stage 2 settler. Although the 2 stage coloured water treatment plant was developed mainly as a means of providing and maintaining a set pH at which to carry out the colour removal process under optimal conditions, the design has other benefits:
Stage 1 is the colour removal stage. Since there is no limestone bed in this stage there is no possibility of the limestone particles becoming armoured, i.e. coated with aluminium or iron deposits.
Information on the operation of the stage 2 LTBR in the treatment of coloured water can be used in the design of the water stabilisation section of a conventional water treatment plant.
Two stage processes are inherently more effective than single stages,
providing a double barrier for the removal of contaminants from the water.
The dosage of alum added to stage 1 can be adjusted to provide slightly more dissolved aluminium than is required to react with the colour in the feed. Since the pH in stage 1 is below the optimum pH for aluminium hydroxide precipitation, some dissolved aluminium will remain in solution in the water exiting stage 1. In stage 2, extra limestone dissolves in the water, raising the pH to above 7. This result in the precipitation of the residual aluminium in the incoming water, as aluminium hydroxide, which serves to adsorb and coagulate any colour flocs carried in the overflow from stage 1.
From the results of analyses of the 2-Stage large-scale pilot plant trials carried out at Sedgefield and George, it is concluded that:
Soft, highly coloured waters with low alkalinities can be effectively treated in
the 2-stage LTBR plant to produce potable water that complies, in all respects, with the SANS 241/2006 Specification for Class 1 Drinking Water.
No pH control system is necessary, nor is a lime dosing system.

- v -
Coagulants dosages on the pilot plant when treating Sedgefield water are much
lower than used on the corresponding full-scale plants. This is because the colour removal stage on the pilot plant is run at a pH of 5.1, which is much closer to the optimum pH value than the 6.0 used on the full-scale plant. The total dosage of limestone added is therefore also much less than the lime dosage used on the full-scale plant. The pilot plant was run at coagulant dosages as low as 60 mg/l, with satisfactory colour removal, but Dissolved Organic Carbon removals may be unsatisfactory at such low coagulant additions.
At George, ferric chloride is used as the flocculant on the full-scale plant.
When used on the pilot plant, at the same dosage, the acidity of the water is so high that the limestone is consumed so quickly that the pH in both stages drops below the desired values, when the pilot plant is run overnight. For this reason the coagulant was first changed to a polyaluminium chloride/polyamine mix. This gave excellent colour removal with almost negligible limestone consumption, but the cost of the coagulant was considered to be excessive.
Substituting the highly acidic ferric chloride coagulant with less acidic alum
produced satisfactory colour removal and removed the necessity of replacing part of the lime with sodium carbonate in order to reduce the calcium level and hardness of the potable water to within acceptable levels. Although ferric chloride is cheaper and more readily available than alum, the economics of this substitution warrant further investigation by the management at George.
It is unnecessary to add potassium permanganate to the water in order to
reduce dissolved iron and manganese levels to below the recommended levels, when limestone is used to increase the alkalinity and pH of the water. This indicates that the source of the iron and manganese in the drinking water produced on the full-scale plant could be the brown lime used on the full-scale plant.
The manganese dioxide coated filter medium used on the full-scale plant at
George appears to be very effective in polishing the drinking water and removing any traces of colour not removed by the ferric chloride and potassium permanganate.
It should be noted that a polyelectrolyte is always used on the full-scale water
treatment plant in order to improve settling. The improvement is often marginal and may not warrant the costs involved.
The Limestone Teeter Bed Reactor pilot plant was operated at flow rates of
250 l/hour, 500 l/hour and 1000 l/hour. Sudden increases in flowrate result in a loss of fines from the teeter bed, but these fines are recycled back to Stage 1 and not lost to the process in the proposed 2 stage coloured water treatment plant. At the highest flowrate it is necessary to top up the teeter bed with limestone at least twice per day, or to double the size of the limestone bed. Overflow from the settlers was noted at high flowrates and the filter run time of the sand filter was very much shortened.

- vi -
The main shortcomings in the design of the pilot plant were:
Excessive carry-over of small particles of active limestone from the Stage 1 Clarifier indicates that the retention time is insufficient within the coagulating cone used for the pilot plant trials.
When treating George water, there is a significant drop in the pH of the water
leaving Stage 2 as the mass of limestone in the teeter bed drops. The implication of this is that the volume of the LTBR in the pilot plant is too small to maintain equilibrium conditions for more than about 12 hours between limestone top-ups, when the pilot plant is operated at its design flow rate of 500 l/hour.
The lack of a sludge thickening stage. Sludge thickening should be standard on
any water treatment plant, not only to reduce the volume of sludge produced, but also to increase the volume of potable water available for distribution.
2.4. Capital and operating costs Capital cost comparisons between the LTBR system and more conventional systems are very difficult to make. However, given the simplicity of the LTBR system, that no lime dosing or pH control systems are required and that the deep cone settlers used on the LTBR system require much less space than the conventional horizontal clarifiers, the capital cost of the LTBR based plant should be lower than that of a conventional plant. Comparative chemical costs were also very difficult to obtain. Most municipalities, including Knysna municipality, go out to tender for the supply of water treatment chemicals on a long-term basis, which is normally for 3 years. However, alum was in very short supply during mid 2008, and the spot price of alum was much higher than the tendered price. The chemical suppliers were unwilling to estimate the longer-term chemical costs. Although the pilot plant could be operated at a coagulant dosage of 1/3 of that used on the full-scale plant at Sedgefield, the final pilot plant trials were carried out using ½ the coagulant dosage used on the full-scale plant. Given that cost of the limestone is only about 1/3 of the cost of lime, it is probably safe to assume that the chemical costs would be cut to ¼ of the present costs by using the proposed 2-stage LTBR coloured water treatment process. 2.5 Flow rates The large-scale teeter bed pilot plant was operated, both at Sedgefield and at George, at a flow rate double the design flow rate, i.e. at 1000 litres/hour. The conclusion reached was that, although the teeter bed can run at double the design flow rates quite satisfactorily, the settlers and filters become overloaded.

- vii -
All the equipment also worked well at a flow rate of 250 litres/ hour, except the coagulant dosing pump, which behaved erratically at flow rates close to 1 ml/minute. It is almost certain that some of the coarse limestone was not in a condition of incipient fluidization, but there was no evidence of precipitates being trapped between the limestone particles. The pH of the partly stabilized water from Stage 2 hardly varied, perhaps indicating that the increased retention time compensated for the lower energy conditions. It was concluded that the LTBR can operate well over a wide range of flow rates. At the higher flow rates the operation of the settlers and sand filter becomes critical. Should the plant be run at a low flow rate for an extended period, a finer limestone can be used as make-up. 2.6 Sludge properties Sludge was discharged from the two clarifiers every second day and was visibly thicker than the lime sludges discharged from the full-scale plants. The solids concentration of the sludge varied according to the tests that were being performed during any particular period and was within the range of 0.5 to 1.0% solids, by mass. Rough calculations on the composition of the sludge, based upon the alum dosage and the insolubles content of the limestone, show that up to 50% of the solids in the sludge are probably in the form of insolubles from the limestone. This may explain the increased settling rate of the colour flocs in the clarifiers when using limestone in place of lime. 3. DESIGN PARAMETERS 3.1. Application of Ergun’s equation The sizing of the Limestone Teeter Bed Reactors is based upon the application of Ergun’s Equation (see Appendix B), which provides a method for calculating the upflow velocity necessary to produce conditions of incipient fluidization at any level within a teeter bed and the resulting pressure drop through the bed. Pilot Plant trials using the larger scale LTBR at Sedgefield and George demonstrate that the information provided from the application of Ergun’s equation to the sizing of a teeter bed is also sufficiently accurate to be used for the design of full scale Limestone Teeter Bed Reactors. However, the analyses of the Stage 2 water samples indicated that the height and the live limestone storage capacity of the LTBR should be increased to reduce the frequency of recharging and to provide the additional alkalinity required when ferric chloride is used as the coagulant. The analyses indicate that the Coagulation Cone, used in Stage 1, the colour removal stage, was also originally undersized.

- viii -
3.2 Colour removal Parameters for the design of full-scale coloured water treatment plants, based upon the use of LTBR technology, are given in a series of tables in Section 6 of the main report. 3.3 Stabilisation of soft, corrosive surface supplies. The tables provided in Section 6 of the main report are suitable for the design of equipment to be used for the stabilisation of general potable water supplies either up-front, or at the end of the process train. 3.4 Converting an existing coloured water treatment plant from lime to limestone Section 8 of the main report describes how two Limestone Teeter Bed Reactors can be used to convert an existing Water Treatment Plant from the use of Lime to using Limestone. 4. RECOMMENDATIONS FOR FURTHER RESEARCH 4.1 Determination of the optimal conditions for colour removal Coagulant dosages and optimal pH ranges for colour removal are usually determined from jar tests. The results obtained from these beaker tests are a function not only of the effectiveness of the colour removal process but also the rate at which the precipitates settle. This depends primarily on the size, density and electrophoretic mobility of the flocs. The metal salts, added to precipitate the colour, also act as flocculants, serving to neutralize the negative charges on the colour precipitate, to bind the precipitated particles together into larger flocs and thereby to increase the settling velocity of the precipitated colour. The amount of floc carry-over from stage 1 in the 2-stage LTBR coloured water treatment process is not critical, since the water is re-settled, at a higher pH, in stage 2 and then filtered through a conventional sand filter. During the pilot plant trials small, well-formed, very dark brown flocs were produced at low pH values with low doses of coagulants, although these precipitates were slow to settle. This would appear to substantiate the theory that colour precipitation requires only a low coagulant dosage and pH. Further research may be warranted to determine whether colour precipitation can be carried out with low coagulant dosages at low pH values in treatment plants in which the settling velocity of the precipitated colour is not important, such as the proposed 2-stage LTBR coloured water treatment plant, and whether this leads to lower overall operating costs.

- ix -
4.2 Determination of the optimal conditions for the removal of organics SANS 241:2006 specifies maximum concentrations for Dissolved Organic Carbon. UV Absorbance may be used as a surrogate for DOC, but no limits have been set for UVA and the relationship between UVA and DOC is not linear and differs from water to water. No guidance appears to be given to plant managers or operators to enable them to optimize the operation of their plants to meet the organoleptic and colour requirements of SANS 241:2006, at minimum cost.
(a) It is recommended that the Water Research Commission should initiate
research into the relationship between UVA and DOC for a range of typical South African waters and determine combinations of coagulant types, dosages and pH values to guide plant managers and operators in meeting the National Standards.
4.3 South African brown limes “Guidelines for the Treatment of Cape Coloured Waters” (Swartz, CD and de Villiers, HA, 1998), Appendix F, Section 3 “Lime” gives the iron content in the P & B hydrated lime as 1.79 mg/g. This analysis needs to be confirmed. It will also be necessary to determine whether this iron is in a soluble form and what the residual iron level is in stabilized water in which lime only is used for stabilisation.

- x -
ACKNOWLEDGEMENTS
The Reference Group (Steering Committee) appointed by the Water Research Commission to review the progress and quality of the deliverables supplied under this research project and to make recommendations in respect of these deliverables consisted of the following persons: Dr G Offringa Water Research Commission (Chairman) Mr S A Pieterse City of Cape Town Prof J Maree CSIR, Pretoria and Tshwane University of Technology Mr H Basson George Municipality Mr J Hartslief Knysna Municipality Mr G S Mackintosh Emanti Management Group The financing of this project by the Water Research Commission and the contribution made to the successful completion of the project by the members of the Reference Group is gratefully acknowledged. The support and advice offered by the Chairman, Dr Gerhard Offringa, and Mr Sarel Pieterse, who heads Cape Town’s Water Laboratory, were particularly welcome. The author wishes to record his sincere thanks to Mr C D Swartz who prepared the proposal for this research project and provided much needed guidance throughout its implementation.

- xi -
TABLE OF CONTENTS
Page
CHAPTER 1 INTRODUCTION 1.1 The use of lime in potable water treatment 1 1.2 The use of limestone in place of lime 1 1.3 The limestone teeter bed reactor 2 1.4 Aims of the research project 3 CHAPTER 2 LITERATURE SURVEY 2.1 Hindered bed classifiers. (Teetered bed separators) 4 2.2 Fluidised bed reactors 5 2.3 Limestone Contactors 5 2.4 Limestone filters 6 2.5 Limestone fluidised bed reactors 8 2.6 Pulsed limestone bed treatment of acid mine drainage 9 2.7 The circulator clarifier 11 2.8 The Gyractor 12 2.9 Limestone teeter(ed) beds & teeter bed reactors 12 CHAPTER 3 THE OPERATION OF A SMALL-SCALE PILOT
PLANT LIMESTONE TEETER BED REACTOR 3.1 Design of the small scale pilot plant 13 3.2 Investigation of the conditions necessary to create and maintain a
state of incipient fluidisation throughout the teeter bed. 15 3.3 General conclusions from the small-scale pilot plant trials 16 CHAPTER 4 DESIGN AND CONSTRUCTION OF A LARGER
PILOT PLANT 4.1 The combined LTBR/ clarifier 19 4.2 Frequency of limestone recharging 19 CHAPTER 5 THE RESULTS OF TRIALS PERFORMED ON
THE LARGE-SCALE PILOT PLANT 5.1 Pilot plant modifications to ensure that colour removal is carried out within the optimal pH range 21 5.2 The 2 stage coloured water treatment plant 28 5.3 Conclusions on the results of the large-scale pilot plant trials 43 5.4 Capital and operating costs 44 CHAPTER 6 DESIGN PARAMETERS FOR FULL-SCALE
LIMESTONE TEETER BED REACTORS USED IN WATER TREATMENT
6.1 Application of Ergun’s equation. 46

- xii -
6.2 Colour removal 46 6.3 Stabilisation 53 CHAPTER 7 HIGH FLOW AND LOW FLOW CONDITIONS 7.1 High flow conditions 56 7.2 Low flow conditions 56 7.3 Conclusions on operating the LTBR at high and low flow rates 56 CHAPTER 8 CONVERTING AN EXISTING COLOURED
WATER TREATMENT PLANT FROM LIME TO LIMESTONE 57
CHAPTER 9 SLUDGE CHARACTERISTICS 59 CHAPTER 10 CONCLUSIONS 10.1 Conditions within the Limestone Teeter Bed Reactor 60 10.2 The 2-stage coloured water treatment plant 60 10.3 The stabilisation of general potable water supplies 61 10.4 Design parameters 63 CHAPTER 11 RECOMMENDATIONS 11.1 Determination of the optimal conditions for colour removal 64 11.2 Determination of the optimal conditions for the removal of organics 65 11.3 South African brown limes 65 APPENDIX A REFERENCES 66 APPENDIX B THEORY INVOLVED IN SIZING OF A
LIMESTONE TEETER BED REACTOR 67
- xiii -
LIST OF FIGURES
Page
Figure 2.1 The Floatex Hydrosizer. 4
Figure 2.2 The CSIR Limestone Contactor. 6
Figure 2.3 Three-Media Filter 7
Figure 2.4 Single Medium CaCO3 Filter 7
Figure 2.5 Flow Diagram of Cone-Shaped Fluidised Bed and
Crystallisation Reactor 8
Figure 2.6. Schematic of the Pulsed Limestone Bed Process 10
Figure 2.7 The Circulator Clarifier 11
Figure 2.8 The Gyractor 12
Figure 3.1 The Small-Scale Limestone Teeter Bed Reactor, Floc Bed
Clarifier & Limestone Filter Column 18
Figure 5.1 The Simple Alum Dosing Float 24
Figure 5.2. The Leak-Proof Alum Dosing Float 25
Figure 5.3 The Internal By-Pass System 26
Figure 5.4 Self-Compensating Alum Dosing System 27
Figure 5.5. Sedgefield 2 Stage LTBR Coloured Water Treatment Plant
Diagram 30
Figure 5.6. Photograph of the pH Meters, Raw Water Rotameter And
Coagulant Dosing Pump at George 36
Figure 5.7. Photograph of the 2 Stage Pilot Plant at George 38
Figure 5.8. George 2 Stage LTBR Coloured Water Treatment Plant
Diagram 39
Figure 6.1 Proposed 2 Stage LTBR Coloured Water Treatment Plant 47
Figure 6.2. LTBR Used for Stabilisation after Conventional Water
Treatment 55
Figure 8.1 Converting an Existing Coloured Water Treatment Plant
from Lime to Limestone 58
- xiv -
LIST OF TABLES
Page
Table 3.1 Limestone Teeter Bed Reactor. Small Scale Pilot Plant Sizing Calculations 14
Table 5.1 Results of Chemical Analyses on Final Pilot Plant Runs at Sedgefield 34
Table 5.2 Results of Chemical Analyses on Initial Pilot Plant Runs at George 40
Table 5.3 Results of Chemical Analyses on Final Pilot Plant Runs at George 41
Table 6.1 Limestone Teeter Bed Reactor Sizing Table 48 Table 6.2 Flushing, Free Settling and Hindered Settling Velocities for Limestone Particles 49

1
CHAPTER 1. INTRODUCTION
1.1 THE USE OF LIME IN POTABLE WATER TREATMENT Lime is generally the chemical chosen to increase the alkalinity and pH of surface or underground waters that are naturally acidic due to contained heavy metals, such as iron and manganese or natural organic matter (NOM) or metal salts, such as alum or ferric chloride, added to the water as coagulants. This is because lime is a strong alkali that has been reasonably cheap, readily available and quick reacting. Lime is also the chemical of choice used to stabilise potable waters to make them less corrosive to metals and concrete in the distribution systems. 1.2 THE USE OF LIMESTONE IN PLACE OF LIME Recently there has been a move towards the use of limestone in place of lime in the treatment of potable water supplies. The advantages of using limestone in place of lime include:
a) The lower cost of limestone. b) Limestone is less hazardous to handle, because it is less corrosive than lime,
creates less dust and is kinder to the skin. c) Limestone is more readily available than lime, since there are more limestone
quarries than lime plants. d) The effects of over-addition of limestone are much less than the effects of the
over-addition of lime. e) Carbon dioxide is released to the atmosphere when lime is produced, both
from the breakdown of the limestone to quicklime and carbon dioxide in a kiln and from the burning of the fuel used to heat the kiln, which in South Africa is generally coal.
f) Potable waters are stabilised at a much lower pH when limestone is used than when lime alone is used.
g) The sludge produced has a higher density and therefore a lower volume when limestone is used in place of lime.
h) Automatic pH control systems are not required when using limestone. i) Dry lime feeders or slurry preparation tanks and slurry dosing systems are
required when adding lime. This equipment is often problematic. j) Lime must be stored under cover and protected from rain, whereas limestone
can be stored in the open. Due to the nature of limestone there are practical problems associated with its use in the water treatment. These include:
a) The low dissolution rate of limestone relative to lime. b) A low limestone utilisation rate, generally as a result of its low dissolution
rate.

2
c) Armouring (the formation of an impervious coating on the surfaces of the limestone particles) occurs in limestone contactors and even in fluidised bed reactors. (Hammarstrom, Sibrell & Belkin, 2003). Armouring has tended to limit the application of limestone to low coloured water and waters that have low dissolved heavy metal concentrations.
Some of these limitations have been partly overcome during the last 15 to 20 years in various processes designed specifically for the use of limestone in the neutralisation of acidic waters, especially Acid Mine Drainage (AMD). However, the newer plants have generally become complicated and expensive. In Chapter 2 “Literature Survey” of this report further detail of these newer processes has been included. 1.3 THE LIMESTONE TEETER BED REACTOR The Limestone Teeter Bed Reactor was developed in order to overcome the practical problems associated with the use of limestone in the treatment of potable water supplies. A teeter bed can be considered as a packed bed in which the upflow velocity is just high enough to fluidise the bed, i.e. the bed is in a state of incipient fluidisation. This state occurs when the upward force exerted by the fluid on the particles is just sufficient to balance the net weight (i.e. the submerged weight) of the bed and the particles begin to separate from each other and “float” in the fluid. Alternatively, the teeter bed can be considered as a hindered bed in which the solids concentration is maximised at all levels within the bed. The limestone teeter bed reactor (LTBR) is a moving bed limestone contactor, generally built in three sections: a reservoir section at the bottom, which is normally cylindrical in shape and holds the coarsest and heaviest particles, a conical middle section (the teeter bed section) and a cylindrical upper section (the elutriation section). The LTBR is designed on the basis that the limestone particles within the teeter bed section are all in a state of incipient fluidisation. Constant jostling of the teetering limestone particles cleans the particles of adhering impurities in the limestone and precipitated metal/colour compounds and hydroxides, thereby ensuring optimal limestone dissolution rates. Precipitates with a density less than that of the limestone “suspension” rise through the bed and enter the elutriation section above the teeter bed. The density of the limestone teeter bed slurry is high, whereas the iron and aluminium precipitates have very low densities and are very small when they are formed, and hence the precipitates are readily ejected from the teeter bed and into the elutriation section. The fine limestone particles generally remain “active” in the elutriation section until their continued dissolution leaves only very small particle weighing a small fraction of their original mass. The cylindrical reservoir section operates at a high upflow velocity and holds the freshly added limestone particles until they become small enough to rise into the teeter bed section. Without this reservoir section, freshly added coarse limestone particles would collect in the bottom of the teeter bed section, displacing smaller

3
particles upwards into higher zones in which the upflow velocities are too low to maintain them in a state of incipient fluidisation, i.e. they become static. The reservoir section increases the time for which the LTBR can operate without requiring to be recharged with fresh limestone. Advantages claimed for the limestone teeter bed reactor include:
LTBRs can treat water having high levels of colour associated with natural organic matter and inorganic iron.
Limestone teeter bed reactors require no flushing and do not block in operation, which means that very little limestone is wasted and downtime is minimised.
Large LTBRs, having high feed water flow rates, can be constructed. . LTBRs can stabilise waters having high levels of dissolved metals and
turbidity. There is a high limestone solids concentration within the LTBR, which
reduces its size Reduced running costs of the proposed technology means that more money is
available for urgent social needs. Technology proposed is appropriate for use in rural areas, using semi-skilled
labour as well as in urban areas All equipment and water treatment chemicals are locally available. Using limestone instead of lime reduces carbon dioxide emissions and global
warming. Achieving these aims is equivalent to demonstrating that limestone can effectively replace the use of lime in all drinking water installations, other than in applications that require the use of very high pH values, such as in lime softening and magnesium concentration reduction. 1.4. AIMS OF THIS RESEARCH PROJECT The aims of this project are: To demonstrate the use of the Limestone Teeter Bed Reactor in the stabilisation of soft, corrosive potable water surface supplies and the treatment of Cape coloured waters and to develop design parameters for the construction of full size plants, based upon the LTBR technology. In addition the aims include:
a) Providing conditions in which the dissolution of the limestone particles is optimised.
b) Increasing the utilisation of the limestone to close to 100%. c) Overcoming the limitations imposed by armouring of the limestone particles. d) Eliminating the use of automatic pH control systems, dry feeders, slurry
preparation tanks and slurry dosing systems. e) Providing a system that is simple and cheap to operate and maintain.

4
CHAPTER 2 LITERATURE SURVEY
2.1. HINDERED BED CLASSIFIERS. (TEETERED BED SEPARATORS) Hindered-bed classifiers have been used extensively throughout the minerals processing industry for several years. These classifiers are typically used to categorize mineral particles according to both size and density. They have been proven useful in recent years for density-based separations in fine coal applications. Also, these devices have been of particular interest for carbon recovery from both active fine coal streams and refuse ponds. With low capital cost and high capacities, hindered-bed classifiers have found their way into many different sectors of the mining industry. .
Figure 2.1 The Floatex Hydrosizer.
The Floatex Hydrosizer is a hindered settling devise. It utilizes a current of water, introduced across the bottom of the Hydrosizer, to expand sand slurry into a state of teeter. In this teetered state, the sand grains will classify themselves so that the coarse grains report to the bottom where they will stay relatively close to each other with high water velocities flowing between them. The finer particle will be dispersed to the higher levels where they will stay in more open suspension and therefore, the water velocity between them will be low. The bed is of straight rectangular section and does no taper. The finer particles are fully fluidised.

5
2.2. FLUIDISED BED REACTORS Fluidised bed reactors are used in the manufacture of products ranging from jet fuel to fertilizers. The packing is commonly a catalyst, and the fluidised bed creates a larger surface area for chemical reactions to occur which leads to faster reaction rates and higher yields. Typical uses include the cracking of hydrocarbons, coal gasification, carbonisation and calcinations. Fluidised beds have also been used for heat exchange, drying operations, coating (for example the coating of polymers onto metals), solidification and granulation, the growth of particles, adsorption and desorption and various biological processes. 2.3 LIMESTONE CONTACTORS The CSIR in Stellenbosch developed a local version of the packed bed limestone contactor in which the aggressive raw water is contacted with readily soluble, friable limestone pebbles having a grading of +12 mm –15 mm. In this manner, alkalinity, calcium and pH are all increased to effect partial stabilisation. These limestone contactors can treat surface waters containing only very low concentrations of iron (< 0.1 mg/l), aluminium (< 0.15 mg/l) and turbidity (< 1NTU) and are therefore located after the coagulation, flocculation, settling, filtration and disinfection processes to limit the accumulation of sludge within the limestone contactor. In the local units, which use a soft, friable and highly soluble limestone, sludge resulting from the breakdown of the limestone pebbles and consisting mainly of limestone mud, silica and metal oxides must be flushed frequently from the limestone contactors. Larger volumes of sludge from the precipitation of added iron and aluminium salts can block them completely. Some fairly large units are now in operation. The CSIR also developed a limestone contactor specifically for stabilising underground water containing dissolved iron. The maximum capacity of the CSIR Spraystab limestone contactor is given as 2.5 m3/h when the iron concentration exceeds 3mg/l. The CSIR designed limestone contactors are not normally applied to the treatment of coloured surface waters. The maximum limit for colour in the feedwater to the larger municipal units is quoted as 30 mg/l Pt units, which represents water with very little colour. In the basic CSIR surface water limestone contact process, the aggressive raw water is contacted with limestone pebbles in a fixed bed reactor as shown below in Figure 2.2. The raw water is passed through a false bottom and percolates in an upward flow direction through a granite aggregate layer before entering a fixed limestone bed. The natural CaCO3 dissolution driving force of the water (reflected by the calcium carbonate dissolution potential or CCDP) is used to take up calcium and carbonate

6
species by exposing the water to graded particles of potable water grade stabilisation limestone (CaCO3).
Figure 2.2 The CSIR Limestone Contactor.
In this manner, alkalinity, calcium and pH can all be increased to effect partial stabilisation. Thereafter the partially stabilized water flows out through a bell-mouthed spillway to a reservoir. 2.4 LIMESTONE FILTERS (Extract from Ødegaard, Eikebrokk & Storhaug, 1999). Because of the need for corrosion control, some alternative filter configurations have been developed with calcium carbonate as filter medium. Normally a grain size in the range of 1-3 mm is used. Two different systems are in use (Figures 2.3 & 2.4). In the first system (Figure 2.3) calcium carbonate is used as the bottom media in a down-flow three media filter with conventional anthracite/sand as the upper media. Particle separation takes place in the anthracite/sand part of the filter while the calcium carbonate part has the function of carbonatisation. Most of the plants use iron chloride as coagulant (typical dosage 3,3-5 mg Fe/l) in order to reach the operating pH of 3,5-4,0 that is required to ensure sufficient dissolution of the CaCO3. In some of these plants CO2 is added as well (typically 6-15 mg/l) in order to minimize the iron dosage. This leads to lower sludge production and chloride concentration. The filtration rate is typically 5 m/h.

7
Figure 2.3 Three-Media Filter Figure 2.4 Single Medium CaCO3 Filter
The other system is an up-flow filter with calcium carbonate as the only filter medium. Ferric chloride is used both as coagulant and as pH-control chemical, requiring very high iron dosages (around 10 mg Fe/l) in order to reach the necessary pH of around 3,0-3,5. In our view, this is a questionable process because it may lead to high concentrations of both iron and chloride in the final water. pH, grain size and contact time influence the dissolution of the marble in order to arrive at the combination of pH, alkalinity and Ca-concentration aimed for (see above). In a typical Norwegian situation, it is experienced that the empty bed contact time in the marble part of the filter must be at least 15-25 minutes. A filter depth of the marble layer of 150-250 mm at a filter rate of 5 m/h is required (see Figure 2.4). It is, of course, the intention that the marble grain shall dissolute and shrink in size. After reaching a critical lower grain size, the smallest grains are washed out during back-washing and new marble grains have to be supplied. New grains are supplied during back washing in order to ensure the proper grain grading at the start of a new filter cycle. In the three media filters a typical back-washing routine is composed of 3 min water backwash at 60-80 m/h, 3 min backwash with air (together with water) and finally 6,5 min water backwash. Overall this results in relatively high backwash water consumption, in the range of 6-11 %. It is very important that back-washing is performed optimally. If not, the sand and marble layers may mix, resulting in more rapid head-loss development over time and more frequent backwash. Typically backwashing takes place 1-2 times per day for the three-media filters and the calcium carbonate lost through backwash is expected to be in the range of 15-20 %. Several different filter configurations are in use. Open down-flow two-media (anthracite/sand) filters are dominating (see typical configuration in Figure 2.3), but single media up-flow backwash filters as well as single media up-flow continuously washed filters (Dynasand) are also used. Lately, experiments have demonstrated that the anthracite may favorably be replaced by an expanded clay aggregate filter medium (Filtralite) that is produced in Norway. The design filter rate in two-media filters is primarily determined by the desired filter run length and whether or not a polymer is used as flocculation/filtration aid. Experiences from treatment of typical Norwegian waters with a colour in the range of 25-45 mg Pt/l in full scale as well as in pilot plants, have given the following empirical relationship between filter run length, Tf (hrs), and filtration rate, vf (m/h);

8
Tf = k1/vf - 4,5, where k1 = 80 when alum is used alone and k1=180 when an additional polymer dosage of 0,1 mg/l is used. It is obvious from this relationship that a small dosage of flocculant (0,1 mg/l of polymer) can increase the filter run length considerably. Or one may use a considerably higher filter rate at a given run time. The filters are designed to yield filter run times above 6 hrs. In two-media filters, this requires, for a typical water, a design filter rates less than about 8 m/h when alum is used alone and less than about 16 m/h when alum is used together with a polymer as flocculation/filtration aid. Back washing is carried out with backwash rates in the order of 30-70 m/h, sufficient to expand the bed about 30 %. Back washing is typically carried out in sequences of 4-8 min water backwash followed by 1-2 min air backwash (at the same rates as the water back-wash) followed by another water back-wash for a few minutes. 2.5 LIMESTONE FLUIDISED BED REACTORS In a pilot plant study to determine the technical feasibility of neutralising sulphuric acid rich water using fluidised bed technology (Maree and Du Plessis, 1994), a precipitated, by-product, limestone was utilised completely when testing iron (III)-rich water, but with iron (II)-rich water, coated limestone particles accumulated in the fluidised-bed reactor. About 70 % of the limestone was utilised in the case of water containing 600 mg/l iron (II). A contact time of 4 minutes was sufficient for the neutralization of acid water containing 4 g/l free acid and 580 mg/l iron (III), compared to 40 minutes when iron (II) replaced iron (II). A flow diagram of the equipment used in the trials is reproduced below as Figure 2.5. The feed flowrate was only 30 to 60 l/hour, but the recycle flowrate was set at 2100 l/hour in order to fluidise the limestone by increasing the bed volume to between 20 and 50% above its static volume. This means that the bed was fluidised and not in a state of teeter.
Figure 2.5 Flow Diagram of Cone-Shaped Fluidised Bed and Crystallisation Reactor

9
2.6 PULSED LIMESTONE BED TREATMENT OF ACID MINE DRAINAGE Acid Mine Drainage and highly coloured waters, after the additional of a coagulant, are similar in that they are both acidic and contain high levels of dissolved iron and/or aluminium. The main difference between them is that the AMD often contains high sulphate levels whilst the sulphate levels in the potable water supplies are generally low. A new AMD treatment technology, developed by the U.S. Geological Survey, uses CO2 in a pulse fluidized limestone bed reactor to minimize armour formation and enhance limestone reaction with AMD. (Hammarstrom, Sibrell & Belkin, 2003), (Sibrell, Watten & Boone, 2003), (Sibrell, Wildeman, Frienmuth, Chambers & Bless 2005). Limestone was characterized before and after treatment with constant flow and with the new, pulsed limestone bed process using AMD from an inactive coal mine in Pennsylvania (pH=2.9, Fe =150 mg/l, acidity =1000 mg/l CaCO3). In constant flow experiments in a fluidized bed, limestone was completely armoured with reddish-colored ochre within 48 h. Effluent pH initially increased from the inflow pH of 2.9 to over 7, but then decreased to <4 during the 48 h of contact. In the absence of CO2 and pulsing, limestone grains were coated with a layer of gypsum crystals and become almost completely encapsulated in a 10 to 30 mm thick Fe–Al hydroxysulfate armor within 48 h. Although the ochre armour readily flakes off upon drying, the gypsum coating under the armour appears to be more stable and retards further limestone dissolution. The pulsed fluidized limestone beds was tested for the remediation of acid mine drainage at the Friendship Hill National Historic Site, in southwestern Pennsylvania. A schematic of the AMD treatment apparatus is shown in Figure 2.6. The apparatus shown was sized to treat 230 liter per minute. It consisted of four 61 cm (24 in) diameter fiberglass columns containing limestone, and one 46-cm (18-in) diameter column (the carbonator) functioning as a packed tower for CO2 absorption into the water. The height of the limestone columns and the carbonator was 215 cm (84 inches). Incoming water was routed to one set of two columns containing limestone during a rinse/recharge cycle. The limestone particle size was roughly 0.1 to 1.0 mm. The flow fluidized a single limestone bed for a period of one minute, and then flow was diverted to the second column for one minute, while the bed in the first column settled. Therefore, water was discharged to the drain continuously. This pulsed-bed operation allows higher flow rates to be passed through the limestone bed, thus providing for better mixing and scouring of the particle surfaces. The flow path was controlled by an electrically actuated three-way ball valve operating on a timer-controlled program.

10
Figure 2.6. Schematic of the Pulsed Limestone Bed Process. Meanwhile, the water in the other set of two columns was recirculated through the carbonator, where carbon dioxide gas can be added to the water. This was termed the treatment cycle, and the water was diverted back and forth between the two limestone columns on a one-minute cycle as in the recharge phase. This mode of operation continued for a total of four minutes. A second set of ball valves was then actuated, and the columns that had been receiving incoming water were switched to the treatment cycle, and the columns that had been on treatment cycle were switched to receive and discharge water. Thus, at any one time, one out of the four columns was receiving and discharging water, and one of the columns was receiving water recycled through the carbonator. The system also recovered and reused some of the CO2
dissolved in the effluent. After discharge from the columns, the effluent was sent to a 0.4 m diameter by 3 m tall stripping tower, where air was passed counter currently to the water through a packed bed. The CO2 was stripped from the effluent with a counter current flow of air and recycled to a second paired packed bed reactor receiving incoming AMD. The 230 litre/min treatment system was constructed and operated over a fourteen-month period from June 2000 through September 2001. Over this period of time, 50 metric tons of limestone was used to treat 50 million liters of water. The influent water pH was 2.5 and acidity was 1000 mg/L as CaCO3. Despite the high potential for armouring at the site, effluent pH during normal plant operation ranged from 5.7 to 7.8 and averaged 6.8. As a result of the high influent acidity, sufficient CO2 was generated and recycled to provide a net alkaline discharge with about 50 mg/L as CaCO3 alkalinity. Additions of commercial CO2 increased effluent alkalinity to as high as 300 mg/L, and could be a useful process management tool for transient high flows or acidities. Metal removal rates were 95% for aluminum (60 mg/L in the

11
influent), 50 to 90% for iron (Fe), depending on the ratio of ferrous to ferric iron, which varied seasonally (200 mg/L in the influent), and <10% of manganese (Mn) (10 mg/L in the influent). Ferrous iron and Mn removal was incomplete because of the high pH required for precipitation of these species. Metal hydroxide sludges were settled in settling tanks, and then hauled from the site for aesthetic purposes. Over 450 metric tons of sludge was removed from the water over the life of the project. The dried sludge was tested by the Toxicity Characteristics Leaching Protocol (TCLP) and was found to be non-hazardous. Limestone removed from a pulsed bed pilot plant was a mixture of unarmoured, rounded and etched limestone grains and partially armoured limestone and refractory mineral grains (dolomite, pyrite). The 30% of the residual grains in the pulsed flow reactor that were armoured had thicker (50 to 100 mm), more aluminous coatings and lacked the gypsum rind that developed in the constant flow experiment. Aluminium-rich zones developed in the interior parts of armor rims in both the constant flow and pulsed limestone bed experiments in response to pH changes at the solid/solution interface. It was concluded that armouring of the type identified during the trials conducted using the pulsed bed reactors on AMD was very unlikely to occur when using limestone to treat potable water supplies. This is because the sulphate levels in the potable water supplies are well below the concentrations required to form gypsum and to precipitate aluminium or iron hydroxysulphates. 2.7. THE CIRCULATOR CLARIFIER
A. Reagents B. Reaction Zone C. Hydro-ejector D. Sludge Concentration. E. Clarification Zone. F. Clarified water collection channel. G. Overflow. H. Deflection Skirt.
Figure 2.7 The Circulator Clarifier.

12
This clarifier is used for cold-process carbonate removal using lime, i.e. water softening. Although it utilises a steeply-sloping cone similar in shape to the limestone teeter bed and a deflection skirt, which looks very similar to a Draught Tube, and both are centrally mounted inside a tall circular clarifier, the Circulator is designed to provide optimum conditions for the precipitation of calcium carbonate at high pH values, not the dissolution of limestone in an acidic water stream. The calcium carbonate crystals are formed spontaneously from ultra-microscopic nuclei, whilst the settled carbonates sludges are recirculated back into the reaction zone using a Hydro-ejector. There is no attempt to create teeter bed conditions within the cone. 2.8. THE GYRACTOR
1. Reactor. 2. Catalyst powder supply tank. 3. Treated water outlet. 4. Sampling Taps. 5. Evacuation of exhausted catalysts 6. Air outlet.
Figure 2.8 The Gyractor
The Gyractor is also used for cold-process carbonate removal. The difference between the Circulator Clarifier and the Gyractor is that the Gyractor uses a “catalytic” mass of grains of marble or sand of between 200 microns and 1 mm in size. The water and the lime are introduced tangentially at the bottom of the cone so as to cause a gyratory movement of the contact mass. The calcium carbonate crystals form on the surfaces of the grains of marble or sand, which are periodically evacuated and replaced by fresh “catalytic powder”. Teeter bed conditions are not created in the cone. 2.9. LIMESTONE TEETER(ED) BEDS & TEETER BED REACTORS No references to either Limestone Teeter(ed) Beds or Teeter Bed Reactors could be found in any of the literature surveyed.

13
CHAPTER 3 THE OPERATION OF A SMALL-SCALE PILOT PLANT
LIMESTONE TEETER BED REACTOR
3.1. DESIGN OF THE SMALL SCALE PILOT PLANT The design of the LTBR was based upon the application of the Theory Involved in Sizing of a Limestone Teeter Bed Reactor, reproduced in Appendix B, which was used to produce Table 3.1 below. The small-scale pilot plant LTBR was constructed in 3 mm thick clear PVC sheeting, so that the flow patterns within the limestone bed could be visually examined. The LTBR was built in 2 sections, bolted together. The bottom section has a lower inlet diameter of 55 mm, a height of 1.1 m and a top diameter of 125 mm. The top section has a lower inlet of the same diameter as that at the top of the lower section, i.e. 125 mm, a top diameter of 200 mm and a height of 1.1m. An elutriation section, also of 200 mm diameter was bolted onto the top section of the teeter bed. The height of water in the elutriation section is controlled by selectively plugging, with rubber grommets, a series of 5 mm diameter holes drilled at different levels through the walls of the elutriation section. By this means the height of the elutriation section can be varied between 100 and 425 mm. It should, however, be appreciated that the effective height of the elutriation section is the distance between the top of the expanded limestone bed and the overflow level. A single, standard filter nozzle fitted into a circular plated between two flanges at the bottom of the LTBR is used to support the limestone within the teeter bed. An overflow weir and outlet at the top of the elutriation section lead to the settler. To overcome the low pressure of the feedwater, a 200 litre tank, level control valve and a small centrifugal pump were added into the feed line before the teeter bed.

14
Ta
ble
3.1.
Lim
esto
ne T
eete
r B
ed R
eact
or. S
mal
l Sca
le P
ilot P
lant
Siz
ing
Cal
cula
tions
.
PIL
OT
PLA
NT.
0.5
m3
per
hour
.
TO
DE
TER
MIN
E d
p or
D .
m Q
dp
Dr
rp
gV
alue
of
vh
Vr
Dp
Vis
cosi
ty F
low
rate
Par
ticle
LTB
R
Flu
id P
artic
leA
ccel
.M
od. E
rgun
Upf
low
LT
BR
Vol
ume
Res
iden
ce
Hea
d D
iam
eter
Dia
met
er D
ensi
ty D
ensi
tyG
ravi
tyE
quat
ion
Vel
ocity
Hei
ght
Tim
eLo
sskg
.m-1
.s-1
m3 .s
-1
m
m k
g.m
-3
kg.m
-3 m
.s-2
kg.m
-2.s
-2 m
.h-1
m
m3
m
in.
kP
aFo
r th
e or
igin
al b
otto
m o
f the
teet
er b
ed0.
001
0.00
0139
0.00
400.
059
1000
2710
100.
0018
5.03
2.3
0.03
323.
9821
.95
For
the
cent
re o
f the
teet
er b
ed0.
001
0.00
0139
0.00
100.
125
1000
2710
100.
0040
.78
1.2
0.02
533.
0411
.45
For
the
top
of th
e te
eter
bed
0.00
10.
0001
390.
0006
0.2
1000
2710
100.
0015
.93
NO
TES
1)
d p o
r D
may
be
dete
rmin
ed fr
om th
e M
odifi
ed E
rgun
equ
atio
n, a
t inc
ipie
nt fl
uidi
satio
n:
2) H
ead
loss
Dp
thro
ugh
the
solid
s in
the
LTB
R, a
t inc
ipie
nt fl
uidi
satio
n, is
giv
en b
y:
kP
a
Bot
tom
+ T
op S
ectio
n
Top
Sec
tion
Onl
y
081.
3214
804
2
22
gd
DQ
dD
Qp
pp
0001)
1(p
hg
p

15
3.2. INVESTIGATION OF THE CONDITIONS NECESSARY TO CREATE AND MAINTAIN A STATE OF INCIPIENT FLUIDIZATION THROUGHOUT THE TEETER BED These pilot plant trials focused on attempts to adjust the grading of the limestone and the upflow feedwater velocity through the LTBR so as to maintain the full depth of the limestone bed in a condition of incipient fluidisation. The cross-sectional area of the reactor increases with the distance from the bottom of the LTBR, i.e. in the direction of flow of the water, as does the volume of each horizontal slice of equal thickness through the bed. The implication of this is that for the bed to be in a condition of incipient fluidization at every level from the bottom to the top of the teeter bed, the grading of the limestone, i.e. the mass of each size fraction, (more strictly the volume of each size fraction) must equal the volume of the bed available to accommodate that fraction. In general, the smaller the size of the limestone particle, the larger the mass required of that particular particle size fraction. Further complications arise from:
a) The decrease in the size of each limestone particles as it dissolves. b) The breakdown of each single limestone particle into a range of smaller
particles as the original particle dissolves. This is especially true for some of the highly friable limestones found in the Western Cape, such as the P & B limestones. This is probably a big advantage in view of the above requirement.
c) Variations in the feed water flowrate to suit changes in potable water demand.
d) The intermittent addition of fresh limestone, which will generally be coarser
than the limestone remaining in the bed, but will have a grading, determined more from commercial rather than theoretical considerations.
e) The rate of dissolution of the limestone particles depends upon:
the degree of saturation of the feed water with respect to calcium carbonate the dosage of coagulant added mass transport resistances the purity of the limestone, which is variable, since limestone is a naturally
occurring mineral the temperature of the water the residence time in the teeter bed
Consideration of all the above factors indicate that it is unlikely that conditions of incipient fluidization can be achieved throughout the limestone teeter bed, even at start-up, and that these optimum conditions are probably almost impossible to maintain.
16
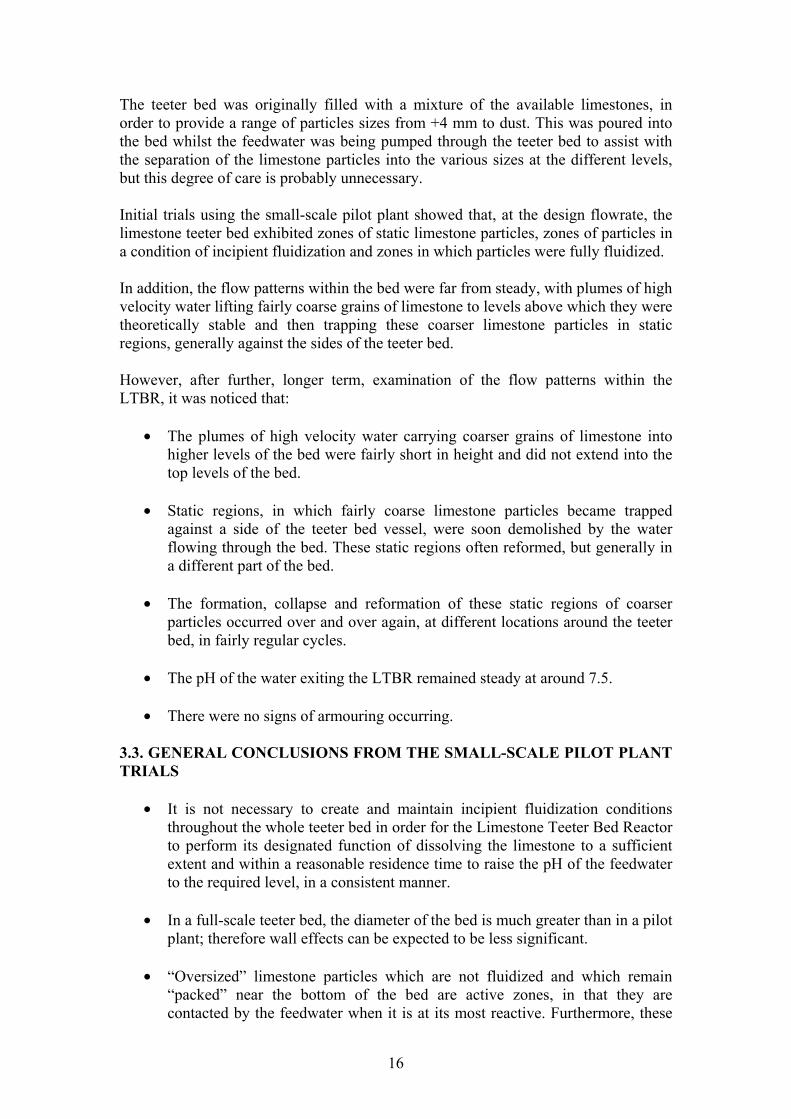
The teeter bed was originally filled with a mixture of the available limestones, in order to provide a range of particles sizes from +4 mm to dust. This was poured into the bed whilst the feedwater was being pumped through the teeter bed to assist with the separation of the limestone particles into the various sizes at the different levels, but this degree of care is probably unnecessary. Initial trials using the small-scale pilot plant showed that, at the design flowrate, the limestone teeter bed exhibited zones of static limestone particles, zones of particles in a condition of incipient fluidization and zones in which particles were fully fluidized. In addition, the flow patterns within the bed were far from steady, with plumes of high velocity water lifting fairly coarse grains of limestone to levels above which they were theoretically stable and then trapping these coarser limestone particles in static regions, generally against the sides of the teeter bed. However, after further, longer term, examination of the flow patterns within the LTBR, it was noticed that:
The plumes of high velocity water carrying coarser grains of limestone into higher levels of the bed were fairly short in height and did not extend into the top levels of the bed.
Static regions, in which fairly coarse limestone particles became trapped
against a side of the teeter bed vessel, were soon demolished by the water flowing through the bed. These static regions often reformed, but generally in a different part of the bed.
The formation, collapse and reformation of these static regions of coarser
particles occurred over and over again, at different locations around the teeter bed, in fairly regular cycles.
The pH of the water exiting the LTBR remained steady at around 7.5.
There were no signs of armouring occurring.
3.3. GENERAL CONCLUSIONS FROM THE SMALL-SCALE PILOT PLANT TRIALS
It is not necessary to create and maintain incipient fluidization conditions throughout the whole teeter bed in order for the Limestone Teeter Bed Reactor to perform its designated function of dissolving the limestone to a sufficient extent and within a reasonable residence time to raise the pH of the feedwater to the required level, in a consistent manner.
In a full-scale teeter bed, the diameter of the bed is much greater than in a pilot
plant; therefore wall effects can be expected to be less significant.
“Oversized” limestone particles which are not fluidized and which remain “packed” near the bottom of the bed are active zones, in that they are contacted by the feedwater when it is at its most reactive. Furthermore, these

17
oversized limestone particles represent an in-process source of make-up limestone as they dissolve and become smaller rise into the main bed and start to teeter.
The breakdown of a limestone particle into a range of smaller particles as the
original particle dissolves is related to the highly friable nature of the limestones found in parts of the Western Cape. These limestone fines, since they possess high surface areas, perform the essential task of raising the pH of the feedwater to close to its limestone equilibrium value. Given the increase in the diameter of the vessel with height, these fine limestone particles remain within the LTBR, provided that the vessel has not been overfilled.
Coarse, single-sized limestone with a nominal particle size of 2 to 4 mm
(Poultry Grit) may used for the initial fill and for make-up of both the teeter bed reactor and the limestone filter column.
Throughout the trials, a mixture of limestone particles of different sizes, from
coarse to very fine, existed within the teeter bed.
Aluminium hydroxide and aluminium/colour precipitates do not become trapped within the teeter bed, but are generally carried through the elutriation section and into the clarifier.
When operated at a pH in the range 4.5 to 5.5 the colour removal stage works
well and consistently, provided that the alum dosage is correct, the alum is added either after or with the limestone and the energy conditions are within the right range.

18
Figure 3.1 The Small-Scale Limestone Teeter Bed Reactor, Floc Bed Clarifier & Limestone Filter Column.

19
CHAPTER 4 DESIGN AND CONSTRUCTION OF A LARGER PILOT PLANT
4.1 THE COMBINED LTBR/CLARIFIER The decision was made to locate the Limestone Teeter Bed Reactor centrally inside the clarifier. The main factors influencing this decision were: 4.1.1 The Small Size and Height of the LTBR The diameters at the top and bottom of a Limestone Teeter Bed Reactor can be estimated using the Ergun Equation for a given design flow rate and maximum and minimum limestone particle diameters (See Appendix B). The necessary residence time, and therefore the height of the LTBR can be determined from laboratory or pilot plant trials, using the given raw water source and available limestone. The small scale pilot plant trials indicated that the highly friable limestones found in the Western Cape dissolved rapidly at the energy conditions existing inside the LTBR and that an empty vessel residence time of 3 minutes raised the pH of the Sedgefield raw water to 7.5, which is well above the optimum pH for colour removal. Since the residence time in the clarifier may be in the order of 2 hours, these results show that the LTBR occupies only some 2% of the volume of the clarifier. 4.1.2 Avoidance of Floc Breakup Flocs formed within the top section of the LTBR were broken whilst being transported from the small scale LTBR to the clarifier and when passing through the small holes drilled through the top of the elutriation section of the small-scale teeter bed, whilst further breakup of the flocs probably also occurred in the launder and in the piping between the LTBR and the clarifier due to the excessive drop from the teeter bed to the clarifier. Combining the two pieces of equipment considerably reduces the footprint of the plant and should reduce the capital costs considerable, since only one foundation is required. 4.2. FREQUENCY OF LIMESTONE RECHARGING The volume of the teeter bed is 16 litres. Under conditions of incipient fluidization throughout the teeter bed the solids volume fraction is 0.558. In practice, the teeter is not filled completely, to provide space for the elutriation section above the teeter bed and to limit the carry-over of limestone dust that occurs during loading of fresh limestone. The mass of limestone in the bed averaged about 15 kg. The mass of limestone used per hour is dependent upon the acidity of the raw water, the alum dosing rate and chosen pH for colour removal. At Sedgefield, the limestone consumption was approximately 60 g/hour, 30 g/m3 or 1.5 kg/day at the design feed flowrate of 500 l/hour.

20
The small-scale LTBR pilot plant trials indicate that:
The pH of the water leaving the LTBR can be held within the optimal range for colour removal (probably from 4.5 to 5.5) whilst the mass of limestone in the teeter bed drops by some 10% per 24 hours.
The volume of the teeter bed, as designed, is just sufficient when the plant is
operated at 500 l/hour and the limestone is recharged once per day.

21
CHAPTER 5 THE RESULTS OF TRIALS PERFORMED ON THE LARGE-
SCALE PILOT PLANT
5.1. PILOT PLANT MODIFICATIONS TO ENSURE THAT COLOUR REMOVAL IS CARRIED OUT WITHIN THE OPTIMAL pH RANGE The optimum pH for colour removal using alum as the coagulant is within the range 4.5 to 5.5. Within this range the coagulant dosage required to reduce the colour to below 20 colour units is minimised and this, in turn reduces the mass of alkali necessary to neutralise the acidity of the alum solution, minimises the volume of sludge produced and lowers the operating costs of the colour removal process. The equilibrium pH between the water and limestone is generally in the range 7 to 8 after the addition of sufficient aluminium to achieve adequate colour removal. This is well above the optimum pH for colour removal. One of the main benefits claimed for the use of LTBR technology in the treatment of coloured waters is that plants based upon this technology can be run without expensive, automatic control systems. It is therefore necessary to devise a simple, manual method to set the pH and then ensure that the colour removal stage runs, without any intervention, for at least 12 hours and, if possible, for 24 hours. Some of the methods devised and tested are listed below: 5.1.1 Reducing the Mass of Limestone in the LTBR One method tested was to reduce the effective size of the teeter bed by removing most of the limestone. This reduces the residence time to only a few seconds and drops the pH of the water exiting the LTBR to any desired value. However, as the limestone is consumed and the size of the limestone bed becomes smaller, the pH drops fairly rapidly. The pH could probably be maintained within a fairly tight range with the addition of a dry limestone feeder and pH control, but this would make the plant unnecessarily complicated and expensive. 5.1.2 Using Coarse Limestone Particles A second method envisaged involved filling the teeter bed with coarse limestone, say 4 mm particles only, to reduce the rate of limestone dissolution, which is surface controlled at low pH values. However, the teeter bed would inevitably end up containing a range of limestone particle sizes as each limestone particle dissolves and decreases in size and as the limestone bed is replenished with fresh, coarse limestone particles.

22
5.1.3 Using Dolomitic Limestone in Place of Calcitic Limestone A third method, one that was tested on the pilot plant, is to use dolomitic limestone in place of calcitic limestone. Initially the dolomitic limestone dissolved at about the same rate as the calcitic limestone and the pH increased to over 7.5. However the pH then decreased quite rapidly to below 5. When the dolomitic limestone was removed from the teeter bed it was found to be coated all over with a brown layer, which was probably an iron oxide rich layer of magnesium carbonate. The limestone inside this outer “skin” proved to be quite soft. It is known that the calcite component of dolomite can dissolve preferentially and that the remaining magnesium carbonate is much slower to dissolve, but this sample of dolomitic limestone appeared to contain high levels of iron, which affected the way in which the limestone dissolved. It is possible that if the pilot plant were to be run at a much higher flowrate, then the increased agitation could break down the layer of iron rich magnesium carbonate around each particle, implying that dolomitic limestone might be suitable for use in the LTBR. However, it is unlikely that the pH will remain sufficiently constant. 5.1.4 Splitting the Raw Feed into 2 Streams A further possible method is to split the feed flow into two streams, one of which goes to the limestone teeter bed reactor, whilst the other stream bypasses the LTBR. These two streams can then be blended together in the right ratio in order to achieve a mixed pH within the specified range. Theoretically, the alum solution can be added to the raw water, to the water stream that passes through the LTBR, to the bypass stream or to the streams after they are blended together. Each of these four alternative arrangements was tested, with the following results:
a) Alum solution added to the raw water stream. The pH of the blended stream could be maintained within the specified range quite easily. However, precipitation of the aluminium in the bypass stream takes place only once the two streams are blended and, at this stage, colour removal and floc formation is poor, since the energy conditions necessary for good colour removal and floc formation exist only within the LTBR.
b) Alum solution added only to the water stream that passes through the LTBR.
In this arrangement all the aluminium is precipitated within the LTBR, either in the form of an aluminium/colour complex or as aluminium hydroxide. There is then not sufficient aluminium remaining to precipitate the colour in the water stream bypassing the LTBR, when the two streams are blended.
c) Alum solution added only to the water that bypasses the LTBR. In this
arrangement the alkalinity in the raw water that has passed through the LTBR is not high enough to neutralise the acidity in the bypass. The pH of the blended water is therefore generally below the specified range.

23
d) Alum solution is added to the blended streams. In this arrangement the alkalinity in the blended water is not high enough to neutralise its acidity. The pH of the blended water is then well below the specified range.
As a result of these tests, the decision was made to assess the effects of blending the two streams inside the limestone bed. During these initial trials, some of the raw water stream was fed into the bottom of the LTBR and passed upwardly through the whole limestone bed, so that limestone dissolution was close to equilibrium and the resultant pH was high but stable, whether limestone in the bed was fresh or old, over a wide range of flowrates. Alum solution was dosed into the remainder of the raw feedwater, which was dosed vertically into the top of the limestone bed; with the depth of injection of the raw water plus alum i.e. the residence time of this part stream within the limestone teeter bed, determining the final, mixed pH. This arrangement prevented the premature formation of aluminium hydroxide and provided the right energy conditions for mixing the feedwater and alum solution in contact with limestone, for the precipitation of aluminium/colour complexes and for the formation of flocs. It proved relatively easy to adjust the depth of penetration of the alum solution into the limestone teeter bed to provide any pH within the required range for colour precipitation and to maintain this pH value for short periods, but, as the limestone was consumed, the level of the top of the limestone bed dropped, the effective penetration into the bed decreased, as did the resulting pH of the mixed water. When fresh limestone was added the pH increased. 5.1.5 The Simple Alum Dosing Float A simple alum dosing float was devised and manufactured and is illustrated below as Figure 5.1.

24
Figure 5.1 The Simple Alum Dosing Float. This device enabled alum solution to be injected at a relatively constant depth below the top of the limestone bed, since the float and dosing pipe followed any changes in the level of the top of the limestone bed. The simple alum dosing float worked well, but suffered from excessive leakage of alum solution from the top of the dosing pipe, above the limestone bed. It was felt that this leakage of alum solution into a region of the teeter bed in which the energy conditions were low resulted in poor mixing of the alum solution with the coloured water. This prevented good floc formation and was probably a factor in the high carry-over of flocs into the filter section. For this reason a non-leaking version of the Alum Dosing Float was devised. 5.1.6 The Leak-Proof Alum Dosing Float In this design there are two fixed concentric pipes and a single “floating” dosing pipe that fits between these pipes. Air is trapped between the two fixed pipes. This trapped air acts as an “air lock” which can occur in an elevated section of any liquid carrying pipeline. This air lock effectively prevents the alum solution from leaking from the dosing system into the LTBR above the desired level. This device is illustrated in Figure 5.2.

25
Figure 5.2. The Leak-Proof Alum Dosing Float. This dosing pipe was installed in the large scale LTBR. One immediate problem encountered was that the “floating” dosing pipe tended to “stick” due to the pipes not being absolutely straight or concentric. Putting flexible rubber joints in both the fixed inner and outer pipes solved this problem. Problems were then encountered with the hollow float, which started to leak. The hollow float was then replaced by a set of disks, some made from polyethylene and some from PVC. By changing the numbers of disks made from each type of plastic the density of the float could be adjusted over a wide range without the danger of the float leaking. Although the floating dosing pipe moved freely up and down when first installed inside the LTBR, it was found that, after a few hours, the float started to stick and this was blamed on fine limestone particles penetrating between the fixed and “floating” pipes. The decision was then made to concentrate on non-mechanical ways of compensating for changes in the level of the top of the limestone bed. 5.1.7 The Internal By-pass System
This method involves inserting a vertical tube concentrically inside the LTBR to act as an internal bypass. Square holes cut in the side of this tube, just above the water level, allow some of the feedwater to by-pass the limestone teeter bed, due to the difference between the density of the limestone “slurry” around the pipe and the water inside the pipe, when the pilot plant is operating. All the alum solution is added to the raw water feed stream before it enters the bottom of the teeter bed.

26
Figure 5.3 The Internal By-Pass System. This system worked well and held the pH of the combined stream constant. However, mixing and floc formation was not satisfactory due, probably, to the low energy conditions at the level at which the two streams blended and this led to excessive floc carryover. A small number of coarse limestone particles are lifted up by the upflow through the internal bypass pipe. This provides a degree of mixing of the particles in the teeter bed with the constant movement of larger sized particles throughout the bed. Cutting the bypass holes lower down the tube, within the top of the limestone bed proved unsatisfactory since the combined pH changed with the level of the top of the limestone bed. 5.1.8 The Self-Compensating Alum Dosing System The Self-Compensating Alum Dosing System is illustrated below in Figure 5.2. As with the other dosing systems, the object is to hold the pH of the water exiting the LTBR to as close to the set pH value as possible, in spite of changes to the top level of the limestone bed.

27
Figure 5. 4 Self-Compensating Alum Dosing System.
Part of the feed flow is dosed into the bottom of the teeter bed and the remainder of the flow is injected into the top of the filter bed, together with all the alum solution, through the Self-Compensating Dosing System. The alum solution, diluted by the part stream of feedwater, drops by gravity vertically downwards inside a 20 mm diameter pipe inside a 32 mm diameter pipe, which is closed at its lower end by a cap. The flow therefore turns around and travels vertically upwards, reaching a level in the 32 mm diameter pipe which depends mainly upon the density of the diluted alum solution and the density of the limestone bed outside the 32 mm pipe. Should the level of the limestone in the teeter bed be low and therefore the pressure outside the dosing system also low, then the dilute alum solution would then pass mainly through the lower holes in the 32 mm pipe, directly into the limestone bed. As the level of the limestone bed rises, the pressure at the level of the lowest outside holes rises which slows the flow through these holes and increases the flows through the higher holes?
By this means the dosing system exhibits a degree of self-compensation against changes in the level of the limestone bed, which tends to maintain a fairly constant pH in the water exiting the LTBR.

28
As with any of the dosing systems in which the alum is added near the top of the limestone bed, mixing and initial floc formation are below standard because the energy conditions are not optimized. 5.2. THE 2 STAGE COLOURED WATER TREATMENT PLANT Although the 2 stage coloured water treatment plant was developed as a means of providing and maintaining a set pH range in which to carry out the colour removal process under optimal conditions, its introduction marked a critical stage in the development of the LTBR colour removal plant. In the first stage, coagulant is added to the raw water, which is then blended with a portion of sludge or settled water recycled from the stage 2 settlers. The ratio of stage 2 sludge/settled water to raw water is adjusted manually so that the pH of the treated water leaving stage 1 is within the optimal range for colour removal. No solid limestone is added to the first stage. Rapid mixing, slow mixing, colour precipitation, the precipitation of aluminium and iron hydroxides/ hydrates and floc formation all take place within one or more coagulating cones mounted inside the stage 1 settler or settlers. These coagulating cones are based upon the principles of precipitation combined with floc bed/sludge blanket clarification. For the pilot plant trials, a second LTBR cone was used. This cone was obviously far too small, since it was designed for the incipient fluidization of limestone particles up to 4 mm in diameter, whereas, operating as a floc bed, it needs to support only very light flocs. In spite of being undersized, precipitation of colour was very good, as can be seen from the results of the analyses of the Stage 1 water, given in Sections 5.2.2 and 5.2.3 of this report. However, the excessive carry-over of fine and reactive particles of limestone from the Stage 1 clarifier, indicated in the same analyses by the continued increase in the pH of these water samples in transit, points out the need to increase the residence time of the raw water, alum and limestone particles within the coagulating cones. In order to ensure a reasonably constant pH in Stage 1, the alkalinity and pH of the raw water and the coagulant dosing rate must remain within a reasonably tight range. It is also essential that the characteristics of the Stage 2 settled water, recycled back to Stage 1 remain fairly constant. This implies that the closer the reaction between the water in Stage 2 is to equilibrium, the more likely the pH in Stage 1 will stay within the acceptable range. The second stage incorporates one or more Limestone Teeter Bed Reactors, mounted within the stage 2 settlers. Contact with the limestone particles in the LTBR ensure that stabilisation and settling are carried out at a pH close to the equilibrium pH. The equilibrium pH is generally around 7.5 for highly coloured feedwaters. At this pH, when alum is used as the coagulant, any residual aluminium from the first stage is precipitated in the second stage as aluminium hydroxide and this aluminium hydroxide assists in flocculating any flocs carried over from stage 1.

29
The second stage is followed by conventional rapid gravity sand filtration to remove any flocs and fine solids carried over from the stage 2 settlers. A diagram illustrating the 2 stage LTBR Coloured Water Treatment Plant used during the pilot plant trials at Sedgefield is inserted below, as Figure 5.5.

30
FILT
ERED
WA
TER
/ BA
CK
WA
SH E
FFLU
ENT
BA
CK
WA
SH W
ATE
R
CO
MPR
ESSE
D A
IR
ALU
M S
OLU
TIO
N
INLE
T
STA
GE
1SA
ND
FIL
TER
STA
GE
2S
TAG
E 2
STA
GE
2
Figu
re 5
.5.
Sedg
efie
ld 2
Sta
ge L
TBR
Col
oure
d W
ater
Tre
atm
ent P
lant
Dia
gram
.

31
5.2.1 Benefits of the 2 Stage Coloured Water Treatment Plant Although the 2 stage coloured water treatment plant was developed mainly as a means of providing and maintaining a set pH at which to carry out the colour removal process under optimal conditions, the design has other benefits:
Stage 1 is the colour removal stage. Since there is no limestone bed in this
stage there is no possibility of the limestone particles becoming armoured, i.e. coated with aluminium or iron deposits.
Information on the operation of the stage 2 LTBR in the treatment of
coloured water can be used in the design of the water stabilisation section of a conventional water treatment plant. This is in line with the objectives of this research project.
Two stage processes are inherently more effective than single stages,
providing a double barrier for the removal of contaminants from the water.
The dosage of alum added to stage 1 can be adjusted to provide slightly more dissolved aluminium than is required to react with the colour in the feed. Since the pH in stage 1 is below the optimum pH for aluminium hydroxide precipitation, some dissolved aluminium will remain in solution in the water exiting stage 1. In stage 2, extra limestone dissolves in the water, raising the pH to above 7. This result in the precipitation of the residual aluminium in the incoming water, as aluminium hydroxide, which serves to adsorb and coagulate any colour flocs carried in the overflow from stage 1.
5.2.2 The Operation of the 2 Stage Pilot Plant in Sedgefield Raw Water for the Sedgefield Water Treatment Plant is pumped directly from a small, natural pool in the Karatara River, not far from where this river feeds into Swartvlei Lake. The quality of the raw water is highly variable and changes very quickly. The reasons for this include:
The catchment area of the Karatara River is small and steep. This means that rain falling in the catchment area can reach the abstraction point in little more than one hour.
Depending upon whether the rain falls over the forested areas of the catchment
or over the farmlands, the NOM and colour may increase or decrease very quickly.
When the mouth of Swartvlei estuary is open and Swartvlei Lake is tidal, the
level of the pool from which the raw water is abstracted is only slightly above the average level of Swartvlei Lake. At times of high spring tides, low rainfall and low freshwater flow in the Karatara River, salt water from Sedgefield Lake can flow backwards, into the abstraction pond. A low, sandbag dam is

32
usually built across the river, just below the pool to limit this effect, but, even then, the raw water can become quite salty under these conditions.
When the mouth of Swartvlei estuary is closed salty water from Swartvlei
Lake can mix with the fresh water in the abstraction pool. These changes in water quality tend to obscure the effects of planned changes in the operation conditions of the pilot plant, such as changes in operating pH, alum dosage and flow rate. Since the effects of any changes to any of the operating conditions take several hours to work their way through the coloured water treatment system, the plant was left to operate all through the night, without attention. This strategy was only partially successful since, both in 2006 and in 2007, the Sedgefield Water Treatment Plant was flooded to a depth of over 1 metre and all the pilot plant equipment needed to be cleaned and dried out; a process which took more than a week, in both instances. Recycling Stage 2 treated water back to Stage 1, in order to maintain the pH in Stage 1 at close to 5, proved remarkable easy. Overnight there was very little change in the pH, provided that the limestone bed was topped up daily. Originally, the intention was to recycle the underflow from Stage 2 back to stage 1 in order to supply the necessary alkalinity, but it was found that topping up the limestone bed of the Stage 2 LTBR resulted in a spike in the pH of Stage 1. This spike was caused by fine and very reactive particles of fine limestone associated with the 3-4 mm nominal size Poultry Grit used as make-up, carried over from the top of the teeter bed, which settled into the bottom cone of the Stage 2 settler and were then pumped over to Stage 1. Pumping settled water, rather than sludge, from Stage 2 to Stage 1, solved this problem during the trials, but the intention is to recycle sludge on the full-scale plants. Problems were experienced, by the Municipality, in maintaining the laboratory test equipment in the Sedgefield laboratory in working order, so many of the water quality parameters could not be measured onsite. However the pH values of the water exiting from Stage 1 and from Stage 2 were monitored continuously using dedicated pH meters and these meters were calibrated frequently. Floc formation and water colour were assessed visually, as was the extent of floc carryover. Samples of raw water and of treated water were analysed by A L Abbott & Associates in Cape Town when testing could be synchronised with their visits and their help in this matter is appreciated. Final pilot plant water qualities were determined by the Water Laboratory of the Scientific Services Branch of the City of Cape Town, under the control of Sarel Pieterse. His input, knowledge and attention to detail throughout this research project are very much appreciated.

33
Much of the early test work on the small scale and the large scale pilot plants was carried out at alum dosages above or equal to that used on the full scale Sedgefield Water Treatment Plant. Colour removal, floc formation and solid/liquid separation were all good, but the hardness of the final water was close to the upper limit for Class 1 Drinking Water. This is partly because calcium bicarbonate is formed, in addition to soluble calcium sulphate, when limestone is used in place of lime. One possible method of reducing the hardness of the treated water is to strip carbon dioxide from the water during Stage 1 treatment. This step proved to be unnecessary since trials with the 2 stage pilot plant showed that, by operating the colour removal stage within the optimal pH range of 4,5 to 5.5, the alum dosage could be reduced to a third of what was being used on the full-scale plant. The lower dosage of alum meant that less limestone was dissolved in the LTBR and that the hardness of the Stage 2 water was much reduced. One practical problem, which became apparent during the pilot pant trials, was concerned with the initial fill of limestone. The design assumes that the teeter bed is filled to the correct level with limestone graded from 4 mm to fine dust. Under the design conditions, all the limestone is in the state of incipient fluidisation. In the design it is assumed that 3-4 mm Poultry Grit is used as make-up. If the teeter bed were to be filled with Poultry Grit, the upflow velocities in most of the bed would be too low to fluidise limestone particles of this size. This problem can be overcome by making up an initial charge from a mixture of animal feed limestone and Poultry Grit. A second problem was occasionally encountered when topping up the teeter bed with Poultry Grit. Topping up was performed whilst the plant was in operation and the teeter bed was expanded. The Poultry Grit was simply poured onto the top of the limestone bed. Generally these particles, being much larger than the limestone particles in the top of the teeter bed, disappeared into the bed and presumable took up position towards the bottom of the teeter bed, dictated by their size and the upward velocity of the water at that level. On a few occasions, probably when the limestone was added too quickly, the limestone bed did not have the opportunity to classify itself, the resistance to flow of the feedwater increased and the water level in the Stage 1 clarifier started to rise. The “blockage” was rapidly cleared using plant water from a hose inserted into the teeter bed, but this process had to be carefully controlled, otherwise it led to the loss of a considerable amount of fine limestone from the top of the limestone bed due to the increased water upflow rate. In the proposed full-scale plant a reservoir section has been added below the teeter bed to hold newly added particles of coarse limestone. The results of the final test run on the Sedgefield water are included below. The alum dosage was 90 mg/l and the pH in Stage 1 was adjusted, using water recycled from Stage 2, to a pH of 5.1. The flow rate was 500 l/hour.
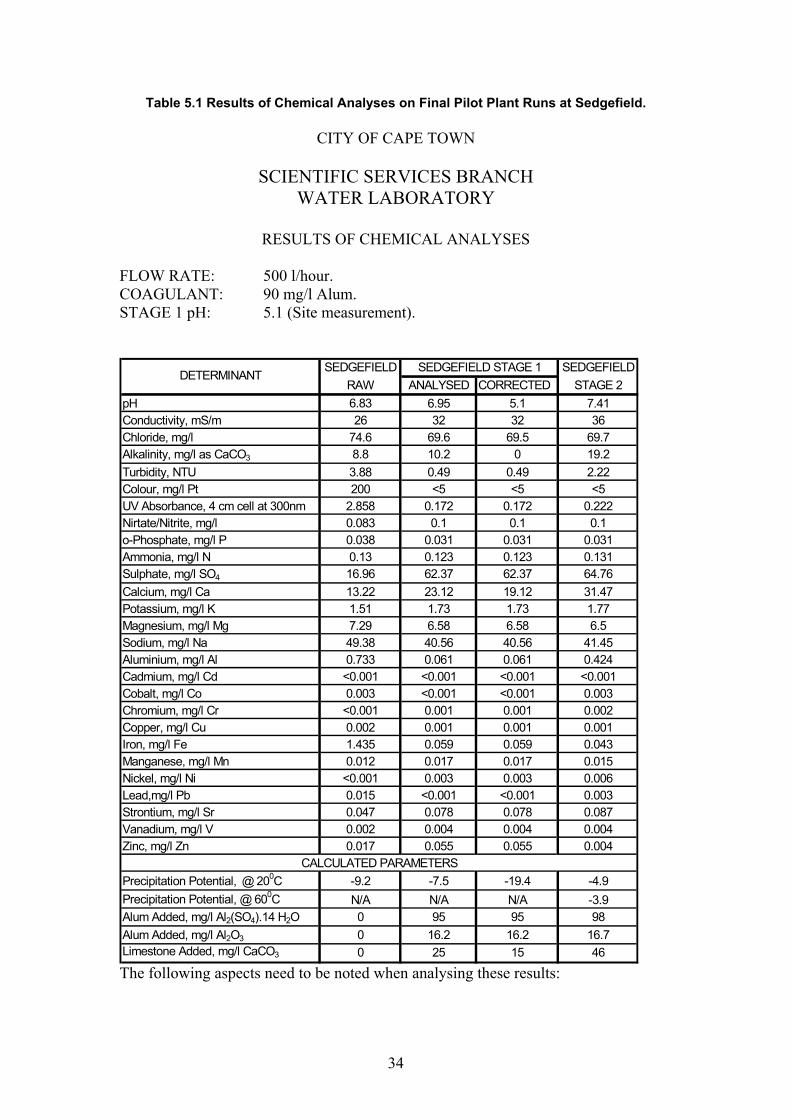
34
Table 5.1 Results of Chemical Analyses on Final Pilot Plant Runs at Sedgefield.
CITY OF CAPE TOWN
SCIENTIFIC SERVICES BRANCH WATER LABORATORY
RESULTS OF CHEMICAL ANALYSES
FLOW RATE: 500 l/hour. COAGULANT: 90 mg/l Alum. STAGE 1 pH: 5.1 (Site measurement).
SEDGEFIELD SEDGEFIELDRAW ANALYSED CORRECTED STAGE 2
pH 6.83 6.95 5.1 7.41Conductivity, mS/m 26 32 32 36Chloride, mg/l 74.6 69.6 69.5 69.7Alkalinity, mg/l as CaCO3 8.8 10.2 0 19.2Turbidity, NTU 3.88 0.49 0.49 2.22Colour, mg/l Pt 200 <5 <5 <5UV Absorbance, 4 cm cell at 300nm 2.858 0.172 0.172 0.222Nirtate/Nitrite, mg/l 0.083 0.1 0.1 0.1o-Phosphate, mg/l P 0.038 0.031 0.031 0.031Ammonia, mg/l N 0.13 0.123 0.123 0.131Sulphate, mg/l SO4 16.96 62.37 62.37 64.76Calcium, mg/l Ca 13.22 23.12 19.12 31.47Potassium, mg/l K 1.51 1.73 1.73 1.77Magnesium, mg/l Mg 7.29 6.58 6.58 6.5Sodium, mg/l Na 49.38 40.56 40.56 41.45Aluminium, mg/l Al 0.733 0.061 0.061 0.424Cadmium, mg/l Cd <0.001 <0.001 <0.001 <0.001Cobalt, mg/l Co 0.003 <0.001 <0.001 0.003Chromium, mg/l Cr <0.001 0.001 0.001 0.002Copper, mg/l Cu 0.002 0.001 0.001 0.001Iron, mg/l Fe 1.435 0.059 0.059 0.043Manganese, mg/l Mn 0.012 0.017 0.017 0.015Nickel, mg/l Ni <0.001 0.003 0.003 0.006Lead,mg/l Pb 0.015 <0.001 <0.001 0.003Strontium, mg/l Sr 0.047 0.078 0.078 0.087Vanadium, mg/l V 0.002 0.004 0.004 0.004Zinc, mg/l Zn 0.017 0.055 0.055 0.004
Precipitation Potential, @ 200C -9.2 -7.5 -19.4 -4.9Precipitation Potential, @ 600C N/A N/A N/A -3.9Alum Added, mg/l Al2(SO4).14 H2O 0 95 95 98Alum Added, mg/l Al2O3 0 16.2 16.2 16.7Limestone Added, mg/l CaCO3 0 25 15 46
SEDGEFIELD STAGE 1DETERMINANT
CALCULATED PARAMETERS
The following aspects need to be noted when analysing these results:

35
5.2.2.1 Analysis of Sedgefield Stage 1 Water
Stage 1 was operated at a pH of 5.1, yet the results of the chemical analysis, carried out in Cape Town, show a pH of 6.95.
Stage 1 incorporates a settler, but not a filter. This means that the sample contained fine flocs and fine particles of limestone. During the period in which the sample was stored and when it was in transit to Cape Town, the fine limestone particles appear to have dissolved further, raising the pH of the water from 5.1 to 6.95. This would also have had the effect of raising the calcium concentration and the alkalinity of the Stage 1 water before it was analysed and decreasing the value of the limestone dissolution potential, i.e. making the Stage 1 water appear slightly less corrosive than it actually was. To correct for this effect, the removal of small amounts of limestone from the Stage 1 water, as analysed, was modelled using PHREEQC. Calcite was removed from the sample until the equilibrium pH dropped from 6.95 to 5.1. This required the removal of 10 mg/l of calcite, causing a reduction in the alkalinity from 10.2 mg/l to zero and reducing the dissolved calcium concentration from 23.12 mg/l to 19.12 mg/l. The Precipitation Potential decreased from – 7.5 to –19.4 mg/l.
The addition of 15 mg/l limestone, as CaCO3, is sufficient to increase the pH of the raw water, after addition of 95 mg/l of alum, to 5.1, in Stage 1, thereby removing the colour from the water.
The indicated iron and aluminium concentrations in the Stage 1 water are both
well within acceptable limits. 5.2.2.2 Analysis of Sedgefield Stage 2 Water
The limestone added to produce stable water, with a limestone dissolution potential of less than 5 mg/l was calculated at only 46 mg/l. This is very low and confirms the low running costs of the system.
The turbidity of the Stage 2 water, at 2.22 NTU, is above the limit for Class 1
potable water, but well within the Class 2 range. The reason for this slightly high turbidity is not immediately apparent, especially given that the water from the 2 stage pilot plant is usually sparking clear. There is, however, a slight decrease in the dissolved iron concentration between Stages 1 and 2, which may indicate the slow oxidation and precipitation of some residual iron.
The increase in dissolved aluminium concentrations between Stages 1 and 2 is
possibly due to the dissolution of colour flocs carried over from Stage 1 to Stage 2 at the higher pH in Stage 2, in the sample of Stage 2 water sent for analysis. This is unlikely to happen in the plant itself, since the residence time in the plant is much shorter than the time between taking and analysing the samples.

36
5.2.3 The Operation of the 2 Stage Pilot Plant in George Raw Water for the New George Water Treatment Plant flows by gravity from the Garden Route Dam. The quality of the raw water is less variable and changes more slowly, but the colour range of the raw water is greater than at Sedgefield, probably indicating that the raw water is obtained from more than one source. As at Sedgefield, there is no laboratory at the New George Water Treatment Plant and samples are sent to a central laboratory at the George Wastewater Treatment Plant. This involves a delay of at least 24 hours before the operators can react to changes in the quality of the raw water. On the LTBR Pilot Plant, pH values of the water exiting from Stage 1 and from Stage 2 were monitored continuously using dedicated pH meters and these meters were calibrated frequently. Floc formation and water colour were assessed visually, as were the extent of floc carryover. At times, the water from the dam contained high concentrations of a soft, black, somewhat sticky material, which is high in manganese. This material then quickly blocked the Rotameter in the feed line and any strainers added to protect the Rotameter.
Figure 5.6. Photograph of the pH Meters, Raw Water Rotameter and Coagulant Dosing
Pump at George.

37
Samples of raw water and of treated water were analysed by the George central laboratory and this assistance was very much appreciated. Final pilot plant water qualities were determined by the Water Laboratory of the Scientific Services Branch of the City of Cape Town, under the control of Sarel Pieterse. His input and attention to detail throughout these trials is very much appreciated. At the George New Water Treatment Plant it proved possible to take advantage of a sump some 1.3 m deep, to lower the Stage 2 LTBR/Settler and the Sand Filter. This increased the head available to drive the Stage 2 LTBR from 1.2m to 2.5m, which helped to prevent the limestone bed from solidifying. At the New George Plant, ferric chloride is used as the coagulant. The ferric chloride solution is highly acidic and may contain up to 1% free hydrochloric acid. As a result, the alkali demand is very high, which would result in the production of potable water with very high hardness, if lime only were to be used. Instead, both lime and sodium carbonate are added as neutralising agents. This regime has the advantage of providing bicarbonate alkalinity in addition to hydroxide alkalinity. Further complications in the treatment of the raw water at the full-scale George New Water Treatment Plant are caused by the high iron and manganese concentrations that sometimes occur in the treated water. To overcome these problems hydrogen peroxide is added at the colour removal stage, whilst a manganese dioxide coated filter medium from Australia is used in place of sand to remove residual iron and manganese.

38
Figure 5.7. Photograph of the 2 Stage Pilot Plant at George.

39
SAND FILTERSTAGE 2
STAGE 1S TAGE 2
S T AGE 2
Figure 5. 8. George 2 Stage LTBR Coloured Water Treatment Plant Diagram.
Initially the LTBR Pilot Plant was operated using ferric chloride at the same dosage as was being used on the George New Water Treatment Plant i.e. at 75 mg/l FeCl3.
The design pH was 4.0. It quickly became apparent that a very high recycle rate of settled Stage 2 water was required to maintain this pH and that the rate of limestone consumption was so high that when the pilot plant was left to run overnight a substantial portion of the limestone in the LTBR was consumed and the pH of the Stage 2 water was then far too low. An additional negative effect was that the calcium concentration of the Stage 2 water exceeded 150 mg/l, which is above the Class 1 recommended operational limit. These results were in line with those achieved on the full-scale plant. It was felt that to use a mix of limestone and sodium carbonate would unnecessarily complicate the pilot plant. In early April 2008, trials were being carried out at the old George Water Treatment Plant using Ultrafloc 3800, which is a blend of polyaluminium chloride and a cationic
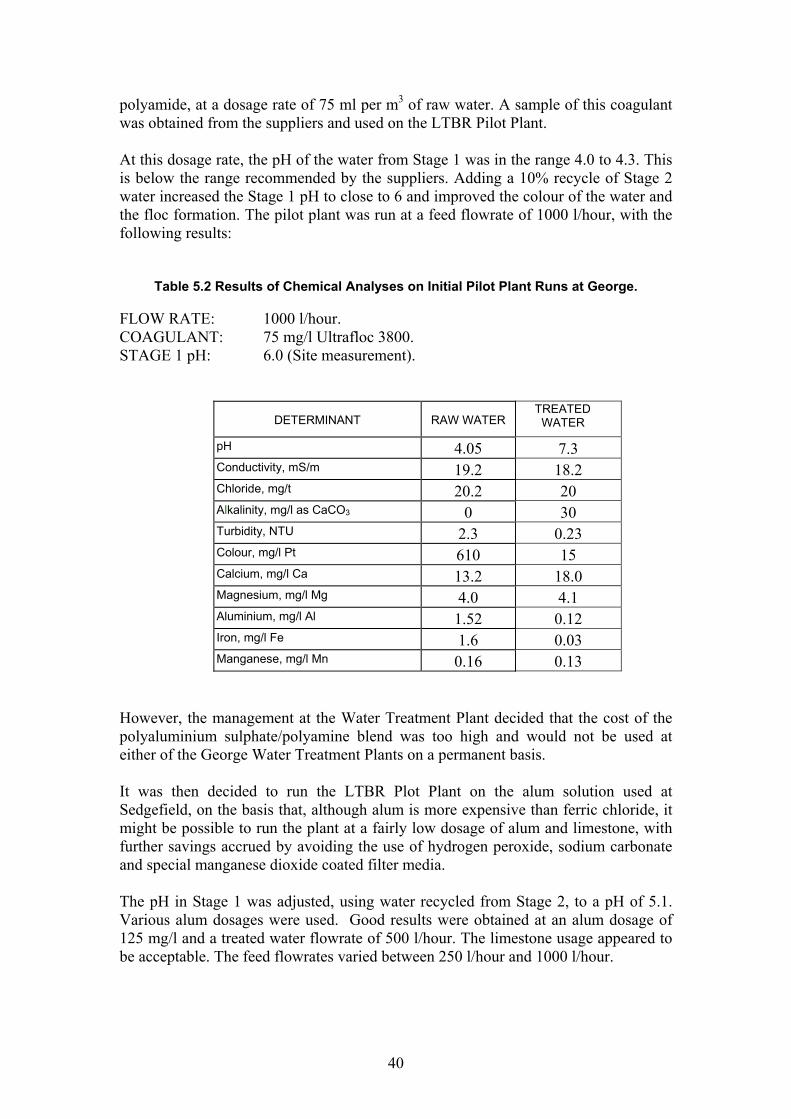
40
polyamide, at a dosage rate of 75 ml per m3 of raw water. A sample of this coagulant was obtained from the suppliers and used on the LTBR Pilot Plant. At this dosage rate, the pH of the water from Stage 1 was in the range 4.0 to 4.3. This is below the range recommended by the suppliers. Adding a 10% recycle of Stage 2 water increased the Stage 1 pH to close to 6 and improved the colour of the water and the floc formation. The pilot plant was run at a feed flowrate of 1000 l/hour, with the following results:
Table 5.2 Results of Chemical Analyses on Initial Pilot Plant Runs at George.
FLOW RATE: 1000 l/hour. COAGULANT: 75 mg/l Ultrafloc 3800. STAGE 1 pH: 6.0 (Site measurement).
DETERMINANT RAW WATER TREATED WATER
pH 4.05 7.3 Conductivity, mS/m 19.2 18.2 Chloride, mg/t 20.2 20 Alkalinity, mg/l as CaCO3 0 30 Turbidity, NTU 2.3 0.23 Colour, mg/l Pt 610 15 Calcium, mg/l Ca 13.2 18.0 Magnesium, mg/l Mg 4.0 4.1 Aluminium, mg/l Al 1.52 0.12 Iron, mg/l Fe 1.6 0.03 Manganese, mg/l Mn 0.16 0.13
However, the management at the Water Treatment Plant decided that the cost of the polyaluminium sulphate/polyamine blend was too high and would not be used at either of the George Water Treatment Plants on a permanent basis. It was then decided to run the LTBR Plot Plant on the alum solution used at Sedgefield, on the basis that, although alum is more expensive than ferric chloride, it might be possible to run the plant at a fairly low dosage of alum and limestone, with further savings accrued by avoiding the use of hydrogen peroxide, sodium carbonate and special manganese dioxide coated filter media. The pH in Stage 1 was adjusted, using water recycled from Stage 2, to a pH of 5.1. Various alum dosages were used. Good results were obtained at an alum dosage of 125 mg/l and a treated water flowrate of 500 l/hour. The limestone usage appeared to be acceptable. The feed flowrates varied between 250 l/hour and 1000 l/hour.

41
The results of the final test run on the George water are included below.
Table 5.3 Results of Chemical Analyses on Final Pilot Plant Runs at George.
CITY OF CAPE TOWN
SCIENTIFIC SERVICES BRANCH WATER LABORATORY
RESULTS OF CHEMICAL ANALYSES
FLOW RATE: 500 l/hour. COAGULANT: 130 mg/l Alum. STAGE 1 pH: 5.1 (Site measurement).
GEORGE GEORGERAW ANALYSED CORRECTED STAGE 2
pH 4.24 7.95 5.1 7.86Conductivity, mS/m 32 31 31 32Chloride, mg/l 55 53.5 53.5 53.6Alkalinity, mg/l as CaCO3 NIL 8.4 0 33.8Turbidity, NTU 19.9 0.31 0.31 1.71Colour, mg/l Pt 250 <5 <5 5UV Absorbance, 4 cm cell at 300nm 3.002 0.217 0.217 0.339Nirtate/Nitrite, mg/l 0.117 0.164 0.164 0.162o-Phosphate, mg/l P 0.043 0.032 0.032 0.038Ammonia, mg/l N 0.149 0.122 0.122 0.207Sulphate, mg/l SO4 1.21 66.33 66.33 63.97Calcium, mg/l Ca 14.25 55.87 52.7 64.44Potassium, mg/l K 0.72 0.93 0.93 0.98Magnesium, mg/l Mg 2.47 2.91 2.91 2.85Sodium, mg/l Na 16.25 13.34 13.34 13.13Aluminium, mg/l Al 1.228 0.044 0.044 0.379Cadmium, mg/l Cd 0.002 <0.001 <0.001 <0.001Cobalt, mg/l Co 0.003 0.003 0.003 0.005Chromium, mg/l Cr 0.005 0.004 0.004 0.002Copper, mg/l Cu 0.008 0.001 0.001 0.001Iron, mg/l Fe 3.642 0.049 0.049 0.054Manganese, mg/l Mn 0.162 0.122 0.122 0.075Nickel, mg/l Ni <0.001 0.004 0.004 <0.001Lead,mg/l Pb 0.015 0.007 0.007 <0.001Strontium, mg/l Sr 0.027 0.118 0.118 0.137Vanadium, mg/l V 0.001 0.003 0.003 0.005Zinc, mg/l Zn 0.085 0.065 0.065 0.006
Precipitation Potential, @ 200C -126.4 -1.6 -18.1 -1.5Precipitation Potential, @ 600C N/A N/A N/A 2.3Alum Added, mg/l Al2(SO4).14 H2O 0 130 130 130Alum Added, mg/l Al2O3 0 22.8 22.8 21.9Limestone Added, mg/l CaCO3 0 104 96 125
DETERMINANTGEORGE STAGE 1
CALCULATED PARAMETERS

42
The following aspects need to be noted when analysing these results.
Stage 1 was operated at a pH of 5.1, yet the results of the chemical analysis show a pH of 7.95. This effect is similar to the result from Sedgefield.
Stage 1 incorporates a settler, but not a filter. This means that the sample contained fine flocs and fine particles of limestone. During the period in which the sample was stored and then in transit to Cape Town, the fine limestone particles appear to have dissolved further, raising the pH of the water from 5.1 to 7.95. This would also have had the effect of raising the calcium concentration and the alkalinity of the Stage 1 water before it was analysed, and the further effect of decreasing the value of the limestone dissolution potential, i.e. making the Stage 1 water appear slightly less corrosive. To correct for this effect, the removal of small amounts of limestone from the Stage 1 water, as analysed, was modelled using PHREEQC. Calcite was removed from the sample until the equilibrium pH dropped from 7.95 to 5.1. This required the removal of 8 mg/l of calcite, causing a reduction in the alkalinity from 8.4 mg/l to zero and reducing the dissolved calcium concentration from 55.87 mg/l to 52.7 mg/l. The Precipitation Potential decreased from – 1.6 to –18.1 mg/l.
The addition of 96 mg/l limestone, as CaCO3, is sufficient to increase the pH of the raw water, after addition of 95 mg/l of alum, to 5.1 in Stage 1 thereby removing the colour from the water.
The indicated iron and aluminium concentrations in the Stage 1 water are both
well within acceptable limits. 5.2.3.1 Analysis of George Stage 2 Water
Extra limestone was dissolved in Stage 2, and the stream was settled and filtered before the sample was taken. This is confirmed by the increase in pH, calcium and alkalinity and the decrease in the calculated limestone dissolution potential of the water.
The limestone added to produce stable water, with a calculated limestone
dissolution potential of 1.5 mg/l, was calculated at 125 mg/l. This confirms that the LTBR can remove the colour and stabilise the feedwater cheaply.
The increase in dissolved aluminium concentrations between Stages 1 and 2 is
possibly due to the dissolution of colour flocs carried over from Stage 1 to Stage 2. This is unlikely to happen in the plant itself, since the residence time is so much shorter than the time between sampling and analysing the water samples.

43
5.3. CONCLUSIONS ON THE RESULTS OF THE LARGE-SCALE PILOT PLANT TRIALS Soft, highly coloured waters with low alkalinities can be effectively treated in the 2 stage LTBR plant to produce potable water which complies, in all respects, with the SANS 241/2005 Specification for Class 1 Drinking Water. No pH control system is necessary, nor is a dry lime or lime slurry dosing system. Coagulants dosages on the pilot plant when treating Sedgefield water are lower than used on the corresponding full-scale plants. This is because the colour removal stage on the pilot plant was run at a pH of 5.1, which is much closer to the optimum pH value than the 6.0 used on the full-scale plant. The total dosage of limestone added is also much less than the lime dosage used on the full-scale plant. The pilot plant was run at coagulant dosages as low as 60 mg/l, with satisfactory colour removal, but Dissolved Organic Carbon removals were probably unsatisfactory at such low coagulant additions. At George, ferric chloride is used as the flocculant on the full-scale plant. When used on the pilot plant, at the same dosage, the acidity of the water was so high that the limestone was consumed so quickly that the pH in both stages dropped below the desired values. For this reason the coagulant was first changed to a polyaluminium chloride/polyamine mix. This gave excellent colour removal with almost negligible limestone consumption, but the cost of the coagulant was considered to be excessive. Substituting the highly acidic ferric chloride coagulant with less acidic alum produced satisfactory colour removal and removed the necessity of replacing part of the lime with sodium carbonate in order to reduce the calcium level and hardness of the potable water to within acceptable levels. Although ferric chloride is cheaper and more readily available than alum, the economics of this substitution warrant further investigation by the management at George. It is unnecessary to add any oxidising agents to the water in order to reduce dissolved iron and manganese levels to below the recommended levels, when limestone is used to increase the alkalinity and pH of the water. This indicates that the source of the iron and manganese in the drinking water produced on the full-scale plant could be the lime. The manganese dioxide coated filter medium used on the full-scale plant at George appears to be very effective in polishing the drinking water and removing any traces of colour not removed by the ferric chloride and hydrogen peroxide. It should be noted that a polyelectrolyte is always used on the full-scale water treatment plant in order to improve settling. The improvement when adding a polyelectrolyte is often marginal and may not warrant the costs involved. The Limestone Teeter Bed Reactor was operated at flow rates of 250 l/hour, 500 l/hour and 1000 l/hour. Sudden increases in flowrate resulted in a loss of fines from the teeter bed, but these fines are recycled back to Stage 1 and not lost to the

44
process in the proposed 2 stage coloured water treatment plant. At the highest flowrate it is necessary to top up the teeter bed with limestone at least twice per day, or to double the size of the limestone bed. Overflow from the settlers is also excessive at high flowrates and the filter run time of the sand filter is very much shortened.
The main shortcomings in the design of the pilot plant were:
a) Excessive carry-over of small particles of active limestone from the Stage 1 Clarifier indicates that the retention time is insufficient within the coagulating cone used for the pilot plant trials.
b) There is a significant drop in the pH of the water leaving Stage 2 as the
mass of limestone in the teeter bed drops. The implication of this is that, when treating George water, the volume of the LTBR in the pilot plant is too small to maintain equilibrium conditions for more than about 12 hours between limestone top-ups, when the pilot plant is operated at its design flow rate of 500 l/hour.
c) The lack of a sludge thickening stage. Sludge thickening should be
standard on any water treatment plant, not only to reduce the volume of sludge produced, but also to increase the volume of potable water available for distribution.
5.4. CAPITAL AND OPERATING COSTS At the start of this research project, the intention was to compare the capital cost of a coloured water treatment plant employing LTBR technology with the costs of a standard coloured water treatment plant to be built at Sedgefield. Both plants were to be rated at 4.8 Ml/day. Unfortunately, the lowest tendered capital cost received for the new Sedgefield coloured water treatment plant was almost 3 times higher than the budget, so plans to build this plant were scrapped. Part of the reason for the high capital cost was the very high cost escalation rate that occurred during this period, which was partly due to the shortage of skilled construction workers at a time when the industry was particularly busy on the provision of infrastructure and partly due to the rapid increase in fuel costs. A further problem was that the bills of quantities for the new plant had not been prepared in such a way as to enable the costs for each process stage to be extracted separately. Capital cost comparisons between the LTBR system and more conventional systems are therefore very difficult to make. However, given the simplicity of the LTBR system, that no lime dosing or pH control system are required and that the deep cone settlers used on the LTBR system require much less space than the conventional horizontal clarifiers, the capital cost of the LTBR based plant should be lower than that of a conventional plant.

45
Comparative chemical costs were also very difficult to obtain. Most municipalities, including Knysna municipality, go out to tender for the supply of water treatment chemicals on a long-term basis, which is normally for 3 years. However, alum was in very short supply during mid 2008, and the spot price of alum was much higher than the tendered price. The chemical suppliers were unwilling to estimate the longer-term chemical costs. Other factors which complicated the direct comparison between the operating costs of the LTBR system and more conventional systems include:
The difference in the pH at which the colour removal stage is operated in the LTBR based technology and the pH at which the first stage in a more conventional plant is operated.
The difference between the objective of the plant operators on the full-scale
plant, which is to run the plant conservatively and the objective of the researcher, which is to optimise the performance of the pilot plant.
The effect on DOC removal with changes in the coagulant dosage.
The decrease in lime or limestone demand, following a reduction in the dosage
of coagulant used.
Ferric chloride, lime, sodium carbonate and hydrogen peroxide were all used in the full-scale treatment of the coloured water at George, whereas, on the pilot plant, only alum and limestone were added.
Although the pilot plant could be operated at a coagulant dosage of 1/3 of that used on the full-scale plant at Sedgefield, the final pilot plant trials were carried out using ½ the coagulant dosage used on the full-scale plant. Given that cost of the limestone is only about 1/3 of the cost of lime, it is probably safe to assume that by changing to limestone the chemical costs would be cut to ¼ of the present costs.

46
CHAPTER 6 DESIGN PARAMETERS FOR FULL-SCALE LIMESTONE
TEETER BED REACTORS USED IN WATER TREATMENT
6.1. APPLICATION OF ERGUN’S EQUATION The sizing of the Limestone Teeter Bed Reactors is based upon the application of Ergun’s Equation (see Appendix B), which provides a method for calculating the upflow velocity necessary to produce conditions of incipient fluidisation at any level within a teeter bed and the resulting pressure drop through the bed. The small-scale pilot LTBR trials indicated that the information provided by the application of Ergun’s equation was accurate enough for the design of a larger-scale pilot plant. Trials on the small-scale pilot plant teeter bed, which was constructed from clear PVC, showed that the flow conditions within the teeter bed are “chaotic” rather than “ideal”, and that, although there is a distinct graduation from large particles near the bottom of the teeter bed to very small particles near the top of the teeter bed, there are short term perturbations within the bed during which parts of the bed remain static for short periods, whilst other regions become fluidised. However, no parts of the bed remain static for more than a few minutes. There was no evidence of the trapping of precipitated colour complexes or metal hydroxides within the bed and no signs of coating of the limestone particles. Pilot Plant trials using the larger scale LTBR at Sedgefield and George indicated that the information provided from the application of Ergun’s equation to the sizing of a teeter bed was sufficiently accurate to be used for the design of full scale Limestone Teeter Bed Reactors. However, the analyses of the Stage 2 water samples indicated that the height of the LTBR and the live limestone storage capacity of the teeter bed should be increased to reduce the frequency of recharging and to provide the additional alkalinity required when ferric chloride is used as the coagulant. The analyses also indicated that the Coagulation Cone, used in Stage 1, the colour removal stage, was also undersized. 6.2. COLOUR REMOVAL Figure 6.1 illustrates the proposed 2 stage Limestone Teeter Bed Reactor Coloured Water Treatment Plant. The equipment layout is the same as that tested at Sedgefield and George, but the sizes of both the Coagulation Cone and the Teeter Bed have been increased significantly.

47
F
igur
e 6.
1 Pr
opos
ed 2
Sta
ge L
TBR
Col
oure
d W
ater
Tre
atm
ent P
lant
.

48
Tabl
e 6.
1 Li
mes
tone
Tee
ter B
ed R
eact
or S
izin
g Ta
ble.
F Q
vD
t v
D1
hV
rD
ph e
d dd c
d f
m3 /h
our
m3 /s
m/h
our
m
m/h
our
m
m
m3
m
in.
kP
am
mm
mm
50.
0013
921
.00.
551
274
0.15
22.
50.
273.
2223
.85
0.5
0.77
92.
202
4210
0.00
278
21.0
0.77
927
40.
216
2.5
0.54
3.22
23.8
50.
51.
101
3.11
559
150.
0041
721
.00.
954
274
0.26
42.
50.
813.
2223
.85
0.5
1.34
93.
815
7320
0.00
556
21.0
1.10
127
40.
305
2.5
1.07
3.22
23.8
50.
51.
557
4.40
584
250.
0069
421
.01.
231
274
0.34
12.
51.
343.
2223
.85
0.5
1.74
14.
925
9430
0.00
833
21.0
1.34
927
40.
373
2.5
1.61
3.22
23.8
50.
51.
907
5.39
510
335
0.00
972
21.0
1.45
727
40.
403
2.5
1.88
3.22
23.8
50.
52.
060
5.82
711
140
0.01
111
21.0
1.55
727
40.
431
2.5
2.15
3.22
23.8
50.
52.
202
6.22
911
945
0.01
250
21.0
1.65
227
40.
457
2.5
2.42
3.22
23.8
50.
52.
336
6.60
712
650
0.01
389
21.0
1.74
127
40.
482
2.5
2.69
3.22
23.8
50.
52.
462
6.96
513
355
0.01
528
21.0
1.82
627
40.
506
2.5
2.95
3.22
23.8
50.
52.
583
7.30
413
960
0.01
667
21.0
1.90
727
40.
528
2.5
3.22
3.22
23.8
50.
52.
697
7.62
914
665
0.01
806
21.0
1.98
527
40.
550
2.5
3.49
3.22
23.8
50.
52.
807
7.94
115
270
0.01
944
21.0
2.06
027
40.
570
2.5
3.76
3.22
23.8
50.
52.
913
8.24
115
775
0.02
083
21.0
2.13
227
40.
590
2.5
4.03
3.22
23.8
50.
53.
016
8.53
016
380
0.02
222
21.0
2.20
227
40.
610
2.5
4.30
3.22
23.8
50.
53.
115
8.80
916
885
0.02
361
21.0
2.27
027
40.
628
2.5
4.57
3.22
23.8
50.
53.
210
9.08
117
390
0.02
500
21.0
2.33
627
40.
647
2.5
4.83
3.22
23.8
50.
53.
304
9.34
417
895
0.02
639
21.0
2.40
027
40.
664
2.5
5.10
3.22
23.8
50.
53.
394
9.60
018
310
00.
0277
821
.02.
462
274
0.68
22.
55.
373.
2223
.85
0.5
3.48
29.
849
188
Dia
of
Feed
Pi
pe
Dia
of
Dra
ught
Tu
be
Dia
of
Cla
rifie
r Ta
nk
LTBR
D
iam
eter
To
p
Volu
me
of L
TBR
Res
iden
ce
Tim
e in
LT
BR
Fl
owra
teFl
owra
te
Hea
d Lo
ss
thro
ugh
LTBR
Upf
low
ve
loci
ty
Top
Upf
low
ve
loci
ty
Bot
tom
LTBR
D
iam
eter
B
otto
m
Hei
ght
of
LTBR
Hei
ght o
f El
utria
tion
Sect
ion

49
Tabl
e 6.
2 Fl
ushi
ng, F
ree
Settl
ing
& H
inde
red
Settl
ing
Velo
citie
s Fo
r Lim
esto
ne P
artic
les.
New
ton'
s La
w.
Turb
ulen
t Flo
w. D
p >
5 m
mLa
min
ar F
low
. Dp
< 50
mm
d p2 (r
p -r
)g
18m
d p
d p
v flu
shv f
lush
v fre
e v f
ree
v hin
dv h
ind
mm
mm
/sm
/hm
/sm
/hm
/sm
/h10
0.00
001
0.02
3091
83.1
0.00
0095
0.34
24.
344E
-05
0.16
200.
0000
20.
0326
5611
7.6
0.00
038
1.36
80.
0001
738
0.63
300.
0000
30.
0399
9514
4.0
0.00
0855
3.07
80.
0003
911.
4140
0.00
004
0.04
6182
166.
30.
0015
25.
472
0.00
0695
12.
5050
0.00
005
0.05
1633
185.
90.
0023
758.
550.
0010
863.
9160
0.00
006
0.05
6561
203.
60.
0034
212
.312
0.00
1563
95.
6370
0.00
007
0.06
1093
219.
90.
0046
5516
.758
0.00
2128
67.
6680
0.00
008
0.06
5312
235.
10.
0060
821
.888
0.00
2780
310
.01
900.
0000
90.
0692
7324
9.4
0.00
7695
27.7
020.
0035
188
12.6
710
00.
0001
0.07
3021
262.
90.
0095
34.2
0.00
4344
215
.64
110
0.00
011
0.07
6585
275.
70.
0114
9541
.382
0.00
5256
518
.92
120
0.00
012
0.07
999
288.
00.
0136
849
.248
0.00
6255
622
.52
130
0.00
013
0.08
3256
299.
70.
0160
5557
.798
0.00
7341
726
.43
140
0.00
014
0.08
6399
311.
00.
0186
267
.032
0.00
8514
630
.65
150
0.00
015
0.08
9432
322.
00.
0213
7576
.95
0.00
9774
435
.19
v
flus
h
= 3
.1g(
rp
-r)d
1/2
r
FLUS
HING
VEL
OCI
TY
v fre
e =VE
LOCI
TY
FREE
SET
TLIN
G
PART
ICLE
DIA
MET
ERv h
ind=
v fre
e(1-
ff2/
3)
Sto
kes'
Law
VEL
OC
ITY
HIN
DERE
D S
ETTL
ING
A.W
.Bon
d

50
Table 6.1 illustrates the application of Ergun’s Equation in the analysis of the flow conditions that exist in the larger scale teeter bed when it is operated under design conditions and producing treated water to SANS 241:2006 specifications. The flowrate to Stage 1 of 0.65 m3/hour represents a raw feed of 500 l/hour plus a recycle of 150 l/hour. The upflow velocity, under teeter conditions, is 274 m/hour at the bottom of the LTBR, where the largest particles in the limestone grit, as supplied, are 7.5 mm in diameter. The upflow velocity at the top of the LTBR was calculated at 21 m/hour. According to Ergun’s Equation, this corresponds to the incipient fluidisation of limestone particles with a diameter of 0.64 mm. It should be noted that the required incipient fluidisation velocity at the bottom of the LTBR depends only upon the maximum size of the limestone particles supplied. The sizing of the top of the teeter bed is more complicated, since it involves balancing the efficiency in the use of the limestone against the efficiency of separation of the suspended solids from the treated water. In general, the larger the top of the teeter bed, the larger its volume and the longer the retention time, i.e. the limestone dissolution time. Also, the larger the top diameter of the teeter bed, the smaller the diameter of the limestone particles that remain within the bed. When the dissolution or breakdown of the limestone particles reduces their effective hydraulic diameter to less than 0.64 mm, the particles can no longer remain at equilibrium within the teeter bed at an upflow velocity of 21 m/hour and they are ejected into the elutriation section above the teeter bed. Initially there are few solids in this region and free settling conditions exist. An examination of Table 6.2 above shows that limestone particles with a diameter of only 0.08 mm have a free settling velocity of around 21 m/hour. The implication of this is that a limestone particle may remain in the elutriation section until its diameter is reduced by dissolution to less than 0.1 mm. However, when the teeter bed has been in operation for several hours, the number of limestone particles within the elutriation section can become quite large and hindered settling conditions may occur. Table 6.2 indicates that the diameter of a limestone particle that remains in equilibrium under these conditions is in the region of 0.12 mm. This means that a limestone particle is likely to remain within the elutriation section until its diameter is reduced to around 0.1 mm before it is carried over into the clarifier section. With a soft, friable limestone, such as that supplied by P & B Limestone, it is difficult to determine how many limestone particles of 0.1 mm are derived from each particle, or kilogram of Chicken Grit sold, but it is clear that the limestone dissolution rate in a teeter bed under design conditions is very high.

51
The elutriation section has three main purposes:
The continued dissolution of the limestone particles to maximize limestone utilisation.
The further reduction of the carbonate precipitation potential to the minimum practical value.
The provision of additional volume above the teeter bed that can accommodate the fresh limestone added as make-up whilst it penetrates into the teeter bed.
In Table 6.2, these velocities of 274 m/hour and 21 m/hour are used to size full scale LTBR coloured water treatment plants in which the sum of the raw water feed flowrate and recycle flowrate covers the range of 5 m3/hour to 100 m3/hour, per unit. The alkali recycle represents the extra volume of stabilised water, recycled back from Stage 2, which must be added to the raw water, plus added coagulant, to raise the pH in the Stage 1 coagulating cone, to within the optimum pH range for colour removal. This flowrate is unlikely to more than 30% of the raw water feed flowrate and can be determined with sufficient accuracy in the laboratory, using samples of the raw water. A comparison between the pilot plant design parameters given in Table 3.1 and the full-scale design parameters set down in Table 6.1 shows that the height of the teeter bed section has been increased from 1.2 m, including the elutriation section, in the pilot plant to 2.5m plus an extra 0.5 m for the elutriation section, for a full-scale plant. This more than doubles the original residence time of 1.57 minutes. A coarse limestone particle reservoir has been added below the teeter bed. This reservoir is designed to hold coarse limestone particles during the first few hours after fresh limestone has been added to the teeter bed. Without the reservoir, these coarse particles drop down inside the teeter bed and occupy some 10% of the volume of the bed, which corresponds to some 25 % of the height of the lower end of the teeter bed. Without a coarse limestone reservoir, most coarse limestone particles would remain packed at the bottom of the teeter bed when first loaded into the teeter bed. Under static conditions the rate of dissolution of the coarse particles may be too low to maintain the set pH values in the two stages. Since the diameter of the reservoir is small, the upflow velocities are high and the coarse particles quickly reach the state of incipient fluidisation. The height of the reservoir section is inversely related to the frequency at which the LTBR is charged and can be calculated once this factor is known. Table 6.2 also lists the recommended Draught Tube diameter, Clarifier diameter and the diameter of the feed pipe inside the LTBR. The Draught Tube is sized so as to prevent any rapid change of velocity from the elutriation section to the Draught Tube, whilst the Clarifier is designed at an upflow velocity of 1.5 m/hour, in its vertical section. Table 6.2 also lists the head loss through the LTBR, which is constant, at design conditions, for all sizes of plant. This headloss is 24 kPa or nearly 2.5 m of water head. This means that, provided the water level in the Stage 1 Clarifier is at least 3m

52
higher than the water level in the Stage 2 clarifier, the transfer of water from Stage 1 to Stage 2 can take place by gravity. Alkali water/sludge is pumped from the underflow outlet of the Stage 2 clarifier into the feed line to the Stage 1 LTBR, in order to increase the pH of the colour removal stage to within the optimum range of 4.5 to 5.5, using a variable speed pump. During the limestone make-up process, part of this stream can be diverted to join the feed into Stage 2. This recycles any fine particles in the make-up limestone, which have been carried over from the teeter bed into the Stage 2 clarifier, back into the bottom of the teeter bed. This not only reduces the wastage of limestone, it prevents the pH in Stage 1 from becoming too high during limestone make-up, which occurred when the larger scale pilot plant was being topped up. The recycling of the underflow, plus the increased freeboard provided by the elutriation section, should overcome this problem. The design of the Stage 1 clarifier is also based upon an upflow velocity of 1.5 m/hour. Since the feed rate to both stages is the same, both clarifiers are of the same diameter. The clarification cone provides rapid mixing, precipitation of the colour solids, the gradually decreasing energy conditions required for slow mixing and floc formation and solids contact. Colour removal in Stage 1 of the large-scale pilot plant was satisfactory, but the analyses of the Stage 1 water indicated that the settled water still contained significant amounts of undissolved limestone particles. Increasing the retention time in the Coagulating Cone should reduce the colour in the treated water, reduce limestone consumption and reduce the recycle flow rate. The size of the Clarification Cone is limited by the need to provide as much area as possible for the settling of the colour flocs within the surrounding clarifier. The retention time allowed in the Clarification Cone is nearly 15 minutes. This is ½ of the normal recommended retention time, but given the ideal tapering velocity distribution, this is ample. Colour removal involves the processes of precipitation, adsorption and flocculation. The Clarification Cone is intended to accomplish all these processes within a single piece of equipment, so that normal design criteria are unlikely to apply. The cone is a mixed plug flow/backflow device, which operates as a floc blanket. The diameter at the bottom of the Clarification Cone, in the rapid mix zone, has been chosen to give an upflow velocity of 300 m/hour. This arrangement prevents the formation of dead zones in the bottom corners of the cone. The diameter at the top of the Clarification Zone is much greater, in order to retain flocs within the active precipitation zone for as long as possible. The upflow velocity at the top of the cone is 10 m/hour.

53
6.3. STABILISATION 6.3.1 Limestone Contactors Limestone contactors used to stabilise drinking water are normally located at the end of the process train i.e. after settling and final filtration. In this position the limestone contactor is required to treat water with a very low turbidity and low manganese, iron and aluminium concentrations. In South Africa, 12 to 15 mm limestone pebbles, supplied by P & B Limeworks of Bredasdorp, are normally used, mainly because this limestone is highly soluble. Although the P & B limestone is stated as containing low levels of silica, tests indicate that it can contain up to 6% silica. This silica appears to be fairly uniformly distributed throughout the limestone mass. This content of silica is sufficient to raise the turbidity of the final water to above 1 NTU, which is the upper limit set in SANS 241:2006 for Class 1 Drinking Water. The P & B limestone is also quite soft and friable, which are advantages in the LTBR treatment of coloured water, but can be a disadvantage when it is used in a limestone contactor at the end of the treatment line. In a limestone contactor the pebbles near the bottom of the contactor dissolve first, since they are in contact with the most corrosive water. There must therefore be a tendency for those pebbles near the bottom of the contactor to crush into much smaller particles and “mud” under the weight of the particles above them, especially under downwash conditions, when the contactor is drained. Fairly frequent down washing of the contactors, to drain, would appear to be necessary to remove this mud when a contactor starts to block or the turbidity of the stabilised water exceeds 1 NTU. The backwashed mud represents mainly lost limestone. No figures appear to have been published on the turbidity levels of the stabilised water produced by limestone contactors in South Africa, under operating conditions, on the increase in pressure drop across a contactor with time, on the frequency of down washing required and on the overall utilisation of the limestone purchased. In many countries, these problems are greatly reduced by using much finer, very pure, hard limestone. 6.3.2 The LTBR used for Upfront Stabilisation and Clarification In this case, in addition to stabilising the water, the system can accommodate and remove high levels of turbidity and aluminium, iron and manganese concentrations in the feed water. The full size, Stage 2, LTBR and its associated clarifier replace the conventional clarifier, but no alkaline recycle is necessary. In this second case the clarifier after the LTBR can be made much smaller, as shown in Figure 6.2.
54
After conventional clarification and filtration or ultrafiltration, the final water has a very low turbidity and iron, aluminium and manganese content. If the limestone used has a low insoluble solid content, then the increase in turbidity due to the release of silica and metal oxides from the limestone particles, as they dissolve, will cause a negligible increase in the turbidity of the water. There is, however, a potential increase in the turbidity of the stabilised water caused by the carryover of fine remnants of limestone particles from the top of the LTBR as the limestone particles dissolve. When a hard, very pure, limestone is utilised, each particle dissolves from the outside, becoming smaller and smaller and gradually rising within the teeter bed. Although the movement inside the teeter bed is vigorous enough to keep the surfaces of the particles fresh and to prevent the particles from becoming coated with precipitation products, the energy conditions are not high enough to break the solid limestone particles. When the diameter of a particle has been reduced to 10% of its initial size, its mass has been reduced to 1/1000th of its original mass. This is because the volume and mass of a sphere are proportional to the cube of its diameter. This means that, for a pure, hard limestone supplied with a particle diameter of, say 4 mm, 99.9% of the limestone has been dissolved when the size of the particles has been reduced to 0.4 mm, i.e. 400 µm. However, to ensure high limestone utilisation figures, the design must be based upon the size of the smallest limestone particles remaining in the make-up limestone after washing to remove the inevitable dust. For initial design purposes, the minimum limestone particle size, after backwashing, has been assumed to be 1.2 mm. This means that by rejecting those particles that have been reduced by dissolution to a diameter of less than 0.12 mm, the limestone utilisation efficiency will be in excess of 99.9%. An examination of Table 6.2 shows that limestone particles with a diameter of 0.12 mm have a hindered settling velocity of about 22 m/hour and a free settling velocity of close to 45 m/hour. Sizing the diameter of the elutriation section, and hence the top of the LTBR, at a flow velocity of 22 m/hour ensures that particles smaller than 0.12 mm will be ejected from the elutriation section and will then settle out in the clarifier, provided that the upflow velocity in the clarifier is less than 45 m/hour. In practice, it is probably better to size the clarifier at a slightly lower upflow velocity to ensure that none of the limestone particles are carried over with the final drinking water.

55
Figure 6.2. LTBR Used for Stabilisation after Conventional Water Treatment.

56
CHAPTER 7 HIGH FLOW AND LOW FLOW CONDITIONS
7.1. HIGH FLOW CONDITIONS The large-scale teeter bed pilot plant was operated; both at Sedgefield and at George, at a flow rate double the design flow rate, i.e. at 1000 litres/hour. If the flow rate is suddenly increased whilst the teeter bed is full of limestone, then there is a significant carry-over of fine media. When the feed flow rate is slowly increased, over a period of several hours, there is very little loss of limestone. The pH of the partly stabilized water leaving the Stage 2 LTBR changes very little when the flow rate is doubled, probably reflecting an increase in the rate of dissolution of the limestone under the higher energy conditions in the teeter bed. There is generally insufficient limestone in the teeter bed to last overnight at feed flowrates much above the design value and a significant carry-over of flocs from both stages, which means that the sand filter blocks during the night. The conclusions reached were that, although the teeter bed can run at double the design flows rate quite satisfactorily, the settlers and filters become overloaded. 7.2. LOW FLOW CONDITIONS All the equipment worked well at a flow rate of 250 litres/ hour, except the coagulant dosing pump, which behaved erratically at flow rates of close to 1 ml/minute. It is almost certain that some of the coarse limestone was not in a condition of incipient fluidization, but there was no evidence of precipitates being trapped between the limestone particles. The pH of the partly stabilized water from Stage 2 hardly varied, perhaps indicating that the increased retention time compensated foe the lower energy conditions. 7.3. CONCLUSIONS ON OPERATING THE LTBR AT HIGH AND LOW FLOW RATES The LTBR will operate well over a wide range of flow rates. At the higher flow rates the operation of the settler and sand filter become critical. Should the plant be run at a low flow rate for an extended period, a finer limestone can be used as make-up?

57
CHAPTER 8 CONVERTING AN EXISTING COLOURED WATER
TREATMENT PLANT FROM LIME TO LIMESTONE Figure 8.1 below, shows two Limestone Teeter Bed Reactors used in the conversion of an existing Water Treatment Plant from Lime to Limestone. The capital cost of such a conversion should be low since use is made of the existing clarifier in Stage 1, whilst only a very small clarifier is required in Stage 2, the water stabilisation phase, provided that a good quality limestone is used in Stage 2. The alum solution is first added to the raw water, which is then split into two streams. One stream gravitates, or is pumped to a limestone teeter bed reactor, where the calcium concentration and alkalinity of the stream plus its share of alum, are raised to levels just below their equilibrium values in contact with limestone. The pH of this stream would probably be within the range 7.5 to 8,0, for highly coloured raw water. This water is then combined with the bypass stream, with its share of added alum solution, which would probably have a pH of around 3.5. The streams are split in a ratio such that when they are recombined, the mixed pH is in the range of 4.5 to 5.5, when alum is used as the coagulant. Precipitation of the colour and adsorption onto metal hydroxides takes place partly within the Stage 1 LTBR and partly after the streams are mixed and is completed within the flocculating section of the existing water treatment plant. Settling of these flocs takes place within the existing plant settlers. One advantage of the proposed conversion is that there is no recycle of high alkaline water back from the stabilisation stage to the colour removal stage, and therefore, no increase in the flowrates through the settlers and the filters. The stabilisation stage incorporates a Limestone Teeter Bed Reactor located inside a small clarifier, sized as described in Section 6.3.3.

58
FI
GU
RE
8.1
Con
vert
ing
an E
xist
ing
Col
oure
d W
ater
Tre
atm
ent P
lant
from
Lim
e to
Lim
esto
ne

59
CHAPTER 9 SLUDGE CHARACTERISTICS
Sludge was discharged from the two clarifiers every second day and was visibly thicker than the lime sludges discharged from the full-scale plants. The solids concentration of the sludge varied according to the tests that were being performed during any particular period, within the range of 0.5 to 1.0% solids. Rough calculations on the composition of the sludge, based upon the alum dosage and the insolubles content of the limestone, show that up to 50% of the solids in the sludge are probably in the form of silica and heavy metal compounds from the limestone. This explains the increased settling rate of the colour flocs in the clarifiers when using limestone in place of lime. No specific equipment was provided to thicken the sludge, but a preliminary design for a thickener, using teeter bed technology, has been prepared.

60
CHAPTER 10 CONCLUSIONS
10.1. CONDITIONS WITHIN THE LIMESTONE TEETER BED REACTOR Although flow conditions inside the LTBR, under operating conditions, can be described as being chaotic (in fluidised bed terminology) rather than ideal, the overall effect is that of a bed in a state of incipient fluidisation, with the largest limestone particles remaining, generally in motion, near the bottom of the bed and the smallest particles, in a more mobile condition, remaining near the top of the limestone bed. Limestone particles that, due to continued dissolution, become too small to remain within the teeter bed are ejected from the teeter bed and remain within the elutriation section above the cone section until they dissolve almost completely. Insolubles in the feed limestones tested are small enough to be ejected from the limestone teeter bed and from the elutriation section and finally settle out in the clarifier or are removed in the sand filters. Limestone teeter bed reactors require no flushing and do not block in operation, which means that very little limestone is wasted and downtime is minimised. An elaborate underfloor feed and flushing system is not required for the LTBR. The limestone solids concentration within the LTBR is much higher than within a fluidised bed. This reduces the size of the bed, increases inter-particle abrasion and increases effective limestone dissolution rates. Limestone utilisation is close to 100%. Large LTBRs, having high feed water flow rates, can be constructed. Chicken Grit, which is a high calcium, friable limestone presently being marketed to poultry farmers and has a nominal particle grading between 3 and 4 mm, is a readily available source of limestone for the LTBR, although many other limestones can almost certainly be used. The LTBR can be sized so that only infrequent topping up with fresh limestone is required. This can be important for small installations that do not have full-time operators. 10.2. THE 2-STAGE COLOURED WATER TREATMENT PLANT In the proposed plant colour removal takes place within the Stage 1 Coagulation Cone, which is a combined precipitator/rapid mix/slow mix flocculator/sludge blanket.

61
Limestone dissolution, residual aluminium removal, clarification and stabilisation occur inside the Stage 2, Limestone Teeter Bed Reactor. With this arrangement there is no direct contact between the coagulant and the limestone and therefore there can be no danger of coating the limestone (armouring) or of trapping the precipitated colour flocs or hydroxides. The analyses of the Stage 1 water clearly indicated that the Coagulation Cone on the large-scale pilot plant used for this research was undersized, but the quality of the flocs produced were proof that the energy conditions within the cone were of the right order. Enlarging the cone increases the retention time under slow mix conditions and the depth of the sludge/floc blanket and will take the colour removal process to completion. The LTBR colour removal plant requires the use of two clarifiers, one after each stage. This has negative cost considerations, but a two-stage solids removal process is inherently more effective than a single stage in removing impurities. The pH in Stage 1 can be set, and will then remain, within the chosen range for optimal colour removal, by manually setting the flowrate of the high alkalinity water recycle from the Stage 2 LTBR back to Stage 1. Feed waters having high levels of colour associated with natural organic matter and inorganic iron can be treated to SANS 241/2006 Class 1 drinking water standards. Armouring of the limestone particles cannot occur in the proposed 2-stage colour removal plant, since the coagulants never come into direct contact with the limestone. The use of automatic pH control systems, dry feeders, slurry preparation tanks and slurry dosing systems is eliminated in the proposed design. The colour removal system is simple and cheap to operate and maintain. Colour precipitates and metal hydroxides formed within the coagulating cone(s) are removed from the feed water, mainly in the clarifiers but also in the sand filter. Sludge volumes created when limestone is used to neutralise the acidity of the raw water plus added coagulant, are much lower than corresponding volumes measured when lime is used for the same purpose. Lowering the sludge volume also has the effect of increasing the volume of potable water produced. 10.3. THE STABILISATION OF GENERAL POTABLE WATER SUPPLIES Although direct contact between the limestone and the water cannot result in a positive CCPP, partial stabilisation results in potable water that is normally not corrosive. When fully stabilised water is heated in a domestic geyser it can become scaling. On balance, very slightly under-stabilised water may be a better choice. The pilot plant results show that the LTBR can be used to stabilize potable water either at the beginning or at the end of the process train.

62
The advantages of front-end stabilisation include the ability to use the LTBR clarifier to remove turbidity and dissolved meals from the feed water. With this system the complete process train is protected against corrosion. The one disadvantage could be that the pH throughout the system is above the optimum value for disinfection using chlorine. Using the LTBR to stabilize drinking water after conventional treatment places the equipment in direct competition with the limestone contactor. Since the only chemical cost associated with limestone stabilisation is the cost of the actual limestone, any savings in chemical costs must be made in terms of a better usage of the limestone purchased, compared to a conventional limestone contactor. By using a purer and more solid particle and sizing the teeter bed and the clarifier to reject the limestone particles below a certain size, it is possible to obtain limestone utilisation efficiency in excess of 99%, without exceeding the specified turbidity level for the drinking water. When the LTBR is used for the stabilisation of drinking water, there should never be any need to backwash the system or to dig out any spent limestone. The LTBR stabilizer scores over the limestone contactor in terms of not requiring the expensive perforated floor and being much smaller in size.
Limestone is converted to lime in a kiln at temperatures over 8000C. Within the kiln, the reducing conditions convert any insoluble ferric oxides in the limestone to soluble ferrous iron. It is probable that insoluble manganic oxides are similarly converted to soluble manganous compounds. The brown lime used in the Western Cape is coloured by iron and manganese in the lime. When lime is used for stabilisation at the end of the process train there is a tendency for these soluble metals to add back colour to the final treated water and for the iron and manganese to oxidize in the distribution system. The precipitated hydroxides would then tend to settle out and be swept into consumers’ premises during times of high demand. When limestone is used in place of lime this cannot occur, since the metals compounds in the limestone are insoluble and should be removed within the water treatment plant. At the George Water Treatment Plants, the problem of high residual iron contents has been solved by adding potassium permanganate and chlorine to the feed and using a manganese dioxide coated sand as the filter medium. The capital and chemical costs, however, are high. The pilot plant results show that, when using limestone instead of lime, the residual iron and manganese levels, both at Sedgefield and at George are well within spec.

63
LTBRs can partially stabilise waters having high levels of dissolved metals and turbidity, very effectively. Limestone Teeter Bed Reactors can be located either at the front of the process train or at the end. When located at the front of the process train the high pH and alkalinity of the stabilised feedwater has the effect of protecting all the downstream process plant from corrosion. However, any metal salts added as coagulants after stabilisation will increase the corrosiveness of the water, as will chlorine gas added to disinfect the water. The pH value of the stabilised water may also be too high for optimal disinfection using chlorine. The LTBR placed at the front of the process train has the advantage over limestone contactors in that the LTBR can accommodate fairly high turbidity concentrations in the raw water. When a LTBR is placed at the end of the process train a very pure limestone with a very low insolubles concentration should be used to limit the turbidity of the final water. 10.4. DESIGN PARAMETERS Design parameters for the LTBR, for the associated clarifiers and for the coagulation cones used in the treatment of coloured waters are given in Chapter 6.

64
CHAPTER 11 RECOMMENDATIONS
11.1. DETERMINATION OF THE OPTIMAL CONDITIONS FOR COLOUR REMOVAL Although this research project was intended to be largely of a practical nature, with the main objective of determining design parameters for the construction of full scale LTBRs, much time was spent on attempting to determine which coagulants to use to remove colour from surface waters, how much to add and at what pH should the process be operated. Coagulant dosages and optimal pH ranges are usually determined from jar tests. “Guidelines for the Treatment of Cape Coloured Waters” (Swartz, CD and de Villiers, HA. 1998), provides, in Annexure E, a good description of how to carry out these coagulation beaker tests, based upon practices recommended by the AWWA and ASTM. In all these tests, samples are withdrawn for analysis from the beakers, after the completion of the flocculation stage and after allowing sufficient time for sedimentation to occur. The results obtained from these beaker tests are a function, not only of the effectiveness of the colour removal process, but also the rate at which the precipitates settle. This depends primarily on the size, density and electrophoretic mobility of the flocs. The metal salts, added to precipitate the colour, also act as flocculants, serving to neutralize the negative charges on the colour precipitate at low pH values, to bind the precipitated particles together into larger flocs and greatly increase the settling velocity of the precipitated colour. Adding more metal salt than necessary to precipitate all the colour and operating the colour removal stage at a higher pH than strictly required to precipitate the colour yields a higher colour “removal”, than operating at lower values. Adding extra iron and aluminium salts is important in a normal coloured water treatment plant which must produce a certain volume of potable water with a low residual colour, in a given time; but adding more coagulant than is necessary increases the costs of coagulation and of the alkali needed to neutralise the acidity added by the coagulant, increases the volume of sludge and decreases the volume of potable water produced. The 2-stage LTBR coloured water treatment process, used for the larger sized pilot plant trials, has a separate stage, stage 1, for colour removal. In this stage the pH can be set within a wide range, simply by adjusting the flowrate of the alkaline water returned from stage 2. The amount of floc carry-over from stage 1 is not critical in this

65
design, since the water is re-settled, at a higher pH, in stage 2 and then filtered through a conventional sand filter. During the pilot plant trials small, well formed, very dark brown flocs were produced at low pH values with low doses of coagulants, although these precipitates were slow to settle. This would appear to substantiate the theory that colour precipitation requires only a low coagulant dosage and pH. Colour removal plants which employ direct filtration may also operate effectively on high coloured waters at lower coagulant dosages and pH values than are indicated by jar tests. Further research may be warranted to determine whether colour precipitation can be carried out with low coagulant dosages at low pH values in treatment plants in which settlement under these conditions is not critical and whether this leads to lower overall operating costs. 11.2. DETERMINATION OF THE OPTIMAL CONDITIONS FOR THE REMOVAL OF ORGANICS SANS 241:2006 specifies maximum concentrations for Dissolved Organic Carbon. UV Absorbance may be used as a surrogate for DOC, but no limits have been set for UVA and the relationship between UVA and DOC is not linear and differs from water to water. No guidance appears to be given to plant managers or operators to enable them to optimize the operation of their plants to meet the organoleptic and colour requirements of SANS 241:2006, at minimum cost.
(b) The Water Research Commission should commission research into the
relationship between UVA and DOC for a range of typical South African waters and determine combinations of coagulant types, dosages and pH values to guide plant managers and operators in meeting the National Standards.
11.3. SOUTH AFRICAN BROWN LIMES “Guidelines for the Treatment of Cape Coloured Waters” (Swartz, CD and de Villiers, HA. 1998), Appendix F, Section 3 “Lime” gives the iron content in the P & B hydrated lime as 1.79 mg/g. This analysis needs to be updated. It will also be necessary to determine whether this iron is in a soluble form and what the residual iron level would be in stabilized water in which lime only is used for stabilisation.
66
APPENDIX A REFERENCES (Hammarstrom, Sibrell & Belkin, 2003). Characterization of limestone reacted with Acid-Mine Drainage in a pulsed limestone bed treatment system at the Friendship Hill National Historical Site, Pennsylvania, USA. Applied Geochemistry 18 (2003) 1705-1721. Floatex Hydrosizer. Floatex Separations Ltd. (Ødegaard, Eikebrokk & Storhaug, 1999). Processes for the removal of humic substances from water - an overview based on Norwegian experiences. Wat. Sci. Tech. Vol. 40(9), pp 37-46, 1999 (Maree and Du Plessis, 1994). Neutralization of acid-mine water with calcium-carbonate. Water Science and Technology, vol. 29(9), pp 285-296 (Sibrell, Watten & Boone, 2003). Remediation of Acid Mine Drainage at the Friendship Hill National Historical Site with a Pulsed Limestone Bed Process. Hydrometallurgy 2003-Fifth International Conference. 2003 (Sibrell, Wildeman, Frienmuth, Chambers & Bless 2005). Demonstration of a Pulsed Limestone Bed Process for the Treatment of Acid Mine Drainage at the Argo Tunnel Site, Idaho Springs, Colorado. American Society of Mining and Reclamation. 2005. Circulator clarifier. Degrémont Suez. Water Treatment Handbook. The Gyractor. Degrémont. Water Treatment Handbook.

67
APPENDIX B. THEORY INVOLVED IN SIZING OF A LIMESTONE TEETER BED REACTOR Ergun’s Equation In the late 1940’s Ergun & Orning (Ergun, 1952, p.89) developed an expression relating pressure drop and fluid flow for a packed bed, based upon the concept that the total energy lost by the flow of a fluid through the packed bed could be treated as the sum of the viscous and kinetic energy losses. When a fluid flows upwardly through a packed bed the space between the particles increases as the velocity of the fluid increases. At a very low feed flow rate the liquid percolates through the void spaces of the packed bed and the bed remains intact. With increasing liquid velocities the pressure drop through the bed rises until it reaches the submerged weight of the packed bed, per unit area. At this flow rate the bed starts to expand and to become fluidised. Ergun found that viscous energy losses dominate at low fluid flow rates, i.e. at low Reynolds’ numbers, whilst kinetic energy losses dominate in the turbulent range. At the onset of fluidisation the particles are still close enough together that the pressure drop is related to the velocity by Ergun’s equation.
pp dk
dk
LP
3
22
23
21 )1()1(
………………………..…eq. (1)
Where P is the pressure drop across the bed. (Pa)
L is the depth of the packed bed. (m) is the viscosity of the fluid. (kg/m.s) is the superficial upflow velocity (m/s) dp is the equivalent spherical diameter of the particles. (m) is the density of the fluid. (kg/m3) k1 is the coefficient of viscous energy. (dimensionless) k2 is the coefficient of kinetic energy. (dimensionless)
is the porosity of the bed. (dimensionless)
Values for the coefficients of viscous energy and kinetic energy were originally obtained by Ergun & Orning (Ergun, 1952, p.89), by the method of least squares, based upon the results of 640 experiments as k1 = 150 and k2 = 1.75. MacDonald et al.

68
(1979) studied data on an even wider range of particles and concluded that k1 =180 provided an even closer fit. MacDonald’s figures are used in this report. A teeter bed can be considered as a packed bed in which the upflow velocity is just high enough to fluidise the bed, i.e. the bed is in a state of incipient fluidisation. This state occurs when the upward force exerted by the fluid on the particles is just sufficient to balance the net weight (i.e. the submerged weight) of the bed and the particles begin to separate from each other and “float” in the fluid. Although single sized or continuously graded limestone can be used in the limestone teeter bed reactor, adding fresh limestone to the LTBR results in the creation of a multimodal size distribution, since the older limestone particles will be partly dissolved and therefore become progressively smaller with time. In order to produce a limestone bed in which most of the limestone particles are in a state of teeter, rather than being fluidised, the teeter bed tank must be in the form of a hollow inverted truncated cylinder. The largest particles will then tend to gather near the bottom of the bed, where their high hindered settling velocities match the high upflow velocity in that region, whilst the smaller particles remain close to the top of the bed, where their lower hindered settling velocities match the much lower upflow velocities which occur there. Two important factors influence the rate of dissolution of the limestone at different points within the teeter bed: Incipient Fluidisation. Let the subscript 1 indicate conditions at the bottom of the teeter bed and Let the subscript 2 indicate conditions at the top of the teeter bed. The condition under which the upward force, exerted by the fluid entering the teeter bed on the particles, is sufficient to balance the downwards force at the entrance to the teeter bed due to the submerged mass of the particles in the bed is represented by the equation: DPA1 = (1-e) (rp-r) A1 L g……………………………………eq. (2) DP = (1-e) (rp-r) L g……………………………………….eq. (3) Where A1 is the area of the horizontal cross section through the bottom of the bed. Substituting in equation (1) for DP, from equation (3), provides for the condition of incipient fluidisation, also known as minimum fluidisation.
( )pp
p dk
dkg 3
22
231 )1(
ενρ
ενμερρ +
−=− ……………………………...……....eq. (4)
Now 211
4DQ
AQ
πν == . …………………………………..……………eq. (5)

69
Where D1 is the diameter at the bottom of the teeter bed (m) and Q is the volumetric feed flowrate m3/s. Substituting in equation (5) for ν , from equation (5) gives:
( ) ( ) ppp
dD
QkdDQkg
2221
22
2321
1 16)1(4
επ
ρεπμερρ +
−=− …………………………..eq. (6)
Let K1 = 31 )1(ε
ε−k……………………………………………..…….eq. (7)
and K2 = 32
εk
……………………………………………………..……eq. (8)
Wen & Yu (1966) noted that K1 and K2 stay nearly constant over a wide range of particles and Reynolds’ numbers. They determined values of:
⎟⎟⎠
⎞⎜⎜⎝
⎛
2
1
2KK
= 33.7 and ⎟⎟⎠
⎞⎜⎜⎝
⎛
2
1K
= 0.0408
Chitester et al. (1984) continued this work and, for coarse particles determined that;
⎟⎟⎠
⎞⎜⎜⎝
⎛
2
1
2KK
= 28.7 and ⎟⎟⎠
⎞⎜⎜⎝
⎛
2
1K
= 0.0494, provided a better fit to their data.
Values of K1 = 1162 and K2 = 20.24, obtained by Chitester et al. (1984) are used in this report to solve the Ergun’s Equation for minimum fluidisation. Substituting the above values in equation (6) gives:
( )pp
p dDQ
dDQ
g 41
2
221
81.321480 ρμρρ +=− ………………………….…..eq. (9)
For a given maximum particle size dp and a given volumetric flowrate, the diameter of the teeter bed D1 can be determined from equation (9). This version of Ergun’s equation is applicable to any level within the teeter bed, provided that the bed is in a state of incipient fluidisation throughout and the correct values are used for D1. Substituting the given values for K1, K2, k1 and k2 in equations (7) & (8) provides a value for e (the porosity of the bed) of 0.442. This porosity corresponds to that for a loosely packed bed in which the particles have a sphericity of 0.92, which is consistent with the theory applied.