the gender pay gap in belgium - report 2010
TRANSCRIPT
The Gender Pay Gap
in Belgium - Report 2010


Table of contents
FOREWORD ..................................................................................................................................................... 5
INTRODUCTION .............................................................................................................................................. 7
I. GENERAL GENDER PAY GAP INDICATORS ..................................................................................................9
INDICATOR 1 : DIFFERENCES IN THE AVERAGE GROSS WAGES OF WOMEN AND MEN ............9
1.1 Full-time workers ..........................................................................................................................10
1.2 Full-time and part-time workers ..................................................................................................14
1.3 Extension to companies and sectors not included in the Structure of Earnings Survey ...........16
1.4 The pay gap by status ....................................................................................................................20
1.5 Trends in the pay gapl ...................................................................................................................23
INDICATOR 2 : SHARE IN THE TOTAL SUM OF WAGES ....................................................................26
II. INEQUALITY FACTORS ..................................................................................................................................33
INDICATOR 3 : RATIO FOR PART-TIME WORK ..........................................................................................33
IINDICATOR 4 : RATIO BY AGE AND LEVEL OF EDUCATION ...................................................................36
4.1 The pay gap by age ........................................................................................................................36
4.2 The pay gap by level of education .................................................................................................40
INDICATOR 5 : SEGREGATION ON THE LABOUR MARKET .....................................................................42
5.1 Horizontal segregation : sectors ..................................................................................................43
5.2 Horizontal segregation : professions............................................................................................53
5.3 Vertical segregation ......................................................................................................................56
5.4 The size of the company ................................................................................................................56
5.5 The gender pay gap in the light of the overall pay gap ................................................................57
EXTRA INDICATOR : MARITAL STATUS AND HOUSEHOLD COMPOSITION ...........................................58
EXTRA INDICATOR : NATIONALITY ............................................................................................................61
III. BREAKDOWN OF THE DIFFERENCE IN PAY ..............................................................................................67
INDICATOR 6 ...............................................................................................................................................67
SUMMARY ....................................................................................................................................................... 71
POLICY RECOMMENDATIONS ....................................................................................................................... 75
EXPLANATORY GLOSSARY ............................................................................................................................. 77
LIST OF TABLES ............................................................................................................................................. 79
LIST OF GRAPHS ............................................................................................................................................ 81
ANNEX 1 : NACE REV1 NOMENCLATURE ..................................................................................................... 83
ANNEX 2 : ISCO NOMENCLATURE ................................................................................................................ 85
ANNEX 3 : LIST OF JOINT COMMITTEES ....................................................................................................... 87


- 5 -
Foreword
Tout comAs in previous years, the pay gap between women and men – the gender pay gap – remains a priority
in 2010. The fi gures demonstrate once again just how stubborn pay differences between women and men
continue to be in Belgium. Naturally, it is impossible for me to view this situation with any satisfaction.
On the one hand, as Minister for Employment, I am convinced that a labour market that is not free of discrimi-
nation is, by defi nition, a labour market that is not functioning to the best of its ability. A proper labour market
requires equal pay for equal work.
On the other hand, as Minister for Equal Opportunities, I think that the pay gap in itself is a fundamental in-
justice. Having a paid job is also a way of gaining a place in society. For most people, it is their most important
means of obtaining an income and also of developing themselves personally. Systematically giving women
fewer opportunities than men in this area brings about inequalities in society.
So once again this report is an essential tool for shaping our policy based on strong analytical foundations.
In the second half of 2010, Belgium will be taking over the Presidency of the European Union. It is in this
context that a European pay gap report is currently being prepared. I will also be using Belgium’s Presidency
to keep the issues surrounding the pay gap on the political agenda at a European level.
I very much hope you will enjoy reading this report.
Joëlle Milquet
Vice Prime Minister and Minister for Employment and Equal Opportunities, responsible for the Policy on Migration and Asylum

- 6 -

- 7 -
Introduction
March has now become synonymous with the publication of a new report on the gender pay gap. The 2010
report is the fourth year in succession it has been published. A quick glance at the fi gures tells us that little
change can be detected in comparison with the previous year. But for the fi rst time, however, this is good
news. In fact, the current fi gures confi rm the narrowing of the gap we observed last year, although this still
needs to be interpreted with the required caution. As a result, we can safely state that the pay gap in 2006
and 2007 was markedly smaller than in the period before. Why that is the case is less straightforward to
defi ne. This is because the pay gap is a consequence of a combination of factors and the explanation for this
narrowing of the gap is probably to be found by searching in different directions. One striking fact is that the
women coming into the labour market are increasingly well educated. They are also interrupting their career
less frequently and hence are able to build up longer periods of service and gain seniority. We can naturally
only applaud a structural improvement such as this in the position that women occupy on the labour market.
Yet we also hope that the awareness of the situation gained over recent years has not been without its effects
– the unions, as well as the government departments involved and successive Ministers for Employment have
all put in a great deal of effort in this area – and that both employees and employers are also more aware of
the totally unacceptable nature of the pay gap.
Whether the pay gap will continue to narrow in the future remains a matter of some conjecture. The report
in 2011 will include the fi gures for 2008, which was the year of the global fi nancial crisis. Whether and how
the crisis has had an effect on the pay gap is a question that we are asked regularly. But without any concrete
data, we can only speculate. In principle, the crisis may have an effect on the pay gap in various different ways.
In the fi rst place, the GFC is still being felt in terms of unemployment fi gures – and naturally the pay gap can
only be calculated based on people who are still in employment. This means that a rise or fall in the pay gap
is mainly a consequence of redundancies and less so of trends in pay levels. Which sectors are affected, or
whether mainly men or women are made redundant and which pay categories are most affected by the crisis
can all have an impact on the average pay of women and men. It can also work out to be higher or lower. If,
for example, redundancies are mainly men on the lower pay categories, the men still in employment will earn
more on average, which would widen the pay gap. So being able to interpret pay gap fi gures means taking
account of the movements in employment levels.
Because 2010 is the year of Belgium’s Presidency of the European Union, we are publishing two reports this
year: this report for Belgium in March, and a European report in October. As a result, there is no European
section in this particular report. The indicators for the various Member States will be calculated in the exten-
sive European report. In the context of Europe, Belgium is setting a good example. In some other Member
States, the pay gap is twice as high. This makes us especially suitable for carrying the load. In terms of policy,
fi rst, both for eliminating discrimination and improving the position in the labour market for women and, se-
cond, for continuing to work on further improving and harmonising the statistical apparatus.
Even though it is the fourth report in the series, it will fi nd its way into the hands of entirely new readers. So
in this sense, this introduction requires an explanation about the how and why of this report. It was at the
Council of Ministers meeting on 31st March 2006 that the decision was taken to draft an offi cial report every
year with fi gures dealing with the pay gap. This task was entrusted jointly to the Institute for the Equality of
Women and Men, and to the Federal Public Service Employment, Labour and Social Dialogue. In compiling
the fi rst report, a natural partner was soon found in the Directorate-General Statistics and Economic Infor-
mation at the Federal Public Service Economy, SMEs, Self-Employed and Energy. A year later, in the search to
fi nd a way of fi lling in the gaps in the data, contact was made with the Federal Planning Bureau. Again, here,
the collaboration has been long-lasting. Both partners in the project also work together to supply data on the

- 8 -
pay gap in Belgium to Eurostat. This year, the Directorate-General for Statistics and Economic Information is
also handling the layout and printing side of the report.
The pay gap is calculated on the basis of the average gross pay of women and men. The difference between
the two is expressed as a percentage of the average gross pay for men. The formula used is:
H-F x 100
H
(F= the average gross pay for women, and M= the average gross pay for men)
Gross hourly wages rates are generally used, although monthly and annual salaries and even bonuses are
also used to illustrate clearly the differences in pay between women and men.
This year, for the fi rst time, we also have details about a number of fringe benefi ts. Fringe benefi ts are bene-
fi ts of every kind that come on top of base pay. In principle, fringe benefi ts form part of the overall salary
and the pay gap, while in practice it is not so easy to obtain a good view as to how these benefi ts are broken
down. In the report, we base ourselves on fi scal data analysed by the Directorate-General for Statistics and
Economic Information. The sometimes major differences observed provide food for thought and make closer
examination of this issue necessary without delay.
Although reliable and complete administrative data does exist at the National Social Security Offi ce (NSSO)
about salaries paid in Belgium, this data is not detailed enough for most of the indicators in this report. Which
is why we mainly use the Structure of Earnings Survey (SES). The SES is an annual survey conducted by the
Directorate-General for Statistics and Economic Information among organisations or the local units of com-
panies. This provides highly dependable and detailed data. Companies with fewer than 10 staff and a number
of sectors are not included in the survey. This disadvantage is offset to some extent by estimates produced by
the Federal Planning Bureau based on administrative data. Every four years, the survey is extended to include
education, healthcare and the socio-cultural sector. This was not the case for the survey year 2007, on which
this report is based.
Finally, we don’t just provide a single fi gure on the pay gap, but explain the topic from various different points
of view. This is done using a set of indicators approved by the European Union’s Council of Ministers. In the
fi rst section of the report, the pay gap is shown in its entirety, while in the second section, a number of impor-
tant factors are explained. In the third section, they are linked together and we examine the extent to which
the pay differences between women and men can be attributed to these known factors. Finally, we make a
series of policy recommendations.
- 9 -
I. General gender pay gap indicators
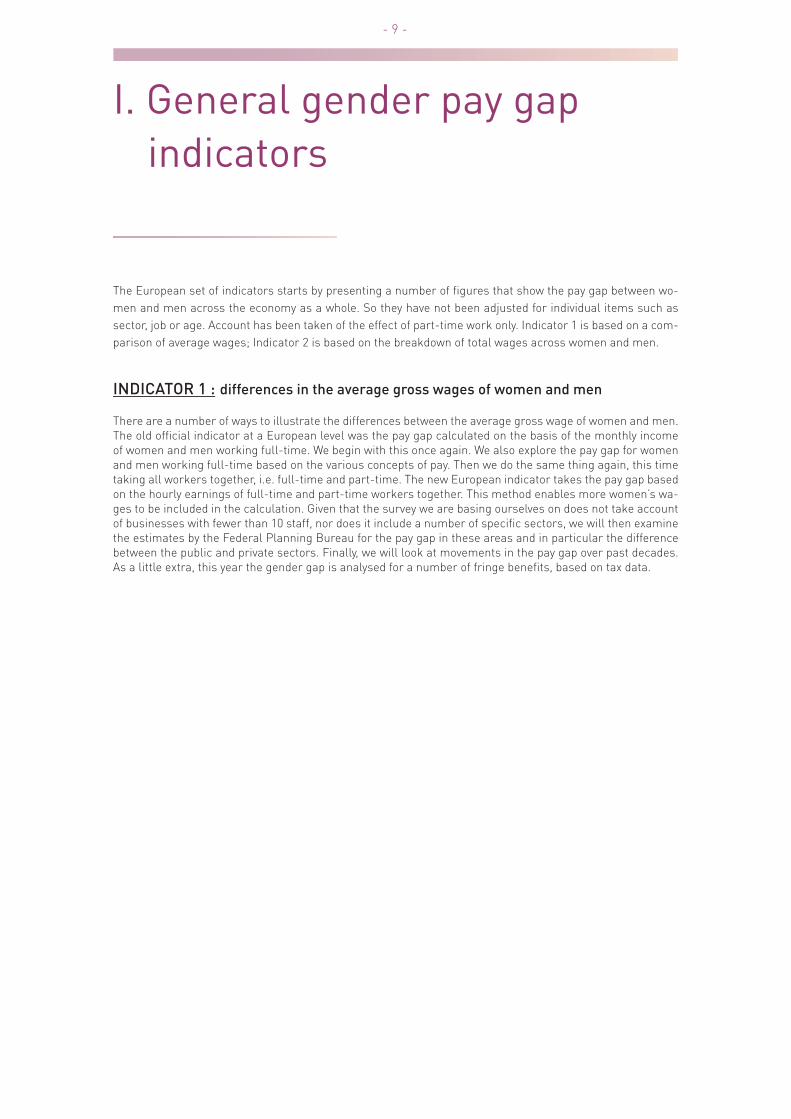
The European set of indicators starts by presenting a number of fi gures that show the pay gap between wo-
men and men across the economy as a whole. So they have not been adjusted for individual items such as
sector, job or age. Account has been taken of the effect of part-time work only. Indicator 1 is based on a com-
parison of average wages; Indicator 2 is based on the breakdown of total wages across women and men.
INDICATOR 1 : differences in the average gross wages of women and men
There are a number of ways to illustrate the differences between the average gross wage of women and men.
The old offi cial indicator at a European level was the pay gap calculated on the basis of the monthly income
of women and men working full-time. We begin with this once again. We also explore the pay gap for women
and men working full-time based on the various concepts of pay. Then we do the same thing again, this time
taking all workers together, i.e. full-time and part-time. The new European indicator takes the pay gap based
on the hourly earnings of full-time and part-time workers together. This method enables more women’s wa-
ges to be included in the calculation. Given that the survey we are basing ourselves on does not take account
of businesses with fewer than 10 staff, nor does it include a number of specifi c sectors, we will then examine
the estimates by the Federal Planning Bureau for the pay gap in these areas and in particular the difference
between the public and private sectors. Finally, we will look at movements in the pay gap over past decades.
As a little extra, this year the gender gap is analysed for a number of fringe benefi ts, based on tax data.

- 10 -
1.1 Full-time workers
The graph below shows the gross monthly wages of full-time workers for 2007. This graph shows that women
earn 341 EUR less than men, on average. This means that in 2007, the pay gap between women and men was
11.69%. Gross earnings for both men and women rose in comparison with 2006. However, this rise was grea-
ter for women, which closed the pay gap slightly (12.47% in 2006). Yet we can say that the fi gures for 2007 are
comparable with those for 2006. In relation with 2004 and 2005, the pay gap is considerably smaller.
GRAPH 1 : Average gross monthly wages of full-time employees (in EUR) (2007)
Source: DGSEI, Structure of Earnings Survey
Table 1 shows the changes over 6 years for the gross monthly wages of women and men working full-time,
and the pay gap. Each year gross earnings rose, with the changes for women stronger on the whole. Between
2002 and 2007, the earnings of women working full-time increased by 19%, while for men it increased by only
15%. This unequal rise is making the pay gap smaller in the long term. As already pointed out above, the
difference in gross monthly wages between men and women was 341 EUR in 2007. This means that women
earned 88.3% of what men earned, whereas it was only 87.5% in 2006 (85.6% in 2002).
Table 1: Average gross monthly wages of full-time employees (in EUR) and the pay gap (2002-2007)
2002 2003 2004 2005 2006 2007
Women 2.165 2.231 2.343 2.387 2.491 2.577
Men 2.529 2.679 2.757 2.807 2.846 2.918
pay gap 14% 17% 15% 15% 12% 12%
Source: DGSEI, Structure of Earnings Survey
0
500
1000
1500
2000
2500
3000
3500
Women Men
Women Men

- 11 -
The table below shows the gross hourly wages of men and women working full-time and indicates a similar
trend. While the hourly wages for both women and men working full-time are rising, the increase is greater
for women, which in turn is closing the pay gap. When we look at gross hourly wages, the pay gap continues
to become smaller than with gross monthly earnings. This can be attributed to the fact that among full-time
workers, men work more hours than women. Hence part of the pay gap in gross monthly earnings can be
explained by the fact that men work more hours per month and therefore earn more per month.
Table 2 : Average gross hourly wages of full-time employees (in euro) and the pay gap (2002-2007)
2002 2003 2004 2005 2006 2007
Women 12,88 13,14 14,15 14,38 15,00 15,48
Men 14,89 15,60 16,25 16,68 16,93 17,36
Pay gap 14% 16% 13% 14% 11% 11%
Source: DGSEI, Structure of Earnings Survey
The pay gap in bonuses clearly is smaller than the pay gap in ordinary monthly earnings. This is due to the
fact that many bonuses are made up of a fi xed part and a part that depends on the monthly earnings. Yet the
total pay gap bears close resemblance to the gap for the salary component, given that bonuses only represent
a limited part of the total amount (approximately 10%). This means that the salary component has a much
greater impact on total gross annual earnings. Given that this component of the pay gap has closed the most,
a signifi cant reduction in the pay gap can also be seen in total gross annual earnings. Once again here the
fi gures for 2007 are comparable with those for 2006, although they are considerably lower than in 2004 and
2005.

- 12 -
Tableau 3 : Average gross annual wages of full-time employees (in EUR) and the pay gap (2002-2007)1
Total (salary component + bonuses component)
2002 2003 2004 2005 2006 2007
Women 29.832 28.386 30.282 31.317 32.616 33.625
Men 34.590 33.616 35.675 36.819 37.175 38.018
Pay gap 14% 16% 15% 15% 12% 12%
Salary component
2002 2003 2004 2005 2006 2007
Women 26.433 25.977 27.056 27.960 29.149 30.053
Men 31.095 30.859 32.027 33.085 33.346 34.102
Pay gap 15% 16% 16% 15% 13% 12%
Bonuses component
2002 2003 2004 2005 2006 2007
Women 3.399 2.409 2.617 3.357 3.467 3.572
Men 3.495 2.757 3.012 3.734 3.829 3.916
Pay gap 3% 13% 13% 10% 9% 9%
Source : DGSEI, Structure of Earnings Survey
In addition to these bonuses, some employees also receive extra benefi ts, which are not included in the
survey. Based on offi cial data, we are not able to check whether items such as a company car or a business
mobile phone are allocated more to men rather than to women. Research also shows that this actually is
the case.
However, based on tax information available to the Directorate General for Statistics and Economic informa-
tion of the FPS Economy, we are able to highlight a number of differences, as shown in table 4.
1 The multifunctional DMFA (Déclaration multifonctionelle / Multifunctionele aangifte) return was introduced in 2003. This
change to the lodging of Social Security data may cause a discrepancy.

- 13 -
Table 4 : Proportion of wage earners to whom certain benefi ts are allocated and the average amount (in EUR) of these benefi ts (2006)2
Women Men Différence
Share options
Proportion 0,31% 0,73%
Average amount 2.996,83 5.770,64 48,07%
Reimbursement of travel
costs to and from work
Proportion 70,9% 70,3%
Average amount 369,34 514,70 28,24%
Contributions to
supplementary pension
schemes
Proportion 13,3% 15,9%
Average amount 385,55 710,60 45,74%
Sources : DGSEI, Tax statistics and NSSO
The share options in the table are new options allocated in 2006. 0.73% of male wage earners and 0.31% of
female wage earners benefi ted from share options. On average, men received options to a value of 5,770.64
EUR, while women received 2,996.83 EUR. This indicates a very large difference of 48.07%. This is probably
related to the under-representation of women in company management (the glass ceiling), given that share
options are usually allocated to employees occupying more senior positions.
Reimbursements for travel between home and work are allocated to both men and women. Yet on average,
men receive annual reimbursements that are 28.24% higher than women. There are a number of possible
explanations for this. On average, men tend to live further away from their place of work. Part-time workers,
which includes women in particular, tend to live closer.
As far as supplementary pensions are concerned, we can see that employers pay a contribution for 13.3% of
women and 15.9% of men. This involves appreciable percentages of wage earners and so merits the neces-
sary attention. So, in comparison with one another, more men than women receive a supplementary pension,
but the major difference lies mainly in the extent of the amounts involved: an average of 710.60 EUR is contri-
buted for men, while for women it is only 385.55 EUR – 45.74% less. This is another area where the gender pay
gap is very wide. In fact the difference here is far higher than in the pay gap, which is not so easy to explain.
These differences are also relevant in the context of the debate about pensions.
2 The most recent available data relates to 2006.

- 14 -
1.2 Full-time and part-time workers
Before proceeding with an analysis of the pay gap between full-time and part-time workers, it has to be said
that the pay gap based on hourly wages is signifi cantly smaller among part-time workers than with their full-
time counterparts. This signifi cant difference can be explained mainly by the fact that like women who work
part-time, men who work part-time earn less per hour than full-time workers. But because fewer men work
part-time, the impact that this has on the pay gap between full-time and part-time workers on the whole is
however negligible. Taking account of the large number of women who work part-time, a pay gap indicator
based only on full-time workers would result in the exclusion of a large number of working women from this
indicator. By including part-time workers in the calculation, the lower average hourly wages of part-time
workers create a wider pay gap between men and women, which refl ects the reality better. This is especially
the case in industry and sales, where the vast majority of part-time workers are women on lower wages. For
all these reasons, the offi cial European wages indicator has been calculated since the summer of 2007 on the
basis of the hourly wages of full-time and part-time working men and women together. Readers wishing to
have more details about part-time workers are referred to Indicator 3.
Table 5 : Average gross hourly wages of full-time and part-time employees (in EUR) and the pay gap (2002-2007)
2002 2003 2004 2005 2006 2007
Women 12,41 12,77 13,44 13,78 14,37 14,78
Men 14,80 15,44 16,06 16,54 16,80 17,27
Pay gap 16% 17% 16% 17% 14% 14%
Source : DGSEI, Structure of Earnings Survey
In 2007, the pay gap based on the average gross hourly wages of full-time and part-time workers was 14%
for sectors C to K. We note that the closing of the pay gap that took place in 2006 after 4 years of stagnating
fi gures, did not continue in 2007, although this pay gap of 14% in 2007 did confi rm the fall in 2006.

- 15 -
The table below shows the pay gap for full-time and part-time workers together based on average gross
monthly earnings. Calculated in this way, the pay gap is considerably greater than with full-time workers
alone. In addition to the impact that working part-time has on the hourly wages of women and men, there is of
course also a signifi cant difference in the average monthly wages of part-time and full-time wageearners.
Taking account of the fact that women are very much over-represented among part-time workers, which
results in an even wider pay gap, in 2007, the pay gap between women and men based on the average gross
monthly earnings of full-time and part-time workers taken together was 23%, although for full-time workers
in the same period, the pay gap was only 12%. The importance of this indicator lies in the fact that no adjust-
ment has been made at all for the effects of part-time work: on average, women earn 23% per month less
than men. Although a signifi cant part of this pay gap can be attributed to part-time working, this indicator
refl ects the day-to-day reality for women.
Table 6 : Average gross monthly wages of full-time and part-time employees (in EUR) and the pay gap (2002-2007)
2002 2003 2004 2005 2006 2007
Women 1.834 1.932 2.003 2.049 2.106 2.130
Men 2.462 2.592 2.677 2.720 2.756 2.783
Pay gap 26% 25% 25% 25% 24% 23%
Source : DGSEI, Structure of Earnings Survey
Movements in the pay gap between women and men have remained relatively stable here, albeit showing a
slight downward trend. Hence the pay gap was 25.18% in 2004, 24.67% in 2005, 23.58% in 2006 and 23.46% in
2007. This trend needs to be confi rmed over the years ahead

- 16 -
1.3 Extension to companies and sectors not included in the Structure of Earnings
Survey
The Structure of Earnings Survey only includes those companies with at least 10 employees in sectors C to
K of the NACE nomenclature (see Annex 1). Since 2006, sectors C-K, M, N and O have also been included in
the survey, although only every four years3. Sectors C to K are industry, trading, hospitality, transport, fi nance,
real estate and other services to companies4. Based on the fi gures from the survey, plus administrative data,
the Federal Planning Bureau estimates the average gross hourly wages for all company sizes and for most
other sectors. With sectors C to K, there are also the primary sector (agriculture and fi sheries), government
administration, education, healthcare and the socio-cultural sector. In the NACE nomenclature, these then
are sectors A to O.5 Compared with the data published in the previous report, it is important to note that the
series has been re-estimated and adjusted, on the one hand as the result of a review of the historic employ-
ment series, the volume of work and pre-tax earnings in the national accounts, and on the other hand on
account of an adjustment to the methodology. However, these re-estimates only have a relatively limited effect
on the fi gures.
The tables below show fi gures from the Federal Planning Bureau, based on the survey and administrative
data. The original survey data is supplemented here in two ways: fi rst by businesses employing fewer than 10
staff and second by sectors A, B, L and O.6
3 Sectors M, N and O include education, healthcare and social services and collective, social and personal
services – also called the socio-cultural sector.4 Industry includes mining and manufacturing, the product and distribution of electricity, gas and water and construction.
5 Two sectors are not taken into consideration here: the sector for domestic staff and the small sector of extra-territorial
organisations (e.g. EU or UN staff).
6 For these re-estimated fi gures, account has of course been taken of the 2006 survey results for sectors M, N and O.

- 17 -
A distinction is made in tables 7 and 8 between businesses with fewer than 10 staff and those with 10 or more
staff in sectors C-K, M, N and O. Table 9 compares sectors C to K and sectors C-K, M, N and O with sectors
A to O.
Table 7 : Average gross hourly wages for full-time and part-time employees (in EUR) and the pay gap in companies with at least 10 employees and companies with fewer than 10 employees (NACE sectors C-K, M, N & O) (2002-2007)
2002 2003 2004 2005 2006 2007
Men
Companies with 10 employees or more 15,13 15,78 16,37 16,84 17,09 17,57
Companies with fewer than 10 employees 11,90 12,29 12,96 13,29 13,51 13,98
Total 14,69 15,29 15,88 16,33 16,58 17,06
Women
Companies with 10 employees or more 13,32 13,67 14,36 14,74 15,31 15,75
Companies with fewer than 10 employees 10,39 10,65 11,27 11,53 12,07 12,61
Total 12,89 13,22 13,90 14,25 14,83 15,29
Pay gap
Companies with 10 employees or more 12% 13% 12% 12% 10% 10%
Companies with fewer than 10 employees 13% 13% 13% 13% 11% 10%
Total 12% 14% 13% 13% 11% 10%
Sources : Federal Planning Bureau and DGSEI, Structure of Earnings Survey
The average hourly wages in companies with fewer than 10 employees in sectors C-K, M, N and O appears to
be lower than in companies with 10 or more employees. This applies to both women and men. It can also be
seen that the difference in wages in 2007 is a little smaller in companies with fewer than 10 employees (9.8%)
than in those with 10 or more employees (10.4%). This has been the other way round in previous years.
Table 8 shows the results for this exercise in sectors C to K, and M to O separately. The average hourly wages
in companies with at least 10 employees is higher across the board than in companies with fewer than 10
employees. This is regardless of gender or sector. The split between the ‘classic’ private sectors, i.e. industry
and market services on the one hand, and the ‘semi-public’ sectors, i.e. education, healthcare and social
services and the socio-cultural sector on the other, highlights an interesting difference. While in sectors C
to K the pay gap is greater in companies with 10 employees to more (14%) than in those with fewer than 10
employees (8%), it is the other way round for sectors M, N and O: 14% for companies with more than 10 em-
ployees, compared with 20% for those with fewer than 10 employees.
However, when companies with fewer than 10 employees are included in the calculation for the pay gap in
sectors C to K, this provides a slight and somewhat contradictory rise for the period 2002-2005, but also a
small fall for 2006 and 2007. This is called a ‘composition effect’: the number of women in the overall volume
of labour – i.e. in the total number of hours worked – is higher in small companies, at 35.8% versus 29.3%
elsewhere. The gross hourly wage is also appreciably lower in those companies, both for men (14.0 EUR

- 18 -
versus 17.3 EUR) and women (12.9 EUR versus 14.8 EUR). Including this lower pay segment weighs down
more on the average hourly wages of women than men, which in turn widens the pay gap slightly. For 2006
and 2007, the reduction in the pay gap created by including small companies can probably be attributed to the
fact that the reduction in the pay gap in companies with fewer than 10 employees was greater than in those
with 10 employees or more. For sectors M, N and O, the addition of companies with fewer than 10 employees
only results in a very minor increase in the pay gap, although this is clearly higher in companies with at least
10 employees.
Table 8 : Average gross hourly wages for full-time and part-time employees (in EUR) and the pay gap in companies with at least 10 employees and companies with fewer than 10 employees (NACE sectors C-K and M, N & O) (2002-2007)
Sectors C-K
2002 2003 2004 2005 2006 2007
Men
Companies with 10 employees or more 14,83 15,48 16,07 16,52 16,80 17,27
Companies with fewer than 10 employees 11,86 12,26 12,93 13,25 13,47 13,95
Total 14,40 15,00 15,61 16,02 16,30 16,77
Women
Companies with 10 employees or more 12,43 12,78 13,44 13,74 14,37 14,78
Companies with fewer than 10 employees 10,58 10,81 11,42 11,68 12,28 12,87
Total 12,07 12,39 13,04 13,32 13,95 14,41
Pay gap
Companies with 10 employees or more 16% 17% 16% 17% 14% 14%
Companies with fewer than 10 employees 11% 12% 12% 12% 9% 8%
Total 16% 17% 16% 17% 14% 14%
Sectors M, N & O
2002 2003 2004 2005 2006 2007
Men
Companies with 10 employees or more 17,44 18,03 18,53 19,14 19,22 19,75
Companies with fewer than 10 employees 12,42 12,77 13,38 13,83 14,04 14,54
Total 17,05 17,64 18,11 18,73 18,80 19,32
Women
Companies with 10 employees or more 14,48 14,77 15,49 15,93 16,46 16,96
Companies with fewer than 10 employees 9,71 10,04 10,73 10,93 11,29 11,70
Total 14,11 14,41 15,11 15,56 16,06 16,55
Pay gap
Companies with 10 employees or more 17% 18% 16% 17% 14% 14%
Companies with fewer than 10 employees 22% 21% 20% 21% 20% 20%
Total 17% 18% 17% 17% 15% 14%
Sources : Federal Planning Bureau and DGSEI, Structure of Earnings Survey

- 19 -
Un second complément aux données de l’Enquête sur la structure et la répartition des salaires permet de
couvrir les secteurs A à O.
Table 9 : Average gross hourly wages for full-time and part-time employees in NACE sectors C-K, C-K, M, N & O and A-O (in EUR) and the pay gap (2002-2007)
2002 2003 2004 2005 2006 2007
Men
Sectors C à K 14,40 15,00 15,61 16,02 16,30 16,77
Sectors C-K,M,N&O 14,69 15,29 15,88 16,33 16,58 17,06
Sectors A à O 14,38 14,99 15,55 16,02 16,28 16,74
Women
Sectors C à K 12,07 12,39 13,04 13,32 13,95 14,41
Sectors C-K,M,N&O 12,89 13,22 13,90 14,25 14,83 15,29
Sectors A à O 12,58 12,92 13,59 13,97 14,53 14,96
Pay gap
Sectors C à K 16% 17% 16% 17% 14% 14%
Sectors C-K,M,N&O 12% 14% 13% 13% 11% 10%
Sectors A à O 12% 14% 13% 13% 11% 11%
Sources : Federal Planning Bureau and DGSEI, Structure of Earnings Survey
The pay gap does not change much when agriculture (A), fi sheries (B) and public administration (L) are added
to sectors C-K, M, N and O. The average gross hourly wage remains virtually identical for men whether they
work in sectors C to K or elsewhere (except for sectors A, B and L, where the average gross hourly wage is
14.7 EUR), while the average gross hourly wage for women is lower when they work in sectors C-K, at 14.4
EUR compared with 15.3 EUR for sectors C-K, M, N and O in 2007; this can be attributed to the higher hourly
wages in education. In sectors A, B and L the average gross hourly wage for women is 13.0 EUR.

- 20 -
1.4 The pay gap by status
Calculating the pay gap for the public and private sector together does not refl ect the actual situation clearly.
That’s because the result is somewhere between the two, very divergent values. There are two main reasons
why the pay gap differs so much between the public and private sectors. First, pay is not established in the
same way: in the public sector, in principle, there is no individual pay component over and above the remu-
neration levels set by the pay scales. Second, the composition of the labour force is fairly balanced, although
there is a ‘glass ceiling’ here too: women experience more diffi culty in rising to more senior positions.
The data of the Federal Planning Bureau distinguishes between the Social Security Service [NSSO(PLA)]
status of the employee and the NSSO(PLA) sector of the company. This enables the pay gap to be calculated
separately for civil servants, blue-collar workers, and white-collar workers. Because there is gender inequa-
lity in the public sector in terms of permanent appointments – two-thirds of male civil servants are appointed,
whereas barely half of women are – a distinction is made between these two statuses within government in
the table below.7
Table 10 : Average gross hourly wages (in EUR) for full-time and part-time employees and the pay gap, by status (2007)8-9
Private sector Public sector Total
Blue-collar
workers
White-collar
employees
Contract civil
servants
Permanent civil
servants
Women 10,7 16,0 13,8 17,4 15,0
Men 13,0 21,7 14,6 17,3 16,7
Pay gap 18% 26% 6% -1% 11%
Sources : Bureau fédéral du Plan, DGSIE, Enquête sur la structure et la répartition des salaires
The pay gap based on hourly wages is 26% for white-collar employees and 18% for blue-collar workers. The
pay gap is practically non-existent for permanent civil servants, but is 6% for contract civil servants. This
means that the overall pay gap fi gure conceals some major status-based differences. When we look at the
data for the period 2002-2007 (table 12), we can see that although the pay gap for blue-collar workers remai-
ned stable, the pay gap for white-collar employees and contract civil servants became smaller between 2002
and 2007 – minus 3 percentage points for white-collar employees and minus 4 for contract civil servants.
Consequently, the estimated pay gap of 11% for sectors A to O in fact conceals a much wider pay gap in the
private sector.
7 The term ‘civil servant’ is used here in the broad sense of an employee working in the public sector.8 A «contract civil servant» is an employee in the public sector who is not appointed on a permanent basis and hence
works on an employment contract. In principle, a distinction can be made for this category between blue-collar workers
and white-collar employees. That distinction is not made here.9 The fi gures relate to the economy as a whole, with the exception of the small sectors P and Q, domestic staff and
extra-territorial organisations.

- 21 -
Graph 2 : Pay gap based on the average gross hourly wages for full-time and part-time employees, by status (2007)
Sources : Federal Planning Bureau and DGSEI, Structure of Earnings Survey
The effect of part-time work is removed to a large extent in the pay gap based on gross hourly wages. Only the fact
that part-time workers receive lower hourly wages is still a factor in the indicator. But the effect of part-time work
does play a role in the pay gap based on annual earnings. At the end of the survey year in the private sector, both
female blue-collar workers and female white-collar employees earned 37% less than their male counterparts. The
fi gure for contract civil servants was 18%, while for permanent staff working in public administration, it was 11%.
Over the period 2002-2007, the pay gap for blue-collar workers and permanent civil servants remained steady,
while the gap for white-collar employees and contract civil servants narrowed by 2 percentage points for white col-
lar employees and 4 percentage points for contract civil servants. Taking all statuses together, the pay gap based
on gross annual earnings was 24%.
Table 11 : Average gross annual wages for full-time and part-time employees and the pay gap, by status (2007)
Private sector Public sector Total
Blue-collar
workers
White-collar
employees
Contract civil
servants
Permanent civil
servants
Women 15.014 26.877 20.895 31.058 24.068
Men 23.654 42.669 25.559 34.829 31.585
Pay gap 37% 37% 18% 11% 24%
Sources : Federal Planning Bureau and DGSEI, Structure of Earnings Survey
-5% 0% 5% 10% 15% 20% 25% 30%
Blue-collar workers
White-collar employees
Contract civil servants
Permanent civil servants
Total

- 22 -
Graph 3 : Pay gap based on the gross annual wages for full-time and part-time employees, by status (2007)
Sources : Federal Planning Bureau and DGSEI, Structure of Earnings Survey
Table 12 : Changes to the pay gap for full-time and part-time employees, by status (2002-2007)10
2002 2003 2004 2005 2006 2007
Gross hourly wages
Blue-collar workers 17% 19% 18% 18% 17% 18%
White-collar employees 29% 30% 29% 29% 27% 26%
Contract civil servants 10% 14% 7% 8% 6% 6%
Permanent civil servants -2% 0% 0% 0% -1% -1%
Total 12% 14% 13% 13% 11% 11%
2002 2003 2004 2005 2006 2007
Gross annual wages
Blue-collar workers 38% 38% 37% 37% 36% 37%
White-collar employees 39% 39% 38% 38% 37% 37%
Contract civil servants 22% 24% 20% 19% 19% 18%
Permanent civil servants 11% 11% 11% 10% 11% 11%
Total 26% 25% 25% 24% 24% 24%
Sources : Federal Planning Bureau and DGSEI, Structure of Earnings Survey
10 From 2005 onwards, the estimates for the public sector are less reliable on account of problems with NSSOPLA data.
0% 5% 10% 15% 20% 25% 30% 35% 40%
Blue-collar workers
White-collar employees
Contract civil servants
Permanent civilservants
Total

- 23 -
1.5 Trends in the pay gap
As part of analysing the pay gap, it is of interest to examine trends in the long term. To do that, we have to
restrict ourselves to the fi gures for full-time and part-time employees in industry. Hence this is no longer
about NACE sectors C to K, but only sectors C and D.
Graph 4 : Average gross monthly wages (in EUR) for full-time and part-time employees in industry (1972-2007)
Sources : DGSEI, Structure of Earnings Survey (from 1999) and the Half-Yearly Survey of Salaries and Wages (processed by FPS ELSD)
Graph 4 shows the average gross monthly wages of men and women working full-time or part-time in indus-
try for the period from 1972 to 2007.11 The graph shows that wages for both men and women rose over the
course of time, but those for women rose more quickly than those for men. In fact, between 1972 and 2007,
women’s wages rose by a factor of 6.3, while for men it was a factor of 4.8. This explains the declining trend
for the pay gap in the graph below. Whereas the pay gap in 1972 was still 43%, by 2007 it was 28%. This can
be explained by the fact that women now have a more constant presence on the labour market in general,
including in positions that were previously more easy for men to access. Also, women today are coming on
to the labour market with an equally high and even higher level of qualifi cations than young men. Finally, the
latest generations of women are also achieving longer years of service.
11 The series of data was interrupted in 1998 and 1999, which has caused a slight discrepancy in graphs 4 and 5.
0
2
4
6
8
10
12
14
16
19
60
19
62
19
64
19
66
19
68
19
70
19
72
19
74
19
76
19
78
19
80
19
82
19
84
19
86
19
88
19
90
19
92
19
94
19
96
19
98
20
00
20
02
20
04
20
06
WomenMen

- 24 -
Graph 5 : Pay gap based on the gross monthly wages of full-time and part-time employees in industry (1972-2007)
Sources : DGSEI, Structure of Earnings Survey (from 1999) and the Half-Yearly Survey of Salaries and Wages (processed by FPS ELSD)
For gross hourly wages we can go back to the 1960s if we restrict ourselves to full-time and part-time
employees in industry.12
Graph 6 : Average gross hourly wages for full-time and part-time employees in industry (in EUR) (1960-2007)
Sources : DGSEI, Structure of Earnings Survey (from 1999) and the Half-Yearly Survey of Salaries and Wages (processed by FPS ELSD)
12 As for gross monthly wages, there is a break in the data series here in 1998 and 1999.
0%
5%
10%
15%
20%
25%
30%
35%
40%
45%
19
72
19
74
19
76
19
78
19
80
19
82
19
84
19
86
19
88
19
90
19
92
19
94
19
96
19
98
20
00
20
02
20
04
20
06
0
500
1000
1500
2000
2500
3000
3500
4000
19
72
19
74
19
76
19
78
19
80
19
82
19
84
19
86
19
88
19
90
19
92
19
94
19
96
19
98
20
00
20
02
20
04
20
06
WomenMen

- 25 -
Graph 7 : Pay gap based on the gross hourly wages of full-time and part-time employees in industry (1960-2006)
Sources : DGSEI, Structure of Earnings Survey (from 1999) and the Half-Yearly Survey of Salaries and Wages (processed by FPS ELSD)
The graphs above show similar trends as with the monthly wages of white-collar employees. The pay gap is
smaller than the gap for monthly wages as the result of the disappearance of the effect of part-time working.
In 1960, the pay gap based on gross hourly wages was 41%, compared with 18% in 2007.
0%
5%
10%
15%
20%
25%
30%
35%
40%
45%
19
60
19
62
19
64
19
66
19
68
19
70
19
72
19
74
19
76
19
78
19
80
19
82
19
84
19
86
19
88
19
90
19
92
19
94
19
96
19
98
20
00
20
02
20
04
20
06

- 26 -
Women 41,25%
Men 58,75%
INDICAT0R 2 : share in the total sum of wages
In what follows, we will calculate a totally different pay gap indicator based on the whole of the wages paid
to men and women and their participation in the labour market, fi rst as employees and then in paid working
days.
According to the National Social Security Offi ce (NSSO), 95,974,263,404 EUR was paid in gross wages in Bel-
gium in 2007. 36.011 billion EUR was paid to women, which corresponds to 37.52% of total wages, compared
with 37.06% in 2006.
Graph 8 : Share of women and men in the total sum of wages (2007)
Source : NSSO
In graph 9 we can see the ratio of the number of paid working days between women and men.13 Compared
with 2006, when women worked 40.53% of the paid working days, this percentage rose slightly to 41.25% in
2007.
Graph 9 : Share of women and men in the total number of paid working days (2007)
Source : NSSO
13 The paid working days of part-time employees have been converted into working paid at the rate of 7 hours and 36
minuted per working day (i.e. 7.6 hours).
Women 37,52%
Men 62,48%
- 27 -
Men 54,08%
Women 45,92%
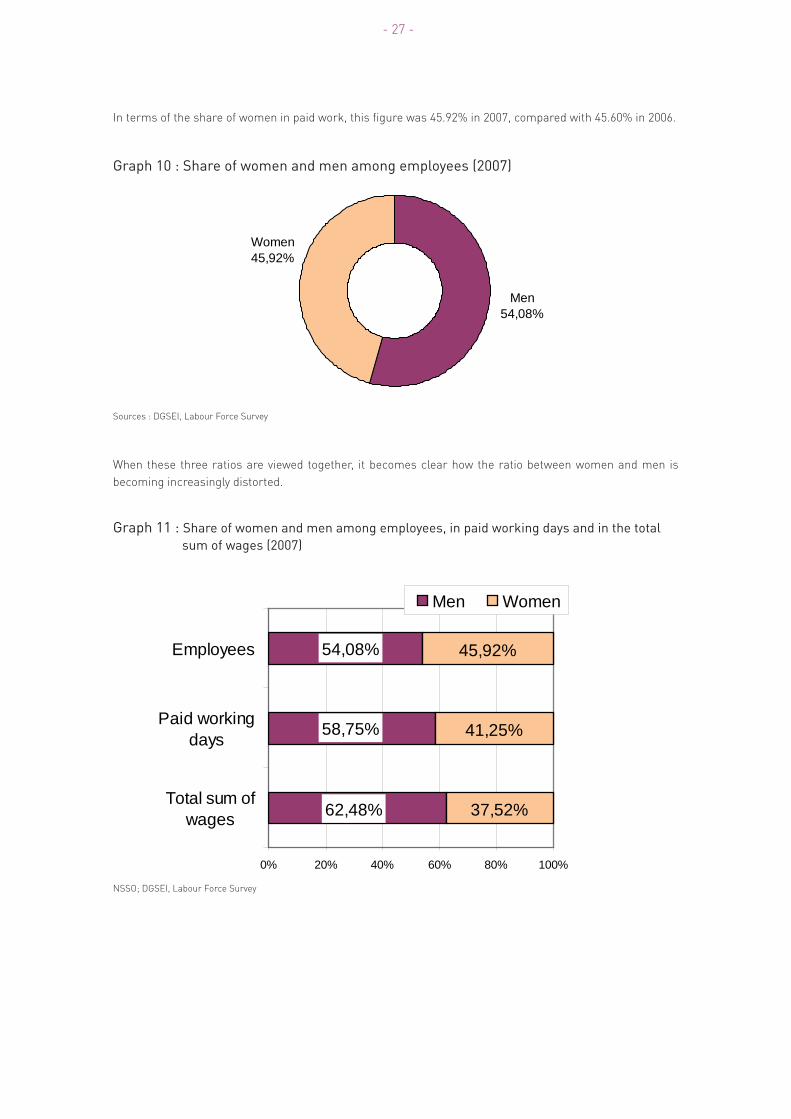
In terms of the share of women in paid work, this fi gure was 45.92% in 2007, compared with 45.60% in 2006.
Graph 10 : Share of women and men among employees (2007)
Sources : DGSEI, Labour Force Survey
When these three ratios are viewed together, it becomes clear how the ratio between women and men is
becoming increasingly distorted.
Graph 11 : Share of women and men among employees, in paid working days and in the total sum of wages (2007)
NSSO; DGSEI, Labour Force Survey
37,52%
41,25%
45,92%
62,48%
58,75%
54,08%
0% 20% 40% 60% 80% 100%
Total sum ofwages
Paid workingdays
Employees
Men Women
- 28 -
We now have all the elements we need to calculate the total pay gap, which is defi ned as the difference
between the share of women in the total sum of wages and their share in paid employment. In 2007, 45.92%
of employees were women and 95,974,263,404 EUR was paid out in wages. Hence taken together, female
workers should have received 44.067 billion EUR, or 8.056 billion EUR more than they actually earned (36.011
billion EUR). However, given that women work part-time more often than men, we will adjust this difference in
the total volume of work by using the share of women in the total number of paid working days, instead of the
number of women among employees. 41.25% of paid working days were worked by women. Taking working
hours into account, they therefore should have earned 39.587 billion EUR, which is 3.576 billion EUR more
than they actually earned. If we take account of the fact that women work part-time more often than men, the
total pay gap narrows signifi cantly, but an important part of the pay gap is not the result of this difference in
the average number of working hours.
We also note that the percentages attributed to women in 2007 are slightly higher than they were in 2006,
while the overall pay gap calculated on these percentages actually widened. This can be attributed to the fact
that the overall total wage bill also rose and was 5.706 billion EUR more than in 2006. This means that the
share of wages not going to women was also greater.
To be as correct as possible in our comparison, we also need to take account of infl ation. Based on the na-
tional index of consumer prices, we can recalculate the total wage bill to 2006 prices and hence deduce that
in 2007 (adjusted) 94,262,528,677 EUR was paid in gross wages. Hence the wages shortfall in relation to the
number of female employees and the number of paid working days worked by women continue to increase
and are now 7.912 billion EUR and 3.512 billion EUR respectively.
In what follows, we show the detailed breakdown of full-time employees, female and male, across the various
categories of gross monthly wages. What stands out immediately is that women are over-represented in
those categories under 2500 EUR.

- 29 -
Graph 12 : The breakdown of women and men across the categories of gross monthly wages for full-time employees in NACE sectors C-K and in companies with at least 10 employees (2007)
Source : DGSEI, Structure of Earnings Survey
0%
2%
4%
6%
8%
10%
12%
14%
16%
18%
20%-1
249
1250
-149
915
00-1
749
1750
-199
920
00-2
249
2250
-249
925
00-2
749
2750
-299
930
00-3
249
3250
-349
935
00-3
749
3750
-399
940
00-4
249
4250
-449
945
00-4
749
4750
-499
950
00-5
249
5250
-549
955
00-5
749
5750
-599
960
00-6
249
6250
-649
965
00-6
749
6750
-699
970
00 +
WomenMen

- 30 -
Table 13 : The breakdown of women and men across the categories of gross monthly wages for full-time employees in NACE sectors C-K and in companies with at least 10 employees (2006 and 2007)
2007 2006
Women Men Women Men
- 1.249,99 0,3% 0,1% 0,4% 0,2%
1.250-1.499,99 3,6% 1,2% 5,3% 1,7%
1.500-1.749,99 11,2% 4,3% 15,0% 6,3%
1.750-1.999,99 16,5% 10,1% 17,7% 12,4%
2.000-2.249,99 16,6% 15,1% 14,3% 16,7%
2.250-2.499,99 12,3% 17,2% 10,6% 15,4%
2.500-2.749,99 9,2% 13,0% 9,0% 10,3%
2.750-2.999,99 7,3% 8,6% 6,8% 7,1%
3.000-3.249,99 5,6% 6,2% 5,1% 6,0%
3.250-3.499,99 4,1% 4,8% 3,4% 4,4%
3.500-3.749,99 2,9% 3,7% 2,9% 3,8%
3.750-3.999,99 2,2% 2,8% 2,0% 2,7%
4.000-4.249,99 1,7% 2,3% 1,8% 2,3%
4.250-4.499,99 1,5% 1,8% 1,3% 1,8%
4.500-4.749,99 0,9% 1,5% 0,9% 1,6%
4.750-4.999,99 0,7% 1,2% 0,7% 1,2%
5.000-5.249,99 0,6% 1,0% 0,6% 0,9%
5.250-5.499,99 0,5% 0,8% 0,5% 0,8%
5.500-5.749,99 0,3% 0,7% 0,3% 0,7%
5.750-5.999,99 0,5% 0,5% 0,3% 0,6%
6.000-6.249,99 0,2% 0,4% 0,2% 0,4%
6.250-6.499,99 0,2% 0,4% 0,2% 0,4%
6.500-6.749,99 0,2% 0,3% 0,2% 0,3%
6.750-6.999,99 0,2% 0,3% 0,1% 0,3%
7.000 et + 0,8% 1,7% 0,8% 1,8%
Source : DGSEI, Structure of Earnings Survey

- 31 -
The data relating to 2007 includes companies with at least 10 employees in NACE sectors C to K, i.e. industry
and commerce. To make comparisons with 2006 possible, when the sectors were expanded to education,
healthcare and the socio-cultural sector, we have limited the data for 2006 to sectors C to K in the tables
above.
In 2007, in comparison with 2006, we can see a reduction in the percentage of women with gross monthly
wages of less than 2,000 EUR. In 2006, this was the case for 4 women out of 10, whereas in 2007 only 3 out of
10 earned a maximum of 2,000 EUR per month. As in 2006, 1 in 2 women in 2007 earned less than 2,250 EUR
gross per month. Whereas in 2006 4 out of 10 men earned this same amount, it was only 3 men out of 10 in
2007. For wages of 2,250 EUR gross per month and upwards, in 2007 the percentages of women per category
were smaller than for men, whereas this inversion in the proportions was already visible in 2006 from gross
monthly wages of 2,000 EUR upwards. In the higher pay scales, the difference was bigger in 2007, as was the
case in 2006. Only 3% of women earned more than 5,000 EUR gross per month, compared with 6% of men.
Hence the situation of women in the higher pay scales does not improve.

- 32 -
- 33 -
II. Inequality factors
Pay differences are highly conditioned by the position of men and women on the labour market. The EU
indicator set scrutinises the effect of part-time work, age and education differences, and the horizontal se-
gregation on the labour market. To these, we have also added vertical segregation, marital status, household
composition and nationality/origin. We also relate the pay gap between women and men with the overall
differences between high and low wages within sectors.
INDICATOR 3 : ratio for part-time work
Part-time working has increased considerably for both women and men over past decades. But that does
not take away the fact that there continues to be a major difference; in 2007, 42.6% of female wage earners
worked part-time, compared with only 7.8% for males. This means that when we talk about part-time work, it
is mainly women who are involved. More than four-fi fths of part-time workers are women.
In addition to a difference in numbers, there is also a major difference in the reasons why people work part-
time. The Labour Force Survey conducted by the Directorate-General Statistics and Economic Information
specifi cally enquired about these reasons. 13.3% of women working part-time and 19.7% of men working
part-time stated they were unable to fi nd a full-time job. For almost 60% of women working part-time, stri-
king the right balanced between work and home life is the main reason for working part-time. The fi gure for
men is one-third. Caring for children or other dependants was mentioned far more often by women than by
men. Combining another job, studies or (early) retirement were the main reasons mentioned by almost one in
fi ve male part-time workers. For women, this was only one in twenty. Only 10.5% of female and 8.8% of male
part-time workers did not want to have a full-time job.

- 34 -
Tabl
e 14
: B
reak
dow
n of
fem
ale
and
mal
e pa
rt-t
ime
wag
e ea
rner
s, b
y re
ason
for
wor
king
par
t-tim
e (2
007)
W
omen
Men
Car
ing
for
child
ren
or d
epen
dant
s
23,9
%6,
7%
-
lack
of
or
ina
bil
ity
to u
se
su
ita
ble
ch
ild
ca
re 1
0,3
% 1
,7%
-
lack
of
or
ina
bil
ity
to u
se
su
ita
ble
da
yca
re f
or
oth
er
de
pe
nd
an
ts 0
,8%
0
,4%
-
lack
of
or
ina
bil
ity
to u
se
su
ita
ble
ch
ild
ca
re A
ND
da
yca
re f
or
oth
er
de
pe
nd
an
ts 0
,6%
0
,3%
-
oth
er
rea
so
ns
1
2,2
% 4
,4%
Oth
er p
erso
nal o
r fa
mily
rea
sons
35,8
%25
,5%
Can
not fi
nd
full
-tim
e w
ork
13,3
%19
,7%
Doe
s no
t wan
t ful
l-tim
e w
ork
10,5
%8,
8%
Com
bina
tion
with
oth
er jo
b, s
tudi
es o
r (e
arly
) ret
irem
ent
5,8%
19,6
%
-
Oth
er
(pa
rt-t
ime
) jo
b s
up
ple
me
nts
th
e m
ain
acti
vity
2
,4%
6
,8%
-
Co
mb
ina
tio
n w
ith
stu
die
s 1
,9%
7
,1%
-
(Ea
rly)
re
tire
me
nt
an
d s
o m
ay
on
ly w
ork
pa
rt-t
ime
1
,5%
5
,6%
Sw
itch
from
full
-tim
e to
par
t-tim
e fo
r bu
sine
ss/e
cono
mic
rea
sons
0,9%
2,1%
Hea
lth
reas
ons
(dis
abili
ty/i
nabi
lity
to w
ork)
2,7%
6,7%
Pro
fess
iona
l rea
sons
(wor
king
atm
osph
ere
or c
ondi
tions
, str
ess,
har
assm
ent,
etc.
)0,
9%2,
1%
Oth
er r
easo
ns6,
2%8,
9%
Tota
l10
0,0%
100,
0%
So
urc
e :
FP
S E
con
om
y, D
ire
cto
rate
-Ge
ne
ral
Sta
tisti
cs a
nd
Eco
no
mic
In
form
ati
on
, L
ab
ou
r F
orc
e S
urv
ey

- 35 -
Graph 13 : Breakdown of female and male part-time wage earners, by reason for working part-time (2007)
Source : DGSEI, Labour Force Survey
In indicator 1 we have already discussed the size of the impact that working part-time has on the monthly
and annual wages of women and men. The offi cial indicator for part-time work is the pay gap in hourly wa-
ges between women and men working part-time. Because men working part-time also have to deal with an
appreciable difference in wages, we have expanded the comparison here to the hourly wages of women and
men working full-time.
Graph 14 : Pay gap based on gross hourly wages for full-time and part-time wage
earners (2007)
Source : DGSEI, Structure of Earnings Survey
A woman working part-time earns 3.62 EUR less per hour on average than a full-time working man. That
represents a pay gap of 21%. This wide gap can be broken down further in two ways: one, by using part-time
working men as the comparison point and, two, by using full-time working women. In relation to part-time
working men, the difference in wages is still 1.15 EUR, or a gap of 8%. The pay gap between part-time and
full-time working men is 14%. Full-time working women earn 1.74 EUR per hour more on average than part-
time working women, but 1.88 EUR less than a full-time working man.
0,0%
5,0%
10,0%
15,0%
20,0%
25,0%
30,0%
35,0%
40,0%
Car
ing
for c
hild
ren
or d
epen
dant
s
Oth
er p
erso
nal o
rfa
mily
reas
ons
Can
not f
ind
full-
time
wor
k
Doe
s no
t wan
t ful
l-tim
e w
ork
Com
bina
tion
with
othe
r job
, stu
dies
or
(ear
ly) r
etire
men
t
Sw
itch
from
full-
time
to p
art-t
ime
for
busi
ness
/eco
nom
icre
ason
s
Hea
lth re
ason
s(d
isab
ility
/inab
ility
to w
ork)
Pro
fess
iona
lre
ason
s (w
orki
ngat
mos
pher
e or
cond
ition
s, s
tress
,ha
rass
men
t, et
c.)
Oth
er re
ason
s
Women part-time
Women part-time
Women part-time
Men full-time
Men full-time
Men part-time
Men full-time
Women full-time
21%%
8% 14%
11% 11%
3.62 EUR
1.15 EUR 2.47 EUR
1.74 EUR 1.88 EUR

- 36 -
Table 15 : Average gross monthly wages of part-time and full-time employees (in EUR) and the pay gap (2007)
Part-time employees Full-time employees
Women 1.441 2.577
Men 1.749 2.918
Pay gap 18% 12%
Source : DGSEI, Structure of Earnings Survey
Men working part-time on average work more hours than women working part-time. In this way, the pay
gap calculated based on monthly wages is a good deal greater than the pay gap based on hourly wages. For
industry and market services, there is a pay gap of 18% in monthly wages for part-time workers.
The degree of part-time working differs sharply according to the sector of employment. These fi gures are
shown in table 16 in Indicator 5.
INDICATOR 4 : ratio by age and level of education
Two factors that have a major infl uence on pay – and hence also the pay gap – are age and level of
education.
4.1. The pay gap by age
To be able to analyse the pay gap by age category, we will fi rst look at how the employment rate by age chan-
ged in 2007.
Graph 15 : Employment rate by age category (2007)
Source : DGSEI, Labour Force Survey
0%10%20%30%40%50%60%70%80%90%
100%
-25years
25-29years
30-44years
45-54years
55-64years
Total
WomenMen

- 37 -
A fi rst observation is that the employment rate rose in 2007 compared with 2006, except for men in the youn-
gest age category. Of course account has to be taken of the fact that young people under the age of 25 are
often still studying. We also note that the employment rate for men and women changes in a reasonably even
manner with age, although the employment rate for women is still lower than for men. Employment levels
rise until the age of 45 and then begin to fall, a fact that is visibly faster among women than with men. For the
age categories 45-54 and 55-64, the employment rate compared with the previous year rose faster for women
than for men. Nevertheless, only 26% of women aged 55 to 64 are still active on the labour market, compared
with 43% of men of the same age.
In what follows, we will look at the average gross hourly wages of full-time working men and women of the
same age category in industry and commerce.
Graph 16 : Average gross hourly wages (in EUR), by age category of full-time working men and women in NACE sectors C-K (2007)
Source : DGSEI, Structure of Earnings Survey
As we might have expected, wages rise with age for both women and men. The pay gap for young people un-
der 25 is relatively high at 11%. After 25, wages rise faster for men than for women and the pay gap rises from
5% for 25 to 29-year-olds to 8% for 30 to 44-year-olds and 11% for 45 to 54-year-olds, culminating at 19% for
the category of 55 to 64-year-olds. This rise in the pay gap can be explained by the differing career structures
of men and women. Women interrupt their career more frequently and fi nd it less easy to be considered for
promotion. In general, they also often receive fewer opportunities to go on training courses than men.
0,00
5,00
10,00
15,00
20,00
25,00
-25years
25-29years
30-44years
45-54years
55-64years
Total
WomenMen

- 38 -
Things develop differently for part-time workers.
Graph 17 : Average gross hourly wages (in EUR), by age category for part-time working men and women in NACE sectors C-K (2007)
Source : DGSEI, Structure of Earnings Survey
Although the wages of part-time working men also continue to rise with age, those of part-time working wo-
men tend to stabilise after the age of 30. The pay gap also stays steady at 7% for all age categories under 45.
For 45 to 54-year-olds (14%) it doubles, rising even further to 20% for 55 to 64-year-olds.
0,00
5,00
10,00
15,00
20,00
-25years
25-29years
30-44years
45-54years
55-64years
Total
WomenMen
- 39 -
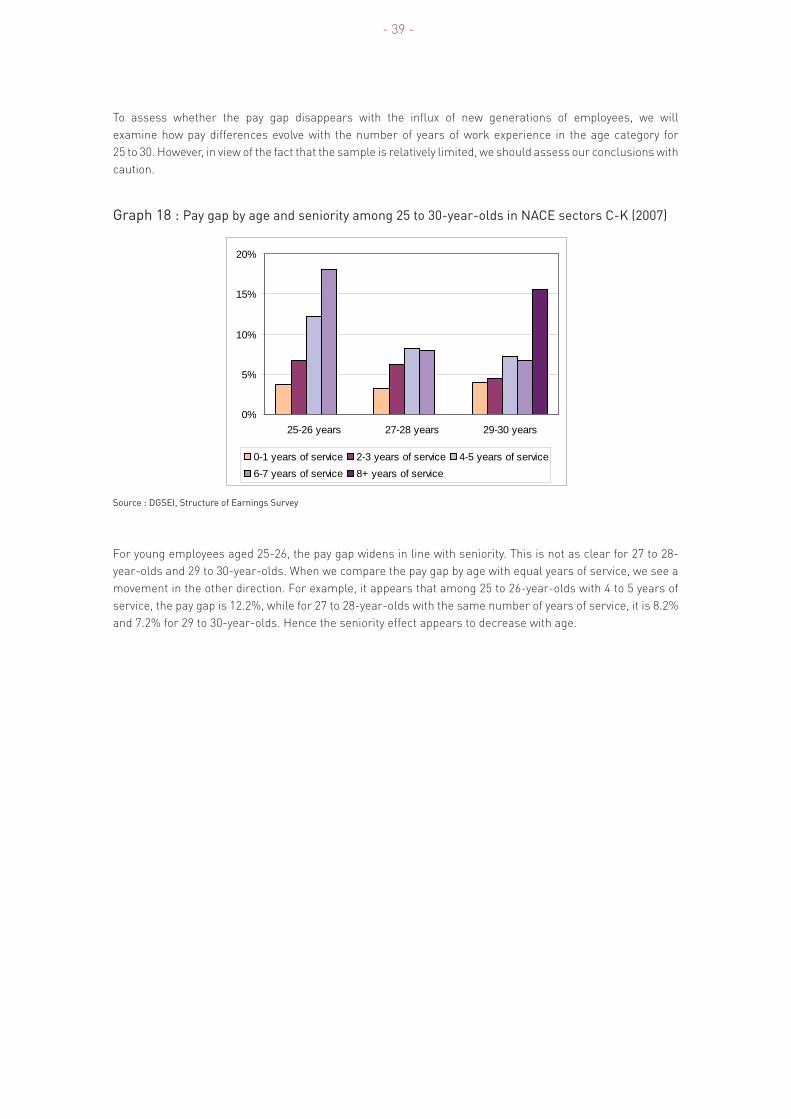
To assess whether the pay gap disappears with the infl ux of new generations of employees, we will
examine how pay differences evolve with the number of years of work experience in the age category for
25 to 30. However, in view of the fact that the sample is relatively limited, we should assess our conclusions with
caution.
Graph 18 : Pay gap by age and seniority among 25 to 30-year-olds in NACE sectors C-K (2007)
Source : DGSEI, Structure of Earnings Survey
For young employees aged 25-26, the pay gap widens in line with seniority. This is not as clear for 27 to 28-
year-olds and 29 to 30-year-olds. When we compare the pay gap by age with equal years of service, we see a
movement in the other direction. For example, it appears that among 25 to 26-year-olds with 4 to 5 years of
service, the pay gap is 12.2%, while for 27 to 28-year-olds with the same number of years of service, it is 8.2%
and 7.2% for 29 to 30-year-olds. Hence the seniority effect appears to decrease with age.
0%
5%
10%
15%
20%
25-26 years 27-28 years 29-30 years
0-1 years of service 2-3 years of service 4-5 years of service6-7 years of service 8+ years of service

- 40 -
4.2 The pay gap by level of education
The higher the qualifi cations, the higher the pay. Although this does not apply to each individual employee in
every situation, it is a pattern that comes strongly to the fore when we examine average fi gures across the
economy as a whole. There are also signifi cant differences in labour market participation that need to be
taken into account. As the level of education rises, so does the employment rate. However, this rise is more
accentuated among women. There is an employment level of 31.1% among women with a low level of educa-
tion, while the fi gure is 80.9% among women educated to a high level. That is a difference of 49.8 percentage
points. With men, the difference is only 37.2 percentage points, ranging from 49.6% to 86.8%. The difference
in the employment rate between men and women therefore reduces as they become more highly educated.
Graph 19 : Employment rate by level of education (2007)
Source : DGSEI, Labour Force Survey
The pay gap also differs depending on whether we are at a different level of education. For full-time em-
ployees, the pay gap is at its widest among higher educated individuals. The difference is much smaller in the
middle group.
0%
20%
40%
60%
80%
100%
Low Moderate High Total
Women Men

- 41 -
Graph 20 : Average gross hourly wages (in EUR) for full-time working men and women, by level of education (2007)
Source : DGSEI, Structure of Earnings Survey
The lower pay gap among individuals with a low level of education and the middle group can be explained in
part by labour market participation. Graph 19 shows that women with a low level of education offer themsel-
ves far less on the labour market. This usually applies within this group to the least well educated women.
As a result, the average wages of women in this group is artifi cially increased. For women who only have the
prospect of earning a very low wage – whether in a part-time job with diffi cult hours, such as in the retail or
cleaning sector – working outside the house is often not an attractive option.
In the category of individuals who have completed long-course higher education, career structure plays a
greater role and individual pay negotiations will therefore also be more important for this group. In addition,
women are less likely to set a high salary as a priority and give more preference to fl exible working hours, for
example.
0,00
5,00
10,00
15,00
20,00
25,00
30,00
Maximumhigher
secondaryeducation
Higher short-course
education
Minimumlong-course
highereducation
Total
WomenMen

- 42 -
Yet we should also note that behind these rather broad categories of education levels, there are major diffe-
rences in the type of study courses completed. These different types of study are not always given the same
value. For example, a diploma in exact sciences is often given a higher value on the labour market than a
diploma in human sciences. So, if this latter type of course is selected more by women, it will have an effect
on the pay gap.
Graph 21 : Average gross hourly wages (in EUR) for part-time working men and women, by level of education (2007)
Source: DGSEI, Structure of Earnings Survey
Graph 21 shows a similar pattern for people who work part-time. For individuals with short-course and long-
course higher education, the pay gap among full-time and part-time employees is the same. For individuals
with a lower level of education, the pay gap among full-time employees is 16%, while it is only 10% for part-
time employees.
INDICATOR 5 : segregation on the labour market
A large part of the pay differences between women and men can be attributed to segregation on the labour
market. In other words, unequal pay is often a question of unequal work: in some sectors higher wages are
paid than in others, while some professions earn more, managers earn more than executive staff and in
general, pay is higher in larger companies. Women are often over-represented in jobs where the pickings
are not so good. This is by no means a coincidence and has grown to become that way historically. Women’s
work is stereotypically associated with ‘soft’ and economically less important work. In principle, there are two
possible ways of approaching this section of the pay gap: by breaking through segregation on the one hand,
and valuing – and hence paying – typical ‘female’ occupations better.
As in previous years, we have calculated the differences in pay by sector, by joint committee and by profession,
as well as using the gender ratios and part-time levels of employment in the sectors, the under-representa-
tion of women in managerial positions and the pay gap as a whole, defi ned as the difference between low and
high pay. Segregation on the labour market is also analysed by the size of companies.
Nous analyserons en outre la ségrégation sur le marché du travail sur base de la taille des entreprises.
A number of the sectors in which many women are employed, such as education, healthcare and the socio-
cultural sector, are only included in the Structure of Earnings Survey every four years. In our 2009 report, we
were able to present the data about these sectors. This will again be the case in the 2013 report. However, the
data from the Federal Planning Bureau does allow for a distinction to be made between the private sector and
government. This distinction has already been discussed in Indicator 1.
0,00
5,00
10,00
15,00
20,00
25,00
Maximumhigher
secondaryeducation
Higher short-course
education
Minimumlong-course
highereducation
Total
WomenMen

- 43 -
The large number of categories lend themselves less well for displaying the data in the form of a graph. Most
of the information is assembled in a large summary table. The list of terms used (nomenclature) is attached
in an annex.
5.1 Horizontal segregation: sectors
Differences between employment sectors play a major role in pay differences between women and men.
There are a number of important factors involved here. There are differences in the level of average wages
and the pay differences between women and men, as well as in the vertical segregation between the sectors.
In other words in the concentration of women in lower-paid jobs, in the extent to which women and men work
part-time and in the tension between high and low wages. When in a particular sector in general there is a
greater difference between high and low wages, the gender pay gap also often tends to be greater.
The table below shows the average gross hourly wages of full-time working men and women and the pay
gap in sectors C to K. In view of the fact that the number of employees is relatively low for some categories,
sharp fl uctuations have been observed over the years. Spikes can also be expected in those sectors where
employment has not been stable over the years. To accommodate these fl uctuations, we have included the
average pay differences for 2002 to 2007 in the table. We also indicate the number of full-time employees for
each sector, the percentage of women in all employees and in managerial positions, and the percentage of
female and male employees who work part-time in the sector. The overall pay gap is also shown, calculated
as the difference between the 5th and 85th pay percentile and the average of these pay differences from 2002
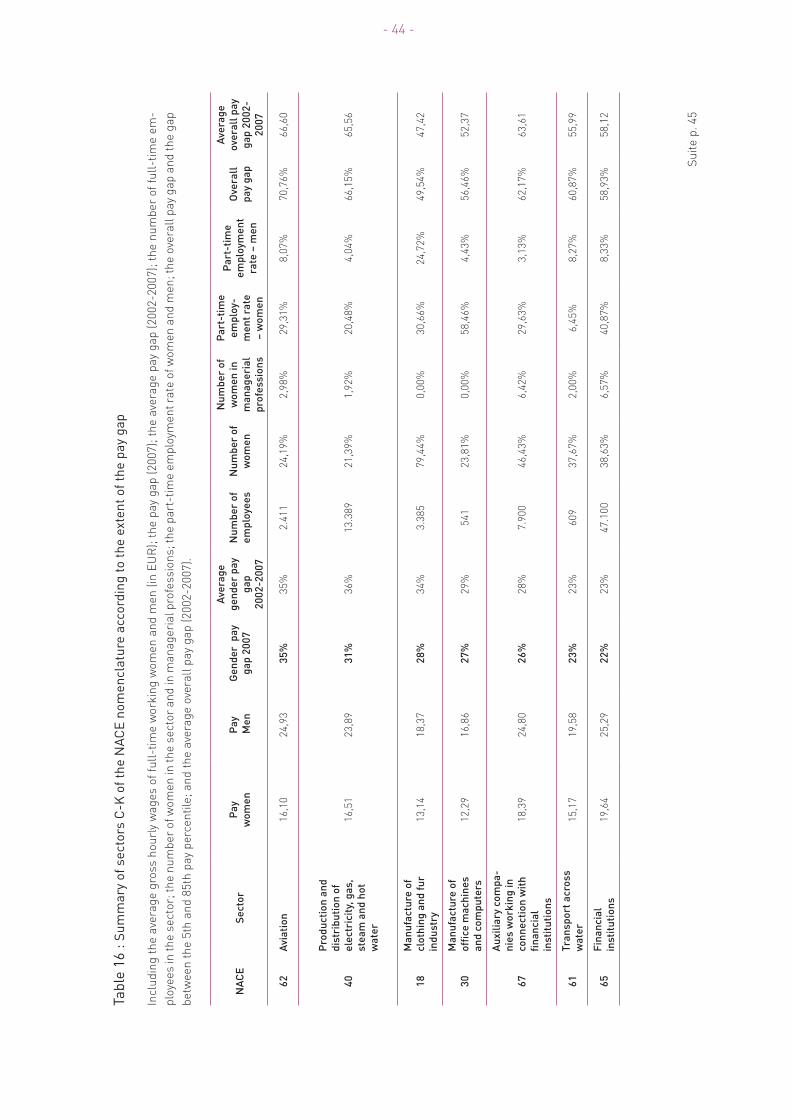
to 2007. The data shown in the table is ranked according to the size of the pay gap.
- 44 -
Tabl
e 16
: Su
mm
ary
of s
ecto
rs C
-K o
f the
NAC
E no
men
clat
ure
acco
rdin
g to
the
exte
nt o
f the
pay
gap
Inclu
din
g t
he
ave
rag
e g
ross h
ou
rly
wa
ge
s o
f fu
ll-t
ime
wo
rkin
g w
om
en
an
d m
en
(in
EU
R);
th
e p
ay
ga
p (
20
07
); t
he
ave
rag
e p
ay
ga
p (
20
02
-20
07
); t
he
nu
mb
er
of
full
-tim
e e
m-
plo
yee
s in
th
e s
ecto
r; t
he
nu
mb
er
of
wo
me
n in
th
e s
ecto
r a
nd
in m
an
ag
eri
al
pro
fessio
ns;
the
pa
rt-t
ime
em
plo
yme
nt
rate
of
wo
me
n a
nd
me
n;
the
ove
rall
pa
y g
ap
an
d t
he
ga
p
be
twe
en
th
e 5
th a
nd
85
th p
ay
pe
rce
nti
le;
an
d t
he
ave
rag
e o
vera
ll p
ay
ga
p (
20
02
-20
07
).
NA
CE
Se
cto
rP
ay
wo
me
n
Pa
y
Me
n
Ge
nd
er
pa
y
ga
p 2
00
7
Ave
rag
e
ge
nd
er
pa
y
ga
p
20
02
-20
07
Nu
mb
er
of
em
plo
ye
es
Nu
mb
er
of
wo
me
n
Nu
mb
er
of
wo
me
n i
n
ma
na
ge
ria
l
pro
fes
sio
ns
Pa
rt-t
ime
em
plo
y-
me
nt
rate
– w
om
en
Pa
rt-t
ime
em
plo
ym
en
t
rate
– m
en
Ove
rall
pa
y g
ap
Ave
rag
e
ove
rall
pa
y
ga
p 2
00
2-
20
07
62
Avia
tio
n1
6,1
02
4,9
33
5%
35
%2
.41
12
4,1
9%
2,9
8%
29
,31
%8
,07
%7
0,7
6%
66
,60
40
Pro
du
cti
on
an
d
dis
trib
uti
on
of
ele
ctr
icit
y, g
as
,
ste
am
an
d h
ot
wa
ter
16
,51
23
,89
31
%3
6%
13
.38
92
1,3
9%
1,9
2%
20
,48
%4
,04
%6
6,1
5%
65
,56
18
Ma
nu
fac
ture
of
clo
thin
g a
nd
fu
r
ind
us
try
13
,14
18
,37
28
%3
4%
3.3
85
79
,44
%0
,00
%3
0,6
6%
24
,72
%4
9,5
4%
47
,42
30
Ma
nu
fac
ture
of
offi
ce
ma
ch
ine
s
an
d c
om
pu
ters
12
,29
16
,86
27
%2
9%
54
12
3,8
1%
0,0
0%
58
,46
%4
,43
%5
6,4
6%
52
,37
67
Au
xil
iary
co
mp
a-
nie
s w
ork
ing
in
co
nn
ec
tio
n w
ith
fi n
an
cia
l
ins
titu
tio
ns
18
,39
24
,80
26
%2
8%
7.9
00
46
,43
%6
,42
%2
9,6
3%
3,1
3%
62
,17
%6
3,6
1
61
Tra
ns
po
rt a
cro
ss
wa
ter
15
,17
19
,58
23
%2
3%
60
93
7,6
7%
2,0
0%
6,4
5%
8,2
7%
60
,87
%5
5,9
9
65
Fin
an
cia
l
ins
titu
tio
ns
19
,64
25
,29
22
%2
3%
47
.10
03
8,6
3%
6,5
7%
40
,87
%8
,33
%5
8,9
3%
58
,12
Su
ite
p.
45

- 45 -
NA
CE
Se
cto
rP
ay
wo
me
n
Pa
y
Me
n
Ge
nd
er
pa
y
ga
p 2
00
7
Ave
rag
e
ge
nd
er
pa
y
ga
p
20
02
-20
07
Nu
mb
er
of
em
plo
ye
es
Nu
mb
er
of
wo
me
n
Nu
mb
er
of
wo
me
n i
n
ma
na
ge
ria
l
pro
fes
sio
ns
Pa
rt-t
ime
em
plo
y-
me
nt
rate
– w
om
en
Pa
rt-t
ime
em
plo
ym
en
t
rate
– m
en
Ove
rall
pa
y g
ap
Ave
rag
e
ove
rall
pa
y
ga
p 2
00
2-
20
07
32
Ma
nu
fac
ture
of
au
dio
, vid
eo
an
d
tele
co
mm
un
ica
-
tio
ns
eq
uip
me
nt
16
,67
21
,40
22
%2
6%
10
.10
32
1,8
6%
3,2
5%
29
,20
%6
,61
%5
7,4
7%
59
,91
16
Ma
nu
fac
ture
of
tob
acco
pro
du
cts
14
,75
18
,77
21
%2
3%
1.2
33
48
,36
%0
,00
%4
7,7
7%
14
,50
%4
9,9
8%
46
,85
33
Ma
nu
fac
ture
of
me
dic
al
eq
uip
-
me
nt
for
pre
cis
ion
an
d o
pti
ca
l
ins
tru
me
nts
an
d
wa
tch
es
/clo
ck
s
14
,14
17
,87
21
%2
2%
5.2
83
24
,25
%0
,57
%3
6,7
3%
6,6
5%
56
,74
%5
4,3
2
19
Le
ath
er
ind
us
try
an
d m
an
ufa
ctu
re
of
sh
oe
s
13
,13
16
,22
19
%2
0%
1.1
36
41
,14
%0
,23
%2
8,7
8%
4,0
5%
54
,83
%5
5,0
1
31
Ma
nu
fac
ture
of
ele
ctr
ica
l m
ac
hi-
ne
s a
nd
eq
uip
-
me
nt
14
,46
17
,72
18
%1
9%
15
.24
92
1,6
8%
1,0
2%
29
,25
%1
2,0
0%
49
,84
%5
0,3
7
23
Ma
nu
fac
ture
of
co
ke
s,
refi
ne
d
cru
de
oil
pro
du
cts
an
d n
uc
lea
r fu
els
21
,40
26
,20
18
%1
8%
4.3
93
17
,36
%4
,79
%2
0,7
5%
7,5
9%
60
,69
%5
9,1
4
74
Oth
er
bu
sin
es
s
se
rvic
es
15
,53
19
,01
18
%2
0%
14
1.6
92
38
,11
%2
,75
%4
7,6
0%
11
,82
%5
9,3
4%
59
,25
17
Ma
nu
fac
ture
of
tex
tile
s1
2,5
71
5,3
41
8%
20
%2
3.1
26
35
,77
%0
,17
%2
5,8
6%
12
,55
%4
3,4
3%
41
,44
66
Ins
ura
nce
19
,45
23
,62
18
%1
8%
18
.77
54
5,0
2%
7,4
9%
28
,45
%5
,99
%5
9,2
6%
56
,14
21
Pa
pe
r a
nd
ca
rd-
bo
ard
in
du
str
y
14
,50
17
,47
17
%1
8%
12
.00
71
7,0
1%
0,2
0%
21
,45
%8
,51
%4
8,5
6%
49
,11
73
Re
se
arc
h a
nd
de
ve
lop
me
nt
18
,10
21
,66
16
%1
8%
12
.00
04
1,7
7%
3,2
4%
18
,72
%4
,96
%6
3,5
9%
65
,40
63
Tra
ns
po
rt s
up
po
rt
bu
sin
es
se
s1
4,6
31
7,4
81
6%
17
%3
9.2
12
32
,40
%1
,13
%2
4,4
4%
17
,65
%5
0,8
4%
52
,38
Su
ite
p.
46
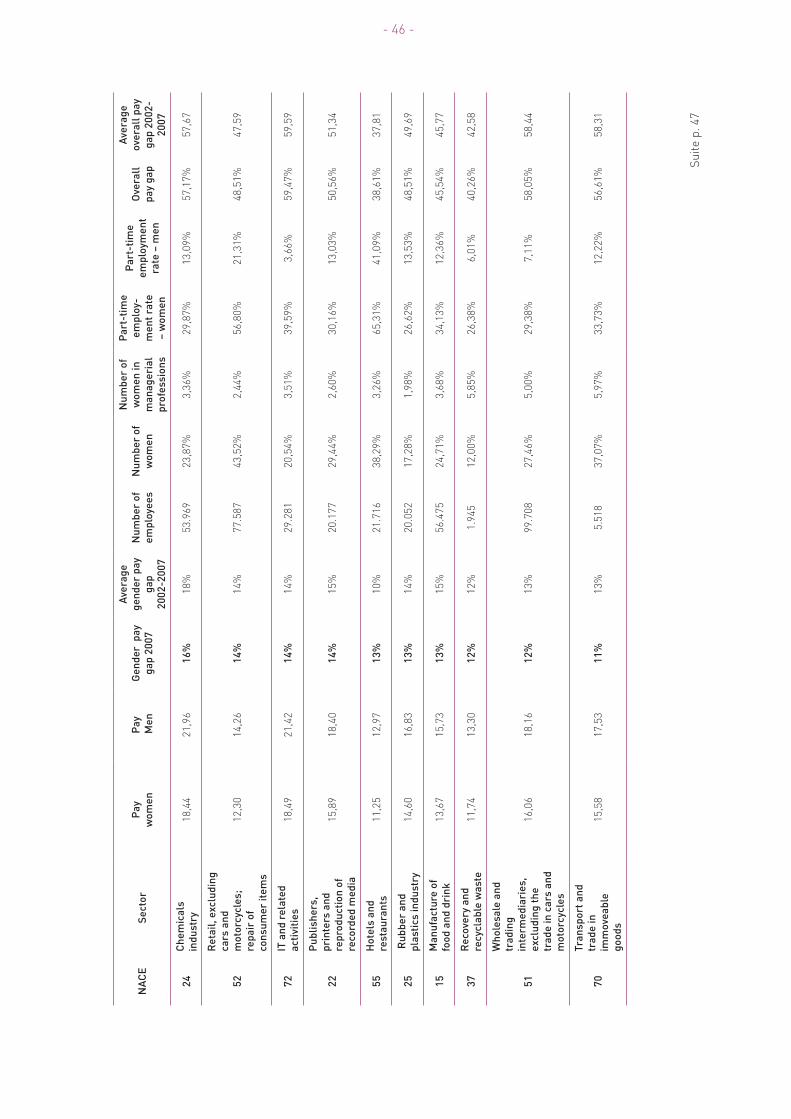
- 46 -
NA
CE
Se
cto
rP
ay
wo
me
n
Pa
y
Me
n
Ge
nd
er
pa
y
ga
p 2
00
7
Ave
rag
e
ge
nd
er
pa
y
ga
p
20
02
-20
07
Nu
mb
er
of
em
plo
ye
es
Nu
mb
er
of
wo
me
n
Nu
mb
er
of
wo
me
n i
n
ma
na
ge
ria
l
pro
fes
sio
ns
Pa
rt-t
ime
em
plo
y-
me
nt
rate
– w
om
en
Pa
rt-t
ime
em
plo
ym
en
t
rate
– m
en
Ove
rall
pa
y g
ap
Ave
rag
e
ove
rall
pa
y
ga
p 2
00
2-
20
07
24
Ch
em
ica
ls
ind
us
try
18
,44
21
,96
16
%1
8%
53
.96
92
3,8
7%
3,3
6%
29
,87
%1
3,0
9%
57
,17
%5
7,6
7
52
Re
tail
, e
xc
lud
ing
ca
rs a
nd
mo
torc
yc
les
;
rep
air
of
co
ns
um
er
ite
ms
12
,30
14
,26
14
%1
4%
77
.58
74
3,5
2%
2,4
4%
56
,80
%2
1,3
1%
48
,51
%4
7,5
9
72
IT a
nd
re
late
d
ac
tivit
ies
1
8,4
92
1,4
21
4%
14
%2
9.2
81
20
,54
%3
,51
%3
9,5
9%
3,6
6%
59
,47
%5
9,5
9
22
Pu
bli
sh
ers
,
pri
nte
rs a
nd
rep
rod
uc
tio
n o
f
reco
rde
d m
ed
ia
15
,89
18
,40
14
%1
5%
20
.17
72
9,4
4%
2,6
0%
30
,16
%1
3,0
3%
50
,56
%5
1,3
4
55
Ho
tels
an
d
res
tau
ran
ts1
1,2
51
2,9
71
3%
10
%2
1.7
16
38
,29
%3
,26
%6
5,3
1%
41
,09
%3
8,6
1%
37
,81
25
Ru
bb
er
an
d
pla
sti
cs
in
du
str
y1
4,6
01
6,8
31
3%
14
%2
0.0
52
17
,28
%1
,98
%2
6,6
2%
13
,53
%4
8,5
1%
49
,69
15
Ma
nu
fac
ture
of
foo
d a
nd
dri
nk
1
3,6
71
5,7
31
3%
15
%5
6.4
75
24
,71
%3
,68
%3
4,1
3%
12
,36
%4
5,5
4%
45
,77
37
Re
co
ve
ry a
nd
rec
yc
lab
le w
as
te1
1,7
41
3,3
01
2%
12
%1
.94
51
2,0
0%
5,8
5%
26
,38
%6
,01
%4
0,2
6%
42
,58
51
Wh
ole
sa
le a
nd
tra
din
g
inte
rme
dia
rie
s,
ex
clu
din
g t
he
tra
de
in
ca
rs a
nd
mo
torc
yc
les
16
,06
18
,16
12
%1
3%
99
.70
82
7,4
6%
5,0
0%
29
,38
%7
,11
%5
8,0
5%
58
,44
70
Tra
ns
po
rt a
nd
tra
de
in
imm
ove
ab
le
go
od
s
15
,58
17
,53
11
%1
3%
5.5
18
37
,07
%5
,97
%3
3,7
3%
12
,22
%5
6,6
1%
58
,31
Su
ite
p.
47

- 47 -
NA
CE
Se
cto
rP
ay
wo
me
n
Pa
y
Me
n
Ge
nd
er
pa
y
ga
p 2
00
7
Ave
rag
e
ge
nd
er
pa
y
ga
p
20
02
-20
07
Nu
mb
er
of
em
plo
ye
es
Nu
mb
er
of
wo
me
n
Nu
mb
er
of
wo
me
n i
n
ma
na
ge
ria
l
pro
fes
sio
ns
Pa
rt-t
ime
em
plo
y-
me
nt
rate
– w
om
en
Pa
rt-t
ime
em
plo
ym
en
t
rate
– m
en
Ove
rall
pa
y g
ap
Ave
rag
e
ove
rall
pa
y
ga
p 2
00
2-
20
07
64
Po
st
an
d t
ele
co
m-
mu
nic
ati
on
s
15
,51
17
,33
11
%1
0%
49
.23
12
4,2
2%
6,3
0%
35
,53
%1
5,1
5%
52
,65
%5
1,1
5
26
Ma
nu
fac
ture
of
oth
er
no
n-m
eta
llic
min
era
l p
rod
uc
ts
14
,57
16
,07
9%
9%
25
.05
38
,72
%4
,61
%2
5,9
1%
9,8
9%
47
,42
%4
6,9
3
50
Sa
le a
nd
re
pa
ir o
f
ca
rs a
nd
mo
torc
yc
les
;
reta
il o
r m
oto
r
fue
ls
14
,76
15
,90
7%
7%
30
.51
11
5,1
8%
1,7
5%
31
,83
%8
,04
%4
9,6
7%
47
,22
41
Ex
tra
cti
on
,
pu
rifi
ca
tio
n a
nd
dis
trib
uti
on
of
pu
re w
ate
r
16
,55
17
,82
7%
5%
3.1
37
19
,74
%0
,00
%1
4,0
7%
2,3
6%
52
,44
%4
7,3
4
36
Ma
nu
fac
ture
of
furn
itu
re;
oth
er
ind
us
try
12
,55
13
,42
6%
9%
13
.50
92
3,4
8%
0,3
1%
34
,85
%5
,32
%3
6,0
6%
35
,71
34
Ma
nu
fac
ture
an
d
as
se
mb
ly o
f c
ars
,
tra
ile
rs a
nd
se
mi-
tra
ile
rs
15
,83
16
,81
6%
10
%3
5.6
47
10
,88
%3
,23
%2
0,8
9%
5,8
6%
39
,02
%4
1,1
0
35
Ma
nu
fac
ture
of
oth
er
me
an
s o
f
tra
ns
po
rt
16
,40
17
,34
5%
9%
13
.11
24
,99
%1
1,3
9%
14
,64
%1
3,5
3%
43
,28
%4
5,3
5
29
Ma
nu
fac
ture
of
ma
ch
ine
s,
ap
pa
ratu
s a
nd
ins
tru
me
nts
15
,60
16
,42
5%
8%
32
.43
31
0,1
4%
1,5
3%
19
,80
%7
,80
%4
3,2
9%
44
,99
27
Me
tall
urg
y1
7,1
01
7,7
74
%6
%2
9.4
47
4,6
7%
7,5
1%
22
,05
%8
,25
%4
9,7
2%
50
,67
71
Hir
e w
ith
ou
t o
pe
-
rati
ng
sta
ff1
5,5
01
5,9
93
%3
%4
.23
52
7,5
7%
3,2
3%
23
,10
%7
,14
%5
6,8
9%
52
,97
Su
ite
p.
48

- 48 -
NA
CE
Se
cto
rP
ay
wo
me
n
Pa
y
Me
n
Ge
nd
er
pa
y
ga
p 2
00
7
Ave
rag
e
ge
nd
er
pa
y
ga
p
20
02
-20
07
Nu
mb
er
of
em
plo
ye
es
Nu
mb
er
of
wo
me
n
Nu
mb
er
of
wo
me
n i
n
ma
na
ge
ria
l
pro
fes
sio
ns
Pa
rt-t
ime
em
plo
y-
me
nt
rate
– w
om
en
Pa
rt-t
ime
em
plo
ym
en
t
rate
– m
en
Ove
rall
pa
y g
ap
Ave
rag
e
ove
rall
pa
y
ga
p 2
00
2-
20
07
28
Ma
nu
fac
ture
of
pro
du
cts
ma
de
fro
m m
eta
l
14
,49
14
,94
3%
5%
46
.17
18
,26
%2
,11
%3
3,5
8%
6,2
4%
40
,35
%4
1,3
7
45
Bu
ild
ing
in
du
str
y1
4,2
71
4,3
71
%4
%1
11
.11
84
,70
%2
,24
%3
8,8
7%
7,2
6%
34
,42
%3
4,3
3
20
Tim
be
r in
du
str
y
an
d m
an
ufa
ctu
re
of
ite
ms
ma
de
fro
m w
oo
d,
co
rk,
ree
ds
an
d
wic
ke
rwo
rk
13
,29
13
,14
-1%
1%
8.1
19
14
,01
%0
,09
%3
1,7
8%
15
,07
%3
3,1
1%
34
,21
60
Tra
ns
po
rt o
ve
r
lan
d1
4,5
11
4,2
4-2
%-2
%7
7.8
36
9,4
4%
2,9
6%
39
,65
%1
6,8
5%
47
,51
%4
8,7
3
14
Oth
er
ex
tra
cti
on
of
min
era
ls1
7,0
41
6,1
7-5
%-3
%2
.49
67
,81
%0
,00
%2
0,8
3%
16
,84
%4
3,5
1%
45
,97
Sou
rce
: D
GS
EI,
Str
uctu
re o
f E
arn
ing
s S
urv
ey

- 49 -
In contrast with previous years, the biggest pay gap is to be found in the aviation sector. But the rest of the top
5 is made up of the same sectors as last year: the gas and electricity sector, the manufacture of clothing and
fur, manufacturers of offi ce machines and computers, and auxiliary companies working for fi nancial institu-
tions. The smallest pay gaps are in the sectors of metal processing, the timber industry and the manufacture
of items from wood, cork, reed and wickerwork, the building industry, road transport and other extraction of
minerals. These are sectors where few women work.
As in the previous report, the next table provides an overview by joint committee of the pay gap in 2007 and
the average from 2002 to 2007. Compared with the fi gures for 2006, there has been very little change in the
average pay gaps.

- 50 -
Tabl
e 17
: Av
erag
e gr
oss
mon
thly
wag
es (i
n EU
R) (
2007
), th
e pa
y ga
p (2
007)
and
the
aver
age
pay
gap
(200
2-20
07) b
y jo
int c
omm
ittee
JR
C
Blu
e-c
oll
ar
wo
rke
rs
Pa
y –
wo
me
nP
ay –
me
nG
en
de
r p
ay g
ap
20
07
Ave
rag
e g
en
de
r
pa
y g
ap
10
0A
ux
ilia
ry J
C f
or
blu
e-c
oll
ar
wo
rke
rs2
.38
52
.80
41
51
6
10
9G
arm
en
t a
nd
clo
thin
g i
nd
us
try
1.9
64
2.7
13
28
31
11
1M
eta
l, m
ac
hin
e a
nd
ele
ctr
ica
l co
ns
tru
cti
on
2.4
79
2.8
02
12
13
11
2G
ara
ge
tra
de
2
.44
42
.58
45
5
11
5G
las
s i
nd
us
try
2.3
27
2.7
35
15
16
11
6C
he
mic
als
in
du
str
y
2.8
34
3.4
07
17
18
11
7P
etr
ole
um
in
du
str
y a
nd
tra
de
3.3
32
4.2
04
21
22
11
8F
oo
d i
nd
us
try
2.2
37
2.6
86
17
16
11
9T
rad
e i
n f
oo
ds
tuff
s2
.06
02
.28
91
01
1
12
0T
ex
tile
in
du
str
y a
nd
kn
itw
ea
r 2
.08
62
.56
21
91
9
12
1C
lea
nin
g2
.02
82
.21
79
10
12
4T
he
bu
ild
ing
in
du
str
y2
.34
32
.47
45
6
12
6S
oft
fu
rnis
hin
gs
an
d w
oo
dw
ork
ing
2
.06
12
.23
58
9
13
0P
rin
tin
g,
gra
ph
ic a
rts
an
d d
ail
y n
ew
sp
ap
ers
2
.50
42
.88
51
31
5
13
6P
ap
er
an
d c
ard
bo
ard
pro
ce
ss
ing
2.2
62
2.6
75
15
16
14
0T
ran
sp
ort
an
d l
og
isti
cs
2
.31
52
.29
9-1
1 Su
ite
p.
51

- 51 -
14
9S
ec
tors
re
late
d t
o m
eta
l, m
ac
hin
e a
nd
ele
ctr
ica
l co
ns
tru
cti
on
2.2
69
2.5
19
10
10
14
9.0
4J
oin
t re
pre
se
nta
tio
n s
ub
-co
mm
itte
e f
or
the
me
tal
tra
de
2.2
08
2.7
35
19
19
30
2H
ote
l in
du
str
y1
.86
02
.01
98
9
30
6In
su
ran
ce
3.1
18
3.6
31
14
15
31
0B
an
ks
3.1
61
3.9
34
20
21
31
1L
arg
e r
eta
il b
us
ine
ss
es
2.0
49
2.2
30
88
CP
Wh
ite
-co
lla
r e
mp
loye
es
Pa
y –
wo
me
nP
ay –
me
nG
en
de
r p
ay g
ap
20
07
Ave
rag
e g
en
de
r
pa
y g
ap
20
0A
ux
ilia
ry J
C f
or
wh
ite
-co
lla
r e
mp
loye
es
2.7
16
3.3
75
20
21
20
1In
de
pe
nd
en
t re
tail
1.7
81
2.1
05
15
16
20
2E
mp
loye
es
in
fo
od
re
tail
ing
1.9
55
2.2
97
15
16
20
7E
mp
loye
es
in
th
e c
he
mic
al
ind
us
try
2.9
68
3.5
60
17
18
20
9E
mp
loye
es
in
me
tal
fab
ric
ati
on
in
du
str
y2
.56
22
.88
21
11
2
21
0E
mp
loye
es
in
th
e s
tee
l in
du
str
y3
.19
33
.50
29
9
21
1E
mp
loye
es
in
th
e p
etr
ole
um
in
du
str
y a
nd
tra
de
3.4
23
4.4
79
24
24
21
4E
mp
loye
es
in
te
xti
le i
nd
us
try a
nd
kn
itw
ea
r2
.09
12
.56
71
91
9
21
5E
mp
loye
es
in
th
e g
arm
en
t a
nd
clo
thin
g i
nd
us
try
2.0
18
2.8
74
30
31
21
8A
ux
ilia
ry n
ati
on
al
JR
C f
or
wh
ite
-co
lla
r e
mp
loye
es
2.5
93
2.8
28
81
0 Su
ite
p.
52

- 52 -
22
0E
mp
loye
es
in
th
e f
oo
d i
nd
us
try
2.3
80
2.7
66
14
15
22
1E
mp
loye
es
in
pa
pe
r in
du
str
y2
.64
63
.02
31
21
3
22
2E
mp
loye
es
in
pa
pe
r a
nd
ca
rdb
oa
rd p
roce
ss
ing
2.2
41
2.6
53
16
17
22
6E
mp
loye
es
in
in
tern
ati
on
al
tra
de
, tr
an
sp
ort
an
d l
og
isti
cs
2.4
18
2.5
15
45
30
2H
ote
l in
du
str
y1
.90
52
.10
81
01
1
30
6In
su
ran
ce
3.0
74
3.6
17
15
17
30
7B
rok
ing
an
d i
ns
ura
nce
ag
en
cie
s2
.74
73
.94
63
03
2
31
0B
an
ks
3.2
14
4.1
45
22
23
31
1L
arg
e r
eta
il b
us
ine
ss
es
2.0
86
2.2
52
77
31
5.0
2J
oin
t re
pre
se
nta
tio
n s
ub
-co
mm
itte
e f
or
air
lin
es
2.7
82
3.6
71
24
27
So
urc
e :
DG
SE
I, S
tru
ctu
re o
f E
arn
ing
s S
urv
ey

- 53 -
5.2 Horizontal segregation: professions
Men and women are not only working more frequently in particular sectors, they also concentrate more often
on certain trades and professions. The ISCO nomenclature is used in the Structure of Earnings Survey, limited
here to two fi gures (see attachment). Some categories are more heterogeneous than others. This again is
about people who are employed full-time in industry and market services.
The table on the pages that follow shows the average gross hourly wages of women and men, the difference
in pay and the average pay gap for 2002 to 2007, the gender breakdown and the rate of part-time employment.
What is striking is that there are signifi cant pay differences between the categories of occupations. The pay
gap is largest among CEOs and board members at 34%. There is a dip in the fi gures for directors and senior
management, with the pay gap 26% in 1999. Between 2000 and 2004, the gap remained above 20%, but it fell
to a steady 14% for 2005, 2006 and 2007.

- 54 -
Tabl
e 18
: Su
mm
ary
of th
e oc
cupa
tiona
l cat
egor
ies
in th
e IS
CO n
omen
clat
ure
Wit
h t
he
ave
rag
e g
ross h
ou
rly
wa
ge
s o
f fu
ll-t
ime
ma
le a
nd
fe
ma
le w
ork
ers
(in
EU
R);
th
e p
ay
dif
fere
nce
(in
EU
R);
th
e a
vera
ge
pa
y g
ap
(2
00
0-2
00
7);
th
e n
um
be
r o
f w
om
en
an
d
me
n a
nd
th
e s
ha
re o
f w
om
en
wo
rkin
g f
ull
-tim
e in
th
e o
ccu
pa
tio
na
l ca
teg
ory
(2
00
7);
an
d t
he
pa
rt-t
ime
em
plo
yme
nt
rate
of
wo
me
n a
nd
me
n.
ISC
OO
cc
up
ati
on
sP
ay –
wo
me
n
Pa
y –
me
n
Pa
y g
ap
Ave
rag
e p
ay g
ap
20
02
-20
07
Sh
are
of
wo
me
n
Pa
rt-t
ime
em
plo
ym
en
t
rate
–
wo
me
n
Pa
rt-t
ime
em
plo
ym
en
t
rate
– m
en
12
CE
Os
an
d b
oa
rd
me
mb
ers
30
,05
35
,03
14
18
18
,26
%1
7,8
4%
4,2
9%
13
Dir
ec
tors
an
d m
an
ag
ers
21
,40
32
,59
34
32
21
,56
%1
0,5
2%
5,0
4%
21
Ph
ys
icis
ts,
ma
the
ma
-
tic
ian
s,
en
gin
ee
rs a
nd
sc
ien
tifi
c p
rofe
ss
ion
s
20
,73
23
,54
12
12
14
,24
%2
1,0
2%
3,2
9%
24
Oth
er
pro
fes
sio
na
ls
(in
cl.
la
wye
rs,
so
cia
l
sc
ien
tis
ts,
art
ists
)
20
,76
26
,27
21
21
32
,64
%1
9,7
4%
4,1
8%
31
Te
ch
nic
ian
s i
n p
hys
ics
an
d t
ec
hn
olo
gic
al
dis
ci-
pli
ne
s
16
,60
18
,90
12
14
11
,76
%2
1,6
5%
6,1
3%
32
Te
ch
nic
ian
s i
n o
rga
nic
an
d h
ea
lth
sc
ien
ce
s1
6,3
51
7,8
79
12
51
,75
%2
5,1
2%
4,6
6%
34
Oth
er
as
so
cia
te
pro
fes
sio
na
ls1
7,1
52
0,0
61
51
64
2,3
3%
28
,36
%5
,86
%
41
Se
cre
tari
es
, a
cco
un
tan
ts
an
d l
og
isti
cs
em
plo
ye
es
15
,19
17
,02
11
11
44
,43
%3
1,5
9%
10
,48
%
42
Cu
sto
me
r s
erv
ice
em
-
plo
ye
es
an
d c
as
hie
rs1
3,4
61
5,4
11
31
35
5,0
3%
56
,90
%2
1,5
1%
51S
up
erv
iso
ry a
nd
su
r-
ve
illa
nce
sta
ff1
1,7
71
3,8
91
51
62
6,7
2%
67
,38
%3
2,3
7%
52M
od
els
, s
ale
sp
ers
on
s
an
d d
em
on
str
ato
rs1
1,8
11
4,6
71
92
34
0,3
5%
52
,67
%1
4,3
9%
Su
ite
p.
55
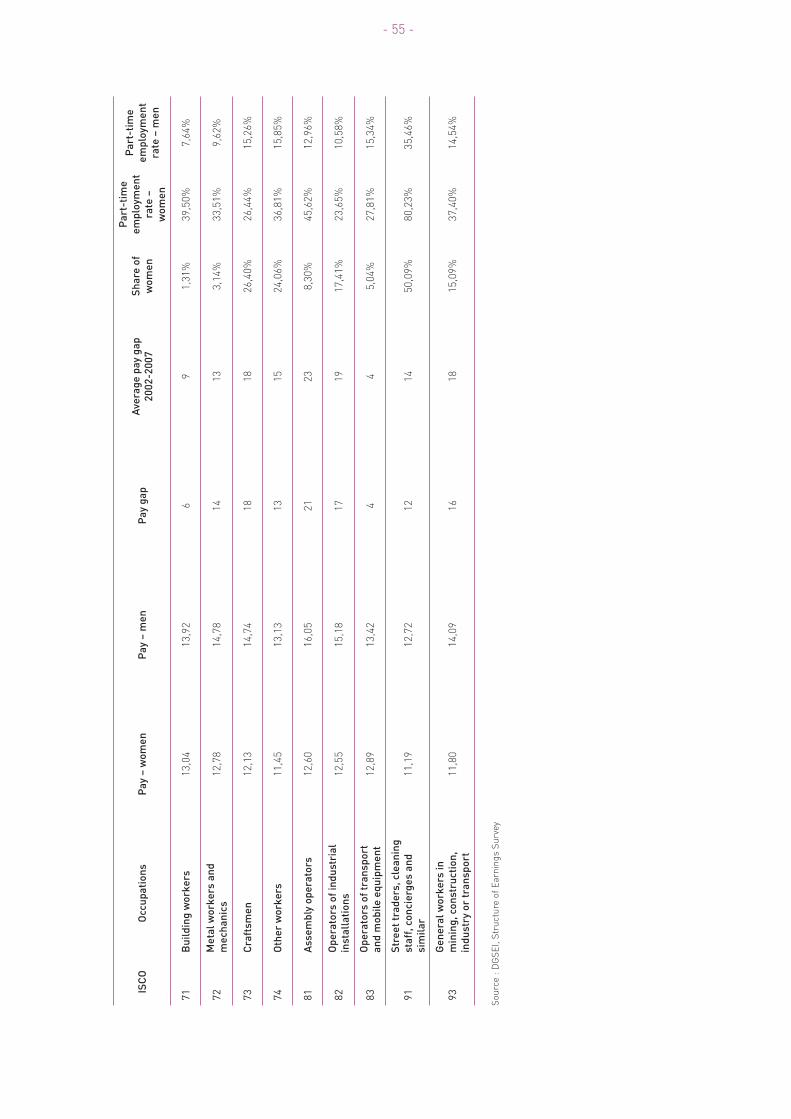
- 55 -
ISC
OO
cc
up
ati
on
sP
ay –
wo
me
n
Pa
y –
me
n
Pa
y g
ap
Ave
rag
e p
ay g
ap
20
02
-20
07
Sh
are
of
wo
me
n
Pa
rt-t
ime
em
plo
ym
en
t
rate
–
wo
me
n
Pa
rt-t
ime
em
plo
ym
en
t
rate
– m
en
71B
uil
din
g w
ork
ers
13
,04
13
,92
69
1,3
1%
39
,50
%7
,64
%
72M
eta
l w
ork
ers
an
d
me
ch
an
ics
12
,78
14
,78
14
13
3,1
4%
33
,51
%9
,62
%
73C
raft
sm
en
12
,13
14
,74
18
18
26
,40
%2
6,4
4%
15
,26
%
74O
the
r w
ork
ers
11
,45
13
,13
13
15
24
,06
%3
6,8
1%
15
,85
%
81A
ss
em
bly
op
era
tors
12
,60
16
,05
21
23
8,3
0%
45
,62
%1
2,9
6%
82O
pe
rato
rs o
f in
du
str
ial
ins
tall
ati
on
s1
2,5
51
5,1
81
71
91
7,4
1%
23
,65
%1
0,5
8%
83O
pe
rato
rs o
f tr
an
sp
ort
an
d m
ob
ile
eq
uip
me
nt
12
,89
13
,42
44
5,0
4%
27
,81
%1
5,3
4%
91S
tre
et
tra
de
rs,
cle
an
ing
sta
ff,
co
nc
ierg
es
an
d
sim
ila
r
11
,19
12
,72
12
14
50
,09
%8
0,2
3%
35
,46
%
93G
en
era
l w
ork
ers
in
min
ing
, co
ns
tru
cti
on
,
ind
us
try o
r tr
an
sp
ort
11
,80
14
,09
16
18
15
,09
%3
7,4
0%
14
,54
%
So
urc
e :
DG
SE
I, S
tru
ctu
re o
f E
arn
ing
s S
urv
ey

- 56 -
5.3 Vertical segregation
The under-representation of women in managerial positions can be seen in the summary table for the sec-
tors (table 16). The share of women in the occupational categories of CEOs and board members (ISCO 12) and
directors and senior managers (ISCO 13) is shown next to the share of women in the sector. Vertical segrega-
tion is always expressed as a relative shortage, i.e. in proportion to the presence of women in a sector. When
the share of women in managerial positions corresponds to their share in the sector, it can be assumed that
women have no specifi c obstacles to overcome on their way to the top.
There is a shortage of women at the top in almost all sectors. Out of the 44 sectors in industry and market
services, 10 of them have fewer than 0.5% women in managerial positions. The glass ceiling is the thickest in
the sector for manufacturing fur and clothing: while women make up almost 80% of employees, they are not
represented at management level. There is also a similar ‘concrete glass ceiling’ in the sectors for tobacco
production, leather processing and the textile industry. Other sectors with a high level of vertical segregation
are companies assisting fi nancial institutions and retail.
And those women who do succeed in breaking through the glass ceiling are then confronted with a major pay
gap: 34% for directors and senior managers and 14% for CEOs and board members.
5.4 The size of the company
We know that the size of the company has an effect on employee pay and hence on the pay gap between wo-
men and men. The table below shows the average gross monthly wages of women and men and the resulting
pay gap classifi ed according to the size of companies with 10 employees or more in sectors C to K.
Table 19 : Average gross monthly wages of full-time employees (in EUR) and the pay gap by company size (according to the number of employees) (companies with at least 10 employees) (2007)
Taille de l’entreprise Women Men Pay gap
10-19 2.182 2.401 9
20-49 2.265 2.572 12
50-99 2.434 2.768 12
100-199 2.574 2.956 13
200-499 2.609 3.058 15
500-999 2.667 3.241 18
>=1000 2.729 3.267 16
Source : DGSEI, Structure of Earnings Survey

- 57 -
The average gross monthly wages of both women and men increase with the size of the company. The pay gap
also rises with the number of employees in the company, with the exception of companies with at least 1,000
employees, where the pay gap is smaller than in companies with 500 to 999 employees.
Graph 22 : Average of gross monthly wages of full-time employees (in EUR) by company size (according to the number of employees) (companies with at least 10 employees) (2007)
Source : DGSEI, Structure of Earnings Survey
5.5 The gender pay gap in the light of the overall pay gap
Taken overall, the pay differences between women and men are in line with the differences in high and low
pay in a particular sector. These differences are refl ected by the overall pay gap, defi ned as the difference
between high and low pay, expressed as a percentage of high pay. Low pay is defi ned on the basis of the 5th
pay percentile of a sector. This is a pay level by which 5% of all employees in a sector earn less and 95% earn
more. The yardstick for high pay is a pay level by which 85% of the employees in a sector earn less and 15%
earn more.
To avoid major spikes in sectors that have few employees, we have calculated an average of the overall pay
differences per sector for the data from 2002 to 2007. The data for each sector is shown in table 16.
Overall pay differences vary from 33% in the sector for the timber industry and the manufacture of items from
wood, cork, reed and wickerwork, with the exception of furniture, to 71% in aviation. The two sectors with the
largest overall pay gap also have the biggest gender pay gap. The two sectors with the smallest overall pay
gap also have a very small gender pay gap.
0
500
1.000
1.500
2.000
2.500
3.000
3.500
10-19 20-49 50-99 100-199
200-499
500-999
>=1000
Women Men

- 58 -
EXTRA INDICATOR : marital status and household composition14
Marital status and household composition can also have an effect on the pay of men and women and hence
on the pay gap.
The graph below shows gross hourly wages by marital status. We can see that marital status has an effect on
the pay of men in particular. This is especially the case for married men. While average gross hourly wage of
single men is 15.07 EUR, this fi gure rises to 18.82 EUR for married men. This difference can be explained in
part by age. On average, a married man is twelve years older than a single man, and graphs 16 and 17 show
that age is positively correlated to pay. In other words, people earn more on average as they get older. This
analysis also applies to widowers, who are twenty years older on average than single men. Although divorced
men are on average thirteen years older than single men, this argument appears to apply to them to a les-
ser extent.15 This indicates that age difference in the difference in pay is not fully explained. The graph also
confi rms the model of the man as the breadwinner. The stronger the family bond, the higher the pay. Men with
a partner are assumed to be able to make themselves more available for their career.
With women, their average gross hourly wages vary less according to marital status. Their pay differences
are less pronounced than with men. Married women earn more than single or divorced women. In 2007, they
had a gross hourly wage of 16.04 EUR, compared with 14.59 EUR for single women and 15.59 EUR for divor-
ced women. Once again age plays a role, but without explaining everything. On average, married women are
ten years older than single women, while divorced women are thirteen years older on average. Probably the
relationship with a partner plays a particular role for women in their decision whether or not to participate
(full-time or part-time) on the labour market.
Graph 23 : Average gross hourly wages, by marital status (in EUR) (2007)
Sources : DGSEI, Structure of Earnings Survey and the National Register
14 For the sake of simplicity, we speak here of ‘families’. In statistical terms, it is ‘households’: people who together form
a living unit. In the vast majority of cases, both notions coincide. 15 These fi gures are based on the Structure of Earnings Survey 2006 and apply to employees from sectors C to K.
0,002,004,006,008,00
10,0012,0014,0016,0018,0020,00
Single Married Widow/Widower Divorced
WomenMen

- 59 -
The graph with the employment rate of women and men according to family type does indeed show that
married women are often less active on the labour market than single women. This observation can also be
made for men. The data confi rms the role pattern to a large extent. The employment rate of men is higher
across the board than women and the difference becomes more pronounced within marriage. Having children
results in married couples participating more in the labour market, but participation falls with unmarried
couples. An age-related effect is probably at work here: younger couples with no children and a higher labour
market participation are probably not married as often as older couples whose children ‘have left home’ and
hence are counted as couples with no children and who work less.
Graph 24 : Employment rate by family type (2007)
Source : DGSEI, Labour Force Survey
The varying effects of marital status of the pay of women and men mean that the pay difference is very large
for married people (15%) and relatively limited for singles (3%). One of the reasons for the low pay difference
among singles can be explained by the fact that singles are younger on average and tend to be at the be-
ginning of their career, meaning that factors such as seniority, years of service and promotions are not yet
playing a major role. Compared with the data from 2006, the pay gap for each category remained about the
same in 2007.
0%
10%
20%
30%
40%
50%
60%
70%
80%
90%
100%
Single-
perso
n hou
seho
ld
Married
coup
le, no
child
ren
Unmarr
ied co
uple,
no ch
ildren
Married
coup
le, ch
ild(re
n)
Unmarr
ied co
uple,
child
(ren)
Single-
paren
t family
Other
Total
WomenMen

- 60 -
Graph 25 : Pay gap by marital status (2007)
Sources : DGSEI, Structure of Earnings Survey and the National Register
When we look at pay by family composition, we see a more or less similar picture as with marital status. With
men, having a partner plays a major role: men who have a partner earn more than single men. Once again
the difference can be explained by the age effect. With women, the effect is much smaller: whether they have
a partner or not, women’s pay is barely affected. But having children does have an effect on women’s pay,
whereas the presence of children with men has almost no effect.
Graph 26 : Average gross hourly wages by family type (2007)
Sources : DGSEI, Structure of Earnings Survey and the National Register
0%
2%
4%
6%
8%
10%
12%
14%
16%
Single Married Widow/Widower Divorced
Pay Gap
02468
101214161820
Single, nochildren
Single, child(ren) Couple, nochildren
Couple, child(ren)
Women Men

- 61 -
The impact of these various factors results in the end in the pay gap being small for singles without chil-
dren, average for singles with children, and signifi cantly higher for couples (with or without children). We
should also note that the pay gap for the various categories shows little change with the data from 2006.
Graph 27 : Pay gap by family type (2007)
Sources : DGSEI, Structure of Earnings Survey and the National Register
EXTRA INDICATOR: nationality
Gender inequality is often exacerbated by other social inequalities. As was the case last year, the survey into
the structure of wages was linked to the nationality from the National Register. As a result, we are also able
to show the pay gap by nationality in this report. Categories have also been created to prevent working with
small and hence less reliable sample numbers. First, we show the differences in the employment rate by na-
tionality. Before there can be any question of a pay gap, people have to be able to fi nd work. An initial inequality
on the labour market is that they cannot fi nd work. Next we discuss the pay gap according to nationality and
examine the nationalities of these women and men who lag behind in pay compared with the average gross
hourly wages of Belgian women and men.
The distinction that people tend to make inconsiderately between nationals and foreigners is not so easy
to include in statistics. It stems partly from the difference in nationality. Someone of Moroccan origin, with
Belgian nationality, is usually considered as a ‘foreigner’, whereas a ‘true-blue’ Australian is probably not
viewed either as being ‘foreign’, or as a ‘native’. Whether people discriminate consciously or not, they do not
base themselves on objective characteristics. This makes measuring all the more diffi cult. To overcome this
obstacle in the graph and table below, a distinction has been made both of current nationality and country of
birth. However, using the country of birth is again only a way of approaching the rather subjective distinction
between foreigners and natives.
0%2%4%6%8%
10%12%14%16%18%
Single, nochildren
Single, child(ren) Couple, nochildren
Couple, child(ren)
Pay Gap

- 62 -
Graph 28 : Employment rate by current nationality and by country of birth (2007)
Source : DGSEI, Labour Force Survey
Table 20 : Employment rate by current nationality and by country of birth (2007)
Belgian non-Belgian, EU 27 non-EU 27
Women 57% 52% 25%
Men 69% 69% 52%
Born in BelgiumBorn in an EU 27 country,
not Belgium
Born in a non-EU 27
country
Women 58% 50% 35%
Men 70% 66% 58%
Source : DGSEI, Labour Force Survey
When we look at the employment rate by nationality, we can see that for men there is no difference between
Belgians and other EU citizens. In both cases the employment rate is 69%. However, there is a difference for
women. While the employment rate for Belgian women is 57%, it is only 52% for women from other EU states.
For people with a nationality outside the European Union, the employment rate for men falls to 52% and for
women to 25%. This means that only half of men and a quarter of women with a nationality from outside the
European Union and living in Belgium have a job here.
The employment rate by country of birth gives a somewhat different picture. For women and men born in Bel-
gium, the employment rate is somewhat higher than for women and men with Belgian nationality. For people
born in another EU member state, it is just a little lower again. However, being born in a non-EU country has a
less negative effect on the rate of employment than having a nationality from outside the European Union. The
employment rate of women in this category is 35% and 58% for men. The difference between country of birth
and current nationality of course works in two directions. People of foreign origin with Belgian nationality
are in the fi rst classifi cation with ‘Belgians’ and in the second category of ‘born in a non-EU country’. We can
probably deduce from this that foreigners with Belgian nationality are viewed relatively better on the labour
market than foreigners with a non-European nationality, but less well than ‘natives’.
02468
101214161820
Single, nochildren
Single, child(ren) Couple, nochildren
Couple, child(ren)
Women Men

- 63 -
The negative impact of having a foreign nationality or a different country of birth on a person’s chances of
fi nding work is greater across the board for women than for men. For each category, the disadvantage in rela-
tion to Belgian women or women born in Belgium is at least twice as big as the disadvantage for men. Hence
the gender gap is made signifi cantly bigger by the ‘ethnic gap’. As a result, the biggest difference between
women and men in the employment rate is to be found in the category of non-EU citizens. Women with a non-
EU nationality have less than half as much chance of fi nding work as men in the same category. In the same
way, foreign women have less than half as much chance of fi nding work as Belgian women or women from
other EU countries.
For the purposes of the pay gap, we can further refi ne the categories of nationality. Table 20 and graph 32
show the average gross hourly wages of full-time and part-time employees by nationality for all of the sectors
included in the survey – in other words for industry and market services.16 Just to be absolutely clear : this
does not relate to the pay gap in those various countries.
Table 21 : Average gross hourly wages (in EUR) and the pay gap for full-time and part-time
employees by nationality in Belgium (NACE sectors C-K) (2007)
Nationality Women Men Pay gap
Belgian 14,74 17,24 15%
German, French and Dutch 16,67 19,47 14%
Other EU 15 citizens17 15,36 17,97 15%
Other EU 27 citizens18 13,00 16,40 21%
Other Europeans (incl. Turks and Russians) 12,25 13,79 11%
Maghreb countries 10,71 12,44 14%
Other Africans 11,03 12,49 12%
North and South Americas 18,44 23,05 20%
Asia and Oceania 13,77 16,22 15%
Source : DGSEI, Structure of Earnings Survey and the National Register
16 En the 2006 survey year, the sectors of healthcare, education and the socio-cultural sector were also surveys, so that making compari-
sons with the fi gures from 2009 report is not so straightforward.
17 This category includes EU 15 citizens, with the exception of Belgium, Germany, France and the Netherlands. The countries included are
Italy, Luxembourg, Denmark, Spain, Greece, Ireland, Austria, Portugal, Finland, Sweden and citizens of the United Kingdom.
18 This category includes citizens of Poland, Slovakia, Slovenia, the Czech Republic, Bulgaria, Romania, Estonia, Latvia, Lithuania,
Hungary, Cyprus and Malta.
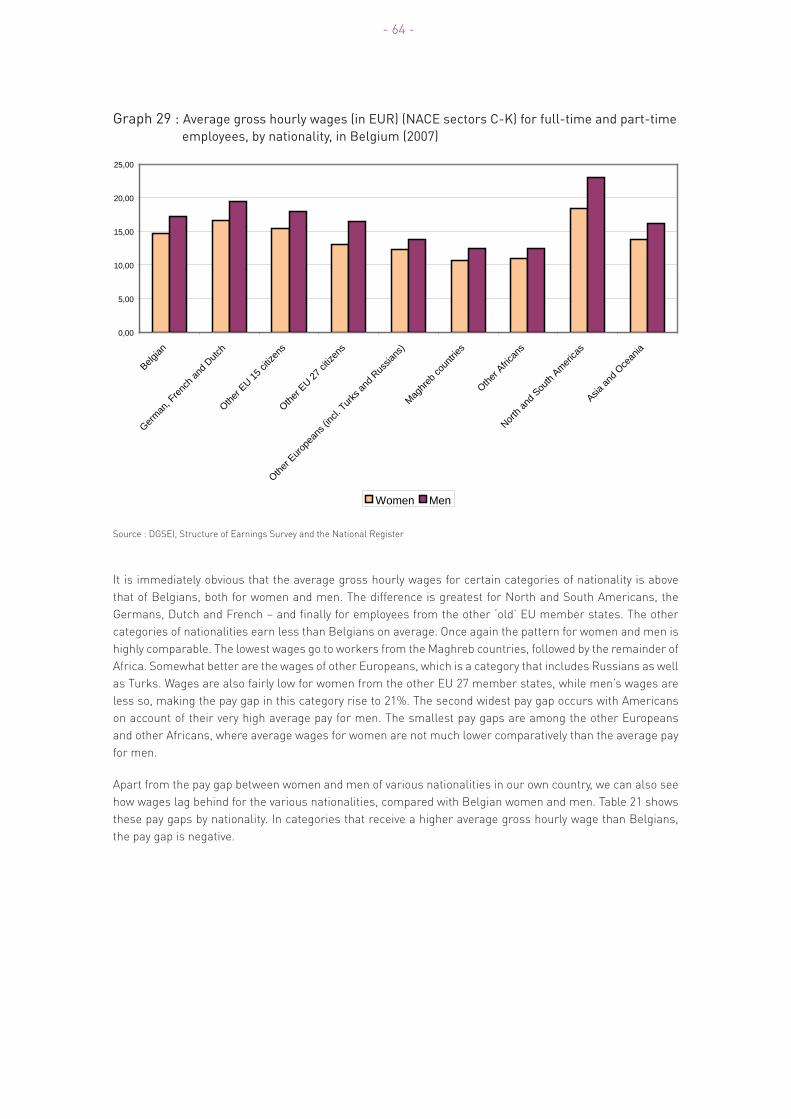
- 64 -
Graph 29 : Average gross hourly wages (in EUR) (NACE sectors C-K) for full-time and part-time employees, by nationality, in Belgium (2007)
Source : DGSEI, Structure of Earnings Survey and the National Register
It is immediately obvious that the average gross hourly wages for certain categories of nationality is above
that of Belgians, both for women and men. The difference is greatest for North and South Americans, the
Germans, Dutch and French – and fi nally for employees from the other ‘old’ EU member states. The other
categories of nationalities earn less than Belgians on average. Once again the pattern for women and men is
highly comparable. The lowest wages go to workers from the Maghreb countries, followed by the remainder of
Africa. Somewhat better are the wages of other Europeans, which is a category that includes Russians as well
as Turks. Wages are also fairly low for women from the other EU 27 member states, while men’s wages are
less so, making the pay gap in this category rise to 21%. The second widest pay gap occurs with Americans
on account of their very high average pay for men. The smallest pay gaps are among the other Europeans
and other Africans, where average wages for women are not much lower comparatively than the average pay
for men.
Apart from the pay gap between women and men of various nationalities in our own country, we can also see
how wages lag behind for the various nationalities, compared with Belgian women and men. Table 21 shows
these pay gaps by nationality. In categories that receive a higher average gross hourly wage than Belgians,
the pay gap is negative.
0,00
5,00
10,00
15,00
20,00
25,00
Belgian
German
, Fren
ch an
d Dutc
h
Other E
U 15 ci
tizen
s
Other E
U 27 ci
tizen
s
Other E
urope
ans (
incl. T
urks a
nd R
ussia
ns)
Maghre
b cou
ntries
Other A
frican
s
North a
nd S
outh
America
s
Asia an
d Oce
ania
Women Men

- 65 -
Table 22 : Pay disadvantage (in EUR) and the pay gap with regard to the average gross hourly wages of Belgian employees, by nationality, in Belgium (NACE sectors C-K) (2007)19
Women Men
Pay disadvantage
compared with
Belgian women
Pay gap compa-
red with Belgian
women
Pay disadvantage
compared with
Belgian men
Pay gap compared
with Belgian men
Germans, French, Dutch -1,93 -13% -2,23 -13%
other EU 15 citizens20 -0,62 -4% -0,73 -4%
other EU 27 citizens21 1,74 12% 0,84 5%
other Europeans 2,49 17% 3,45 20%
Maghreb countries 4,03 27% 4,80 28%
other Africans 3,71 25% 4,75 28%
North and South Americans -3,70 -25% -5,81 -34%
Asia and Oceania 0,97 7% 1,02 6%
Sources : DGSEI, Structure of Earnings Survey and the National Register
Women and men from the Maghreb region, the other Africans and Europeans from non-EU 27 countries (in-
cluding Turks and Russians) have a signifi cant pay disadvantage vis-à-vis Belgians. Except for women from
the new EU member states, the disadvantage for women from a percentage point of view is of equal size or a
little less than for men. Of course, that does not detract from the fact that women from these categories still
earn less than men across the board. Women from the Maghreb countries are the worst off of all: on average,
they only earn 10.71 EUR gross per hour.
For those nationalities that earn more than Belgians on average (shown here with a negative pay gap), the
lead enjoyed by women is comparable to that of men, except for the Americans. American women earn 25%
more on average than Belgian women, while for American men, this advantage rises to 34%.
19 For women of other nationalities, we took the average gross hourly wages of Belgian women as the reference point.
For the purpose of eliminating all gender pay gaps, the gross hourly wages of Belgian men should also be mentioned
here as a reference point. We have opted not to do that here in order to illustrate the dual disadvantage.
20 This category includes EU 15 citizens, with the exception of Belgians, Germans, French and Dutch. Hence the category
covers citizens from Italy, Luxembourg, Denmark, Spain, Greece, Ireland, Austria, Portugal, Finland, Sweden and the
United Kingdom.21 This category includes citizens of Poland, Slovakia, Slovenia, the Czech Republic, Bulgaria, Romania, Estonia, Latvia,
Lithuania, Hungary, Cyprus and Malta.

- 66 -

- 67 -
III. Breakdown of the difference in payINDICATOR 6 Indicators 1 to 5 are descriptive in nature: they indicate how the pay gap varies according to a number of
characteristics, namely age, education, sector of employment, family composition and nationality. Indicator
6 examines the relationship of the pay gap with these variables. An econometric method is used to look at
the extent to which the variation in pay between women and men can be attributed to a number of known
factors.
Hence the pay gap is divided into an explained part and an unexplained part. The explained part includes the
strong infl uence of the varying positions of men and women on the labour market, such as the strong pre-
sence of women in less well-paid sectors or the lower seniority accrued by women. So these are differences
that can be observed objectively. However, this does not mean that they should also be justifi ed: if young girls
are systematically pointed towards the types of education and qualifi cations that provide fewer opportunities
on the job market, or if women sometimes have no choice other than to work part-time or in less attractive
sectors, this goes a long way to explaining the pay gap. But that does not mean to say that it is acceptable.
Then, of course, there is also the unexplained part of the pay gap. Even if they have the same qualities as men,
women are still paid less. This means that a woman with the same length of service, the same age, working
in the same sector with the same profession and same level of education as a man still earns less than that
man. We should mention here that the pay gap could be explained much better if we had even more detailed
data to hand. For example, it would appear that a university degree offers fewer opportunities for women.
However, for as long as we do not know whether this has to do with the difference in diploma (engineer or
historian) or if in fact it is the result of obvious discrimination, it is hard to make any pronouncements on the
subject. So the unexplained part of the pay gap consists of two parts: the yet to be explained (mainly through
a lack of details about certain characteristics) and the essentially unexplained part, because it is the result
of ‘pure’ pay discrimination.
The classic model used to break down the pay gap is the ‘Oaxaca-Blinder decomposition’, which estimates
women’s pay and men’s pay on the basis of known variables. They are then put together in a single compari-
son to investigate the difference. We use the Oaxaca-Blinder decomposition because it is included in the list
of indicators approved by the Council of the European Union in 2001. There are also other explanatory models
for analysing the pay gap.
The results for Indicator 6 for 2007 are broadly the same as those from 2005 and 2006, but they are not fully
comparable because the decomposition model was applied in 2006 to sectors C-K, M, N and O, whereas the
data in this report only relates to sectors C to K. It also contains an additional variable: nationality. Having said
that, the statistical parameters do allow us to test the reliability of the analysis and confi rm the usefulness
of the model.22
The results of the decomposition indicate that 48% of the pay gap can be explained on the basis of twelve
defi ned factors. By taking an additional factor into consideration, the explained part has now risen from 46%
to 48% compared with the previous results.
22 The model and all the variables included in it are statistically signifi cant; the majority have a p-value of less than
0.0001. The determination coeffi cient is 51.22% for women and 53.09% for men.
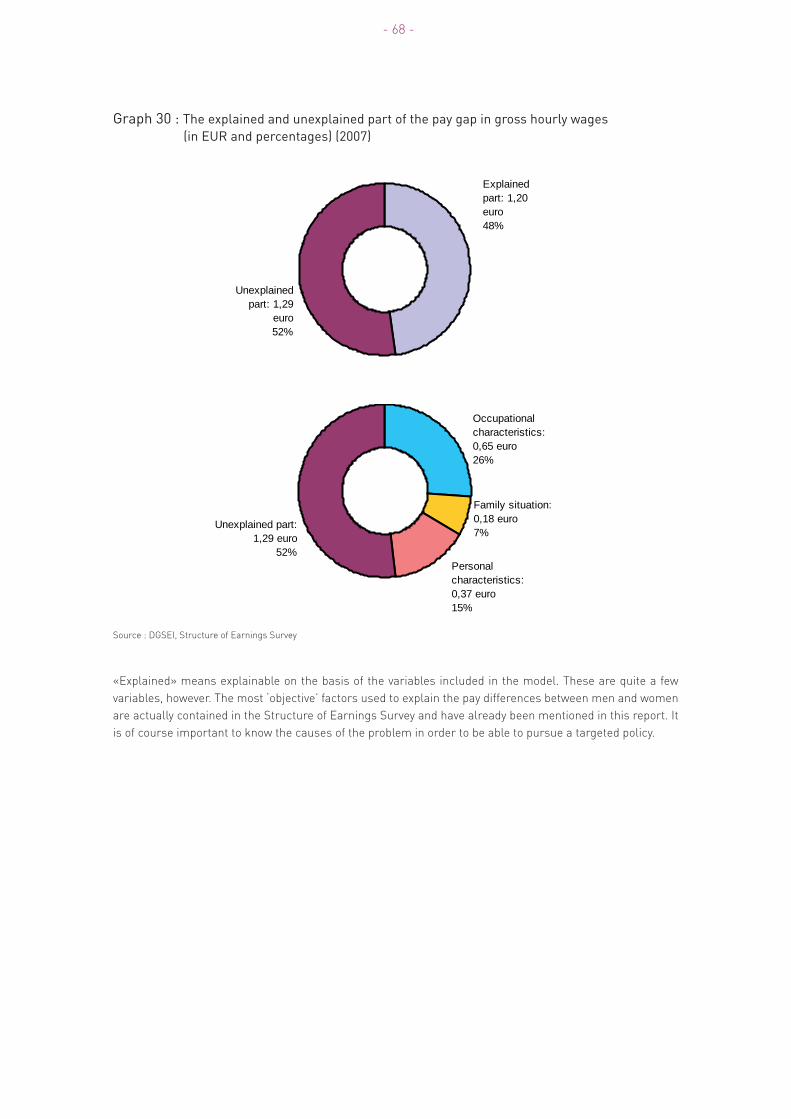
- 68 -
Graph 30 : The explained and unexplained part of the pay gap in gross hourly wages (in EUR and percentages) (2007)
Source : DGSEI, Structure of Earnings Survey
«Explained» means explainable on the basis of the variables included in the model. These are quite a few
variables, however. The most ‘objective’ factors used to explain the pay differences between men and women
are actually contained in the Structure of Earnings Survey and have already been mentioned in this report. It
is of course important to know the causes of the problem in order to be able to pursue a targeted policy.
Unexplained part: 1,29
euro52%
Explained part: 1,20 euro48%
Family situation: 0,18 euro7%
Personal characteristics: 0,37 euro15%
Occupational characteristics: 0,65 euro26%
Unexplained part: 1,29 euro
52%

- 69 -
The explained part of the pay gap, which totals 48%, can be broken down further: 27% of the pay gap in gross
hourly wages can be attributed to occupational characteristics, 15% to personal characteristics and 7% to
the family situation.
The explained part is analysed in detail in the graph below.
Graph 31 : Decomposition of the pay gap – subdivision of the explained part of the pay gap (2007)
Source : DGSEI, Structure of Earnings Survey
Nearly 55% of the explained part can be attributed to characteristics that refer to the position of men and wo-
men on the labour market, which can in the broad sense be contained under the heading of ‘segregation.’ The
occupation explains 12% of the explained pay gap and whether the person is employed on a permanent basis
11% and the sector 8%. The outline is completed by whether the job is part-time or full-time, the employment
region and the ‘form of economic and fi nancial control.’ This latter variable indicates whether and, if so, the
extent to which, there is a form of government participation in the company.
The family situation accounts for 15% of the explained pay gap. Of particular importance is whether there are
children (11.4%). Although this result comes as no surprise – for it has everything to do with the diffi culty of
combining gainful employment and family – it remains a challenge for policy.
Finally, only 30% of the explainable part of the pay gap can be attributed to individual characteristics, such
as education, work experience, length of service in the company and nationality. It is of interest to note that
almost 6% of the explained part is attributable to the fact that a foreign nationality is involved. Converted
into difference in average gross hourly wages, we are then talking about 0.37 EUR. These results show that
a breakthrough is needed in gender-related stereotypical study choices. Discrimination based on ethnicity
also needs to be combated and we can see that the problem of less stable and interrupted career pathways
requires a good deal of attention.
8,9%
7,7%
8,4%
5,6%
11,4%
3,5%
8,3%
7,2%
7,9%
10,9%
8,3%
12,0% Occupation
Employment sector
Type of contract (open-endedor fixed-term)Employment type (full-time orpart-time)Employment region
Form of economic andfinancial controlMarital status (married or not)
Family type (with or withoutchildren)Nationality
Level of education
Work experience (estimatedtotal years of service)Years of service in thecompany
Caractéristiques professionnelles : 54,6%
Situation familiale : 14,9%
Caractéristiques individuelles : 30,5%

- 70 -

- 71 -
Summary I. Overall pay differences
This report is structured in the same way as the indicators. We have gone away from the more general fi gures
and gone into greater details, each time referring to the relevant tables.
How big is the pay gap?
For 2007, the pay gap based on the gross hourly wages of full-time and part-time employees across 1.
all sectors was 11%. (table 10)
For 2007, the pay gap based on the gross annual wages of full-time and part-time employees across 2.
all sectors was 24%. The effect of part-time working is shown in full with annual wages. (table 11)
When the pay gap based on the gross annual wages of full-time and part-time employees is broken 3.
down into status, major differences come to the fore. For blue-collar workers in the private sector,
the pay gap is 18%, whereas for white-collar employees it is 26%. For contract civil servants in the
public sector, the pay gap is 6%, whereas for permanent civil servants it is -1%. (table 10)
Calculated on the basis of annual wages, the fi gures for blue-collar workers and white-collar 4.
employees rise to 37%. At the end of the year, contract and permanent civil servants were looking at
a pay gap of 18% and 11% respectively. The fact that women work part-time more often than men
therefore has a major impact on the average differences in pay. (table 11)
The pay gap calculated on the basis of monthly wages for full-time employees is 12%. Until 2007, this 5.
was the offi cial pay gap indicator. (table 1)
The pay gap calculated on the basis of monthly wages for full-time and part-time employees together 6.
is 23%. This is known as the equal pay day indicator. (table 6)
The pay gap in fringe benefi ts rises signifi cantly. Women are less likely to be granted these benefi ts 7.
and receive smaller amounts. Employers pay for a supplementary pension for 13.3% of female
employees and 15.9% of males. The amounts for supplementary pensions for women are 45.74%
lower on average than for men. The contribution for travelling to and from work is 28.24% lower on
average for women. Only a small proportion of employees receive additional benefi ts in the form of
share options. However, men are twice as likely as women to receive these benefi ts (0.73% of men
compared with 0.31% of women). The amounts for women here are 48% lower than for men. (table 4)
Is the pay gap closing?
The survey fi gures for 2007 indicate that there is no clear-cut reduction in the pay gap compared with 8.
the previous year. However, the closing of the pay gap observed in 2006 is confi rmed by this data.
Over the longer term, we can see a clear downward trend in the size of the pay gap. The pay gap in 9.
industry has halved over the past 40 years. In the short term – with the exception of 2006 – the closing
of the pay gap is very slow, but quite steady.
The total pay gap
In 2007, 45.92% of the workforce was female. Together women accounted for 41.25% of the paid 10.
working days and they received 37.52% of the total wages bill (95,974,263,404 euro).
Based on the proportion of employees they represent, all women together should have earned 8.056 11.
billion EUR more in 2007. Based on their share in the number of paid working days – hence taking
account of the fact that women work part-time more often than men – 3.576 billion EUR.

- 72 -
The proportion of women among employees, both in the number of paid working days and the total 12.
wage bill, was slightly higher in 2007 than in 2006. This is a trend that was also noted in previous years.
Yet we can state that the amounts of the total pay gap, taking changes in prices into consideration, are
approximately the same or slightly higher.
Of all women who work full-time, three out of ten earn less than 2,000 EUR gross per month, whereas 13.
the fi gure in 2006 was four women out of ten. For men, this is only the case for three out of twenty.
One in two women earn less than 2,250 EUR gross per month, while for men it is only two out of fi ve.
(table 13)
More than 6% of the men who work full-time earn more than 5,000 EUR gross per month, while only 14.
3% of women earn this amount. (table 13)
II. Factors
Part-time work
Only 10.5% of female and 8.8% of male part-time wage earners do not want a full-time job. (table 14)15.
A woman working part-time in industry and market services earns 21% per hour less than a man 16.
working full-time, 11% less than a woman working full-time and 8% less than a man working part-time.
A female part-time worker earns 18% per month less than a male part-time worker. (table 15)17.
Age
The pay gap widens with age. Among wage earners who work full-time, the pay gap is 19% for workers 18.
aged over 55 and 11% for 45 to 54-year-olds. For part-time workers, the fi gure is 20% in the oldest
age category and 14% in the one below.
The difference in the employment rate between women and men also increases with age.19.
Level of education
The pay gap is widest among full-time and part-time workers with a higher level of education at 20.
21%.
The employment rate for women and men rises in line with the level of education. The difference in 21.
the employment rate between men and women becomes smaller as the level of education rises.
Segregation
In contrast with previous years, the largest pay gap in 2007 was in the aviation sector. However, the 22.
top 5 was made up of the same sectors as the previous year. (table 16)
Other sectors with a wide pay gap are the sectors for the production and distribution of electricity, 23.
gas, steam and hot water, the manufacture of clothing and fur, the sector for manufacturing offi ce
machines and computers and the auxiliary companies of fi nancial institutions. (table 16)
Only metallurgy and the sector for manufacturing other transport resources have proportionately 24.
more women in management than in the sector itself. Yet there is still a pay gap of 4% and 5%
respectively. (table 16)
The pay gap is greatest among directors and managers, at 34%. Only 22% of this occupational 25.
category is female. (table 18)
For lawyers, social scientists, artists and other ‘professionals’ working in paid employment, the pay 26.
gap rises to 21%. (table 18)
For industry and market services, the average gross monthly wages of both women and men rise in 27.
accordance with the size of the company. The pay gap also rises with the number of employees in the
company, with the exception of companies with over 1,000 employees, where the pay gap is smaller
than in companies with 500 to 999 employees.

- 73 -
Marital status and family composition
Marital status has an effect on men’s pay in particular. The average gross hourly wage for single men 28.
was 15.07 EUR in 2007, compared with 18.82 EUR for married men. The difference in average age only
explains this difference in part.
The employment rate for men is higher than for women in each of the marital status categories and 29.
the difference becomes more pronounced within marriage.
The various effects of marital status on the pay of women and men result in the pay difference being 30.
very large for people who are married (15%) and relatively small for singles (3%).
Having a partner plays a major role for men: men who live with a partner receive more pay than single 31.
men. The presence of children barely has any effect for men.
For women the fact whether they have a partner or not hardly affects their pay. But children do 32.
make a difference: for women with children, average hourly wages are lower than for women with
no children.
In the end, the impact of these various factors means that the pay gap is only small for singles with 33.
no children, average for singles with children and high for couples (with or without children).
Nationality
For men, there is no difference in the employment rate between Belgians and other EU citizens. 34.
In both cases the employment rate is 69%. There is, however, a difference for women. While the
employment rate for Belgian women is 57%, the fi gure for women from other EU member states is
52%.
For people with a nationality outside the European Union, the employment rate for men dips to 52% 35.
and to 25% for women. This means that only half of men and a quarter of women from outside the
European Union in Belgium have a job.
Women with a non-EU nationality only have half as much chance of fi nding a job as men from the 36.
same category. In the same way, these women are only half as likely to fi nd work as Belgian women,
or women from the other EU countries. Hence the gender gap is enlarged appreciably further by the
‘ethnic gap’. (table 20)
Citizens from Germany, France, the Netherlands and America working in Belgium earn more 37.
on average than Belgians do; this has to do with well-paid jobs, for men in particular. For these
categories of nationalities, there is a pay gap of 14% for the three neighbouring countries and 20%
for Americans. (table 21)
For workers from the Maghreb countries and the remainder of Africa, the average gross hourly wages 38.
of women and men are the lowest. Women earn 11 to 12% less than men in these categories. (table 21)
Women and men from the Maghreb, other African and European non-EU 27 countries (including 39.
Turks and Russians) have a major wages disadvantage compared with Belgians. (table 22)
III. The relative weight of these factors
48% of the pay gap can be explained on the basis of known factors. 52% cannot be explained.40.
Of the explained part, 55% can be attributed to characteristics that refer to the position of women 41.
and men on the labour market. The occupation explains 12% of the explained pay gap and the sector
8%.
The family situation appears to be responsible for 15% of the explained pay gap. In particular, whether 42.
or not people have children is important.
Of the explained part of the pay gap, only 31% can be attributed to individual characteristics such as 43.
education, work experience, years of service in the company and nationality.

- 74 -

- 75 -
Policy recommendations
This fourth pay gap report indicates that the pay difference between women and men in our country is on a
slightly downward trend. However, this positive note cannot disguise the fact that there are structural
problems whose origins stem from a highly disparate range of causes. By defi nition therefore, any policy that
focuses on narrowing the pay gap is a long-term project for which both government departments and the
social partners need to accept their share of the responsibility.
In last year’s report, we made a number of practical suggestions for closing the pay gap. These recommen-
dations from the Institute for the Equality of Women and Men and the Federal Public Service for Employment,
Labour and Social Dialogue remain valid in full. They can be summarised as follows :
All job classifi cations in the various sectors and companies need to be screened in terms of 1.
their gender neutrality – and then be adjusted, if required.
Stereotypical study choices need to be discouraged, including by promoting awareness of the 2.
fundamental equality of women and men, in the way youngsters are educated from an early
age.
The employment mediation services (VDAB, Forem, Actiris, ADG) need to watch and ensure that 3.
all of their measures are focused on women as well as on men.
These services must also ensure that vacancies are offered to both men and women at all 4.
times.
Thresholds that make it diffi cult to access to the labour market must be removed.5.
With this in mind, the unemployment trap needs to be tackled, especially for the partners of 6.
individuals living on replacement income.
A longer period of parental leave is necessary and should also be better divided across both 7.
partners.
Good-quality, affordable childcare must become a right.8.
In order to break through the glass ceiling, measures must be taken to guarantee better re-9.
presentation of women on company boards, at a senior level in government institutions, social
organisations and companies.
When training is provided to employees, both internally and outside the company, women and 10.
men must be taken into consideration equally.
Greater awareness is required regarding the input and opportunities in individual pay negotia-11.
tions, both for employees and employers, as well as for women and men alike.
Poorly educated women, migrant women, single mothers, etc. are faced with a dual disadvan-12.
tage on the labour market. Consequently, measures to do away with the disadvantage of these
vulnerable groups are of fundamental importance, meaning that the gender mainstreaming of
the policy also needs to be monitored.
A range of the statistical tools used need to be strengthened so that the pay gap can be focused 13.
on better.
This autumn, the social partners will be negotiating again on an interprofessional agreement. The Minister
of Labour and Equal Opportunities has expressed the wish that this agreement becomes the start for a
multiyear plan for approaching the pay gap by reviewing the job classifi cations that form the base for the
method of setting wages in the sectors. The partners are also being asked to ensure the gender-neutrality
of all sectors by 2016 in a further effort to close the pay gap. We hope that the social partners tackle this
challenge head-on and share the aims of the minister. The issue of bringing the status of blue-collar workers
and white-collar employees into line is also on the table, which offers an additional opportunity. It will also
be necessary to remove this outmoded distinction over time in order to restructure in depth the job classifi -
cations and the sliding pay scales attached to them. Naturally the gender perspective needs to be an integral
part of the debate.

- 76 -
Government departments should be able to confi rm the effort of the social partners by developing a plan to-
gether across all policy levels gradually to do away with segregation on the labour market. The combination of
a strong interprofessional accord and a clear-cut joint commitment from the federal government, the regions
and communities should make it clear that our country wishes to play a strong pioneering role in tackling the
pay gap – at a time when Belgium will be taking on the presidency of the European Union. And in so doing, the
pay gap will once again be placed high on the European agenda.
Finally, we wish again to ask for attention to be focused on the need to have suffi cient data available so that pay
differences can be highlighted and hence be combated effectively. It is also highly desirable for a breakdown
by gender to be introduced into the various areas within the social balance sheet. This applies in particular to
the heading of «amount of benefi ts over and above basic pay». Indeed, highlighting these benefi ts, which in
many cases constitute a major part of total remuneration, remains a problem. Nevertheless, the fi scal data
included in this report indicates it is a highly relevant issue. The national surveys that exist at the moment
are not able to provide an answer. The reports on equal opportunities that business still needs to draft may
well provide information on a company level, but they do not lend themselves well to systematic processing,
so that they are unable to fi ll in any of the gaps in terms of statistics.
Once again this report would not have been possible without the active and expert contribution from sources
such as the Directorate-General for Statistics and Economic Information at the FPS Economy and the Fe-
deral Planning Bureau. The basic tool remains the unsurpassed Structure of Earnings Survey. This survey
is conducted annually in Belgium and provides signifi cant added value for analysing the pay gap – as well as
for many other things as well. Nevertheless we are disappointed that the decision has been taken to include
sectors M, N, O (education, healthcare and the socio-cultural sector) of the NACE Rev. 1 classifi cation in the
survey only every four years. As last year’s report shows, the data from these sectors, where comparatively
many women work, provides signifi cant added value.

- 77 -
Explanatory glossaryDGSEI: Directorate General for Statistics and Economic information of the FPS Economy, formerly called the
National Statistical Institute. Website: www.statbel.fgov.be
Employment rate: Ongoing random survey conducted annually by the DGSEI among households in Belgium.
The survey gauges the fi gures for employment, unemployment and non-working is part of Eurostat’s Euro-
pean Labour Force Survey (LFS).
Employment rate: The percentage of the working age population (15 to 64 years of age) that is actually wor-
king
EU-SILC: The SILC survey harmonised at a European level.
Glass ceiling: The diffi cult access to higher positions by women, the reduced chances of promotion for
women.
Median: The mid-point in a given sequence of numbers. The median is sometimes used as an alternative to
the average, because it is less sensitive to extreme values.
NACE nomenclature: International classifi cation system for sectors. A new NACE nomenclature has been
used since 2008, called ‘NACE Rev.2’. ‘NACE Rev. 1.1’ is the NACE classifi cation used in the 2007 survey year
and still frequently referred to. (see Annex 1)
NSSO (National Social Security Offi ce): Institution that manages the social security contributions of
employers and employees, and has statistical data on wages derived from these contributions.
NSSOPLA (National Social Security Offi ce for Provincial and Local Authorities): Institution that manages the
social security contributions of provincial and local authorities, and has statistical data on wages derived from
these contributions for this category of government employees.
Panel Study on Belgian Households (PSBH): Survey of Belgian households, predecessor of the SILC survey.
Pay gap: The difference between the average wages of men and women expressed as a percentage of male
pay, also known as gender pay gap.
Percentile: A point in a regulated series indicating a one-hundredth part. When, for instance, all wages are
ranked from low to high, the fi rst percentile corresponds to the wages where 1% of workers earn less, and
99% more. This report uses the 5th percentile. This corresponds with wages where 5% are lower and 95%
higher. The 85th percentile refers to wages where 85% are lower and 15% higher. The median is the 50th
percentile, or the middlemost value, to be more precise.
Random sample: A random selection of a part of the population studied in order to conduct research. In ge-
neral, the higher the number of people questioned, the more reliable the data will be.
Segregation: The phenomenon whereby the labour market is divided into different parts, which are not always
easy to transfer to and from. Horizontal segregation refers to the division in sectors and occupations; vertical
segregation to the distribution into different levels.

- 78 -
Structure of Earnings Survey (SES): Random survey on earnings conducted annually by the DGSEI among
a large number of Belgian companies. Up until 2005, this survey was conducted only in sectors C-K of the
NACE nomenclature, hence only in industry and market services. Since 2006, healthcare, education and the
socio-cultural sector have been included. This survey is conducted every four years (2006, 2010, etc.) in all
European countries.
SILC (Statistics on Income and Living Conditions): A random sample survey on income and poverty conducted
annually by the DGSEI among Belgian households. The same survey is conducted, likewise annually, in all
European countries.
Indicator: A way of quantifying a certain phenomenon in fi gures. Agreements are made about indicators at a
European level so that comparable data can be obtained.
ISCO nomenclature: International Standard Classifi cation of Occupations. The classifi cation can be refi ned
further by including more number codes. For instance, 2 stands for scientifi c staff; 23 is a subcategory and
stands for teaching staff, 231 for university professors and non-university institutions of higher education, 232
for secondary school teachers, and so forth (see Annex 2)
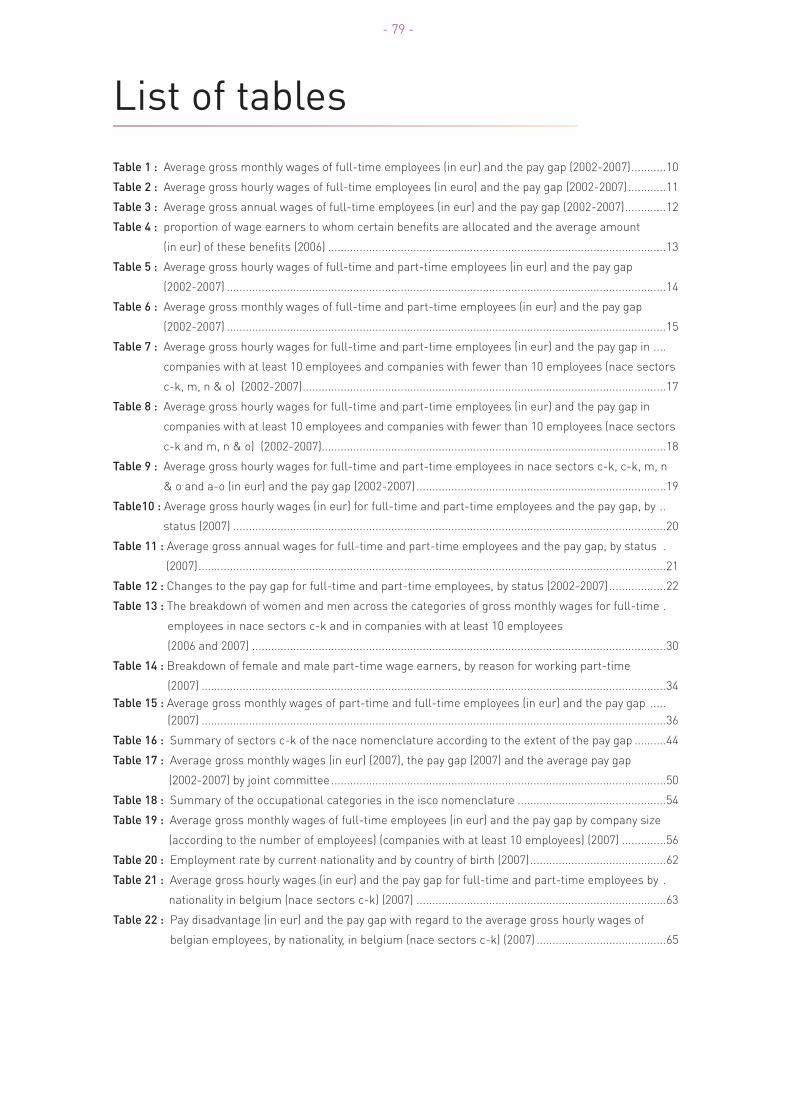
- 79 -
List of tables Table 1 : Average gross monthly wages of full-time employees (in eur) and the pay gap (2002-2007) ...........10
Table 2 : Average gross hourly wages of full-time employees (in euro) and the pay gap (2002-2007) ............11
Table 3 : Average gross annual wages of full-time employees (in eur) and the pay gap (2002-2007) .............12
Table 4 : proportion of wage earners to whom certain benefi ts are allocated and the average amount
(in eur) of these benefi ts (2006) ...........................................................................................................13
Table 5 : Average gross hourly wages of full-time and part-time employees (in eur) and the pay gap
(2002-2007) ...........................................................................................................................................14
Table 6 : Average gross monthly wages of full-time and part-time employees (in eur) and the pay gap
(2002-2007) ...........................................................................................................................................15
Table 7 : Average gross hourly wages for full-time and part-time employees (in eur) and the pay gap in ....
companies with at least 10 employees and companies with fewer than 10 employees (nace sectors
c-k, m, n & o) (2002-2007) ...................................................................................................................17
Table 8 : Average gross hourly wages for full-time and part-time employees (in eur) and the pay gap in
companies with at least 10 employees and companies with fewer than 10 employees (nace sectors
c-k and m, n & o) (2002-2007).............................................................................................................18
Table 9 : Average gross hourly wages for full-time and part-time employees in nace sectors c-k, c-k, m, n
& o and a-o (in eur) and the pay gap (2002-2007) ...............................................................................19
Table10 : Average gross hourly wages (in eur) for full-time and part-time employees and the pay gap, by ..
status (2007) .........................................................................................................................................20
Table 11 : Average gross annual wages for full-time and part-time employees and the pay gap, by status .
(2007) ....................................................................................................................................................21
Table 12 : Changes to the pay gap for full-time and part-time employees, by status (2002-2007) ..................22
Table 13 : The breakdown of women and men across the categories of gross monthly wages for full-time .
employees in nace sectors c-k and in companies with at least 10 employees
(2006 and 2007) ...................................................................................................................................30
Table 14 : Breakdown of female and male part-time wage earners, by reason for working part-time
(2007) ...................................................................................................................................................34
Table 15 : Average gross monthly wages of part-time and full-time employees (in eur) and the pay gap .....
(2007) ...................................................................................................................................................36
Table 16 : Summary of sectors c-k of the nace nomenclature according to the extent of the pay gap ..........44
Table 17 : Average gross monthly wages (in eur) (2007), the pay gap (2007) and the average pay gap
(2002-2007) by joint committee ..........................................................................................................50
Table 18 : Summary of the occupational categories in the isco nomenclature ...............................................54
Table 19 : Average gross monthly wages of full-time employees (in eur) and the pay gap by company size
(according to the number of employees) (companies with at least 10 employees) (2007) ..............56
Table 20 : Employment rate by current nationality and by country of birth (2007) ...........................................62
Table 21 : Average gross hourly wages (in eur) and the pay gap for full-time and part-time employees by .
nationality in belgium (nace sectors c-k) (2007) ...............................................................................63
Table 22 : Pay disadvantage (in eur) and the pay gap with regard to the average gross hourly wages of
belgian employees, by nationality, in belgium (nace sectors c-k) (2007) .........................................65

- 80 -

- 81 -
List of graphsGraph 1 : Average gross monthly wages of full-time employees (in eur) (2007) ...............................................10
Graph 2 : pay gap based on the average gross hourly wages for full-time and part-time employees, by status
(2007) ....................................................................................................................................................21
Graph 3 : Pay gap based on the gross annual wages for full-time and part-time employees,
by status (2007) ....................................................................................................................................22
Graph 4 : Average gross monthly wages (in eur) for full-time and part-time employees in industry
(1972-2007) ...........................................................................................................................................23
Graph 5 : Pay gap based on the gross monthly wages of full-time and part-time employees in industry
(1972-2007) ...........................................................................................................................................24
Graph 6 : Average gross hourly wages for full-time and part-time employees in industry (in eur)
(1960-2007) ...........................................................................................................................................24
Graph 7 : Pay gap based on the gross hourly wages of full-time and part-time employees in industry
(1960-2006) ...........................................................................................................................................25
Graph 8 : Share of women and men in the total wages bill (2007).....................................................................26
Graph 9 : Share of women and men in the total number of paid working days (2007) .....................................26
Graph 10 : Share of women and men among employees (2007) ........................................................................27
Graph 11 : Share of women and men among employees, in paid working days and within the total wages
bill (2007) ............................................................................................................................................27
Graph 12 : the breakdown of women and men across the categories of gross monthly wages for full-time
employees in nace sectors c-k and in companies with at least 10 employees (2007) ....................29
Graph 13 : Breakdown of female and male part-time wage earners, by reason for working
part-time (2007) ..................................................................................................................................35
Graph 14 : Pay gap based on gross hourly wages for full-time and part-time wage earners (2007) ...............35
Graph 15 : Employment rate by age category (2007) ..........................................................................................36
Graph 16 : Average gross hourly wages (in eur), by age category of full-time working men and women
in nace sectors c-k (2007) ..................................................................................................................37
Graph 17 : average gross hourly wages (in eur), by age category for part-time working men and women in
nace sectors c-k (2007)......................................................................................................................38
Graph 18 : Pay gap by age and seniority among 25 to 30-year-olds in nace sectors c-k (2007) ......................39
Graph 19 : Employment rate by level of education (2007) ..................................................................................40
Graph 20 : Average gross hourly wages (in eur) for full-time working men and women, by level of
education (2007) .................................................................................................................................41
Graph 21 : Average gross hourly wages (in eur) for part-time working men and women, by level of
education (2007) .................................................................................................................................42
Graph 22 : Average of gross monthly wages of full-time employees (in eur) by company size (according to
the number of employees) (companies with at least 10 employees) (2007) ....................................57
Graph 23 : Average gross hourly wages, by marital status (in eur) (2007) ........................................................58
Graph 24 : Employment rate by family type (2007) .............................................................................................59
Graph 25 : Pay gap by marital status (2007) .......................................................................................................60
Graph 26 : Average gross hourly wages by family type (2007) ............................................................................60
Graph 27 : Pay gap by family type (2007) .............................................................................................................61

- 82 -
Graph 28 : Employment rate by current nationality and by country of birth (2007) ...........................................62
Graph 29 : Average gross hourly wages (in eur) (nace sectors c-k) for full-time and part-time employees, by
nationality, in belgium (2007) ...............................................................................................................................64
Graph 30 : The explained and unexplained part of the pay gap in gross hourly wages
(in eur and percentages) (2007) .........................................................................................................68
Graph 31 : Decomposition of the pay gap – subdivision of the explained part of the pay gap (2007) ...............69

- 83 -
Annex 1:
NACE Rev1 nomenclature
letter
code
number
codeSector
A Agriculture, hunting and forestry
B Fishing
CMineral extraction
14 Other mineral extraction (not containing energy and non-metallic)
D
Industry
15 Imanufacture of food products and beverages
16 Manufacture of tobacco products
17 Manufacture of textiles
18 Manufacture of clothing and fur
19 Leather industry and manufacture of shoes
20 Timber industry and manufacture of items made from wood, cork, reed and
wickerwork
21 Paper and cardboard industry
22 Publishing, printing and reproduction of recorded media
23 Manufacture of coke, refi ned petroleum products and nuclear fuel
24 Chemicals industry
25 Rubber and plastics industry
26 Manufacture of other non-metallic mineral products
27 Metallurgy
28 Manufacture of metal products
29 Manufacture of machines, apparatus and equipment
30 Manufacture of offi ce machines and computers
31 Manufacture of electrical machines and equipment
32 Manufacture of audio, video and telecommunications equipment
33 Manufacture of medical equipment, precision and optical instruments, watches and
clocks
34 Manufacture and assembly of motor vehicles, trailers and semi-trailers
35 Manufacture of other transport equipment
36 Manufacture of furniture, other industry
37 Recovery of recyclable waste
E
Production and distribution of electricity, gas and water
40 Production and distribution of electricity, gas, steam and hot water
41 Collection, purifi cation and distribution of water
F 45 Building industry
G
Whole and retail; repair of motor vehicles and household items
50 Sale and repair of motor vehicles and motorcycles; retail of engine fuels
51 Wholesale and commission trade, excluding trade in motor vehicles and motorcycless
52 Retail, motor vehicles and motorcycles; repair of consumer items
H 55 Hotels and restaurants

- 84 -
I
Transport, storage and communication
60 Transport on land
61 Transport over water
62 Aviation
63 Transport support activities
64 Post and telecommunications
J
Financial institutions
65 Financial institutions
66 Insurance
67 Auxiliary companies connected to fi nancial institutions
K
Property, rental and services to companies
70 Rental and trade in property
71 Rental without operating personnel
72 IT and related activities
73 Research and development
74 Other business services
L Government
M 80 Education
N 85 Healthcare and social services
O
Community amenities, socio-cultural and personal services
90 Collecting and processing wastewater and waste
91 Miscellaneous associations
92 Recreation, culture and sport
93 Other services
P Private households with employees
Q Extraterritorial organisations and bodies

- 85 -
Annexe : ISCO nomenclature
ISCO Occupation
12 CEOs and board members
13 Directors and managers
21 Physicists, chemicals, engineers and science-related occupations
22 Specialists in organic sciences, doctors, nursing supervisors and midwives
23 Teaching staff
24 Other professionals (including lawyers, social scientists, artists)
31 Technicians in physics and technological disciplines
32 Technicians in organic and health sciences
33 Intermediary occupations education
34 other intermediaries
41 Secretaries, accountants and staff logistics
42 Service counter employees and cashiers
51 Vupervisory and surveillance staff
52 Models, sales people and demonstrators
71 Building labourers
72 Metal-workers and mechanics
73 Civil servants
74 Other workers
81 Assembly operators
82 Operators of industrial installations
83 Operators of transport and mobile equipment
91 Street vendors, cleaning staff, concierges and similar
93 Labourers in mining, construction, manufacturing and transport

- 86 -

- 87 -
Annex 3 :List of joint committees
Blue-colour workers
100 Auxiliary joint committee for blue-collar workers
109 Clothing and garment-manufacturing industry
111 Metal, machinery and electrical construction
112 Garage industry
115 Glass industry
116 Chemical industry
117 Petroleum industry and trade
118 Food sector
119 Trade in foodstuffs
120 Textile industry and knitwear
121 Cleaning
124 Construction
126 Upholstery and woodwork
130 Printing, graphic arts and daily newspapers
136 Paper and cardboard processing
140 Transport and logistics
149 Sectors related to metal, machinery and electrical construction
149.04 Joint sub-committee for the metal trade
302 Hotel industry
306 Insurance sector
310 Banks
311 Large retailers
White-collar workers
200
201 Auxiliary joint committee for white-collar workers
202 Self-employed retailers
207 White-collar workers from food retailing
209 White-collar workers from the chemicals industry
210 White-collar workers from the fabricated metal products industry
211 White-collar workers from the steel industry
214 White-collar workers from the petroleum industry and trade
215 White-collar workers from the textile industry and knitwear
218 White-collar workers from clothing and ready-to-wear
220 National auxiliary joint committee for white-collar workers

- 88 -
221 White-collar workers from the paper industry
222 White-collar workers from the paper and cardboard processing industry
226 White-collar workers from international trade, transport and logistics
302 Hotel industry
306 Insurance sector
307 Brokerage and insurance agencies
310 Banks
311 Large retailers
315.02 Joint sub-committee for airlines