the gender implications of macroeconomic policy and performance
TRANSCRIPT

UNRISD UNITED NATIONS RESEARCH INSTITUTE FOR SOCIAL DEVELOPMENT
The Gender Implications of Macroeconomic
Policy and Performance in Malaysia
Anita Doraisami ([email protected])
April 2005 Revised Draft
Prepared for the UNRISD report
Gender Equality: Striving for Justice in an Unequal World
DRAFT WORKING DOCUMENT Do not cite without the author’s approval
I wish to thank Ann Zammit for her incisive comments and suggestions which significantly improved this paper. I remain solely responsible for all remaining errors.

The United Nations Research Institute for Social Development (UNRISD) is an autonomous agency engaging in multidisciplinary research on the social dimensions of contemporary problems affecting development. Its work is guided by the conviction that, for effective development policies to be formulated, an understanding of the social and political context is crucial. The Institute attempts to provide governments, development agencies, grassroots organizations and scholars with a better understanding of how development policies and processes of economic, social and environmental change affect different social groups. Working through an extensive network of national research centres, UNRISD aims to promote original research and strengthen research capacity in developing countries. Current research programmes include: Civil Society and Social Movements; Democracy, Governance and Human Rights; Identities, Conflict and Cohesion; Social Policy and Development; and Technology, Business and Society. A list of the Institute’s free and priced publications can be obtained by contacting the Reference Centre.
UNRISD, Palais des Nations 1211 Geneva 10, Switzerland
Tel: (41 22) 9173020 Fax: (41 22) 9170650
E-mail: [email protected] Web: http://www.unrisd.org
Copyright © United Nations Research Institute for Social Development (UNRISD). This is not a formal UNRISD publication. The responsibility for opinions expressed in signed studies rests solely with their author(s), and availability on the UNRISD Web site (http://www.unrisd.org) does not constitute an endorsement by UNRISD of the opinions expressed in them. No publication or distribution of these papers is permitted without the prior authorization of the author(s), except for personal use.
2

CONTENTS Page
1 Introduction...................................................................................................... 5
2 An Overview of Malaysia’s Political Economy............................................. 7 2.1 Independence and the Lassiez-Faire Approach (1957–1969)............... 7 2.2 The NEP and the rise of Dirigisme (1970–1985).................................. 9 2.3 The High Growth era (1987–1996).................................................... ... 14 2.4 The Crisis and Post–Crisis Era (1997–2000)......................................... 17
3 Social Policy and Women’s Well-Being in Malaysia................................... 18 3.1 Social Security...................................................................................... 20 3.2 Health.................................................................................................... 22 3.3 Education............................................................................................... 24
4 The Gender Implications of Macroeconomic Policy.................................... 26 4.1 The Gender Implications of Previous Macroeconomic Policy Policy Regimes...................................................................................... 26 4.2 Trade and FDI Policy............................................................................ 29 4.3 Fiscal Policy........................................................................................... 32
5 Conclusion........................................................................................................ 32
Tables
1 Sectoral Breakdown of Development Expenditure, 1956–1970........................ 35 2 Federal Government Current Revenue............................................................... 35 3 Structure of Manufactured Exports in Malaysia, 1968–2000............................ 36 4 Sectoral Distribution of Employment in Malaysia, 1957–2000........................ 36 5 Sectoral Distribution of Exports in Malaysia, 1956–2000................................ 36 6 Sectoral Distribution and Growth of GDP in Malaysia, 1960–2000................. 37 7 Sectoral Breakdown of Development Expenditure, 1971–1985....................... 37 8 Sectoral Breakdown of Development and Current Expenditure Second Malaysia Plan, 1971–1975................................................................................ 38 9 Sectoral Breakdown of Development and Current Expenditure Third Malaysia Plan, 1976–1980................................................................................ 39 10 Sectoral Breakdown of Development and Current Expenditure Fourth Malaysia Plan, 1981–1985................................................................................ 40 11 Public Development Spending, 1971–1985...................................................... 41 12 Net Capital Flows, Inflation and Unemployment Rates................................... 41 13 Selected Stock Market Indicators in Malaysia, 1990–1996.............................. 42 14 Commercial Bank Lending and Advances to Selected Sectors........................ 42 15 Sectoral Breakdown of Development Expenditure, 1986–1995....................... 43 16 Sectoral Breakdown of Development and Current Expenditure Fifth
Malaysia Plan, 1986–1990................................................................................ 44 17 Sectoral Breakdown of Development and Current Expenditure Sixth Malaysia Plan, 1991–1995................................................................................ 45
3

18 Selected Economic Indicators in Malaysia......................................................... 46 19 Sectoral Breakdown of Development and Current Expenditure Seventh Malaysia Plan, 1996–2000................................................................................. 47 20 Share of Government Expenditure on Social Policies, Annual Average................................................................................................. 47 21 Infant and Maternal Mortality Rates.................................................................. 48 22 Fertility and Life Expectancy Rates................................................................... 48 23 Literacy Rates in Malaysia................................................................................. 48 24 Labour Force Participation Rate by Sex, 1957–2000........................................ 48 25 Percentage Distribution of Employment by Sector and Gender, 1957–2000......................................................................................................... 49 26 Malaysia: Manufacturing Employment, 1980–1999......................................... 50 27 Male and Female Labour Force Participation Rate by Per Capita Gross National Income (US Dollars), 2001................................................................ 50 28 Labour Force Participation Rates by Age Gender and Ethnicity, 2002.................................................................................................................. 51 29 Percentage Distribution of Persons outside the Labour Force by Gender and Reasons for not Seeking Work, 2002........................................... 51 30 Labour Force Participation Rate (%) by Educational Attainment and Gender, 2002.............................................................................................. 51 31 Malaysia: Employment by Manufacturing Sub-Sector and Gender, 1968–1999........................................................................................................ 52 32 Share of Female Workers in Manufacturing, 1971–1997................................ 53 33 Employment by Sector, 1994–1999................................................................. 53 34 Number of Registered Retrenchments by Sector, 1998................................... 54 35 Registered Unemployed by Gender, 1994–1999............................................. 54 36 Malaysia: Manufacturing Wages by Gender, 1983–1997............................... 54
Bibliography............................................................................................................... 56
4
1. Introduction
Prior to the Asian crisis, Malaysia was one of the fastest growing economies in the world and was on track to achieving developed country status by the year 2020. Since Independence in 1957, the Malaysian economy has grown by an average of seven percent per year. Over this period the Malaysian economy was transformed from an agricultural exporter of primary commodities to one where manufactured exports comprise more than eighty percent of exports. Malaysia also made considerable inroads into poverty reduction generally as well as in reducing income imbalances among its multi-ethnic population. Today, Malaysia is a multi-ethnic society with a population (in 2000) of approximately 23 million. The Malaysian population is composed of three main ethnic groups with Malays or Bumiputeras comprising 63.3 percent, Chinese 26.5 percent and Indians 7.6 percent. Since the implementation of the New Economic Policy in 1970 the pursuit of greater equality of incomes and opportunities have played an important role in determining the course of economic development and macroeconomic policy in Malaysia. While the progress towards the achievement of greater inter-ethnic income equality has been meticulously tracked in succesive development plans, little is known of about whether greater gender equality was also achieved during this period of rapid economic growth and profound structural transformation. Gender equality is not only a fundamental human right but as the World Bank (2004) notes countries that reduce gender inequality reap significant rewards in terms of faster economic growth and lower poverty rates. This study aims to examine more fully the relationship between past macroeconomic regimes on the well being of women and gender equality. It focuses on the gender implications of the broad effects of macroeconomic policy as well as specific aspects of macroeconomic policies. The possible feedback effects of gender relations/gender inequality on macroeconomic policy will also be explored. The Sixth Malaysia Plan (1991–95) undertook to support the objectives of the National Policy for Women which was launched in 1989. It objectives are to ensure equitable sharing in the acquisition of resources and information as well as access to opportunities and benefits of development for both men and women. It also seeks to integrate women in all sectors of national development in line with their abilities and needs, in order to improve the quality of life, eradicate poverty, abolish ignorance and illiteracy and ensure a peaceful and prosperous nation. The goal of achieving greater inter-ethnic economic parity between the various races have been precisely set out by the NEP. Targets were set to achieve them and successive development plans meticulously tracked the fulfillment of these over time. The same cannot be said about the pursuit of greater gender equality.
5
Development Planning documents in Malaysia have included a chapter on Women in Development since the Sixth Malaysia Plan. From the Sixth Plan until the Eighth Plan the focus of this chapter has been on the employment distribution women in the workforce by occupation and sector. A short summary is also made of the gains that women have achieved in the areas of health and education. However there is lack of gender disaggregated data on wide range of indicators in Malaysia and to a large extent limitations are imposed on the extent of the analysis reported in this paper because of this. Section two of this paper provides an overview of Malaysia's evolving political economy, and is divided into four periods; Independence and the Laissez-Faire Approach (1957–1969), the NEP and the Rise of Dirigisme (1970–1985) the High Growth Era (1986–1996) and the Crisis and Post Crisis Era (1997–2001). For each of the periods above economic policy will also be viewed within context of the overall framework of national development policies, plans and objectives. Section three presents an overview of social policy and its implications for the well being of women in Malaysia. Section four presents an assessment of how past macroeconomic policies were helpful in advancing women’s well being and contributing to greater gender equality. Section five concludes by discussing the lessons that can be drawn from the Malaysian experience as well as future directions for research. The findings in this paper indicate that women benefited from the implementation of the NEP particularly in terms of seeking to eliminate the identification of ethnic background with occupation. Expenditure on education was high and women made gains in terms of literacy rates and participation at all levels of education. However in spite of achieving gender equity in education far fewer women are employed in higher level occupations than men. Foreign Direct Investment has had a profound impact on both the economy and women’s employment in the manufacturing sector. Here the prohibition of industry based unions have most likely contributed to a trade off between greater female participation in the labour force and gender wage equality. More recently increases in female labour force participation has stagnated, while immigrant labour has increased during the era of high economic growth. This suggests that perhaps to some extent female labour may have been substituted with migrant labour. Generally this indicates that high growth rates alone will not ensure an improvement in the well being of women. More research is needed to explore these links.
2. An Overview of Malaysia’s Political Economy
2.1 Independence and the Lassiez-Faire Approach (1957–1969)
The British colonial legacy had a number of lasting impacts on Malaysia. First, a dual economy resulted in a large plantation and mining sector (owned mainly by British interests) existing alongside peasant smallholdings (Chan, 1986). The dominance of foreign investment coincided with an economy dominated by two commodities, rubber and tin. A second legacy of the colonial era was the dramatic demographic change, which led to the creation of a multi-ethnic society.
6
To meet the high production schedules in the mining and plantation sectors respectively the colonial government organised a massive inflow of cheap immigrant labour from China and India, The influx of migrant labour resulted in the segregation of these various groups by geographical location, economic occupation and political roles. Further 80 percent of Malays resided in rural areas and two-thirds, were below the poverty line. (Bussink, 1980), while Malay earnings were only half the average non-Malay income (Snodgrass, 1980). The Malays remained largely marginal to the growing capitalist sector with the elite integrated into the colonial state apparatus and the masses remaining in the countryside as peasants. Emerging business opportunities were mainly taken up by the more urbanized and better connected Chinese (Jomo, 1990). Ethnic considerations were to play an important role in determining the course of economic development and macroeconomic policy in Malaysia. At the time of Independence the Alliance- a coalition of the United Malay National Organisation (UMNO) the Malaysian Chinese Association (MCA) and the Malayan Indian Congress (MIC) formed the government of the new nation. Before the Alliance came to power a series of compromises were reached (later known as the ‘bargain’) between UMNO and the MCA. Essentially it amounted to the safeguarding of Chinese economic interests in return for Malay political supremacy. During this period there were three development plans (see Table 1). Planning in Malaysia began with the Draft Development Plan (1950-55). The draft development plan reflected the underlying commitment of the state to British plantation and mining interest. Hence development expenditure heavily favoured export and urban interests with priority allocated to providing economic infrastructure. Expenditure on social services were generally considered by the colonial authorities to be extravagant, while considerable resources were directed to fighting the communist insurgency. There was also emphasis on equating development expenditure to revenue availability, as there was concern about Britain’s balance of payments. These features of the Draft Development Plan were echoed in the development plans during this period. The First Five Year (1956–60) placed most of the emphasis was on urban infrastructural development. This consumed 52 percent of the budget, while public spending in the social sector had low priority. The heavy bias in urban infrastructure reflected the views of the colonial government of a dynamic urban sector inducing rural development via a trickle down process (Jesudason, 1989, p.50). In the Second Five Year Plan (1961–5) due to greater political pressure to improve the welfare of the Malay and primarily rural section of the Malaysian population nearly half of planned investment went to agriculture and a higher percentage of funds for infrastructure and social services were allocated to the rural sector. As Rudner (1975) explains under the Malaysian constitution rural areas are given a disproportionately large representation in parliament and rural Malays effectively determined the government of the day. The orientation now switched to raising rural incomes so that the domestic market could be enlarged and thus enhance industrial development. To stimulate rural incomes and productivity the government made a concerted effort to
7

promote land development schemes in rubber and oil palm for settlers and subsidized the replanting of higher yielding varieties of rice by smallholders. Large irrigation projects were also started and the level of social services and public utilities to the rural sector was lifted. The First Malaysia Plan (1966–70) continued broadly with the principles of expanded government and rural development. In this period government revenues were mainly composed of indirect taxes and import duties were the largest single source of revenue (Table 2). In spite of the fact that three development plans were implemented during this period, it has been asserted that during this period a largely laissez-faire approach was pursued (see Jomo, 1990, Searle, 1999, Jesudason, 1989). As Jomo (1990) explains planning during this period was a relatively unsophisticated process and plans were little more than programs for private capital formation. Searle (1999) argues that the bargain constrained the role of the state in expanding Malay ownership of the economy and that it shaped the laissez-faire policies that the government followed. He also asserts that this outcome was sustained by the power and personality of the Malaysia’s first Prime Minister, Tunku Abdul Rahman. Further Snodgrass (1980) contends that the State had a benign attitude to foreign ownership which was due to a preference for foreign capital to Chinese capital. In 1970 foreigners continued to control three-quarters of the corporate capital in agriculture and mining, as well as seventy percent of the export trade. In the meantime Chinese enterprises generally prospered in the 1960s. A number of Chinese businesses grew into large and diversified conglomerates and substantial gains were made in property and banking (Tan, 1982). At independence foreign banks were the most significant actors in the financial system. With the establishment in 1959 of Bank Negara Malaysia (BNM), Malaysia’s central bank, and its support for domestic banking activities Chinese banks flourished (see Tan, 1982). Increased government spending on infrastructure including rural development primarily aimed at the Malays also provided Chinese contractors and other businesses with opportunities for growth and profit. Chinese businesses particularly small and medium level firms seldom employed Malays. Although some Chinese firms did employ Malays as functional directors to assist in their dealings with government, such directors exerted little influence on the day to day affairs of such companies. In short Malays were generally marginalized from Chinese businesses and viewed them as inimical to their own aspirations (Searle, 1999). Further they felt marginalized from the modern sector. They were over-representation in poorly paid occupations in agriculture and under-representation in ownership of share capital. After more than a decade of independence Malays and Malay interest held only 2.4 percent of share capital in limited companies while foreigners and the Chinese owned 63.3 percent and 34 percent respectively. In terms of industrial strategy the government began industrial promotion with the enactment of the Pioneer Industries Ordinance in 1958. This strategy sought to encourage
8

foreign investment in production, assembly and packaging plants to supply finished goods previously imported from abroad with the inducement of tax exemptions for periods of between five to ten years. There was no ownership regulation and industry prioritization and foreign firms relocated operations to Malaysia to circumvent tariffs, enjoy tax holidays and increase domestic market share (Rasiah, 2001b). However due to the small domestic market, industrial growth slowed down after the period 1958–60. The share of manufacturing to GDP thus stayed around 9 percent between 1960 and 1965. In 1968 the emphasis shifted to export orientation when the Investment Incentives Act was enacted to encourage the expansion of manufactured exports. Following this shift to export orientation after 1968, import substitution gradually lost significance in terms of output and employment generation, though it continued to coexist with the former. During this period the manufactured exports sector was dominated by resource processing industries and smelted tin initially dominated this category accounting for 65.8 manufactured exports (see Table 3). During the 1960’s GDP at factor cost grew at 5.5 percent accompanied by inflation rates of about 1 percent. Between 1960 and 1970 agriculture consisting mainly of the cash crops of rubber, palm oil and timber decreased its share in GDP from 37 to 31 percent while manufacturing increased from 8.5 to 13 percent (Table 4). In terms of sectoral distribution of employment the share of agriculture declined from 59.6 percent in 1957 to 53.5 percent (Table 5) while in terms of exports the share of agriculture declined from 72.8 percent in 1956 to 70 percent in 1973 (Table 6). Although growth rates were high, with the labour force growing by more than 3 per cent per annum, the unemployment rate rose from about 6 per cent in 1962 to around 8 percent in 1970, while 49 percent of households were classified as being in poverty. When elections were held in 1969, there was substantial erosion of support for the government and racial riots broke out in the capital, Kuala Lumpur. Economic and social disparities between Malays and non-Malays were identified as the root cause of the riots. The civil disturbance led to fundamental economic and political change. A new development ideology, the New Economic Policy (NEP), which became the blueprint for all subsequent plans from 1970–1990, was to herald profound and lasting structural change in the Malaysian economy.
2.2 The NEP and the rise of Dirigisme (1970–1985)
The NEP’s ultimate goal was to foster national unity through the eradication of poverty and to restructure society in order to eliminate the identification of race with economic function and geographic location. In operational terms the target was a reduction of poverty from the 1970 period of 49 percent of households to 17 percent by 1990. In the case of restructuring goals, four areas were given specific attention: reduction of income imbalance among various ethnic groups and regions, restructuring of employment patterns by sector and occupation, the ownership and control of corporate sector limited companies share capital and the creation of a Malay commercial and industrial community.
9

With reference to the first mentioned area, the government’s main concern was raising the income level of Malays to match those of non-Malays and raising the less developed states’ income levels through implementing various public sector activities and programs. In terms of the second area, a greater share of Malays, particularly in the higher earning professional and technical group was envisaged in order to reflect the Malay share in the total population. The third main restructuring area was to increase the share of Malay corporate ownership to at least 30 percent. The share owned by other Malaysians were also targeted to increase from 34.3 percent to 40 percent while that owned by foreigners were to drop from 63.3 percent to 30 percent. The fourth restructuring objective was to increase Malay ownership of and participation in small scale commercial and service sectors. This was to be achieved either through assisting individual Malay entrepreneurs to become sole owners of an unincorporated enterprise i.e. to become proprietorships or forming partnerships with the state enterprises. As Crouch (2001) explains the government acting on behalf of Malays expanded its commercial and industrial operations as a way of creating openings for Malay businesses. It was envisaged that the increases in Malay businesses as well as the anticipated increase in the Malay ownership of the corporate sector would result in the establishment of a Malay commercial and industrial community- in short Malay capitalists. Under the NEP the ethnic considerations were embedded into development plans and marcoeconomic policy. Successive plan documents have tracked the progress of different ethnic groups in terms poverty alleviation and the four main areas of restructuring. During NEP state-owned enterprises and trust agencies were charged with the responsibility of mobilizing resources and accumulating capital on behalf of the Malay community as it was apparent that little change in ownership would be achieved by Malay capitalists alone. Trust agencies were to accumulate share capital on behalf of the Malay community with the ultimate aim of transferring it to individuals. The choice of this strategy meant that fiscal policy in Malaysia has been inextricably linked with the NEP and the distinction between the private and public sector became increasingly blurred over time. In the 1970s several state owned enterprises played a key role in achieving NEP objectives, many of which play the same role today. The more important of these include the State Economic Development Corporations (SEDCs) and Perbadanan Nasional Berhad (PNB). To increase Malay participation at the state level, (SEDCs) were set up in every state in the early 1970s. SEDCs were involved in the promotion of Malay entrepreneurship through partnerships with Malay firms as well as engaged directly in production of goods and services which provided employment and know how for Malays. Access to generous funds from the central government and easy availability of credit led to a proliferation of SEDC subsidiaries and their activities. SEDCs were involved in agriculture, construction, mining, manufacturing, property development and the expansion of cottage industry. Most of the SEDCs made massive losses. (see Crouch, 1996). PNB’s main function was to select and
10

acquire a portfolio of shares in companies with sound growth potential. In 1981, PNB set up Amanah Saham Nasional (ASN) with the purpose of buying PNB’s assets at cost and selling them to Malay individuals.
New policies and regulatory agencies were also established to achieve NEP targets. A major new instrument in this regard was the Industrial Co-ordination Act (ICA) of 1975. The intention of the Act was to control the growth of the manufacturing sector to ensure advancement of Malay capitalist interest in that sector (Jomo, 1986). The ICA stipulated that all manufacturers had to obtain a licence except those with capital of less than $100 000 and less than 25 full-time paid employees. An important feature of the Act was the wide powers given to the minister to grant or refuse a licence in the national interest. The national interest was defined as fulfilling NEP requirements of 30 percent Malay employment and ownership. It was not surprising that the ICA was vigorously opposed by both Chinese and foreign businesses. Small family run businesses were particularly hard hit and subsequently the Act was amended to exempt smaller firms. However, the Act retained its character as an instrument for restructuring. In terms of regulatory agencies, the key agencies were the Foreign Investment Committee (FIC) and the Capital Issues Committee (CIC) .The FIC was established in 1974 with the major objective of monitoring and controlling foreign takeovers of Malaysian companies or assets, to make sure that they conformed to NEP objectives. However, included in NEP guidelines was a provision covering any proposed acquisition of assets or interests exceeding one million ringgit in value whether by Malaysian or foreign interests. This, in effect, extended the FIC’s influence over domestic investments as well. The CIC’s main function was to ensure that all public companies that wished to apply for a public listing or a change in their equity structure complied with the NEP requirements of ownership of 30 percent equity for Malays. It also set the price of shares issued to Malay interest (including public enterprises) by private Chinese and foreign interest. This price was usually below the market price.
In 1960, there were only 22 non-financial public enterprises, (NFPEs) and only three of these had redistributive objectives. While the primary emphasis of most (NFPEs) in the pre-NEP period was on rural and infrastructure development, enterprises established after 1969 focused more on modern sector activities such as finance, commerce and industry, previously the exclusive domain of private enterprise. During the next two decades, the total number of enterprises owned by the federal and state governments grew considerably totalling 1010 by 1985 (see Rugayah, 1995). This inevitably led to a surge of public development expenditure in Malaysia. In terms of industrial policy as already noted the Investments Incentives Act was enacted in 1968 to promote export orientated industrialization. However the major impetus for export production occurred after the 1969 racial riots when employment creation became a major goal. By the early 1970s the Penang Development Corporation in particular made a concerted effort to target US electronics firms and this heralded the commencement of the rapid rise of the Malaysian manufacturing sector.
11

In 1972 the government opened free trade zones to ensure better security coordination and control for export processing activities, initially mainly attracting electronics and textile firms (Rasiah, 1995). The development of export processing industries in Malaysia was rapid in the 1970s. Warr (1996) noted that the importance of EPZ’s in Malaysia is unique among the developing countries establishing these zones and that their role as significant both in absolute terms and as a proportion of overall manufacturing activity. As part of the new policy orientation towards export-led industrialization trade union activity was restricted. In 1974 when global electronics companies started establishing assembly plants in Malaysia, apparently the government reached an understanding with foreign companies not to allow the unionization of workers. In 1976 when the Electrical Industry Workers Union attempted to enroll workers employed in the electrical and electronics industry, the registrar of trade unions ruled that it was unlawful for electronics workers to join unions. Attempts by electronics workers to form a union of their own under the umbrella of the Malaysian Trade Union Congress (MTUC) was repeatedly rejected by the government until 1988 when the formation of in-house unions limited to individual plants rather than a national union was permitted (see Athukorala, 2001). In the textile and garment industry the government also prevented the formation of a national union combining state and regional unions (Crouch, 1996: 225). In this period two main types of export-oriented industries developed; resource based and non resource based industries. Resource based industries involved the increased processing of older (rubber and tin) and newer (palm oil and timber) primary commodities for export. Non resource based export industries have been more important in terms of growth and employment generation since the 1970s. The most dramatic growth has involved electrical and electronic components which have accounted for slightly more than half of total manufactured exports since the mid-1980s (see Table 2). As a result of the special provisions the textile and electronics sectors grew rapidly The electronics industry in general can be divided into three sub-sectors; industrial electronics (large computers robots and telecommunications equipment), consumer electronics (radios televisions, personal computers and VCRs) and components (for example, passive devices and semi-conductors). The overwhelming portion of Malaysia’s electronics industry has been in the assembly of semi-conductors using cheap labour Jesudason (1989). By 1978 Malaysia had become the largest producer of semi-conductors in the world. In spite of these impressive statistics the most important contribution of the electronics industry was only in high levels of employment. From a mere 577 full time workers in 1970, employment increased to an estimated 83 000 in 1984. The electronics industry became the single most important absorber of low skilled labour and directly contributed to the lowering of the country’s unemployment rate in the 1970s and early 1980s. However there were several weaknesses in the electronics industry resulting from the enclave nature of its production. There were few backward and forward linkages. The consequences of over-concentration in the components sector were first, low wages for
12

workers because of the lower value-added activities and second the volatile nature of the industry in Malaysia because of rapid product obsolescence leading to severe retrenchments during recessions (see Rasiah, 2001b). In short the labour intensive export oriented manufacturing generated high levels of employment but failed to create many linkages in the economy. The government was relatively passive in formulating policies to lay the basis of a more dynamic electronics and textile sector; its main interest in that sector was the quick provision of employment while it concentrated on the creation of a Malay capitalist and managerial class under the NEP (Jesudason, 1989). State intervention during this period further increased when Dr Mahathir Mohamad assumed office in 1981. Mahathir was not been reticent about his plans for Malaysia and launched the Look East” policy soon after taking office. This policy sought to transform Malaysia into a newly industrialising economy (NIC), modelled on the Japanese and Korean economies. The Look East policy also led to state intervention in developing heavy industries through the establishment of the Heavy Industries Corporation of Malaysia (HICOM). HICOM pursued a heavy industrial program by collaborating with foreign, mainly Japanese, companies in developing a range of industries, including cement, steel and car manufacture. HICOM was the majority shareholder in these ventures. The government’s objectives included the development of a capital goods sector and greater linkages with the domestic economy, especially Bumiputera enterprises. HICOM’s activities were financed through massive foreign borrowing, mainly from official Japanese sources. HICOM would later incur massive losses. The government was able to support high levels of expenditure during the 1970s when economic growth was high, and commodity prices were buoyant. An important source of revenue which was established then (and remains so today) was Petronas, the National Petroleum Corporation. In 1974, the Petroleum Development Act was introduced which gave Petronas the exclusive right to explore and exploit Malaysia’s petroleum resources. Jesudason (1989) asserts that Malaysia’s petroleum policy gradually evolved into one of intensifying petroleum extraction and revenues for its NEP objectives. During this period there were three development plans (see Table 7). Between the Second Malaysia Plan and the Fourth Malaysia Plan development spending on agriculture declined in importance while spending shifted to Commerce and Industry reflecting the increased role of the state in this sphere. However in terms of total spending, i.e. development spending and current spending the allocation to the social sector was five percent greater compared to the economic sector for the Second Malaysia Plan. During the Third and Fourth Malaysia Plans allocation to the social sector and economic sector was almost equal. In terms of total government expenditure education has been the largest single item of expenditure (see Tables 8, 9 and 10). A surge in government spending and foreign borrowings also occurred during the Fourth Malaysia Plan as the state involvement in the economy increased rapidly (see Table 11). Between 1970 and 1986 direct taxes were the major source of revenue compared to indirect taxes in the previous period, the petroleum tax in particular was an important source of revenue.
13

In terms of the sectoral distribution of exports, manufactured exports now comprised fifty percent of exports while in terms of the structure of manufactured exports electrical machinery now made up 51.4 percent of manufactured exports. In terms of the sectoral distribution of GDP agriculture had declined to 20 percent of GDP while the share of manufactures rose to 19.6 percent. Growth rates were high between 1970 and 1980 averaging 7.9 percent per annum while the inflation rate averaged 5.5 percent. High growth rates also led to a decline in the incidence of poverty from 49 percent in 1970 to 29 percent in 1980 and 20.7 percent in 1984. In 1985, commodity prices of Malaysia’s major export earners slowed, but in 1986 they slumped in unison. The prices of tin, petroleum and rubber were almost half their 1984 values. Output and employment also contracted sharply in the electronics sector due to a cyclical downturn in that sector and Malaysia experienced its first recession recording a contraction in GDP of one percent in 1986. The unemployment rate which fell to 5.7 percent in 1980, increased to 7.6 percent in 1985 and to 8.1 percent in 1986. In 1985, the government set up the Central Information Collection Unit (CICU) to monitor the performance and financial position of public enterprises in which the government had a stake with a view to privatization. The severity of the recession provided a catalyst for radical policy reform.
2.3 The high growth era, 1987–1996
After the economic recovery in 1987, key economic blueprints reflected a down-play of the ethnic restructuring goals. The new approach was embodied in the National Development Policy (NDP) which replaced the NEP upon its expiration in 1990. The goal of the NDP was to transform Malaysia into a fully developed nation by the year 2020. This plan was also known as Wawasan (Vision) 2020 and growth, as opposed to restructuring, was emphasised as the primary goal of economic development policy. The target growth rate of 7 percent per annum needed to achieve Vision 2020 now replaced the 30 percent restructuring target, which was an obsessive force in economic policy-making during the 1970s and the early 1980s. Further the private sector was seen as the engine of growth, in contrast to the NEP where the state was instrumental in achieving the goals of economic policy. The crucial changes that took place in this period for the purposes of this study centre on privatising state owned enterprises and liberalising foreign investment guidelines. Privatisation in Malaysia was a major policy reversal as it involved a retreat of the state in promoting its goals. In 1985, the powerful Economic Planning Unit (EPU) issued its guidelines on privatisation. According to the EPU privatisation was needed due to the mismanagement of heavy industries. By 1986–87, virtually every major HICOM unit was in the red and extensive foreign debts incurred by state enterprises were draining government coffers. (Bowie, 1994:78) The public sector was also beset by other problems such as economic inefficiency, inferior goods and services, high costs, incompetence and limited innovation (Biddle and Milor, 1999). However EPU guidelines stipulated that Bumiputera interests were to be given priority when contracts were awarded to privatise
14

state owned assets. This meant that Bumiputera firms were more likely than non-Bumiputera or foreign firms to be awarded the contracts regardless of whether they tendered the most competitive bids. (Biddle and Milor, 1999:32). Jesudason (1989) maintains that state enterprise expansion resulted in little net increase in production and employment and that state companies rarely reached the point of commercial viability, with the success rate per dollar spent being very low. However, the state was unwilling, until the advent of privatisation, to undertake corrective action as they met the goal of ethnic restructuring. Further the failure of state enterprises in manufacturing and the failure of the state to forge a state-Chinese capitalist alliance compromised the nation’s ability to enhance its technological capabilities and develop a strong manufacturing base. The manner in which privatisation was implemented furthered the ethnic restructuring objectives of creating a Bumiputera business class. Gomez and Jomo (1997) have meticulously documented how patronage has figured prominently in the awarding of privatised projects, with the major beneficiaries of state assets being Bumiputera companies whose owners were closely connected to the dominant faction of the governing coalition, UMNO. An independent monitoring body to ensure proper implementation of the plan was also lacking. In the absence of institutional monitoring the CIC underpriced new shares, depriving the public sector of considerable revenue while enriching the new owners of former state enterprises (Gomez and Jomo, 1997). Other observers have also been sceptical about the depth of Malaysia’s privatisation program. Bowie (1991:140) notes that in most cases, despite forfeiting ownership stakes of 50 percent or more, the state has preserved its control over privatised concerns often by the sale of equity to quasi-state entities such as Petronas or the central bank. In other instances, the government retained control through the relatively widespread use of the Special Rights or Golden Share. (see Adams, et al 1992). Privatisation provided a major boost to the Malaysian stock market and it was estimated that the market capitalisation of privatised companies amounted to 22 percent of market capitalisation of the KLSE (Seventh Malaysia Plan: 212). A further major boost that was to occur was the surge in equity flows from abroad. Market capitalisation increased sixteen fold between 1987 and 1996. By 1996, Malaysia had one of the highest stock market to GDP capitalisations in the world. These developments had a major impact on the Malaysian financial system. Aside from privatization, to reduce outlays the government now saw a need for non-debt creating finance and sought to encourage foreign investment to help revive the economy. An accommodating Investments Promotion Act was enacted in 1986. It provided generous tax holidays and pioneer status for periods of five years (renewable in some cases for up to ten years) for investment in export oriented manufacturing and agriculture and tourism. To promote domestic private investment, the Industrial Coordination Act’s stringent Bumiputera investment and employee exemption limits for licensing of manufacturing enterprises were amended. In particular, foreign equity ownership of 100 percent was
15
allowed for foreign owned companies exporting more than 80 percent of output. The government also either suspended or relaxed some NEP requirements to promote investments. After the Plaza Accord which realigned the dollar-yen exchange rate, Malaysia was well situated to take advantage of new East Asian investment and mesh into the East Asian production network. In 1986 the exchange rate of the ringgit to the US dollar fell by a little over 7 percent but in terms of the IMF’s Special Drawing Rights (SDRs based on a basket of currencies) the ringgit fell by 20 percent and the real effective exchange rate fell by the same percentage. Further the withdrawal of privileges under the Generalised System of Preferences (GSP) form the East Asian NICs in February 1988 also encouraged relocation to those countries which still qualified. These factors combined with favourable new international conditions resulted in a resurgence of export oriented manufacturing largely under the auspices of foreign capital. As a result FDI commenced to surge between 1989 and 1996 this was accompanied by a large increase in commercial bank lending and portfolio flows (see Table 12). The impact of commercial bank lending and portfolio flows will be discussed briefly followed by the impact of FDI flows. Most of the commercial bank loans were borrowed by Malaysian banks which sought to profit from international interest rate differentials between Malaysia and that which was paid overseas. In January 1997 for example US and Japanese discount rates was 5 percent and 0.5 percent respectively while Malaysian commercial bank base lending rate was 9.2 percent. Malaysian corporations also sought to lower their financing costs by borrowing funds abroad. On the supply side Japanese and European banks sought to lend money at higher interest rates. The quasi-peg of the ringgit to the US dollar meant that both borrowers and lenders did not have to deal with exchange rate volatility and losses at least while the peg held. In addition to a large increase in bank lending flows, portfolio flows from abroad commenced to surge in 1992, as noted above the stock market also received a major boost with the massive privatisation program. The bulk of the flows were destined for the stock market. In 1993, portfolio flows peaked at 15 percent of GDP and the Kuala Lumpur Stock Exchange Composite Index doubled. In 1996, Malaysia had one of the highest stock market capitalisations to GDP ratios in the world (see Table 13). Increases in capital flows led to an increase in credit. Table 14 illustrates the direction of credit to the non-financial sector in Malaysia since 1960. Loans for building and construction accounted for almost a quarter of all loans. Lending for shares and consumption comprised 12.3 percent of loans. At the end of 1996, bank loans to the broad property sector and for consumption and the purchase of shares comprised about 35 percent of total credit. The pattern of FDI flows to Malaysia resulted in an export sector dominated by the electrical and electronics sub-sector in terms of output, earnings and employment (Seventh Malaysia Plan: 288). This sector generated 67.5 percent of manufactured exports in 1995 and was 91 percent foreign owned. Also underlying Malaysia’s manufactured export
16

success are chronic structural and institutional deficits that have not been overcome. This include a high degree of concentration in the electronics sub-sector, high degree of foreign ownership, high dependence on imported inputs with low local supply linkages, acute scarcity of technically skilled human resources, and the lack of institutions to facilitate movement to higher value added activities (see Lall, 1995, Rasiah, 2001a). Manufacturing share of total employment rose from 15.1 percent in 1985 to 25 percent in 1995, (see Table 4) while the growth of manufactured exports on the other hand averaged 28 percent per annum. By 1996 manufactured exports accounted for eighty percent of total exports, and manufacturing share of GDP increased from 19.6 percent to 34 percent. Over this period severe labour shortages occurred and immigrant labour filled the gap. By 1996 the unemployment rate had dropped to its lowest level at 2.5 percent and twenty percent of the Malaysian labour force were foreign workers. Between 1989 and 1995 the incidence of poverty fell from 17.1 percent to 8.7 percent. Over this period the Fifth and Sixth Malaysia Plans were implemented (see Table 15). The Fifth Malaysia Plan had a similar sectoral allocation for the Economic and the Social sector as previous development plans but had a greatly reduced allocation for Industry and Commerce as the government’s privatization program was implemented. In terms of total expenditure 27.07 percent was allocated to the social sector with education receiving 18.35 percent of the allocation, while 21.26 percent was allocated to the Economic sector (see Table 16). During the Sixth Malaysia plan development expenditure allocated to education exceeded that directed to the agricultural sector. Total expenditure allocated to the social sector was 30 percent and of this 20 percent was allocated to education (see Table 17). Greater spending on education was thought to be necessary to achieve the aims of the First Industrial Master Plan (1986–1995) which emphasized the need to deepen domestic participation in the manufacturing sector. During this period sales and excise taxes became more important sources of revenue while import duties declined. Revenue raised from corporate and personal income taxes increased as well possibly reflecting high GDP growth rates.
2.4 The Crisis and Post-Crisis Era, 1997–2000
The golden age of Malaysia’s economic performance ended abruptly with the onset of the East Asian crisis. After Thailand was forced to float the bhat in 2 July 1997, the Malaysian stock market and the ringgit came under severe pressure and the Malaysian central bank ceased defending the ringgit on 14 July 1997. Massive capital inflows assisted by a liberalized capital account regime which had contributed to high growth rates and a stock market boom were now reversing facilitated by the same liberal regime leaving Malaysia vulnerable to contagion. Between January 1997 and January 1998 the ringgit had depreciated by almost 50 percent against the US dollar. In 1998 real GDP fell by 7.5 percent. The East Asian currency crisis culminated in IMF packages for all Asian crisis economies severely affected by the crisis except Malaysia. Although Malaysia experienced a currency crisis and a banking crisis its
17

low level of external debt spared it from a debt crisis, and thus, unlike the other countries Malaysia did not require a large official financing package or debt rescheduling. Malaysia’s initial low level of short-term external debt was a consequence of the central bank’s prudential regulation of capital flows which limited the foreign exposure of the financial and corporate system, to foreign borrowing. Such regulation included limits on banks’ net foreign currency open positions and monitoring of liabilities of domestic corporations to ensure their foreign exchange earning potential (see Meesook, 2001). Nonetheless Malaysia’s liberal capital account regime rendered it vulnerable to contagion. The vulnerability emanated from two features. First portfolio flows were free of restrictions and in the Malaysian context portfolio outflows accounted for almost all of the reversals. The stock market started to collapse in tandem with the ringgit and by the end of 1997 the Kuala Lumpur Stock Exchange Composite Index had fallen by over 50 percent resulting in corporate distress and a massive build up of non-performing loans. Second cross border activities in ringgit were treated liberally, permitting the use of the currency in trade and financial transactions with non-residents and in offshore trading of securities listed on the local exchange. As a consequence an offshore ringgit market developed and short positions taken in the expectation of depreciation destabilised exchange rate and monetary policy. Economic contraction as a result of the crisis was only recorded in the first quarter of 1998 in Malaysia. As late as the last quarter in 1997 a healthy increase of 6.1 percent was achieved. Malaysia experienced its worst contractions of GDP in the second and third quarters of 1998. Overall Malaysia experienced five quarters of negative growth. In terms of patterns of expenditure of GDP, the sharpest decline was recorded for private fixed investment in Malaysia (see Table 18). There were also falls in consumption of 10.3 percent and exports 6.9 percent. However import declines were much more severe at 25.9 percent. As a result there was a large turnaround in the current account deficit and foreign reserves were replenished. In terms of sectoral patterns the sharpest decline was recorded for construction followed by manufacturing. The massive contractions in GDP had a muted effect on the unemployment rate in Malaysia which only increased by 0.6 percent. As already noted foreign workers comprised more than 20 percent of the Malaysian labour force and these workers may have provided a buffer to retrenching local workers thus keeping the registered unemployment rate lower than it would have been. Inflation rates also increased very moderately by 2.6 percent. Malaysian policymakers exercised considerable latitude in charting their own policy response as Malaysia was not involved in an IMF program. Initially the response of the authorities was to hike interest rates and tighten fiscal policy in an attempt to anchor market confidence in the financial system. In early 1998 fiscal policy was revised to a more expansionary stance. However pressure on the ringgit, much of which was thought to emanate from the offshore ringgit market in Singapore continued resulting in capital outflows. Measures implemented to reduce the upward pressure on interest rates however led to the commencement of differentials emerging between domestic and offshore rates. The strong demand for offshore ringgit hindered the ability to conduct monetary policy
18

based on domestic needs and selective capital controls were imposed to reduce the internationalization of the ringgit and regain monetary autonomy so that interest rates could be lowered. The rationale behind Malaysia’s capital controls can be explained in terms of the standard textbook exposition of the impossible trinity, i.e. that monetary policy autonomy is difficult to achieve when capital is mobile and exchange rate stability is also considered desirable. After capital controls were imposed interest rates fell sharply and this mitigated corporate distress and contained non-performing loans. The pegging of the exchange rate to the US dollar provided both exchange rate stability and ex-post undervaluation of the ringgit, which in turn facilitated a marked increase in export growth. By the second quarter of 1999, the recovery was underway in Malaysia. By mid 2000 the pre-crisis (1996) growth level was regained with two ‘lost years’ of output The Malaysian recovery was led by an improvement in public consumption and investment and export performance. Liu (2000) observes that Malaysia’s recovery in 1999–2000 was among the strongest of the Asian crisis economies led by buoyant world demand for electronics and supported by accommodating macroeconomic policies, i.e. expansionary monetary and fiscal policies to reflate the economy. The external current account turned into large surpluses, allowing a build-up of international reserves. Unemployment declined and inflation remained low. In an empirical study of the effects of Malaysian capital controls, Doraisami (2004) concludes that capital controls enabled expansionary monetary policy without precipitating capital flight and that capital controls facilitated a recovery which entailed less political and economic dislocation than one which would have been associated with market oriented reform. In this sense capital controls can be viewed as a pro-poor macroeconomic policy response in the face of financial crisis. During this period the Second Industrial Master Plan 1996 and the Seventh Malaysia Plan (1996–2000) were implemented. The objectives were for Malaysia to upgrade its industrial structure and join the group of industrial countries by 2020. The Second Industrial Master Plan emphasized the need for Malaysia to upgrade its industrial structure and to attract foreign investment from technology oriented multinational corporations. The share allocated to the social sector and Education in particular rose (see Table 19). The incidence of poverty which fell from 8.9 percent in 1995 to 6.1 in 1997, increased to 7 percent in 1998 during the crisis before falling to 5.5 percent in 2000. (see Jomo and Lee, 2001).
19
3.Social Policy and Women’s Well-Being in Malaysia
Ramesh (2000) asserts that social policies of Southeast Asian governments concentrate on education and to a lesser extent on health and social security. Further Southeast Asian countries rely on a compulsory savings mechanism which leaves large gaps in coverage and do not provide an adequate income during retirement, with the exception of civil servants who enjoy rather generous benefits paid from general revenue. As we shall see below this pattern also applies in Malaysia. In this section firstly an overview of the social policies in relation to social security, health and education will be presented followed by an assessment of whether these policies were helpful in terms of advancing the well being of women. In making this assessment the criteria which is used is that the most effective means for reducing gender based poverty and inequality is to provide citizenship based entitlements to basic income support, health care and education.
3.1 Social Security
Asher (2000a) states that social security systems in Southeast Asian countries have been traditionally based on certain key assumptions. First policymakers have relied on the continuation of rapid economic growth and consequent continuing reduction in the poverty levels of the region to take care of the financing of old age. Second policymakers have generally regarded social security provision for the non-public sector component of the labour force as essentially a concern of the families, communities and employers. Schmidt (1998) states that this view was consistent with the notion that the owners of productive capital who are seen as benefactors of labour should complement the strong family and community ties in the provision of social security. Third there is tendency to view the relationship between the individual and the state as a natural organism and the needs and the goals of the community are stressed above those of the individual. The organic view has been combined with the close government-business relations and active role of government in mobilizing the society towards primarily the economic growth objective. Social security needs of individuals thus have been considered secondary to the growth objective and to the needs of the business sector. Social security programs in Malaysia offer different levels of benefits to different groups of workers with those in government employment receiving the best benefits and those in the informal sector virtually nothing (see Ramesh, 2000). The main social security programs in Malaysia are the Employee Provident Fund (EPF), Employment Injury and Invalidity Benefits Scheme and the Old Age pension scheme for the Civil Service and Military. There are other schemes such as the Teachers Provident Fund (TPF) the Malaysian Estates Staff Provident Fund and a handful of statutory and private provident funds but they are rather small and do not play a crucial role in the social welfare system in Malaysia. The EPF established under the EPF Act of 1951 is the primary social security institution in Malaysia. Originally a compulsory savings mechanism for retirement, it has over the years been expanded to fulfill a range of objectives. All workers except domestic servants, casual and agricultural workers and certain groups of government employees are included
20
compulsorily in the scheme. Since August 1, 1998 all foreign workers have been included in the EPF scheme. The rate of contribution was originally set at 5 percent each for the employer and the employee and remained unchanged until 1975. From 1975 to 1980 the rate of contribution for the employee was 6.0 percent and for the employer 7.0 percent, it was 9.0 and 11.0 percent respectively during 1980-92 and 10.0 and 12.0 percent respectively during 1993–4 period. Since 1995 the rate has been 11.0 and 12.0 percent respectively giving a total contribution rate of 23.0 percent of the employees’ base remuneration, excluding overtime payments and gratuities. However while foreign employees contribute 11 percent of their salary to the scheme, employer contribution for foreign workers is 5 ringgit per month. Since 1995 individual EPF accounts have been divided into three. Account 1 holds 60 percent of a members total balance and can only be withdrawn upon retirement at the age of 55 or in the event of death, physical or mental incapacity or permanent emigration from Malaysia. Account 11 holds 30 percent of a member’s contribution and is intended for the purchase or upgrade of a member’s home. The remaining 10 percent is set aside in Account 111 for contributions towards medical care. Contributions to the EPF by both employers and employees, interest accruals and gains from all withdrawals are exempt from income tax and 5000 ringgit of employee contributions to the EPF may be deducted from calculating taxable income. Active contributors to the EPF account for about half of the total labour force, and twenty percent of the population in 1997. The low social security coverage of social security programs is also a function of the structure of the labour force containing a large proportion of workers in informal employment. The percentage of the workforce estimated to be employed in the informal sector was 23 percent between 1980 and 1990 with 21 percent being female while between 1990 and 2000, 17 percent of women and an equal number of men were estimated to be informally unemployed. Asher (2000b) states that EPF claims that the average amount available for withdrawal is sufficient is unrealistic, given that the average EPF balance of members is low. He asserts that this is particularly the case for those on lower incomes and as well with those with high life expectancies. A survey commissioned by the EPF (cited in Asher, 2000b) found that 68.6 percent of retirees found that their EPF savings were inadequate to sustain their costs of living in retirement and of these 60 percent had contributed to the EPF scheme for more than 25 years. A study by the World Bank (cited in Asher, 2000b) found that in the 1980’s 82 percent of the elderly (over 65 years) in Malaysia lived with their children and that children/grandchildren were also the major source of income support for the elderly in Malaysia with 37 percent of men and 67 percent of women relying on their children for support. 13 In addition to the EPF, Malaysia also provides employment, injury and invalidity benefits under the Employees’ Social Security Act 1969, called SOCSO. It consists of two separate schemes; the Employment Injury Scheme which was implemented in 1972 and the Invalidity Pension scheme introduced in 1974. All employers employing one or more
21

employees are covered under the Act. The Act however applies only to those employees earning less than 2000 ringgit per month. Once an employee is covered, then cover continues to be valid regardless of income. The main groups exempted are domestic servants, casual workers and military and police personnel. The contribution rate for the Employment Injury Scheme is approximately 1.25 percent of wages and is wholly paid by the employer. For the invalidity Pension Scheme, the rate of contribution is 1.0 percent of wages shared equally between the employer and the employee. The Public Service Pension Scheme established under the Government Pension Ordinance of 1951 (revised Pension Act 1980) provides pensions to civil servants. A permanent government officer is eligible for a non-contributory government pension provided that s/he is confirmed and has completed no less than three years of recognized service. The scheme covers retirement benefits for officials in the federal, state and local public service; employees of state enterprises, judges and members of Parliament. However only pensionable officials qualify for benefits under the scheme; temporary and part-time officials are excluded. The maximum monthly retirement pension available under the scheme is 50 percent of final salary. Pensions for Federal civil servants are paid out of federal government general revenue. State enterprises, statutory authorities and local governments contribute 17.5 percent of the employees’ monthly salary in respect of their employees, the employees themselves do not contribute anything. From the brief outline of the social security system above it can be concluded that aside from the generous pensions provided to civil servants, the rest of the labour force is not well served by the current social security arrangements. This applies even more so for women for a variety of reasons. First women tend to have a lower labour force participation rates and are also more likely to be engaged in sectors that are not covered such as the informal sector. Second as the EPF scheme entails twenty three percent of a workers salary is set aside on a monthly basis, it is clear that those with higher salaries, and who contribute over a longer period of time will retire on higher incomes. Given that women have lower incomes and that their contributions are likely to have been more discontinuous due to breaks for child-bearing and rearing, they are likely to retire on much lower incomes. Further given that Account 11and 111 can also be used to accumulate property and for health purpose, women are likely to be less advantaged than men as a result of their lower contributions. Finally, a Malaysian woman in 2000 had a life expectancy of 74 years. Given that women’s labour force participation rates was 46.7 percent of the workforce this means that (as noted above) women are more likely to be dependent on a spouse or other family members for income support. The provision of a universal old age pension would go a long way towards improving women’s well being and gender equality in Malaysia.
3.2 Health
Ramesh and Holliday (2001) state that the Malaysia along with Singapore and Hong Kong are by any standards remarkable health care performers. They have achieved excellent outcomes with low cost and the basis of this has been the strong state role in health care provision particularly in terms of hospital care where the cost is greatest but much lower involvement in outpatient care. Ramesh and Holliday argue that the health care systems in
22

these countries have many features in common with the British health care system which has also achieved good health care outcomes at modest cost. Health care costs are also relatively low because there is strong family support for the sick which reduces the scope and duration of hospitalization. Further the aged (aged 65 and above) whose health care expenses are usually larger form a much lower proportion of the population in the Malaysian context they comprised 3.9 percent of the population in 1995. The public sector in Malaysia contains about 75 percent of all hospital beds and 45 percent of all doctors (Ramesh and Holliday, 2001). Despite its dominant role, the public sector faces a severe shortage of skilled staff, as public hospitals find it difficult to recruit and retain medical staff especially specialists. Private health care providers though still small in number compared to those in the public sector have been proliferating in recent years and are projected to match the public sector by the year 2020. In terms of financing, Malaysia has a varied system that includes varying levels of user charges in public hospitals, government grants, limited insurance, some compulsory savings and large out of pocket expenses. According to the Malaysian Morbidity Survey (1986–7), (cited in Ramesh and Holliday, 2001) 23.5 percent of users of government facilities paid from out-of-pocket sources, 6.5 percent through third parties, and the remaining 70 percent received free services. Among the users in private facilities in comparison, 21 percent paid through third parties and the remainder paid out of their own pocket. According to the government’s estimate public subsidies amounted to M$14–21 for treatment compared to the M$1 paid by the patient. All health services provided in rural areas are paid for from general revenue and are free at the point of delivery. The Rural Health Service set up to meet the health needs of rural areas operates through health centres, maternal and child welfare clinics and mobile health teams to reach the most isolated communities. As early as 1980 the Rural Health Service had succeeded in offering access to a health facility within 5 km of a dwelling to over 90 percent of the rural population and this has played a central role in improving life expectancy (Doling and Omar, 2002). Public hospitals which tend to be located in urban areas levy varying levels of user charges according to the class of ward chosen. About 85 percent of public hospital beds are in the Third Class ward (the lowest class), which have nominal fees; even these are waived for those unable to pay. The total revenues raised from user charges form only 4 percent of the government’s health expenditure. In terms of outpatient care however, three quarters all outpatient care is provided by the private sector (Ramesh and Holliday, 2001). The government is concerned about the rising health costs has identified health as one of the target areas for privatization. This has been the major driving force behind the introduction of Account 11 of the EPF. However, only about 4 percent of EPF members have sufficient funds in Account three to cover even the average costs of critical illness (Asher, 2000b). While the public sector will still remain the main provider of health services, in recent years it has privatized a number of health facilities and turned over the
23

management of drug stores and laundry and maintenance of medical equipment at all public hospitals to the private sector. As noted in Table 20 the share of government’s expenditure on health has declined from 1.68 percent of GDP in 1972–79 to 1.46 percent of GDP in 1990–95. Further in 1993, public health care expenditure declined from 1.5 percent of GDP to 1.4 percent while in the same period private health expenditure increased from 1 percent of GDP to 1.5 percent. (see Ramesh, 2001). Ramesh also notes that the trend of undermining state provision of health care is of concern for two reasons. First public provision of health care, particularly hospital care has played a significant role in keeping down costs. Provision at below market prices impose a greater downward impact on prices than suggested by its share of total expenditure because its presence as a cheaper alternative acts a benchmark for the private sector. In addition centralized administration and purchasing arrangements, as well as the tardiness with purchasing the latest equipment and frills in terms of accommodation, has a similar effect. As noted above the public provision of hospital care and free treatment in public hospitals for low income earners as well as free health services provided by the rural health service has resulted in vast improvements for women. Maternal mortality rates which are a good indicator of the quality of health services (as most maternal deaths are preventable) declined from a high of 2.81 per thousand to 0.2 in 2000. Infant mortality rates also fell markedly. (see Table 21) The total fertility rate also fell but remain high by East Asian standards. Gains were also made in terms of male and female life expectancy (see Table 22). In this context plans for an increase in privatization, may in fact worsen health outcomes for women.
3.3 Education
Under the New Economic Policy education was accorded a special role being regarded as a vehicle to modernize society and attain social goals, of promoting equal opportunities for all and promoting national unity (Faaland, et al 1990:58). Equal education opportunities were to be available for rich and poor alike as well as to men and women. The high priority given to education is reflected in the fact that twenty percent of government expenditure is devoted to it. This is the highest proportion in Southeast Asia and one of the highest in the world. (Ramesh, 2000) Expenditure on education is also high because of Malaysia’s age profile. In 1996, 64 percent of the population was aged between 0 and 14 years of age. Under the aegis of the NEP a massive school building program, free schooling between the ages of six until sixteen and automatic promotion of students until Grade 9 had a dramatic impact on educational opportunities. Ramesh (2000) states that Malaysia charges no virtually tuition fees at any level of education. More than 80 percent of Malaysians attend public schools. In terms of the distribution of the spending on education 36 percent of resources are devoted to primary education, 34 percent to secondary education and 26 percent to higher education
24
After the 1969 racial riots in Malaysia, a quota system was administered at the higher education level at local universities, in order to increase the higher education participation rate of Bumiputeras. Although the official figures have never been released, Pong (1993) estimates that 75 percent of places in local tertiary institutions have been reserved for Bumiputeras under the government’s affirmative action policy. This has led to a large number of non-Malay students going overseas to receive a tertiary education. In 1996 approximately 7 percent of Malaysians were enrolled in tertiary education locally while the same percentage were enrolled in institutions overseas. Malaysia’s policy of imposing ethnic quotas at local universities and reluctance to expand the government funded tertiary education sector has resulted in a massive drain on foreign exchange as well as exacerbated the brain drain. In addition it has led to a severe shortage of skilled labour which has impeded industrial upgrading. More recently the government has allowed “twinning” arrangements with foreign universities. This is an arrangement whereby a private institution sets up partnership with a foreign university, and then confers the degree of the foreign university on students upon satisfactory completion of the course. This arrangement usually involves attending the part of the course at the local campus and part of the course overseas. The government is hoping that this will be a growth area which will address the skills shortage as well as attract students from around the region so as to earn foreign exchange. Malaysia’s high expenditure on education and the provision of free public education has resulted in impressive gains in terms of literacy for women. In terms of adult literacy women literacy rates increased faster than those of men over the decades so that the gap in the literacy rate of 22.5 percent between males and females in 1970 narrowed to 7.9 percent in 2000 (see Table 23). In terms of youth illiteracy rates (measured as illiteracy rates among those between the ages of 15–24 years old), the female illiteracy rate was 2.3 percent while it was 2.5 percent for males. Female primary net enrolment ratio in 2000–01 was 99 percent and the primary net enrolment ratio of females as a percentage of males in 2000–01 was 1.00. In terms of the female secondary net enrolment ratio this stood at 74 in 2000–01 and the secondary net enrolment ratio of females as a percentage of males was 1.11. As far tertiary education is concerned in 1996 there were 106 females for every 100 males in tertiary education and female enrolment at the tertiary level in 2000 was 51.3 percent of total enrolments in universities, while male enrolments were at 48.7 percent However, women tended to dominate in the fields of Arts and Humanities. While women were well represented in the computer science and information technology courses comprising 51.4 percent of the enrolments in this area, in engineering courses the gender gap was much larger with females comprising less than thirty percent of enrolments (Ministry of Family and Development, 2003). In summary universal provision of education and health services has served women well and have resulted in impressive improvements in related indicators. As already noted above a universal age pension scheme would vastly improve the welfare of women. However, to
25

date there has been little research available on the gender implications of the nature of the Malaysian income security arrangements. Gender disaggregated data on the retirement entitlements of the EPF and civil service pension schemes would facilitate research in this area.
4. The Gender Implications of Macroeconomic Policy
In this section the gender implications of the macroeconomic policy under past regimes outlined in section 2 are discussed before proceeding to discuss those of trade and FDI policy and fiscal policy
4.1 The gender implications of previous macroeconomic policy regimes
Form Independence in 1957 until the implementation of the NEP in 1970, a laissez-faire approach was adopted. In this period there was a small rise in manufacturing share of GDP and employment of 4 percent (see Table 6) and 1.3 percent (see Table 4) respectively. However during this period there was an increase in unemployment and the half the population was officially classified as being in poverty and foreigners controlled the economy. During this period female labour force participation rate increased by almost 7 percent (see Table 24). There was an increase in the employment of women in manufacturing of about 4 percent and in the community, social and personal services sector of 5 percent (see Table 25). The introduction of the NEP in 1970 heralded the end of the laissez faire approach and economic policy was strongly dirigiste, in particular until 1986. In fact economic policy in Malaysia has retained its interventionist characteristics since that time in spite of the push to privatization and liberalization after the recession in 1986. Government intervention in the economy remains substantial, as does government ownership of financial assets and companies listed on the Malaysian stock exchange. The evolution of female labour force participation had occurred in different phases and reflects the structural change in the economy. Between 1970 and 1980 when export oriented manufacturing was emphasized and Free Trade zones were established women increased their labour force participation rate by 5 percent In this period women also increased their share of employment in the manufacturing sector as well as in the wholesale retail trade and hotels and restaurants sector. Between 1980 and 1991 there was another large increase women’s share of employment in manufacturing, however this slowed between 1991 and 2000. Two plausible explanations that might explain this decline is that foreign workers may have substituted for female workers and second that this is part of regional trend which occurred in East Asia as economies moved towards full employment and skill intensive manufacturing. Each of these is discussed in turn. Between 1991 and 1995 full employment was achieved and a persistent labour shortage
26

developed. In the wake of labour constraints firms, particularly in the manufacturing sector employed foreign workers. In fact the manufacturing sector employed the largest number of foreign workers 31.3 percent (Eighth Malaysia Plan). The exact number of foreign workers in Malaysia is the subject of much debate, as the percentage of illegal foreign workers is thought to be as high as their legal counterparts but they are thought to have comprised 20–25 percent of the workforce. The Eighth Malaysia Plan states that 90.6 percent of foreign workers are unskilled but does not provide a breakdown by gender. In terms of sector of employment as noted above the manufacturing sector employed the largest number of foreign workers. The agricultural sector employed 22.9 percent followed by 8.7 percent in construction, 7.4 percent in services while 20.3 percent were employed as maids. All unskilled foreign workers in Malaysia are employed on work permits and have no right of residency. Contracts vary in duration from 1 to 3 year terms are not usually renewable more than once. From 1998 foreign workers have been included in the EPF terms but on much less generous terms than domestic workers. Also they have no free entitlements to health education and housing services. Athukorala (2001) asserts that migrant workers undertake the 3D jobs (dirty, dangerous and demanding) which local workers are not prepared to do and may have depressed the wages of local unskilled workers. The fact that foreign workers are available on short-term contracts and attract lower EPF contributions from employers suggests the possibility that female labour may have been substituted with foreign labour by employers. This may have also happened with male workers. To date there has been little research on this topic. Thus high growth rates alone cannot be relied upon to increase female labour force participation and hence the well being of women in Malaysia. A second explanation put forward by Jomo (2001b:16) suggests that there was an increase in female employment in manufacturing in the early period of labour intensive manufacturing destined for export markets. However with the advent of full employment, and more skill intensive manufacturing, manufacturing growth and industrial employment growth tapered off with the female share of such employment declining. Jomo suggests that this trend reflected the gender preferences employers as the gender wage gap narrowed. In terms of absolute numbers of women employed in manufacturing the number of women employed was remained stagnant between 1992 and 1995 before rising in 1996 and 1997 and then declining to 1995 levels in 1998 as the impact of the crisis was felt (see Table 26 ). In the twenty years between 1980 and 2000 the female labour force participation rate increased by 4.5 percent. Further during the period between 1991 and 1995 when high growth rates were achieved the female participation rate fell by 3 percent. Male labour participation rates also declined during this period but by 1 percent (see Table 24). The female labour force participation rate in Malaysia in 2000 was 46.7 percent. A comparison of the male and female labour force participation rates in Malaysia rates with countries with approximately the same level of per capita income suggests that there is far greater
27

uniformity in male labour force participation rates while female participation rates vary widely (see Table 27). In general male participation rates are uniformly over 80 percent. Female participation rates are much higher in former Soviet bloc countries. Malaysian female participation rates fall in the lower end of the range, comparable with those in Brazil, Mauritius and Panama. A breakdown of women labour force participation by age-group in 2002 suggests that women in the 25–29 age group have the highest labour force participation rate and that this rate declined by 8 percent when they reach the 30-34 age group and then declines steadily with age until another sharp drop of about ten percent when women reach the age of 50–54 and then a further drop of ten percent when they reach the usual retirement age of 55. (see Table 28). The sharp drop in women’s labour force participation rates before they reach retirement age obviously has implications for the number of women in senior and highly paid positions in the workforce. Also Table 28 suggests that there is little difference in the overall female labour force participation rate of the various ethnic groups in Malaysia. Malaysian Chinese women reach the highest female labour force participation rate in the 25–29 age group, and then this drops by about 15 percent as they reach the 30–34 age group. Malaysian men on the other hand exhibit a high labour force participation rate of 97 percent, and this is sustained until a there is a twenty percent drop when they reach the retirement age of 55. More research needs to be undertaken on why more women do not return to the workforce and why they retire early. Table 29 suggests that this may be due to notions that women should stay at home and be caregivers to children and the elderly as an overwhelming 70 percent of women who are not in the labour force cite home obligations for not seeking work. However it could also be due to due to poorer terms and conditions for women, particularly those who are less educated. Table 30 indicates that the participation rate of Malaysian women in the workforce increases with their level of education. Steps need to be taken to increase the female labour force participation rate if gender equality is to be increased. Steps also need to be taken to ensure that women are well placed to compete for job opportunities in the future. According to the Eighth Malaysia Plan, the greatest number of job vacancies are expected to be in the administrative and managerial as well as the professional and technical categories. In terms of occupations the highest demand is expected to be for engineers and engineering assistants especially in electrical, electronics and mechanical engineering as industries move towards more capital intensive and knowledge based production processes. However as has already been noted although women are well represented in Malaysian tertiary education institutions they tend to pursue studies in the Humanities area. Strategies must be found to ensure that women are better placed to obtain jobs in growth areas. Prior to the crisis Malaysia also received massive increases in portfolio lending flows which together with the privatization push led to a stock market boom and later bust in the
28

wake of the financial crisis. However there is very little information on how much women benefited from the privatization efforts of the government, female share ownership or the breakdown of bank lending by sector and gender. As we have seen loans to the broad property sector comprised a large proportion of bank loans in Malaysia but little is known of the proportion of bank loans disbursed to women for this purpose or in fact if women faced any gender specific impediments to obtaining loans. As government control of financial assets in Malaysia is estimated to be about 56 percent in 1996 (see Doraisami, 2004) and government directives to increase loans to various sectors as well as to the Malay community have been issued in the past perhaps government directives to increase loans to women could be considered if warranted, particularly for female headed single-parent households (who are not entitled to any social security entitlements) which comprise 18 percent of all households in Malaysia (Eighth Malaysia Plan). Loans to women could facilitate could facilitate a range of objectives, including property ownership as well as the establishment of micro enterprises. More data is needed to ascertain where women stand in relation to men in being on the road to asset ownership and wealth in Malaysia.
4.2 Trade and FDI Policy
Malaysia’s impressive growth rates since Independence can be readily attributed to the rate of expansion of the manufacturing sector and its export performance Rapid export led growth underpinned by foreign direct investment stimulated a steady rise in manufacturing which has profoundly altered the structure of the Malaysian economy. The evolution of female labour force participation in Malaysia has mirrored these changes, with the manufacturing sector now employing more than twice the number of women as the agricultural sector. It also employs the largest number of women together with community and social services. The proportion of female workers as a proportion of the total number of workers in manufacturing was 43.6 percent in 2000. However there was a wide variation in the proportion of women employed in the different sub-sectors of manufacturing. In 1997 the top five sub-sectors in terms of proportion of female employees were the professional scientific equipment sector, followed by other manufactures, wearing apparel, leather products and electrical machinery. On the other end of the scale in capital intensive “heavy industry” sub-sectors such as petroleum refineries, iron and steel and transport equipment women comprised 10.8 percent, 12.8 percent, and 21 percent of employees. This suggests that even in sectors of the economy where women are employed in large numbers a sharp gender demarcation in this sub-sector still exists and further research is needed to establish if these differences are a source of gender wage inequality in manufacturing (see Table 31). In the Malaysian context it is clear that the rapid mobilization of the female labour force in the export oriented, labour intensive foreign owned manufacturing sector particularly the electronics sector contributed to Malaysia’s economic transformation. Further as Ahmad (1998:4) observes the industrial expansion associated with the establishment of export processing zones in the 1970s also had a profound impact on rural to urban migration as young unmarried Malays women were drawn in unprecedented numbers from the villages to urban factories. Indeed it is not an exaggeration to say that Malaysian women
29

contributed greatly to Malaysia’s industrial take-off and industrialization. And the observation by the United Nations Report (cited in Lim, 1993:79) that rapid industrialization push in some countries was as much female-led as export led also applied to Malaysia. The share of female workers within the manufacturing labour force has also altered since 1971. There has been a marked increase in the share of women employed in the professional and non-professional categories as well as among production workers. In 1997 the largest percentage of women were employed in the clerical and related sector while the lowest percentage were in the professional category and the technical and supervisory category (see Table 32). While the government’s export oriented industrialization policy attracted foreign direct investment with the establishment of Free Trade Zones and generous fiscal incentives, a very attractive added incentive was the prohibition of workers in the electronics industry from forming a national union. As already noted currently only in-house unions are allowed and moves to establish a national union have been met with threats by multinationals to move to other countries. There is also no minimum wage in Malaysia. The availability of unskilled work particularly for production work which is suitable for women may have provided women with a lower level of education an opportunity to enter the workforce and may have improved their bargaining power vis-à-vis men in households, however policies which aim at keeping wages low in the manufacturing sector would not have contributed to an overall increase in gender wage equality. Further, the fact that there is preponderance of women in the manufacturing sector (in the sense that this sector is where over 27 percent of women are employed) have exposed them to greater economic and social vulnerability. This is a phenomenon which has also been observed in other countries. Lim 1993 asserts that this is not only because they work in the sectors most sensitive to international demand conditions but also because they were mainly in direct production jobs which fluctuated more closely with the actual level of the firm’s than other types of jobs such as design supervision or maintenance. Eisold (1984) asserts that women in the new international division of labour were more vulnerable because the branch establishment of their multinational employers were expected to rapidly adjust their production levels in response to highly interdependent global requirements; and there tended to be sudden redundancies just as there could also be rapid or forced increases in overtime. In Malaysia Lim (1993) states that half the total number of workers retrenched between 1983 and 1985 were from manufacturing with the largest proportion of workers from electronics followed by textiles. This pattern was also repeated in the wake of the financial crisis that occurred in 1997. While employment in manufacturing declined by 4 percent in 1998, (see Table 33) the number of workers from the manufacturing sector comprised 54 percent of all workers retrenched (see Table 34). Further the number of female workers registered as unemployed rose from 45.4 percent in 1996 to 46.6 percent 1997 before falling to 43.5 percent in 1998 and rising by 3 percent in 1999, as prices of semiconductors slumped. On the other hand the percentage of males, unemployed dropped by 3 percent in
30

1999 as the recovery got underway (see Table 35). Surges in capital flows (particularly short-term capital flows) and their reversal have led to deep fluctuations in economic activity in the 1990s. It has been argued that large fluctuations in economic activity have far greater adverse impacts on women than men (see Singh and Zammit, 2000). If this is true then any policy which reduces the downturn in economic activity would enhance the welfare of women. In the Malaysian case there is evidence that the use of capital controls facilitated a recovery with less economic and social dislocation (see Doraisami, 2004) and thus the use of capital controls may have assisted women. It is clear FDI flows to Malaysia has transformed the Malaysian manufactured export sector and female labour force participation. This trend has also been observed in a number of developing countries and the extent to which female employment in foreign owned enterprises in export related sectors have benefited women and contributed to gender equality have been questioned (see Braunstein, 2000 and Seguino, 2000,) Seguino (2002) suggests that in some countries labour intensive export-led growth can trap women in insecure low paid jobs and efforts to raise their wages can lead to a decline in export demand and a loss of foreign investment and thus female employment. In these circumstances Seguino (2002:270) suggests that the pursuit of gender equity may be a reason for the state to adopt an industrial policy ( which may also involve restrictions on foreign direct investment and trade restrictions) that moves a country up the ladder to higher value added production and employment and training policies that insure that women This is the current direction of industrial policy in Malaysia, however Malaysia lacks the skilled labour and as well as an indigenous manufacturing capacity to be able to move in this direction quickly. In the short-term other policy options should be explored. The government could perhaps top up the EPF contributions for workers in this industry as a compensation for trade union restrictions, this has the advantage of increasing the real wage for workers while not increasing the costs to multinationals. In the Malaysian context there is a dearth of disaggregated published data on the gender differentials in wages by sector and occupation on a time series basis. Indeed as already noted this there is a lack of published statistics on a gender disaggregated basis generally and it is important that the Malaysian government to begin to prepare and publish statistics on a gender disaggregated basis for a whole range of macroeconomic and policy variables. Data from various issues of the ILO Yearbook of Labour Statistics suggest that female wages as a share of male wages in manufacturing rose from 47.5 percent in 1983 to 62.9 percent in 1997 (see Table 36). While the female wage share increased from 47.5 percent to 4.9.3 percent in 1985 a decline then ensued as Malaysia experienced its first recession since Independence. Much of this improvement in the female share occurred in the 1990s as high growth rates were posted and the economy approached full employment. In broader terms a study by the World Bank (1995) concluded that the average gender gap for all workers may be as much as fifty percent in 1991. The Human Development Report (2003) suggests that female estimated earned income in 2001 measured in US dollars on a
31
Purchasing Power Parity basis was about 47 percent of male earned income. While a study by Milanovic (2001) which examined inequality and determinants of earnings in Malaysia between 1984 and 1997 found that women are discriminated to the tune of 16–20 percent in matters of earnings.
4.3 Fiscal Policy
As noted above, Malaysia has committed a large proportion of successive budgets to education and lower proportions to health and social security. Total tax revenues collected (i.e. direct and indirect taxes) as a proportion of GDP was 16.9 percent in 1960 and 16.2 percent in 1970. However, it rose to 20.63 percent of GDP in 1986, as a result of increased tax revenues from the petrol tax. It was 18.63 percent in 1996 and 22.43 percent in 2000. In general it has been suggested that direct taxes on income, profits and property tend to be universally progressive and indirect taxes generally regressive although the degree of regressiveness tends to vary with the exemption of basic goods and services. Direct taxes were only 18 percent of total taxes in 1960 but this increased to 29 percent in 1970 and was 41.6 percent in 2000, contributing an equal share of total tax revenues as indirect taxes. The shift to direct taxes however was not accompanied by a large increase in personal income tax which was only 10.5 percent of taxes collected. Thus the impact of the tax system in terms of counteracting the market distribution of income in which women are disadvantaged was probably lower than if there were larger increases in personal income taxes. In Malaysia the highest marginal rate of tax is 30 percent, perhaps presenting the scope for a more progressive tax structure. Sales tax was the major form of indirect taxes levied followed by excise taxes and import levies. In the Malaysian context sales tax are is levied at a flat rate of ten percent. Cigarettes and alcohol attract rates of 25 percent and 20 percent respectively. Basic foodstuffs are exempted from sales taxes and this may diminish the regressiveness of the reliance on indirect taxes. To date there no studies which have examined the degree of progressiveness of the tax system in Malaysia or the types of changes in the Malaysian tax system which will improve the well being of women.
5. Conclusion
This paper has provided an overview of Malaysia’s evolving political economy and social policy and discussed their gender impacts. In conclusion the aspects of social policy and macroeconomic policies which have been conducive to the well being of women are sketched out, while directions for future research are identified Social policy in Malaysia particularly where the provision of education and health services are concerned contributed greatly to women’s well being with women enjoying vast improvements in health and education indicators. Where social security is concerned however, women are not well served by the current system. There is also little information on the level and sources of income of older Malaysian women. There is little doubt that
32

women would be greatly advantaged by moves to a non-contributory universal pension scheme. However the implementation of such a scheme may not be feasible. Perhaps it is a question of designation of rights and finding ways to recognize and recompense women’s or men’s unpaid economic role by according personal pension rights to this unpaid work. More research is needed on best ways of financing such a scheme. At present there is also little research on the implications and distributive effects of various taxes or combinations of taxes and none on gender. The Malaysian economy has undergone significant structural change and produced high growth rates since 1957. The evolution of female labour force participation has occurred in different phases and reflects the structural change in the economy. Generally policy changes that have increased the level of female well being has occurred while interventionist policies have been pursued although they were not designed or implemented with the objective of achieving gender equality. These include the NEP goals of according a high priority to education so that the identification of occupation with race can be diminished as well as an eradication of poverty based on high growth rates. In terms of trade and FDI policies there appears to be a trade off between greater female participation in the labour force and gender wage equality. More recently, increases in female labour force participation has stagnated, while immigrant labour has increased during the era of high economic growth. Generally this indicates that high growth rates alone will not ensure an improvement in the well being of women. More research is needed to explore these links More gender disaggregated data is needed on a time series basis of the gender wage gap across sectors and occupations. Research also needs to be conducted on the underlying causes of wage differentials so that more informed policy action can be undertaken. Data on the ownership of property, shares and incomes in retirement is also needed. The ways in which labour, credit and goods markets impact on the welfare of women needs to be assessed. The Malaysian government has shown a strong commitment in ensuring that women share equally in the benefits of development. Development Planning documents in Malaysia have included a chapter on Women in Development since the Sixth Malaysia Plan. From the Sixth Plan until the Eighth Plan the focus of this chapter has been on the employment distribution women in the workforce by occupation and sector. A short summary is also made of the gains that women have achieved in the areas of health and education. Future plan documents should move towards assessing the gender implications of thrust of macroeconomic policy in each Plan period and mainstreaming gender implications of developments in each chapter and to tracking these over time much the same way as it is done in terms of ethnic grouping. Successive development plans in Malaysia have emphasized the need to realize the goals of the NEP. Targets have been set and policies have been put in place to ensure that these targets are met. The identification of race with occupation has been eroded since the implementation of the NEP. Likewise the narrowing of wage differentials between ethnic groups and an increase in Bumiputera equity ownership of the corporate sector has also
33

been achieved and is meticulously tracked and recorded in successive development plans. Poverty reduction and equity ownership of the corporate sector has been subject to targets. However it is difficult to gauge the progress made by Malaysian women in this regard as there is little information on how women have fared in terms of gender wage differentials in occupations and sectors as well as gender differentials in asset ownership, poverty and retirement incomes.
34

TABLES Table 1 Sectoral Breakdown of Development Expenditure 1956-1970 in millions of ringgit (percentage in parenthesis )
First Five Year Plan 1956–1960
Second Five Year Plan 1961–1965
First Malaysia Plan 1966–1970
Economic Sector 759.9 (75.5) 1763.7.( 66.5) 2210.8 (61.2)
Agriculture 227.5 (22.6) 467.9 (17.3) 911.2 (25.2)
Infrastructure 520.3 (51.7) 1236.7 (46.6) 1162.6( 32.2)
Industry 12.1 (1.2) 59.1 (2.2) 137.0 (3.8)
Social Sector 138.8 (13.8) 413.6 (15.6) 644.7 (17.9)
Education 60.9 (6.0) 236.5 (8.9) 286.9 (7.9)
Health 12.7 (1.3) 101.9 (3.8) 114.2 (3.2)
Housing 65.2 ( 6.5) 69.4 (2.6) 188.0 (5.2)
General 108.8 (10.8) 474.4 (17.9) 754.7 (20.9)
Total Public Investment 1006.7 (100.0) 2561.7 (100.0) 3610.2 (100.0)
Source: Rudner 1980:57–8, Table 1.
Table 2 Federal Government Current Revenue as a percentage of total revenue
1960 1970 1986 1996 2000
Direct Taxes 18 29 44.3 44.3 41.6Corporate Income Tax 20 17.6 24.3 23.0Petroleum Tax - 15.7 3.78 3.4Personal Income Tax 7 9 10.5 10.5Others 2 2 5.67 4.7Indirect Tax 65 54 30.9 36.7 42.0Export Duties 24 11 5.8 1.78 0.9Import Duties 34 23 10.6 10.5 10.0Excise Tax 10 7.2 9.93 10.4Sales Tax - 5.1 9.39 18.1Other 7 10 1.8 5.12 2.6Non-tax Revenue and Non-revenue receipts
17 17 24.8 19 14.8
Total 100 100 100 100 100Source: Jomo 1990 Bank Negara Malaysia Quarterly Bulletin various issues.
35
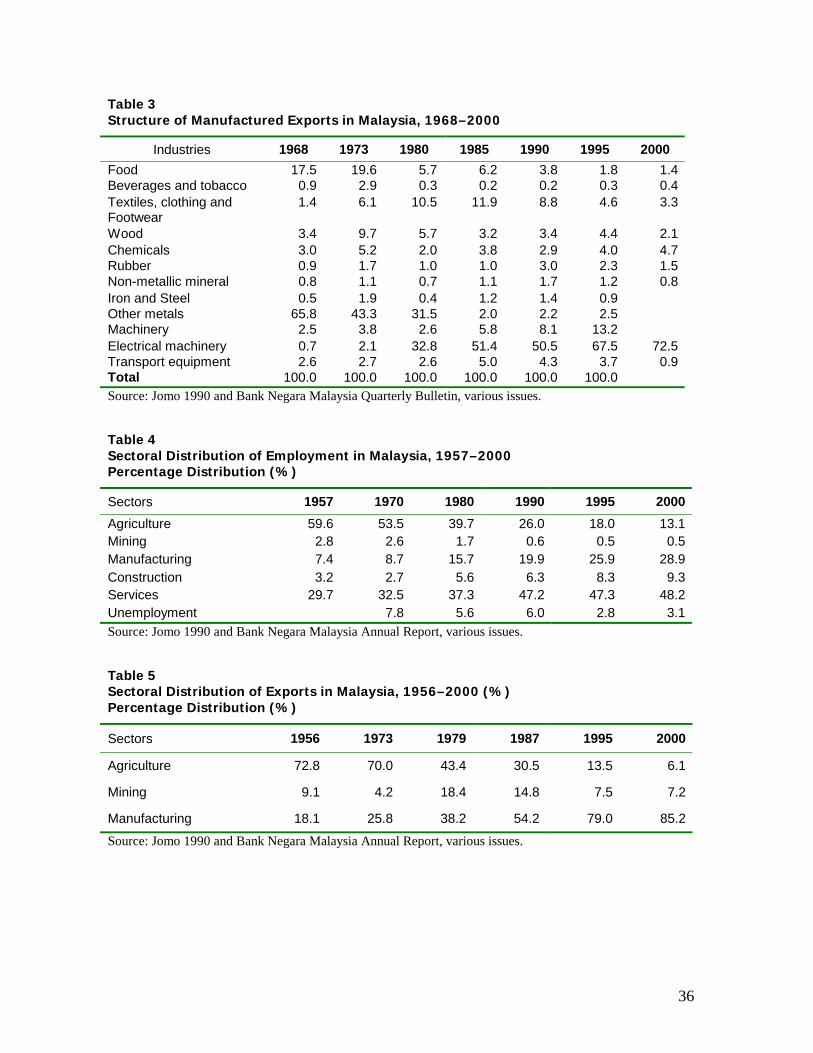
Table 3 Structure of Manufactured Exports in Malaysia, 1968–2000
Industries 1968 1973 1980 1985 1990 1995 2000 Food 17.5 19.6 5.7 6.2 3.8 1.8 1.4Beverages and tobacco 0.9 2.9 0.3 0.2 0.2 0.3 0.4Textiles, clothing and Footwear
1.4 6.1 10.5 11.9 8.8 4.6 3.3
Wood 3.4 9.7 5.7 3.2 3.4 4.4 2.1Chemicals 3.0 5.2 2.0 3.8 2.9 4.0 4.7Rubber 0.9 1.7 1.0 1.0 3.0 2.3 1.5Non-metallic mineral 0.8 1.1 0.7 1.1 1.7 1.2 0.8Iron and Steel 0.5 1.9 0.4 1.2 1.4 0.9 Other metals 65.8 43.3 31.5 2.0 2.2 2.5 Machinery 2.5 3.8 2.6 5.8 8.1 13.2 Electrical machinery 0.7 2.1 32.8 51.4 50.5 67.5 72.5Transport equipment 2.6 2.7 2.6 5.0 4.3 3.7 0.9Total 100.0 100.0 100.0 100.0 100.0 100.0 Source: Jomo 1990 and Bank Negara Malaysia Quarterly Bulletin, various issues.
Table 4 Sectoral Distribution of Employment in Malaysia, 1957–2000 Percentage Distribution (%)
Sectors 1957 1970 1980 1990 1995 2000Agriculture 59.6 53.5 39.7 26.0 18.0 13.1Mining 2.8 2.6 1.7 0.6 0.5 0.5Manufacturing 7.4 8.7 15.7 19.9 25.9 28.9Construction 3.2 2.7 5.6 6.3 8.3 9.3Services 29.7 32.5 37.3 47.2 47.3 48.2Unemployment 7.8 5.6 6.0 2.8 3.1Source: Jomo 1990 and Bank Negara Malaysia Annual Report, various issues.
Table 5 Sectoral Distribution of Exports in Malaysia, 1956–2000 (%) Percentage Distribution (%)
Sectors 1956 1973 1979 1987 1995 2000
Agriculture 72.8 70.0 43.4 30.5 13.5 6.1
Mining 9.1 4.2 18.4 14.8 7.5 7.2
Manufacturing 18.1 25.8 38.2 54.2 79.0 85.2Source: Jomo 1990 and Bank Negara Malaysia Annual Report, various issues.
36

Table 6 Sectoral Distribution and Growth of GDP in Malaysia, 1960–2000 (%) Percentage Distribution (%)
Sectors 1960 1970 1980 1985 1990 1995 2000Agriculture 37 31 23 20.7 20 13.6 10.5Mining 9 10 15 10.4 14 7.4 5.7Manufacturing 9 13 20 19.6 26 33.1 37.5Services 45 46 42 49.3 40 45 46.8GDP 100.0 100.0 100.0 100.0 100.0 100.0 100.0Source: Jomo 1990 and Bank Negara Malaysia Annual Report, various issues. Table 7 Sectoral Breakdown of Development Expenditure, 1971–1985 (%)
Second Malaysia Plan 1971–1975
Third Malaysia Plan 1976–1980
Fourth Malaysia Plan 1981–1985
Economic Sector 71.6 59.3 75.3
Agriculture 23.1 20.8 11.8
Infrastructure 32.8 24.8 36.2
Commerce and Industry 15.7 13.7 27.3
Social Sector 14.0 17.6 13.4
Education 7.4 6.9 6.3
Health 2.2 1.7 1.0
Housing 2.3 5.5 5.3
Other Services 2.1 3.5 0.8
Security and General Administration 14.4 23.1 11.3
Total Public Investment 100.3 100 100
Source: Jesudason, 1989.
37

Table 8 Sectoral Breakdown of Development and Current Expenditure Second Malaysia Plan, 1971–1975 in millions of ringgit
Development Expenditure
Current Expenditure
Total Expenditure
Total (%)
Defence and Security 1009 4675 5684 22.28
Economic Sector 24.09
Agriculture 1796 454 2250 8.82
Trade and Industry 1366 171 1537 6.02
Transport 1373 276 1949 6.46
Public Utilities 316 - 316 1.23
Other 289 109 398 1.56
Social Sector 29.52
Education 739 4348 5087 19.94
Health 183 1376 1559 6.11
Housing 143 - 143 0.56
Social and Community Services
51 - 51 0.19
Other Social Services - 694 694 2.72
Other - 4087 4087 16.02
General Administration
219 1836 2055 8.05
Total 7484 18026 25510 100.5
Source: Second Malaysia Plan.
38

Table 9 Sectoral Breakdown of Development and Current Expenditure Third Malaysia Plan, 1976–1980 in millions of ringgit Development
Expenditure Current
Expenditure Total
Expenditure Total (%)
Defence and Security 3331 8428 11759 19.82
Economic Sector 27.12
Agriculture 3873 1172 5045 8.5
Trade and Industry 3296 453 3749 6.31
Transport 3551 455 4006 6.75
Public Utilities 1793 - 1793 3.02
Other 1215 297 1512 2.54
Social Sector 28.12
Education 1650 8948 10598 17.86
Health 278 2786 3064 5.16
Housing 1159 - 1159 1.95
Social and Community Services
359 - 359 0.60
Other Social Services - 1513 1513 2.55
Other - 10397 10397 17.52
General Administration
623 3750 4373 7.37
Total 21128 38197 59327 99.95
Source: Third Malaysia Plan.
39

Table 10 Sectoral Breakdown of Development and Current Expenditure Fourth Malaysia Plan, 1981–1985 in millions of ringgit
Development Expenditure
Current Expenditure
Total Expenditure Total (%)
Defence and Security 7258 15525 22783 17.5
Economic Sector 27.27
Agriculture 6436 3908 10344 7.95
Trade and Industry 6827 1927 8754 6.73
Transport 7211 1263 8474 6.51
Public Utilities 4552 - 4552 3.49
Other 2905 446 3371 2.59
Social Sector 26.68
Education 4733 15288 20021 15.39
Health 661 4545 5206 4.00
Housing 5325 - 5325 4.09
Social and Community Services
1331 - 1331 1.02
Other Social Services - 2840 2840 2.18
Other - 28913 28913 22.22
General Administration
823 7329 8152 6.26
Total 48062 82004 130066 99.93
Source: Fourth Malaysia Plan.
40

Table 11 Public Development Spending, 1971–1985
Second Malaysia Plan 1971–75
Third Malaysia Plan 1976–80
Fourth Malaysia Plan 1981–85
Government Financing
Government revenue 21700 54 706 93,770
Public Authorities current surplus
800 1853 29442
Foreign Borrowing 2300 3907 26163
Net Domestic Borrowing 4650 9610 24263
Use of accumulated reserves 1170 3584 468
Government Expenditure
Current Expenditure 20800 48723 91890
Development Expenditure 9820 24937 80331
Overall Deficit 8120 17101 50889
Deficit/GDP 10.9 9.3 16.3
Deficit/Revenue 37.0 31.0 54.3
Foreign Borrowing /deficit 28.0 23.0 51.4
Source: Jesudason, 1989.
Table 12 Net capital flows, by category (% of GDP) GDP, Inflation and Unemployment Rates
1989 1990 1991 1992 1993 1994 1995 1996 Net capital inflows (% of GDP)
3.5 4.2 11.9 15.2 16.8 1.6 8.5 7.2
Official Development Finance -2.4 -2.4 -0.5 -1.4 0.6 0.3 2.7 0.3 Foreign direct investment 4.4 5.4 8.5 9.0 7.8 6.0 4.7 4.8 Commercial Bank Funds 1.1 2.0 2.8 6.3 6.6 -7.0 0.1 1.0 Portfolio Equity n.a. n.a. -1.5 5.6 14.5 5.7 1.2 4.0 GDP growth Rate 9.2 9.7 8.7 7.8 8.3 9.2 9.5 8.6 Inflation Rate 3.9 2.0 4.4 4.7 3.5 5.0 3.5 3.4 Unemployment Rate 7.5 5.1 4.3 3.7 3.0 2.9 2.8 2.5
Source: Ong (1998) and International Financial Statistics various issues.
41
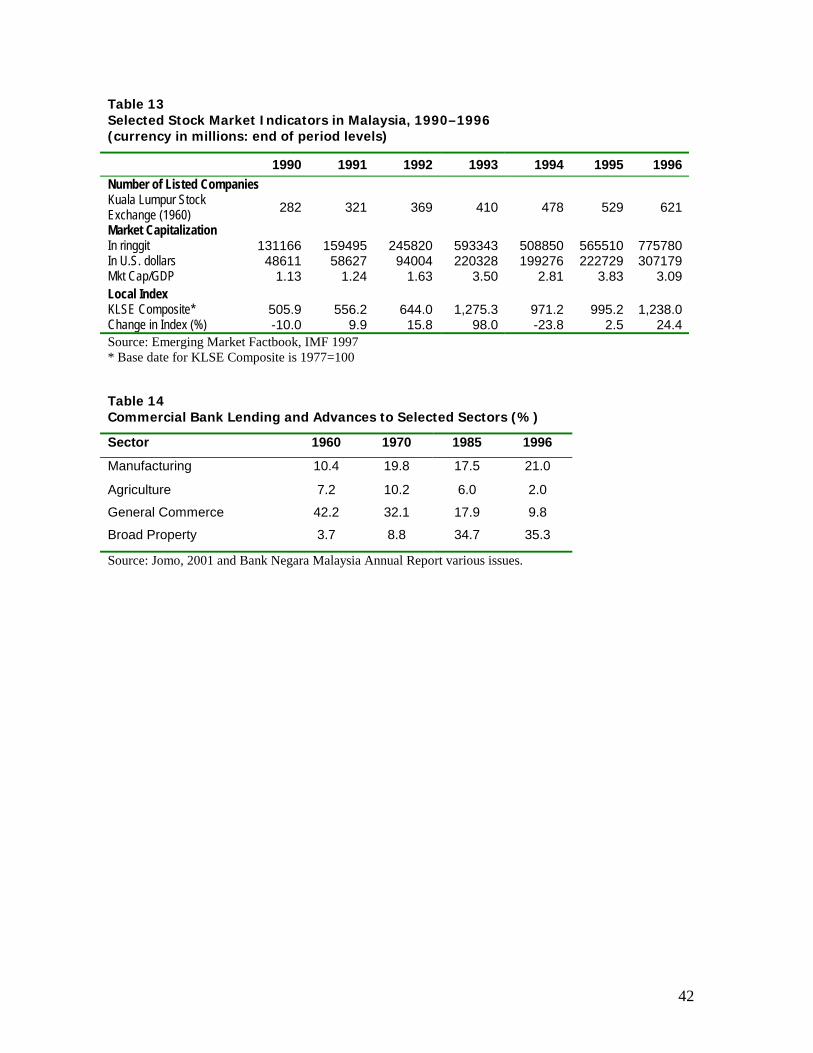
Table 13 Selected Stock Market Indicators in Malaysia, 1990–1996 (currency in millions: end of period levels)
1990 1991 1992 1993 1994 1995 1996Number of Listed Companies Kuala Lumpur Stock Exchange (1960) 282 321 369 410 478 529 621
Market Capitalization In ringgit 131166 159495 245820 593343 508850 565510 775780In U.S. dollars 48611 58627 94004 220328 199276 222729 307179Mkt Cap/GDP 1.13 1.24 1.63 3.50 2.81 3.83 3.09Local Index KLSE Composite* 505.9 556.2 644.0 1,275.3 971.2 995.2 1,238.0Change in Index (%) -10.0 9.9 15.8 98.0 -23.8 2.5 24.4Source: Emerging Market Factbook, IMF 1997 * Base date for KLSE Composite is 1977=100 Table 14 Commercial Bank Lending and Advances to Selected Sectors (%) Sector 1960 1970 1985 1996
Manufacturing 10.4 19.8 17.5 21.0
Agriculture 7.2 10.2 6.0 2.0 General Commerce 42.2 32.1 17.9 9.8 Broad Property 3.7 8.8 34.7 35.3
Source: Jomo, 2001 and Bank Negara Malaysia Annual Report various issues.
42

Table 15 Sectoral Breakdown of Development Expenditure, 1986–1995 (%)
Fifth Malaysia
Plan 1986–1990
Sixth Malaysia Plan
1991–1995
Seventh Malaysia Plan
1996–2000
Economic Sector 76.2 50.6 47.6
Agriculture 16.0 11.6 8.2
Transport 43.2 22.4 21.0
Commerce and Industry 17.0 7.4 11.4
Other - 9.2 7.0
Social Sector 17.2 24.8 31.6
Education 12.5 13.4 19.9
Health 1.5 4.4 3.8
Housing 2.2 3.3 3.4
Other 1.0 12.9 4.6
Security and General Administration
6.6 20.1 20.8
Total 100 100 100
Source: Seventh Malaysia Plan, Eighth Malaysia Plan.
43
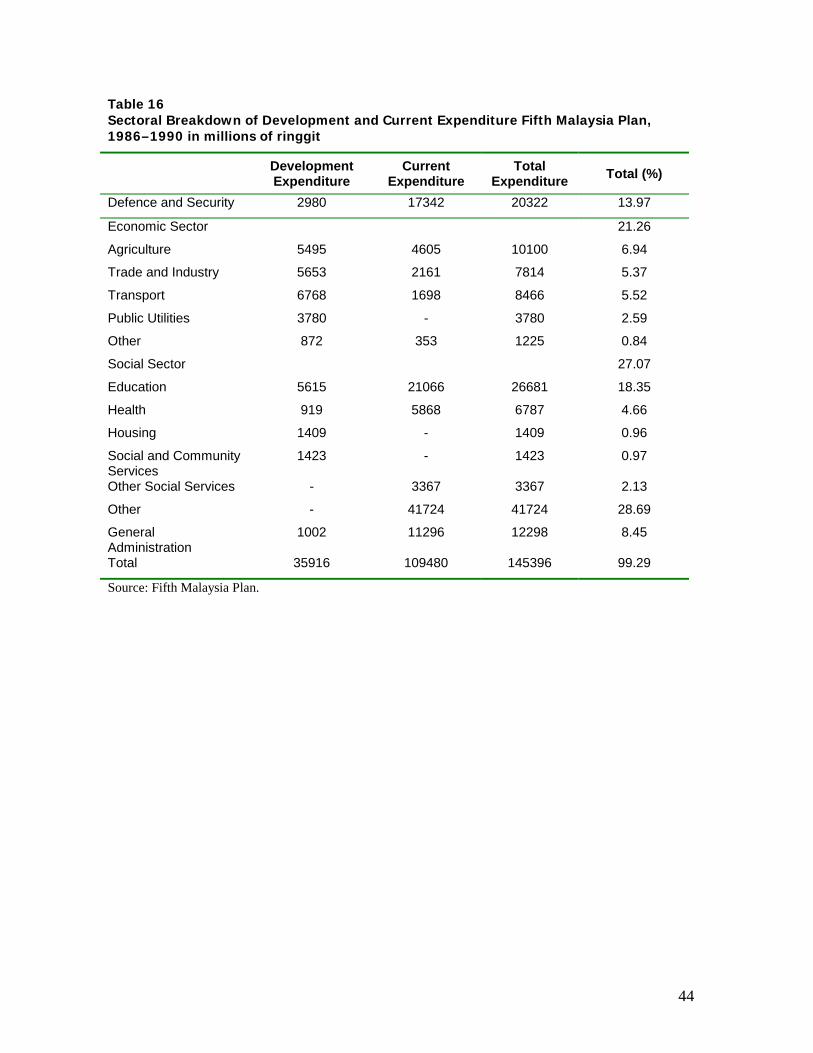
Table 16 Sectoral Breakdown of Development and Current Expenditure Fifth Malaysia Plan, 1986–1990 in millions of ringgit
Development Expenditure
Current Expenditure
Total Expenditure Total (%)
Defence and Security 2980 17342 20322 13.97
Economic Sector 21.26
Agriculture 5495 4605 10100 6.94
Trade and Industry 5653 2161 7814 5.37
Transport 6768 1698 8466 5.52
Public Utilities 3780 - 3780 2.59
Other 872 353 1225 0.84
Social Sector 27.07
Education 5615 21066 26681 18.35
Health 919 5868 6787 4.66
Housing 1409 - 1409 0.96
Social and Community Services
1423 - 1423 0.97
Other Social Services - 3367 3367 2.13
Other - 41724 41724 28.69
General Administration
1002 11296 12298 8.45
Total 35916 109480 145396 99.29
Source: Fifth Malaysia Plan.
44

Table 17 Sectoral Breakdown of Development and Current Expenditure Sixth Malaysia Plan, 1991–1995 in millions of ringgit
Development Expenditure
Current Expenditure
Total Expenditure Total (%)
Defence and Security 11890 25498 37388 17.07
Economic Sector 18.8
Agriculture 6202 6005 12207 5.57
Trade and Industry 4456 2513 6969 3.18
Transport 11780 5578 17358 7.92
Public Utilities 3569 - 3569 1.63
Other 175 923 1098 0.50
Social Sector 30.02
Education 7661 36654 44315 20.24
Health 2341 9816 12157 5.55
Housing 1089 - 1089 0.49
Social and Community Services
3006 - 3006 1.37
Other Social Services - 5202 5202 2.37
Other - 52659 52659 24.05
General Administration
2536 19377 21913 10.00
Total 54705 164225 218930 99.94
Source: Sixth Malaysia Plan.
45

Table 18 Selected Economic Indicators Malaysia (%)
1997 1998 1999 2000
GDP Growth 7.3 -7.4 5.4 8.5Private Consumption 4.3 -10.2 2.9 12.5Public Consumption 5.7 -8.9 17.1 3.0Growth in Domestic Investment 12.2 -43.5 -3.9 0.1Growth of Merchandise Exports ($fob %) 0.7 -7.0 -15.3 16.0Growth of Merchandise Imports ($cif%) 0.7 -26.1 12.0 20.2Agricultural Sector 0.7 -2.8 0.5 2.6Manufacturing Sector 10.1 -13.4 11.7 19.1Construction Sector 10.6 -24.0 -4.4 1.0Inflation Rate 2.7 5.3 2.7 1.6Unemployment Rate 2.6 3.2 3.4 3.1Three Month Interbank Lending Rate (%) 7.7 6.5 3.2 3.2Current Account Balance as a % of GDP -5.2 13.5 15.9 -5.5
Source: Asian Development Bank Asia Recovery Information Centre database (www.aric.adb.org) and IMF International Financial statistics. All growth rates are on a year-on-year basis.
46

Table 19 Sectoral Breakdown of Development and Current Expenditure Seventh Malaysia Plan, 1996–2000 in millions of ringgit
Development Expenditure
Current Expenditure
Total Expenditure Total (%)
Defence and Security 11586 32191 43777 13.05
Economic Sector 20.67
Agriculture 5519 6402 11921 3.55
Trade and Industry 12189 9381 21570 6.43
Transport 18926 5947 24873 7.41
Public Utilities 7564 - 7564 2.25
Other 847 1617 2464 0.73
Social Sector 33.67
Education 18491 55667 74158 22.1
Health 3731 17381 21112 6.29
Housing 4541 - 4541 1.35
Social and Community Services
5935 - 5935 1.76
Other Social Services - 7286 7286 2.17
Other - 69865 69865 20.83
General Administration
9707 30623 40330 12.02
Total 99036 236360 335396 99.94
Source: Seventh Malaysia Plan.
Table 20 Share of Government Expenditure on Social Policies, Annual Average (%)
Social Security Health Education
Gross Domestic Product
1972-79 0.77 1.68 5.63
1980-89 1.25 1.52 5.88
1990-95 1.47 1.46 5.39
Total Govt Expenditure
1972-79 3.11 6.71 22.45
1980-89 3.99 4.82 19.20
1990-95 5.51 5.49 20.03
Source: Ramesh (2000).
47

Table 21 Infant and Maternal Mortality Rates
1956–60 1961–1970 1971–1980 1990 2000
Infant Mortality Rates 73 49.35 32.5 16 8
Maternal Mortality Rate 2.81 1.88 0.89 0.2 0.2
Source: Ministry of Women and Family Development 2003.
Table 22 Fertility and Life Expectancy Rates
1957 1970 1980 1990 2000
Total Fertility Rate 6.7 5.0 4.2 3.8 3.0
Life Expectancy at Birth Male 56 63.5 66.4 68.8 69.9
Life Expectancy at Birth Female 58 68.2 70.5 73.4 74.7
Source: Ministry of Women and Family Development 2003.
Table 23 Literacy Rates in Malaysia
1957 1970 1980 1990 2000
Adult Literacy Rate Male - 72.1 80 90 91.4
Adult Literacy Rate Female - 49.6 64 80 83.5
Source: Ministry of Women and Family Development 2003.
Table 24 Labour Force Participation Rate by Sex, 1957–2000
Year 1957 1970 1980 1991 1995 2000
Male 88.7 79.3 84.8 85.3 84.3 83.3
Female 30.8 37.2 42.2 47.8 44.7 46.7
Source: Ministry of Women and Family Development 2003.
48
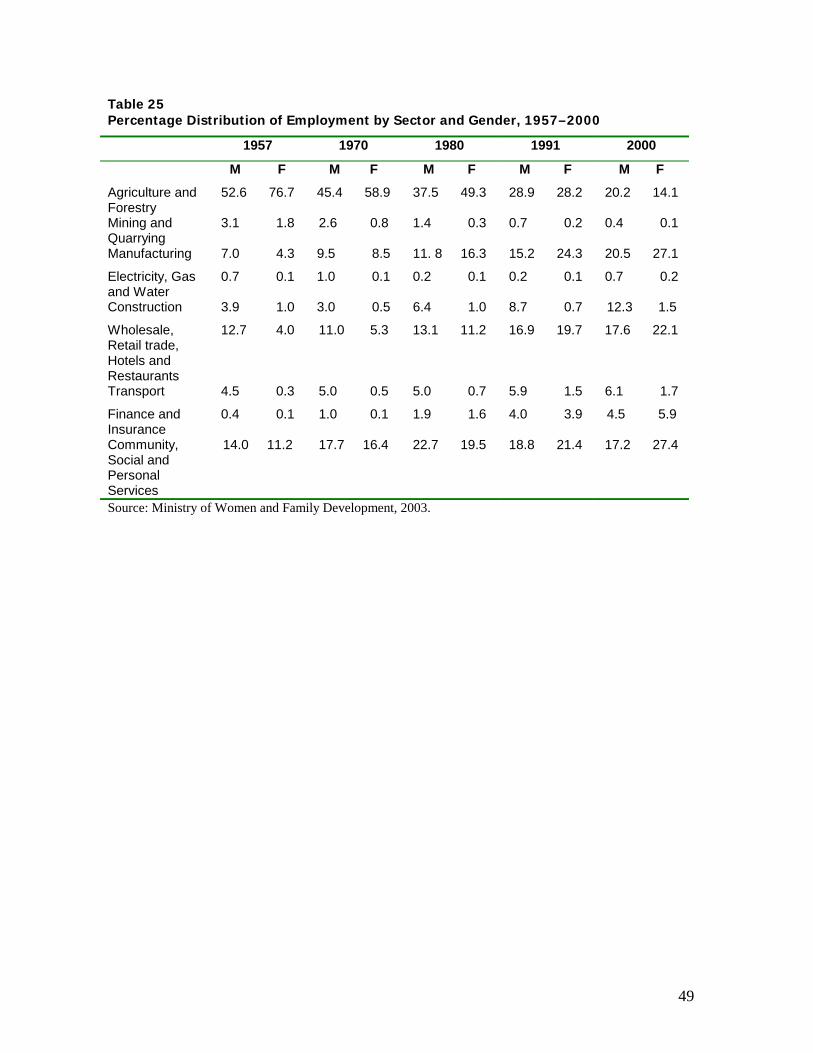
Table 25 Percentage Distribution of Employment by Sector and Gender, 1957–2000
1957 1970 1980 1991 2000
M F M F M F M F M F Agriculture and Forestry
52.6 76.7 45.4 58.9 37.5 49.3 28.9 28.2 20.2 14.1
Mining and Quarrying
3.1 1.8 2.6 0.8 1.4 0.3 0.7 0.2 0.4 0.1
Manufacturing 7.0 4.3 9.5 8.5 11. 8 16.3 15.2 24.3 20.5 27.1
Electricity, Gas and Water
1.0 0.1 0.2 0.1 0.2 0.1 0.7 0.2
Construction 3.9 1.0 3.0 0.5 6.4 1.0 8.7 0.7 12.3 1.5
Wholesale, Retail trade, Hotels and Restaurants
12.7 4.0 11.0 5.3 13.1 11.2 16.9 19.7 17.6 22.1
Transport 4.5 0.3 5.0 0.5 5.0 0.7 5.9 1.5 6.1 1.7
Finance and Insurance
0.4 0.1 1.0 0.1 1.9 1.6 4.0 3.9 4.5 5.9
Community, Social and Personal Services
14.0 11.2 17.7 16.4 22.7 19.5 18.8 21.4 17.2 27.4
0.7 0.1
Source: Ministry of Women and Family Development, 2003.
49
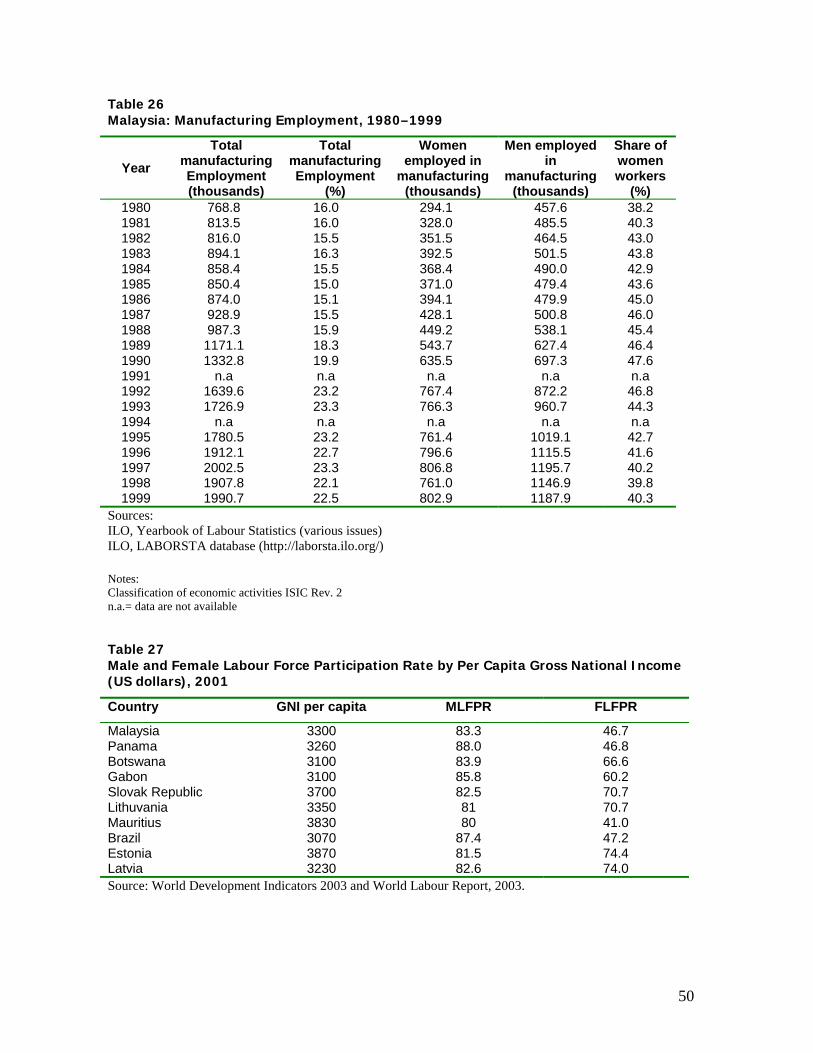
Table 26 Malaysia: Manufacturing Employment, 1980–1999
Year Total
manufacturing Employment (thousands)
Total manufacturing Employment
(%)
Women employed in
manufacturing (thousands)
Men employed in
manufacturing (thousands)
Share of women workers
(%) 1980 768.8 16.0 294.1 457.6 38.2 1981 813.5 16.0 328.0 485.5 40.3 1982 816.0 15.5 351.5 464.5 43.0 1983 894.1 16.3 392.5 501.5 43.8 1984 858.4 15.5 368.4 490.0 42.9 1985 850.4 15.0 371.0 479.4 43.6 1986 874.0 15.1 394.1 479.9 45.0 1987 928.9 15.5 428.1 500.8 46.0 1988 987.3 15.9 449.2 538.1 45.4 1989 1171.1 18.3 543.7 627.4 46.4 1990 1332.8 19.9 635.5 697.3 47.6 1991 n.a n.a n.a n.a n.a 1992 1639.6 23.2 767.4 872.2 46.8 1993 1726.9 23.3 766.3 960.7 44.3 1994 n.a n.a n.a n.a n.a 1995 1780.5 23.2 761.4 1019.1 42.7 1996 1912.1 22.7 796.6 1115.5 41.6 1997 2002.5 23.3 806.8 1195.7 40.2 1998 1907.8 22.1 761.0 1146.9 39.8 1999 1990.7 22.5 802.9 1187.9 40.3
Sources: ILO, Yearbook of Labour Statistics (various issues) ILO, LABORSTA database (http://laborsta.ilo.org/) Notes: Classification of economic activities ISIC Rev. 2 n.a.= data are not available Table 27 Male and Female Labour Force Participation Rate by Per Capita Gross National Income (US dollars), 2001
Country GNI per capita MLFPR FLFPR
Malaysia 3300 83.3 46.7 Panama 3260 88.0 46.8 Botswana 3100 83.9 66.6 Gabon 3100 85.8 60.2 Slovak Republic 3700 82.5 70.7 Lithuvania 3350 81 70.7 Mauritius 3830 80 41.0 Brazil 3070 87.4 47.2 Estonia 3870 81.5 74.4 Latvia 3230 82.6 74.0 Source: World Development Indicators 2003 and World Labour Report, 2003.
50

Table 28 Labour Force Participation Rates by Age Gender and Ethnicity, 2002 Age Group
Malay Female Participation
Rate
Malay Male Participation
Rate
Chinese Female
Participation Rate
Chinese Male
Participation Rate
Indian Female
Participation Rate
Indian Male
Participation Rate
15-64 45.6 80.2 45.6 80.4 45.2 81.4 15-19 17.9 26.6 12.0 19.2 17.2 29.4 20-24 58.6 79.6 60.1 72.7 59.8 82.6 24-29 61.9 96.7 73.4 96.9 60.8 96.9 30-34 54.2 97.9 58.5 98.1 55.4 98.9 35-39 51.8 98.5 50.8 98.9 58.6 98.8 40-44 51.8 97.8 49.3 98.4 55.1 96.9 45-49 50.1 96.5 47.2 96.9 44.4 93.2 50-54 40.2 92.9 35.2 92.5 31.0 89.0 55-59 29.3 73.2 27.6 73.6 12.9 64.8 60-64 21.0 59.7 15.8 53.3 7.6 46.2 Source: Labour Force Survey Report, Department of Statistics Malaysia, 2002.
Table 29 Percentage Distribution of Persons outside the Labour Force by Gender and Reasons for not Seeking Work, 2002
Reasons for Not Seeking Work Males Females Still at School 68.4 25.1 Housework 3.1 70.6 Going for Further Studies 2.2 0.9 Disabled 4.2 0.8 Not Interested 1.4 0.3 Retired 13.7 0.8 Other 7.1 1.5 Source: Labour Force Survey Report, Department of Statistics Malaysia, 2002.
Table 30 Labour Force Participation Rate (percent) by Educational Attainment and Gender, 2002
Educational Attainment Males Females No Formal Education 77.8 36.4 Primary 90.2 42.0 Secondary 79.5 45.1 Tertiary 73.7 58.9 Total 80.5 46.2 Source: Labour Force Survey Report, Department of Statistics Malaysia, 2002.
51

Table 31 Malaysia: Employment by Manufacturing Sub-Sector and Gender, 1968–1999
52
1968 1970 1975 1983 1985 1986 1987 1988 1989 1990 1991 1992 1993 1994 1995 1996 1997 1998 1999F n.a. n.a. n.a. 32.8 33.1 33.6 33.9 33.8 34.1 34.7 35.3 36 34.8 34.1 34.7 33.7 37.9 n.a. n.a.T 15 12.6 12.9 12.5 12.9 13.4 13.1 11.8 10.5 8.8 8.1 7.5 7.1 6.8 6.7 6.7 6.4 6.6 6.8F n.a. n.a. n.a. 29.3 29.8 29.6 29.4 31.3 30.2 33.3 34 34.1 30.2 33.3 32.7 32 38.2 n.a. n.a.T 2.1 2.1 1.4 1.2 1.2 1.1 1 0.8 0.6 0.5 0.4 0.4 0.3 0.3 0.4 0.3 0.4 0.4 0.4F n.a. n.a. n.a. 52.7 46.7 45.2 44.2 45.5 52 46.5 46.5 51.1 48.8 52.2 67.1 57.6 15.6 n.a. n.a.T 3 2.4 1.9 1.1 0.9 0.9 0.8 0.6 0.7 0.5 0.4 0.4 0.3 0.3 1.2 0.9 0.8 0.8 0.7F n.a. n.a. n.a. 64.5 64.1 65.1 65.1 63.9 61.3 58.2 57.8 54.2 52.6 49.1 45.3 48.3 49.2 n.a. n.a.T 3.6 5.1 10 6.7 5.7 5.7 5.5 5.4 5 4.5 4.6 4.1 3.9 3.5 3.4 3.5 3.3 3.4 3.3F n.a. n.a. n.a. 88.4 89.4 89.1 88.8 87.7 87.4 85.3 86.3 86 84.3 81.2 83.4 79.3 73.4 n.a. n.a.T 2.5 3.1 3.7 5.6 6.5 7.2 7.7 7.8 8 7.7 7.2 6.9 6.2 5.4 5.3 4.1 4.5 4.8 4.8F n.a. n.a. n.a. 66.7 66.7 50 52 57.1 71.4 61.1 66.7 66.7 63.6 60 58.6 62.1 70.8 n.a. n.a.T 0.2 0.3 0.2 0.1 0.1 0.1 0.1 0.1 0.1 0.2 0.3 0.2 0.2 0.2 0.2 0.2 0.1 0.2 0.2F n.a. n.a. n.a. 61.5 55.6 55.6 55.6 50 68.8 50 57.1 57.9 52.4 52.9 48 46.2 54.5 n.a. n.a.T 0.5 0.5 0.5 0.3 0.1 0.2 0.2 0.1 0.2 0.1 0.1 0.1 0.1 0.1 0.2 0.1 0.1 0.2 0.2F n.a. n.a. n.a. 23.5 24.1 24.6 26 25.6 25.4 26 27.7 28.8 29.1 30.1 32.2 31.4 35.3 n.a. n.a.T 18.6 20.3 15.5 12.9 11.4 11 10.9 10.7 10.7 10.7 9.9 10.6 11.2 11.3 10.6 10.3 10.6 10 8.8F n.a. n.a. n.a. 22.1 25.6 25.6 25.6 28.3 29.3 29.7 30.6 29.9 28.9 28.4 23.5 27.2 27.9 n.a. n.a.T 2.1 1.6 1.7 1.6 1.9 1.8 1.7 2 1.9 1.7 2.2 2.3 2.6 2.7 3 2.7 2.9 2.6 2.2F n.a. n.a. n.a. 42.4 38.6 39.4 33.3 32.7 33 33.3 32.7 31.8 31.9 32.8 31.9 31.1 34.1 n.a. n.a.T 1.2 1.1 1.2 1.3 1.4 1.5 1.7 1.7 1.6 1.6 1.6 1.7 1.6 1.6 1.7 1.6 1.7 1.6 1.7F n.a. n.a. n.a. 38.1 38.6 39 38.3 38.7 39.8 41.2 42.5 43.5 41.2 42.5 40.9 39.1 38 n.a. n.a.T 7.3 7.6 5 4 4.3 4.1 3.7 3.3 2.9 2.6 2.4 2.4 2.4 2.4 2.5 2.5 2.2 2.3 2.2F n.a. n.a. n.a. 18.5 15.9 16.7 16.9 15.2 16.3 16.3 15.5 16.1 15.8 16.3 15.7 15.9 18 n.a. n.a.T 0.8 1 1.1 1.1 1.3 1.4 1.4 1.3 1.2 1.1 1.2 1.2 1.1 1 0.9 1 1.1 1.1 1.1F n.a. n.a. n.a. 42.9 41.4 42.7 42.4 44 43.8 41.5 40.3 40.3 37.9 37.7 36.4 38.3 40.1 n.a. n.a.T 3.3 3.2 2.2 2 2 2 1.8 1.7 1.6 1.4 1.3 1.4 1.3 1.3 1.4 1.3 1.4 1.5 1.5F n.a. n.a. n.a. 11.1 7.1 6.7 9.1 9.1 9.1 9.1 8.3 8.3 7.7 11.1 11.1 7.7 10.8 n.a. n.a.T 0.7 0.6 0.2 0.2 0.2 0.3 0.2 0.2 0.2 0.1 0.1 0.1 0.1 0.2 0.2 0.1 0.2 0.3 0.2F n.a. n.a. n.a. 16.7 9.1 18.2 11.1 10 12.5 20 11.1 10 10 16.7 21.4 10 13.3 n.a. n.a.T 0 0 0.1 0.1 0.2 0.2 0.2 0.2 0.1 0.1 0.1 0.1 0.1 0.1 0.1 0.1 0.1 0.1 0.1F n.a. n.a. n.a. 40.7 41.8 43 44.8 48.8 50.3 50.3 50.8 50.2 49.7 47.1 44.1 42.4 45.3 n.a. n.a.T 13.3 12.5 9.4 6.1 5.9 6.8 7.3 7.9 7.6 7.1 6.6 6.3 6 5.6 5.4 4.8 5.2 5.6 5.9F n.a. n.a. n.a. 53 53.9 54.3 55.2 54.7 53.2 53.4 53.6 52.1 49.4 45.9 46.3 42.7 43.4 n.a. n.a.T 1.6 2.6 2.4 3.1 3.2 3.4 3.5 3.4 3.9 4.3 4.7 4.8 4.7 5.1 5.2 5.2 4.3 4.8 5.5F n.a. n.a. n.a. 52.6 56.5 57.7 62.2 60.4 57.8 59.2 56.4 58.4 57.8 51.9 46.1 42.6 54.5 n.a. n.a.T 0.3 0.2 0.2 0.4 0.4 0.5 0.9 0.8 0.9 0.8 0.8 0.7 0.7 0.6 0.6 0.4 0.4 0.4 0.4F n.a. n.a. n.a. 13 13 16.7 14.3 14.3 16.1 13.9 13.9 13.5 11.9 13.5 12.1 26.2 28.4 n.a. n.a.T 0.5 0.6 0.5 0.5 0.4 0.5 0.4 0.5 0.4 0.4 0.3 0.3 0.3 0.4 0.4 0.5 0.7 0.6 0.6F n.a. n.a. n.a. 21.2 21.5 21.7 20.2 21.2 20.3 19.6 19.4 20.1 18.8 18.1 17.6 16.5 16 n.a. n.a.T 4.9 4.4 3.9 4.4 4.7 4 3.4 3.1 3.1 3 2.9 2.8 2.6 2.6 2.7 3.1 3.3 3.5 3.3F n.a. n.a. n.a. 13.1 13.2 12.1 11.3 11.9 11.7 11.7 12.3 11.9 11.6 11.4 10.5 12.3 12.8 n.a. n.a.T 2 1.8 2.2 2 2.2 2.1 2.1 1.7 1.6 1.6 1.6 1.5 1.5 1.5 1.6 1.7 1.9 2.1 2F n.a. n.a. n.a. 15.6 16.1 16 11.1 10 14.7 16.7 16.1 18.8 17.8 19.2 17.4 16.7 22.4 n.a. n.a.T 0.2 0.2 0.3 0.7 0.6 0.5 0.5 0.5 0.5 0.5 0.6 0.6 0.6 0.6 0.6 0.7 0.6 0.7 0.6F n.a. n.a. n.a. 32.6 30.8 32.8 35.4 33.3 31.2 30.5 29.4 30.2 29.3 26.5 23.4 24 25.3 n.a. n.a.T 6.1 5.5 4.6 4.4 4.2 3.8 3.7 4 4 3.9 4 4.3 4 4 5.2 4.8 4.9 4.7 4.4F n.a. n.a. n.a. 13.4 17.3 16.7 17.6 19.6 19.2 25.2 33.7 34.2 35.8 31.3 29.7 46 41.7 n.a. n.a.T 4.5 4.2 3.2 2.9 2.8 2.8 2.8 2.7 2.6 3.2 3.5 3.4 3.9 3.8 4.6 3.8 5 4.5 4.5F n.a. n.a. n.a. 76.2 73.7 75.9 76.6 78 77.2 75.4 72.7 73.3 71.3 70.1 66.5 67 67.3 n.a. n.a.T 1.4 1.9 10.8 17.7 17.2 18.1 19.5 22.1 23.4 25.7 26.7 27.5 29.2 30.5 29 30.2 29.1 29.6 31.3F n.a. n.a. n.a. 17.6 19.8 19.7 22.2 21.6 20.3 20.7 21.4 20.4 19.8 20 20.2 17.2 21 n.a. n.a.T 2.8 3.2 3.9 4.3 4 3.3 2.8 2.5 2.9 3 3.2 3.2 3.3 3.5 3.7 3.8 4.1 4.3 4.1F n.a. n.a. n.a. 67.9 70.7 70.9 71.4 75 74.2 72.6 71.1 69.7 72.4 69.6 72.2 70.7 90.5 n.a. n.a.T 0.5 0.6 0.3 1.1 1.2 1.2 1.2 1.3 1.4 1.7 1.9 1.8 1.7 1.8 1.8 1.5 1.6 1.7 1.6F n.a. n.a. n.a. 67.1 69.5 75 73.3 73 66 62.8 62.7 61.1 59.4 59.4 52.1 57.8 70.7 n.a. n.a.T 1.1 0.9 1 1.5 1.7 2.1 2 1.9 2.1 2.1 2.1 2 1.7 1.6 1.4 1.6 1.5 1.6 1.5F n.a. n.a. n.a. 44.8 44.8 46.9 48.6 50.2 50.6 50.7 50.8 50.9 49.6 48.4 46.3 45.7 47 n.a. n.a.T 100 100 100 100 100 100 100 100 100 100 100 100 100 100 100 100 100 100 100
Wood and cork products 331
Total manufac. 3Source: UNIDO International Yearbook of Industrial Statistics (various issues) and UNIDO Industrial Statistics Database
Petroleum refineries 353
Food Products 311-2
Beverages 313
Tobacco 314
Textiles 321
Wearing apparel 322Leather and products
of leather 323
Footwear 324
Furniture Fixtures excl. Metallic 332
Non-electrical machinery 382
Electrical machinery 383
Rubber products 355
Plastics products 356Pottery, china and earthenware 361
Glass 362
Industrial Chemicals 351
Other chemicals 352
Products of petroleum and coal 354
Paper 341Printing and
Publishing 342
Transport equipment 384
Metal products 381
Prof. Scient. Equipment 385
Other manufactures 390
Other non metallic mineral prods. 369
Iron and steel 371Non-ferrous metals
372

53
Table 32 Share of Female Workers in Manufacturing, 1971–1997 1971 1979 1985 1990 1997
Professional 4.02 7.20 8.40 10.95 17.39
Non-Professional 4.75 7.78 10.46 13.71 22.52
Technical and Supervisory 6.49 19.75 15.99 19.39 19.81
Clerical and Related 28.57 50.27 55.57 61.85 68.90
General 10.27 17.63 29.22 20.35 18.13
Production Workers
Skilled 34.16 54.70 58.09 62.70 51.40
Semi-skilled na 40.60 39.18 53.73 48.08
Unskilled 40.30 54.70 55.32 60.02 51.60
Source: Rasiah, 2002. * includes semi-skilled workers Table 33 Employment by Sector, 1994–1999 (% annual change)
1994 1995 1996 1997 1998 1999
Agriculture Forestry and Fishing 3.2 2.9 -0.1 -1.6 -4.6 -0.1
Mining and Quarrying 5.5 -0.5 1.2 1.6 1.2 -0.7
Manufacturing 8.6 6.4 10.0 6.5 -4.1 4.0
Construction 9.9 20.2 11.0 10.1 -7.6 -0.7
Finance and Insurance 6.0 12.3 5.1 9.5 -2.6 0.6
Transport and Communications 6.4 7.3 3.7 5.8 0.4 1.5
Government Services 0.5 0.1 0.2 0.2 0.2 0.2
Other Services 2.1 8.4 5.3 5.8 2.1 2.1
Total 1.4 5.5 5.3 4.6 -2.5 1.7
Source: Jomo and Lee (2001).

Table 34 Number of Registered Retrenchments by Sector, 1998
Sector No of Retrenchments % of total
Manufacturing 45,021 54.0
Construction 9,294 11.1
Retail and Wholesale trade restaurant and Hotel
10,355 12.4
Finance, Insurance, Property and Business Services
6,502 7.8
Agriculture, Forestry and Fishing
5,108 6.1
Social Services 4,223 5.1
Other Services 2,938 3.5
Total 83,441 100.0
Source: Jomo and Lee (2001).
Table 35 Registered Unemployed by Gender, 1994–1999
End of Period
Total Job Seekers
Male No %
Female No %
1994 26445 15095 57.1 11350 42.9
1995 25546 13935 54.5 11611 45.5
1996 21747 11863 54.6 9884 45.4
1997 23762 12680 53.4 11082 46.6
1998 33345 18832 56.5 14513 43.5
1999 37315 19948 53.5 17367 46.5
Source: Jomo and Lee (2001).
54

Table 36 Malaysia: Manufacturing Wages by Gender, 1983–1997
Female Male Female as % of Male
1983 336 707 47.5% 1984 n.a. n.a. n.a 1985 407 825 49.3% 1986 400 844 47.4% 1987 401 838 47.9% 1988 393 848 46.3% 1989 420 864 48.6% 1990 443 885 50.1% 1991 495 952 52.0% 1992 558 1037 53.8% 1993 612 1082 56.6% 1994 677 1161 58.3% 1995 719 1242 57.9% 1996 842 1343 62.7% 1997 912 1449 62.9%
Source: ILO LABORSTA database (http://laborsta.ilo.org/) Note: Data refer to earnings per month (Ringgit) and employees
55

BIBLIOGRAPHY
Adams, Christopher and Cavendish, William, 1992, “Malaysia” in Christopher Adams, P. (eds) Adjusting Privatisation : Case Studies from Developing Countries James Curry London pp 211-277. Ahmad, Aminah, 1998, “Country Briefing Paper Women in Malaysia”, Asian Development Bank, Manila. Asher, Mukul, 2000a, Social Security Reform Imperatives: The Southeast Asian Case April Public Policy Program Working Paper Series 02-00 National University of Singapore http://www.fas.nus.edu.sg/ppp/faculty-wp.htm#2000 accessed on July 2004. Asher, M, 2000b, ‘Social Security’ in Ramesh, M (ed.), Welfare Capitalism in Southeast Asia: Social Security Health and Education Policies: Bassingstoke Macmillan; 30–80. Athukorala, P, 2001, Employment Intensive Development: The Malaysian Experience Study Prepared for the International Labour Office Geneva. Rspas.anu.edu.au/economics/staff/athu/athukorala/Malaysia/paper/202001 accessed on 2 April 2004. Bank Negara Malaysia, 1995, Second Quarter Quarterly Statistical Bulletin, Kuala Lumpur. Bank Negara Malaysia, 1996, Second Quarter Quarterly Statistical Bulletin, Kuala Lumpur. Bank Negara Malaysia, 2000, Second Quarter Quarterly Statistical Bulletin, Kuala Lumpur. Bank Negara Malaysia, 1995, Annual Report, Kuala Lumpur. Bank Negara Malaysia, 1996, Annual Report, Kuala Lumpur. Bank Negara Malaysia, 2000, Annual Report, Kuala Lumpur. Biddle, Jesse and Vidat Milor, 1999, “Consultative Mechanisms and Economic Governance in Malaysia” Private Sector Development Department Occasional Paper No. 38, World Bank, September. Bowie, Alasdair, 1991, Crossing the Industrial Divide: State, Society and Politics of Economic Transformation in Malaysia Colombia University Press. New York.
Braunstein, Elissa, 2000, “Engendering Foreign Direct Investment: Family Structure Labor Markets and International Capital Mobility” World Development, 20: 7: 1157–1172.
56

Bussink, William, 1980, “Employment and Income Distribution in Peninsula Malaysia” in Kevin Young, et al. (eds), Malaysia: Growth and Equity in a Multiracial Society. John Hopkins Press, Baltimore. Chan, P,1986, “The New Economic Policy and Restructuring of the Corporate Sector” in Chan P and Kenzo H. (eds) Impact of the New Economic Policy on the Malaysian Economy with Special Reference to Ownership and Control Institute of Developing Economies: Tokyo. Crouch, Harold, 1996, Government and Society in Malaysia Cornell University Press: New York. Department of Statistics Vital Statistics Department of Statistics, Kuala Lumpur.
Doling, John and Roziah Omar, 2002, “The Welfare State System in Malaysia” Journal of Societal and Social Policy, Vol. 1, pp.33–47.
Doraisami, Anita, 2004, “ From Crisis to Recovery : the Motivations for and the Effects of Malaysian Capital Controls” Journal of International Development Vol 16:2 : 241-254 Eisold, E, 1984, Young Women Workers in Export Industries; The Case of the Semi-conductor Industry in Southeast Asia World Employment Program Working Paper No. 30 International Labour Office Geneva. Faaland, Just, Jack Parkinson and Rais Saniman, 1990, Growth and Ethnic Inequality: Malaysia’s New Economic Policy. Hurst and Co.London. Gomez Terrence and Kwame Sundaram Jomo, 1997, Malaysia's Political Economy: Politics, Patronage and Profits: Cambridge University Press, Cambridge. Government of Malaysia, 1966, First Malaysia Plan, 1966–1970, Kuala Lumpur Government Printers. Government of Malaysia, 1971, Second Malaysia Plan, 1971–1975, Kuala Lumpur Government Printers. Government of Malaysia, 1976, Third Malaysia Plan, 1976–1980, Kuala Lumpur Government Printers. Government of Malaysia, 1981, Fourth Malaysia Plan, 1981–1985, Kuala Lumpur Government Printers. Government of Malaysia, 1986, Fifth Malaysia Plan, 1986–1990, Kuala Lumpur Government Printers. Government of Malaysia, 1991, Sixth Malaysia Plan, 1991–1995, Kuala Lumpur
57
Government Printers. Government of Malaysia, 1996, Seventh Malaysia Plan, 1996–2000, Kuala Lumpur Government Printers. Government of Malaysia, 2001, Eighth Malaysia Plan, 2001–2005, Kuala Lumpur Government Printers. International Labour Organisation, 2002, Men and Women in the Informal Sector: A Statistical Picture Geneva. Jesudason, James, 1989, Ethnicity and the Economy: The State, Chinese Business and Multinationals in Malaysia, Oxford University Press. Singapore. Jomo, Kwame Sundaram, 1986, A Question of Class: the State and Uneven Development in Malaysia Oxford University Press. Singapore. Jomo, Kwame Sundaram, 1990, Growth and Structural Change in the Malaysian Economy Macmillan London. Jomo, Kwame Sundaram, 2001, A Malaysian Eclipse: Economic Crisis and Recovery Zed Books: London and New York. Jomo, Kwame Sundaram, 2001b, Globalisation, Export-Oriented Industrialization, Female Employment and Equity in East Asia. Paper Prepared for the UNRISD Project on Globalisation, Export-Oriented Employment for Women and Social Policy. Jomo, Kwame Sundaram and Lee Hwok Aun, 2001, “Social Impacts” in Kwame Sundaram Jomo (ed.), A Malaysian Eclipse: Economic Crisis and Recovery Zed Books: London and New York. Labour Force Survey Report, Department of Statistics Government Printers Kuala Lumpur, 2002. Lall, Sanjaya, 1999, “Technology Policy and Competitiveness in Malaysia” in Jomo, Sundaram and Felker, Greg (eds) Malaysian Industrial Technology Policies, Routledge London and New York, pp.148–179. Lim, Lin Lean, 1993, “The Feminisation of Labour in the Asia-Pacific Rim Countries: From Contributing to Economic Dynamism to Bearing the Brunt of Adjustments in Naohiro Ogawa. et al. Human Resources in Development Along the Asia-Pacific Rim. Singapore Oxford University Press. Liu. Ohlin, 2000, “Overview” in Kanitta Meesook, Il Houng Lee, Ohlin, Liu, Yougesh
58

Khatri, Natalia Tamirisa, Michael Moore, and Mark Krysl (eds), et. al. (eds), Malaysia: From Crisis to Recovery. IMF Occasional Paper No. 207, Washington D.C., pp.1–2. Meesook, Kannita, 2001, “Comparative Review of Policies and Performance, 1997–2000”. in Kanitta Meesook, Il Houng Lee, Ohlin, Liu, Yougesh Khatri, Natalia Tamirisa, Michael Moore, and Mark Krysl (eds), et. al. (eds) Malaysia: From Crisis to Recovery. IMF Occasional Paper No. 207, Washington D.C., pp.3–27. Ministry of Women and Family Development, 2003, The Progress of Malaysian Women Since Independence: 1957–2000. Ministry of Women and Family Development, Kuala Lumpur. Milanovic, Branko, 2001, Inequality and Determinants of Earnings in Malaysia. Paper delivered at the Asia and Pacific Forum on Poverty: Reforming Policies and Institutions for Poverty Reduction Asian Development Bank Manila, 5–9 February. Ong, Hong Cheong, 1998, “Coping With Capital Flows and the Role of Monetary Policy: the Malaysian Experience 1990–95 in C.H. Kwan, and Siow Yue Chia (eds) Coping with Capital Flows, Institute of Southeast Asian Studies: Singapore. Ramesh, M and Ian Holliday, 2001, The Health Care Miracle in East and Southeast Asia; Activist State Provision in Hong Kong, Malaysia and Singapore Journal of Social Policy Vol. 30, No. 4, pp.637–651. Ramesh, M, 2000, Welfare Capitalism in Southeast Asia: Social Security Health and Education Policies Macmillan: Bassingstoke. Rasiah, Rajah, 1995, Foreign Capital and Industrialisation in Malaysia Macmillan: Bassingstoke. Rasiah, Rajah, 2000a, “Pre-crisis Weaknesses and Vulnerabilities in Jomo, K, (ed.) Malaysian Eclipse: Economic Crisis and Recovery Zed Books: London and New York, pp. 47–66. Rasiah, Rajah, 2001b, “Southeast Asia’s Ersatz Miracle: The Dubious Sustainability of its Growth and Industrialisation” in Jomo, K S, (ed.) Southeast Asia’s Industrialization: Industrial Policy, Capabilities and Sustainability Palgrave Basingstoke Hampshire, pp.86–112. Rasiah Rajah, 2002, Manufactured Exports, Employment, Skills and Wages in Malaysia Employment Paper 35, International Labour Organisation, Geneva. Rudner, Martin, 1975, Nationalism Planning and Economic Modernisation in Malaysia: The Politics of Beginning Development Sage Publications, London. Rudner Martin, 1980, “Trends in Malaysian Development Planning: Goals, Policies and
59
Goal Expansion Review of Indonesian and Malaysian Affairs, Vol. 14, No. 12, pp.48–91. Rugayah, Muhamad, 1995, “Public Enterprises” in Jomo, K S (ed.), Privatising Malaysia Westview Press: Boulder Colorado. Schmidt, J, 1998, Southeast Asia Between Global Neoliberal Discipline and Local Quests for Welfare Asia Research Centre Working Paper No. 84, Murdoch University Freemantle. Searle, Peter, 1999, The Riddle of Malaysian Capitalism: Rent Seekers or Real Capitalists? Allen and Unwin and University of Hawaii Press Sydney and Honolulu. Seguino, Stephanie, 2000, “Gender Inequality and Economic Growth” World Development, Vol. 28, No. 7, pp.1211–1230. Seguino, Stephanie, 2002, “Gender, Quality of Life and Growth in Asia 1970–1990, The Pacific Review, Vol. 15, No. 2, pp.245–277. Singh, Ajit and Ann Zammit, 2000, “International Capital Flows: Identifying the Gender Dimension”, World Development, Vol. 28, No. 7, pp.249–1268. Snodgrass, Donald, 1980, Inequality and Economic Development in Malaysia Oxford University Press: Kuala Lumpur. Tan, Tat Wai, 1982, Income Distribution and Determination in West Malaysia Oxford University Press: Kuala Lumpur. United Nations Development Program, 2003, Human Development Report Oxford University Press, New York. Warr, Peter, 1986, “Malaysia’s Industrial Enclaves: Benefits and Costs in T.G. Mc Gee (ed.) Industrialisation and Labour Force Processes: A Case Study of Peninsula Malaysia Canberra: Australian National University. World Bank, 1995, “Malaysia Meeting Labour Needs: More Workers and Better Skills” Report No. 13163–MY Country Operations Division Country Department 1 East Asia and the Pacific Region. World Bank 2004 EnGendering Development- Through Gender Equality in Rights, Resources and Voice Oxford University Press, New York. World Development Indicators, 2003, International Labour Office, Geneva. World Labour Report, 2003, United Nations Development Program, New York.
60

61