the future of urban mobility 2.0 - uitp
TRANSCRIPT

Imperatives to shape extended mobility ecosystems of tomorrow
The Future of Urban Mobility 2.0
January 2014

Content
Forewords 3
1. Executive summary 5
2. Plotting the trend – Urban mobility systems are on their way to breakdown 9
3. Where are we now? Arthur D. Little Urban Mobility Index 2.0 11
4. What is holding back changes? Business models archetypes for urban mobility 22
5. Shaping the future – Strategic directions and imperatives for cities 27
6. Case studies of cities demonstrating good practices 51
Authors:
François-Joseph Van AudenhovePartner, Arthur D. Little, Brussels
Laurent DaubyDirector Rail Transport, UITP
Jérôme PourbaixHead of Policy and Outreach, UITP
Oleksii KorniichukManager, Arthur D. Little, Frankfurt
Acknowledgement for their support and valuable input: Wilhelm Lerner (author of the first edition of the study), Ralf Baron, Aurelia Bettati, Marie Maggiordomo, Marc Durance, Lucie Lammens and Caroline Cerfontaine.
The Urban Mobility Index 2.0 was developed by Arthur D. Little; the UITP is independent of this index, which does not necessarily reflect its opinion. Strategic imperatives for cities have been developed together with the UITP.

3
Mobility has significantly evolved in the past, under the influence of industrial evolutions. Following the first industrial revolution enabled by the invention of steam powered technology, the railway industry emerged. The second industrial revolution with mass production enabled the emergence of the automobile industry and, closer to us, the third industrial revolution with digitalization enabled the emergence of computer-aided travelling (for example GPS in a car). Today we are entering what could be called a fourth industrial revolution, represented by industry and technology convergence, leading to the emergence of for example clean energy vehicles or connected mobility solutions. This evolution is particularly noticeable over past years in network industries (such as telecommunication and media, utilities and the mobility industry) as well as in B2C industries (such as retail and healthcare) where, driven by evolving customer needs and enabled by rapidly evolving technology, business models are continuously evolving.
In this new world, in order to meet the key challenges of today and the future, organizations cannot only rely on optimizing their operations or pushing the next products generation to market. To be successful and meet evolving customer’ needs, they need to adapt to this new changing world by continuously finding ways to reinvent themselves. This successful transformation can only be enabled by system-level collaboration and innovation.
As a global management consultancy, linking strategy, technology and innovation, Arthur D. Little aims to help its clients succeed in this “new world of innovation.” The Future of Urban Mobility (FUM) Lab is our contribution to tackle the urban mobility challenge. With its FUM studies, Arthur D. Little aims to support cities and nations in shaping the extended mobility ecosystems of tomorrow and facilitate an open dialogue between urban mobility stakeholders. Our Mobility Lab initiative has reached a new dimension in 2013, with the signature of an exclusive partnering agreement with the International Association of Public Transport (UITP) for the co-development of future of urban mobility studies; which in our view constitutes the ideal partner due to its global representation amongst mobility actors and the depth of expertise of its practitioners in the field of mobility.
With the release of this second edition of the Future of Urban Mobility study, our aim is to provide mobility decision-makers and stakeholders with reflections and guidance on devising sustainable strategies that are meeting current and future evolving mobility challenges. We hope you will find this report useful and we would be pleased to discuss its conclusions and the implications for your organization.
Sincerely
Ignacio Garcia-Alves François-Joseph Van Audenhove
Arthur D. Little Global CEO Partner
Forewords

4
The Arthur D. Little study “The Future of Urban Mobility – Towards networked, multimodal cities of 2050” had triggered the interest and attention of UITP when it was released in 2011; and for us it was natural to feature it in the main plenary session of our World Congress last May.
When we were approached by Arthur D. Little to work together on a second edition of the study, the UITP immediately saw a great opportunity to further convey its own messages developed since 2009 in our PTx2 strategy, later labeled “Grow with public transport”.
This strategy for the public transport sector sets out the ambitious aim to double the market share of public transport worldwide by 2025 and pinpoints the key areas where action is urgently needed.
Current trends indicate that more people will choose to use private motorized transport, leading to a staggering 6.2 billion private motorized trips every day in cities of the world. If the world fails to change its mobility habits, the future of our planet looks decidedly bleak. By 2025, worldwide transport-related greenhouse gas emissions will be 30% higher than 2005 levels. Transport energy bills will also skyrocket and higher levels of energy consumption could pose a threat to global energy security. Traffic congestion will bring cities worldwide to a standstill. Most alarmingly, half a million people will be killed in road traffic accidents every year.
Thankfully, more and improved public transport offers a route to a better future. By doubling the market share of public transport worldwide by 2025, cities will be able to boost growth, help fight climate change and create pleasant urban environments where people and businesses can thrive. Doubling the market share of public transport will enable the stabilization of urban transport greenhouse gas emissions and energy consumption despite overall mobility increase. In 2025, 60,000 lives will be saved, as a more balanced mobility mix will lead to fewer urban traffic fatalities. Doubling the market share of public transport would also create seven million green, local jobs.
We took the city ranking proposed by Arthur D. Little as a starting point to perform and refine our analysis of today’s mobility situation in view of tomorrow’s requirements. Cities are clustered around their development stage and are given a series of strategic recommendations to overcome current limitations to achieve the objective of “networked mobility”.
I would like to thank Arthur D. Little for their fruitful cooperation and welcome this joint effort by two prestigious and reputable organizations. I hope that our joint study will inspire and help many decision-makers and readers.
Sincerely
Alain Flausch
UITP Secretary General

5
Arthur D. Little, the Global Management Consultancy, launched its “Future of Urban Mobility” lab in 2010 and in 2011 released its first global study highlighting the mobility challenges cities face on a worldwide basis. This report introduced the first Arthur D. Little Urban Mobility Index, which assessed the mobility maturity and performance of 66 cities worldwide, and triggered high interest within the mobility industry and in the media on a global scale.
January 2014 sees Arthur D. Little release the second version of the “Future of Urban Mobility” study, including an updated version of the Urban Mobility Index, with an extended scope of 84 cities worldwide as well as an extended set of criteria. The index finds most cities are still badly equipped to cope with the challenges ahead indicating there is still significant potential for improvement.
Arthur D. Little highlights what is holding cities back, and, together with its partner the UITP – the International Association of Public Transport – identifies three strategic directions for cities to better shape the future of urban mobility. The study also describes 25 imperatives to consider when defining sustainable urban mobility policies and case studies of cities demonstrating good practice.
1. Executive Summary

6
1.1. Arthur D. Little Urban Mobility Index 2.0 – The most comprehensive global urban mobility benchmarking study
Plotting the trend
Urban mobility is one of the toughest challenges that cities face today as existing mobility systems are close to breakdown.
The world’s population is increasingly city-based. 53% of the population currently lives in urban areas and by 2050 this number is expected to reach 67%. Today, 64% of all travel made is within urban environments and the total amount of urban kilometers travelled is expected to triple by 2050. Delivering urban mobility to cope with this increasing demand will thus require massive investment in the future.
In addition to the increasing demand for urban mobility, mobility needs are evolving. Changing travel habits, demand for services to increase convenience, speed and predictability, as well as evolving customer expectations toward individualization and sustainability will require mobility services portfolio extension as well as business model transformation, while specialized players from other sectors are assessing opportunities to play a role in the extended mobility ecosystem.
Moreover, in order to reach UITP’s objective of “doubling the market share of public transport worldwide by 2025” (compared to the 2005 level), public transport stakeholders are working hard to improve attractiveness, capacity and efficiency of mobility systems despite growing limitations of public financing, demonstrating the need for system level innovation.
Methodology
Using 19 criteria Arthur D. Little assessed the mobility maturity and performance of 84 cities worldwide. The mobility score per city ranges from 0 to 100 index points; the maximum of 100 points is defined by the best performance of any city in the sample for each criteria. In addition, Arthur D. Little has reviewed policy initiatives undertaken by cities to improve the performance of urban mobility systems.
Where are we now?
The overall results find most cities are still badly equipped to cope with the challenges ahead. The global average score is 43.9 points, meaning that, on average, the 84 cities achieve less than half of the potential that could be reached today if applying best practices across all operations.
Only 11 cities score above 52 points (the top 20% of the score range). The highest score (58.2 points) went to Hong Kong
followed closely by Stockholm (57.4 points) and Amsterdam (57.2 points), still indicating potential for improvement.
There are big differences between the top- and low-end performers in various regions:
n Europe achieves the highest average score of the six world regions surveyed, with an average of 49.8 points (51.5 points for Western Europe and 45.2 for (South)-Eastern Europe) and nine out of the 26 analyzed European cities scoring above 52 points. European urban mobility systems are the most mature ones as of today and lead the way in mobility performance. Stockholm (57.4), Amsterdam (57.2) and Copenhagen (56.4 points) head the table – while Athens (40.0 points), Rome (40.9 points) and Lisbon (41.3) are the worst European cities in the sample.
n Latin American and Asian Pacific cities show slightly below average performance. The continents’ average scores are well below Western Europe (43.9 and 42.8 points respectively) but outperform other regions in public transport-related criteria (financial attractiveness of PT, share of modal split, smart cards). Most cities in Latin America show an average performance of between 40 and 47 points, while Asian Pacific cities show the broadest range in performance, from Hong Kong and Singapore with scores of 58.2 and 55.6 respectively – sitting at the top of the global table – down to Hanoi with 30.9 points.
n USA/Canada shows average performance with 39.5 points. Given their orientation towards cars, USA/Canadan cities rank bottom worldwide in terms of maturity. In terms of performance, they perform above average overall, but show poor results with regard to number of cars per capita and CO2 emissions. New York leads the way with 45.6 points, followed closely by Montreal with 45.4 points.
n Africa and the Middle East are the lowest performing regions with respective average point totals of 37.1 and 34.1. Whilst urban mobility systems in Africa perform well on several criteria due to the lower number of cars, they are still at an evolving stage and haven’t reached sufficient maturity yet. Middle East cities have high levels of cars per capita and are expected to invest in development of environmental modes of transport in the mid-term perspective.
What is holding back change?
A comprehensive review of technologies and urban mobility business models reveals sufficient availability of solutions to address the mobility challenges. In its 2011 study1, Arthur D. Little identified three long-term business models archetypes
1 Arthur D. Little, “Future of Urban Mobility. Towards Networked, Multimodal Cities of 2050”, 2011

7
for mobility suppliers (the “Amazon”, “Apple” and “Dell” of urban mobility). Those business models still hold true today and each have interesting development potential. However, these solutions and archetypes are currently not being applied comprehensively.
There is a clear trend towards shared mobility: in complement to conventional public transport, more cars and bikes are being shared in cities, both via peer-to-peer and business-to-consumer models, but many of those concepts haven’t yet managed to take off as providers are still testing different business models.
Why is the innovation potential not being unleashed? There is a key reason: the management of urban mobility operates in an environment that is too fragmented and hostile to innovation. Our urban management systems do not allow market players to compete and establish business models that bring demand and supply into a natural balance. It is one of the toughest system-level challenges facing actors of the mobility ecosystems. There are plenty of solutions and business models available, but very few have managed to smartly integrate them to unleash their full business potential. What is needed is system-level collaboration between all stakeholders of the mobility ecosystem to come up with innovative and integrated business models.
Moreover, many mature cities do not yet have a clear vision and strategy on how their mobility systems should look in the future. The lack of synergies between isolated initiatives leads to a sub-optimal outcome in terms of mobility performance, which calls for a more holistic approach. At a different level, integration between regional mobility systems still remains very low in comparison to other parts of the economy as transport infrastructures were historically designed to serve regional rather than supra-regional goals. In that context, there is a need for stronger alignment between regional mobility strategies while respecting each-others accountabilities and ensuring solutions are adapted to local contexts.
1.2. Strategic imperatives for cities to shape extended mobility systems of tomorrow
Three strategic directions for cities
To meet the urban mobility challenge, cities need to implement one of the following three strategies dependent on their matu-rity and the share of sustainable transport in their modal split:
n Rethink the System: Cities in mature countries with a high proportion of motorized individual transport need to shape political agendas to fundamentally redesign their mobility systems so that they become more orientated towards
public transport and sustainability. The majority of cities in the index (53 out of 84) belong to this group.
n Network the System: For mature cities with a high share of sustainable transport modes, the next step must be to fully integrate the travel value chain to foster seamless, multimodal mobility while ensuring “one face to the customer” and to increase the overall attractiveness of public transport by service extension. This group contains the majority of cities in Europe as well as Hong Kong, Singapore, Seoul, Tokyo, Toronto and Buenos Aires.
n Establish Sustainable Core: For cities in emerging countries with partly underdeveloped mobility systems, the aim must be to establish a sustainable mobility core that can satisfy short term demand at a reasonable cost without replicating mistakes from developed countries. With access to emerging transport infrastructure and technologies, these cities have the opportunity to become the test-bed and breeding ground for tomorrow’s urban mobility systems.
Four dimensions for cities to consider when defining sustainable urban mobility policies
n Visionary Strategy and Ecosystem: Establishing sustainable urban mobility policies requires cities to develop a political vision and urban mobility objectives based on strategic alignment between all key public and private stakeholders of the extended mobility ecosystem. This should inform a visionary urban mobility strategy (priorities and investments to achieve mobility objectives), which ensures the right balance between stretch and achievability.
n Mobility Supply (solutions and lifestyles): Responding to increasing demand for urban mobility and to consumer and business needs for seamless, multimodal urban mobility requires cities to extend their public transport offering and adapt it from “delivering transport” to “delivering solutions”. This transformation can be achieved through a combination of quality improvements to the current public transport offering and an increase of customer experience via service offering extension through partnerships and alliances with third parties.
n Mobility Demand Management: The limited capacity of current mobility systems and the level of investment required for the development of transport infrastructure means mobility service extension must also be complemented with measures to manage the demand side. Mobility demand management is a delicate discipline which can easily meet strong resistance if not properly planned and executed. However, a number of measures exist and some of these have already derived clear benefits, the relevance of which should be assessed by cities against the local context.

8
n Public Transport Financing: Devising the right funding mix for public transport is a critical priority for cities to ensure its financial viability, particularly given that funding needs are increasing significantly due to growing supply, rising quality expectations and the rising cost of production factors. As fare revenues do not always evolve in line with the costs of production factors and the public debt crisis is increasing pressure on public resources, transport authorities and operators need to assess opportunities to derive additional revenues from aggregation of third party services and to perceive charges from indirect beneficiaries of public transport.
A system-level approach across these four dimensions is critical: sustainable improvements of a city’s mobility performance requires simultaneous improvement on each of the four dimensions as the weakest link will influence overall mobility performance.
In this study Arthur D. Little and the UITP elaborate further on those dimensions and identify 25 imperatives for cities to consider when defining sustainable urban mobility policies. The study also includes case studies of cities demonstrating good practice.

9
All around the globe people are flocking to cities. In 2007, UN population figures showed that more than a half of the world’s population for the first time lived in urban areas. That proportion is set to rise to 60% by 2030 and 67% by 2050.
This mushrooming in urban population will be accompanied by a massive growth in the number of individual journeys taken on a daily basis. Today, 64% of all travel kilometers are made in urban environments but the number of urban kilometers travelled is expected to treble by 2050. Such an explosion in the growth of urban mobility systems will present new challenges on a number of different fronts (see Figure1).
n Planet: At a time when sustainability of resources and the environment is increasingly at the forefront of one’s mind, a logarithmic increase in the use of motorized transport raises the specter of a vast rise in air and noise pollution and CO2 emissions. Indeed, it is predicted that by 2050 urban mobility systems will use 17.3% of the planet’s bio capacities, five times more than they did in 1990.
n People: An inevitable consequence of an unreformed and under-invested urban mobility system is gridlock. By 2050, the average time an urban dweller will spend in traffic jams will be 106 hours per year, twice the current rate, with all that entails for the quality of life of the average citizen.
n Profit: Unless far-sighted decisions relating to service expansion and innovation are made now, the cities of the future stand to sleepwalk into a situation where they have insufficient public transport, overloaded infrastructures, a default expansion of motorized means of transport and a concomitant parking capacity problem. Given that urban infrastructure is a key factor in luring businesses to cities, this would be highly damaging commercially.
Meanwhile, mobility needs are evolving all over the world. People’s travel habits are changing, as is the mix of transport modes and services offered to them. But it is clear that, going forward, transport providers will have to satisfy demand for services that are increasingly convenient, fast and predictable. At the same time, consumers are becoming more concerned about the sustainability of their mode of travel and some are prepared to sacrifice individual forms of transport in furtherance
2. Plotting the trend Urban mobility systems are on their way to breakdown
Air pollution CO2 emissions Noise Increasing ecological
footprint
9,306
CAGR 2010-50 -0.2% p.a.
CAGR 2010-50 +1.4% p. a.
2050
33%
67%
2030
8,321
40%
60%
2010
6,896
48%
52%
Rural Urban
Urban and rural population, 2010-2050 [m people; %]
Urban mobility demand, 2010-2050 [trillions pkm p.a.; %]
67.1
2.6x
+55%
+68%
2050 2030
43.2
2010
25.8
Pla
net
Pe
op
le
Pro
fit
Traffic chaos Traffic security Traffic jam Decreasing quality of life and
convenience
Overloaded infrastructures Insufficient public transport
capacities Increasing motorization Limited parking places
The world is becoming increasingly urban
Urban mobility demand explodes Cities are confronted with new
challenges
Source: UN Population Division, Schäfer/Victor 2000, Cosgrove/Cargett 2007, Arthur D. Little
Figure 1: The future of earth will be urban…

10
of that cause, leading to the successful introduction and rapid penetration of new mobility services such as car sharing and bike sharing.
Due to limits on public financing, however, public transport stakeholders are struggling to improve the attractiveness, capacity and efficiency of public transport and system innovation may be the only answer. At the same time, specialized players from other sectors – notably automotive OEMs, financial institutions/payment providers and internet businesses – are assessing opportunities to play a role in the extended mobility ecosystems of tomorrow. All this raises the question: what will the future business model(s) of urban mobility be?
The good news is that people are beginning to get the message. The Siemens Megacity Challenges Study found that mobility was cited as the most important issue for cities when it came to attracting investment, with 27% of respondents mentioning it, three times more than the second mentioned factor, security (see Figure 2).
When the above study asked which sectors had the highest need for investment in cities, no less than 86% of the sample opted for mobility as the number one priority, with education and the environment tying in second place with 77%. That said, the scale of investment required to cope with the mobility challenge is immense. In 2010, the global investment in urban mobility amounted to 324 bn EUR. By 2050, it is forecast that 829 bn EUR a year will be required.
Figure 2: Mobility is the n°1 priority for cities and will require significant investment
Source: Siemens, Bureau of Transport Statistics, Arthur D. Little 1) Siemens “Megacity Challenges Study” 2) % saying high need for investment 3) Percentage of respondents
829
665
534429
324245
185
0
200
400
600
800
1.000
1990 2000 2010 2020 2030 2040 2050
34
566666
927
Water supply Health
Environment Culture
Energy supply Education
ICT City management
Security Mobility
Global urban mobility investment volume in bn EUR Urban mobility infrastructure is the n°1 priority area for cities in attracting investors 1) 3)
In 1990 investment amount in global urban mobility equaled 185 bn EUR
For 2050 the need of 829 bn EUR is being forecasted (growth by the factor 4.5)
Mobility: Priority n°1 for cities Constant growth of investments in urban mobility
Public housing
Social services 66 Energy supply 67
77 Education
69 Water supply 70
74 Security 71
Health
71
Environment
Mobility
Waste management
86 77
Highest needs for investment in cities 2007-2017 1) 2)

11
3.1. Index design: scope and methodology
The reform of urban mobility systems is one of the biggest challenges confronting policymakers, stakeholders and users today, and to do it justice the urban mobility index required a commensurately ambitious approach. Arthur D Little’s researchers worked on seven geographical areas across six continents to study the status quo, and this year’s index is more comprehensive than ever, with 18 more cities scrutinized than for the last report (see Figure 3).
The largest group of cities in the index was the Megacity group of the C40 Climate Leadership Group, a network of the world’s cities committed to addressing climate change. The next biggest was the 24-strong group of cities selected on the basis that they represent the largest metropolises determined by GDP share of region and population, which are not members of the C40 group. This included no fewer than six cities in China and four in
India. The final group was made up of smaller cities with good practices, which are useful as role models for others. Europe dominated this group with 14 of the 20 places.
The Mobility Index assessed cities on the basis of 19 criteria. 11 of these were related to how mature the city under examination was in terms of its existing infrastructure, from public transport’s share of the modal split to smart card penetration. These indicators made up 58 possible points of the maximum of 100 available. The other 42 points were awarded on the basis of performance, with categories including the level of transport-related CO2 emissions and the mean travel time to work (see Figure 4 overleaf).
3. Where are we now? Arthur D. Little’s Urban Mobility Index 2.0
Americas Europe, Middle
East & Africa Asia Pacific
“Megacities”-cluster of C40 Cities Climate
Leadership Group
World’s largest cities
determined by GDP share1)
Smaller cities with good practices
40
24
20
Africa
Addis Ababa Cairo
Europe
Athens Berlin Istanbul
Middle East
Baghdad Tehran
Asia
Bangkok Delhi Dhaka Hanoi
USA/Canada
Chicago Houston Los Angeles New York Philadelphia Toronto Washington D.C.
Latin America
Bogota Buenos Aires Caracas Lima Mexico City Rio de Janeiro Sao Paulo
Pacific
Melbourne
London Madrid Moscow
Johannesburg Lagos
Paris Rome Warsaw
Ho Chi Minh Hong Kong Jakarta Karachi
Mumbai Seoul Tokyo
Sydney
Munich Stockholm Vienna Zurich Nantes Hanover
Kuala Lumpur Singapore
Amsterdam Copenhagen Frankfurt Prague Stuttgart Brussels
Helsinki Dubai
Ankara Bangalore Beijing Chennai Guangzhou Hyderabad Kolkata
Atlanta Boston Dallas Miami
Europe
Barcelona Lisbon St. Petersburg
Africa
Kinshasa
Lahore Manila Osaka Shanghai Shenzhen Tianjin Wuhan
22 33 29
Portland Montreal
Curitiba Santiago de Chile
Source: Arthur D. Little Urban Mobility Index 2.0; 1) not included into group 1 (C40 Megacities)
Figure 3: Our benchmark sample includes 84 cities covering seven geographical regions across all continents

12
The selection of the criteria used to measure the maturity and performance of the cities under examination was governed by a desire to cover the classical areas of mobility measurements – security, quality, accessibility, affordability, sustainability, innovativeness and convenience – while finding the right balance between the supply side, and the demand side, as well as overall mobility policy initiatives. The selection of the measurement criteria was also driven by the ability to obtain data in all the territories covered, which proved impossible in some cases (e.g. measurement of accessibility by the number of public transport stops per square kilometer) as certain statistics are not collected in some regions of the world. We trust however that, taken as a whole, the 19 criteria make for a representative and comprehensive view of cities’ mobility.
When it came to weighting the criteria, it was decided to award a number of them a lower maximum weighting than others. This has been done to avoid penalizing cities unfairly. When it comes to urban agglomeration density, for example, a densely populated city such as Tokyo would rate highly for public transport provision over the much less densely populated Atlanta, where such a solution might not be the answer. The authors of the report were also keen not to penalize mature cities with long established road densities, for example, on the basis that this was an indicator over which they had little if any influence (see Figure 5 overleaf).
Arthur D. Little Urban Mobility Index 2.0 – Assessment criteria
Maturity [max. 58 points]
Performance [max. 42 points]
Criteria Weight1
1. Financial attractiveness of public transport 4
2. Share of public transport in modal split 6
3. Share of zero-emission modes in modal split 6
4. Roads density 4
5. Cycle path network density 6
6. Urban agglomeration density 2
7. Smart card penetration 6
8. Bike sharing performance 6
9. Car sharing performance 6
10. Public transport frequency 6
11. Initiatives of public sector 6
Criteria Weight1
12. Transport related CO2 emissions 4
13. NO2 concentration 4
14. PM10 concentration 4
15. Traffic related fatalities 6
16. Increase of share public transport in modal split 6
17. Increase of share of zero-emission modes 6
18. Mean travel time to work 6
19. Density of vehicles registered 6
1) The maximum of 100 points is defined by any city in the sample for each criteria Source: Arthur D. Little Urban Mobility Index 2.0
Figure 4: Arthur D. Little Urban Mobility Index 2.0 assessment criteria

13
Criteria Weight1
1. Financial attractiveness of public transport
4
2. Share of public transport in modal split
6
3. Share of zero-emission in modal split 6
4. Roads density 4
5. Cycle path network density 6
6. Urban agglomeration density 2
7. Smart card penetration 6
8. Bike sharing performance 6
9. Car sharing performance 6
10. Public transport frequency 6
11. Initiatives of public sector 6
Definition
Ratio between the price of a 5 km journey with private means of transport and the price of a 5 km journey with public transport within the agglomeration area
Private means of transport: car or motorcycle, depending on what vehicle type dominates in modal split Cost of journey with motorized-individual transport: fuel cost only, based on fuel consumption and fuel price
including taxes; average for gasoline and diesel cost taken Cost of public transport journey: ticket cost for a 5 km distance trip Percentage of the total number of person trips which are made with pubic transport in the last available
measurement Modal split definition: trips made by residents of the urban agglomeration; both motorized and non-motorized
trips; trips for all purposes; trips on both working days and weekends Percentage of the total number of person trips which are made by bicycle and walking in the last available
measurement
Ratio between the total road length in an urban agglomeration and the urbanized surface area Total road length definition: all roads open to public traffic (both paved and non�paved) incl. motorway network
and excl. farmland, forest and private roads located within the urban agglomeration borders Measured as a deviation from an optimum value. Optimum value for road density according to Fei (2011)2) is:
average for core city 11,0 km/km2, average for suburbs 3,7 km/km2, average for mixed territories 7,35 km/km2
Ratio between the total length of cycle lanes and cycle paths in an urban agglomeration and the urbanized surface area of this urban agglomeration
Cycle lane: A lane marked on a road with a cycle symbol, which can be used by cyclists only Cycle path: An off-road path for cycling incl. exclusive cycle paths (for cyclists only), shared-use paths (for
both cyclists and pedestrians), and separated paths (where section for cyclists’ use is separated from the pedestrians’ section)
Ratio between the population of an urban agglomeration and its urbanized surface area Urban agglomerations taken as defined by the United Nations’ in World Urbanization Prospects3) Urbanized surface area doesn‘t include sea, lakes, waterways, woods, forests etc. and refers to the build-up
land surface only Ratio between the total number of transit smart cards in circulation in an urban agglomeration area and the
population of this area Cards are only considered if they are issued and/or accepted by public transport authorities of public transport
operators Ratio between the total number of bikes in bike sharing systems in an urban agglomeration area and the
population of this area Only bikes in business-to-consumer (B2C) and administration-to-citizen (A2C) schemes are considered.
Peer-to-peer (P2P) sharing is excluded Ratio between the total number of cars in car sharing systems in an urban agglomeration area and the
population of this area Only cars in business-to-consumer (B2C) and administration-to-citizen (A2C) schemes are considered.
Peer-to-peer (P2P) sharing is excluded Both free floating and station based models are considered Frequency of the busiest public transport line in an urban agglomeration Frequency of the busiest metro line taken; if metro not available – then frequency of the busiest bus line
considered Qualitative evaluation of strategy and actions of public sector with regard to urban mobility along 5
dimensions: General sustainability and restrictions; Alternative engines; Multimodality; Infrastructure; Incentives
Arthur D. Little Urban Mobility Index 2.0 – Assessment criteria
Figure 5: Arthur D. Little Urban Mobility Index 2.0 – Definition of assessment criteria
Maturity [max. 58 points]
Performance [max. 42 points]
Criteria Weight1
12. Transport related CO2 emissions 4
13. NO2 concentration 4
14. PM10 concentration 4
15. Traffic related fatalities 6
16. Increase of share of public transport in modal split 6
17. Increase of share of zero-emission in modal split 6
18. Mean travel time to work 6
19. Density of vehicles registered 6
Definition
Ratio between the total amount of carbon dioxide emitted by the agglomeration area p.a. as a consequence of its transport activities and its population
The data considers carbon dioxide emissions from the burning of fossil fuels in transportation only (sectorial approach)
Annual arithmetic average of the daily concentrations of NO2 recorded at all monitoring stations within the agglomeration area
Annual arithmetic average of the daily concentrations of PM10 recorded at all monitoring stations within the agglomeration area
Number of deaths related to transport i.e. an annual number of people killed as a result of transport accidents that occurred in an urban agglomeration area p.a.
Fatality is counted if it occurs during a period of 30 days after the accident
Increase of the percentage of the total people trips which are made daily by public transport in the last available measurement compared to its share in the last but one measurement
Increase of the percentage of the total people trips which are made daily by bicycle and walking in the last available measurement compared to its share in the last but one measurement
Total number of minutes that it usually takes the person to get from home to work each day during the reference week
The elapsed time includes time spent waiting for public transport, picking up passengers in carpools, and time spent in other activities related to getting to work
The ratio between the total number of passenger motorized vehicles (incl. cars, motorcycles, taxis) within the urban agglomeration and its population
Non-active vehicles (“scrap”) excluded from the calculation
1) Maximum number of points achievable 2) Shi Fei (2011) “Theoretical Research on Rational Urban Road Network Density Based on Operations Research”. World Academy of Science, Engineering and Technology 3) United Nations, Department of Economic and Social Affairs, Population Division, Population Estimates and Projections Section, World Urbanization Prospects

14
3.2. Ranking of urban mobility systems
The results of the Urban Mobility Index 2.0 report make grim reading as it finds most cities are badly equipped to cope with the challenges ahead. The global average score is 43.9 points, meaning that, on average, the 84 cities achieve less than half of the potential that could be reached today when applying best practice across all operations (see Figure 6).
Only 11 cities score above 52 points (top 20% of the score range). The highest score (58.2 points) went to Hong Kong followed closely by Stockholm (57.4 points) and Amsterdam (57.2 points), still indicating potential for improvement.
16 of the cities surveyed were below average. While most of these were in developing economies, four were in the US – Atlanta, Dallas, Houston and Miami – fresh evidence that the Americans’ addiction to cheap gas is impeding the development of sustainable mobility models. At the opposite end of the spectrum, among the cities with above average scores, all but two were in Europe. Exceptions in this group are Hong Kong, the city with the world’s most well integrated and sustainable mobility ecosystem, and Singapore.
Perhaps surprisingly, the cities of the C40 Climate Leadership Group perform slightly worse, than all 84 cities in the sample, with an average of 42.6 points against a global average of 43.9.
There are big differences between the top- and low-end performers in various regions:
n Europe achieves the highest average score of all the regions surveyed. With an average of 49.8 points (51.5 points for Western Europe and 45.2 for (South)-Eastern Europe) and nine out of the 26 analyzed European cities scoring above 52 points, European urban mobility systems are the most mature ones as of today and lead the way in mobility performance. It is a clear leader in three categories in the Maturity bucket: cycle path network, car sharing and bike sharing. Stockholm (57.4), Amsterdam (57.2) and Copenhagen (56.4 points) head the table – while Athens (40.0 points), Rome (40.9 points) and Lisbon (41.3) are the worst scoring European cities in the sample (see Figure 7 overleaf).
n Latin American and Asian Pacific cities show slightly below average performance. The continents’ average scores are well below Western Europe (43.9 and 42.8 points respectively) but outperform other regions in public transport-related criteria: fares are financially attractive, services are frequent, smart card use is well developed and public transport represents a dominant part of the modal split. Most cities in Latin America show average performance of between 40 and 47 points while Asian Pacific cities show the broadest range in performance, from Hong Kong and Singapore with scores of 58.2 and 55.6
Urban Mobility Index
Global Average 43.9
Source: Arthur D. Little Urban Mobility Index 2.0; UITP is independent of this index, which does not necessarily reflect its opinion; 100 index points for city that would achieve best performance on each criteria.
Ranking
below average average above average
28 32 36 40 44 48 52 56 60
Baghdad HanoiAtlanta
Delhi
Tehran
Lahore
Dallas
Kuala Lumpur
Houston
Johannesburg
Bangkok
Addis Ababa
Lagos
RomeMiami
Cairo
Jakarta
Los Angeles
Bangalore
Chicago
Osaka
Portland
Dhaka
Athens
Hyderabad
BostonLisbon
MelbourneMexico City
Buenos Aires
Tianjin
Saint PetersburgLima
Manila
Washington, D.C.
Curitiba
Ankara
New York
NantesIstanbul
Prague
Frankfurt
ZurichParisSingapore
ViennaCopenhagen
AmsterdamHong Kong
PhiladelphiaChennai
Sydney
MumbaiRio de Janeiro
Toronto
Moscow
Montreal
São Paulo
Bogota
KolkataSantiago de ChileGuangzhou
Beijing
ShenzhenWarsaw
ShanghaiBarcelona
SeoulTokyo
Brussels
Berlin
Wuhan
Hanover
MunichHelsinkiCaracas
Karachi
Dubai
Ho Chi Minh City
Kinshasa
Madrid
Stuttgart
London
Stockholm
Figure 6: Arthur D. Little’ Urban Mobility Index 2.0

15
respectively – sitting at the top of the global table – down to Hanoi with 30.9 points.
n USA/Canada shows average performance with 39.5 points. Given their orientation towards cars, USA/Canadan cities rank bottom worldwide in terms of maturity. In terms of performance, they perform above average overall, but show poor results with regard to number of cars per capita and CO2 emissions. New York leads the way with 45.6 points, closely followed by Montreal with 45.4 points.
n Africa and the Middle East are the lowest performing regions with respective average point totals of 37.1 and 34.1. While urban mobility systems in Africa perform well on several criteria due to the relatively low number of cars per capita and the large number of journeys made on foot, they are still evolving and lack maturity. Middle East cities have high levels of cars per capita and are expected to invest in development of environmental modes of transport in the mid-term perspective. War-torn Baghdad came bottom of the class overall, perhaps for obvious reasons.
None of the urban mobility systems in the above regions, except Western Europe, reaches 50% of potential maturity, showing that all the world’s cities have a long way to go in terms of developing their travel networks. It was a slightly more encouraging story when it came to performance, with Europe leading the way with a score of 24.8 out of 42 (59%).
Eleven cities belong to the above average group worldwide
n Hong Kong – study winner: 58.2 points, 1 out of 84 worldwide, 1 out of 28 in Asia Pacific Despite – or perhaps because of – being one of the most densely populated areas in the world, with more than
7 million people packed into a land mass of just 1,100 sq km, Hong Kong has developed the most advanced urban mobility system in the world. Public transport represents no less than 64% of the modal split, the number of vehicles registered per capita is amongst the lowest in the survey, and smart card penetration stands at 3.1 cards per person. This latter point can be explained by the fact that some people have two cards, one personalized and one anonymous; some cardholders work in Hong Kong but live in China; and others belong to tourists. Hong Kong fares even better when it comes to performance factors with a low level of transport-related emissions per capita, a low rate of traffic-related deaths, and a respectable mean travel time to work given its population density (see Figure 8 overleaf).
n Stockholm: 57.4 points, 2 out of 84 worldwide, 1 out of 19 in Western Europe The Swedish capital stands out for having one of the best-developed networks of cycle paths: its bike lane network is the third most dense in the world, with 4,041km of lanes per 1,000 sq km. It has a high rate of public sector initiatives, and its multi-modal SL-Access smart card has a penetration of 0.64 cards per capita. As a result of this forward-thinking approach, it ranks above average for transport-related emissions, with one of the lowest concentrations of nitrogen dioxide and particulates (NO2 and PM10) in the air in the world. What’s more, its traffic-related death rate is amongst the lowest in the survey.
n Amsterdam: 57.2 points, 3 out of 84 worldwide, 2 out of 19 in Western Europe There is a car for only one in three citizens in Amsterdam, which makes it well below the Western European average of 0.45 vehicles per capita. Cycling on the other hand has a very high share of the modal split (33%) thanks partly to a
Number of cities in index
19 7 9 28 13 5 3
51.5 45.2 43.9 42.8
39.5 37.1 34.1
(South-) Eastern Europe
Asia Pacific
USA/ Canada
Latin America
Western Europe
Middle East
Africa
Figure 7: Ranking by regions [average points]
Source: Arthur D. Little Urban Mobility Index 2.0
Western Europe ranks top out of all regions surveyed followed by (South-) Eastern Europe
European urban mobility systems are the most mature ones as of today – They also lead the way in mobility performance
USA/Canada: cities rank bottom worldwide in maturity given their orientation toward cars
Developing regions perform well on several criteria due to low number of cars so far

16
dense cycling lanes network occupying 3,502 km per 1,000 sq km. Add to this, the second best car-sharing performance worldwide (1.219 shared cars per million citizens) and it’s no surprise to hear that transport-related CO2 emissions are significantly lower than the Western European average (844 kg per capita per annum in Amsterdam compared to an average of 1,330 kg in Western Europe as a whole).
n Copenhagen: 56.4 points, 4 out of 84 worldwide, 3 out of 19 in Western Europe The Danish capital has the safest urban mobility system in the world, with 4.1 traffic deaths per million citizens. It also has the lowest penetration rate of cars in Western Europe at 0.24 per capita, and the use of individual transport is on the decrease. This coupled with the fact it has a dense cycle-lane network, helps explain why its transport-related CO2 emissions are significantly below the European average at 812 kg per capita, compared to a Western European average of 1,330 kg.
n Vienna: 56.0 points, 5 out of 84 worldwide, 4 out of 19 in Western Europe
Alongside Zurich, Vienna’s public transport system has the highest share of journeys in Western Europe, with 39% of trips made on its services. It has pioneered the use of a new generation of Liquefied Petroleum Gas (LPG)-powered engines in its bus fleet, whose emissions fall more than 50% below the EU-5 standard. It also has a below average number of private cars per capita and encourages cycling. One innovative initiative in this regard is Bike City, a housing estate equipped with extra-large lifts to accommodate bicycles and limited space for car parking. The combined effect of all this is clean air, with a particularly low concentration of NO2 and PM10.
n Singapore: 55.6 points, 6 out of 84 worldwide, 2 out of 28 in Asia Pacific With a population density of 7,300 inhabitants per square kilometer, Singapore’s public transport is highly developed; accounting for no less than 48% of the modal split, and mobility card penetration is at 2.9 cards per capita. Thanks, at least in part, to high taxes and duties, car ownership has been reduced to 0.18 cars per capita and car-use is also
Figure 8: Top 11 cities with above average mobility score
Source: Arthur D. Little Urban Mobility Index 2.0
Fin.
att
ract
. of
PT
(cos
t of
5 km
PT/
cos
t of 5
km
car
)
Sha
re o
f pub
lic tr
ansp
ort i
n m
odal
spl
it [%
]
Sha
re o
f zer
o-em
issi
on m
odes
in
mod
al s
plit
[%]
Roa
ds d
ensi
ty (d
evia
tion
from
op
timum
) [km
/km
2 ]
Cyc
le p
ath
netw
ork
dens
ity
[km
/ths
km2 ]
Urb
an a
gglo
mer
atio
n de
nsity
[c
itize
ns/k
m2 ]
Sm
art c
ard
pene
trat
ion
[car
ds/c
apita
]
Bik
e sh
arin
g pe
rfor
man
ce
[sha
red
bike
s/ m
illio
n ci
tizen
s]
Car
sha
ring
perf
orm
ance
[s
hare
d ca
rs/m
illio
n ci
tizen
s]
Den
sity
of v
ehic
les
regi
ster
ed
[veh
icle
s/ca
pita
]
Freq
uenc
y of
the
busi
est p
ublic
tra
nspo
rt lin
e [ti
mes
/ day
]
Initi
ativ
es o
f pub
lic s
ecto
r (0
to 1
0 sc
ale)
Tran
spor
t rel
ated
CO
2 em
issi
ons
[kg/
capi
ta]
Ann
ual a
vera
ge N
O2
conc
entr
atio
n [m
cg/m
3 ]
Ann
ual a
vera
ge P
M10
conc
entr
atio
n [m
cg/m
3 ]
Traf
fic re
late
d fa
talit
ies
per
1
mill
ion
citiz
ens
Dyn
amic
s of
sha
re p
ublic
tr
ansp
ort i
n m
odal
spl
it [%
]
Dyn
amic
s ze
ro-e
mis
sion
m
odes
in m
odal
spl
it [%
]
Mea
n tr
avel
tim
e to
wor
k [m
inut
es]
OV
ER
ALL
SC
OR
E
1.7 55% 38% 2.0 187 6.5 3.1 0 0 0.07 324 10 776 50.0 50.0 16.2 +20% 0% 36.6 58.2
6.7 33% 34% 0.5 4,041 3.7 0.6 852 400 0.40 212 10 1,348 12.5 16.7 9.4 -7% +89% 33.7 57.4
3.0 8% 50% 1.7 3,502 3.2 0.7 527 1,219 0.32 130 10 844 30.0 24.7 19.5 +12% +13% 35.5 57.2
4.8 27% 33% 2.7 3,977 2.7 0.1 1,025 246 0.24 238 10 812 56.0 28.0 4.1 +123% -15% 29.7 56.4
3.9 39% 34% 0.6 2,948 3.8 0.0 692 415 0.39 277 10 1,111 21.7 21.5 16.1 +15% +13% 29.3 56.0
2.6 48% 23% 2.6 280 7.3 2.9 19 57 0.18 233 9 1,381 22.0 29.0 32.5 +17% +64% 36.8 55.6
2.9 34% 50% 8.8 3,520 3.8 0.6 2,224 219 0.46 267 10 1,163 39.2 38.0 23.9 +7% 0% 38.6 55.4
3.8 39% 31% 0.7 3,700 4.2 0.0 232 1,064 0.54 149 10 1,200 30.1 19.1 15.4 +15% +3% 30.4 54.7
3.9 34% 26% 10.8 254 5.6 3.1 1,012 253 0.39 468 10 1,050 37.0 22.9 26.6 +10% +4% 44.1 53.2
3.6 27% 40% 2.1 4,678 2.3 0.9 0 70 0.48 246 10 1,228 28.0 20.2 13.9 -16% +8% 28.5 53.2
4.6 21% 42% 0.1 3,862 3.0 0.0 727 640 0.56 210 10 1,351 35.3 21.7 15.3 0% +11% 30.1 53.0
Hong Kong
Stockholm
Amsterdam
Copenhagen
Vienna
Singapore
Paris
Zurich
London
Helsinki
Munich
1
2
3
4
5
6
7
8
9
11
Performance indicators Maturity indicators
9

17
discouraged via congestion pricing, which charges drivers more for using roads during the rush hour.
n Paris: 55.4 points, 7 out of 84 worldwide, 5 out of 19 in Western Europe In addition to the outstanding performance of its extensive rail network, the French capital boasts the third best bike-sharing performance in the world after Wuhan and Brussels, with 2,224 shared bikes per million citizens. Its cycle-lane network is also well advanced, accounting for 3,520 km per thousand square kilometers. An innovative car sharing scheme has proved highly successful too, with 2,000 electric Bluecars attracting more than 100,000 registered subscribers. On the commercial front, a grouped goods delivery system, Distripolis, uses low-emission vehicles to reduce transport-related pollution.
n Zurich: 54.7 points, 8 out of 84 worldwide, 6 out of 19 in Western Europe The Swiss banking center saw public transport’s share of the modal mix increase by five percentage points between 2005 and 2010 to 39%, putting Zurich alongside Vienna as the best-performing city in Western Europe. Its ‘good practice’ urban mobility strategy has led to a dense cycle-lane network – 3,700 km per thousand square kilometers – and the world’s third best car sharing performance after Stuttgart and Amsterdam, with 1,064 shared cars per million citizens.
n London: 53.2 points, 9 out of 84 worldwide (ex aequo with Helsinki), 7 out of 19 in Western Europe Like Hong Kong, London’s smart card penetration rate is at saturation level and it boasts dynamic and efficient public transport sector operators. Despite having a far from optimum level of road density, its rate of traffic-related fatalities is below average and its level of harmful emissions is average or below average. But while it has frequent services on public transport, its mean travel time to work is below average.
n Helsinki: 53.2 points, 9 out of 84 worldwide (ex aequo with London), 7 out of 19 in Western Europe The world’s most dense cycle-lane network can be found in Helsinki, which has a total of 1,000 km of segregated bike lanes, or 4,678km per thousand square kilometers of city area. One innovation, the 1.3 km Baana pathway for cyclists and pedestrians, was used by 320,000 cyclists in one six-month period in 2012. The city also boasts a high penetration of its HSL Travel Card at 0.9 cards per capita, with the result that Helsinki has a low concentration of both NO2 and PM10.
n Munich: 53 points, 11 out of 84 worldwide, 9 out of 19 in Western Europe The level of zero-emission modes in the capital of Bavaria’s modal split is an impressive 42%. A significant contributor to this
has been Munich’s Cycle Capital Campaign, which has a vision of turning Munich into Germany’s most bicycle-friendly large city. Between 2002 and 2012, cycling’s share of the modal split rose from 10% to 17%, aided by the creation of a dense network of cycle lanes that now stretches to 3,862 km per thousand square kilometers. Munich is also enjoying a dense and high quality multimodal public transport system, especially by rail (tram, metro, S-bahn) (see Figure 9 overleaf).
Trends towards shared mobility
An important finding of the study is that progress is being made in the field of shared mobility. With every year that passes, more and more cars and bikes are being shared than ever before. In 2011, Arthur D. Little found that in the 66 cities surveyed in the context of the first edition of the urban mobility index, an average of 89 cars were shared per million citizens. In 2013 – just two years later – in the 84 cities surveyed, 115 cars per million were shared – that represents a global compounded annual growth rate of +14% per annum. On a like-for-like basis, the increase was almost identical: +13% p.a. It was a similar story when it came to bike use. The number of bikes shared per million citizens increased from 344 to 383 (+6% p.a.) between the two studies. On a like-for-like basis, the increase was even more impressive: +12% p.a.
Integrated mobility platforms
Smart card use is also on the increase, pointing to a growth in the integration of services worldwide. In 2011, the average pene -tration of smart cards was 0.34 cards per capita in the 66 cities surveyed. In 2013, in the 84 cities surveyed, this had increased to 0.44 cards per capita (+14% p.a.). On a like-for-like basis, penetration was up +21% p.a. It should be noted that most of this growth is being driven by developing cities such as Dubai, Buenos Aires, Delhi, Kuala Lumpur and Tehran, while, in contrast, smart card penetration is stagnating in developed cities.
There are some very good examples of successfully integrated mobility platform initiatives at local level, of which probably the most well-known one is the Octopuscard launched by Hong Kong in 1997.
Other successful initiatives worth mentioning include SMILE (Vienna), Trafiken.nu (Stockholm), Path2Go (San Francisco Bay Area), and Goroo (Chicago Metropolitan Region). In Germany, Stuttgart and Berlin, recently received major subsidies from the central government to speed up implementation and are good examples of strong integration between several actors of different plumages:
n SMILE (Smart Mobility Information and ticketing system Leading the way for Effective e-mobility services) is a prototype of the multimodal mobility platform of the City of

18
Western Europe USA/Canada Latin America Asia Pacific Middle East/Africa
Average 51.5 Average 39.5 Average 43.9 Average 42.8 Average 36.0
Stockholm 57.4 Amsterdam 57.2 Copenhagen 56.4 Vienna 56.0 Paris 55.4 Zurich 54.7 London 53.2 Helsinki 53.2 Munich 53.0 Stuttgart 51.9
Hanover 50.1
Berlin 51.7
Madrid 50.3
Barcelona 49.1
Frankfurt 48.8
Nantes 47.7
Lisbon 41.3
New York 45.6
Montreal 45.4
Toronto 44.4
Washington 43.7 (D.C.) Boston 40.9
Philadelphia 40.3
Chicago 39.1 Los Angeles 38.1 Portland 37.8 Miami 37.3
Rome 40.9
Houston 34.7 Dallas 33.8
Atlanta 32.5
Santiago de Chile 47.1 Bogota 46.3 Sao Paulo 45.7
Rio de Janeiro 44.0
Curitiba 44.0
Lima 43.5 Buenos Aires42.4 Mexico City 42.2 Caracas 40.1
Wuhan 51.1 Seoul 49.3 Tokyo 49.2 Shanghai 49.1 Shenzhen 47.7 Beijing 47.2 Guangzhou 47.2 Kolkata 47.0 Mumbai 43.9 Manila 43.6 Sydney 43.1 Tianjin 42.6 Melbourne 41.9 Chennai 40.7 Hyderabad 40.7
Ho Chi Minh 39.8 Karachi 39.5 Dhaka 39.2 Bangalore 38.9 Osaka 38.5
Jakarta 37.4 Bangkok 35.0 Kuala Lumpur 34.6
Lahore 33.1 Delhi 33.5
Hanoi 30.9
Cairo 37.4 Lagos 37.1
Addis Ababa 36.5
Johannesburg 35.0
Tehran 33.0
Baghdad 28.6
Kinshasa 39.4 Dubai 40.6
Figure 9: Urban Mobility Index by regions and cities
Brussels 49.7
Hong Kong 58.2
Singapore 55.6
(South-)Eastern Europe
Average 45.2
Prague 47.8
Warsaw 47.8
Istanbul 47.2
Ankara 46.1
Moscow 44.4
St. Petersb. 43.4
Athens 40.0
25
30
35
40
45
50
55
60

19
Western Europe USA/Canada Latin America Asia Pacific Middle East/Africa
Average 51.5 Average 39.5 Average 43.9 Average 42.8 Average 36.0
Stockholm 57.4 Amsterdam 57.2 Copenhagen 56.4 Vienna 56.0 Paris 55.4 Zurich 54.7 London 53.2 Helsinki 53.2 Munich 53.0 Stuttgart 51.9
Hanover 50.1
Berlin 51.7
Madrid 50.3
Barcelona 49.1
Frankfurt 48.8
Nantes 47.7
Lisbon 41.3
New York 45.6
Montreal 45.4
Toronto 44.4
Washington 43.7 (D.C.) Boston 40.9
Philadelphia 40.3
Chicago 39.1 Los Angeles 38.1 Portland 37.8 Miami 37.3
Rome 40.9
Houston 34.7 Dallas 33.8
Atlanta 32.5
Santiago de Chile 47.1 Bogota 46.3 Sao Paulo 45.7
Rio de Janeiro 44.0
Curitiba 44.0
Lima 43.5 Buenos Aires42.4 Mexico City 42.2 Caracas 40.1
Wuhan 51.1 Seoul 49.3 Tokyo 49.2 Shanghai 49.1 Shenzhen 47.7 Beijing 47.2 Guangzhou 47.2 Kolkata 47.0 Mumbai 43.9 Manila 43.6 Sydney 43.1 Tianjin 42.6 Melbourne 41.9 Chennai 40.7 Hyderabad 40.7
Ho Chi Minh 39.8 Karachi 39.5 Dhaka 39.2 Bangalore 38.9 Osaka 38.5
Jakarta 37.4 Bangkok 35.0 Kuala Lumpur 34.6
Lahore 33.1 Delhi 33.5
Hanoi 30.9
Cairo 37.4 Lagos 37.1
Addis Ababa 36.5
Johannesburg 35.0
Tehran 33.0
Baghdad 28.6
Kinshasa 39.4 Dubai 40.6
Figure 9: Urban Mobility Index by regions and cities
Brussels 49.7
Hong Kong 58.2
Singapore 55.6
(South-)Eastern Europe
Average 45.2
Prague 47.8
Warsaw 47.8
Istanbul 47.2
Ankara 46.1
Moscow 44.4
St. Petersb. 43.4
Athens 40.0
25
30
35
40
45
50
55
60

20
Vienna. This smartphone-based platform was developed with public transport as a backbone. It integrates diverse mobility offerings into multiple unified travel options taking into account unique customer needs. SMILE provides intelligent customer information, and enables electronic booking and payment. It is open to third-parties and is expected to develop into a nation-wide platform for Austria in the medium term.
n Trafiken.nu is a multimodal planning tool that was piloted in Stockholm (a joint initiative of the local PTO, PTA, city administration and road building authority) and financed via toll revenue. It was later rolled out in other areas, such as the Gothenburg Region and Skane Country. This tool compares different multimodal chains door-to-door with regard to cost, time and climate impact. However, innovative mobility ser-vices, such as car or bike sharing, are not integrated so far.
n Path2go is a trip-planning tool for the San Francisco Bay Area that combines real-time information on transit, traffic and parking in order to provide personalized intermodal chains for travelers. The platform also includes en-route incident alerts and navigation to connect with transit. Tool roll out in Los Angeles is planned in the short term. Reservation and ticket-purchasing functionalities are not yet available however.
n Goroo, a multimodal journey planner in the Chicago Metropolitan Region was developed by the local PTA in collaboration with PTOs, the traffic authority, the tourism bureau, the parking services provider, the regional transportation department and other stakeholders. Apart from urban mobility the platform also offers entertainment, shopping, sport, recreation, gastronomy and other value-added services.
n Stuttgart Services Mobility Platform is a prototype system that provides real-time intermodal information and can be used as a booking and reservation system. The platform provides real-time information for all modes of transport. Routes can be planned according to the availability of transport means (for car and bike sharing) and the actual traffic situation. Users can obtain the most suitable mobility solution in each specific situation.
While we are yet to discover any example of best practice when it comes to integrated mobility platforms at supra-regional level, private companies such as Daimler, Citroen, Google, Nokia and the German Railway are making interesting attempts to establish platforms integrating multiple local players:
n Daimler’s moovel is focused on its captive car sharing service car2go as well as other third-party mobility services, including taxis, public transport, bike sharing, carpooling etc. It covers five German agglomerations – Stuttgart, Berlin,
Rhine-Ruhr, Nuremberg and Munich. Expansion to other cities, regions and continents, as well as aggregation of further mobility providers, is expected.
n Citroen’s Multicity has integrated car-sharing, flights, railway, hotels and other tourist services, but, at this stage, is active only in Germany and France.
n Google Now is an intelligent personal assistant with voice recognition that makes mobility-related recommendations for users based on their location, calendar entries etc. Besides traffic, transit, flight and hotel information, the platform assists users with car rentals, event tickets and reminders.
n Nokia Here provides public transport information for 700 cities across 50 countries. Modes covered include bus, train, ferry, tram and walking. The system also provides navigation for car drivers in 94 countries including real-time information on congestion, accidents, and road-works. Unlike its competitor Google Now, Nokia Here doesn’t offer bicycling directions.
n German Railway’s Qixxit platform is open to third parties. It is currently available only as a beta-version and aggregates railway, long-distance buses, airlines, taxis, car rental, car sharing, bike sharing and local public transport in Germany.
n Platforms currently being created globally around Visa PayWave and Mastercard PayPass are also worth mentioning.
The integrator type of business models are expected to change their core. While transit smart cards have been at the core of such business models until now and smart cards penetration continues to increase, we expect that over the next five to ten years smartphone-based mobility platforms will become increasingly important for mobility integrators and will constitute major revenue generators.
3.3. Overall conclusions
It is clear that no city has a perfect urban mobility system. Overall, only 11 cities are performing “above average” – the top 20% of the score range. Even the city with the highest score – Hong Kong with 58.2 out of 100 – still has significant potential for improvement. On average, less than half of the potential of urban mobility systems is unleashed today. Action is needed, and fast.
Out of seven regions surveyed, Western Europe ranks top followed by (South-) Eastern Europe and Latin America: Not only are European urban mobility systems the most mature ones as of today, they also lead the way in mobility performance. USA/Canadan cities rank bottom worldwide in terms of maturity

21
given their orientation towards cars. Developing regions, on the other hand, perform well on several criteria due to the low number of cars and the share of individual motorized transport in the modal mix so far.
Significant progress has been made in certain sectors since we published our previous urban mobility index in 2011. In terms of the trend towards shared mobility, more cars and bikes are being shared in cities, via both peer-to-peer and business-to-consumer models. Integrated mobility platforms are also gaining traction: the penetration of mobility smart cards is increasing, driven by developing cities, and there is a growing number of examples of good practice in integrated mobility platforms at the local level. There is currently no good example of best practice for a supra-regional integrated mobility platform.
A near-perfect mobility system does not yet exist in the world today and full satisfaction with urban transport is not observed in any of the cities studied. Even among the cities that score highest, the scope for improving toward the maximum score of 100 is still significant:
n Hong Kong, for example, scores very high in terms of modal split, smart card penetration and vehicles per capita but lags in terms of car and bike sharing.
n Amsterdam is a cycling oriented city with a good cycling network, car and bike sharing systems, but public transport has a poor share of the modal split (only 8%).
n Vienna and Zurich have safe mobility systems with well-balanced modal splits, but have no mobility card so far, etc.
What would a city that would perform well across all criteria look like? A hypothetical best-in-class urban mobility system would:
n Be as affordable as Hong Kong, with a similar modal split and level of smart-card acceptance. It would also have as few vehicles as Hong Kong.
n Ensure air is as pure as Stockholm’s
n Promote cycling like Amsterdam
n Be as safe as Copenhagen
n Have best-in-class bike sharing as demonstrated in Brussels and Paris
n Have a public transport service as frequent as the London Tube
n Have best-in-class car sharing as demonstrated in Stuttgart
n Have as minor an impact on climate as in Wuhan
n Ensure travel times as short as they are in Nantes

22
4.1. Business model archetypes for urban mobility
Confronting the challenges of the future will often require the adoption of new technology and business models. A comprehen -sive review of technologies and urban mobility business models reveals that the majority of them are at the growth or maturity stage. However, there are sufficient solutions available to address the mobility challenges. In its 2011 study2, Arthur D. Little identified three long-term sustainable business models for the future of urban mobility, which it dubbed the “Amazon”, “Apple” and “Dell” models of urban mobility (see Figure 10).
n The Amazon model: So-called because – like the online retailer – it is an aggregator of third-party services. It relies on a single point of access for mobile and supplementary services, including information, planning, booking and payment/billing functions. These are largely virtual services, with little physical infrastructure required, which form a one-stop shop. Examples of this model in the public transport sphere include German Railway’s Qixxit, Daimler’s moovel or Viennna’s SMILE. Car rental variants include Check 24, carrentals.com and eBookers, while examples
2 Arthur D. Little, “The Future of Urban Mobility – Towards networked, multimodal cities of 2050, 2011
in the hotel market include HRS, Expedia, Opodo and TripAdvisor. However, market research shows that no one is currently operating a truly integrated intermodal routing and compilation of travel chains, e.g. taxi-rail-rental-car-hotel, in both directions of travel. A fully implemented service of this sort has the potential to attract significant volume.
n The Apple model: Like the desktop-to-smartphone giant, the key to this model is deep vertical integration of services. The goal here is a completely seamless user experience of the sort epitomized by car hire company Avis’s acquisition of car-sharing firm ZipCar and Sixt’s car-and-driver service MyDriver and its car-sharing joint venture with BMW, DriveNow. Other examples of the Apple business model archetype are German Railway, offering also car sharing (“Flinkster”) and bike sharing (“call-a-bike”) services or Transdev operating train, tram-train, metro, light rail, coach, bus, BRT, paratransit, ferry, taxi, car-sharing, shared-ride airport shuttle and bicycle sharing.
4. What is holding back changes? Business model archetypes for urban mobility
Figure 10: Three long term sustainable business model archetypes for the future of urban mobility
“Amazon of mobility“
Aggregator of third party services: Single point of access for mobility and supplementary services (information, planning, booking, payment) – One-stop-shop concept
Virtual services, minimal physical infrastructure needed
“Apple of mobility“
Integrator of own services: A number of mobility solutions under one strong brand; deep vertical integration
Goal: Integrated mobility services for end consumers that provide a seamless, multimodal journey experience
“Dell of mobility“
Singe mode specialist: Stand alone mobility services, e.g. car or bike sharing, no intermodal integration
Also providers of disruptive technologies (drive-in-drive-out, be-in-be-out (BIBO), NFC solutions for mobility etc.)
Business model: Vision: Insights:
Source: Arthur D. Little Own services Third party services
Business archetypes for urban mobility suppliers

23
n The Dell model: While others diversified in response to excess supply and deteriorating margins in the PC market of the mid-90s, US PC manufacturer Dell thrived by concentrating on online sales and supply chain excellence. In the urban mobility context, this model refers to single mode specialists such as local public transport (e.g. Transport for London), car and bike sharing providers (e.g. Volkswagen’s Quicar), car pooling platforms (e.g. carpooling.com), taxi and limo services. All these sectors are expected to enjoy rapid growth over the next few years. Bike sharing in the US, for example, is expected to grow 51% p.a. between 2013 and 2016. B2C car-sharing is expected to mushroom too. In Europe it is tipped to increase by 43% p.a. between 2013 and 2016 and in Japan by 64% p.a. in the same period.
These models need not stand alone. The Amazon and Apple archetypes can be combined, whereby a mobility provider could integrate its own services with those of third parties and provide “one face to the customer”. Figure 11 shows how this could work from the perspective respectively of an automotive OEM and a PTA/PTO.
Those three business model archetypes still hold true today and each has interesting development potential. However, these solutions and archetypes are currently not being applied comprehensively and only a few players have managed to smartly integrate them to unleash their full business potential.
Note: SU=Suburban, LD = Long-Distance, HW = Hardware, SW = Software Source: Arthur D. Little
“Total Mobility Provider” – Illustrative Business Model from an Automotive OEMs perspective
Car sharing
Car rental
Car pooling
Limou-sine
Parking SW
Taxi
Bike sharing
LD train
Reg. bus
Reg. train
SU train Air
Bus
Metro
Tram
Parking HW
Bike rental
Cars
AGGREGATOR
INTEGRATOR
CORE BUSINESS
Figure 11: Combined “Amazon” and “Apple” business models (“Total Mobility Provider”)
“Total Mobility Provider” – Illustrative Business Model from a PTA/PTO perspective
Bike sharing
Car rental
Car pooling
Reg. train
Bike rental
Taxi
Limou- sine
LD train
Parking HW
Parking SW
Reg. bus
Car sharing
SU train
Air
Local public transport
AGGREGATOR
INTEGRATOR
CORE BUSINESS

24
There is a clear trend toward shared mobility: more cars and bikes are being shared in cities, both via peer-to-peer and business-to-consumer models.
Car sharing is one mobility mode set to become much more ubiquitous in the next few years. The strongest growth is expected to be seen in regions with mature urban mobility systems, such as Western Europe, North America and some Asian Pacific cities, because they are easier to target due to their existing infrastructure and an openness on the part of economically and environmentally conscious consumers to embrace options that are cheaper and more sustainable (see Figure 12).
Car sharing has evolved from a community-based, collaborational exercise between eco- and/or cost-oriented customers with an average age of 40 (car sharing 1.0), to a big business which has attracted some of the world’s major car manufacturers, and a younger customer base thanks, in part, to the need for them to be app-savvy (car sharing 2.0). Currently operators are looking for the next levers that will turn car sharing into a mass market 3.0 business model. Depending on the type of operator, Arthur D. Little has identified four business model archetypes in the car sharing sector: Traditionalists, Citizen Networkers, Mobility Integrators and Innovative OEMs.
n Traditionalists: These service providers offer a broad range of unsually low-cost cars3 stationed in dedicated parking spaces around the city or region they serve. This type of operator may well be established on a not-for-profit or co-operative basis and thus offer comparatively low usage fees. Because the reservation of cars is usually possible without smartphone usage, the older generation find this type of car sharing user friendly.
The German car-sharing company Greenwheels/StattAuto is one of the pioneers in this. Its members can reserve a car at any time over the phone or online, with the driver accessing the car or key-deposit box with a chip card and pin code. At the end of a trip, the member returns the car to the distribution station and fills out a short driving report.
The disadvantages of such operations are that the cars can be found at defined stations only4 (and the network of such stations is sometimes insufficiently dense) and customer processes can be relatively complex. Other examples of operators in this area include Stadtmobil, Communauto, etc. (see Figure 13)
3 Still a minor share of premium cars is also being offered, e.g. Stadtmobil has Mercedes, BMW and Audi in its fleet.
4 But Traditionalists also start to penetrate the free-floating operating model, e.g, Auto-mobile car sharing service of Communauto in Montreal.
n Citizen Networkers: Unlike the Traditionalists, Citizen Networkers connect private car owners and people looking to rent their vehicles for short periods of time. P2P car sharing is a comparatively new business model, having emerged in 2001 in Germany with the establishment of the RentMyCar platform. In the US this business model was first piloted by RelayRides in 2010 in San Francisco. The advantages of this model is that it tends to offer cheaper rides than any other car-based system, insurance is built in and there is no need for anyone to invest in a fleet.
The down side is that it does not become an effective and reliable option until a critical mass of car owners has been established. They also tend to be neighbourhood schemes with limited geographic scope and sometimes car theft problems can arise. Examples include Tamyca, Jolly Wheels, Getaround, etc.
n Mobility Integrators: Entrepreneurial public transport operators have increasingly developed a clear vision of becoming integrated mobility providers. Thus they have started offering car sharing and other services in addition to their core business. These operators belong to the “Apple of Mobility” business model archetype.
These operators can leverage their existing customer base to reach the critical mass of users needed for a profitable car sharing business more quickly. Captive users of such PTOs can also use the same mobility cards to access shared cars and same smartphone apps designed to reserve and pay for shared cars.
There are no additional disadvantages for users if the car sharing service is being provided by a Mobility Integrator, rather than, for example, a Traditionalist. As station based car sharing is currently the only operating model being offered by Mobility Integrators, the disadvantages on this model apply. Examples include Deutsche Bahn’s Flinkster (countrywide in Germany plus in Austria’s capital Vienna), Transdev’s Autobleue (in Nice) and Keolis’ Autocool, Lilas, Auto’Tao, IDElib’ (in Bordeaux, Lille, Orléans and Pau respectively).
n Innovative OEMs: This model relies on providers offering middle segment or premium cars to user communities who typically identify available vehicles and their locations via a smartphone app.
The advantage this free-floating model has overother car sharing options is that users are not restricted to picking up cars from fixed points and can hire a car at a moment’s notice. Just intermodal apps are available and (same as in other archetypes) customers often have the choice of an electric car as well as a conventional petrol or diesel-powered. Such
Car sharing 3.0. – What is the next lever that will turn car sharing into a mass market?

25
services do, however, command higher usage fees, rely on smartphone skills and do not allow the reserving of a car in advance (orders tend to be taken only 15 or 30 minutes beforehand). Examples include BMW’s DriveNow, Daimler’s car2go, Volkswagen’s Quicar, Citroen’s Multicity, etc.
While growth will be rapid in this sector, it is from a low base and providers are currently still assessing long term profitability of different business models. Very few examples
boast a significant number of members or users and the challenge is to find a way to turn car sharing from the province of a relatively small number of early adopters into a mass-market option.
Levers for potential growth exist in four main areas: geographical expansion, developing the sales platform, creating or extending a partner network and fostering loyalty by becoming more locally responsive.
Source: Arthur D. Little
Car sharing 1.0: Eco niche
Car sharing 2.0: OEMs get on
Car sharing 3.0: Mass market
Feat
ure
s
Demand
Time 1948 2008 2012-2015
Swiss self driver
coperative (SEFAGE)
Station based model Complicated customer processes: reservation,
information provisioning Target group – Eco-oriented customers
Witkar
Free floating & private P2P models
Smart phone based Premium cars pilots
Is it about community? Is it about seamless and
integrated solutions? Is it about convenience?
Car sharing innovation curves – Selective
Figure 12: Car sharing innovation curves
Figure 13: Car sharing business model archetypes
Innovative OEMs Mobility integrators Citizen networkers
Unique Selling Proposition
Advantages
Disadvantages
Mainly low-cost cars Full service model Broad range of vehicle types
Source: Arthur D. Little 1) Except Quicar
Examples
Greenwheels/StattAuto Stadtmobil Communauto
Tamyca Jolly Wheels RelayRides Getaround
Deutsche Bahn – Flinkster Veolia Transdev – Autobleue Keolis – Autocool, Lilas,
Auto'Tao, IDElib'
BMW DriveNow Daimler car2go Volkswagen Quicar Citroën Multicity
Lower usage fees Booking possible without
smartphone usage skills Appropriate for older customer groups
Mainly station based services Less flexibility
Sometimes complicated processes for customers
Leveraging existing customer base
Integration into own intermodal apps (e.g. Qixxit) and mobility cards (e.g. BahnCard)
Mainly free floating1)
spontaneous hire Intermodal apps (e.g. moovel) Usually minute based charging
Premium cars also User communities Value add location based services Strong OEM brand
Higher usage fees Smartphone usage skills needed Booking in advance (> 30 minutes
before) not possible
PTOs enlarging their service portfolio in order to offer door-to-door mobility
Strong PTO brand
Mainly station based services Less flexibility
Sometimes complicated processes for customers
Critical mass decisive Car theft issues Neighborhood based geographic
scope No full service model
“Virtual” fleet made up of vehicles from participating owners
Usually large selection of cars
Insurance included Cheaper compared to car
sharing/rental Suitable for less density
populated areas
Traditionalists

26
4.2. What is holding back changes?
Given the scale of the looming crisis in urban mobility and the fact that the solutions to it are already available, it is reasonable to ask: why has the potential for innovation not been unleashed?
The answer is that the management of urban mobility operates in an environment that is too fragmented and hostile to innovation. Our urban management systems do not allow market players to compete and establish business models that bring demand and supply into a natural balance. Current mobility systems adapt poorly to changing demands, are weak in combining single steps of the travel chain into an integrated offering, find it difficult to learn from other systems, and shun an open, competitive environment. Collaboration on solutions is rare. Rewards for investors are rather meagre.
Moreover, a lot of mature cities do not yet have a clear vision and strategy on how their mobility systems should look in the future. In all too many cases, urban mobility plans look like “Christmas wish lists” with no clear reflection of the synergies or incompatibilities between the initiatives, too limited integration between the different modes of transportation and no convincing explanation of how desired results should be achieved by allotting responsibilities, setting deadlines, and instituting monitoring procedures. This lack of synergies between isolated initiatives leads to a sub-optimal outcome in terms of mobility performance, which calls for a more holistic approach.
There is also often a poor interlinking of urban mobility strategy and other urban strategies. For example, if a city is committed in its environmental strategy to reduce CO2 emissions, it should ask what contribution transport should make to achieve this goal.
Finally, decisions are often mainly based on “public sector actions” and do not sufficiently address interfaces with the private sector and what contribution it could make to the achievement of urban mobility goals. The private sector needs to be involved in the goal-setting process.
At a different level, integration between regional mobility systems still remains very low in comparison to other parts of the economy as transport infrastructures were historically designed to serve regional rather than supra-regional goals. In that context, there is a need for stronger alignment between regional mobility strategies while respecting each-others accountabilities and ensuring solutions are adapted to local contexts.
Urban mobility is one of the toughest system-level challenges facing actors of the mobility ecosystems. In the future, innovative mobility services will be driven less by improvements in single transport modes than by integration. What is needed is system-level collaboration between all stakeholders of the mobility ecosystem to come up with innovative and integrated business models.

27
5.1. Three strategic directions for cities
The urban mobility study was conducted in 84 cities around the globe, a sample consisting of the largest cities in the world as measured by GDP share, C40 members, and a group of smaller cities, which had demonstrated some level of good practice with regards to mobility.
We tried to put the index results in perspective by looking at city characteristics and analyzing their correlation with the mobility scores of cities. We looked more specifically at the following city characteristics:
n Prosperity: This was determined by the GDP per capita as of 2012, with those having a GDP per capita of more than 25,000 USD being defined as ‘mature’ and those below that level defined as ‘emerging’.
n Modal split: This criterion was applied by assessing the respective shares of individual motorized mobility, public transport and walking/cycling in the modal split. Cities with less than 50% of individual motorized transport in the modal split were categorized as ‘public mobility-oriented cities’. The others were categorized as ‘individual mobility cities’.
n City size: This was determined by the population of the city agglomerations as of 2012. Cities with more than five million
residents were defined as ‘large’ and those below defined as ‘smal’.
The analysis revealed wildly divergent performances but allowed for a number of interesting conclusions:
n City size does not matter – City size does not have a signifi-cant influence on the mobility score. However, the two other city characteristics that we studied, namely city prosperity and the prevalence of public transport, do have a significant influence on the mobility score: the richer the city and the lower the share of individual transport, the higher the score.
n Mature cities are not necessarily a model – Cities in emerging regions should not necessarily aspire to emulate their counterparts in mature regions. If cities in emerging regions replicate the pathway that cities in mature regions have followed, they run the risk of introducing the very same problems of poor modal split, high carbon emissions and low travel speed.
n Innovation is key – One thing all cities have in common is that they need to innovate to improve their performance.
We can distinguish three typical city clusters depending on urban mobility system positioning on the evolutionary curve:
5. Shaping the future: Strategic directions and imperatives for cities
Figure 14: City clusters of urban mobility and their performance with regards to triple bottom line
Source: Arthur D. Little Mobility Index Performance level: good bad
Cluster Challenges and opportunities associated with current performance level
Planet People Profit
Public Mature cities with high share
of public transport/walking & cycling
Sustainability - often a goal of master plans; public transport less environmentally harmful
Sufficient infrastructure supply and convenient usage/access
Mature cities with high mobility budgets; able to implement high-end
technologies
Individual Mature cities with high share
of individual transport in modals split
Often most dirtiest cities in the world (mobility related impact), e.g.,
7 t CO2/ capita High congestion and accidents level
lead to lowering quality of life
Less interesting markets for infrastructure provides, due to lower
demand for public mobility
Emerging Emerging cities with partly underdeveloped mobility
systems Weak environmental impact due to underdevelopment of infrastructure
Low satisfaction with mobility supply esp. in Africa, South-East Asia;
Main mode: by foot
Often problems with financing of mobility infrastructure. Affordability challenges
Public
Individual
Emerging

28
public, individual and emerging, each of them with specific opportunities and challenges to address and overcome (see Figure 14 overleaf):
n “Public” city cluster: The key here is to further improve performance in terms of sustainability and smart infrastructure – both targets which would benefit from networking of the mobility system and other efforts to reduce still further the role of individual motorized transport in the modal split.
n “Individual” city cluster: Cities in this cluster tend to be among the dirtiest and most congested in the world thanks to a disproportionate reliance on car use. In the interests of both sustainability and quality of life there is a pressing need to change the mobility culture.
n “Emerging” city cluster: Cities in this cluster have under-developed infrastructure and the resources to change this are scarce. The good news is that there is an opportunity to create a mobility system that does not repeat the errors made in mature markets.
Each of these city clusters requires a different approach to make them fit for the future, as illustrated in Figure 15:
n Rethink the System (for the “individual” city cluster): Cities in mature countries with a high proportion of motorized individual transport need to shape political agendas to fundamentally redesign their mobility systems so
that they become more orientated towards public transport and sustainability. The majority of cities in the index (53 out of 84) belong to this group.
n Network the System (for the “public” city cluster): For mature cities with a high share of sustainable transport modes, the next step must be to fully integrate the travel value chain to foster seamless, multimodal mobility while ensuring “one face to the customer” and to increase the overall attractiveness of public transport by service extension. This group contains the majority of cities in Europe as well as Hong Kong, Singapore, Seoul, Tokyo, Toronto and Buenos Aires.
n Establish Sustainable Core (for the “emerging” city cluster): For cities in emerging countries with partly underdeveloped mobility systems, the aim must be to establish a sustainable mobility core that can satisfy short term demand at a reasonable cost without replicating mistakes from developed countries. With access to emerging transport infrastructure and technologies, these cities have the opportunity to become the test-bed and breeding ground for tomorrow’s urban mobility systems.
That said, different strategic directions can be combined. In addition to rethinking their mobility system, cities in the “individual” cluster can initiate action to network the system. But these initiatives will only bring significant benefits if sustainable modes of transport make up a sufficient percentage
Baghdad
Hong Kong
Seoul Addis Ababa
Johannes-burg
Wuhan Munich
Zurich
Amsterdam
Time
Mat
uri
ty
Features: Innovative thinking Seamless integration
with “one key” for citizens
High convenience Sharing concepts
Establish Sustainable Core: Invest in
sustainable urban mobility infrastructure
Rethink the System: Shape political agenda
towards shift to public & sustainability
Network the System: Integration of different
market players and networking of citizens
Prerequisite Way forward Establish your own way
(do not replicate)
Figure 15: Three strategic directions for cities
Source: Arthur D. Little
Emerging Emerging cities with
partly underdeveloped mobility systems
Individual Mature cities with high
share of individual transport in modals split
Public Mature cities with high
share of public transport/ walking & cycling
Networked mobility Integration of all modes
to reduce share of individual motorized
transport

29
of the modal split. Hence “rethinking the system” is a prerequisite to obtaining the full benefits of “Network the System”. Similarly, cities in the “emerging” city cluster should undertake the right set of actions in order not to be forced to rethink the system in a second stage, and once the basic elements of a sustainable mobility system are in place, start introducing initiatives to network the system.
5.2. Four dimensions for cities to consider when defining sustainable urban mobility systems
Improving urban mobility is a challenge of epic proportions. As urban populations grow and economic prosperity increases, cities are increasingly under pressure to deliver fast, safe and environment-friendly transport to citizens and businesses. Fortunately, there is a wealth of good-practice examples, technologies and business models on which the various stakeholders can draw to devise effective and sustainable mobility policy.
Arthur D. Little and the UITP have identified four key dimensions to be considered by mobility actors in cities seeking to put in place sustainable urban mobility systems (see Figure 16):
n Visionary Strategy and Ecosystem
n Mobility Supply (solutions and lifestyles)
n Mobility Demand Management
n Public Transport Financing
If an urban mobility policy based on implementing the above four dimensions is to succeed in achieving its aims, it is vital that all four dimensions are improved simultaneously as the overall results will be influenced by the performance of the weakest link.
In this context, 25 imperatives should be carefully assessed by cities as a basis for setting up sustainable urban mobility policies and converted into a concrete set of actions. The relevance of the imperatives to each city will vary depending on the urban mobility city cluster to which they belong (see Figure 17 overleaf).
5.2.1 First dimension of sustainable urban mobility systems: Visionary Strategy and Ecosystem
Establishing sustainable urban mobility policies requires cities to develop a political vision and a set of urban mobility objectives based on a strategic alignment between all key public and private stakeholders of the extended mobility ecosystem. This should forge a visionary urban mobility strategy, in which priorities – and the investments required to achieve them – are identified, in a way that strikes the right balance between stretch and achievability.
The time has come for mobility actors to step up and to drive innovation in urban mobility as there is now a real window of opportunity. In order to exploit this, public transport authorities and operators will need to open their minds and take a much more holistic view on public transport than they have done up to now. They will need to work closely with each other, and the new market players, to deliver creative and entrepreneurial mobility solutions guided by a strategic vision of how cities and regions can be planned and organized.
The establishment of a visionary urban mobility strategy involves addressing seven key imperatives:
Imperative 1: Establish a transparent, viable and stable regulatory framework for public transport, integrating national and regional mobility powers, and ensuring a clear allocation of roles and responsibilities
An unstable regulatory framework is the enemy of strategic planning in both private and public sectors. Constant changes to the legal and organizational framework are a particular problem for the public transport sector.
In such a context it is vital that transparent rules are developed to allocate roles among the system’s stakeholders, with risks and responsibilities clearly split between authorities, operators, as well as private actors and associations alike.
Source: Arthur D. Little & UITP FUM 2.0
System-level framework for sustainable mobility
Mobility Supply (solutions & lifestyles)
Mobility Demand Management
Public Transport Financing
Visionary Strategy & Ecosystem
1
2 3
4
Figure 16: System-level framework for sustainable urban mobility system
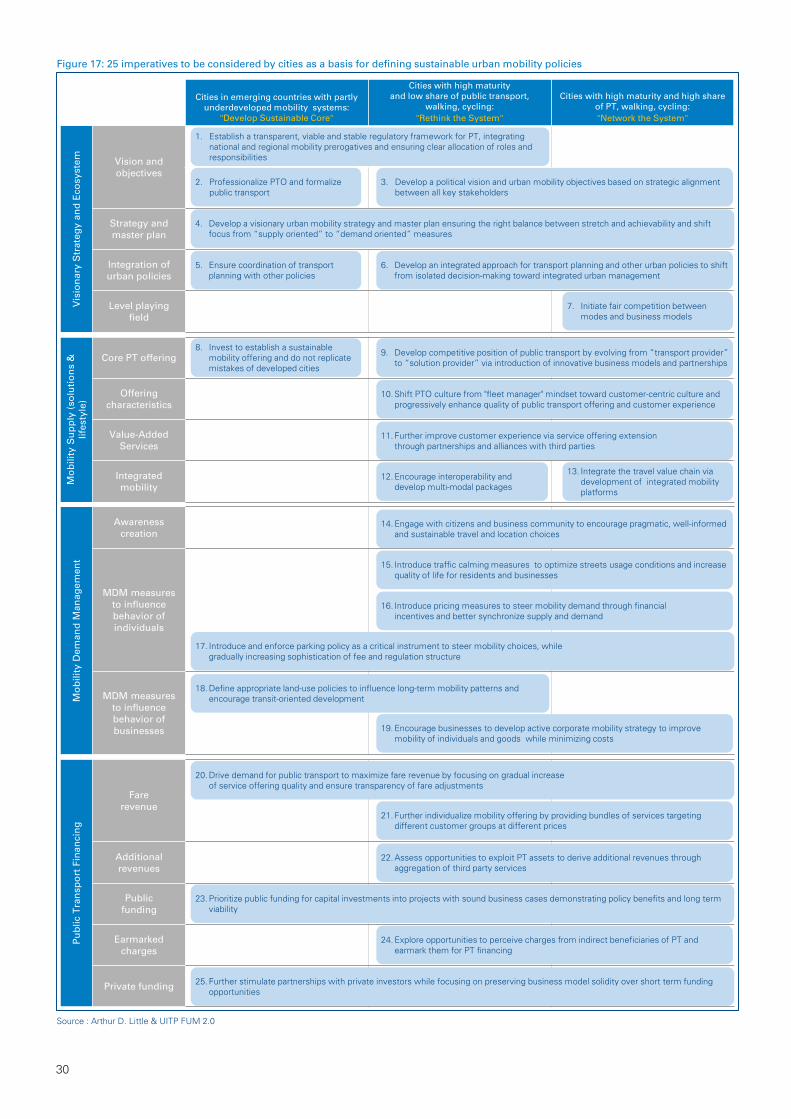
30
Mo
bili
ty D
eman
d M
anag
emen
t
Awareness creation
MDM measures to influence behavior of individuals
MDM measures to influence behavior of businesses
Mo
bili
ty S
up
ply
(so
luti
on
s &
lif
esty
le)
Core PT offering
Offering characteristics
Value-Added Services
Integrated mobility
Pu
blic
Tra
nsp
ort
Fin
anci
ng
Fare revenue
Additional revenues
Public funding
Earmarked charges
Private funding
Cities in emerging countries with partly underdeveloped mobility systems:
"Develop Sustainable Core"
Cities with high maturity and low share of public transport,
walking, cycling: "Rethink the System"
Cities with high maturity and high share of PT, walking, cycling: "Network the System"
Vis
ion
ary
Str
ateg
y an
d E
cosy
stem
Vision and objectives
Strategy and master plan
Integration of urban policies
Level playing field
Figure 17: 25 imperatives to be considered by cities as a basis for defining sustainable urban mobility policies
Source : Arthur D. Little & UITP FUM 2.0
5. Ensure coordination of transport planning with other policies
2. Professionalize PTO and formalize public transport
4. Develop a visionary urban mobility strategy and master plan ensuring the right balance between stretch and achievability and shift focus from “supply oriented” to “demand oriented” measures
3. Develop a political vision and urban mobility objectives based on strategic alignment between all key stakeholders
7. Initiate fair competition between modes and business models
6. Develop an integrated approach for transport planning and other urban policies to shift from isolated decision-making toward integrated urban management
8. Invest to establish a sustainable mobility offering and do not replicate mistakes of developed cities
9. Develop competitive position of public transport by evolving from “transport provider” to “solution provider” via introduction of innovative business models and partnerships
10. Shift PTO culture from "fleet manager" mindset toward customer-centric culture and progressively enhance quality of public transport offering and customer experience
11. Further improve customer experience via service offering extension through partnerships and alliances with third parties
12. Encourage interoperability and develop multi-modal packages
13. Integrate the travel value chain via development of integrated mobility platforms
15. Introduce traffic calming measures to optimize streets usage conditions and increase quality of life for residents and businesses
16. Introduce pricing measures to steer mobility demand through financial incentives and better synchronize supply and demand
17. Introduce and enforce parking policy as a critical instrument to steer mobility choices, while gradually increasing sophistication of fee and regulation structure
18. Define appropriate land-use policies to influence long-term mobility patterns and encourage transit-oriented development
19. Encourage businesses to develop active corporate mobility strategy to improve mobility of individuals and goods while minimizing costs
21. Further individualize mobility offering by providing bundles of services targeting different customer groups at different prices
22. Assess opportunities to exploit PT assets to derive additional revenues through aggregation of third party services
23. Prioritize public funding for capital investments into projects with sound business cases demonstrating policy benefits and long term viability
25. Further stimulate partnerships with private investors while focusing on preserving business model solidity over short term funding opportunities
14. Engage with citizens and business community to encourage pragmatic, well-informed and sustainable travel and location choices
24. Explore opportunities to perceive charges from indirect beneficiaries of PT and earmark them for PT financing
20. Drive demand for public transport to maximize fare revenue by focusing on gradual increase of service offering quality and ensure transparency of fare adjustments
1. Establish a transparent, viable and stable regulatory framework for PT, integrating national and regional mobility prerogatives and ensuring clear allocation of roles and responsibilities

31
In order to optimize performance it is important that operators are governed by a system of incentives and penalties to encourage them to conduct their business in a way that leads to achievement of strategic system-level goals.
Overall, the regulatory framework should be geared towards creating a transparent, high quality and economically efficient transport sector.
Imperative 2: Professionalize Public Transport Operators (PTOs) and formalize public transport
In many countries, informal forms of public transport make up an unacceptably high proportion of the total. Unregulated private-sector operators carrying passengers on a diverse combination of minibuses, cars, and motorcycles are a prominent feature of the modal mix.
In cities where such operators predominately tend to suffer from congestion, delays, environmental degradation and poor safety records, the only way to solve these problems is to regulate the operators via a competent public transport authority.
This might involve the creation of a register of minibus-taxi associations, owners and their vehicles; the formulation of a code of conduct for operators; training of operators and drivers; legislation to regulate minibus-taxi operations; and the recapitalizing of ageing vehicles.
Imperative 3: Develop a political vision and urban mobility objectives based on strategic alignment between all key stakeholders
No revamp of a city’s mobility system can succeed without a political vision that outlines a range of urban mobility objectives and wins the support of all key public and private mobility stakeholders. The resulting mobility vision must embody the goals of the three main stakeholders – the city administration, the private sector and the citizens – and lay out the purpose and objectives of the system.
In addition to getting all the relevant stakeholders involved, a good vision should capture the imagination of the public by addressing them in plain and simple language. It must also carry a sense of urgency if it is to create momentum in building and sustaining commitment to the city’s overall objectives.
If a clear and widely accepted vision for a mobility system exists, it ensures that:
n Future success will be systematically managed
n Expectations of different stakeholders will be prioritized
n All related activities will be channeled in one direction
n The city will take a proactive instead of reactive role in the development of its mobility system
Imperative 4: Develop a visionary urban mobility strategy and master plan ensuring the right balance between stretch and achievability
A successful urban mobility strategy consists of an integrated set of actions designed to produce a sustainable competitive advantage for a city and its transportation system.
It should be based on clear, simple and consistent goals; a profound understanding of the challenges thrown up by the environment under discussion plus the actions needed to overcome them; and an objective appraisal of the resources and abilities available. Effective implementation of such a plan will also rely on ensuring the right balance between stretch and achievability.
The maturity level of a city will dictate to what extent it concentrates action on the demand-side (mobility demand management) and the supply-side (provision of services and infrastructure). Cities in the “Establish Sustainable Core” cluster, for example, should devote about 80% of measures to the supply-side, with 20% to the demand-side. At the other end of the spectrum, cities in the “Network the System” cluster should reverse those percentages.
Imperative 5: Ensure coordination of transport planning with other urban policies
The provision of an efficient urban mobility system cannot take place in a vacuum. When planning improvements to the transport system, it is vital to ensure co-ordination among as wide a range of stakeholders as possible, including bodies responsible for land-use planning, energy and environmental planning, social policy, etc.
Different approaches are required by cities at different stages of evolution. Those that are at a point where they need to “Rethink the System” or “Network the System” need to integrate urban policies (see Imperative 6 below). While for those at the “Develop Sustainable Core” stage, initiating co-operation between transport planning and other urban policy is an initial step in the right direction. It is often desirable to foster co-operation between such bodies by promoting joint projects. If a greenfield site is being developed, for example, priority should be given to public transport, pedestrian routes and cycle paths, with roads designed for private cars treated as a secondary issue.

32
The headline goal of any effective urban mobility strategy is to satisfy the travel needs of both people and businesses in such a way that it improves quality of life for the citizen and increases the competitiveness of a country or region.
Ensuring this goal is achieved, however, involves a rigorous multi-stakeholder approach that takes in consultations between government and local authorities, public transport operators and other mobility providers, businesses, as well as community organizations like trade unions and NGOs, cycling associations and the media.
A successful urban mobility strategy needs to consider the interests of both public and private transport, passenger mobility and goods mobility, motorized and non-motorized transport and vehicles that are parked as well as those on the move.
The establishment of a visionary and well-grounded urban mobility strategy requires careful consideration of a number of dimensions, as illustrated in figure 18 overleaf.
The first step is to set the scene by gaining an understanding of the current level of mobility performance (and its shortcomings) in order to create the required sense of urgency. Alongside this, the key stakeholders need to be identified and their needs examined and understood. Finally, a thorough assessment of the existing public and private mobility initiatives is of critical importance in order to understand everyone’s agendas and avoid “throwing out the baby with the bath water”.
These findings should form the basis of a political vision and lead to the formulation of urban mobility objectives based on a strategic alignment between all key stakeholders. This will inform the urban mobility strategy, its priorities and the investments required to bring it to fruition. The geographical, functional and modal scope should also be clearly defined beforehand.
While the selection of the appropriate mobility measures should be systematically assessed against local contexts, examining other mobility strategies and initiatives allows for the identification of good/bad practices and the discovery of lessons learned elsewhere which can be inspirational.
Potentially relevant mobility measures should be identified, discussed and assessed with all the (public and private) stakeholders involved. Following this process, the most suitable measures can be selected and synergies/conflicts amongst them identified. On this basis, strategic options, in the form of integrated packages of measures, should be developed, resulting in a final selection of priority measures to implement.
The development of a master plan with a long-term horizon, which lays out responsibilities and allocates resources, together with the introduction of clear governance mechanisms for monitoring and updating is also a must. Meanwhile, a budget plan will ensure that the investment undertaken synchronizes with existing funding streams.
Last but not least is the necessity of an energetic marketing and PR campaign to communicate the aims and objectives of the strategy and ensure the maximum involvement of all stakeholders (including the public at large) in its implementation.
Dimensions to be considered when defining an urban mobility strategy

33
Imperative 6: Develop an integrated approach for transport planning and other urban policies to shift from isolated decision-making toward integrated urban management
As mentioned above, more mature cities must ensure that transport planning is not treated in isolation from other elements of urban policies. Integrated urban management might call for mobility strategy to be aligned with the regional sustainability strategy, for example, to make a ‘greening’ of the modal split a cornerstone of mobility policy. Harmful emissions can be reduced by establishing environmental zones for cars and zones with speed limits to ensure traffic calming, together with the pedestrianization of city centers.
Cities should make ‘Urban density increase’ a priority when it comes to land-use planning in order to decrease travel distances and the need for individual transport thus making commuter destinations more accessible. Investment in public transport should go hand-in-hand with this to ensure that citizens are not forced to resort to using their cars due to a lack of public transport solutions.
Imperative 7: Initiate fair competition between transport modes and business models
Fair competition in the transport sector is a prerequisite for innovation and efficiency. As public sector monopolies may not always have motivation to perform at peak efficiency, opportunities to gradually replace or complement them by systems that involve private and public operators operating in competition should be explored. This can not only maximize the efficiency of the service operators but will lead to the right mix of services and customer experiences, as well as an improvement in standards across the board.
Indeed, it is not overstating the case to say that initiating fair competition between different transport modes and transport business models is a prerequisite for networking the system.
Figure 18: Dimensions to be considered when defining a sustainable urban mobility strategy
Setting the Scene
Sense of urgency 1
Accountabilities 2
Stakeholders views 3
Scope 4
Vision & Objectives 5
Good practices 6
Measures 7
Roadmap 8
Governance & Marketing 9
Vision & Objectives
Strategy Formalization
Strategy Execution & Monitoring
Understand patterns to reach shared understanding of mobility issues Objectivize current mobility performance & gaps with best practices
Understand needs and agendas of each stakeholder group Understand needs of different customer groups (individual, businesses)
Identify key stakeholders and clarify “grey zones” of accountabilities Understand current (public and private) mobility initiatives
Develop a political vision and set priorities and targets Ensure alignment between stakeholders on priorities (non normative)
Identify relevant mobility measures for set priorities and assess synergies Select strategic options in form of integrated package of measures
Set up clear governance mechanisms for monitoring and update Marketing of mobility strategy, PR work with other stakeholder groups
Synthesis of experience from other mobility strategies and initiatives Identify Good/Bad Practices and lessons learned
Define geographical scope: city, region, nation Define functional (mobility, sustainability) & modal scope (persons, goods)
Develop master plan with responsibilities and resources allocation Develop budget plan and synchronize with funding streams
Source: Arthur D. Little

34
5.2.2. Second dimension of sustainable urban mobility systems: Mobility Supply (solutions and lifestyle)
Responding to increasing demand for urban mobility and to consumer and business needs for seamless, multimodal urban mobility requires cities to extend their public transport offering and adapt it from “delivering transport” to “delivering solutions”. This transformation can be achieved through a combination of quality improvements to the current public transport offering and an increase of customer experience via service offering extension through partnerships and alliances with third parties.
Mobility supply can be articulated into three main categories, of which the two first constitute core mobility services (see Figure 19):
n Supply and operations of infrastructure and modes of transportation
n Offering characteristics: quality, safety, security, convenience, sustainability, affordability
n Development of additional value-added services next to core mobility services
Developing appropriate mobility supply policy – providing the right response to consumer and business need for seamless, multi -modal urban mobility – involves addressing six key imperatives:
Imperative 8: Invest to establish a sustainable mobility offering and do not replicate mistakes of developed countries
Many of the biggest cities in the emerging economies – such as Tehran, Beijing and Sao Paolo (to name a few) – made the mistake of prioritizing roads for private cars when they were establishing their mobility systems, with the result that they are now plagued by congestion, air pollution and road safety issues.
Today’s cities in the “Establish Sustainable Core” cluster have the opportunity to avoid the mistakes of the past by making public transport the priority in designing their mobility systems.
This means investing in the establishment and development of:
n Rail lines and stations optimized to serve as multi-modal interchange points
n Heavy (metro and suburban) rail, light rail services, and trams
n Bus rapid transit services, etc.
Planners should never lose sight of the need to progressively increase the geographical coverage of the public transport network and the frequency of services. The earlier cities start thinking about environmentally sustainable modes of transport, the fewer problems they will have to deal with in the future.
Figure 19: Key components of public mobility services
Public mobility infrastructure
Source: Arthur D. Little
Accessibility, operating hours, punctuality, reliability, frequency, network coverage
Sufficient capacities in peak periods
Exploitation safety performance, security and perception of security
Emergency medical and police services
Real-time information, planning, booking and payment
Comfort, speed, congestion freeness
Energy efficiency and alternative engines Air quality and noise neutrality, climate
neutrality
Financial attractiveness for users, meeting social and distributional objectives
Cost efficiency of operators, PT incentives
Quality
Safety and Security
Conve-nience
Sustain-ability
Afford-ability
Rail (regional, sub-urban, metro, light rail, tram)
Buses (regional, urban buses & trolleybuses, BRT)
Ferries, Personal Rapid Transit
Car & bike sharing Car & bike rental Taxi & limousine service Etc.
Park + Ride facilites Bike + Ride facilites Bike garages and parking boxes Etc.
Public transport
Public individual transport
Parking infra- structure
Service offering characteristics

35
Imperative 9: Develop competitive position of public transport by evolving from “transport provider” to “solution provider” via introduction of innovative business models and partnerships in order to foster sustainable transport
Public transport operators need to evolve from “transport provider” to “integrated solution provider”, who offer a broad range of sustainable mobility services, and thus create strong alternatives to the use of individual motorized modes of transportation in favor of sustainable transport modes.
This can for instance be achieved via the establishment of inter-modal strategic partnerships and alliances with taxi, bike and car sharing providers, operators of parking facilities and major mobility generators such as business parks. Public administra -tors can assist PTOs in this challenging task by providing:
n Segregated infrastructure for tramways and buses
n Urban traffic control systems giving priority to public transport at traffic lights
n Park and Ride facilities that allow car drivers to avoid congestion by completing the inner-urban part of their journey by rail or public transport, etc.
In order to encourage the bike sharing industry, the city administra tion should also take care of segregated cycle lanes – that help promote cycling as a safe activity – and bike parking facilities.
Another aim should be to make private modes of transport more “public” (e.g. through the introduction of car sharing or
pooling) and public modes more “private” (e.g. through the introduction of persona lized journey planners). This will enable customers to benefit from the advantages of both private and public models while simultaneously travelling with sustainable modes of transport.
Imperative 10: Shift public transport operator culture from “fleet manager” mindset toward customer-centric culture and progressively enhance quality of public transport offering while improving customer experience
In the not too distant past, public transport operators sometimes saw themselves as administering logistics rather than serving customers. In this service-conscious age, public transport opera-tors need to evolve toward a more customer-focused culture (see Figure 20).
This evolution should be achieved by putting the interests of the customer at the heart of decision-making, leading to quality enhancement of service offering characteristics, such as:
n Improving quality of static and real-time information (e.g. through the introduction of contextual journey planners, with online booking and real-time travel information, to ease seamless travel across the various public and private transport modes)
n Improving punctuality and regularity of services
n Improving security and perception of security, etc.
Public transport operators that have excelled in progressively building a superior customer experience have approached such programs in three steps:
Figure 20: At the end of the day, the emotional experience is what makes the difference
Source: Arthur D. Little
Physical Experience
Price, product features, location, time to serve, channels, …
Traditional Approach
People buy based on emotions … and justify with logic! Customers give their money … but fans give their hearts! Customers complain … but fans forgive
The Essence of Superior Customer Experience
The Basics ... ... and what makes the Difference!
Emotional Experience
Senses stimulated and emotions evoked (Smell, sight, hearing, touch, taste)
Best Practice – turning Customers into Fans
+

36
n Eliminate major drivers of customer dissatisfaction
n Ensure a consistent approach towards passengers across the whole journey
n Exceed passenger expectations at selected touch points to create moments of memory and a “wow effect”
As a first step in this direction, public transport operators need to identify passenger expectations by customer segment and assess the current level of customer experience for each attribute of the offering along the customer journey, thereby allowing for the identification of priority areas of improvement.
Enhancing service-offering quality and improving customer experience while getting costs under control requires the authorities to prioritize their actions and make the required trade-offs according to their expected impact. Improvement can be achieved through a combination of smart actions of different nature that do not always need to be expensive. Alongside hard measures (mostly infrastructure-related involving high capital expenditure) and measures related to the introduction of new technologies, the role of management measures (e.g. adapting processes toward increased customer centricity) as well as soft measures (e.g. training to increase staff empathy) should not be underestimated.
Imperative 11: Further increase customer experience via commercial offering extension through partnerships and alliances with third parties
The development of a coherent commercial offer within subway and railway stations, transforming stations from being purely transport providers to destination locations for consumers can significantly improve customer experience while maximizing revenues from existing assets.
Historically, infrastructure operators have had some difficulty in setting up an optimal and value creating commercial offer. Airports, and to a lesser extent railway stations, are now at an advanced stage of their commercial activity redesign as a key element of customer experience and a key lever of value creation, whereas local public transport operators still have major room for improvement.
The introduction of complementary value-added services to the core public transport offering can come in two forms:
n Through improving the existing retail, food & beverage and advertising offerings in stations
n Through the development of additional business, convenience and leisure services
Of particular importance in this context is the definition of the most appropriate industrial models for the operations of commercial activities. These can be a combination of direct operation, plus concessions and/or partnerships with third parties. In most cases, public transport operators would benefit from assessing opportunities to collaborate with commercial operators for some part of their commercial operations, in order to benefit from their experience and economies of scale in managing such types of activities. Early integration of such partners into new infrastructure development or infrastructure renovation projects can also enable their participation in more global investment schemes and can accelerate renovation.

37
Walk through a modern airport these days and you are treated to an assault on the senses. Advertising, whether in the form of video, posters, or point-of-sale, vies for the attention of travelers at every turn. Restaurants, bars, and coffee shops offer tempting diversions. And fashion boutiques, newsagents, and a wide range of other retail outlets aggressively promote their wares. It is no surprise to learn that, next to contributing to superior customer experience, such activities generate valuable supplementary income to their host’s core business.
Airports, and to a lesser extent railway stations, have led the way in this regard, with such activity now a key element in the customer experience and a significant lever of value creation. Among local public transport operators, however, there is still massive potential for growth in this area.
Railway and subway stations however share many of the characteristics of airports. Both have excess floor space, large volumes of people traffic, waiting areas, network coverage and numerous employees. They also have one attribute airports lack: they are often in downtown locations. And yet, with the exception of a handful of forward-thinking operators such as MTR in Hong Kong, which initiated a comprehensive redesign of its commercial strategy several years ago leading to superior customer experience and substantial value creation (reaching an average of 3,800 EUR of revenue per commercial sqm), and London’s newly renovated King’s
Cross station (to name but two), railway and subway stations operators all too often fail to fully capitalize on their captive market of passengers, tourists, staff and nearby residents.
The presence of shops, food & beverage outlets and business and convenience services can drastically improve customer experience by developing a coherent and warm atmosphere within and around the stations and is a key lever of value creation for infrastructure operators (see Figure 21).
The failure of subway operators and, to a lesser extent, railway companies to develop profitable commercial offerings as the airports have done can be traced to a number of factors. Infrastructure networks are usually heterogeneous and smaller stations may not be in a position to support commercial activities due to their more limited passenger flows as well as constraints related to access and sanitary standards, requiring potential commercial operators to take this extra level of complexity into account. But all too often the failure to generate a vibrant commercial offering lies in a complacent acceptance of the status quo, characterized – amongst other elements – by a lack of internal processes and capabilities to support commercial activity development and operations that typically fall outside the core business of most transport operators or by long-term relationships with outdated retail operators blocking the introduction of more innovative concepts.
Figure 21: Development of a coherent commercial offer within subway and railway stations
Nearby residents
Tourists
Staff
Passengers
Source: Arthur D. Little
Which targets? What offer?
A coherent and warm atmosphere within and around the station Food &
Beverage offering
Business, convenience and leisure services (banking, laundry,
shoe repair)
Retail area (press,
convenience, fashion, etc.)
Advertising
Development of a coherent commercial offering for subway and railway stations

38
This is a big mistake. With public sector budgets under strain as never before and over-loaded mobility systems in desperate need of expansion, infrastructure operators can no longer afford to allow such a potentially lucrative resource to go unexploited.
A number of dimensions should be considered by public trans port operators in order to develop a coherent commercial offering for subway and railway stations, as illustrated in Figure 22.
A first step is to understand the “playing field” as a requirement for the definition of appropriate ambitions for each commercial activity that can include retail, food & beverage, and advertising, as well as different types of business, convenience and leisure services. This can be done through the identification of the (unmet) needs of different target groups – passengers, tourists, staff, nearby residents – combined with an assessment of the extent to which available competitive offerings are fulfilling those needs. Internal and external constraints, such as fit with the corporate strategy and the scope of activities under accountabilities, should also be taken into account.
The commercial strategy definition should include the identification of:
n The scope and mix of commercial offering(s) to be developed per station category as well as the key principles of commercial zone development
n The most appropriate industrial model for each commercial activity, which can be a combination of direct operation, and concessions or partnerships with third-party operators
As the process gets under way, several scenarios should be kept open as the outcome of some of them will depend to a great extent on the outcome of negotiations with potential partners.
A great deal of attention should be devoted to the elaboration of well-grounded business cases for each of the potential scenarios (scope of activities and industrial models combination), which will allow for validation of the ambitions set and for evaluation of the impacts of different contractual terms during negotiations with third parties.
The development of a detailed roadmap is also of critical importance in avoiding common pitfalls during implementation. Apart from the definition of the activities required for the development of the offerings, the roadmap should also include actions to manage the required internal transformation, both in terms of organization and processes (for direct operations and follow-up of activities performed by third parties), as well as in terms of the building up of internal capabilities.
Figure 22: Dimensions to be considered to develop a coherent commercial offering for subway and railway stations
Governance
Customer needs
Definition of commercial offering strategy: scope and mix of activity per station category, key principles of commercial zones development, etc.
Definition of target positioning per commercial activity (retail, F&B, advertising, services, etc.) taking into account internal/external constraints
Profiling of potential partners and definition of appropriate industrial model per activity (direct operation, concession, financial and/or operational JV, etc.)
Development of business cases (Revenue, Capex, Opex, NPV) taking into account different scenarios as well as financial and operational constraints
Profiling of target segments: passengers, tourists, staff, nearby residents Identification of segment needs along the journey (per commercial activity)
Competitive intensity
Offering strategy
Ambition
Industrial strategy
Business cases
Definition of negotiation tactics and contractual terms with third parties Set up of governance mechanisms for monitoring and follow-up
2
4
3
1
5
6
8
Roadmap Establishment of implementation roadmap per zone and commercial
activity, incl. required internal transformation (organization, processes, capabilities)
7
Understanding the playing field
and setting the ambition
Strategy formulation
Strategy execution & governance
Source: Arthur D. Little
Profiling of competitive offerings per commercial activity/geographical zone Assessment of competitive intensity per activity against key buying criteria

39
Imperative 12: Encourage interoperability and develop multi-modal packages
Integrated mobility means seamless travelling across different modes of transport and includes:
n Easy access to all means of transport: integrated payment combined with real-time information on availability, time and place of means of transport
n Support and facilitation through smartphone apps, online platforms, pricing schemes, discounts, loyalty programs
n Provision of innovative mobility services – car and bike sharing, etc.
From the customer perspective, integrated mobility supply has clear added value as it enables them to:
n Choose from an exhaustive set of public transport modes across diverse mobility providers
n Plan and book the whole trip across all transport modes in just one click
n Use all mobility forms with one single authorization
n Buy only one ticket and pay one bill for the whole trip
n React in real time to changing customer needs, travel obstacles and opportunities (traffic jams, weather, meeting delays, rebates), etc.
Such interoperability can be achieved by integration of fares, ticketing, timetables, transport modes, information and booking processes, the establishment of technical interfaces and the development of a unified medium for customers. All this enables provision of integrated mobility offerings or so-called multi-modal packages.
The realization of this multi-modal mobility vision requires strong cooperation between urban public transport operators and other local mobility operators such as rail companies, taxi services providers, sharing and rental companies, as well as public transport operators in other regions. The latter should be encouraged by public authorities. Experience shows that the strong support of a city’s top management is critical for the establishment of broad partner ecosystems and thus the successful implementation of integrated urban mobility offerings and multi-modal packages.
Imperative 13: Integrate the travel value chain via development of integrated mobility platforms
It was not that long ago that every single journey on public transport required a separate ticket purchase from the transport operator of the vehicle you were due to travel in. Then smart cards arrived and in many cities everything became a lot more straightforward as passengers could travel on bus, metro and railway services using one prepaid travel card.
As there is a strong customer need to enjoy mobility that is more convenient, faster and easier, in the near future, innovative mobility services will be much less driven by separate improvements in different transport modes and system-level innovation will be required to make the difference and respond to consumer and business needs for seamless and integrated mobility. That is why in several cities belonging to the “Network the System” city cluster, mobility service operators (public and private), together with other actors such as connectivity providers, payment providers and internet businesses, are working together to devise integrated mobility concepts, often referred to as between integrated mobility platforms. This is where the Amazon and Apple business model archetypes of urban mobility (as introduced in section 4 above) come into their own.
Integrated mobility platforms involve:
n Provision of an integrated mobility concept through seamless integration of own mobility services and aggregation of services offered by third-party providers
n Offering of service for own account, while managing planning, booking, payment and billing, thereby ensuring “one face to the traveler”
The demand is there. There are new business models and there is urgency. However, devising integrated mobility platforms with a sound business case requires careful consideration of a number of dimensions (as further detailed below). Turning the mobility paradigm towards full integration will take vision, creativity and entrepreneurship among those players who take up the challenge as integrated mobility platform operators, but they will have a tremendous market potential to address.

40
Developing integrated mobility platforms requires the negotiation of a complex web of relationships with the relevant public and private stakeholders in the extended mobility ecosystem (see Figure 23):
n Mobility service operators (motorized-individual, public individual, public, non-motorized and stationary)
n System integration providers
n Connectivity providers
n Data provision providers
n End-user equipment providers
n Value added service providers
In this integrated ecosystem, a critical role is the one of “integrated mobility platform operator”, responsible for planning, booking, payment and billing, thereby ensuring “one face to the traveler”.
The integrated mobility platform operator should be able to:
1. Act as a single point of contact for travelers and as a full service provider, a role that involves:
n Bundling of third-party services and selling them on
n Responsibility for delivery of third-party services and associated risks
n Collection of payments and management of security and fraud
2. Aggregate services of all mobility providers across all modes of transport, a role that involves:
n Design and management of partner ecosystems
n Penetration of new areas through contracts with local mobility providers
n Reaching all mobility providers to keep the promise of total mobility
3. Offer tailored solutions considering customer preferences, lifestyle and budget, a role that involves:
n Customer profiling
n Achieving a balance between requirements on data security and the need for transparency
The establishment of integrated mobility platforms requires careful consideration of a number of dimensions to ensure the development of a robust concept with a balanced business case, as illustrated in Figure 24 overleaf.
Figure 23: Integration of relevant public and private stakeholders within the extended mobility ecosystem
Source: Arthur D. Little Note: CS = car sharing, BS = bike sharing, SU= suburban, LD = long-distance
Techno platforms
Apps Merchant
terminals
Fixed Mobile NFC
Maps Congestion
info Time
schedules Etc.
Mobile handsets
Smart cards Chips
Planning Booking Payment Billing
Modes of transport
Retail Culture Sport Food &
beverages Tourism
B2B B2C
Public individual
Public
Non-motorized
Stationary
CS BS Taxi Car pooling
Motor. individual 2-wheeler Car
Car rental Bike rental Limo
Air
LD train Reg. train
SU train Bus Tram Metro
Reg. bus
Own bike Foot
HW: On/off street , P+R, B+R
SW: finder
Integrated mobility platform operator
Planning Booking Payment Billing
System integration
Connec-tivity
Data provision
End-user equipment
Tour operation
Mobility services
Value added services
Marketing & sales
channels
Dimensions to be considered when developing integrated mobility platforms

41
Key challenges encountered while setting up integrated mobility platforms are typically related to three aspects: stakeholder management, business case and technology.
1. Extended ecosystem stakeholder management
n Finding the right set of partners to close all competency gaps along the value chain while ensuring a positive business case for each partner.
n Alignment between public and private stakeholders, requiring strong will for change from both sides and implying lengthy negotiations over vision alignments and business model definitions.
n Finding the right (legal and operational) structure for the operating company.
2. Devising a profitable business case
n If kept at regional level, given the significant investments required to set up and manage such integrated platforms, an extension of the revenue pool through the introduction of value-added services constitutes a vital part of arriving at a balanced business case. Given the low margin level, local public transport authorities or operators are likely to take the role of integrated mobility platform operator.
n If carried beyond regional borders, there can be numerous candidates for the role of mobility platform operator. Companies that enjoy strong customer trust, who are able to master technology and integrate partners, can act as integrated mobility platform operators. Apart from public transport authorities and operators, most promising candidates are connectivity providers and internet businesses, automotive OEMs, financial institutions and payment providers. In this brave new world, first mover advantage will prove a key success factor.
3. Technology
n While the necessary technologies are available to address the needs of integrated mobility platforms, the technological interfacing of different transport modes and infrastructures and the seamless integration of technology (and underlying management mechanisms) can be challenging.
Figure 24: Dimensions to be considered when developing integrated mobility platforms
Roll-out plan
Customer groups
Definition of revenue drivers per business segment: B2A, B2B, B2C Pricing model, financing options, profit pool distribution
Definition of to-be positioning along the value chain Build-up of partner ecosystem to cover non-core competencies
Quantitative structure, CapEx, OpEx, profitability scenarios Financial model, profitability sensitivities
Business model choice and detailing Definition of services to be integrated and aggregated
Specification of frond-end and back-end technology Processes for planning, booking, payment and billing
Customer segmentation; value proposition per customer groups Quantification of market potential starting with customer demand
Offering portfolio
Revenue drivers
Extended ecosystem
Cost drivers
Technology
Detailing of possible development paths and time sequence for roll-out Assessment of implementation feasibility & risks, planning of activities
2
4
3
1
5
6
8
Organization Construction of internal and external organizational frameworks Assessment of legal feasibility and establishment of operating company
7
Offering tailored to customers
needs
Ecosystem and
business case
Organization & roll-out
Technology
Source: Arthur D. Little

42
5.2.3. Third dimension of sustainable urban mobility systems: Mobility Demand Management
While the supply of infrastructure, vehicles/rolling stock and services will always have a key role in the provision of any urban mobility system, the management of the demand side is equally important and should be an integral part of any mobility master plan. Given the limited capacity of current mobility systems and the level of investment required to expand them, this is a particularly vital issue to be addressed by the transport authorities of cities belonging to the “Rethink the System” and “Network the System” city clusters.
Mobility Demand Management (MDM) strategy typically includes a cocktail of incentives and penalties aimed at encouraging durable changes in mobility behavior. This makes it a delicate discipline, which can easily meet strong resistance if not properly managed, as it can be perceived as working against the principles of freedom of movement.
While some MDM measures have already demonstrated clear benefits, the relevance and acceptability of each individual measure must be assessed against local contexts and based on the existence of viable alternatives to motorized individual transport. This prerequisite of viable and sufficient alternative travel options is a reason for the relative predominance of MDM approaches in cities in the “Rethink the System” or “Network the System” clusters. Communication is key and authorities should open up a dialogue with key stakeholders, including citizens, businesses and the real-estate community.
Apart from the introduction of measures to influence the travel behavior of individuals, urban logistics measures, such as the introduction of innovative distribution models, schedules, and road freight fleet management systems, are also of critical importance to better manage the movement of goods.
Six key imperatives should be considered while developing a comprehensive mobility demand management policy mix (see Figure 25):
Imperative 14: Engage with citizens and the business community to encourage pragmatic, well informed and sustainable travel and location choices
MDM requires dialogue with key stakeholders via various communication channels to make citizens and businesses aware of the consequences of their mobility choices and encourage them to make pragmatic and sustainable travel choices. Effective and clear communication is of paramount importance to raise the acceptance level of MDM measures, which can easily be tagged as “anti-democratic” and “restricting personal freedom.”
To this end, campaigns incorporating messages such as pollution, congestion, health, safety and affordability should work to raise awareness of the advantages of a smarter mobility choice. By positioning the use of sustainable travel modes as a lifestyle choice, customers can be converted into loyal community members.
Figure 25: Set of measures to consider when defining the right Mobility Demand Management mix
Acceptance of measures to be assessed based on existence of viable alternatives to motorized-individual transport modes and dialogue with key stakeholders (citizens and businesses). Adaptation to local context is a must.
Campaign in schools & business community
Welcome packs for new residents Multimodal contextual journey planners
Commu-nication
campaign
Street design: vertical and horizontal deflection
Speed limits; Green zones Shared spaces
Traffic calming
measures
Pricing measures
Reduce supply Fee sophistication Electronic guidance Access contingent parking model
Parking policy
Mobility impact analysis & mitigation Transit oriented development (Re)location of companies
Land-use measures
Mobility plan; Mobility manager Salary incentive Telecommuting Encouragement of carpooling Urban logistics schemes
Corporate policies
Congestion charge Smart fares Usage-based taxes and insurances Fuel price
1
2
3
4
5
6
Source: Arthur D. Little & UITP FUM 2.0

43
Four particular audiences should be targeted by these campaigns:
n School children: Targeting this group has the effect of influencing the mental patterns of both the younger and older generations, as young people nowadays are exerting powerful behavioural influence on their parents.
n New residents: Proactively offer them personalised advice ideally coupled with a “trial voucher” before they become car-addicts. In Munich, all new residents receive mobility information when they apply to open electricity, gas and water accounts. In addition, a specially designed website offers long-term comparisons between central and suburban housing options. These show that a more expensive central rent or mortgage will largely be offset by a less expansive mobility budget over the years.
n Non-users: Information is critical to foster a behavioural change of non-users and often requires to provide them with a “one-stop-shop” for all combinations of public transport options. Developing virtual journey planners (“travel companions”) as well as providing attractive discount for new users can be an effective incentive to encourage a switch from individual motorized transport modes.
n Large businesses: This segment includes real estate developers, shopping malls, hospitals, etc. As these are rarely well-informed about the mobility impact of their location choice, a well-timed intervention can bring about a change of heart.
Imperative 15: Introduce traffic-calming measures to optimize street-usage conditions and improve quality of life for residents and businesses
While traffic-calming measures are generally seen as being linked to improving the quality of life of local residents, they can be a potent weapon in the hands of a mobility authority looking to encourage people to switch from being exclusive car-users to using a variety of more sustainable transport options.
The truth is that any measure that leads to restrictions on the convenience of car use improves the overall competitiveness of alternative options. Options include:
n Street design – can be geared to decreasing speed (humps, chicanes, traffic loops), or redistributing space to non-traffic functions (playing areas, street furniture, vegetation), or soft mobility (pavements, cycle paths).
n Speed limits – apart from speed limits themselves, road humps and “chicanes” perform a similar function.
n Traffic limitation and green zones – areas with limited access and restrictions of (more) polluting vehicles.
n Bans on through-transit traffic – perhaps targeting heavy-duty vehicles.
n Shared spaces – zones where street markings or signs are suppressed, thus encouraging prudent behaviour by car drivers who are in close proximity to pedestrians.
n Restrictions on vehicle ownership or use, by imposing an annual quota on the sale of new cars or restricting access to the town centre by plate number (odd or even), can also contribute to mode migration.
These measures show that an integrated mobility agency – not only in charge of public transport provision, but also of street management as is the case in London – is a major asset in promoting policy consistency and mutual reinforcement.
Imperative 16: Introduce pricing measures to steer mobility demand through financial incentives and better synchronize supply and demand
One sure way of reducing congestion in the inner city is to hit the driver where it hurts most: the wallet. Access to congested areas can be influenced by pricing:
n To reduce bottlenecks in rush hours, differentiate fares according to time of the day. This will flatten the hyper peaks, the points at which the marginal cost of extra supply is most expensive.
n Introduce an urban toll (or congestion charge) on commuters to combat congestion and harmful emissions. Modulable fee can also be introduced according to time of the day.
The latter type of instrument is generally used with one of two ends in view – to ease congestion and emissions, or to raise cash (in the latter case, it is important to devote the fees raised to mobility improvements). However, in practice, they tend to serve both purposes. The experiences of London, Milan, Singapore or Stockholm in the past decade have shown that such apparently unpopular measures do work and can be accepted without driving all businesses outside of the cities.
Another option, however, is to change the cost structure of car ownership so that variable costs become a bigger proportion of the average driver’s outlay. As things stand, drivers tend to pay a series of fixed costs on items such as car tax, fuel tax, and insurance premiums, and then use their cars as much as they can, regardless of the circumstances and traffic conditions. Revamping the fiscal regime of company cars is another option worth looking at. Membership of a car sharing scheme can be offered as an alternative.
A transformation of this structure is recommended so that these fixed costs become variable, with resultant benefits for the lighter user. Smart insurance schemes can be introduced, for example, under which lower mileage users or owners of public transport season tickets are rewarded with lower premiums.

44
Imperative 17: Introduce and enforce parking policy as a critical instrument to steer mobility choices, while gradually increasing sophistication of fee and regulation structure
Although frequently under-estimated, parking is a critical factor in individual mobility choice. Motorists are willing to accept low commuting speeds and congestion if they are confident of getting easy and cheap parking facilities at their destination. For cities, however, commuter parking can represent a waste of a useful and precious community space.
Fortunately, municipal authorities have a number of weapons in their armory to deter car parkers. The introduction of fees for on-street parking has been shown to be a key influence on transport choice and long-term commuter full-day parking should be disincentivized in favor of residents and shorter parking slots for visitors and consumers.
Fees should be set at a minimum level during the start phase and increased gradually as alternative travel options are made available. Fees can be modulated according to place and time and with the availability of new technologies for payment, their structure can become more sophisticated in time.
Caps on parking provision in and around large developments, such as offices, housing estates and shopping centers, can also be a powerful tool. The number of parking places in a development’s car park can be set at a particular rate per square meter it occupies or the number of inhabitants or employees it houses.
In more mature cities, the Access Contingent Model is a promising strategy to reduce the traffic impact of big sites such as shopping centers or sports stadiums. The idea is to agree on a maximum number of car-trips to the site by defining a contingent that may not be exceeded. The sanctions to be applied in case of non-compliance are fixed by a contract between the developer and the local authority as part of the building permission. This model commits the developers to achieving results, not just setting up the means.
Imperative 18: Define appropriate land-use policies to influence long-term mobility patterns and encourage transit-oriented development
The widespread use of the private car all too often stems from the way a city was laid out in the first place. A corollary of this fact is that if you can design your city or district in such a way that smart transport options are available from day one then no corrective measures will be required.
It follows, therefore, that urban and land-use planning are of paramount importance. The key aims of land-use consideration should be to control urban sprawl and to support transit-oriented
development. The integration of mobility management and land-use planning can be addressed both in the plan-making process and in the site-related building permission process:
n At the macro level, authorities should institute land-use measures and policies to concentrate housing, jobs and services in close proximity to major public transport hubs to avoid uncontrolled sprawl.
n At the micro level, authorities should require any developer to include mobility analysis and impact assessment in their project submissions. It is also recommended that development in areas insufficiently served by existing public transport should be authorized only if the developer contributes to the capital or operating expenditure of the desired services to access its facilities.
Imperative 19: Encourage businesses to develop an active corporate mobility strategy to improve mobility of individuals and goods while minimizing costs
Managers of businesses can be a powerful partner in promoting sustainable urban mobility and easing congestion. They should be encouraged to develop a corporate mobility plan and appoint a mobility manager. The former will identify the travel habits of their staff, so that a series of tailor-made solutions can be offered. The latter will be in charge of advising company management of mobility impact of daily or longer-term strategic decisions. (This person shall ideally report directly to company general management.) In business parks, this function should ideally be mutualized to increase its efficiency.
In this context, the following measures introduced by businesses have already demonstrated clear benefits in positively influencing mobility behaviors of employees:
n Introducing flexi-time work schedules allowing employees to choose a less congested commuting time.
n Encouraging tele-working to avoid some commute trips.
n Encouraging smart commuting by offering free or discounted season tickets to staff or by promoting car pooling, possibly alongside the development of company tools to support it.
Similarly, the identification, in conjunction with retailers and logistics operators, of measures to foster the emergence of more virtuous urban logistic schemes can lead to a reduction in the negative effects of moving goods in the city, while limiting cost and business impacts. Among the measures in this field currently under scrutiny are the establishment of urban distribution centres (within or outside of cities), the development of exclusivity zones and the transport of deliveries via alternative (greener) transportation modes, as further explained below.

45
The need to rethink and rationalize urban logistics is being pushed on the front scene by the boom of the number of shipments (exacerbated by the online shopping growth) as well as the growing sensitivity by the general public of the negative environmental and societal impact of fuel driven deliveries in saturated urban centers.
However urban logistics is a difficult issue to apprehend as it encompasses several levels of complexity: next to the heterogeneity of the goods transported and of the means of transportation, urban logistics encompasses a multiplicity of stakeholders (public transport authorities and other local authorities, transportation companies, shippers), each of which may have diverging interests and most of which will – in most cases – lack a shared understanding of the status quo, the priorities and the most appropriate action levers. While local authorities will be interested by opportunities to reduce congestion, pollution and noise, transportation companies and shippers – even if willing to contribute to urban mobility objectives, thereby improving their image – will be mainly triggered by keeping costs under control while maintaining or
increasing service level. This complexity may very often lead to partial, sub-optimal or even counter-productive decisions/solutions being enforced.
The establishment of a well-grounded urban logistic scheme strategy requires careful consideration of a number of dimensions.
First of all, if a reform of urban logistics is to succeed, authorities need to set their priorities before selecting the most appropriate levers to achieve their objectives. After all, while they may be tempted to impose restrictions on trucks entering the city, they do not want to be blamed for harming the economy by raising the shippers’ costs and reducing service levels. These measures need to be developed in a concerted way with the transportation companies, as well as the shippers/recipients around a shared series of objectives. They should provide both positive incentives to the behaviors supporting these objectives, as well as negative ones to the stakeholders not accepting to play by these rules.
Figure 26: Levers to consider when defining appropriate urban logistic schemes
Lever efficiency strongly depends on transport authority’s ability to enforce rules
Source: Arthur D. Little
Lever
Urban Distribution Center (UDC) out of town
Massified delivery to Urban Distribution Center upstream of city Delivery route preparation in UDC Often coupled with Exclusivity zone and/or greener trucks
Urban Distribution Center (UDC) in town
Massified delivery to urban distribution center within city core Delivery route preparation in Urban Distribution Center Often combined with Exclusivity zone and/or Greener trucks
Direct injection Preparation of delivery routes in containers Transport of containers by massified transportation means (train, boat) and transfer to another
mode for last mile transportation
Exclusivity area Exclusivity (usually city core) to a single transportation company Can be limited to some truck sizes and/or time slots
Traffic lane/drop off space reservation Booking of dedicated stopping spaces/traffic lanes
Time slots Opening/shutting of specific times slots for some types of trucks
Greener trucks Usage of “greener” trucks (Euro NCAP 5, gas, electric) Often combined with restrictions
Alternative transportation means
Delivery by alternative vehicles (bicycles, etc.) with a smaller capacity and range Usually combined with Direct injection or UDC in town
Congestion charge Implementation of congestion charges Can foster development of UDC at congestion charge border
Description
Dimensions to be considered when devising urban logistics strategy

46
A urban logistic strategy can typically contribute to several goals, each of which can be influenced by different factors and some of which may be conflicting with each other, thereby requiring careful prioritization:
n Urban congestion reduction, influenced by distance travelled, vehicle capacity & length, and easiness to stop
n Reduction of number of trucks in the city, influenced by vehicle capacity, vehicle filling ratio and congestion level
n Pollution reduction (i.e. CO2/NOX and PM), influenced by vehicle type, distance travelled and congestion level
n Noise reduction, influenced by vehicle type, distance travelled and congestion level
n Development of local economy, influenced by solution costs, impact on service quality (speed, delivery time slots, flexibility/reactivity, etc.)
n Contribution to housing policy (increasing housing space within city limits), influenced by inner city logistics platform footprint.
To achieve these objectives, city authorities and transportation companies can typically apply a combination of levers – please refer to Figure 26 overlay for a list of the most common ones – the applicability and relevance of which should be assessed against the local contexts.
In order to select the most appropriate set of levers, there needs to be a shared understanding of their impact to the local contexts as well as their contribution to the defined objectives, taking into account each of the geographical area and goods category. The activation of a specific lever can positively influence one objective, while negatively influencing another objective: for example due to their smaller load (for a given length) switching all deliveries to electrical trucks would imply a reduction of noise and CO2/NOX and PM emissions, but could simultaneously increase congestion level, as well as negatively impact overall logistics costs (see Figure 27).
Taking these elements into account, the key to success for the development of an appropriate urban logistics strategy lies in performing a careful cost-benefits analysis of each lever individually and in combination with other levers (allowing to assess synergies as well as conflicting impacts) and devising the right set of regulations/incentives to put in place in order to foster their deployment. Finally, once an agreement has been reached about the most appropriate urban logistic scheme, it should be first tested via pilots in restricted areas before full implementation.
Figure 27: Assessment of levers’ ability to influence urban logistic objectives
Lever Main decision maker Impact on objectives
L.A. Transport Shipper Congestion Emissions* Noise* Number of
trucks Costs* Urban area
UDC out of town - - - -- + -
Direct injection + + = = = -
UDC in town + + + - --- ---
Exclusivity area =/+ +++ ++ +++ =/+ =
Traffic lane/drop off space reservation
+/++ = = = = =
Time slots +/++ = = = = =
Greener trucks =/- +++ =/+ - -/-- =
Alternative transportation means
+/++ +++ +/++ +++ - =
Congestion charge =/+ = = ++ = =
Source: Arthur D. Little; UDC: Urban Distribution Center, LA: Local Authority, Transport: Transportation company. * Excluding congestion impact

47
5.2.4. Fourth dimension of sustainable urban mobility systems: Public Transport Financing
Just at the time when urban mobility is approaching crisis point in many cities around the world, local authority budgets are under great pressure. Securing adequate funding for public transport in such a context means thinking outside the box. Capital and operational expenditures are increasing significantly due to growing supply, rising quality expectations and the increasing cost of production factors. As fare revenues do not always evolve in line with costs, transport authorities and operators need to devise alternative funding streams.
There is, however, no silver bullet for the funding of public transport. Apart from improving the efficiency and effectiveness of operations to keep operational expenditures under control, the public transport funding equation involves:
n Maximizing fare revenues by driving demand for public transport and smart fare revenue management through product differentiation
n Exploring opportunities to derive additional revenues from value-added services
n Exploring opportunities to perceiving charges from indirect beneficiaries of public transport
n Ensuring the right prioritization of public funding for capital investments while exploring opportunities of partnership development with private investors.
Six key imperatives need to be considered and combined to achieve a resilient funding mix for public transport (see Figure 28):
Imperative 20: Drive demand for public transport to maximize fare revenue by focusing on a gradual improvement in service offering quality and ensure transparency of fare adjustments
There is conclusive evidence that service improvements, rather than fare reductions, are most effective in increasing public transport patronage and revenue as this is win-win situation for everyone: the customers, the authorities, and the operators.
Good fare regulation and adjustment help generate the necessary margins to innovate and to invest in order to meet the needs of the future, notably by providing high quality services and achieving productivity improvements. Transparency and dependability of income are also key conditions to a successful engagement with potential investors.
All stakeholders involved in the funding mix should be consulted in the fare decision-making process so as to match the vision of mobility with its actual implementation. Fare reviews should be regular – ideally annual – and very progressive. In case of brutal
Figure 28: The public transport funding equation
Transparent fare regulation
Smart fare revenue management
Public funding with sound business cases
Revenue diversification via additional services
Earmarking from beneficiaries
Stimulation of clever private funding
…while improving effectiveness & efficiency of operations
1
2
3
4
5
6
7
Funding
Fare revenue
Additional revenue
Public funding
Earmarked charges
Private funding
Investments
Expenditure
Operations 7
6
5
4
3
1 2
Source: Arthur D. Little & UITP FUM 2.0
The public transport funding equation

48
and steep fare increases, the elasticity of demand is likely to be much higher and the drop in ridership could be significant.
The successful use of a fare adjustment formula in public transport lies in striking a balance between transparency (keeping it simple) and flexibility (in case of changing circumstances).
Imperative 21: Further individualize mobility offering by providing bundles of services targeting different customer groups at different prices
Smart price discrimination and product differentiation have the potential to reduce public transport operating costs and to increase fare revenues. Technological innovation facilitates the design of more sophisticated fare structures and the provision of the right service to the right customer at the right price.
Innovative revenue management practices may involve:
n Time of day-pricing, including peak pricing
n Distance-based pricing
n Level of service-based pricing (e.g. premium services)
n Usage-based pricing and loyalty schemes (based on “miles” earned).
In practice however, public transport operators currently tend to provide a single type of service at a flat fare. In spite of the widespread use of electronic fare collection, the potential of revenue management is largely underexploited. The establishment of detailed databases on customer demand is an essential step in implementing efficient revenue management schemes, and a number of public transport networks, notably in Asia, have shown the way forward.
Imperative 22: Assess opportunities to exploit public transport assets to derive additional revenues through aggregation of third-party services
Public transport operators could increase their margins significantly by capitalizing on their assets and know-how.
Operators’ assets include their infrastructure and property, advertising space, information and telecommunication systems as well as their company’s brand. Public transport know-how, meanwhile, ranges from technical expertise to planning and project management.
In the extended mobility ecosystem of tomorrow, public transport operators can extract significant value by further developing their commercial offering through the introduction of complementary value-added services within subway and railways stations (see Imperative 11) or by acting as integrated mobility platform operators, aggregating and offering services to the customer that are provided by third party providers, thereby strengthening the profile of public transport as the backbone of urban mobility while simultaneously generating additional revenue (see Imperative 13).
Every opportunity to derive additional revenues should be diligently assessed and exploited as soon as it is suitably incorporated into the company’s strategy. Some operators even sell station or line-naming rights. In the context of the development of electric vehicles, metro and tramway operators may also provide facilities for the re-charging of electric vehicles.
Imperative 23: Prioritize public funding for capital investments into projects with sound business cases demonstrating policy benefits and long-term viability
The appraisal of public transport schemes is critical as it is central to comparing their worth against possible alternative solutions and against local, regional and national policy goals. The insights gained via the appraisal process also helps to develop and prioritize transport strategies and policy packages.
The ongoing scrutiny of such appraisals serves to monitor the outcomes of individual schemes and broader transport strategy implementation and increases public acceptance by making the decision-making process transparent.
The problem with current appraisal methodologies is that they often don’t do justice to the full benefits that public transport schemes can provide to the wider public. Recent research has therefore sought to broaden the scope of impacts that can be quantified in transport appraisals to include wider economic, environmental and social issues. Some notable examples include:
n Improving personal security
n Improving economic productivity
n A high quality urban realm
n Regeneration, social inclusion and additional economic vitality
n Supporting population growth
n Contributing to a healthier society
n A more reliable transport system.

49
Imperative 24: Explore opportunities to perceiving charges from indirect beneficiaries of public transport
Passengers are not the only beneficiaries of public transport systems. Car users, employers, retailers and real-estate owners often benefit too. By levying a charge on indirect beneficiaries of public transport, city authorities can create another funding stream for their increasingly stretched urban mobility budgets.
A number of different categories of indirect beneficiaries may be identified, and different schemes implemented to raise cash in each case.
As the number of travelers using public transport increases, traffic conditions on the road improve and it becomes easier to find parking spaces. Car users thus benefit indirectly from public transport and they could be required to contribute to funding its provision and improvement. Contributions could take the form of fuel taxes, urban tolls or parking fees, to be allocated directly to the public transport budget.
Improved access to workplaces and businesses thanks to public transport, represents a benefit for employers in terms of increased efficiency and attractiveness. Against this background, employers and businesses could contribute to the cost of providing public transport (e.g. versement transport in France”, a business rate supplement in London, and a workplace parking levy in Nottingham).
The development of public transport also benefits property owners and developers as the value of their property may increase thanks the better connectivity created by public transport. Different mechanisms may be implemented to capture part of this increment and reallocate it to the funding of public transport.
Imperative 25: Further stimulate partnerships with private investors while focusing on preserving business model solidity over short-term funding opportunities
Engaging with private investors may provide benefits to public transport that go far beyond new capital for investment and growth. While the need to reduce costs and maximize revenue has been at the top of the agenda of most public transport projects for many years, such good practice can be reinforced by regular interaction with private sector partners.
Their managerial and value-creation approach and strong focus on operational efficiency offer an opportunity to create value through improved management practices. The sophistication of their risk analysis and their service contract management skills tend to be second to none too.
That said, engaging with private investors requires the proper identification, allocation and management of risks between public transport undertakings, private investors and suppliers. With political interference among the main deterrents to private investors, it is vital to strike the right balance between public interest and management autonomy.

50

51
As we have seen, there is no single miracle cure when it comes to addressing the problem of creating a sustainable urban mobility system. Each city should reflect on the 25 imperatives outlined above and identify on this basis the most appropriate actions to be taken in their local context. However, a number of cities have introduced some interesting practices that may well be a source of inspiration for others.
In the following pages, we showcase a (non-exhaustive) selection of these practices via eight case studies. In arriving at the selection of cities below, we have looked to include, as illustrated in Figure 29:
n Case studies of cities that are situated in each of the three urban mobility city clusters that we identified: “Rethink the System”, “Network the System” and “Establish Sustainable Core”.
n Illustrations of good practice in each of the four dimensions to be addressed by cities when developing sustainable mobility strategies: “Visionary Strategy and Ecosystem”, “Mobility Supply (solutions and lifestyles)”, “Mobility Demand Management” and “Public Transport Financing”.
6. Case studies of cities demonstrating good practices
Figure 29: Overview of case studies
Lagos (Nigeria)
Lima (Peru)
Tehran (Iran)
Istanbul (Turkey)
Stuttgart (Germany)
London (UK)
Stockholm (Sweden)
Hong Kong
"Develop Sustainable Core"
"Rethink the System"
"Network the System"
Visionary Strategy and Eco-system
Supply management (solutions & lifestyles)
Mobility Demand
Management
Public Transport Financing
1
2
3
4
5
6
7
8
Source : Arthur D. Little & UITP FUM 2.0
Case studies
8
8
8
7
7
7 6
6
6
5
5 4
4 3
3
3
3
2 1
1
1
6
2
2
5

52
Case Study 1: LagosRank 72 of 84 worldwide
Rank 3 of 5 in Africa
Background
Lagos, Nigeria’s commercial Capital, is the most populous city in Sub-Saharan Africa with a population of around 17 million, which is expected to reach 25 million by 2025.
Transport is chaotic and features an inadequate and highly congested road network, old and polluting vehicle fleets, a high rate of accidents etc. “Public transport” is delivered informally by unregistered private cars, two-wheeler taxis and danfo vans, the latter of which are organized by two influential transport unions. Users are faced with overcrowding, high fares, poor quality, breakdowns, long journey times and often violence.
Performance on Urban Mobility Index
Lagos is the only case-study city from the “Establish Sustainable Core” cluster. Its mobility system is characterized by the third longest travel time to work (52 minutes; after Dhaka and Addis Ababa), a marginal, but increasing, share of formal PT (3%), low financial attractiveness of PT in contrast to individual mobility (compared to other emerging economy cities), poor air quality,
but high agglomeration density and only 33 officially registered vehicles per 1,000 citizens. Innovative mobility services as well as cycling infrastructure are absent. An electronic ticketing initiative is in its infancy and smart card penetration is thus marginal.
Governance, vision and master plan
Against a background of improving political stability and with the support of the World Bank, the Lagos Metropolitan Area Transport Authority (LAMATA) was established in 2003 and tasked with transforming and regulating the sector. It developed a Strategic Transport Master Plan (STMP) for 2020/2030 with the aim of creating a modern multi-modal, integrated, safe, quality transport system. Key tenets of the STMP are: integration, quality and affordable fares. The investment program includes Bus Rapid Transport projects, rail and water transport and strategic roads.
Lagos: Rank 72 out of 84 worldwide; Rank 3 of 5 in Africa
Figure 30: Lagos
Mat
uri
ty
Fin. attract. of PT (cost of 5 km PT/cost of 5 km car) 6.7 0.2
Share of PT in modal split [%] 1% 64%
Share of zero-emission modes in modal split [%] 5% 75%
Roads density (deviation from optimum) [km/km2] 12.6 0.1
Cycle path network density [km/ths km2] 0 4,678
Urban agglomeration density [ths citizens/km2] 0.7 17.8
Smart card penetration [cards/capita] 0 3.1
Bike sharing performance [bikes/million citizens] 0 2,384
Car sharing performance [cars/million citizens] 0 1,312
Density of vehicles registered [vehicles/capita ] 0.69 0.03
Frequency of the busiest PT line [times/day] 32 515
Initiatives of public sector (0 to 10 scale) 3 10
Perf
orm
ance
Transport related CO2 emissions [kg/capita] 7,390 55
Annual average NO2 concentration [mcg/m3] 86 12
Annual average PM10 concentration [mcg/m3] 200 11
Traffic related fatalities per 1 million citizens 193 4
Dynamics of share PT in modal split [%] -53% +186%
Dynamics zero-emission modes in modal split [%] -61% +148%
Mean travel time to work [minutes] 62.1 18.4
Worst value of 84
Best value of 84
Below average area Above average area Source: Arthur D. Little FUM 2.0

53
BRT
The first project to get under way was the BRT on the main radial route linking a northern district with the traditional central business district to the south of Lagos Island. Implementation was to be undertaken within a narrow time frame to demonstrate immediate improvement to travelers. BRT was to feature noticeable innovation for users: large-sized, comfortable buses with reliable journey times, bus shelters, fixed routes and fares.
The most critical risks did not lie on the engineering front, but in politics and society. Nigeria is characterized by the high possibility of political change, resistance of existing operators and skepticism of citizens due to a history of poor delivery of transport improvement.
Therefore, LAMATA engaged in stakeholder consultation to generate ownership:
n BRT was developed in partnership (PPP) with existing operator unions. They were invited to form co-operative companies able to maintain and operate BRT in line with LAMATA service specifications. This amounted to no less than a revolution in standards that involved rigorous vehicle maintenance, extensive driver training, station management, etc.
n Citizens were invited to enter into a dialogue with LAMATA. Through newspapers, radio, TV, and road shows, some six million people in the catchment corridor were informed of how the scheme would solve their transport problems.
As a result, BRT became a people’s project, forcing wide political support. Construction was undertaken in a context of anticipated change for the better and the BRT became operational in just 15 months.
With 200,000 daily users, BRT was an immediate success. Travel time on the 22 km corridor was reduced from between 90 and 120 minutes to 50. Travel became more affordable and consistent compared to earlier “arbitrary” fares. In order to continue to foster support and improve services, a BRT Parliament was introduced as well as customer relationship management.
Next steps
This BRT line is still far from solving Lagos’s mobility problems but it did demonstrate LAMATA’s ability to deliver projects. The next steps are:
n Ongoing (electronic) ticketing integration and distance-based fares
n Two further Bus Rapid Transit routes – which are already under construction
n Rail scheme: Lagos State Government is building the 27 km Blue metro line. A private consortium will provide rolling stock, signaling, and power supply, fare collection and information systems, recouping its 400 m USD investment from passenger fares through a 25-year BOT concession. The line is scheduled to open for commercial service in the coming months and is expected to attract 300,000 passengers a day. LAMATA is committed to deliver tracks and provide bus interchange facilities at key stations.

54
Case Study 2: LimaRank 44 of 84 worldwide
Rank 6 of 9 in Latin America
Background and urban mobility related challenges
Lima is the capital of Peru. Situated along the Pacific Ocean, the Lima metropolitan area is a sprawling conurbation with a population of about 8.4 million inhabitants. It is the fifth largest city in Latin America.
The 1990s were marked by the deregulation of urban transport and the liquidation of the national urban transport company. This has led to the development of a dynamic, but largely fragmented and chaotic, public transport landscape.
About 30,000 buses and minibuses operate on more than 600 routes throughout the city. They compete with each other and with about 200,000 to 300,000 taxis. Buses and minibuses are privately owned by hundreds of small operators, and only one third of the taxis are licensed. The system is marked by poor environmental and safety performance as well as a lack of integration. Commuters spend on average two to three hours a day in transportation.
Significant efforts were made in Lima in recent years, through the development of a BRT system, called El Metropolitano, and the opening of the first metro line, called Tren Electrico. These developments were accompanied by a review of public transport regulation, but further priority areas for wider reform of the organization of urban mobility have been identified.
Performance on Urban Mobility Index
Like Rio, Lima was not part of the 2011 Urban Mobility Index, but was added to the 2013 version as a C40 member. The city scores well with regards to the financial attractiveness of public transport and its share of the modal split, the climate impact of transport, agglomeration density, and the density of vehicles registered (only 139 vehicles per 1,000 citizens). Improvement potential lies in the areas of safety, frequency of public transport/metro services, air quality, cycling infrastructure and innovative mobility services.
Lima: Rank 44 out of 84 worldwide; Rank 6 of 9 in Latin America
Figure 31: Lima
Mat
uri
ty
Fin. attract. of PT (cost of 5 km PT/cost of 5 km car) 6.7 0.2
Share of PT in modal split [%] 1% 64%
Share of zero-emission modes in modal split [%] 5% 75%
Roads density (deviation from optimum) [km/km2] 12.6 0.1
Cycle path network density [km/ths km2] 0 4,678
Urban agglomeration density [ths citizens/km2] 0.7 17.8
Smart card penetration [cards/capita] 0 3.1
Bike sharing performance [bikes/million citizens] 0 2,384
Car sharing performance [cars/million citizens] 0 1,312
Density of vehicles registered [vehicles/capita ] 0.69 0.03
Frequency of the busiest PT line [times/day] 32 515
Initiatives of public sector (0 to 10 scale) 3 10
Perf
orm
ance
Transport related CO2 emissions [kg/capita] 7,390 55
Annual average NO2 concentration [mcg/m3] 86 12
Annual average PM10 concentration [mcg/m3] 200 11
Traffic related fatalities per 1 million citizens 193 4
Dynamics of share PT in modal split [%] -53% +186%
Dynamics zero-emission modes in modal split [%] -61% +148%
Mean travel time to work [minutes] 62.1 18.4
Worst value of 84
Best value of 84
Below average area Above average area Source: Arthur D. Little FUM 2.0

55
Upgrade of the public transport system
Lima’s BRT system was inaugurated in 2010 after four years of construction. Articulated buses circulate on special bus lanes that are segregated from the rest of the traffic.
The line is 26 km long and links the principal points of Lima Metropolitan area, from the north of the city to Chorrillos in the south. The headway varies between five and 10 minutes. The system carries about 350,000 persons per day.
The line is equipped with modern platform style bus stops, where travel cards may be purchased and recharged.
Lima’s first metro line opened in 2012, after several decades of construction. The 22 km long route runs above ground (mostly elevated, partly at grade) and counts 16 stations. It links Villa El Salvador to downtown Lima and the headway is around 15 minutes. There are plans to expand the metro into a five line network.
The development of the BRT system, regulatory measures (see below), and some other projects, including notably sidewalks and bikeways, were supported by a loan of the World Bank. The funding of the infrastructure for the metro was partly supported through an economic stimulus package established by the national government.
Regulatory reforms: present and future
Following the launch of the BRT system in 2010 a set of new rules and regulations were implemented. Financial incentives were provided in order to take the oldest, most polluting, and least safe buses and mini-buses off the road – with an ambition to halve their number by 2021 – and to improve the efficiency of vehicles that would remain in operation.
Other measures included a ban of private buses within 400 meters of the BRT system, which met strong opposition from bus companies.
The formalization of taxi services was also part of the reform program and taxi drivers were required to register with the government within a given period of time. The purpose was to modernize and improve the quality of the fleet based on age, weight and roadworthiness criteria. Registered drivers would receive benefits from the local government, such as health care and free training. Registered taxis would be identified by a dedicated label.
However, it appears that further reform would be required to reap the full benefits of the efforts made so far. In that respect, a roadmap for “Sustainable Mobility and Transportation in Lima and Callao by 2025” was developed in August 2013 by a group of local and international universities and organizations. The document sets out a long-term vision and key policies that would significantly improve mobility conditions in Lima.
The document supports the development of a unified technical authority for urban and mobility planning in Lima and Callao, which would ensure continuity in case of changes in the political or economic landscape. Another key policy put forward is the prioritization of polycentric urban development, in order to avoid unnecessary journeys. It also calls for continuing investment in public transport as well as non-motorized mobility.

56
Case Study 3: TehranRank 81 of 84 worldwide
Rank 2 of 3 in Middle East
Background
Tehran has a population of about 8 million and the greater metropolitan region has about 14 million inhabitants. These totals are expected to soar to 9 and 19 million respectively by 2030. As most economic activities are centered in Tehran itself, the influx of commuters brings the daytime population to more than 13 million people. Over the past decade, the worsening traffic congestion and subsequent poor air quality has turned into a major challenge for authorities.
Performance on Urban Mobility Index
Tehran ranked 65th out of 66 in the 2011 version of the Urban Mobility Index. In the 2013 version the city ranks 81st of 84. Two remarkable features of the Iranian capital are the high share of PT (both formal and informal) in the modal split and smart card penetration (0.81 cards/ capita). On the down side, Tehran has the most unsafe mobility system worldwide with 307 fatalities per million citizens (versus a global average of 56 fatalities per million). The frequency of metro services in the city is low
and the air quality is poor. The density of vehicles registered is high (541 vehicles/1,000 citizens versus a global average of 380 vehicles/1,000) and innovative mobility services are not developed.
The Master Plan
A Master Plan Tehran 2025 was developed between 2003 and 2008. Its scope is ambitious, comprehensive and visionary and covers, among other issues, land-use and demand management.
The Municipality’s strategy focuses on making public transport (rail and Bus Rapid Transit) the backbone of its network, complemented by enhanced bus services and taxis as well as the promotion of cycling and walking. The objective is for public transport and paratransit to make up 75% of the modal share by 2030.
Tehran: Rank 81 out of 84 worldwide; Rank 2 of 3 in Middle East
Figure 32: Tehran
Mat
uri
ty
Fin. attract. of PT (cost of 5 km PT/cost of 5 km car) 6.7 0.2
Share of PT in modal split [%] 1% 64%
Share of zero-emission modes in modal split [%] 5% 75%
Roads density (deviation from optimum) [km/km2] 12.6 0.1
Cycle path network density [km/ths km2] 0 4,678
Urban agglomeration density [ths citizens/km2] 0.7 17.8
Smart card penetration [cards/capita] 0 3.1
Bike sharing performance [bikes/million citizens] 0 2,384
Car sharing performance [cars/million citizens] 0 1,312
Density of vehicles registered [vehicles/capita ] 0.69 0.03
Frequency of the busiest PT line [times/day] 32 515
Initiatives of public sector (0 to 10 scale) 3 10
Perf
orm
ance
Transport related CO2 emissions [kg/capita] 7,390 55
Annual average NO2 concentration [mcg/m3] 86 12
Annual average PM10 concentration [mcg/m3] 200 11
Traffic related fatalities per 1 million citizens 193 4
Dynamics of share PT in modal split [%] -53% +186%
Dynamics zero-emission modes in modal split [%] -61% +148%
Mean travel time to work [minutes] 62.1 18.4
Worst value of 84
Best value of 84
Below average area Above average area Source: Arthur D. Little FUM 2.0

57
The Master Plan highlights in particular the need to create a poly-centric city in place of the mono-centric configuration that exists at present, and to concentrate these urban developments around six transit corridors served by rail. The infrastructure needed is estimated at 430 km of railways, supported by BRT and interconnected at 80+ interchange stations, to achieve optimum connectivity.
Institutional organization and the role of private sector encouragement
Public transport is mainly organized by the Traffic and Public Transport Office, reporting directly to the Mayor. Rail is provided by TURSC, a municipality-owned company, which is funded 50-50 by the Tehran municipality and the central government. The operation of bus services and the maintenance of fleets, however, is increasingly outsourced to the private sector. Private companies are responsible for 30% of lines. These companies provided new, cleaner fleets (CNG) as part of their contract to operate. In 2010 an integrated electronic fare collection system was introduced on metro and bus services. As a result, journeys in private buses have increased by 40% in just a few years.
Developing Tehran’s rail system
The metro opened in 1999 and has enjoyed considerable success. Today there are 150 km of metro lines serving 88 stations and the system carries nearly 3 million passengers daily (i.e. 16% of the total number of trips). Despite this success, the metro system is not operating at full capacity due to a lack of trains, and this has led to severe overcrowding and uncomfortable conditions. 85 km of new lines are under construction, but due to economic sanctions and Iran’s international isolation, the planned development pace could not be achieved.
The Bus Rapid Transit system
By the end of the 90s, the city bus service had deteriorated. Buses struggled in dense mixed traffic and the bus service was viewed to be of poor quality. The first BRT line was introduced in 2007 and, in the first year of operation, the number of passengers grew from 214,000 to 380,000 daily. At present, eight lines (121 km) of BRT are in operation – carrying two
million passengers daily – and a further two will start service by next year. BRT lines with only 4% of the total route transport account for 45% of the total bus passengers.
Promotion of cycling
The promotion of cycling for short-distance trips has been a major focus in the last four years. More than 200 km of dedicated lanes have already been built and the ambitious objective for cycling is to achieve a 5% modal share by 2030.
Transport Demand Measures
Fuel price policy: In Iran, fuel has traditionally been highly subsidized. Since 2007, gradual (unpopular) measures were introduced to curb the use of diesel and gasoline and to reduce the subsidies paid on these fuels.
Congestion charging scheme: A restricted traffic zone (19 km2, later extended to 31 km²) has been put in place in the central business district since 1981. An even/odd number plate enforcement system is in place in a slightly larger zone, and trucks are restricted across an even larger area. As manual enforcement was inefficient and frequently breached, a full automatic Congestion Charging System was recently implemented using Automatic Number Plate Recognition (ANPR) with mobile phone payment. As a result, unauthorized entries could be reduced by 90%.
Car-free and pedestrian zones: One of the major projects in promoting pedestrian zones was implemented in the ‘Bazaar’ area. Since 2008, it has resulted in a drastic reduction of air pollution and traffic congestion in the area, which is well served by the metro.
Conclusions
Tehran has developed a comprehensive and ambitious plan. Success is already noticeable, but severe economic restrictions are slowing down the process.

58
Case Study 4: IstanbulRank 27 of 84 worldwide
Rank 3 of 7 in (South-)Eastern Europe
Background
Istanbul is not only the largest city in Turkey; it is its economic, cultural, and historical heart. With a population of 13.8 million, Istanbul is also one of the largest urban agglomerations in Europe and has the unique distinction of spanning two continents, with two thirds of the population living on the European side of the Bosphorus Strait and the remainder inhabiting the Asian side. Urban transportation is one of the key problems faced by the city today and this challenge is growing as its population increases and becomes more prosperous, leading to an even higher ownership rate of private cars. In the last four years alone, Istanbul’s population has increased by 9%. As a result, urban transportation is a hot topic on the agenda of decision-makers and several projects have been initiated to expand the public transport system.
Performance on Urban Mobility Index
The city’s mobility system is affordable and has a well-balanced modal split with 37% of trips being made with PT and 49%
with zero-emission modes. There are only 224 vehicles per 1,000 citizens in Istanbul, which results in only 772 kg CO2/capita (compared to a global average of 1,506 kg/capita), and a very good traffic-safety record (20 fatalities per million citizens in Istanbul versus a global average of 56 fatalities per million). Factors, that are holding back the city’s mobility system include an under-developed bike lanes network (only 27 km/ths km2), marginal car and bike sharing systems (7 shared cars and 9 shared bikes per million citizens – still a progress compared to 2011 Urban Mobility Index, where both car and bike sharing systems were absent), as well as air quality.
Rail Vision 2023
Istanbul Metropolitan Municipality has recently unveiled its future vision for railway transport. The ultimate aim of this plan is to create a metro network with a length of 641 km by the year 2023 (the centennial of the Republic of Turkey). The scale of Istanbul’s ambition is such that it could exemplify UITP’s vision for doubling the market share of public transport worldwide.
Istanbul: Rank 27 out of 84 worldwide; Rank 3 of 7 in (South-)Eastern Europe
Figure 33: Istanbul
Mat
uri
ty
Fin. attract. of PT (cost of 5 km PT/cost of 5 km car) 6.7 0.2
Share of PT in modal split [%] 1% 64%
Share of zero-emission modes in modal split [%] 5% 75%
Roads density (deviation from optimum) [km/km2] 12.6 0.1
Cycle path network density [km/ths km2] 0 4,678
Urban agglomeration density [ths citizens/km2] 0.7 17.8
Smart card penetration [cards/capita] 0 3.1
Bike sharing performance [bikes/million citizens] 0 2,384
Car sharing performance [cars/million citizens] 0 1,312
Density of vehicles registered [vehicles/capita ] 0.69 0.03
Frequency of the busiest PT line [times/day] 32 515
Initiatives of public sector (0 to 10 scale) 3 10
Perf
orm
ance
Transport related CO2 emissions [kg/capita] 7,390 55
Annual average NO2 concentration [mcg/m3] 86 12
Annual average PM10 concentration [mcg/m3] 200 11
Traffic related fatalities per 1 million citizens 193 4
Dynamics of share PT in modal split [%] -53% +186%
Dynamics zero-emission modes in modal split [%] -61% +148%
Mean travel time to work [minutes] 62.1 18.4
Worst value of 84
Best value of 84
Below average area Above average area Source: Arthur D. Little FUM 2.0

59
As recently as 2004, the city had an urban rail network length of just 45 km. By 2013, this had grown to 141 km. This development featured what must count as one of the most important urban transport investments anywhere in the world, the Marmaray tube tunnel under the Bosphorus, which connected Europe and Asia by rail for the first time. It began carrying paying passengers in October 2013.
The city of Istanbul is committed to meeting the ever-increasing demand for mobility as well as the needs of a rapidly growing population by creating a metro network that will constitute the backbone of the transport network. As things stand, urban mobility in Istanbul is dominated by road transport. In 2012, it accounted for 83% of journeys, while rail’s share was only 13%. The projects under way as part of Istanbul’s future vision will, without doubt, constitute a ‘game changer’, increasing the modal share of railway transport to 31% and decreasing that of road transport to 66% in the year 2014. With the projects currently under construction and in the design phase, as well as the increasing network effect and enhanced connectivity, the ultimate vision for 2023 is to have a metro network responsible for 72.5% of all trips, leaving the road transport network with a modal share of 26.5%.
Bus Rapid Transit and bus transformation
In response to the rapid population increase, the city of Istanbul has also developed mass transit solutions to satisfy heavy passenger demand in the short term. The 52 km Bus Rapid Transit System (locally known as Metrobus) carries more than 700,000 passengers a day. BRT was implemented on the city’s main highway, where two lanes were taken away from private cars and dedicated to public transport. With 1x1 lanes, the BRT system offers a capacity more than 30,000 pphpd1 during peak hours when it operates double articulated high-capacity buses with headways of 20 seconds.
1 Passengers per hour per direction
Another important characteristic of Istanbul’s BRT system is its speed of construction. The 18.2 km-long first phase was completed in just seven months in 2007, setting a new record for a project of this sort.
The city is also working to enhance bus transportation, which mainly aims to increase the commercial speed of the buses and their service quality. Dedicated bus-lanes have been introduced and the bus fleet has been renewed over the last one and a half years with the introduction of 1,700 new buses.
Other developments
An increase in public transport supply is not the only solution for the city of Istanbul, however. Other significant initiatives include:
n Collaboration between local and central government was deepened to upgrade the existing suburban railways and construction of the metro network.
n Management of car parks has been formalized. A municipal company named ÍSPARK was established and took over the management of most car parks operated by informal operators.
n Introduction of a smartcard system with fare integration. Istanbul is also working on the introduction of a distance-based and zone-based fare system. Smart Bus Stops, with dynamic passenger information system, also came into service.
Service Quality Improvement is a topical issue on the agenda, with the introduction of EN 13816 European Service Quality Standard and EFQM.

60
Case Study 5: StuttgartRank 12 of 84 worldwide
Rank 10 of 19 in Western Europe
Background and urban mobility-related challenges
Stuttgart is the capital of the state of Baden-Wuerttemberg, which is located in the south-west of Germany. The city itself is home to more than 600,000 inhabitants but about 2.1 million more people live in the surrounding region. Stuttgart is also one of the most attractive and innovative economic locations in Western Europe and the home base of global groups such as Daimler, Porsche and Bosch.
In the face of growing urbanization and the need to improve sustainability, Stuttgart faces increasing challenges. It needs to raise the average travel speed and decrease pollution levels. At the same time, technological innovations such as e-mobility and increasing changes in the behavior of customers offer new possibilities to address these challenges. The combination of different means of transport and innovative technological solutions opens up new approaches to build a sustainable city with an equally ecologically sound urban mobility system.
Performance on Urban Mobility Index
In the last two years Stuttgart has improved its urban mobility performance, according to the Arthur D. Little Urban Mobility Index. Stuttgart is showing particularly impressive results in the area of car sharing: from 419 shared cars per million citizens in 2011 to 1,312 cars per million citizens in 2013, a rate that makes Stuttgart the leading car sharing city in the world. As of 2013, three car sharing providers were operating in the city: car2go (400 eCars), Stadtmobil (320 cars), and Flinkster (76 cars).
Urban mobility strategy and master plan
This success is a result of an implementation of Stuttgart’s “Transport Development Plan 2030”, which was adopted in October 2010. As an addendum to this document the City Administration also issued an action plan “Sustainable Mobility in Stuttgart” in June 2013. Both documents focus on:
1. Environmental issues: congestion relief, reduction of noise, particulate matter, nitrogen oxides and GHG emissions
Stuttgart: Rank 12 out of 84 worldwide; Rank 10 of 19 in Western Europe
Figure 34: Stuttgart
Mat
uri
ty
Fin. attract. of PT (cost of 5 km PT/cost of 5 km car) 6.7 0.2
Share of PT in modal split [%] 1% 64%
Share of zero-emission modes in modal split [%] 5% 75%
Roads density (deviation from optimum) [km/km2] 12,6 0.1
Cycle path network density [km/ths km2] 0 4,678
Urban agglomeration density [ths citizens/km2] 0.7 17.8
Smart card penetration [cards/capita] 0 3.1
Bike sharing performance [bikes/million citizens] 0 2,384
Car sharing performance [cars/million citizens] 0 1,312
Density of vehicles registered [vehicles/capita ] 0.69 0.03
Frequency of the busiest PT line [times/day] 32 515
Initiatives of public sector (0 to 10 scale) 3 10
Perf
orm
ance
Transport related CO2 emissions [kg/capita] 7,390 55
Annual average NO2 concentration [mcg/m3] 86 12
Annual average PM10 concentration [mcg/m3] 200 11
Traffic related fatalities per 1 million citizens 193 4
Dynamics of share PT in modal split [%] -53% +186%
Dynamics zero-emission modes in modal split [%] -61% +148%
Mean travel time to work [minutes] 62.1 18.4
Worst value of 84
Best value of 84
Below average area Above average area Source: Arthur D. Little FUM 2.0
61
2. Promotion of vehicles with alternative engines, especially electromobility
3. Promotion of sustainable modes of transport: public transport, walking, cycling
4. Implementation of innovative mobility solutions: car sharing, bike sharing, ride sharing
5. Integrated mobility offerings
6. City logistics, etc.
Stuttgart’s mobility strategy is integrated with the city’s Land Use plan, Clean Air plan, Noise Reduction plan, Local Transport plan, Climate Protection Concept and general Urban Development plan.
“Stuttgart Services” and intermodal mobility offerings
In April 2012, the state of Baden-Wuerttemberg and its capital were selected by the German government to be one of four “Showcases for Electromobility”. About 40 projects worth a total of over 110 million euros were initiated in order to make the vision of electromobility into a reality. The goal is to have over 2,000 EVs and 1,000 charging points in the region by 2015. One of these projects – Stuttgart Services – aims at the integration of electric vehicles with other sustainable modes of transport and the promotion of intermodal mobility. The backbone of integrated mobility offerings in the city is public transport.
Two main outcomes of the Stuttgart Services project are:
1. Mobility card “Stuttgart Services”
2. Integrated mobility platform and app
The integrated mobility card gives the customer the ability to use different services and means of transport in a fuss-free way. It removes the need to carry different cards for different services, a clear value proposition for customers.
The second main component, the mobility platform, provides real-time intermodal information, serves as an information/planning tool and as a booking and reservation system. To the same extent as with the card, a unique customer benefit is created through integration.
By creating intermodal mobility solutions, an ambitious vision is becoming a reality in Stuttgart. The attractiveness of eco-friendly mobility services has been increased. Public transport, car sharing and bike sharing are being pushed and a sustainable, integrated mobility eco-system is being built. This serves to increase the quality of life of the citizens and promotes the attractiveness of the entire region.

62
Case Study 6: LondonRank 9 of 84 worldwide
Rank 7 of 19 in Western Europe
Background
London is one of the largest cities in the European Union with more than 8.4 million inhabitants. It also has the oldest metro in the world and one of the most extended. The number of inhabitants is increasing each year putting a significant strain on the city’s transport network, which until recently has suffered from years of under investment. Over the next 20 years, the city’s population is expected to increase by almost one million people and employment by more than 600,000, both factors which will increase demand for transport. The main challenges facing the city are to meet this rising demand while maintaining investment in the existing transport network.
Performance on Urban Mobility Index
London’s mobility system is in the above average performing group in both versions of the Urban Mobility Index (2011 and 2013). Since 2011 the number of shared cars slightly increased (from 232 to 253 per million citizens), and the number of shared bikes increased from 695 to 1,012 per million. Transport-
related fatalities decreased from 39 to 27 per million citizens. Other indicators changed insignificantly. The main strengths of London’s mobility system are its Oyster card (on a par with Hong Kong’s Octopus card sharing the highest penetration rate worldwide), a growing share of public transport in the modal split (34% in the last measurement compared to 31% in the last but one measurement), and the frequency of its public transport services. At the same time, the city has significant improvement potential with regard to cycle lane network density (only 254 km/ths km2 in London versus an average of 2,121 km/ths km2 in Western Europe) and travel times to work (44 minutes in London versus an average of 31 minutes in Western Europe).
Enhancing the network
Journeys on public transport are constantly increasing, reflecting population and job growth. To improve the reliability and efficiency of London’s transport system, continued investment in the network is vital. The London 2012 Olympic and Paralympic
London: Rank 9 out of 84 worldwide; Rank 7 of 19 in Western Europe
Figure 35: London
Mat
uri
ty
Fin. attract. of PT (cost of 5 km PT/cost of 5 km car) 6.7 0.2
Share of PT in modal split [%] 1% 64%
Share of zero-emission modes in modal split [%] 5% 75%
Roads density (deviation from optimum) [km/km2] 12.6 0.1
Cycle path network density [km/ths km2] 0 4,678
Urban agglomeration density [ths citizens/km2] 0.7 17.8
Smart card penetration [cards/capita] 0 3.1
Bike sharing performance [bikes/million citizens] 0 2,384
Car sharing performance [cars/million citizens] 0 1,312
Density of vehicles registered [vehicles/capita ] 0.69 0.03
Frequency of the busiest PT line [times/day] 32 515
Initiatives of public sector (0 to 10 scale) 3 10
Perf
orm
ance
Transport related CO2 emissions [kg/capita] 7,390 55
Annual average NO2 concentration [mcg/m3] 86 12
Annual average PM10 concentration [mcg/m3] 200 11
Traffic related fatalities per 1 million citizens 193 4
Dynamics of share PT in modal split [%] -53% +186%
Dynamics zero-emission modes in modal split [%] -61% +148%
Mean travel time to work [minutes] 62.1 18.4
Worst value of 84
Best value of 84
Below average area Above average area Source: Arthur D. Little FUM 2.0

63
Games were a catalyst for major capital investment including a new suburban railway, London Overground, new signaling on the Jubilee line and extensions to the Docklands Light Railway. One of the biggest challenges was to increase frequency and network capacity to accommodate the Games. This was achieved and led to a long-term legacy benefit for Londoners. Moreover, a strong emphasis on Travel Demand Management not only led to a smoothing of the peaks on mainstream public transport and less congestion at busy transport hubs, it also led to increased walking and cycling.
Olympic and Paralympic Games legacy include:
n Improved reliability
n Raised capacity
n Long term vision for London’s road network
n Improvement walking and cycling
n Better travel demand management and signage
Transport for London has also been pioneering contactless payment card technology for ticketing alongside an ambitious digital strategy which has embraced the principle of open data. The aim is to make public transport as simple and as easy to use as possible.
Funding public transport
The Central London Congestion Charge introduced in 2003 to reduce congestion in the city center continues to deliver improved traffic flows and contributes to a general improvement in mobility. The net proceeds of the scheme are being reinvested in the city’s transport system. In 2008 London also introduced a city-wide Low Emission Zone to improve air quality.
Crossrail, a new high frequency East-West railway, will be fully opened in 2019. This ambitious project (42 km of new tunneling over its 118 km length) will add 10% capacity to London’s rail network and will carry around 200 million people annually. Crossrail has been recognized by the business community as critical for London’s future. The funding model involves contributions from Transport for London (TfL), the government and private businesses, reflecting the wide economic benefits
the scheme will deliver. This innovative funding model could be an example for other cities.
Finally, TfL is a good example of a strong and integrated regional authority which controls all aspects of mobility in a city: not only mainstream modes such as metro, tram and buses but also taxi regulation and licensing, the promotion of walking and cycling and responsibility for the cities principle roads to name a few.

64
Case Study 7: StockholmRank 2 of 84 worldwide
Rank 1 of 19 in Western Europe
Background
Stockholm is built on different islands, interconnected by bridges. This geographical and urban context presents a number of challenges to the transport authorities charged with organizing access to the city center and controlling traffic. At the same time, it provides opportunities for controlling access to the central business district, as bridges are easier to police than an urban zone with multiple points of entry and exit.
The city is also well known for its green projects (energy, build ing, transport) and quality of life. When it comes to public transport, everything is done with an eye to making it clean, safe and reliable, with real-time information and fare reimbursement in the case of delays. These are some of the reasons why Stock-holm ranks second after Hong Kong in the Urban Mobility Index.
Performance on Urban Mobility Index
In the 2011 Urban Mobility Index, Stockholm ranked 4 after Hong Kong, Amsterdam and London. In the 2013 version Stockholm is a best performing European city. Stockholm’s modal split became more sustainable, with environmentally-friendly modes taking a 67% share. The number of shared cars per million citizens increased from 138 in 2011 to 400 in 2013. Transport related fatalities decreased from 21 per million in 2011 to 9 per million in 2013. It was the same story when it came to transport-related CO2 emissions: down from 1,430 kg per capita in 2011 to 1,348 kg per capita in 2013. Also remarkable is Stockholm’s cycle path network density – the third most dense in the world – with 4,041 km of lanes per 1,000 sq km, as well as the city’s high air quality.
Stockholm: Rank 2 out of 84 worldwide; Rank 1 of 19 in Western Europe
Figure 36: Stockholm
Mat
uri
ty
Fin. attract. of PT (cost of 5 km PT/cost of 5 km car) 6.7 0.2
Share of PT in modal split [%] 1% 64%
Share of zero-emission modes in modal split [%] 5% 75%
Roads density (deviation from optimum) [km/km2] 12.6 0.1
Cycle path network density [km/ths km2] 0 4,678
Urban agglomeration density [ths citizens/km2] 0.7 17.8
Smart card penetration [cards/capita] 0 3.1
Bike sharing performance [bikes/million citizens] 0 2,384
Car sharing performance [cars/million citizens] 0 1,312
Density of vehicles registered [vehicles/capita ] 0.69 0.03
Frequency of the busiest PT line [times/day] 32 515
Initiatives of public sector (0 to 10 scale) 3 10
Perf
orm
ance
Transport related CO2 emissions [kg/capita] 7,390 55
Annual average NO2 concentration [mcg/m3] 86 12
Annual average PM10 concentration [mcg/m3] 200 11
Traffic related fatalities per 1 million citizens 193 4
Dynamics of share PT in modal split [%] -53% +186%
Dynamics zero-emission modes in modal split [%] -61% +148%
Mean travel time to work [minutes] 62.1 18.4
Worst value of 84
Best value of 84
Below average area Above average area Source: Arthur D. Little FUM 2.0

65
Stockholm as a green city
In 2010, Stockholm was awarded the title of the first European Green Capital. Thanks to voluntary policies instituted since the 90s, greenhouse gas and fine particulate matter have been reduced. The city has also been reducing its fossil fuel dependency by encouraging a reduction in the use of such fuels and by replacing its private and public fleet with green vehicles. Specific objectives are detailed in the Stockholm Environment Program for 2012-2015:
n Environmental certification has been set up for municipal vehicles; in order to meet new standards on air quality an electric city car fleet is being incentivized
n For green cars, the objective has been set is to reach 85% of alternative fuel usage
n Commitment of transport authority to ensure that at least 55% of transport services are operated using green vehicles
n Improvement of cycling network
Sweden has been a pioneer in the use of green vehicles since the 80s. It has also made great efforts to purchase electric vehicles and set up infrastructure for them. In October 2010, a public-private joint procurement was launched with a view to stimulating electric vehicle demand in Sweden. The bus transport fleet in Stockholm is made up of 229 methane buses (which run on a mix of biogas and natural gas), 768 ethanol buses (ED95), and 224 RME buses. The objective is to fully phase out fossil fuel vehicles by 2050.
These objectives are ambitious and the city is already on the right track.
Demand management and the introduction of initiatives to encourage a modal shift towards PT, walking and cycling
Stockholm was one of the first cities to implement a 30 km/h speed limit in residential areas. This initiative has helped public transport by giving it a comparative advantage. Stockholm also introduced a permanent congestion charge in 2007 after a test period in 2006. This scheme, combined with other public transport-friendly measures, led to a reduction in congestion and traffic (-20%) and a modal shift towards greener modes
of transport: between 2004 and 2010, 12% of Stockholm inhabitants shifted from private motorized vehicles to public transport and cycling (9% and 3%).
In line with demand management activities, the following initiatives were implemented:
n Reorganization of the bus network with high-speed lines and feeder lines
n Real time information on traffic and bus arrival times
n Improvement of quality and capacity of all modes of transport
n Improvement of the cycle path network, introduction of a bike sharing scheme, journey planner, etc.
In Stockholm, it is the public transport authority that faces the challenge of finding appropriate measures to address demand management and plays the leading role in implementing them. The quality of the network it created and the incentives it offered citizens to shift to public transport made Stockholm a worthy runner-up to Hong Kong in the survey.

66
Case Study 8: Hong KongRank 1 of 84 worldwide
Rank 1 of 28 in Asia Pacific
Background
In terms of population density, Hong Kong is one of the most crowded cities in the world, with more than seven million people living in an area covering 1,100 km². As a result of this demo -graphy and due to geographical factors, the city is dominated by high-rise buildings in order to maximize urban capacity.
The public transport network is also one of the most efficient in the world, with public transport and walking making up 92% of the modal split. Hong Kong’s transport system is a multi-modal network based on rail transport supported by bus, minibus, tram, ferries, and taxis. The network is well integrated and the Octopus smart card allows customers to use all modes of transport and to pay for parking, shops and leisure facilities.
Performance on Urban Mobility Index
Hong Kong is the study winner of both the 2011 and 2013 Urban Mobility Index versions (i.e. when considering both 11 and 19 urban mobility indicators). The city performs top with regard
to financial attractiveness of PT, share of PT in modal split, smart card penetration, number of vehicles per capita, traffic safety, climate impact of transport and public sector initiatives. In addition to this, it has an above average performance with regard to share of zero-emission modes in modal split, road density, agglomeration density and PT frequency. Improvement potentials lie in areas of cycle path network density, car and bike sharing as well as air quality, especially with regard to NO2.
Rail as a backbone of the network and city
Given its topography and the volume of users, Hong Kong’s network needs to have high capacity and negotiate geographical barriers such as water or mountains. The response of the transport authority to these two demands was a rail-based network that accommodated both spatial and ridership issues.
The rail network has developed impressively since the 80s. The objective was to reach a symbiosis between rail public transport supply and construction. Since the construction of the
Mat
uri
ty
Fin. attract. of PT (cost of 5 km PT/cost of 5 km car) 6.7 0.2
Share of PT in modal split [%] 1% 64%
Share of zero-emission modes in modal split [%] 5% 75%
Roads density (deviation from optimum) [km/km2] 12.6 0.1
Cycle path network density [km/ths km2] 0 4,678
Urban agglomeration density [ths citizens/km2] 0.7 17.8
Smart card penetration [cards/capita] 0 3.1
Bike sharing performance [bikes/million citizens] 0 2,384
Car sharing performance [cars/million citizens] 0 1,312
Density of vehicles registered [vehicles/capita ] 0.69 0.03
Frequency of the busiest PT line [times/day] 32 515
Initiatives of public sector (0 to 10 scale) 3 10
Perf
orm
ance
Transport related CO2 emissions [kg/capita] 7,390 55
Annual average NO2 concentration [mcg/m3] 86 12
Annual average PM10 concentration [mcg/m3] 200 11
Traffic related fatalities per 1 million citizens 193 4
Dynamics of share PT in modal split [%] -53% +186%
Dynamics zero-emission modes in modal split [%] -61% +148%
Mean travel time to work [minutes] 62.1 18.4
Worst value of 84
Best value of 84
Below average area Above average area Source: Arthur D. Little FUM 2.0
Hong Kong: Rank 1 out of 84 worldwide; Rank 1 of 28 in Asia Pacific
Figure 37: Hong Kong
67
rail network and the development of the competencies of the Mass Transit Railway Corporation Limited (MTR), the company has come to rely on secondary revenue provided by station and property-related businesses.
Focus on rail and property model of financing
MTR bases its business model on real estate and density value. Before building a new line, MTR acquires land rights at a pre-railway valuation before preparing an overall scheme, including building and railway design, in cooperation with a property developer. The property developer then finances the development and MTR oversees the construction. When the property is sold, MTR takes a share of the profit and may retain estate management rights.
Today, 86,000 residential units are managed by MTR, together with 76,000 sq m of commercial and office spaces. MTR also has investment properties in 13 shopping malls.
MTR has turned Hong Kong’s high population density into an opportunity rather than a threat. Its policy of combining public transport development and urban development/renewal has led to an almost optimal situation in terms of finance, ecology and ridership. While there may be no perfect urban mobility system, Hong Kong has achieved great success in balancing the conflicting demands of urban planning, transport infrastructure and specific constraints. The result is a low rate of car ownership – 73 per 1,000 citizens – and a dominant role for public transport. This implementation is supplemented with IT facilities such as the Octopus card.
The Octopus card
The Octopus card, launched in 1997, was the second contactless smart card system to be introduced in the world. It not only allows users to travel on public transport but also to pay and register for a range of other services. The fact that card-holders can make payments for shops, fast-food outlets, parking facilities, phone use, together with using it for key card access to residential and offices buildings, and even as a library card for students, means that Octopus card penetration is extremely high. It has become part of the Hong Kong resident’s daily life
and is widely used. According to the Octopus system operator, there are around 22 million cards in circulation.
Hong Kong is a striking example of a city entering into a virtuous system (increasing density, building, and improving the network). But Hong Kong’s mobility has been shaped by one dominant operator and further improvement of the mobility system will require more cooperation with other stakeholders in the ecosystem and the introduction of innovative mobility services.

68
Notes

69

70

ContactsIf you would like more information or to arrange an informal discussion on the issues raised here and how they affect your business, please contact:
Austria Karim Taga [email protected]
Italy Saverio Caldani [email protected]
Belgium/Luxemburg Francois-Joseph Van Audenhove [email protected]
India Srini Srinivasan [email protected]
China Antoine Doyon [email protected]
Korea Kevin Lee [email protected]
Sweden/RussiaKlas Anderlind [email protected]
Czech Republic Dean Brabec [email protected]
Middle East Thomas Kuruvilla [email protected]
Switzerland Ralf Baron [email protected]
France Aurelia Bettati [email protected]
The Netherlands Martijn Eikelenboom [email protected]
UK James Catmur [email protected]
Germany Wilhelm [email protected]
Japan Akitake Fujita [email protected]
USA John Brennan [email protected]
Spain Salman Ali [email protected]
South East Asia Piyush [email protected]
François-Joseph Van AudenhovePartner, Arthur D. Little, Brussels Mobile: +32 473 998 [email protected]
Laurent DaubyDirector Rail Transport, UITPMobile: +32 476 339 [email protected]
Jérôme PourbaixHead of Policy and Outreach, UITPMobile: +32 477 580 [email protected]
Oleksii KorniichukManager, Arthur D. Little, FrankfurtMobile: +49 175 5806 [email protected]
Authors

www.adl.com/FUM2.0
Arthur D. Little
As the world’s first consultancy, Arthur D. Little has been at the forefront of innovation for more than 125 years. We are acknowledged as a thought leader in linking strategy, technology and innovation. Our consultants consistently develop enduring next generation solutions to master our clients’ business complexity and to deliver sustainable results suited to the economic reality of each of our clients. Arthur D. Little has offices in the most important business cities around the world. We are proud to serve many of the Fortune 500 companies globally, in addition to other leading firms and public sector organizations. For further information please visit www.adl.com
UITP
The International Association of Public Transport (UITP) is the international network for public transport authorities and operators, policy decision-makers, scientific institutes and the public transport supply and service industry. It is a platform for worldwide cooperation, business development and the sharing of know-how between its 3,400 members from 92 countries. UITP is the global advocate of public transport and sustainable mobility, and the promoter of innovations in the sector. www.uitp.org
Copyright © Arthur D. Little and UITP 2014. All rights reserved.