the foundation of the new sewage plant at le havre an...
TRANSCRIPT

F. Baguelin & Seng Y Ung (FONDASOL)F. Gaillard & J.P. Commun (RAZEL)
Journée franco-britannique CFMS-BGA,Paris, le 2 décembre 2011
The foundation of the new sewage plant at le Havre
An alternative solution with a preloadingembankment
Titre

L’ouvrage – vue perspective
THE PLANT
2 superimposed tanks
each : ~ square 100m x 100m
6,6m of water

Les 4 cyclors : vue en plan
The 4 units : cyclors A, B, C, D
101 m
90 m

Bond &Harris UU London clay
pl* et la solution pieux
PILES = the initial foundation concept
360 piles mesh : 5,6mx5,6mL=40m Ø=1.4m QELS = 800 t
net limit pressure pl*
0
5
10
15
20
25
30
35
40
45
-1 0 1 2 3 4 5pl* (MPa)
dept
h z
PR1
PR2
PR3
PR4
design
1. fill
2. sand
3. sand
4. clay & peat
5. sand & gravel

Bond &Harris UU London clay
pl* et la solution préchargement
The alternative solution : preloading
360 piles mesh : 5,6mx5,6mL=40m Ø=1.4m QELS = 800 t
net limit pressure pl*
0
5
10
15
20
25
30
35
40
45
-1 0 1 2 3 4 5pl* (MPa)
dept
h z
PR1
PR2
PR3
PR4
design
1. fill
2. sand
3. sand
4. clay & peat
5. sand & gravel
160 to 250 kPa

T2
Plan du remblai de préchargement
THE PRELOADING EMBANKMENT
110m
125m
T1
H fill = 8m
H fill = 12.5 m

Plan du remblai d’essai
THE TRIAL EMBANKMENT
H = 8 m

Remblai d’essai : résultats et conclusion
THE TRIAL EMBANKMENTH= 8 m
Results
� no instability during fill construction
� in 4 months
- pore pressures dissipated
- settlements stabilised and magnitude as predicted
Conclusion : preloading possible without vertical drains in all alluvial deposits

Remblai de préchargement : rés & conclusions
THE PRELOADING EMBANKMENT
Measurements
� inclinometers
� pore pressures
� multipoint tassometers
T1 & T2
� settlement profiles
Results
� no instability confirmed
� confirms quick rate of consolidation
and establishes
� time of fill removal
� degree of creep attained
� residual settlement at service
� checks settlement model
& provides settlement pattern for
structural design

T1 – résultats à diverses périodes
MULTIPOINT TASSOMETER T1
-30.00
-25.00
-20.00
-15.00
-10.00
-5.00
0.00
5.00
10.00
-10 0 10 20 30 40 50 60 tassement s (cm)
cote
NG
F (
m)
24/04/2008
21/05/2008
09/07/2008
02/09/2008

-30.00
-25.00
-20.00
-15.00
-10.00
-5.00
0.00
5.00
10.00
-10 0 10 20 30 40 50 60 tassement (cm)
cote
NG
F (
m)
16/04/2008
21/05/2008
09/07/2008
02/09/2008
T2 – résultats à diverses périodes
MULTIPOINT TASSOMETER T2

T1 & T2 – valeurs finales
MULTIPOINT TASSOMETERS T1 & T2 – Final values
-30.00
-25.00
-20.00
-15.00
-10.00
-5.00
0.00
5.00
10.00
-10 0 10 20 30 40 50 60 tassement s (cm)
cote
NG
F (
m)
T1 (02/09/2008)
T2 (02/09/2008)

-35
-30
-25
-20
-15
-10
-5
0
5
10
0 100 200 300 400 500 600 700
sigma ' v
altit
ude
sigma ' vosigma ' psigma ' v T1sigma ' v T2
Calage du POP sur T1 & T2
∆σ∆σ∆σ∆σ’p = σσσσ’p - σσσσ’v0
∆σ∆σ∆σ∆σ’p ≈ 80 kPa
CALIBRATE OVERCONSOLIDATION MARGIN ∆σ∆σ∆σ∆σ’p (POP)

Calage du POP sur T1 & T2
MULTIPOINT TASSOMETERS T1 & T2 : measured & calculated settlements
-35
-30
-25
-20
-15
-10
-5
0
5
10
0 100 200 300 400 500 600 700
sigma ' v
sigma ' vosigma ' psigma ' v T1sigma ' v T2
-30
-25
-20
-15
-10
-5
0
5
10
0 100 200 300 400 500 600 700
tassement (mm)
cote
NG
F
mesure T1mesure T2calage T1calage T2
overconsolidation margin fit for settlements

TASSUNI : une charge
SETTLEMENT MODEL : TASSUNI (FONDASOL software)
n rectangles i with load qi
m soil layers j with σ’p and :
- either : moduli (E, Er)
- or : compression indexes CC, CS
z
O
y
x
M Load qi on rectangle i
layer 1
layer j
layer m
Settlement si
σz(i,j) εz(i,j)

TASSUNI : formules de tassement avec sig’p
EEpvz
r
vpz
'''' 00 σσσσσε
−++
−=
SETTLEMENT MODEL : TASSUNI (FONDASOL software)
n rectangles i with load qi
m soil layers j with σσσσ’pand :
- or : compression indexes CC, CS
p
zvC
v
pSZ e
C
e
C
'
'log
1'
'log
10
0 σσσ
σσ
ε ++
++
=
For example : E = EM/α & Er = 3 to 10 EM/α
- either : moduli (E, Er)

TASSUNI : 13 couches de sol
TASSUNI : 13 LAYERS

TASSUNI : les 13 charges et les 62 charges
TASSUNI : 13 LOADS FOR PRELOADING

Les 62 charges de l’ELS q-permanentTASSUNI : 62 LOADS FOR PERMANENT STATE

Profilomètre 3 : prévision et mesures
PROFILOMETER 3
Comparison between measured and calculated settlements
before fill removal
0.00
0.10
0.20
0.30
0.40
0.50
0.60
0.70
-20 0 20 40 60 80 100
x(m)
s(m
)
measures 3A measures 3B calculated measure T1 calculated T1
T1
60 cm

Profilomètre 1 : prévision et mesures
OTHER PROFILOMETERS

Profilomètre 2 : prévision et mesures
OTHER PROFILOMETERS

Profilomètre 4 : prévision et mesures
OTHER PROFILOMETERS

Profilomètre 5 : prévision et mesures
OTHER PROFILOMETERS

Fluage : modèle de Bjerrum
SOIL CONSOLIDATION & CREEP
Bjerrum creep model - parameter tF for creep lines
Unloading from 1 to 2 :
m
FF tt
=
2
112 '
'
σσ
αCe
CCm SC
)1( +−=with :

Lois de consolidation et de fluage
SOIL CONSOLIDATION & CREEP

Asaoka sur T1 & T2
SOIL CONSOLIDATION : ASAOKA
T1 T2

Consolidation : courbe ajustée sur T1
SOIL CONSOLIDATION : CURVE FITTING
T1

Consolidation : courbe ajustée sur T2
T2
SOIL CONSOLIDATION : CURVE FITTING

Consolidation & fluage sur T1
SOIL CONSOLIDATION & CREEP
T1
Creep parameter
CONSOLIDATION ONLY
CONSOLIDATION + CREEPCONNECTING POINT
LAST MEASUREMENT
layers subjected to creep at 25m depth : peaty clay , cumulated thickness = 3m

Tassements à 10 ans (ch. perm.) : courbes
SETTLEMENT PREDICTED at 10 years under permanent loads
85 mm

Tassements à 10 ans (ch. perm.) : carte
SETTLEMENT PREDICTED at 10 years under permanent loads

Tassements sous charge d’eau dans CZC
SETTLEMENT PREDICTED under water load in cell CZC
6,6 mm

Tassements sous charge d’eau max
SETTLEMENT PREDICTED under maximum variable load
18 mm

Modèle de la structure
SOIL-STRUCTURE INTERACTION
Model 1 : structure (3D) + subgrade springs for soil
=> initial reinforcement in the structure
Model 2 : 2D a slice of the structure, 5.6m thick : walls or porticos + elastic layer (28m thick) for soil
=> additional reinforcement (+10%)

Modèle 1 : avec ressorts
SOIL-STRUCTURE INTERACTION Model 1 : structure on springs
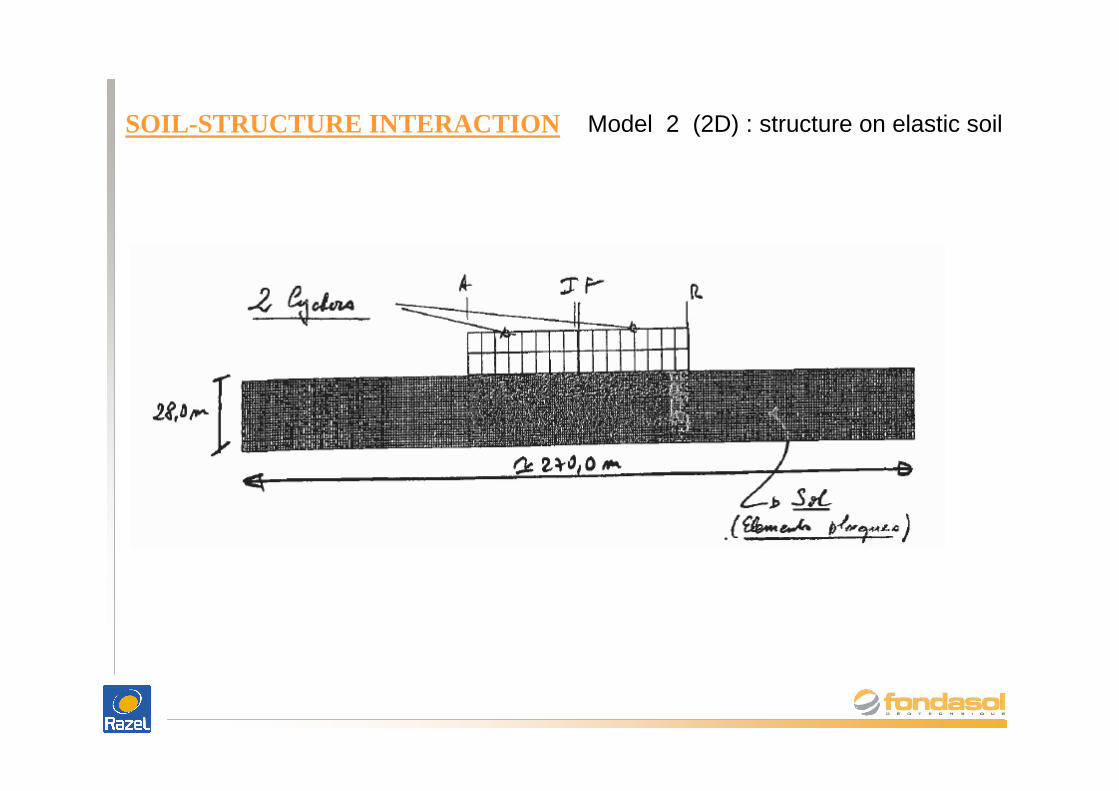
Modèle 2 : sol élastique
SOIL-STRUCTURE INTERACTION Model 2 (2D) : structure on elastic soil

Modèle 2 : Valeurs de E
SOIL-STRUCTURE INTERACTION Model 2 (2D) : E values for soil
15.3m 29.55m90 m
Gravel 199
Fill 49
272 272
Sands 1 143 174 180
Sands 2 58 65 68
Clay 1 69Clay 2 30
7532
7934
E (MPa)
Soil in natural state Soils consolidated

Modèle 2 : tassement file 17
SOIL-STRUCTURE INTERACTION Model 2 (2D)
Settlement at row 17 (columns)
Water in the 4 tanks
6,50 cm 4,11 cm

Modèle 2 : tassement file 17
SOIL-STRUCTURE INTERACTION Model 2 (2D)
Settlement at row 17 (columns)
Water in 2 tanks on left, 1 on right
5,65 cm 2,60 cm

Modèle 2 : tassement files 1 & 20
SOIL-STRUCTURE INTERACTION Model 2 (2D)
Settlement at rows 1 & 20 (walls)
Water in the 4 tanks
2,50 cm 1,76 cm

Tassements mesurés en service (1 an) : carte
SETTLEMENTS MEASURED IN SERVICE
-16
CELL CZA
(mm)
Settlements under water levelfluctuation of 1,1m in one tank

Avantages inconvénients
THE OPINION OF THE CONSTRUCTION WORKS DIRECTOROn the preloading solution
PROS
Lower cost
Simple technique (standard earthworks)
hence : allows to prepare easily thestructure works
CONS
Fill material management atacceptable cost (supply, disposal)
Impact of road transportation (400 trucks / day in the city)
Lack of schedule visibility
Difficulty to obtain approval by thesupervisor on the method and on the time for fill removal

FIN FONDASOL
Fin - FONDASOL
THANK YOU FOR YOUR ATTENTION !