the fco cockpit global bubble status report october 2021
TRANSCRIPT
The FCO Cockpit Global Bubble Status ReportOctober 2021
The FCO Cockpit - Global Bubble Status Report
Contents
1. Introduction2. Results per Asset Class3. Appendix4. Contact
1

The FCO Cockpit - Global Bubble Status Report
Purpose and Benefits
4 The Financial Crisis Observatory (FCO) monthly report discusses the historical evolution of bubbles in and between different asset classes and geographies. The purpose of the FCO report is to ascertain which asset classes and sectors are crowded and to what degree they develop contagion risks.
4 Today, the report is used by 600+ institutions world-wide, including universities, think tanks, sovereign wealth funds, hedge funds, family offices, private banks and pension funds.
4 It delivers the big picture in terms of growing bubbles and instabilities in today’s financial markets for Chief Investment Officers, Senior Researchers, Fund Managers, and Independent Financial Advisors, and all parties with investment performance responsibility or managing financial risks.
4 The report is the result of an extensive analysis applied to the historical time series of about 450 systemic assets and about 850 single stocks. The systemic assets are bond, equity and commodity indices, as well as a selection of currency pairs. The single stocks are mainly US and European equities. The data is from Thomson Reuters.
4 To new readers, we recommend proceeding to the appendix for more detailed information about the methodology and procedures applied in this report.
2

The FCO Cockpit - Global Bubble Status Report
General Results - The Big Picture

The FCO Cockpit - Global Bubble Status Report
General Results as of 2021-09-30
4 This month, the fixed income sector has no bubble signals, as in the previous months.4 In the commodities sector, the positive bubble fraction has risen significantly from 7% to 17% during this month,
while the negative bubble activity remains unchanged at 3%.4 The positive bubble fraction in single stocks and equity indices sectors has dropped from 14% to 11% and 21% to
14% in this month, respectively.4 In the Forex sector, the positive and negative bubble signals are still quite low at 5% and 2% by the end of
September.4 In the CryptoX sector, bubble signals remain nearly zero as in the last month.

The FCO Cockpit - Global Bubble Status Report 5
FCO Market OutlookRethink the Energy TrilemmaThe energy Trilemma describes a balance between energy security (high reliability), social impact (low cost), andenvironmental sensitivity (low emissions). However, it is tough to achieve all three elements at the same time. In theTesla case study of the Feb. 2020 FCO monthly report, we mentioned that the Green Energy and Electrical Automobiletides are coming. We noticed an awakening of the public’s green energy awareness in the U.S., U.K., and Europeancountries. Then, the green energy tide has suddenly accelerated with the COVID-19. As a consequence, most of theglobal big energy producers significantly reduced their Capex in 2020 (also due to COVID-19 uncertainty), which harmsthe potential producing capacity of fossil fuel energy. Although the investment in solar, wind and hydro energy sourceshas increased a lot, the world is still far from being able to transitioning its primary energy sources from coal, oil, andnatural gas to green energy. Moreover, the green energy sources are not stable enough (i.e., not always enoughsunshine, wind, and sufficient rainfall) to guarantee 24/7/365 energy security. Thus, with the combinations of lowinventory, the global recovery from the pandemics since late 2021, bad weather (Hurricane Ida in Gulf Coast), and notenough carbon energy production capability as well as the labor shortage, Europe, U.K., and the U.S. are suffering frompower shortages, while the developing countries are enduring energy poverty.
Fix income: In line with our past reports, the U.S. begins to admit the fear of inflation, and Fed Chair Powell finally said the central bank might start scaling backasset purchases as soon as November and finish in mid-2022. Meanwhile, the Bank of England Governor Andrew Bailey even mentioned that the interest rate couldrise as early as this year to curb the inflation risk. We are happy to see that those central bankers’ words align with what we said in our previous FCO monthly reports.We strongly disagree with Ray Dalio’s opinion that “Cash is trash,” and we do not see there will be "easy" alpha in many asset classes in the next six months. Thus,we recommend that our readers increase cash allocation, reducing risky asset allocation due to the monetary policy change.U.S. equities: It is interesting to watch that many ” long-term” Tesla boosters have sold the Tesla stock in the past few weeks. For instance, ARK investment’s $7000per share Tesla price target for 2024 can not stop its CEO Cathie Wood from selling $270 million Tesla stocks at around $700 per share. Chamath Palihapitiya,another long time Tesla bull, just closed all his Tesla positions. It is amusing to see investors reduce money in contradiction to where their mouths are.China: We see plenty of evidence that U.S. inflation is not temporary, and the Fed has to tighten the interest rate. At the same time, the Chinese economicslowdown is not transient (we discuss this topic in the next slide), and the PBoC has to inject more liquidity. The contradiction of the two countries’ monetary policiesis likely to continue for some time, which widens the interest rate gap and puts more pressure on the Chinese currency, both of which impact the cross-bordercapital flow between the two countries.Commodities: Due to the unusual weather conditions (i.e., flood, hurricane, and drought, etc. in European, North American, and Asian countries), pandemic impactsas well as unconventional monetary policies, most of the agriculture commodities have increased at more than double-digit rates this year, which is not good newsfor the developing countries. According to the UN World Food Program report, 957 million people across 93 countries do not have enough to eat in 2021. In addition,oil and gas production still lagged behind pre-hurricane levels. The global energy crunch deteriorates the unequal recovery. Thus, we feel very sad that the COVID-19 variants, food crisis, and energy poverty hang over those unfortunate least developed countries. In China, roughly 80% of the basic industrial material factories(i.e., steel, Aluminum, copper factories) have suspended production since Sept., thanks to the forced shutdowns and intense energy shortage. The suspensionpushes down the Iron ore demand further (Iron Ore has experienced a 50% price drop until now). We also notice that the Coal price has doubled since the beginningof 2021 for many well-known reasons (lack of mine investment; imports constraints; global shortage in inventories, etc.).
Chinese Q4 weak economic outlookThe PMI (purchasing managers’ index) figures are one of the most apparent evidence of the weak fundamental of China’s economy in Q4, with severe electricitypower shortages, a slowdown across its vast property sector since Evergrande’s credit event, and sporadic outbreaks of the Covid-19 Delta variant andcorresponding lockdowns from time to time. It is hard to imagine what U.S. and European consumers can put into their Christmas shopping cart if China, the “worldmanufacture” lacks electricity to drive machinery in the next two months. Actually, in some provinces of China, Steel, non-ferrous metals, chemicals, textiles, andother energy-consuming companies will only be allowed to operate for two days a week to keep power consumption under control. China (and Indian) does nothave enough coal or natural gas storage for heating while the winter is coming.

The FCO Cockpit - Global Bubble Status Report
Three “Nobel-prize” level questions related to China
6
"Somewhere down this road, a generation may believe they have come of age, before they have."—— Lee Kuan Yew on China‘s rising up
At the global Financial Crisis Observatory (FCO), we are always interested in the topics or phenomena related to real-world economics,and in particular of excesses such as bubbles in all asset classes, and financial crises. This time, we have three "Nobel-prize" levelquestions related to China for everyone to consider.
After two decades of fast development, China's real estate sector, which contributes around 30% of the country's GDP, finally showssigns of slowing down, indicating that the old economic growth model no longer works. Besides the magnificent skyscrapers,international investors observed that households, developers & related upper-chain companies and different levels of government allbecome highly indebted while witnessing the astonishing property price soaring in China during the two decades of tremendousurbanization. We all know that one person's liability is another person's asset, so our first "Nobel-prize" level question is: If almost allreal estate participants are debt-laden, who made money? This question is critical since it addresses the origin of the China debtproblem.
Evergrande, with the drama of its meltdown, has become one of the most enormous "stranded whales" on the beach at the low tide ofcredit, sending a strong signal that Beijing no longer accepts the "too big to fail" enterprises to "kidnap" the economy. However, as aresult of the Evergrande's spillover effect (Evergrande's debts of June 2021, according to Caixin, is around $300 billion, or equivalent to2% of China's GDP), we expect that the Chinese developers' financing situation will deteriorate in both onshore and offshore bondmarkets. This financial contagion might lead to more critical credit events. Arguably, the current China debt situation is similar to Japanin the 1990s and the U.S. in the late 2000s, as the property sector is becoming a threat to financial, economic, and social stability, andthe overcapacity of property-related industries also needs to be solved. Thus, our second "Nobel-prize" level question is: How can theChinese government handle the Evergrande and other coming corporate insolvent cases without triggering a systemic cascade (i.e.,banking crisis/financial crisis/economic crisis).
China has long been the biggest engine of global prosperity. According to IMF, China contributes 28% of GDP growth worldwide from2013 to 2018. The current global economy's most powerful locomotive overly relies on China's property-driven economic growth model.With the peaking of the working-age population and the coming of aging of the population in China, the old economic model can nolonger drive China's economic growth. So our third "Nobel-prize" level question is: What can the Chinese economy rely on if real estateis no longer the option. The answer to this important question will determined the road of China's future.

The FCO Cockpit - Global Bubble Status Report
DS LPPLS Multi-Scale Confidence Indicators:4 The graphs below use our extended methodology of the DS LPPLS Confidence Indicator to the so-called
Multi-Scale Confidence Indicators (MCI). The MCI are finer version of the Confidence Indicator, computed in the same way, however based on different, sets of fit windows that describe different “timescales of thinking” of investors. More specifically, we base the computation of the MCI on the following window sets:— Super-Short (SS) Scale: [40,183] days— Short (S) Scale: [40,365] days— Medium (M) Scale: [365,730] days— Long (L) Scale: [730,1460] days
4 These different sets range from few months up to several years. For each range, LPPLS signals are computed over all contained fit windows in steps of 1 day. The resulting signals are aggregated into four corresponding versions of the Confidence Indicator. These MCI range from very reactive (SS,S) to more stable (M,L) versions. Observing them simultaneously allows understanding the formation and evolution of speculative bubbles in more detail.
4 Based on these four new indicators, the indicator plots show the detailed positive and negative bubble indicator timeseries for all four of them. In the asset tables, we report only the strongest of the four in the column “DS LPPLS Confidence”. The new column “strongest signal” indicates which of the four indicator this corresponds to.
7
How to read the graphs and tables

The FCO Cockpit - Global Bubble Status Report
Additional Bubble Metrics:4 We show the top positive and negative bubble signals, as well as the corresponding bubble characteristics. 4 The “bubble CAGR” (bg) measures the annualized compound bubble growth (bg) of the price during a bubble phase, as
implied by the size (bs) and duration (bd) of a bubble.
𝑏𝑔 = exp !" #$%&#'
4 The bubble size since the bubble start t1 is 𝑏𝑠 = !!!"−1 and the bubble duration is 𝑏𝑑 = 𝑡 − 𝑡"
4 By estimation of the start time t1 and the predicted end time tc of a bubble, the progress of the bubble at the current time t is computed as:
𝑏𝑝 = ()(#($)(#
4 Thus, the bubble progress measures the percentage of time until the predicted end of the bubble that has passed so far (i.e. until t) since the beginning of the bubble. The numerator is the current bubble duration and the divisor 𝑡% − 𝑡" is the “implied bubble duration”, implied by the LPPLS model.
New Ranking Methodology:
4 We rank top positive and negative bubble signals from our database according to the geometric average of the confidence indicator, the bubble CAGR and the bubble progress:
𝑔𝑎 = 𝑐𝑖 ⋅ 𝑏𝑔 ⋅ 𝑏𝑝 &/+
4 This geometric average considers the strength of the bubble signal, the intensity of the bubble (compound growth), as well as the maturity of the bubble. These three metrics characterize the most relevant “dimensions” of a bubble and thus, the geometric average is a reasonable choice to rank bubble signals.
8
How to read the graphs and tables
The FCO Cockpit - Global Bubble Status Report
Fixed IncomeNo bubbles to report

The FCO Cockpit - Global Bubble Status Report
Commodities

The FCO Cockpit - Global Bubble Status Report

The FCO Cockpit - Global Bubble Status Report

The FCO Cockpit - Global Bubble Status Report

The FCO Cockpit - Global Bubble Status Report
Single Stocks

The FCO Cockpit - Global Bubble Status Report

The FCO Cockpit - Global Bubble Status Report

The FCO Cockpit - Global Bubble Status Report

The FCO Cockpit - Global Bubble Status Report

The FCO Cockpit - Global Bubble Status Report

The FCO Cockpit - Global Bubble Status Report

The FCO Cockpit - Global Bubble Status Report

The FCO Cockpit - Global Bubble Status Report

The FCO Cockpit - Global Bubble Status Report
The FCO Cockpit - Global Bubble Status Report

The FCO Cockpit - Global Bubble Status Report
The FCO Cockpit - Global Bubble Status Report

The FCO Cockpit - Global Bubble Status Report
Equity Indices

The FCO Cockpit - Global Bubble Status Report

The FCO Cockpit - Global Bubble Status Report

The FCO Cockpit - Global Bubble Status Report

The FCO Cockpit - Global Bubble Status Report

The FCO Cockpit - Global Bubble Status Report

The FCO Cockpit - Global Bubble Status Report

The FCO Cockpit - Global Bubble Status Report

The FCO Cockpit - Global Bubble Status Report

The FCO Cockpit - Global Bubble Status Report

The FCO Cockpit - Global Bubble Status Report

The FCO Cockpit - Global Bubble Status Report

The FCO Cockpit - Global Bubble Status Report
Forex

The FCO Cockpit - Global Bubble Status Report

The FCO Cockpit - Global Bubble Status Report

The FCO Cockpit - Global Bubble Status Report
CryptoX

The FCO Cockpit - Global Bubble Status Report

The FCO Cockpit - Global Bubble Status Report

The FCO Cockpit - Global Bubble Status Report

The FCO Cockpit - Global Bubble Status Report
Sectors
46
GICS Industry Group Name Yearly Return Bubble Size Bubble Score Value Score Growth ScoreOct 1st Sep 1st Oct 1st Sep 1st Oct 1st Sep 1st Oct 1st Sep 1st Oct 1st Sep 1st
Pharmaceuticals, Biotechnology & Life Sciences 12.6% 19.2% 0.0% 18.8% 0.0% 88.7% 64.7% 65.0% 57.1% 57.2%Consumer Services 22.8% 23.6% 0.0% 0.0% 0.0% 0.0% 24.2% 23.1% 59.5% 58.6%Retailing 7.8% 19.8% 0.0% 0.0% 0.0% 0.0% 18.3% 17.9% 44.8% 44.2%Transportation 10.7% 18.8% -6.6% 0.0% -81.6% 0.0% 42.9% 43.5% 54.3% 54.6%Consumer Durables & Apparel 23.4% 34.1% 0.0% 0.0% 0.0% 0.0% 33.7% 33.8% 48.6% 48.7%Semiconductors & Semiconductor Equipment 36.8% 58.7% 0.0% 0.0% 0.0% 0.0% 54.5% 54.8% 42.0% 41.5%Technology Hardware & Equipment 22.2% 36.0% 0.0% 0.0% 0.0% 0.0% 50.8% 47.8% 51.3% 51.5%Automobiles & Components 49.9% 49.4% 0.0% 0.0% 0.0% 0.0% 52.3% 52.5% 42.6% 42.6%Telecommunication Services 4.1% 6.3% 0.0% 0.0% 0.0% 0.0% 58.9% 60.7% 43.5% 43.2%Energy 60.5% 38.0% 0.0% 0.0% 0.0% 0.0% 50.7% 50.6% 70.3% 69.5%Software & Services 18.1% 33.7% 0.0% 31.3% 0.0% 15.6% 36.8% 35.0% 51.8% 51.3%Materials 14.9% 23.9% 0.0% 0.0% 0.0% 0.0% 49.4% 49.1% 51.2% 51.5%Health Care Equipment & Services 19.1% 30.5% 0.0% 15.8% 0.0% 70.5% 48.1% 47.8% 52.5% 52.7%Capital Goods 24.2% 32.9% 0.0% 0.0% 0.0% 0.0% 48.8% 49.0% 49.4% 49.7%Media & Entertainment 37.2% 52.3% 0.0% 21.7% 0.0% 32.1% 30.2% 28.5% 32.5% 32.5%Commercial & Professional Services 19.8% 26.7% 0.0% 20.3% 0.0% 33.5% 29.1% 29.0% 52.2% 51.9%Food & Staples Retailing 11.3% 21.8% 0.0% 18.9% 0.0% 24.1% 38.8% 38.7% 62.3% 64.5%Household & Personal Products -5.0% 1.6% 0.0% 0.0% 0.0% 0.0% 27.7% 28.0% 53.5% 53.5%Food, Beverage & Tobacco 7.5% 11.8% 0.0% 0.0% 0.0% 0.0% 47.8% 47.4% 57.0% 57.4%Utilities -0.9% 12.8% 0.0% 0.0% 0.0% 0.0% 44.8% 45.5% 53.5% 53.7%Insurance 29.1% 29.3% 0.0% 0.0% 0.0% 0.0% - - - -Real Estate 20.4% 26.9% 0.0% 0.0% 0.0% 0.0% - - - -Diversified Financials 40.1% 49.0% 0.0% 22.2% 0.0% 30.9% - - - -Banks 58.4% 50.5% 0.0% 0.0% 0.0% 0.0% - - - -

The FCO Cockpit - Global Bubble Status Report
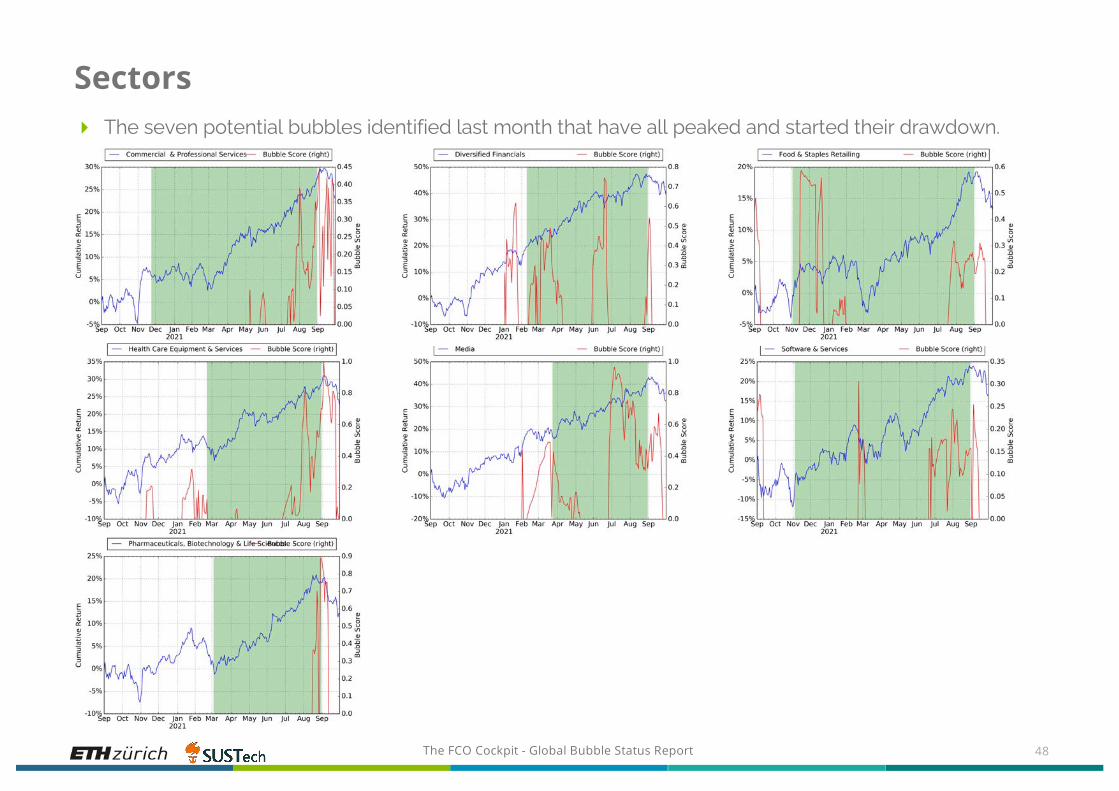
Sectors4 We use the MSCI World Industry Group Indices to calculate bubble size and bubble score of the
corresponding sectors. To determine the value scores and growth scores of the sectors, we average over the corresponding values for each stock of a given sector, weighted by market cap.
4 For the first time in the past two years, we observe a negative bubble in the 24 MSCI World Industry Group Indices (see below): Transportation. Meanwhile, the seven positive bubbles we identified last month have ended their bubble regimes (see next page).
47
The FCO Cockpit - Global Bubble Status Report
Sectors4 The seven potential bubbles identified last month that have all peaked and started their drawdown.
48

The FCO Cockpit - Global Bubble Status Report
Portfolio Construction & Performance
4 Here we illustrate the methodology of the portfolio construction process based on the results of our previous analyses.
4 For individual stocks that we identified in the 4 quadrants, we constructed 4 portfolios based on the 4 quadrants defined in the last report. Each portfolio consists of all the stocks listed in the corresponding quadrant. 1. Trend-Following Long Stock Portfolio (TFLSP) is made of the stocks that have a
positive bubble signal as well as a strong value score. For instance, TFLSP November consists of all the stocks listed in quadrant 1, identified in slide 37 of November 2017 FCO Report.
2. Trend-Following Short Stock Portfolio (TFSSP) is made of the stocks that have a negative bubble signal as well as a weak value score.
3. Contrarian Long Stock Portfolio (CLSP) is made of the stocks that have a negativebubble signal as well as a strong value score.
4. Contrarian Short Stock Portfolio (CSSP) is made of the stocks that have a positivebubble signal as well as a weak value score.
49

The FCO Cockpit - Global Bubble Status Report
Portfolio Construction & Performance
4 At the same time, we also classified 20 industries into 4 quadrants, and constructed 4 type of industry portfolios based on the 4 industry quadrants. Each portfolio consists of all the stocks in the industries listed in the corresponding quadrant. Following the same definitions as above, we have Trend-Following Long Industry Portfolio (TFLIP), Trend-Following Short Industry Portfolio (TFSIP), Contrarian Long Industry Portfolio (CLIP), and Contrarian Short Industry Portfolio (CSIP).
4 In each month, we initiated 8 new portfolios based on the updated results. The performance of every 8 portfolios we initiated since November 2017 are presented in the next slide. All of the stocks in our portfolios are weighted by their market capitalizations and we don’t consider transaction cost in the portfolio performance.
50

The FCO Cockpit - Global Bubble Status Report
Portfolio Construction & Performance4 The market has entered a volatile period in the past month with Short Portfolios starting to outperform. Contrarian
Portfolios are more delicate to use due to their sensitivity to timing the expected reversal and exhibit very volatile performances. We expect trend-following positions to perform in the months following the position set-up and then contrarian positions to over-perform over longer time scales over which the predicted corrections play out.
51

The FCO Cockpit - Global Bubble Status Report
Single StocksWe can divide the stocks into four quadrants1)
4 Quadrant 1: Stocks with a strong value score are cheap relative to their earnings potential. The strong positive bubble signal should be interpreted as a momentum indicator possibly the consequence of a repricing based on the fundamentals. As an investor, one could be a trend-following buyer. E.g. Pfizer Inc.
4 Quadrant 2: Stocks with a weak value score are expensive relative to their earnings potential. The strong positive bubble signal is an indication of sentiment and herding increasing the price until it is not linked to fundamentals anymore. As an investor, one could be a contrarian seller. E.g. Xilinx Inc
4 Quadrant 3: These stocks are expensive relative to their earnings potential. On top of that, there are clear negative bubble signals. Such stocks should be considered as falling knives. As an investor, one could be a trend-following seller. E.g. Ambu A/S
4 Quadrant 4: These stocks are cheap relative to their financial performance. The strong negative bubble signal is an indication of sentiment and herding. These stocks can be considered as over-sold. As an investor, one could be a contrarian buyer. E.g. Amgen Inc.
52
*1) A strong positive bubble signal is identified if bubble score is positive, and a strong negative bubble signal is identified if bubble score is negative.A strong value score is identified if value score is larger than 60%, and a weak value score is identified
if value score is smaller than 40%.
2contra
rian
selle
r
1
3
4 trend-following
buyerContraria
nbuyer
trend-following seller

The FCO Cockpit - Global Bubble Status Report
Single Stocks
4 For 823 stocks, we calculate the bubble warning indicators as well as two financial strength indicators, which indicate the fundamental value of the stock and the growth capability respectively.
4 To analyze the financial strength of individual stocks, we have two indicators. Both scores give a value between zero and one, one being the best of the set and zero the worst, so the higher the score, the higher the financial strength.— A value score that is based on the ROIC (Return on Invested Capital) taking into account the EV
(Enterprise Value) to normalize for high/low market valuations and/or high/low debt; Value scores are calculated by comparing ROIC level versus EV/IC in each industry.
— A growth score that has characteristics similar to the PEG ratio, which is the Price to Earnings ratio normalized by the expected growth of the EPS (Earnings per Share).
4 The stocks are the constituents of the STOXX Europe 600, the S&P 500 and the Nasdaq 100 indices. From these, all doubles and stocks with incomplete data are removed. Because our financial strength indicators are specifically designed for corporates, all financial institutions are taken out of the set as well.
53

The FCO Cockpit - Global Bubble Status Report
Single StocksQuadrant 1 stocks: strong positive bubble signals with strong fundamentals
54
Company Name Country of Headquarters GICS Industry Group NameYearly Return
Bubble Size
Bubble Start
Bubble Score
Value Score
Growth Score
Exelon Corp United States of America Utilities 23.3% 20.9% Oct-20 9.0% 64.4% 25.7%HCA Healthcare Inc United States of America Health Care Equipment & Services 81.2% 64.8% Nov-20 8.0% 67.2% 26.4%Pfizer Inc United States of America Pharmaceuticals, Biotechnology & Life Sciences 23.3% 14.1% Dec-20 11.8% 82.3% 95.6%Flutter Entertainment PLC Ireland; Republic of Consumer Services 12.9% 16.3% May-21 48.1% 69.4% 83.2%Norsk Hydro ASA Norway Materials 152.0% 42.3% Feb-21 56.9% 81.6% 90.6%Entain PLC Isle of Man Consumer Services 95.3% 58.7% Feb-21 25.3% 86.7% 82.2%EssilorLuxottica SA France Consumer Durables & Apparel 36.2% 23.9% Mar-21 59.1% 73.2% 60.5%ASM International NV Netherlands Semiconductors & Semiconductor Equipment 152.5% 36.2% Apr-21 46.8% 82.6% 34.7%Equinor ASA Norway Energy 63.9% 38.3% Jan-21 17.4% 64.5% 94.0%SES SA Luxembourg Media & Entertainment 17.7% 21.4% Apr-21 25.9% 79.6% 99.4%

The FCO Cockpit - Global Bubble Status Report
Single Stocks Quadrant 1 Stocks Current Month Example – EssilorLuxottica SA.
55
4 The above graph shows the one-year cumulative return of the stock in blue (left hand scale), STOXX 600 in green (left hand scale) and the calculated DS LPPLS Bubble Score in red (right hand scale). The green shaded period delineates the time interval within which the positive bubble is identified. The Bubble Score of this six-month bubble has reached 59.1% with a bubble size 23.9%.

The FCO Cockpit - Global Bubble Status Report
Single Stocks Quadrant 1 Stocks Last Month Example – J Sainsbury PLC.
4 The figure above plots the one-year cumulative return of the stock (blue), STOXX 600 (green) and LPPLS Bubble Score (red lines on the right y-axis). The green shaded period delineates the time interval within which a strong positive bubble has been identified and reported last month. The stock ended its bubble regime with a 20% drawdown in the past month, which is in agreement with our strong bubble signal identified last month but still surprising, given the strong fundamentals.
56
The FCO Cockpit - Global Bubble Status Report
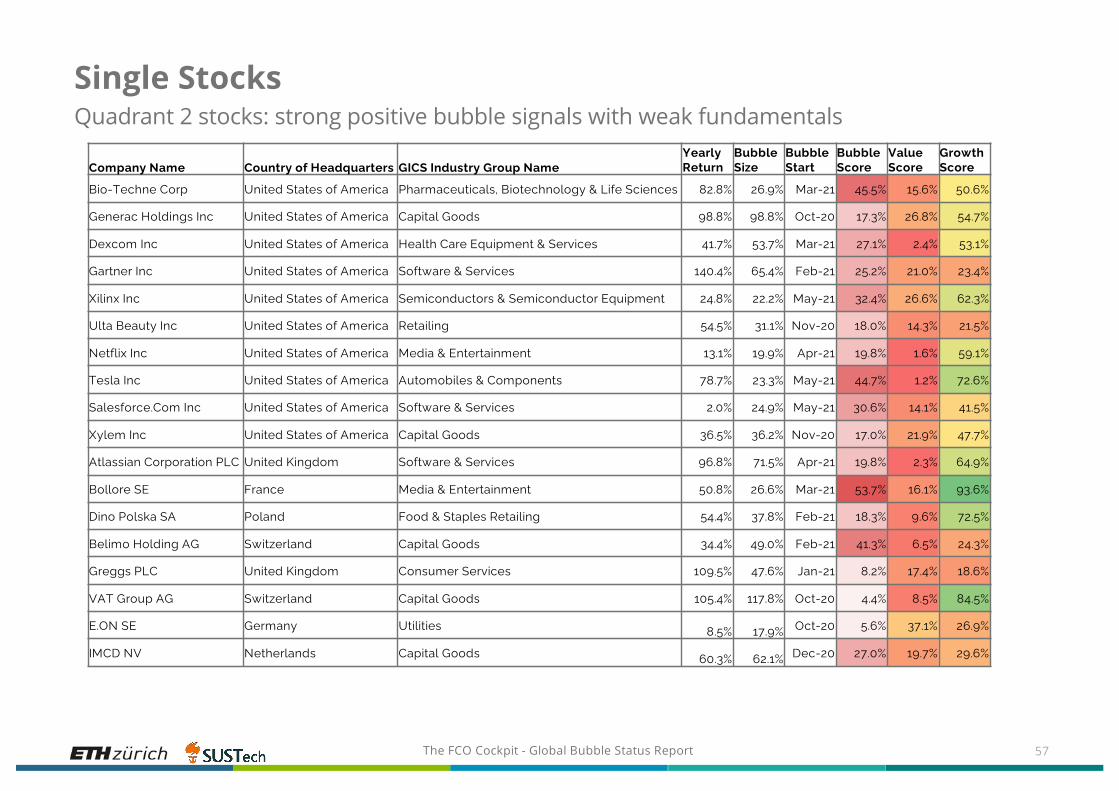
Single StocksQuadrant 2 stocks: strong positive bubble signals with weak fundamentals
57
Company Name Country of Headquarters GICS Industry Group NameYearly Return
Bubble Size
Bubble Start
Bubble Score
Value Score
Growth Score
Bio-Techne Corp United States of America Pharmaceuticals, Biotechnology & Life Sciences 82.8% 26.9% Mar-21 45.5% 15.6% 50.6%
Generac Holdings Inc United States of America Capital Goods 98.8% 98.8% Oct-20 17.3% 26.8% 54.7%
Dexcom Inc United States of America Health Care Equipment & Services 41.7% 53.7% Mar-21 27.1% 2.4% 53.1%
Gartner Inc United States of America Software & Services 140.4% 65.4% Feb-21 25.2% 21.0% 23.4%
Xilinx Inc United States of America Semiconductors & Semiconductor Equipment 24.8% 22.2% May-21 32.4% 26.6% 62.3%
Ulta Beauty Inc United States of America Retailing 54.5% 31.1% Nov-20 18.0% 14.3% 21.5%
Netflix Inc United States of America Media & Entertainment 13.1% 19.9% Apr-21 19.8% 1.6% 59.1%
Tesla Inc United States of America Automobiles & Components 78.7% 23.3% May-21 44.7% 1.2% 72.6%
Salesforce.Com Inc United States of America Software & Services 2.0% 24.9% May-21 30.6% 14.1% 41.5%
Xylem Inc United States of America Capital Goods 36.5% 36.2% Nov-20 17.0% 21.9% 47.7%
Atlassian Corporation PLC United Kingdom Software & Services 96.8% 71.5% Apr-21 19.8% 2.3% 64.9%
Bollore SE France Media & Entertainment 50.8% 26.6% Mar-21 53.7% 16.1% 93.6%
Dino Polska SA Poland Food & Staples Retailing 54.4% 37.8% Feb-21 18.3% 9.6% 72.5%
Belimo Holding AG Switzerland Capital Goods 34.4% 49.0% Feb-21 41.3% 6.5% 24.3%
Greggs PLC United Kingdom Consumer Services 109.5% 47.6% Jan-21 8.2% 17.4% 18.6%
VAT Group AG Switzerland Capital Goods 105.4% 117.8% Oct-20 4.4% 8.5% 84.5%
E.ON SE Germany Utilities 8.5% 17.9% Oct-20 5.6% 37.1% 26.9%
IMCD NV Netherlands Capital Goods 60.3% 62.1% Dec-20 27.0% 19.7% 29.6%

The FCO Cockpit - Global Bubble Status Report
Single Stocks Quadrant 2 Stocks Current Month Example – Bollore SE.
4 The above graph shows the one-year cumulative return of the stock in blue (left hand scale), STOXX 600 in green (left hand scale) and the calculated DS LPPLS Bubble Score in red (right hand scale). The green shaded period delineates the time interval within which the positive bubble is identified. The Bubble Score of this seven-month bubble has reached 53.7% with a bubble size 26.6%. The strong positive bubble signal and weak fundamentals may indicate a high probability of correction in the future.
58

The FCO Cockpit - Global Bubble Status Report
Single Stocks Quadrant 2 Stocks Last Month Example – Advanced Micro Devices Inc.
The figure above plots the one-year cumulative return of the stock (blue), NASDAQ 100 (green) and LPPLS Bubble Score (red lines on the right y-axis). The green shaded period delineates the time interval within which a strong positive bubble has been identified and reported last month. The stock price has undergone a change of regime, which is in agreement with the LPPLS signal. The weak fundamentals suggests that the correction willcontinue, further amplified by the overall correction occurring in the NASDAQ 100 index over the past month.
59

The FCO Cockpit - Global Bubble Status Report
Single StocksQuadrant 3 stocks: strong negative bubble signals with weak fundamentals
60
Company Name Country of Headquarters GICS Industry Group NameYearly Return
Bubble Size
Bubble Start
Bubble Score
Value Score
Growth Score
Take-Two Interactive Software Inc United States of America Media & Entertainment -4.7% -22.0% Dec-20 -12.0% 32.1% 14.1%Vertex Pharmaceuticals Inc United States of America Pharmaceuticals, Biotechnology & Life Sciences -32.8% -23.4% Dec-20 -4.9% 24.9% 34.3%Clorox Co United States of America Household & Personal Products -22.9% -19.2% Nov-20 -41.4% 23.6% 76.2%W W Grainger Inc United States of America Capital Goods 2.0% -14.7% May-21 -82.7% 37.5% 76.7%PPG Industries Inc United States of America Materials 5.2% -17.6% Apr-21 -15.5% 35.8% 66.3%Pinduoduo Inc China Retailing 14.0% -36.8% Nov-20 -17.8% 0.6% 71.5%Ubisoft Entertainment SA France Media & Entertainment -36.6% -22.5% Mar-21 -7.7% 9.4% 88.2%Koninklijke Vopak NV Netherlands Energy -28.8% -12.3% Apr-21 -81.4% 38.5% 93.5%Ambu A/S Denmark Health Care Equipment & Services 1.3% -20.0% Dec-20 -15.2% 2.2% 81.0%

The FCO Cockpit - Global Bubble Status Report
Single Stocks Quadrant 3 Stocks Current Month Example – Koninklijke Vopak NV.
4 The above graph shows the one-year cumulative return of the stock in blue (left hand scale), STOXX 600 in green (left hand scale) and the calculated DS LPPLS Bubble Score in red (right hand scale). The red shaded period delineates the time interval within which the negative bubble is identified. The Bubble Score of this six-month bubble has reached 81.4% with a bubble size -12.3%.
61

The FCO Cockpit - Global Bubble Status Report
Single Stocks Quadrant 3 Stocks Last Month Example – Deutsche Lufthansa AG.
4 The figure above plots the one-year cumulative return of the stock (blue), STOXX 600 (green) and LPPLS Bubble Score (red line on the right y-axis). The red shaded period delineates the time interval within which the strong negative bubble was identified and reported last month. The stock price ended its negative bubble regime we identified last month with a 10% rebound in the past month. One should remain cautious given the weak fundamentals of this stock.
62
The FCO Cockpit - Global Bubble Status Report
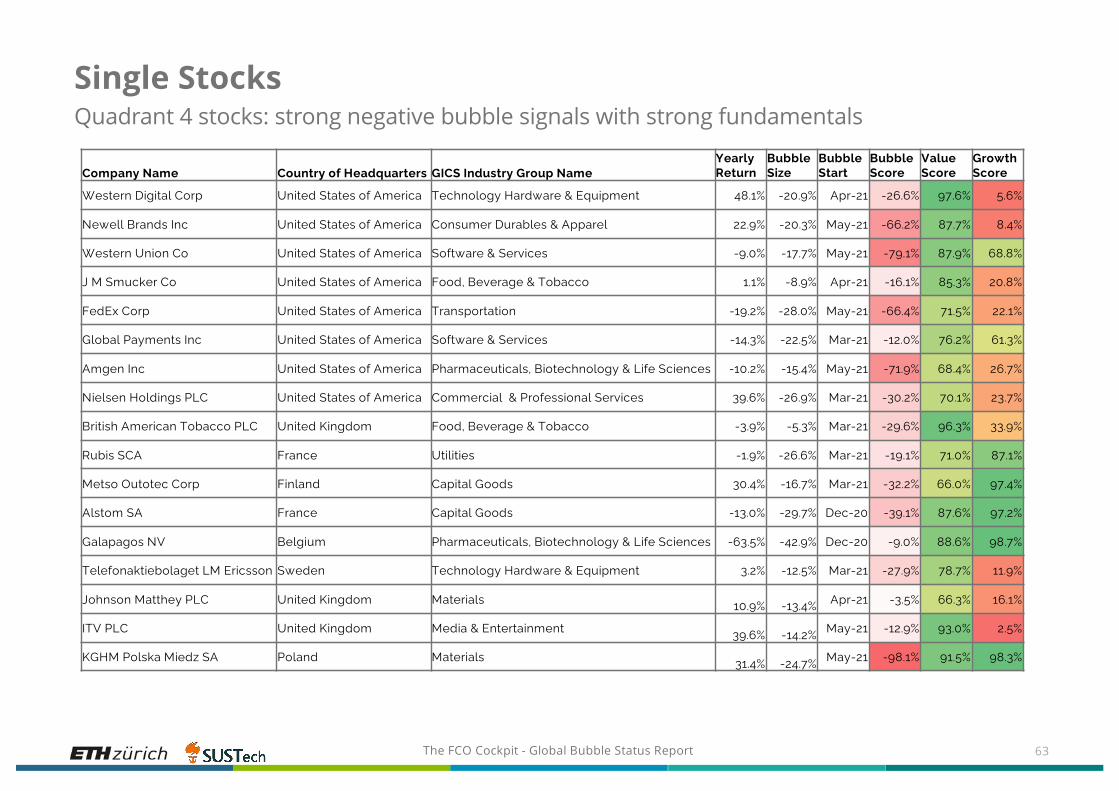
Single StocksQuadrant 4 stocks: strong negative bubble signals with strong fundamentals
63
Company Name Country of Headquarters GICS Industry Group NameYearly Return
Bubble Size
Bubble Start
Bubble Score
Value Score
Growth Score
Western Digital Corp United States of America Technology Hardware & Equipment 48.1% -20.9% Apr-21 -26.6% 97.6% 5.6%
Newell Brands Inc United States of America Consumer Durables & Apparel 22.9% -20.3% May-21 -66.2% 87.7% 8.4%
Western Union Co United States of America Software & Services -9.0% -17.7% May-21 -79.1% 87.9% 68.8%
J M Smucker Co United States of America Food, Beverage & Tobacco 1.1% -8.9% Apr-21 -16.1% 85.3% 20.8%
FedEx Corp United States of America Transportation -19.2% -28.0% May-21 -66.4% 71.5% 22.1%
Global Payments Inc United States of America Software & Services -14.3% -22.5% Mar-21 -12.0% 76.2% 61.3%
Amgen Inc United States of America Pharmaceuticals, Biotechnology & Life Sciences -10.2% -15.4% May-21 -71.9% 68.4% 26.7%
Nielsen Holdings PLC United States of America Commercial & Professional Services 39.6% -26.9% Mar-21 -30.2% 70.1% 23.7%
British American Tobacco PLC United Kingdom Food, Beverage & Tobacco -3.9% -5.3% Mar-21 -29.6% 96.3% 33.9%
Rubis SCA France Utilities -1.9% -26.6% Mar-21 -19.1% 71.0% 87.1%
Metso Outotec Corp Finland Capital Goods 30.4% -16.7% Mar-21 -32.2% 66.0% 97.4%
Alstom SA France Capital Goods -13.0% -29.7% Dec-20 -39.1% 87.6% 97.2%
Galapagos NV Belgium Pharmaceuticals, Biotechnology & Life Sciences -63.5% -42.9% Dec-20 -9.0% 88.6% 98.7%
Telefonaktiebolaget LM Ericsson Sweden Technology Hardware & Equipment 3.2% -12.5% Mar-21 -27.9% 78.7% 11.9%
Johnson Matthey PLC United Kingdom Materials 10.9% -13.4% Apr-21 -3.5% 66.3% 16.1%
ITV PLC United Kingdom Media & Entertainment 39.6% -14.2% May-21 -12.9% 93.0% 2.5%
KGHM Polska Miedz SA Poland Materials 31.4% -24.7% May-21 -98.1% 91.5% 98.3%

The FCO Cockpit - Global Bubble Status Report
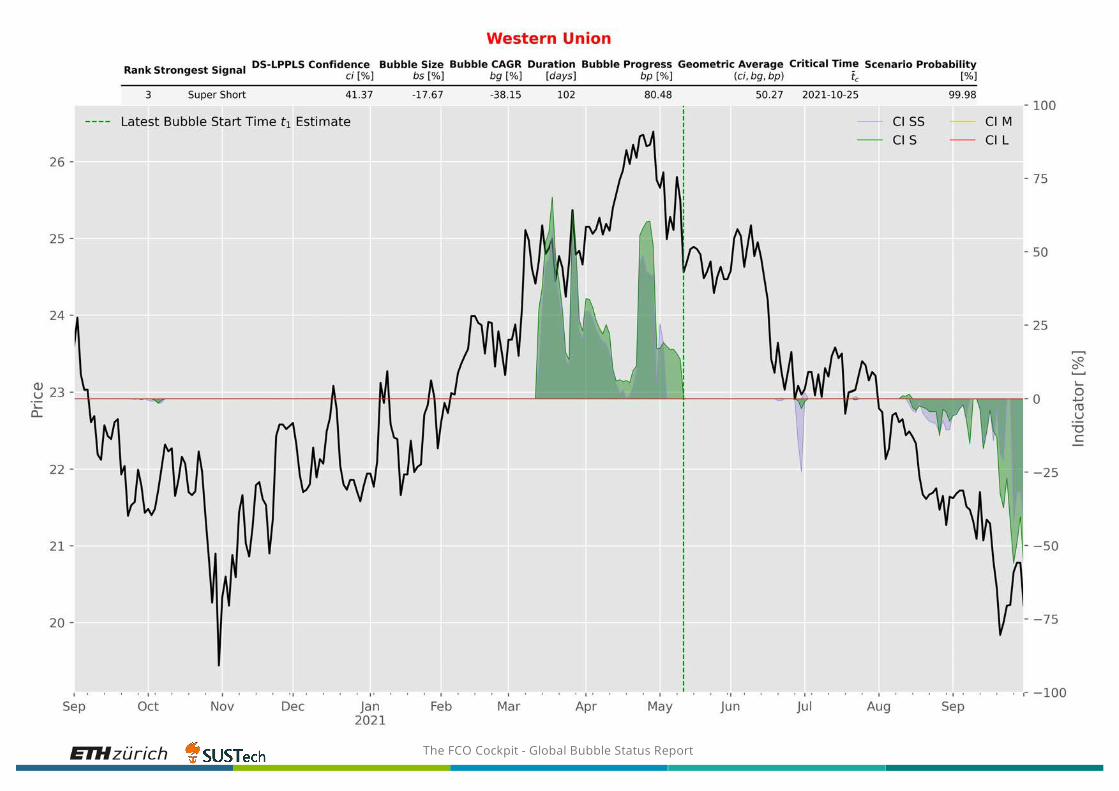
Single Stocks Quadrant 4 Stocks Current Month Example – Western Union Co.
4 The above graph shows the one-year cumulative return of the stock in blue (left hand scale), S&P 500 in green (left hand scale) and the calculated DS LPPLS Bubble Score in red (right hand scale). The red shaded period delineates the time interval within which the strong negative bubble is identified. The Bubble Score of this five-month bubble has reached 79.1% with a negative bubble size -17.7%. We expect a rebound in the future when the negative bubble is mature, given our diagnostic of a negative bubble signal with strong fundamentals, calling for a contrarian buyer position.
64

The FCO Cockpit - Global Bubble Status Report
Single Stocks Quadrant 4 Stocks Last Month Example – Nielsen Holdings PLC.
4 The figure above plots the one-year cumulative return of the stock (blue), S&P 500 (green) and LPPLS Bubble Score (red line on the right y-axis). The red shaded period delineates the time interval within which the strong negative bubble was identified and reported last month. The stock price continued to go down in the past month, which means that the strong negative bubble signal we identified last month my be a false positive or that the negative bubble has not matured yet and a rebound can still be expected. The bubble score is still running at 30%, marking the negative bubble still developing.
65

The FCO Cockpit - Global Bubble Status Report
Appendix
The FCO Cockpit - Global Bubble Status Report

The FCO Cockpit - Global Bubble Status Report

The FCO Cockpit - Global Bubble Status Report

The FCO Cockpit - Global Bubble Status Report

The FCO Cockpit - Global Bubble Status Report

The FCO Cockpit - Global Bubble Status Report

The FCO Cockpit - Global Bubble Status Report
More Information
4 Visit the Financial Crisis Observatory for more information
http://www.er.ethz.ch/financial-crisis-observatory.html
4 Contacts ETH ZurichDidier Sornette, Ke Wu, Dongshuai Zhao & Yu FengChair of Entrepreneurial RisksDepartment of Management, Technology and EconomicsETH ZurichScheuchzerstrasse 78092 Zurich, Switzerland
73