the f 20 years social and economic status and trends
TRANSCRIPT

Social and Economic Status and Trends
United States Department of Agriculture
for the greatest good
Pacific Northwest Region Report FS/R6/PNW/2015/0006
NorThwEST ForEST PlaN
The FirsT 20 Years (1994–2013)
February 2016
Elisabeth Grinspoon, PhDDelilah Jaworski,and Richard Phillips

In accordance with Federal civil rights law and U.S. Department of Agriculture (USDA) civil rights regulations and policies, the USDA, its Agencies, offices, and employees, and institutions participating in or administering USDA programs are prohibited from discriminating based on race, color, national origin, religion, sex, gender identity (including gender expression), sexual orientation, disability, age, marital status, family/parental status, income derived from a public assistance program, political beliefs, or reprisal or retaliation for prior civil rights activity, in any program or activity conducted or funded by USDA (not all bases apply to all programs). Remedies and complaint filing deadlines vary by program or incident.
Persons with disabilities who require alternative means of communication for program information (e.g., Braille, large print, audiotape, American Sign Language, etc.) should contact the responsible Agency or USDA’s TARGET Center at (202) 720-2600 (voice and TTY) or contact USDA through the Federal Relay Service at (800) 877-8339.
To file a program discrimination complaint, complete the USDA Program Discrimination Complaint Form, AD-3027, found online at http://www.ascr.usda.gov/complaint_filing_cust.html and at any USDA office or write a letter addressed to USDA and provide in the letter all of the information requested in the form. To request a copy of the complaint form, call (866) 632-9992. Submit your completed form or letter to USDA by: (1) mail: U.S. Department of Agriculture, Office of the Assistant Secretary for Civil Rights, 1400 Independence Avenue, SW, Washington, D.C. 20250-9410; (2) fax: (202) 690-7442; or (3) email: [email protected].
Authors
Elisabeth Grinspoon, PhD, Delilah Jaworski, and Richard Phillips
Cover Photo: Figure 1: Photo by James Rible.

Oregon, Washington, and California Report — i
Northwest Forest Plan – Socioeconomic Report
Abstract The Northwest Forest Plan 20-year report describes conditions and trends in socioeconomic well-being in the NWFP area. To reveal trends in socioeconomic wellbeing, the 20-year report tracks demographic and economic data as well as data on agency expenditures and several forest-related resources. Unlike the 10-year report, the 20-year report does not attempt to evaluate causation. Data are displayed to indicate possible relationships betweensocioeconomic data and federal management actions.

ii — Oregon, Washington, and California Report
RepoRt FS/R6/pNW/2015/0006

Oregon, Washington, and California Report — iii
Northwest Forest Plan – Socioeconomic Report
Preface
The Northwest Forest Plan (NWFP) 10-year report aimed to demonstrate whether or not the Plan met its socioeconomic goals by focusing on goods and services produced from federal land management. The analytical framework used for the 10-year report uncovers linkages between the socioeconomic data and federal land management under the Plan.
The primary purpose of the 20-year report is updating data and trends displayed in the 10-year and 15-year reports. The 20-year report draws heavily on the analysis and writing in the 10-year and 15-year report (Charnley et al. 2006; Grinspoon and Phillips 2008). The 20-year report is similar to previous reports in displaying data related to socioeconomic well-being in the NWFP area.
The analytical framework is consistent with the 15-year report. Unlike the 10-year report, the analytical framework used for the later reports was not designed to uncover linkages between socioeconomic data and federal land management actions under the Plan. The 20-year report simply tracks demographic data as well as data on agency expenditures and several forest-related resources to display potential trends related to socioeconomic well-being. The differences between the 10-year report and the 15-year and 20-year reports are primarily due to new regional priorities and methodologies for NWFP monitoring agreed upon by the Regional Interagency Executive Committee (RIEC) in March 2006.
The monitoring report is presented in 12 chapters. Chapters 1 and 2 offer an introduction and key findings. Chapter 3 though Chapter 7 address data on resource outputs, including timber production, special forest products, grazing, minerals and recreation. Chapter 8 though Chapter 11 evaluate data in economies that may be associated with federal forest management in the NWFP area. Chapter 12 summarizes the analysis of the data.

iv — Oregon, Washington, and California Report
RepoRt FS/R6/pNW/2015/0006
Table of Contents
Preface . . . . . . . . . . . . . . . . . . . . . . . . . . . . . . . . . . . . . . . . . . . . . . . . . . . . . . . . . . . . . iiiChapter 1: Introduction . . . . . . . . . . . . . . . . . . . . . . . . . . . . . . . . . . . . . . . . . . . . . . . . . . 1 Socioeconomic Monitoring Questions . . . . . . . . . . . . . . . . . . . . . . . . . . . . . . . . . . . . . . 2 Methods and Data Sources . . . . . . . . . . . . . . . . . . . . . . . . . . . . . . . . . . . . . . . . . . . . . . . 2 Economic Contributions of Federal Land Management Agencies . . . . . . . . . . . . . . . . . 3Chapter 2: Key Findings . . . . . . . . . . . . . . . . . . . . . . . . . . . . . . . . . . . . . . . . . . . . . . . . . 5Chapter 3: Timber . . . . . . . . . . . . . . . . . . . . . . . . . . . . . . . . . . . . . . . . . . . . . . . . . . . . . . 9 Expectations . . . . . . . . . . . . . . . . . . . . . . . . . . . . . . . . . . . . . . . . . . . . . . . . . . . . . . . . . . 10 Data Analysis . . . . . . . . . . . . . . . . . . . . . . . . . . . . . . . . . . . . . . . . . . . . . . . . . . . . . . . . . 10 Results . . . . . . . . . . . . . . . . . . . . . . . . . . . . . . . . . . . . . . . . . . . . . . . . . . . . . . . . . . . . 10 Discussion . . . . . . . . . . . . . . . . . . . . . . . . . . . . . . . . . . . . . . . . . . . . . . . . . . . . . . . . . . . 13Chapter 4: Special Forest Products . . . . . . . . . . . . . . . . . . . . . . . . . . . . . . . . . . . . . . . . 17 Expectations . . . . . . . . . . . . . . . . . . . . . . . . . . . . . . . . . . . . . . . . . . . . . . . . . . . . . . . . . . 17 Data Analysis . . . . . . . . . . . . . . . . . . . . . . . . . . . . . . . . . . . . . . . . . . . . . . . . . . . . . . . . . 17 Bureau of Land Management Results and Discussion . . . . . . . . . . . . . . . . . . . . . . . . . 18 Forest Service Results and Discussion . . . . . . . . . . . . . . . . . . . . . . . . . . . . . . . . . . . . . 20Chapter 5: Grazing . . . . . . . . . . . . . . . . . . . . . . . . . . . . . . . . . . . . . . . . . . . . . . . . . . . . . 23 Expectations . . . . . . . . . . . . . . . . . . . . . . . . . . . . . . . . . . . . . . . . . . . . . . . . . . . . . . . . . . 23 Data Analysis . . . . . . . . . . . . . . . . . . . . . . . . . . . . . . . . . . . . . . . . . . . . . . . . . . . . . . . . . 23 Results . . . . . . . . . . . . . . . . . . . . . . . . . . . . . . . . . . . . . . . . . . . . . . . . . . . . . . . . . . . . 24 Discussion . . . . . . . . . . . . . . . . . . . . . . . . . . . . . . . . . . . . . . . . . . . . . . . . . . . . . . . . . . . 24Chapter 6: Minerals . . . . . . . . . . . . . . . . . . . . . . . . . . . . . . . . . . . . . . . . . . . . . . . . . . . . 27 Expectations . . . . . . . . . . . . . . . . . . . . . . . . . . . . . . . . . . . . . . . . . . . . . . . . . . . . . . . . . . 27 Data Analysis . . . . . . . . . . . . . . . . . . . . . . . . . . . . . . . . . . . . . . . . . . . . . . . . . . . . . . . . . 27 Salable Minerals . . . . . . . . . . . . . . . . . . . . . . . . . . . . . . . . . . . . . . . . . . . . . . . . . . . . . . 27 Results . . . . . . . . . . . . . . . . . . . . . . . . . . . . . . . . . . . . . . . . . . . . . . . . . . . . . . . . . . . . 28 Discussion . . . . . . . . . . . . . . . . . . . . . . . . . . . . . . . . . . . . . . . . . . . . . . . . . . . . . . . . . . . 28Chapter 7: Recreation . . . . . . . . . . . . . . . . . . . . . . . . . . . . . . . . . . . . . . . . . . . . . . . . . . 31 Expectations . . . . . . . . . . . . . . . . . . . . . . . . . . . . . . . . . . . . . . . . . . . . . . . . . . . . . . . . . . 31 Data Analysis . . . . . . . . . . . . . . . . . . . . . . . . . . . . . . . . . . . . . . . . . . . . . . . . . . . . . . . . . 31 Results - Recreation Supply . . . . . . . . . . . . . . . . . . . . . . . . . . . . . . . . . . . . . . . . . . . . . . 31 Results - Recreation Demand . . . . . . . . . . . . . . . . . . . . . . . . . . . . . . . . . . . . . . . . . . . . 32 Forest Service . . . . . . . . . . . . . . . . . . . . . . . . . . . . . . . . . . . . . . . . . . . . . . . . . . . . . . . . 32 Bureau of Land Management . . . . . . . . . . . . . . . . . . . . . . . . . . . . . . . . . . . . . . . . . . . . 32 Discussion . . . . . . . . . . . . . . . . . . . . . . . . . . . . . . . . . . . . . . . . . . . . . . . . . . . . . . . . . . . 34Chapter 8: Socioeconomic Conditions and Trends for Counties . . . . . . . . . . . . . . . . . . 37 Data Analysis . . . . . . . . . . . . . . . . . . . . . . . . . . . . . . . . . . . . . . . . . . . . . . . . . . . . . . . . . 37 Results and Discussion . . . . . . . . . . . . . . . . . . . . . . . . . . . . . . . . . . . . . . . . . . . . . . . . . 38 Total Population and Metropolitan vs. Nonmetropolitan Population . . . . . . . . . . . . . . 38 Population by Age . . . . . . . . . . . . . . . . . . . . . . . . . . . . . . . . . . . . . . . . . . . . . . . . . . . . . 39

Oregon, Washington, and California Report — v
Northwest Forest Plan – Socioeconomic Report
Population by Race and Origin . . . . . . . . . . . . . . . . . . . . . . . . . . . . . . . . . . . . . . . . . . . . . . . 40 Employment and Personal Income by Industry . . . . . . . . . . . . . . . . . . . . . . . . . . . . . . . 41 Unemployment . . . . . . . . . . . . . . . . . . . . . . . . . . . . . . . . . . . . . . . . . . . . . . . . . . . . . . . 41Chapter 9: Jobs and Income Associated with Resources and Recreation . . . . . . . . . . . . 47 Expectations . . . . . . . . . . . . . . . . . . . . . . . . . . . . . . . . . . . . . . . . . . . . . . . . . . . . . . . . . . 47 Data Analysis . . . . . . . . . . . . . . . . . . . . . . . . . . . . . . . . . . . . . . . . . . . . . . . . . . . . . . . . . 48 Results . . . . . . . . . . . . . . . . . . . . . . . . . . . . . . . . . . . . . . . . . . . . . . . . . . . . . . . . . . . . 49 Timber-Related Jobs and Income . . . . . . . . . . . . . . . . . . . . . . . . . . . . . . . . . . . . . . . . . 49 Forest Service and BLM effects . . . . . . . . . . . . . . . . . . . . . . . . . . . . . . . . . . . . . . . . . . 50 Nontimber and Recreation-Related Jobs and Income . . . . . . . . . . . . . . . . . . . . . . . . . . 56 Nontimber Forest Industries . . . . . . . . . . . . . . . . . . . . . . . . . . . . . . . . . . . . . . . . . . . . . 56 Recreation . . . . . . . . . . . . . . . . . . . . . . . . . . . . . . . . . . . . . . . . . . . . . . . . . . . . . . . . . . . 57 Discussion . . . . . . . . . . . . . . . . . . . . . . . . . . . . . . . . . . . . . . . . . . . . . . . . . . . . . . . . . . . 57Chapter 10: Agency Jobs, Unit Reorganizations, and Budgets. . . . . . . . . . . . . . . . . . . . . . . 59 Agency Jobs . . . . . . . . . . . . . . . . . . . . . . . . . . . . . . . . . . . . . . . . . . . . . . . . . . . . . . . . . . 59 Expectations . . . . . . . . . . . . . . . . . . . . . . . . . . . . . . . . . . . . . . . . . . . . . . . . . . . . . . . . . . 60 Data Analysis . . . . . . . . . . . . . . . . . . . . . . . . . . . . . . . . . . . . . . . . . . . . . . . . . . . . . . . . . 60 Results and Discussion . . . . . . . . . . . . . . . . . . . . . . . . . . . . . . . . . . . . . . . . . . . . . . . . . 60 Unit Reorganizations . . . . . . . . . . . . . . . . . . . . . . . . . . . . . . . . . . . . . . . . . . . . . . . . . . . 60 Expectations . . . . . . . . . . . . . . . . . . . . . . . . . . . . . . . . . . . . . . . . . . . . . . . . . . . . . . . . . . 60 Data Analysis . . . . . . . . . . . . . . . . . . . . . . . . . . . . . . . . . . . . . . . . . . . . . . . . . . . . . . . . . 60 Results and Discussion . . . . . . . . . . . . . . . . . . . . . . . . . . . . . . . . . . . . . . . . . . . . . . . . . 61 Budgets . . . . . . . . . . . . . . . . . . . . . . . . . . . . . . . . . . . . . . . . . . . . . . . . . . . . . . . . . . . . 61 Expectations . . . . . . . . . . . . . . . . . . . . . . . . . . . . . . . . . . . . . . . . . . . . . . . . . . . . . . . . . . 61 Data Analysis . . . . . . . . . . . . . . . . . . . . . . . . . . . . . . . . . . . . . . . . . . . . . . . . . . . . . . . . . 65 Results . . . . . . . . . . . . . . . . . . . . . . . . . . . . . . . . . . . . . . . . . . . . . . . . . . . . . . . . . . . . 66 Discussion . . . . . . . . . . . . . . . . . . . . . . . . . . . . . . . . . . . . . . . . . . . . . . . . . . . . . . . . . . . 67Chapter 11: Payments to County Governments . . . . . . . . . . . . . . . . . . . . . . . . . . . . . . . . 69 Expectation . . . . . . . . . . . . . . . . . . . . . . . . . . . . . . . . . . . . . . . . . . . . . . . . . . . . . . . . . . 70 Data Analysis . . . . . . . . . . . . . . . . . . . . . . . . . . . . . . . . . . . . . . . . . . . . . . . . . . . . . . . . . 70 Results . . . . . . . . . . . . . . . . . . . . . . . . . . . . . . . . . . . . . . . . . . . . . . . . . . . . . . . . . . . . 70 Discussion . . . . . . . . . . . . . . . . . . . . . . . . . . . . . . . . . . . . . . . . . . . . . . . . . . . . . . . . . . . 70Chapter 12: Conclusion . . . . . . . . . . . . . . . . . . . . . . . . . . . . . . . . . . . . . . . . . . . . . . . . . . . . . 73 Introduction . . . . . . . . . . . . . . . . . . . . . . . . . . . . . . . . . . . . . . . . . . . . . . . . . . . . . . . . . . 73 Objective . . . . . . . . . . . . . . . . . . . . . . . . . . . . . . . . . . . . . . . . . . . . . . . . . . . . . . . . . . . . 73 Key Results . . . . . . . . . . . . . . . . . . . . . . . . . . . . . . . . . . . . . . . . . . . . . . . . . . . . . . . . . . 73Citations and References . . . . . . . . . . . . . . . . . . . . . . . . . . . . . . . . . . . . . . . . . . . . . . . . . . . . 77

vi — Oregon, Washington, and California Report
RepoRt FS/R6/pNW/2015/0006

Northwest Forest Plan – Socioeconomic Report
Oregon, Washington, and California Report — 1
Chapter 1: Introduction The Northwest Forest Plan (NWFP) was developed partly in response to the controversy over the harvest of old-growth forests in the Pacific Northwest. By the late 1980s and early 1990s, the controversy became a crisis as a series of lawsuits severely limited federal timber harvest in the Pacific Northwest. In response to the crisis, President Clinton held a summit in 1993 that led to his issuance of a mandate for federal land management and regulatory agencies to work together to develop a plan to resolve the conflict (Charnley et al. 2006). The result is the Northwest Forest Plan, approved in 1994, which amended Forest Service and Bureau of Land Management (BLM) land management plans to include strategies for forest management, economic development, and agency coordination.
One of the overarching goals of the Plan is balancing the need for forest protection with the need to provide a steady and sustainable supply of timber and nontimber resources in order to promote socioeconomic well-being in NWFP area communities. Plan monitoring is a required tool for determining the effectiveness of the Plan in meeting this and the other goals of the Plan. The purpose of this 20-year report is to inform the Regional Interagency Executive Committee (RIEC) and interested publics of the potential trends in socioeconomic well-being in the NWFP area.
Socioeconomic Monitoring QuestionsDuring the first decade of the NWFP (1994-2003), socioeconomic monitoring focused on evaluating two questions: are predictable levels of timber and nontimber resources available and being produced, and are local economies experiencing positive or negative changes that may be associated with federal forest management? The answers to both of these questions provide important information about socioeconomic well-being in the NWFP area. The 10-year socioeconomic monitoring module included collection of both primary and secondary data to answer the questions posed above about predictable levels of timber and nontimber resources and changes experienced by local economies.
In March 2006, the RIEC agreed upon new regional priorities and methodologies for NWFP monitoring. The
RIEC developed a new socioeconomic monitoring question: What is the status and trend of socioeconomic well-being? In order to answer this question, the RIEC specified periodic regional analysis of existing social, economic and agency data. Due to budgetary constraints, no new data was collected.
This 20-year report provides the data compiled in response to the RIEC’s modification of NWFP’s socioeconomic monitoring questions posed in the NWFP Record of Decision (ROD).1 The 20-year report also follows the RIEC’s direction to use existing data rather than a combination of existing data and primary research as was the protocol for the 10-year report. The aim of this report is to assemble the secondary data in a way that shows the potential trends in socioeconomic well-being in the area
Because over 40 percent of the land in the NWFP area is federally-managed (US Census 2011), monitoring data related to natural resource use shed light on potential relationships between socioeconomic data and federal land management actions. For example, employment in the wood products manufacturing industry is related to change in federal timber harvest. Agency employment is also related to change in federal timber harvest and to agency budgets. A better understanding of the relationships between socioeconomic data and federal land management actions allows land managers to make more informed and better natural resource management decisions that potentially affect socioeconomic well-being of neighboring communities. This information may also assist land managers in prioritizing work.
For the 20-year report, data on population, ethnicity, unemployment, employment, and personal income are charted. Data on quantifiable resource management activities on federal forest lands that contribute to social and economic well-being are also tracked. These include: timber, special forest products, grazing, minerals, and recreation. Lastly, data about agency budgets and employment levels, and agency revenue contributions to local governments are analyzed.
1The Record of Decision (ROD) is one of two key documents establishing policy and direction for the NWFP; the other document is the Standards and Guidelines (S&G).
RepoRt FS/R6/pNW/2015/0006
2 — Oregon, Washington, and California Report
Measuring socioeconomic well-being is controversial. As the authors of the 10-year report explain:
The notion of “well-being” has been widely discussed by social scientists, but it has not been rigorously defined at either conceptual or operational levels. Well-being is a concept based on how “the good life” is defined. While the concept has come to be used as a common expression, the characteristics of “the good life” may be different for people in difference social, cultural, and economic settings. Socioeconomic well-being reflects the general conditions of people’s lives, or the state of a social system that may include many dimensions of community life. Well-being is also defined on the basis of capabilities and achievements of individuals (Sen 1985) and on the social, cultural, and psychological needs of people and communities (Wilkinson 1991). Well-being is often used to represent general community welfare (Richardson and Christensen 1997) and has been assessed through socioeconomic status and community capacity (Doak and Kusel 1996). Studies of community well-being have focused on understanding the contribution of economic, social, cultural, and political components of a community in maintaining itself and fulfilling various needs of local residents (Christakopoulou et al. 2001, Kusel and Fortmann 1991) (as modified from Donoghue and Sutton 2006).
Although no definitive conceptual or operational definition of community socioeconomic well-being exists, it is accepted that measures of socioeconomic well-being should represent multiple dimensions of the human community, such as social, economic, and human concerns (Force and Machlis 1997). Employment instability can cause
hardships on individuals and families, as well as distress
in local and regional economies. Therefore, employment is
weighted as a primary factor determining socioeconomic
well-being within the NWFP area over the report period.
Methods and Data SourcesThe social and economic monitoring program assembles existing data to determine the status and trends in social and economic well-being in the NWFP area. Key social
and economic issues include: 1) the role and quantity of federal timber in the market; (2) federal agency obligations to communities near federal timberlands; and (3) the role forests play, especially federal forests, in local and regional economies. The program tracks demographic data as well as data on agency expenditures and forest-related resources to display potential trends. The data are not suitable for a statistically valid cause-and-effect analysis linking trends in socioeconomic well-being to natural resource management activities on federal lands.
The 20-year report builds on the analysis completed for the 10-year and 15-year reports and examines additional data through 2012. Annual data for all indicators in the time period were not always available. The data displayed in the 20-year report vary based on availability, consistency between years, and the need to present the analysis clearly and effectively to show recent social and economic trends. Comparisons of recent data to those in the previous reports are also discussed.
Most of the social and demographic monitoring was conducted at the county level. The data are mostly based on surveys conducted by the U.S. Census Bureau. The advantage of using this scale of information is that the data are available and affordable. On the other hand, counties are large and using data at this level often masks change in well-being occurring at the sub-county or community scale. Counties are also part of larger economies that characterize the NWFP area, and as such they show differences within these economies.
Not all data are available at the county-level. Much of the agency resource data are available only at the unit-level (i.e., forest or BLM district). Agency units may cross portions of multiple counties. Moreover, the temporal scales presented in this report necessarily vary due to data limitations. For example, agency recreation data are collected at regular intervals, but changes in sampling methodologies limit the ability to compare data across years to identify trends. Therefore, while some data are presented annually between 1995 and 2012 (e.g., timber harvests), some other data only cover a portion of the 20-year period since the adoption of the NWFP.

Northwest Forest Plan – Socioeconomic Report
Oregon, Washington, and California Report — 3
Economic Contributions of Federal Land Management Agencies
The 20-year report includes data on the economic contributions from federal land management agencies to counties in the NWFP area. These data are used to estimate how various resource outputs, uses and recreation opportunities affect jobs and income. They are closely related to other social data and the status and trends of socioeconomic well-being in the NWFP area.
The data for these indicators, and many of the other indicators discussed in the following chapters, come from Forest Service Regional and BLM State resource specialists, state and federal social and economic databases, and IMPLAN. Most of the agency data represent complete counts of the identified indicators such as timber harvest, agency employment, and budgets. Other data are based surveys such as recreation use. The survey data used as indicators are described in more detail in the relevant chapter.

RepoRt FS/R6/pNW/2015/0006
4 — Oregon, Washington, and California Report

Northwest Forest Plan – Socioeconomic Report
Oregon, Washington, and California Report — 5
Chapter 2: Key FindingsIn 2006, the Regional Interagency Executive Committee (RIEC) agreed upon a new socioeconomic monitoring question that replaced the questions posed for the 10-year report. In order to maintain consistency, the 20-year report uses the same methods to answer the question: What is the status and trend of socioeconomic well-being?
• Totalemploymentinforestproducts
industries,includinglogging,primaryand
secondarywoodmanufacturinghasbeen
variableandhasdeclinedoverallbyforty
percentsince2001(figure2-2).However,
employmentinforestproductsindustries
relatedtoForestServiceandBLMharvests
increasedbetween2001and2012.Timber
harvest and related employment have been key
issues in forest policy discussions since the
early 1970s. Total employment in these sectors
has a history of increasing and decreasing in
the NWFP area. Timber employment is closely
related to timber harvest.
• Between2001and2012,overallagency
employmentdeclined(figure2-1).
Employment is a foundation of socioeconomic
well-being. Agency employment, jobs supported
by agency timber harvest and recreational
activities are especially important. Data
show that recreation-related employment was
substantial during the same period.
• From2005to2009,timberharvestlevels
declinedsharply.Timberharvestedfrom
federalforestsincreasednearly70percent
between2009and2012. Most of this decline
can be attributed to reductions in timber harvests
on non-federal lands. After 2009, timber
harvests levels increased. Timber harvested from
federal forests has reached volumes not seen
since shortly after the adoption of the NWFP.
However, timber harvested from non-federal
forests remains below the 1995 to 2005 average.
Between 2001 and 2009, timber offered for sale on federal lands more than doubled, and timber harvest in 2009
was 60 percent greater than that of 2001 (figure 2-3). In 2012, timber offered for sale was approximately 80 percent of probable sale quantity (PSQ), and timber harvest was also approximately 80 percent of PSQ. From 2001 to 2012, the percentage of timber harvested on federal lands compared to total harvest on all ownerships increased from 3.2 to 9.6 percent.
• Inthepastdecade,thepopulationof
nonmetropolitancountieshasincreasedmore
slowlythanmetropolitancounties(figure
2-4).Population size is often an indicator of
economic diversity. Most people in the NWFP
area live in counties that the U.S. Department of
Labor describes as metropolitan. These counties
contain core urban areas of 50,000 or more
population.
• Theeffectsofchangesintimberharvest
andrelatedemploymentonwell-beingare
likelymorepronouncedinnonmetropolitan
counties. Nonmetropolitan counties are less
diverse economically and more strongly tied
to the wood products industry. Most of the
timber harvested in the NWFP area comes
from nonmetropolitan counties. Although
forest products manufacturing employment
is about equally split between metropolitan
and nonmetropolitan counties, it accounts for
roughly 10 percent of total employment in
nonmetropolitan counties and only 1 percent in
metropolitan counties. In periods of economic
hardships, such as the one that began in 2008,
federal lands and federal agencies played
especially important roles in contributing to
socioeconomic well-being in rural America.
While timber harvested on NFS and BLM
lands declined in 2008, the change was modest
compared to the decline in harvests from non-
federal lands. Timber harvested from NFS and
BLM lands reportedly kept mills running during
that difficult year.
• Recreationvisitorspendingisthelargest
singlesourceofeconomicactivityassociated

RepoRt FS/R6/pNW/2015/0006
6 — Oregon, Washington, and California Report
withNFSandBLMmanagementinthe
NWFParea.Millions of visitors recreate on
NFS and BLM-managed lands in the NWFP
area. The annual number of visits is estimated at
approximately 20 million – with 5.3 million to
BLM-managed lands and 14.7 million to NFS
lands in the NWFP area (see chapter 7). Visitors
to NFS and BLM-managed lands in the NWFP
area spend money on lodging, restaurants,
souvenirs, and other trip-related expenses. This
spending contributes to economic activity in the
Figure 2-1: Employment supported by agency programs in the NWFP area
Figure 2-2: Timber-related employment and timber harvest on all ownerships in the NWFP area
0
2,000
4,000
6,000
8,000
10,000
12,000
FS-BLM agencyemployment 2001
FS-BLM agencyemployment 2012
Timber harvestedFS-BLM lands 2001
Timber harvestedFS-BLM lands 2012
Recreation visits toFS-BLM 2012
Num
ber o
f job
s
Direct jobs Indirect and induced jobs
-
1,000
2,000
3,000
4,000
5,000
6,000
7,000
8,000
9,000
10,000
0
20000
40000
60000
80000
100000
120000
MM
BF
Num
ber o
f job
s
Harvest related employment Harvest volume
Employment data not available pre-2001
NWFP area. In 2012, NFS and BLM recreation
visitors supported approximately 6,900 direct
jobs and 2,900 indirect and induced jobs in the
NWFP area (figure 2-1).
In order to make the status and trends available to a
wide range of stakeholders, the monitoring team is creating a webpage on reo.gov that contains all of the socioeconomic monitoring data related to well-being. This responds to stakeholder requests for more transparency from the Forest Service.

Northwest Forest Plan – Socioeconomic Report
Oregon, Washington, and California Report — 7
Figure 2-1: Employment supported by agency programs in the NWFP area
Figure 2-2: Timber-related employment and timber harvest on all ownerships in the NWFP area
0
2,000
4,000
6,000
8,000
10,000
12,000
FS-BLM agencyemployment 2001
FS-BLM agencyemployment 2012
Timber harvestedFS-BLM lands 2001
Timber harvestedFS-BLM lands 2012
Recreation visits toFS-BLM 2012
Num
ber o
f job
s
Direct jobs Indirect and induced jobs
-
1,000
2,000
3,000
4,000
5,000
6,000
7,000
8,000
9,000
10,000
0
20000
40000
60000
80000
100000
120000
MM
BF
Num
ber o
f job
s
Harvest related employment Harvest volume
Employment data not available pre-2001
Figure 2-3: Total timber offered for sale, timber harvest and probable sale quantity (PSQ) on federal lands
Figure 2-4: Population change in NWFP area, 1999-2012
0
100
200
300
400
500
600
700
800
900
1,000
MM
BF
Total harvest Total offer PSQ
-
2,000,000
4,000,000
6,000,000
8,000,000
10,000,000
12,000,000
14,000,000
Popu
latio
n
NWFP Area Metropolitan Total Nonmetropolitan Total

RepoRt FS/R6/pNW/2015/0006
8 — Oregon, Washington, and California Report
Figure 2-3: Total timber offered for sale, timber harvest and probable sale quantity (PSQ) on federal lands
Figure 2-4: Population change in NWFP area, 1999-2012
0
100
200
300
400
500
600
700
800
900
1,000
MM
BF
Total harvest Total offer PSQ
-
2,000,000
4,000,000
6,000,000
8,000,000
10,000,000
12,000,000
14,000,000
Popu
latio
n
NWFP Area Metropolitan Total Nonmetropolitan Total

Northwest Forest Plan – Socioeconomic Report
Oregon, Washington, and California Report — 9
Chapter 3: Timber terminology of “allowable” was changed to “probable” to reflect some uncertainty in calculations for the various alternatives in the Plan, but PSQ is otherwise comparable to ASQ. PSQ is a term used to describe harvest levels that can be maintained without a decline over the long term, and includes only scheduled or regulated yields from the matrix or adaptive management areas and does not include harvests from reserves or administratively withdraw areas (USDA and USDI 1994a). The PSQ represents the anticipated annual flow of timber from this regulated forest; using the average of the anticipated flow during a 10-year period. The current PSQ from national forests and BLM districts under the NWFP is 805 million board feet.
While producing a predictable supply of timber for economies at various scales, the Plan also aimed to maintain ecological sustainability. A second objective for timber harvest under the Plan was to use it as a tool for managing vegetation to achieve ecosystem management objectives, such as promoting development of late-successional and old-growth habitat. The Plan did not quantify the amount of timber harvest produced as a result of management activities in late-successional and riparian reserves. Federal agencies have since completed late-successional reserve assessments that examine reserve conditions and estimate the acreage in which timber harvesting would promote late-successional forest habitat, and use scientific research to determine how to best accelerate late-successional forest development by using harvest treatments (as modified from Charnley et al. 2006).
Timber harvested from reserves contributes to the total volume offered for sale by the agencies and to socioeconomic well-being, but because timber volume produced through treatments in the reserves does not constitute a long-term, sustainable supply of timber, it does not contribute to PSQ volume (USDA and USDI 1994a: 3&4-263).
A shorter term perspective on predictability in timber supply focuses on annual accomplishments providing an annual flow of timber from federal forests to support stable employment. Whether the volume of timber offered for sale by the agencies is identified as PSQ volume or volume produced from a treatment in a late-successional reserve is
“During the 1990s, much of the discussion about the Plan’s socioeconomic goals focused on timber production (Charnley et al. 2006).” A prevailing concern was that the Plan’s cutbacks in federal timber harvesting would negatively affect local forest communities in the Pacific Northwest. Many of these communities had residents who worked in the timber industry as loggers, mill workers, secondary wood products manufacturers, and transporters of wood and wood products. Any reduction in federal timber harvest volumes had the potential to incur social and economic impacts on timber workers and their families in the region (Charnley et al. 2006). This chapter focuses on data in timber production in the NWFP area.
One objective for timber harvest under the Plan was to meet “…the need for a sustainable supply of timber and other forest products that will help maintain the stability of local and regional economies, and contribute valuable resources to the national economy, on a predictable and long-term basis” (USDA and USDI 1994b: 26). “The concept of predictability, as it applies to timber production on federal lands, has both a long- and a short-term perspective. Long-term predictability is linked to a sustainable timber flow, which is tied to the concept of a regulated forest (Charnley et al. 2006).” One of the methods the Forest Service and the Bureau of Land Management (BLM) use for calculating timber production is allowable sale quantity (ASQ), which is the quantity of timber that may be sold from lands identified as suitable for timber production.2 During the 1980s, the ASQ from the national forests and the BLM districts in the NWFP area averaged 4.5 billion board feet annually (USDA and USDI 1994a).
Harvest levels associated with the Plan are described using Probable Sale Quantity (PSQ)3 rather than ASQ. The
2The definition of allowable sale quantity (ASQ) is found in the Forest Service Manual (FSM) 1900 and Forest Service Handbook (FSH) 2409.13. The ASQ is the quantity of timber that may be sold from the area of suitable land covered by the forest plan for a time period specified by a plan. This allowable sale quantity (ASQ) is usually expressed on an annual basis as the “average annual allowable sale quantity.”
3The Probable Sale Quantity (PSQ) is defined in the Final Supplemental Environmental Impact Statement for Amendment to the Survey & Manage, Protection Buffer, and other Mitigation Measures Standards and Guidelines Volume 1 – Chapter 1-4, November 2000, p 479.

RepoRt FS/R6/pNW/2015/0006
10 — Oregon, Washington, and California Report
less important in terms of supporting stable employment in the short-term. The source, however, affects whether the volume can be sustained on a long-term basis. For example, thinning in reserves may produce volume over the short term, but it cannot sustain long-term production.
This chapter examines data in the total volume of timber offered for sale by the agencies. These data are compared to the total PSQ. Some interpretation of the data is also provided. Predictability of future volume offered for sale and specific features of timber sales such as their size and type, and qualifications for bidding on the sales are not assessed for purposes of this monitoring report.
Expectations During the first two years of the Plan, the volume of timber sales from NWFP area forests were expected to differ from the PSQ because federal agencies needed time to complete the surveys and assessments required by the Plan. The agencies also needed to prepare new sales consistent with Plan standards and guidelines (USDA and USDI 1994a: 3&4-269). In 1995, agencies were expected to offer for sale 60 percent of the estimated PSQ (USDA and USDI 2004: 221). The next year, agencies were expected to offer for sale 80 percent of the estimated PSQ. After that, agencies expected that the average annual timber volume offered for sale from matrix lands and adaptive management areas would be consistent with PSQ levels. (as modified from Charnley et al. 2006). The PSQ estimates under the NWFP were based on the expectation that most of the harvest volume would come from regeneration harvest of old forest stands in matrix and some adaptive management areas.
“The Forest Ecosystem Management Assessment Team (FEMAT) noted that achieving predictable and sustainable timber sales from federal forests under the Plan would be difficult, if not impossible (Johnson et al. 1993: 23 as modified from Charnley et al. 2006).” For a more complete discussion of expectations, see Vol. II, Ch. 2 of the 10-year report (Charnley et al. 2006).
Data AnalysisThe Forest Service and BLM maintain corporate timber-volume reports on: volume of timber offered for sale,
volume of timber sold, and volume of timber harvested. Volume offered is the amount of timber that the federal agencies make available for sale in a given fiscal year (October 1-September 30). Not all timber sales that agencies offer are purchased; therefore, volume of timber sold is the timber that actually receives a bid from a qualified purchaser and is awarded. Once sales are sold, purchasers generally take two to three years to harvest. As a result, the volumes sold and harvested in a given year are rarely the same. Socioeconomic impact analyses use volume harvested, because it is the timber-related value that enters the economy. It is the measure of the timber from federal forests that contributes to employment in a given year.
This chapter uses volume of timber offered for sale as an indicator of intended accomplishment by the agencies. Volume offered for sale measures all volume made available for sale by the agencies, including volume offered from late-successional and riparian reserves, and volume not meeting forest utilization standards. As described above, the PSQ component of that volume is the amount of timber offered for sale from matrix lands and adaptive management areas. In this report, the volume that applies to PSQ is not identified separately. The Forest Service data on the volume of timber offered for sale, sold, and harvested are expressed in terms of long logs. The BLM timber data are expressed as short logs. Long logs are scaled to 32 feet for timber volume measurement and short logs are scaled to 16 feet. BLM short log volume is converted to long log volume using a conversion factor equal to 0.825 times the short log volume.
Results The timber industry became a major economic force in the NWFP area in the mid-nineteenth century. The industry had a dominant role in the region’s economy until the 1960s. During the past half century, the timber industry’s importance declined relative to the region’s economy. An examination of the past decade reveals continued shifts in the timber industry. In 2001, there were more than 100,000 jobs in the NWFP area in timber-related sectors, including logging, primary and secondary processing. By 2012, however, the number of jobs in those sectors dropped by nearly 40 percent to 65,000 jobs (table 9-1).

Northwest Forest Plan – Socioeconomic Report
Oregon, Washington, and California Report — 11
Nonmetropolitan counties experienced particularly dramatic declines in the timber industry (table 9-1). In 2001, more than 12 percent of jobs in nonmetropolitan counties were in the timber sector. In 2012, that percentage had declined to only 3 percent. During the same period, however, total nonmetropolitan employment in the NWFP area increased. Declines in the timber industry were more than offset by growth in other sectors. Although overall employment increased, changes in the relative importance of various sectors changed. If new jobs do not match existing worker skills, then the changes may increase unemployment. The mismatch between skills and job requirements may be exacerbating unemployment in nonmetropolitan counties, where the unemployment rate now exceeds the metropolitan unemployment rate in all three NWFP area states (figure 8-7).
Changes to timber harvests have not been uniform across states. NWFP counties in Oregon have seen only a modest decrease in total timber harvest volume. In 1995, 3.8 billion board feet were removed from NWFP counties in Oregon across all ownerships. In 2012, 3.5 billion board feet
were removed. In contrast, both Washington and California saw timber harvests on all ownerships in the NWFP area decline by about 40 percent (figure 3-1).
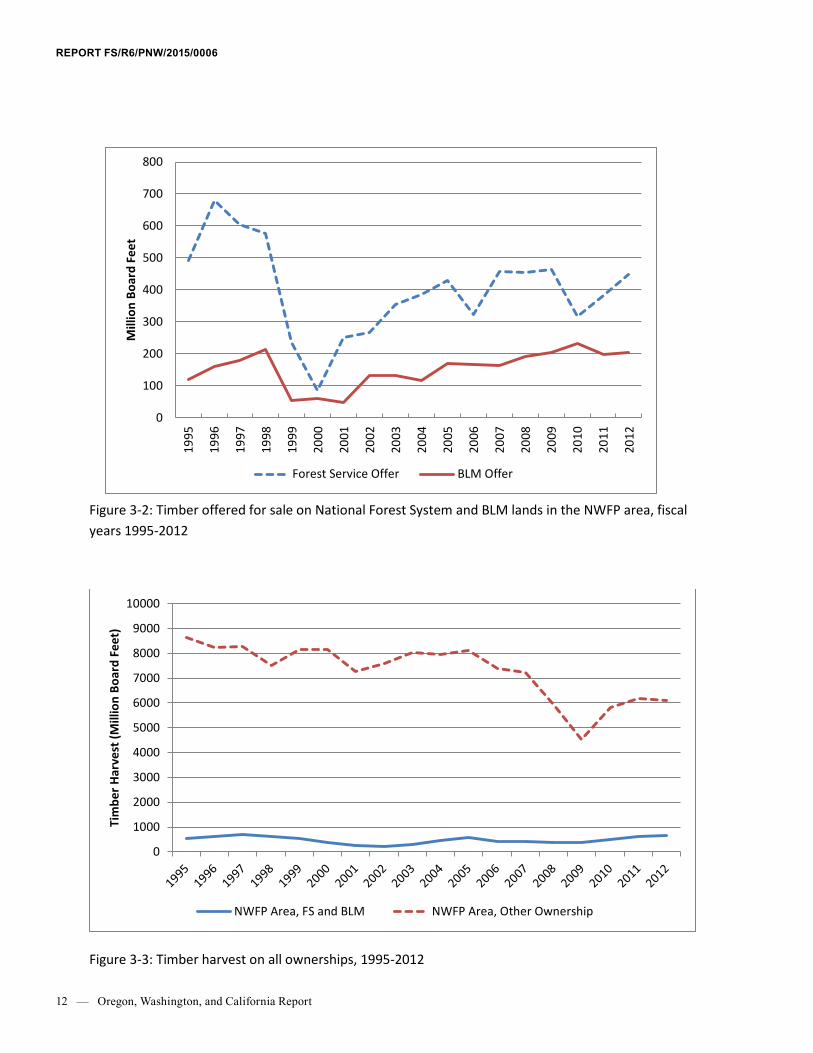
Following a steep decline in federal timber harvests in the late 1990s and early 2000s, harvest volumes increased through 2005 (figure 3-1). However, the housing market crash decreased demand for wood products in the construction industry. As the housing market recovered, timber harvests on federal lands in the NWFP area increased between 2008 and 2012 (figure 3-1). Timber harvest on federal lands are often important to communities near public lands even though federal timber harvests account for only approximately 10 percent of total harvest in the NWFP area (figure 3-3).
In addition to federal regulation and land management, private forces influence timber production in the NWFP area. Globalization has also affected timber markets in the NWFP area. Imports of foreign timber increased from only 12 million board feet in 1995 to 116 million board feet in 2012. In contrast, exports of NWFP timber declined from 1.4 billion board feet in 1995 to 1.1 billion board feet in
Figure 3-1: Timber Harvest by State in NWFP area, All Ownerships
0
1
2
3
4
5
6
7
8
9
10
1995
1996
1997
1998
1999
2000
2001
2002
2003
2004
2005
2006
2007
2008
2009
2010
2011
2012
Billi
on B
oard
Fee
t
CA NWFP Area
OR NWFP Area
WA NWFP Area
NWFP Total
0
100
200
300
400
500
600
700
800
1995
1996
1997
1998
1999
2000
2001
2002
2003
2004
2005
2006
2007
2008
2009
2010
2011
2012
Mill
ion
Boar
d Fe
et
Forest Service Offer BLM Offer
RepoRt FS/R6/pNW/2015/0006
12 — Oregon, Washington, and California Report
Figure 3-1: Timber Harvest by State in NWFP area, All Ownerships
0
1
2
3
4
5
6
7
8
9
10
1995
1996
1997
1998
1999
2000
2001
2002
2003
2004
2005
2006
2007
2008
2009
2010
2011
2012
Billi
on B
oard
Fee
t
CA NWFP Area
OR NWFP Area
WA NWFP Area
NWFP Total
0
100
200
300
400
500
600
700
800
1995
1996
1997
1998
1999
2000
2001
2002
2003
2004
2005
2006
2007
2008
2009
2010
2011
2012
Mill
ion
Boar
d Fe
et
Forest Service Offer BLM Offer
Figure 3-2: Timber offered for sale on National Forest System and BLM lands in the NWFP area, fiscal years 1995-2012
Figure 3-3: Timber harvest on all ownerships, 1995-2012
Figure 3-4: Jobs per million board feet of harvest on all ownerships, 2001-2012
0
1000
2000
3000
4000
5000
6000
7000
8000
9000
10000
Tim
ber H
arve
st (M
illio
n Bo
ard
Feet
)
NWFP Area, FS and BLM NWFP Area, Other Ownership
0.00
0.50
1.00
1.50
2.00
2.50
3.00
3.50
4.00
4.50
5.00
Jobs
per
mill
ion
boar
d fe
et
Logging jobs per MMBF Primary wood mfg. jobs per MMBF
2005
data
are n
ot a
vaila
ble

Northwest Forest Plan – Socioeconomic Report
Oregon, Washington, and California Report — 13
2012 (figure 9-6). While global competition generally makes consumers better off through lower prices and a wider variety of available goods, some domestic firms become less profitable. Changes in the global marketplace, therefore, affect individuals and firms in the NWFP area.
Pressure from competition may induce efficiencies in the timber sector. Fewer logging and primary wood manufacturing employees are needed for each million board feet of timber (figure 3-4). This suggests employees are becoming more productive and the timber sector is becoming less labor-intensive. Increased labor productivity helps to explain the increase in average annual real income in timber-related sectors between 2001 and 2012 (figure 9-3). Therefore, while fewer people are employed in the timber industry, the individuals in that sector are typically better compensated than they were 15 years ago.
Discussion Although federal agencies are not meeting PSQ volumes, timber supplies from agency lands are becoming more stable and predictable compared to the early years of Plan implementation. Since the 10-year report, the volume offered for sale from agency lands has continued to increase
gradually (figure 3-5). The drop in timber harvesting following 2009 resulted from broader economic conditions including the national downturn in building construction (figure 3-6). The 10-year report states that shortfalls in timber-sale volumes offered after 1998 are believed to be related primarily to (1) implementing the survey and manage species standards and guidelines after a lawsuit brought by the ONRC; (2) the Pacific Coast Federation of Fishermen’s Associations et al. v. National Marine Fisheries Service lawsuit, which constrained timber sales that required biological opinions and limited harvest in watersheds with Endangered Species Act–listed anadromous fish; and (3) protests and appeals on individual timber sales (USDA and USDI 2004: 221–222). The lawsuits described above caused numerous timber sales to be enjoined. And the contentious issue of logging old growth has caused appeals and litigation over proposed sales that include old growth (Dombeck and Thomas 2003, Thomas 2003).
Lawsuits, the implementing of survey and manage species standards and guidelines, protests, and appeals led to a major drop in regeneration harvest timber sales beginning in 1999 (USDA and USDI 2004: 223). Instead of regeneration harvesting, methods defined as partial removal
Figure 3-2: Timber offered for sale on National Forest System and BLM lands in the NWFP area, fiscal years 1995-2012
Figure 3-3: Timber harvest on all ownerships, 1995-2012
Figure 3-4: Jobs per million board feet of harvest on all ownerships, 2001-2012
0
1000
2000
3000
4000
5000
6000
7000
8000
9000
10000
Tim
ber H
arve
st (M
illio
n Bo
ard
Feet
)
NWFP Area, FS and BLM NWFP Area, Other Ownership
0.00
0.50
1.00
1.50
2.00
2.50
3.00
3.50
4.00
4.50
5.00
Jobs
per
mill
ion
boar
d fe
et
Logging jobs per MMBF Primary wood mfg. jobs per MMBF
2005
data
are n
ot a
vaila
ble

RepoRt FS/R6/pNW/2015/0006
14 — Oregon, Washington, and California Report
Figure 3-5: Timber offered by the Forest Service and BLM compared to PSQ in the NWFP area, 1995-2012
Figure 3-6: Total harvest compared to total offer on National Forest System and BLM lands in the NWFP area, 1995-2012
0
100
200
300
400
500
600
700
800
900
1000
Mill
ion
Boar
d Fe
et
Total Offer PSQ
0
100
200
300
400
500
600
700
800
900
1995
1996
1997
1998
1999
2000
2001
2002
2003
2004
2005
2006
2007
2008
2009
2010
2011
2012
Mill
ion
Boar
d Fe
et
Total Harvest Total Offer
Figure 3-5: Timber offered by the Forest Service and BLM compared to PSQ in the NWFP area, 1995-2012
Figure 3-6: Total harvest compared to total offer on National Forest System and BLM lands in the NWFP area, 1995-2012
0
100
200
300
400
500
600
700
800
900
1000M
illio
n Bo
ard
Feet
Total Offer PSQ
0
100
200
300
400
500
600
700
800
900
1995
1996
1997
1998
1999
2000
2001
2002
2003
2004
2005
2006
2007
2008
2009
2010
2011
2012
Mill
ion
Boar
d Fe
et
Total Harvest Total Offer

Northwest Forest Plan – Socioeconomic Report
Oregon, Washington, and California Report — 15
were used on over 80 percent of the acres harvested during the first nine years of the Plan (Baker et al. 2005) lowering expected yields.
Avoiding harvest in areas occupied by rare species has also contributed to the drop. When pre-disturbance surveys indicated the presence of numerous survey and
manage species sites, potential timber-sale areas were often abandoned in favor of sites less likely to contain survey and manage species because of the added costs in time and money of trying to complete a sale (USDA and USDI 2004: 223–224) (as modified from Charnley et al. 2006).

RepoRt FS/R6/pNW/2015/0006
16 — Oregon, Washington, and California Report

Northwest Forest Plan – Socioeconomic Report
Oregon, Washington, and California Report — 17
Chapter 4: Special Forest Products Special forest products include food, such as mushrooms and berries, medicinal plants and fungi, floral greenery, wildflowers, Christmas trees, and fuelwood. Special forest products are harvested from both Bureau of Land Management and National Forest Systems lands in the NWFP area. Special forest products may be harvested for commercial or personal use. Some individuals earn income through harvesting and selling special forest products. Other individuals and groups harvest special forest products for subsistence, cultural heritage, family traditions, recreation or spiritual fulfillment. Since the late 1980s, interest in special forest products has grown considerably. Not only has consumer demand increased domestically and internationally, but the volume of special forest products harvested has also increased.
In the Pacific Northwest, more than 200 species of special forest products are harvested on private and public lands (Alexander and Fight 2003: 283-384). The growing recognition of the economic and ecological importance of these special forest products has coincided with a decline in the timber industry and associated job loss (Lynch and McLain 2003: 5-6). These trends have further piqued interest in special forest products.
Special forest products have long been important to Native American Indian tribes for subsistence, medicine, cultural uses, construction, art, and trade (Lynch and McLain 2003: 4, Weigand 2002: 57-58). Special forest products including fuelwood are still valued by the tribes and non-tribal people for cultural, recreational, subsistence, and commercial uses. Among the most valued wild and edible species in the Pacific Northwest are huckleberries and mushrooms. Mushrooms of particular value include: morels, chanterelles, boletes, and matsutake. Floral greens are also of major economic importance. These include: salal (Gaultheria shallon Pursh), evergreen huckleberry (Vaccinum ovatum Pursh), Oregon grape (Mahonia nervosa (Pursh) Nutt.), western red cedar (Thuja plicata Donn ex D. Don), western swordfern (Polystichum munitum (Kaulfuss) K. Presl), beargrass (Nolina Michx.), pine cones, mosses, and coniferous boughs such as noble fir (Abies procera Rehd.) (Alexander and McLain 2001: 61-63, Weigand 2002).
Although most commercial harvesters in the Pacific Northwest do not rely on special forest products as a sole source of income, these products provide supplemental and seasonal sources of income that contribute to household economies. They also provide economic opportunities for Southeast Asian and Latino immigrants to the Pacific Northwest. The income from special forest products has become particularly important as the population of immigrants has increased over the last decade, while employment opportunities have been limited (Brown and Marin-Hernandez 2000, Lynch and McLain 2003: 6) (as modified from Charnley et al. 2006).
Expectations Opportunities for harvesting special forest products were expected to continue under the Plan, however, restrictions on quantity and methods of harvesting in certain areas were expected. Resource values, special status plants and animals, and resource sustainability would be protected, with use restrictions in areas designated for northern spotted owl (Strix occidentalis caurina) habitat and protected areas (USDA and USDI 1994a: 3&4-277). NWFP standards and guidelines call for evaluating the effects of harvest activities on late-successional reserve objectives (USDA and USDI 1994b: C-18). Harvest restrictions in late-successional reserves could be implemented to prevent adverse effects. Fuelwood gathering was highly restricted in late-successional reserves and managed late-successional areas (USDA and USDI 1994b: C-16). Fuelwood cutting in riparian reserves was prohibited, unless required to attain Aquatic Conservation Strategy objectives (USDA and USDI 1994b: C-31–C-32) (as modified from Charnley et al. 2006).
Changes in special forest product harvesting practices may also result from changes in consumer tastes and preferences, cultural and family traditions, and federal land management decisions.
Data AnalysisThe special forest products data are reported and discussed separately for the Forest Service and the BLM because the two agencies categorize and measure individual special forest products differently and track them for different time

RepoRt FS/R6/pNW/2015/0006
18 — Oregon, Washington, and California Report
periods. The BLM data are primarily for the Salem, Eugene, Roseburg, Medford and Coos Bay districts. Data from the Lakeview District are also included because they are partially in the NWFP area and are difficult to separate from the non-NWFP area components.
The Forest Service data are for NWFP area national forests. The Oregon data include all of the Deschutes, Okanogan and Winema National Forests even though parts of these forests are outside of the NWFP area. The data exclude the California national forests in the NWFP area, because the data for Region 5 were not in a format that could be readily used. The NWFP area national forests in California are expected to follow the trends found in the part of the NWFP area in Oregon and Washington. Additional data on special forest products are available in Appendix B of the 10-year report.
Due to the diverse range of products harvested, estimating the economic contribution of special forest products in the NWFP area is difficult. Since many special forest products are collected for subsistence or personal consumption, the economic value of special forest products is not captured in market transactions. One estimate suggests that, across the United States, special forest products account
for billions of dollars of economic activity (McLain and Jones 2005).
Bureau of Land Management Results and DiscussionThe BLM tracks special forest products in the Timber Sale Information System. The Agency summarizes the data annually in a publication called BLM Facts. Similar to the Forest Service, the data are available for several categories of convertible-to-timber products such as lumber and chips and nonconvertible products. The 10-year report uses state-level data from Oregon and Washington; however, scientists believe that these data represent special forest product harvests primarily from the five western Oregon BLM districts in the NWFP area and the Prineville District (Roche 2004), because little special forest product harvesting occurs on BLM districts east of the Cascades (as modified from Charnley et al. 2006).
Fewer special forest products are harvested on BLM-managed lands in the NWFP area; however, there are several major products. Collection of mushrooms increased from 243,000 pounds in 2004 to 377,000 pounds in 2012. Floral and greenery harvesting grew from 772,000 pounds to 1.1
Figure 4-1: Value of special forest products from BLM lands in the NWFP area, fiscal years 2004-2012
Figure 4-2: Amounts of special forest products sold from BLM lands in the NWFP area, fiscal years 2004-2012
$- $20,000 $40,000 $60,000 $80,000
$100,000 $120,000
Valu
e (n
omin
al d
olla
rs)
FY2004 FY2005 FY2006 FY2007 FY2008 FY2009 FY2010 FY2011 FY2012
- 2,000,000 4,000,000 6,000,000 8,000,000
10,000,000 12,000,000 14,000,000 16,000,000
Amou
nt (u
nits
var
y by
pro
duct
)
FY2004 FY2005 FY2006 FY2007 FY2008 FY2009 FY2010 FY2011 FY2012

Northwest Forest Plan – Socioeconomic Report
Oregon, Washington, and California Report — 19
Figure 4-1: Value of special forest products from BLM lands in the NWFP area, fiscal years 2004-2012
Figure 4-2: Amounts of special forest products sold from BLM lands in the NWFP area, fiscal years 2004-2012
$- $20,000 $40,000 $60,000 $80,000
$100,000 $120,000
Valu
e (n
omin
al d
olla
rs)
FY2004 FY2005 FY2006 FY2007 FY2008 FY2009 FY2010 FY2011 FY2012
- 2,000,000 4,000,000 6,000,000 8,000,000
10,000,000 12,000,000 14,000,000 16,000,000
Amou
nt (u
nits
var
y by
pro
duct
)
FY2004 FY2005 FY2006 FY2007 FY2008 FY2009 FY2010 FY2011 FY2012
Figure 4-3: Total value of special forest products sold from BLM lands in the NWFP area, fiscal years 2004-2012
Figure 4-4: Value of special forest products sold from National Forest System lands in the NWFP area, 2002-2012
$-
$50,000
$100,000
$150,000
$200,000
$250,000
Tota
l Val
ue (n
omin
al d
olla
rs)
$0
$200,000
$400,000
$600,000
$800,000
$1,000,000
$1,200,000
$1,400,000
$1,600,000
Prod
uct V
alue
(nom
inal
val
ues)
2002 2003 2004 2005 2006 2007 2008 2011 2012

RepoRt FS/R6/pNW/2015/0006
20 — Oregon, Washington, and California Report
million pounds over this period (figure 4-2). Like NFS lands in the NWFP area, the harvesting of boughs on BLM lands declined markedly between 2004 and 2012 (figure 4-2).
On BLM-managed lands in the NWFP area, most of the value (96percent) of special forest product permits results from the harvesting of boughs, floral and greenery, fuelwood, and mushrooms (figure 4-1). As with NFS lands in the NWFP area, this distribution of value is comparable to the 2004 distribution. The total value of special forest products removed from BLM lands in the NWFP area is significantly lower than the value of special forest products removed from NFS lands in the NWFP area (figure 4-3 and figure 4-5).
Forest Service Results and DiscussionData suggest that the harvest of certain special forest products on National Forest System lands in the NWFP area has declined since 2002. In particular, harvesting of bark, grasses, herbs, mosses, and limbs/boughs declined (figure 4-6). Data show, however, harvesting of some socially and
Figure 4-3: Total value of special forest products sold from BLM lands in the NWFP area, fiscal years 2004-2012
Figure 4-4: Value of special forest products sold from National Forest System lands in the NWFP area, 2002-2012
$-
$50,000
$100,000
$150,000
$200,000
$250,000
Tota
l Val
ue (n
omin
al d
olla
rs)
$0
$200,000
$400,000
$600,000
$800,000
$1,000,000
$1,200,000
$1,400,000
$1,600,000
Prod
uct V
alue
(nom
inal
val
ues)
2002 2003 2004 2005 2006 2007 2008 2011 2012
economically meaningful special forest products increased between 2002 and 2012. Collection of fuelwood, fruits, and berries approximately doubled during that period. Harvesting of mushrooms grew from 381,000 pounds in 2002 to 461,000 pounds in 2012 (figure 4-6). The number of Christmas trees cut on national forests in the NWFP area remained relatively steady over the ten-year period (figure 4-6).
In 2012, 99 percent of the value of special forest product permits from NFS lands in the NWFP area was from seven categories: foliage, fruits and berries, fuelwood, grass, limbs/boughs, mushrooms, and Christmas trees (figure 4-4). The remaining twelve special forest product categories contributed a small share of total value of permits. While this distribution was roughly similar in 2002, the value of fruits and berries increased dramatically. In 2002, about $4,000 of permits were issued. By 2012, this figure had grown to $76,000 (figure 4-4). The total value of special forest products removed from NFS lands in the NWFP area has fluctuated based on demand (figure 4-5).

Northwest Forest Plan – Socioeconomic Report
Oregon, Washington, and California Report — 21
Figure 4-5: Total value of special forest products sold from National Forest System lands in the NWFP area, 2002-2012
Figure 4-6: Amounts of special forest products sold and removed from National Forest System lands in the NWFP area, 2002-2012
$0
$500,000
$1,000,000
$1,500,000
$2,000,000
$2,500,000
$3,000,000
$3,500,000
2002 2003 2004 2005 2006 2007 2008 2011 2012
Tota
l val
ue (n
omin
al d
olla
rs)
0
200,000
400,000
600,000
800,000
1,000,000
1,200,000
Amou
nt (u
nits
var
y by
pro
duct
)
2002 2003 2004 2005 2006 2007 2008 2011 2012

RepoRt FS/R6/pNW/2015/0006
22 — Oregon, Washington, and California Report

Northwest Forest Plan – Socioeconomic Report
Oregon, Washington, and California Report — 23
Chapter 5: Grazing Grazing on NWFP area NFS and BLM lands, which are primarily located west of the Cascade Range, is minor compared to grazing on NFS and BLM lands in eastern Oregon and Washington and northeastern California. Grazing overall on public lands in the West has been declining as cow calf operations have shifted to the Midwest over the past several decades (Mitchell 2000). The Forest Service units in the NWFP area with the most grazing activity are the Okanogan-Wenatchee, Rogue-Siskiyou, and Klamath National Forests. The Medford District had the most grazing activity on the NWFP area BLM districts. There was little or no grazing on the other BLM districts in the NWFP area (as modified from Charnley et al. 2006).
ExpectationsUnder the NWFP, grazing was expected to continue with modifications to ensure consistency with the management objectives for all land use allocations. Some modifications of grazing practices in riparian reserves were expected (USDA and USDI 1994a: 3&4-276). In all land use allocations, sites where known and newly discovered populations of 10 mollusk species or subspecies and one vascular plant species listed in the ROD were to be protected from grazing (USDA and USDI 1994b: C-6). Grazing could be adjusted or eliminated in riparian and late-successional reserves if grazing would retard or prevent attaining reserve and Aquatic Conservation Strategy (aquatic strategy) objectives (USDA and USDI 1994b: C-17, C-33). New livestock handling or management facilities would be located outside of riparian reserves (USDA and USDI 1994b: C-33). Existing facilities could be moved if they prevent attaining aquatic strategy or reserve objectives (USDA and USDI 1994b: C-17, C-33). Modifications to grazing practices were expected to have consequences for individual permittees (USDA and USDI 1994a: 3&4-276) (as modified from Charnley et al. 2006).
Data Analysis The number of grazing allotments or leases, allotment
acres, grazing permittees, and animal unit months (AUMs) are potential indicators of livestock grazing on federal lands. The Forest Service and the BLM track the number and acres
of active and vacant grazing allotments. The Oregon BLM also tracks the number of grazing leases, but does not report the number of acres leased. The 10-year report monitors the number of active allotments and number of active allotment acres for the Forest Service. Vacant allotments were not included as most are being phased out. For the Forest Service, the number of grazing permittees was also monitored. A grazing permittee, or lessee, is any entity that has a grazing permit or lease for one or more allotments, such as an individual or cooperative with several members (Forest Service Manual [FSM] 2230.5). For the BLM, the number of grazing leases was monitored (as modified from Charnley et al. 2006).
Use of the allotment and lease data in the 10-year report is problematic because it is unclear whether the data uses the same definition for active, inactive and closed allotments, and leases for different years.
This 20-year report uses the permitted AUMs and authorized AUMs as indicators of range use. One AUM is the amount of forage a 1,000 pound mature cow and calf consume in a 30-day period, which is about 780 pounds of dry weight. Permitted AUMs are measures of planned capacity. Permitted AUMs are the number of AUMs that are specified on the grazing permit for the duration of the permit (FSM 2230.5). The permit is usually valid for ten years (FSM 2231.03). Permitted AUMs provides a comparable indicator for Forest Service and BLM grazing capacity. Comparing Forest Service and BLM permitted AUMs is more clear-cut than comparing the number of Forest Service active allotments and BLM active leases. Authorized AUMs are the amounts of forage permittees pay for and are authorized to use in a given year. Authorized AUMs indicate how much of the planned capacity is used annually. It is this amount that contributes to jobs and income.
The Forest Service AUM data used in this 20-year report are not completely comparable to that used in the 10-year report. The 10-year report uses district-level data; districts outside of the NWFP area were excluded. For the 20-year report, district level data were unavailable. Instead, this report uses forest-level data. The data for the entire Okanogan and Wenatchee, and Deschutes National Forests were used even though these forests are partially outside

RepoRt FS/R6/pNW/2015/0006
24 — Oregon, Washington, and California Report
of the NWFP area. Data from the Winema National Forest are excluded, because this forest was combined with the Fremont National Forest, which is completely outside of the NWFP area. The use of forest level data creates an upward bias of approximately 30 percent overall. Most of the bias is associated with the inclusion of the entire Okanogan and Wenatchee National Forests. One half of these forests’ AUMs are outside of the NWFP area, and these two forests contribute about 50 percent of the total authorized AUMs across all of the national forests in the NWFP area.
Like the Forest Service data, BLM data used in the 20-year report are not seamlessly comparable with the data used in the 10-year report. The 20-year report includes data for the Klamath Falls Resource Area, which is the portion of the Lakeview District in the NWFP area.
Results In northwest Oregon4 there is an average of 9,052 heads of cattle and calves in each county. In northeastern Oregon5 counties the average is 24,859 (NASS 2012). As a result, the economic contribution of grazing in the NWFP area is minor compared to eastern parts of these states. There are approximately 13,000 jobs in the cattle ranching and farming sector across the NWFP area, which is approximately 0.2 percent of overall employment in the area (IMPLAN 2012). The contribution of the cattle ranching and farming sector to income is even smaller - 0.04 percent - which indicates that livestock grazing jobs pay quite a bit less than other jobs in the NWFP area (IMPLAN 2012).
Employment in livestock grazing is more common in nonmetropolitan areas. More than half of the jobs (6,625) in the cattle ranching and farming sector are in nonmetropolitan NWFP area counties (IMPLAN 2012). The relative contribution to employment is much higher, due to the smaller labor market in nonmetropolitan counties. Approximately 0.8 percent of employment in
4As defined by the National Agricultural Statistics Service (NASS), includes Benton, Clackamas, Clatsop, Columbia, Lane, Lincoln, Linn, Marion, Multnomah, Polk, Tillamook, Washington, and Yamhill counties.
5As defined by NASS, includes Baker, Umatilla, Union, and Wallowa counties.
nonmetropolitan NWFP area counties is in cattle ranching and farming (IMPLAN 2012). Nevertheless, the overall contribution of grazing to economic activity remains minor across the NWFP area.
The employment and income data include all types of cattle ranching and farming. Federal forage constitutes a small share of this sector. In 2012, approximately 100,000 AUMs were authorized on NFS lands in the NWFP area (figure 5-1). This represents a small increase in authorized AUMs since 2006. However, authorized use has fluctuated considerably since 2006, suggesting that the increase does not reflect a trend.
In contrast to the increase in authorized AUMs on NFS lands in the NWFP area, authorized AUMs on BLM-managed lands decreased over the same period from about 15,000 to 10,000 AUMs (figure 5-2). Changes in authorized use may reflect both economic and ecological conditions, which influence both the demand for and availability of forage.
Discussion The 10-year report notes that a drop in grazing activity on NWFP area federal lands was expected based on the NWFP ROD standards and guidelines. The ROD directed managers to adjust or eliminate grazing to meet the objectives of the aquatic strategy and late-successional reserves. The 10-year report notes, however, that the NWFP was only one of several factors likely to be responsible for reduced grazing on federal forests from 1994 to 2003. Grazing in late-successional reserves still occurs, but has been adjusted in terms of location and timing so as to minimize ecological impacts. The season was shortened and the number of animals reduced.
A major factor reported as contributing to reduced forage availability on some federal lands is the reduction in timber program activity. Reduced timber activity leads to a decrease in transitory range, which is productive for grazing. Later seral stage forest does not offer the quality and abundance of livestock forage found in early seral stage habitat (Mackinnon 2005, Phelps 2003). Although the NWFP may have contributed to the decline in grazing on National Forest System and BLM lands between 1993 and

Northwest Forest Plan – Socioeconomic Report
Oregon, Washington, and California Report — 25
Figure 5-1: Permitted and authorized grazing on National Forest units in the NWFP area, 2006-2012
Figure 5-2: Permitted and authorized grazing on BLM units in the NWFP area, 2001-2012
0
20,000
40,000
60,000
80,000
100,000
120,000
140,000
160,000
2006 2007 2008 2009 2010 2011 2012
Anim
al U
nit M
onth
s (AU
Ms)
Permitted Authorized
-
5,000
10,000
15,000
20,000
25,000
30,000
2001 2002 2003 2004 2005 2006 2007 2008 2009 2010 2011 2012
Anim
al U
nit M
onth
s (AU
Ms)
Permitted Authorized

RepoRt FS/R6/pNW/2015/0006
26 — Oregon, Washington, and California Report
2002, agency grazing specialists report that other factors unrelated to the NWFP have had a greater effect (Mackinnon 2005, Phelps 2003).
In fact, Forest Service grazing specialists reported that the NWFP had little effect on grazing opportunity apart from causing some restrictions in riparian areas (Mackinnon 2005, Phelps 2003). Prolonged drought and Endangered Species Act (1973) requirements relating to anadromous fish in streams on allotments constrained grazing activity. Moreover, the reduced grazing on federal forest lands in the NWFP area was consistent with a nationwide decrease in the level of grazing on Forest Service and BLM managed
lands during the 1990s (Charnley and Langner 2001: 31, Mackinnon 2005).
Agency data presented in the 10-year report indicate that livestock grazing on National Forest System and BLM lands in the NWFP area decreased between the early 1990s and the early 2000s. Some decreases were expected because of management constraints in late-successional and riparian reserves under the ROD standards and guidelines. Grazing levels on BLM lands declined only slightly (as modified from Charnley et al. 2006).
This 20-year report shows a variable annual pattern in BLM and Forest Service authorized grazing between 2008 and 2012.

Northwest Forest Plan – Socioeconomic Report
Oregon, Washington, and California Report — 27
Mining on federal forests in the NWFP area is a minor land use. For leasable minerals – oil, gas, and geothermal – the Cascade Range in Oregon and Washington and parts of the northern California forests may contain valuable geothermal resources (USDA and USDI 1994a: 3&4-274-275). There has been little geothermal exploration or development in the NWFP area to date. Some federal forest lands in Oregon and Washington may contain oil and gas resources, but they have not yet been explored and developed for production. The four California NWFP forests have no oil or gas.
Some parts of the NWFP area have known deposits
of locatable minerals (gold, silver, copper, molybdenum,
chromium) and areas with high potential for discovery
of mineral deposits (FEMAT 1993: VI-11). Josephine
and Jackson Counties in Oregon contain known mineral
deposits. The Cascade Range has high potential for the
discovery and production of locatable minerals. Salable
minerals (gravel, stone, sand) occur throughout the NWFP
area. They are used by the managing agencies, other
government and commercial entities, and private individuals
mainly for construction and road building (as modified from Charnley et al. 2006).
Expectations Mining was expected to continue, with modifications to ensure consistency with the management objectives of the land use allocations. The NWFP’s final supplemental environmental impact statement (USDA and USDI 1994a: 3&4-275) predicted that NWFP effects on minerals would be linked to development constraints and mitigation measures designed to protect late-successional and old-growth (older forest) ecosystems. No effects were expected for salable minerals (USDA and USDI 1994a: 3&4-276). The effects of mining in late-successional reserves and managed late-successional areas would be assessed. Restrictions and mitigation measures would be implemented to minimize negative effects on late-successional habitat (USDA and USDI 1994b: C-17).
The ROD contains several guidelines for minerals management in riparian reserves (USDA and USDI 1994b: C-34-C-35). These guidelines pertain to road building, support structures and facilities, and waste materials, and
they are designed to ensure consistency with the objectives of the aquatic conservation strategy. The ROD also contains standards and guidelines for plans of operation, reclamation plans and bonds, inspection, and monitoring in riparian reserves. These standards and guidelines could increase the cost of extracting minerals from the reserves, and decrease mining activity there (USDA and USDI 1994a: 3&4-276) (as modified from Charnley et al. 2006).
Data Analysis Finding good indicators for mining is challenging. The indicators differ by mineral class, as do the years for which data are available. Potentially important data for NWFP monitoring are mineral production data. However, the Minerals Management Service, which tracks the production of leasable minerals, shows there is no record that leasable minerals were produced in the NWFP area just before the NWFP was implemented or during the last 15 years. The agencies do not track locatable minerals production so no data were gathered. Information related to locatable minerals is proprietary, and the government does not charge users any royalties or payments. The Forest Service tracks the removal of salable minerals.
The 10-year report does identify leases and mining claims as indicators but found gathering the data and identifying potential trends was challenging. Identifying which of the existing leases were active was also difficult. Assessing trends in mining claim data was also difficult as agency databases do not distinguish between abandoned and active sites. Overall, we believe the NWFP had little effect on mining opportunities (as modified from Charnley et al. 2006).
The 20-year report examines data in mineral production on National Forest System lands for salable minerals. These data are readily available.
Salable Minerals Volume and value of salable minerals removed are the indicators used for salable minerals production. The Forest Service tracks three categories of use: Forest Service use, free use, and contract use. The Forest Service removes salable minerals mainly for road construction
Chapter 6: Minerals

RepoRt FS/R6/pNW/2015/0006
28 — Oregon, Washington, and California Report
and reconstruction. The agency issues free-use permits to members of the public and government agencies. Contracts of sale are required for commercial removal of salable minerals (as modified from Charnley et al. 2006).
No data are available for Region 6 before 2000 for free-use permits or contracts of sale. The Forest Service salable minerals data are available annually beginning in 2000. The data are assessed between 2000 and 2008 for even-numbered fiscal years to simplify the presentation.
Results Salable minerals are available for agency use, free-use permits, or sale to commercial entities or individuals. The production of salable minerals on NFS lands in the NWFP area has fluctuated considerably since 2000. In 2000, more than 600,000 tons of mineral materials were removed from NFS lands in the NWFP area. In 2012, less than 100,000 tons were removed (figure 6-1). The type of use also varied over the same period. In both 2000 and 2012 the majority of mineral materials removed were sold to private entities. However, in the intervening years free-use permits and agency use constituted the majority of salable mineral production (figure 6-1). Salable mineral production on NFS lands in the NWFP area do not appear to be linked to
broader economic conditions and trends. Salable mineral production was low during much of the construction boom (2002-2006), and grew to the highest level since 2000 in the midst of the recession and housing bust (2008) (figure 6-1).
Discussion Little mining occurs on NFS and BLM-managed lands in the NWFP area. No leasable mineral production (e.g., oil and gas) occurs in the area. Data on locatable minerals production is proprietary and not collected. Salable minerals, or mineral materials, (e.g., sand and gravel) are removed throughout the NWFP area. Salable minerals are used primarily for construction and road building. There are 6,077 jobs in mining stone, sand, gravel, and clay in the NWFP area, which is less than 0.1 percent of total employment in the NWFP area (IMPLAN 2012).
The value of salable mineral production on NFS lands in the NWFP area is low. It reached a high above $2 million in 2000, but declined to about $100,000 in 2012 (figure 6-2). Throughout the period, the economic contribution of mineral production on NFS lands in the NWFP area has been minor.
Figure 6-1: Salable minerals production on national forests in the NWFP area
Figure 6-2: Salable minerals value on national forests in the NWFP area
Table 7-1: Historic road mileage in operational maintenance levels 1-5 in NWFP area Year ML 1 ML 2 ML 3 ML 4 ML 5 ML 3-5 Total
1999 7,150
26,855
6,718
1,291
413
8,422
42,427
2000 7,247
26,916
6,050
1,288
408
7,746
41,909
2001
-
100,000
200,000
300,000
400,000
500,000
600,000
700,000
2000 2002 2004 2006 2008 2010 2012
Tons
FS Use
Free Use
Sold
$-
$500,000
$1,000,000
$1,500,000
$2,000,000
$2,500,000
2000 2002 2004 2006 2008 2010 2012
Nom
inal
Dol
lars
FS Use
Free Use
Sold

Northwest Forest Plan – Socioeconomic Report
Oregon, Washington, and California Report — 29
Figure 6-1: Salable minerals production on national forests in the NWFP area
Figure 6-2: Salable minerals value on national forests in the NWFP area
Table 7-1: Historic road mileage in operational maintenance levels 1-5 in NWFP area Year ML 1 ML 2 ML 3 ML 4 ML 5 ML 3-5 Total
1999 7,150
26,855
6,718
1,291
413
8,422
42,427
2000 7,247
26,916
6,050
1,288
408
7,746
41,909
2001
-
100,000
200,000
300,000
400,000
500,000
600,000
700,000
2000 2002 2004 2006 2008 2010 2012
Tons
FS Use
Free Use
Sold
$-
$500,000
$1,000,000
$1,500,000
$2,000,000
$2,500,000
2000 2002 2004 2006 2008 2010 2012
Nom
inal
Dol
lars
FS Use
Free Use
Sold

RepoRt FS/R6/pNW/2015/0006
30 — Oregon, Washington, and California Report

Northwest Forest Plan – Socioeconomic Report
Oregon, Washington, and California Report — 31
Chapter 7: Recreation The vast majority of Oregon and Washington residents report participating in outdoor recreation (Oregon 2013, Washington 2013). NFS and BLM-managed lands provide a wide variety of motorized and non-motorized recreation opportunities in the NWFP area. Demographic trends, including population growth, an aging population, growing minority populations, and increasing levels of physical inactivity may affect public demand for the quantity and type of outdoor recreation provided by public lands in the NWFP area (Oregon 2013).
ExpectationsRecreational use associated with federal lands was expected to continue at existing levels, consistent with the management objectives for specific land use allocations under the NWFP. For certain land use allocations, existing recreation opportunities could be modified to minimize disturbance to protected species. Recreation opportunities could also be adjusted to attain late-successional reserve and aquatic strategy objectives. New recreation developments in the reserves could be approved if their potentially adverse effects were minimized or mitigated. Ski area expansions would be reviewed on a case-by-case basis for effects on late-successional and riparian habitat. The NWFP would also foster natural-looking landscapes, which would enhance existing recreation opportunities (as modified from Charnley et al. 2006).
Data AnalysisAgency recreation data provide information related to the supply of and the demand for recreation opportunities on federal forest lands. The 10-year report focuses on recreation supply to assess whether predictable levels of recreation opportunities were produced under the NWFP. The 10-year report does not address the nature or quality of recreational experiences or site-specific recreation opportunities. In the 10-year report, the following indicators are addressed: acres of wilderness, road miles, number of recreation residences, ski-area visitation, number of outfitter guide permits, the number and capacity of developed sites, as well as recreation visitation. Recreation data prior to 1999 were unavailable for most of these indicators (Charnley et al. 2006). Data for
most of the indicators were available only for more recent years and usually only for a single year. The lack of data limits the usefulness of the indicators.
Like the previous reports, the 20-year report tracks data on road miles to indicate recreation opportunities as measures of supply and visitation as an estimate of demand. The number of trail miles is not used as an indicator due to the implementation of the Forest Service’s Travel Management Rule, which is a major policy shift in the management of off-highway vehicles and other recreation opportunities. Travel management planning on National Forest System lands masks the potential effects of the NWFP on recreation supply and demand. Other indicators were not used due to the general lack of available and consistent data.
Most of the data are presented and discussed separately for the Forest Service and BLM, because the two agencies track recreation differently and each agency has different data available for different years. The Forest Service began recording data on recreation opportunities using an integrated data management tool called INFRA in 1999. Most recreation data for earlier years are unreliable. The BLM has maintained recreation data in the Recreation Management Information System (RMIS) in electronic form since 1999. Data files for earlier years were recorded on paper; they were not retained by the Oregon state office. The following sections address data sources and limitations in more detail (as modified from Charnley et al. 2006).
Results - Recreation SupplyThe agencies’ road systems support numerous recreation opportunities. Road mileage can be used as an indicator of recreation opportunities, including driving for pleasure, which is one of the most popular outdoor recreation activities in the United States (USDA FS 2003). Roads provide access to dispersed recreational opportunities such as hiking, camping, hunting and fishing. Roads also serve as recreation sites for individuals who use OHVs and bikes on the NFS road system. The Forest Service and BLM maintain five levels of roads. Level 1 includes roads closed to traffic

RepoRt FS/R6/pNW/2015/0006
32 — Oregon, Washington, and California Report
year-round. Level 2 roads are maintained for high clearance vehicles. Level 3, 4, and 5 roads are maintained for passengers cars, although levels of convenience and comfort vary. System road miles are the roads agencies include in their inventories and are responsible for maintaining. National forests also have “unclassified” roads, which are not managed as part of the forest transportation system. They include abandoned travel ways, roads proposed for decommissioning, and off-road vehicle tracks that are not designated and managed as trails by the agencies. Unclassified roads are not evaluated because the Forest Service does not consistently manage data on them and they are not intended for public use.
Consistent with the 15-year report, the road mileage results in the 20-year report are only compiled for Region 6 national forests in the NWFP area since these units had readily available data. The Region 6 national forests make up slightly over 60 percent of all forest service and BLM lands in the NWFP area. Data for system roads were obtained for fiscal years 1999 through 2012. Between those years, the miles of roads classified as level 1 increased. The mileage in all other maintenance levels decreased (figure 7-1). The total number of miles of roads open to passenger cars (ML 3-5) decreased by about 2,500 miles between 1999 and 2012. Over the same period, the miles of roads in ML1 increased by approximately 2,500 miles (table 7-1).
The reduction in the miles of roads open to passenger vehicles coincided with staffing reductions in Region 6. While some closed roads are redundant and therefore do not impede access, in general a reduction in road miles indicates a decrease in access and recreation opportunities.
Results - Recreation Demand Data are available on changing trends in outdoor recreation from the Oregon Parks and Recreation Department (Oregon 2013) and the Washington State Recreation and Conservation Office (Washington 2013). Population growth in Oregon and Washington is expected to increase demand for outdoor recreation on public land. This trend will be tempered by changes in the social and demographic composition of the population. Changing age structure and income levels of the population correspond to different
participation rates in recreational activities. Although participation rates for older Americans are increasing, they are still participating at rates lower than people in other age groups. As the population ages, demand for passive activities may increase. Low-income people participate at much lower rates than higher income people in outdoor recreation.
The growing disparity between wealthy and poor people in the NWFP area, which mirrors that in the nation, may lead to further inequities in opportunities for participation. State recreation planning documents for Oregon and Washington have identified this issue as a significant concern for recreation providers (Oregon 2013, Washington 2013). Another important factor in recreation activities in the region is ethnicity. Different ethnic groups participate in outdoor recreation at different rates, exhibit different preferences for specific activities, and use recreation sites in different ways.
Forest ServiceThe National Visitor Use Monitoring (NVUM) program surveys visitors on each national forest in 5-year intervals. In the 15-year monitoring report, NVUM round 2 data were presented for each national forest in the NWFP area. In this 20-year monitoring report, only some of the national forests have completed NVUM round 3 surveys. Table 7-2 displays the NVUM results for each NWFP area national forest. The Wenatchee, Mt. Baker-Snoqualmie, Mt. Hood, Willamette, Deschutes, and Shasta-Trinity national forests report the highest levels of use, with more than 1,000,000 annual visits in each surveyed period. Most of these forests are near urban centers in the NWFP area.
Bureau of Land ManagementThe BLM tracks visits using the Recreation Management Information System (RMIS). The data are gathered using a combination of census, sampling, and estimation methods. Figure 7-2 displays the number of recreation visits on BLM districts in the NWFP area. Total visitation peaked between 2007 and 2009. Although visitation has declined since 2009, total visits are still above 1999 levels (figure 7-2). The Eugene and Medford districts experienced the most growth in recreation visits between 1999 and 2012, with annual visits approximately doubling on both districts during

Northwest Forest Plan – Socioeconomic Report
Oregon, Washington, and California Report — 33
Table 7-1: Historic road mileage in operational maintenance Levels 1-5 in the NWFP area
Historic Road Mileage in Operational Maintenance Levels 1-5 in NWFP AreaYear ML 1 ML 2 ML 3 ML 4 ML 5 ML 3-5 Total1999 7,150 26,855 6,718 1,291 413 8,422 42,4272000 7,247 26,916 6,050 1,288 408 7,746 41,9092001 7,464 26,707 5,804 1,250 400 7,454 41,6252002 7,533 26,667 5,808 1,250 401 7,459 41,6772003 7,705 26,701 5,803 1,242 400 7,445 41,8512004 7,751 26,888 5,376 1,241 395 7,012 41,6532005 7,690 27,357 4,997 1,199 418 6,614 41,6642006 7,886 27,509 4,820 1,062 310 6,192 41,5922007 7,894 27,344 4,679 1,059 311 6,048 41,2912008 7,926 27,153 4,674 1,060 296 6,029 41,1122009 9,499 25,200 4,598 1,043 299 5,940 40,6462010 9,646 24,779 4,590 1,016 327 5,933 40,3702011 9,616 24,573 4,580 993 327 5,900 40,0972012 9,611 24,372 4,643 996 329 5,967 39,959Change in miles 1999 to 2012 2,461 -2,482 -2,076 -295 -84 -2,455 -2,468Percent change 1999 to 2012 34 -9 -31 -23 -20 -29 -6
7,464 26,707 5,804 1,250 400 7,454 41,625
2002 7,533
26,667
5,808
1,250
401
7,459
41,677
2003 7,705
26,701
5,803
1,242
400
7,445
41,851
2004 7,751
26,888
5,376
1,241
395
7,012
41,653
2005 7,690
27,357
4,997
1,199
418
6,614
41,664
2006 7,886
27,509
4,820
1,062
310
6,192
41,592
2007 7,894
27,344
4,679
1,059
311
6,048
41,291
2008 7,926
27,153
4,674
1,060
296
6,029
41,112
2009 9,499
25,200
4,598
1,043
299
5,940
40,646
2010 9,646
24,779
4,590
1,016
327
5,933
40,370
2011 9,616
24,573
4,580
993
327
5,900
40,097
2012 9,611
24,372
4,643
996
329
5,967
39,959
Change in miles 1999 to 2012 2,461 -2,482 -2,076 -295 -84 -2,455 -2,468 Percent change 1999 to 2012 34% -9% -31% -23% -20% -29% -6%
Figure 7-1: Percent of NWFP area Region 6 roads in operational maintenance classes in 1999 and 2012
0.0%
10.0%
20.0%
30.0%
40.0%
50.0%
60.0%
70.0%
ML 1 ML 2 ML 3 ML 4 ML 5
1999
2012

RepoRt FS/R6/pNW/2015/0006
34 — Oregon, Washington, and California Report
this period. In contrast, the Coos Bay, Klamath portion of Lakeview, and Salem districts saw the number of visits decline between 1999 and 2012. Across BLM-managed lands in the NWFP area annual recreation visits grew by 22 percent between 1999 and 2012.
DiscussionThe 10-year report concludes that the demand for
recreation and tourism grew in the Pacific Northwest during the first decade of NWFP monitoring (Charnley et al. 2006).
The conclusions, however, were limited by the agencies’ capacity to determine specific trends in
recreation opportunities and use was limited by the lack of agency regional-scale recreation data for the years before 1999. The only indicators for which reliable data were available from 1994 onward were number of designated wilderness acres, number of Forest Service recreation residences, and number of skier days (as modified from Charnley et al. 2006).
These indicators represent a minor component of the overall recreation program on agency lands, and they are not closely tied to changes expected under NWFP direction.
Table 7-2: Annual Visitation Estimate (thousands) for the NWFP area Forests
National Forest Visitation, National Visitor Use Monitoring Round 2 and Round 3State Forest Fiscal Year
CollectedRound 2 Visits (1,000s)
90% Confidence Interval
Fiscal Year Collected
Round 3 Visits (1,000s)
90% Confidence Interval
Was
hing
ton
Okanogan 2005 678.9 73.5 2010 272
32.3
Wenatchee 2005 2,312.20 30.6 2010 1,096
16.9
Mt. Baker - Snoqualmie 2005 1,677.50 10.1 2010 1,995
20.9
Gifford Pinchot 2006 1,137.80 14.2 2011 588
29.6
Olympic 2005 827.6 45.2 2010 462
20.2
Ore
gon
Mt. Hood 2006 1,830.80 11.6 2011 1,947
12.5
Willamette 2007 1,360.40 13.6 Siuslaw 2005 1,146.50 21.2 2011
946 20.8
Deschutes 2008 1,894.90 12.3 Umpqua 2007 540.9 30.5 Winema 2008 296.2 13.9 Rogue River 2007 402.3 19.6 Siskiyou 2007 513.5 27.8
Cal
iforn
ia
Klamath 2008 303.5 35.9 Six Rivers 2008 224.3 23.4 Shasta-Trinity NRA 2008 1,292.30 21.8 Shasta-Trinity Non NRA 2008 630.4 24.6 Mendocino 2008 346.6 16.6

Northwest Forest Plan – Socioeconomic Report
Oregon, Washington, and California Report — 35
Table 7-3: Change in BLM Visits during 1999-2008 and 2004-2008
Change in BLM Visits during 1999-2010 and 2004-20101999-2010 Change 2004-2010 ChangeDistrict Visits (1,000) Percent District Visits (1,000) PercentCoos Bay 23 3 Coos Bay -261 -25Eugene 661 159 Eugene 450 72 Lakeview (Klamath only) (58) -33 Lakeview (Klamath only) -57 -33Medford 546 89 Medford 184 19 Roseburg 146 17 Roseburg 137 16 Salem (122) -8 Salem 108 8 Grand Total 1,195 27 Grand Total 561 11
Figure 7-2: BLM recreation visits 1999-2012, NWFP area
Table 7-3: Change in BLM visits between 1999-2012 and 2005-2012
Change in BLM Visits during 1999-2012 and 2005-2012 1999-2012 Change 2005-2012 Change
District Visits
(1,000) Percent District Visits
(1,000) Percent
Coos Bay (111) -15% Coos Bay (460) -42%
Eugene 523 126% Eugene 325 53%
Lakeview (Klamath only)
(50) -29%
Lakeview (Klamath only) (37) -23%
Medford 532 87% Medford 223 24%
Roseburg 130 15% Roseburg 108 13%
Salem (70) -4% Salem 135 10%
Grand Total 955 22% Grand Total 294 6%
-
1,000
2,000
3,000
4,000
5,000
6,000
7,000
Recr
eatio
n Vi
sits
in T
hous
ands
Coos Bay
Eugene
Lakeview (Klamath only)
Medford
Roseburg
Salem
Grand Total

RepoRt FS/R6/pNW/2015/0006
36 — Oregon, Washington, and California Report
For the 20-year report, the quality and quantity of available recreation related data did not improve. The changes the study protocol used in Round 1 and Round 2 of Forest Service NVUM visitor use surveys make it difficult to use the data to track trends on National Forest System lands. BLM recreation use data generally show upward trends in visitation.
The overall decrease in road mileage also potentially affects the quantity of recreation opportunities associated
with driving for pleasure. The miles of roads in Levels 3, 4, and 5 show declines leading to fewer opportunities and decreases in quality related to reduced access to dispersed sites and, in combination with increased demand, more crowding at accessible sites. While this reduction is likely to negatively impact those in passenger cars, the increase in the number of Level 2 miles may positively impact those using high clearance vehicles. The impacts of these changes in terms of magnitude and quality are unknown.

Northwest Forest Plan – Socioeconomic Report
Oregon, Washington, and California Report — 37
Chapter 8: Socioeconomic Conditions and Trends for Counties Data Analysis The counties in the NWFP area are divided into two groups: metropolitan or nonmetropolitan. The designation is determined by the U.S. Office of Management and Budget. The 2011 designations were obtained from the Bureau of Labor Statistics (http://www.bls.gov/oes/current/county_links.htm, accessed 8/17/2012). Classifying the counties into metropolitan and nonmetropolitan groups is helpful because
The 20-year report addresses social and economic change at the county scale. This level of detail was selected because data are readily available at this scale. The 72 counties displayed in table 8-1 are included in the analysis. The counties were identified because of their proximity, and social and economic ties to the national forests and BLM districts in the NWFP area. The counties are the same counties used in the previous reports.
Table 8-1 - Counties in the Northwest Forest Plan area (2011 designation)
State, county, designation State, county, designationCA, Colusa County (nonmetropolitan) OR, Polk County (metropolitan)CA, Del Norte County (nonmetropolitan) OR, Sherman County (nonmetropolitan)CA, Glenn County (nonmetropolitan) OR, Tillamook County (nonmetropolitan)CA, Humboldt County (nonmetropolitan) OR, Wasco County (nonmetropolitan)CA, Lake County (nonmetropolitan) OR, Washington County (metropolitan)CA, Lassen County (nonmetropolitan) OR, Yamhill County (metropolitan)CA, Marin County (metropolitan) WA, Adams County (nonmetropolitan)CA, Mendocino County (nonmetropolitan) WA, Benton County (metropolitan)CA, Modoc County (nonmetropolitan) WA, Chelan County (metropolitan)CA, Napa County (metropolitan) WA, Clallam County (nonmetropolitan)CA, Shasta County (metropolitan) WA, Clark County (metropolitan)CA, Siskiyou County (nonmetropolitan) WA, Cowlitz County (metropolitan)CA, Sonoma County (metropolitan) WA, Douglas County (metropolitan)CA, Sutter County (metropolitan) WA, Franklin County (metropolitan)CA, Tehama County (nonmetropolitan) WA, Grant County (nonmetropolitan)CA, Trinity County (nonmetropolitan) WA, Grays Harbor County (nonmetropolitan)CA, Yolo County (metropolitan) WA, Island County (nonmetropolitan)OR, Benton County (metropolitan) WA, Jefferson County (nonmetropolitan)OR, Clackamas County (metropolitan) WA, King County (metropolitan)OR, Clatsop County (nonmetropolitan) WA, Kitsap County (metropolitan)OR, Columbia County (metropolitan) WA, Kittitas County (nonmetropolitan)OR, Coos County (nonmetropolitan) WA, Klickitat County (nonmetropolitan)OR, Crook County (nonmetropolitan) WA, Lewis County (nonmetropolitan)OR, Curry County (nonmetropolitan) WA, Mason County (nonmetropolitan)OR, Deschutes County (metropolitan) WA, Okanogan County (nonmetropolitan)OR, Douglas County (nonmetropolitan) WA, Pacific County (nonmetropolitan)OR, Hood River County (nonmetropolitan) WA, Pierce County (metropolitan)OR, Jackson County (metropolitan) WA, San Juan County (nonmetropolitan)OR, Jefferson County (nonmetropolitan) WA, Skagit County (metropolitan)OR, Josephine County (nonmetropolitan) WA, Skamania County (metropolitan)OR, Klamath County (nonmetropolitan) WA, Snohomish County (metropolitan)OR, Lane County (metropolitan) WA, Thurston County (metropolitan)OR, Lincoln County (nonmetropolitan) WA, Wahkiakum County (nonmetropolitan)OR, Linn County (nonmetropolitan) WA, Walla Walla County (nonmetropolitan)OR, Marion County (metropolitan) WA, Whatcom County (metropolitan)OR, Multnomah County (metropolitan) WA, Yakima County (metropolitan)
This chapter uses U.S. Census population data, IMPLAN employment data, and Bureau of Labor Statistics populations and unemployment data to address conditions and trends for the following indicators:
• Total Population (BEA 2010)• Metropolitan vs. Nonmetropolitan Population (BEA 2011)• Total Population Change (BEA 2010)• Population by Age (US Census 2010a)
• Population by Race (US Census 2010b)• Employment and Personal Income by Industry (2001-2007) (MIG 2009)• Unemployment (BLS 2010)• Total Population and Metropolitan vs. Nonmetropolitan Population

RepoRt FS/R6/pNW/2015/0006
38 — Oregon, Washington, and California Report
the social and economic conditions are different in urban and rural areas. If the two were combined then positive and negative data mighty cancel each other out. Separating the counties into two groups helps to identify trends more clearly.
Results and Discussion
Total Population and Metropolitan vs. Nonmetropolitan PopulationNearly all of the population growth in the NWFP area since 1999 is attributable to metropolitan counties (figure 8-1). Migration to urban areas may be driven by economic opportunities or desirable amenities. The size and diversity of metropolitan counties may also make them more resilient
to changes in natural resource markets and management. Across all NWFP area counties, the metropolitan population growth rate was double the non-metropolitan population growth rate between 1999 and 2012 (18 percent vs. 9 percent), (table 8-2). Nevertheless, non-metropolitan counties may also provide desirable amenities – open space, access to recreation opportunities, and environmental quality. While many rural areas of the United States have lost population in recent years, the non-metropolitan counties of the NWFP area did experience moderate growth between 1999 and 2012 (figure 8-1).
The NWFP area counties grew more quickly than non-NWFP area counties in California, Oregon, and Washington. Overall, non-metropolitan counties in those three states lost 6 percent of their populations between
-
2,000,000
4,000,000
6,000,000
8,000,000
10,000,000
12,000,000
14,000,000
Popu
latio
n
NWFP Area Metropolitan Total Nonmetropolitan Total
Figure 8-1. Population Growth in Metro and Nonmetro between 1999 and 2012.

Northwest Forest Plan – Socioeconomic Report
Oregon, Washington, and California Report — 39
1999 and 2012. In contrast, non-metropolitan NWFP area counties grew 9 percent over the same period. Similarly, the metropolitan areas in the NWFP area grew more quickly than metropolitan areas in the three states overall (18 percent vs. 15 percent) (table 8-2). Therefore, the NWFP area counties are attracting more residents than counties outside the NWFP area in the three states. These data reflect that both the metropolitan and non-metropolitan counties in the NWFP area continue to be appealing places to live.
Population by AgeDemographic changes, particularly shifts in the age distribution, provide additional context for population growth trends. Non-metropolitan NWFP area counties are
losing younger residents. From 2000 to 2012, the share of young children, teenagers, and working age adults (25-44) declined in the non-metropolitan counties. In contrast, the 45-64 and 65 and older age brackets grew the most over the same period (figure 8-2). The aging of the population in the non-metropolitan counties may reflect a lack of educational and employment opportunities for young people in these counties. Additionally, this trend suggests that population decline in these counties may be imminent. The metropolitan counties in the NWFP area have also seen a sharp increase in the share of individuals in the 65 and older age bracket (figure 8-3). In part, this trend reflects national, and global, demographic shifts toward an older population.
Table 8-2: Population change by metropolitan and nonmetropolitan counties, NWFP area counties and state totals.
1999-2012 2005-2012
CA- Percent change
Percent change
NWFP area counties Total 166,014 10 79,259 4Metropolitan 136,481 11 73,496 6Nonmetropolitan 29,533 6 5,763 1
OR-NWFP area counties Total 499,808 16 282,564 8
Metropolitan 454,164 18 263,492 9Nonmetropolitan 45,644 7 19,072 3
WA-NWFP area counties Total 981,145 19 596,840 11
Metropolitan 888,262 19 549,863 11Nonmetropolitan 92,883 13 46,977 6
Total NWFP countiesTotal 1,646,967 16 958,663 9Metropolitan 1,478,907 18 886,851 10Nonmetropolitan 168,060 9 71,812 4
Oregon, Washington, California Total 6,102,086 14 3,139,345 7 Metropolitan 6,231,488 15 3,388,487 8Nonmetropolitan (129,402) -6 (249,142) -10

RepoRt FS/R6/pNW/2015/0006
40 — Oregon, Washington, and California Report
Population by Race and OriginThe NWFP area is becoming more racially and ethnically diverse. The share of non-white residents in the non-metropolitan counties increased from 7 percent to 10 percent between 2000 and 2012 (table 8-4). In the metropolitan counties, the share of non-white residents increased from
14 percent to 18 percent (table 8-4). The share of Hispanic/Latino residents increased from 8 percent to 12 percent in non-metropolitan NWFP area counties and 9 percent to 14 percent in metropolitan NWFP area counties (table 8-5). As with the aging population in the NWFP area, increasing racial and ethnic diversity in the area also reflects national trends.
Figure 8-1: repeat
Table 8-2: Population change by metropolitan and nonmetropolitan counties, NWFP area counties, and state totals
Figure 8-2: Age class growth in the NWFP area nonmetropolitan counties, 2000-2012
CA-NWFP area counties Total 166,014 10% 79,259 4%
Metropolitan 136,481 11% 73,496 6%Nonmetropolitan 29,533 6% 5,763 1%
OR-NWFP area counties Total 499,808 16% 282,564 8%
Metropolitan 454,164 18% 263,492 9%Nonmetropolitan 45,644 7% 19,072 3%
WA-NWFP area counties Total 981,145 19% 596,840 11%
Metropolitan 888,262 19% 549,863 11%Nonmetropolitan 92,883 13% 46,977 6%
Total NWFP countiesTotal 1,646,967 16% 958,663 9%Metropolitan 1,478,907 18% 886,851 10%Nonmetropolitan 168,060 9% 71,812 4%
Oregon, Washington, California Total 6,102,086 14% 3,139,345 7%Metropolitan 6,231,488 15% 3,388,487 8%Nonmetropolitan (129,402) -6% (249,142) -10%
1999-2012 2005-2012
0
20
40
60
80
100
120
140
2000
2001
2002
2003
2004
2005
2006
2007
2008
2009
2010
2011
2012
Inde
xed
to 1
00
Non-Metro Age Class Growth
Under 25
25 to 44
45 to 65
Over 65
Figure 8-3: Rate of change by age class in NWFP area metropolitan counties, 2000-2012
0
20
40
60
80
100
120
140
160
2000
2001
2002
2003
2004
2005
2006
2007
2008
2009
2010
2011
2012
Inde
xed
to 1
00
Metro Age Class Growth
Under 25
25 to 44
45 to 65
Over 65
Table 8-3:Population and population change by age class in metropolitan and nonmetropolitan NWFP area countiesTotal
Number Number Share Number Share Number Share Number ShareNonmetro2000 1,742,079 580,989 33% 443,977 25% 441,284 25% 275,829 16%2012 1,891,377 571,154 30% 424,627 22% 543,019 29% 352,577 19%Change 149,298 -9,835 -19,350 101,735 76,748% Change 9% -2% -4% 23% 28%
Metro2000 8,601,903 2,992,790 35% 2,653,867 31% 1,991,901 23% 963,345 11%2012 9,979,685 3,231,899 32% 2,763,024 28% 2,674,475 27% 1,310,287 13%Change 1,377,782 239,109 109,157 682,574 346,942 % Change 16% 8% 4% 34% 36%
Total2000 10,343,982 3,573,779 35% 3,097,844 30% 2,433,185 24% 1,239,174 12%2012 11,871,062 3,803,053 32% 3,187,651 27% 3,217,494 27% 1,662,864 14%Change 1,527,080 229,274 89,807 784,309 423,690 % Change 15% 6% 3% 32% 34%
Under 25 Age 25-44 Age 45-64 Age 65 Plus

Northwest Forest Plan – Socioeconomic Report
Oregon, Washington, and California Report — 41
The percent of the population identified as Hispanic in origin in the NWFP area is closer to the national average of 15 percent (table 8-5). California exceeds the national average while Oregon and Washington are less. Generally, the nonmetropolitan counties have a lower percentage classified as Hispanic and most of the growth in the Hispanic percentage is in the metropolitan counties.
Employment and Personal Income by IndustryDemographic changes have coincided with changes in economic activity and labor market conditions in the NWFP area. Between 2001 and 2012, employment in the transportation and warehousing, health and social services, and government sectors grew the most across the NWFP area. The agriculture, forestry, fishing, and hunting sector also grew during this period, although the growth was modest compared to the three sectors identified above (figure 8-5). Nevertheless, this growth is notable, since employment change in this sector was flat between 1990 and
2000 (figure 8-4). Although employment in the agriculture, forestry, fishing, and hunting sector experienced modest growth between 2001 and 2012, the labor income (salary, wages, and proprietors’ income) grew markedly over this period (figure 8-6). This mirrors the trend discussed in the timber harvest section, which notes that while employment in timber-related sectors declined, the average wage paid to employees in those sectors increased.
UnemploymentThe unemployment data for the last 10 years in the NWFP area and the US are presented in figure 8-7. The data are grouped into metropolitan and nonmetropolitan counties in each state. The data are annual rates and are not seasonally adjusted. Except for the Washington metropolitan counties, all other areas have unemployment rates higher than the rates for the US. The nonmetropolitan areas in California, Oregon, and Washington have unemployment rates higher than their corresponding metropolitan areas.
All NWFP area counties and the US follow similar
Table 8-3: Population and population change by age class in metropolitan and nonmetropolitan NWFP area counties
Total Under 25 Age 25-44 Age 45-64 Age 65 PlusNumber Number Share Number Share Number Share Number Share
Nonmetro % % % %2000 1,742,079 580,989 33 443,977 25 441,284 25 275,829 16 2012 1,891,377 571,154 30 424,627 22 543,019 29 352,577 19 Change 149,298 -9,835 -19,350 101,735 76,748Percent change 9 -2 -4 23 28
Metro2000 8,601,903 2,992,790 35 2,653,867 31 1,991,901 23 963,345 112012 9,979,685 3,231,899 32 2,763,024 28 2,674,475 27 1,310,287 13Change 1,377,782 239,109 109,157 682,574 346,942 Percent change 16 8 4 34 36
Total2000 10,343,982 3,573,779 35 3,097,844 30 2,433,185 24 1,239,174 122012 11,871,062 3,803,053 32 3,187,651 27 3,217,494 27 1,662,864 14Change 1,527,080 229,274 89,807 784,309 423,690 Percent change 15 6 3 32 34

RepoRt FS/R6/pNW/2015/0006
42 — Oregon, Washington, and California Report
trends with increasing unemployment from 2008 to 2010 and decreasing unemployment from 2010 to 2012. The data for the NWFP area and the US as a whole reflect the major
economic downturn that began in late 2007. Unemployment rates in the NWFP area doubled between 2007 and 2010.
Table 8-4: percent of population by race in the NWFP area, 2000 and 2012
2000 2012 Non-metropolitan Metropolitan Non-metropolitan Metropolitan
PercentCaliforniaAmerican Indian & Alaska Native 4 1 5 2
Asian 1 5 2 7Black 2 2 2 2Native Hawaiian & Other Pacific Islander <0.5 <0.5 <0.5 <0.5
Two or more races 3 2 4 4White 90 89 87 85
OregonAmerican Indian & Alaska Native 2 1 2 1
Asian 1 1 2 6Black 1 3 1 3Native Hawaiian & Other Pacific Islander <0.5 <0.5 <0.5 0.5
Two or more races 2 2 3 4White 94 90 92 86
WashingtonAmerican Indian & Alaska Native 3 1 3 2
Asian 2 7 2 9Black 1 4 1 5Native Hawaiian & Other Pacific Islander <0.5 1 <0.5 1
Two or more races 2 3 3 5White 92 84 90 79
NWFP AreaAmerican Indian & Alaska Native 3 1 3 2
Asian 1 6 2 8Black 1 3 1 4Native Hawaiian & Other Pacific Islander <0.5 <0.5 <0.5 1
Two or more races 2 3 4 4White 93 86 90 82

Northwest Forest Plan – Socioeconomic Report
Oregon, Washington, and California Report — 43
Table 8-5: Percent of population with Hispanic origin in the NWFP area 2000 and 2012
Area Percent Hispanic
CA 2000 2012Nonmetropolitan 14 19Metropolitan 17 23Total 16 22ORNonmetropolitan 6 9Metropolitan 9 15Total 8 13WANonmetropolitan 7 11Metropolitan 7 12Total 7 11NWFP AREANonmetropolitan 8 12Metropolitan 9 14Total 9 13
0
400
800
1,200
1,600
2,000
Empl
oym
ent (
thou
sand
s)
1990 2000
Figure 8-4. Employment by major industry Average Annual Wage.

RepoRt FS/R6/pNW/2015/0006
44 — Oregon, Washington, and California Report
Figure 8-4: No change from 2008 report
Figure 8-5: Employment by major industry (NAICS), 2001 and 2012
Table 8-5: Percent of population with Hispanic origin in the NWFP area 2000 and 2012
AreaCA 2000 2012
Nonmetropolitan 14% 19%Metropolitan 17% 23%Total 16% 22%
ORNonmetropolitan 6% 9%Metropolitan 9% 15%Total 8% 13%
WANonmetropolitan 7% 11%Metropolitan 7% 12%Total 7% 11%
NWFP AREANonmetropolitan 8% 12%Metropolitan 9% 14%Total 9% 13%
Percent Hispanic
0
200
400
600
800
1,000
1,200Em
ploy
men
t (th
ousa
nds)
2001 Employment
2012 Employment
Figure 8-6: Income by major industry, 2001 and 2012
Figure 8-7: Unemployment rates in the NWFP area and US, 1990-2012
$-
$10,000
$20,000
$30,000
$40,000
$50,000
$60,000
$70,000
Labo
r Inc
ome
(mill
ions
of 2
012
USD
)
2001 Income
2012 Income
0.0%
2.0%
4.0%
6.0%
8.0%
10.0%
12.0%
14.0%
16.0%
1990
1991
1992
1993
1994
1995
1996
1997
1998
1999
2000
2001
2002
2003
2004
2005
2006
2007
2008
2009
2010
2011
2012
CA Metro
CA Nonmetro
OR Metro
OR Nonmetro
WA Metro
WA Nonmetro
US

Northwest Forest Plan – Socioeconomic Report
Oregon, Washington, and California Report — 45
Figure 8-6: Income by major industry, 2001 and 2012
Figure 8-7: Unemployment rates in the NWFP area and US, 1990-2012
$-
$10,000
$20,000
$30,000
$40,000
$50,000
$60,000
$70,000
Labo
r Inc
ome
(mill
ions
of 2
012
USD
)
2001 Income
2012 Income
0.0%
2.0%
4.0%
6.0%
8.0%
10.0%
12.0%
14.0%
16.0%
1990
1991
1992
1993
1994
1995
1996
1997
1998
1999
2000
2001
2002
2003
2004
2005
2006
2007
2008
2009
2010
2011
2012
CA Metro
CA Nonmetro
OR Metro
OR Nonmetro
WA Metro
WA Nonmetro
US

RepoRt FS/R6/pNW/2015/0006
46 — Oregon, Washington, and California Report

Northwest Forest Plan – Socioeconomic Report
Oregon, Washington, and California Report — 47
Chapter 9: Jobs and Income Associated with Resources and Recreation
The Pacific Northwest is endowed with vast forest resources. Federal lands are an important part of the forest resource base, which contribute to socioeconomic well-being by providing a variety of commodities, uses, and services. These lands provide forest resources that support consumptive, nonconsumptive, commercial and noncommercial uses as well as an array of employment opportunities. Timber production was one of the largest drivers of regional economic development in the Pacific Northwest over the past century and it remains an important economic component in many parts of the NWFP area (as modified from Charnley et al. 2006).
This section of the 20-year report presents an assessment of the role that forest resources from National Forest System and BLM lands play in the economy of the NWFP area.
Factors affecting the NWFP area’s industrial composition and associated rates of employment and income over time include changes in technology, industrial diversification and growth, regional competitiveness, product demand, and supply of raw materials. Federal land management agencies directly influence the supply of raw materials, including timber, recreation opportunities, forage, minerals, wildlife, fish, water, and other nontimber forest products. The supply and use of these resources have direct effects on the industries involved in their primary production and conversion, and indirect effects on the businesses and workers supporting these industries. In the years leading up to the creation of the NWFP, discussions about the effects of ecosystem protection and restoration on socioeconomic well-being were often presented as a choice between owls and jobs which later became the broader issue of jobs versus the environment. Although the supply of timber and employment in the wood products
industry are directly related, reducing the debate to a choice between owls and jobs is an over-simplification that ignores the complex social and economic changes in the Pacific Northwest. During the past three decades, high rates of population growth, especially in the urban areas along the Interstate 5 corridor, brought new people to the Pacific Northwest who had different values and beliefs about the appropriate uses of federal lands. At the same time, long-time residents of the Pacific Northwest and people across the country began to question the management of public forest lands for intensive timber production (FEMAT 1993). The public began to recognize other values of public land including recreation, visual quality, as well as the protection of water, wildlife, and fish (as modified from Charnley et al. 2006).
The economy of the Pacific Northwest was also changing. Agriculture and industries based on forest resource extraction grew little. Fewer people in the region depended on the extraction of goods and services from federal lands for their livelihoods. New businesses and employment opportunities fueled by the expanding population were primarily in the trade and services sectors. Growth in the forest products industry shifted to the U.S. South and interior Canada as relative costs changed and engineered forest products gained consumer acceptance (Haynes et al. 2007). During this same time, the forest products industry in the NWFP area has become less diverse and more focused on softwood lumber production at large mills (Haynes 2008).
Expectations“Predictable levels of resource outputs and recreation opportunities from National Forest System and BLM lands were expected to provide predictable levels of employment” (Charnley et al. 2006). This relationship between resource flows and uses from federal lands and employment has been the basis for many federal policies associated with sustaining rural communities. These policies are documented in the Multiple Use Sustained Yield Act of 1960 and the

RepoRt FS/R6/pNW/2015/0006
48 — Oregon, Washington, and California Report
non-declining even-flow policy for timber adopted in 1973 and included in the Forest Service 1982 planning regulation (36 CFR 219). The implementation of the NWFP shifted the emphasis to predictable levels of resource outputs and uses within the NWFP area. With predictable levels, workers and industry supported by resources from federal lands will know with greater certainty the level of future investments necessary to maintain their businesses.
The 10-year report emphasizes three points related to jobs and income associated with resource and recreation outputs: (1) The NWFP fixed average annual planned harvest levels at 1.1 billion board feet. This quantity was scaled back to 0.8 billion board feet during the first few years of NWFP implementation. The new planned harvest levels were more than 80 percent less than the Forest Service and BLM planned annual harvest levels of 4.5 billion board feet during the 1980s. (2) Initial projections documented by the Forest Ecosystem Management Assessment Team (FEMAT 1993) indicated that the permanent reduction in timber supply would result in an initial loss of about 25,000 direct jobs or 17 percent of total timber industry employment. After adjusting to the reduction in timber supply, NWFP implementation was expected to provide a stable flow of timber from federal lands and support predictable rates of employment in the timber industry. (3) Data associated with nontimber resources and recreation outputs are scarce. During the development of the NWFP, the agencies did not know the effect of the NWFP standards and guidelines on nontimber commodity and noncommodity products, uses, and services derived from the region’s forests. They needed to clarify the short- and long-term effects expected on municipal and nonfederal water systems, grazing, minerals, special forest products, recreation residences, and recreation facilities (Tuchmann et al. 1996) (as modified from Charnley et al. 2006).
Data AnalysisEmployment and income estimates come from IMPLAN Professional Version 3.0 with 2012 data. IMPLAN is an input-output model that evaluates how an industry event or change in policy affects economic activity in an area. IMPLAN captures direct, indirect, and induced economic activity. Direct effects occur in the immediately affected industry. For example, a logging company experiences direct effects from a federal timber sale. Indirect effects occur in industries that supply the directly affected firm. When the logging company buys equipment – e.g., trucks and tools – economic activity increases in other firms in the local area. Induced effects occur when employees of the directly and indirectly affected firms spend their earnings in the local area. Employees purchase housing, food, fuel, and other goods and services. All of these transactions influence local economic activity. Therefore, the economic effects of a federal timber sale affect many firms in an economy, not just those in the forestry sector.
The 10-year report covers the years 1990 through 2000 organized by industry or industry group using the Standard Industrial Classification (SIC) system. The more recent IMPLAN data, 2001 and later, are organized by industry or industry group using the North American Industrial Classification System (NAICS). The IMPLAN data sets are selected because they interpret data from a variety of published government sources to fully disclose disaggregated employment and income for individual counties. This disclosure provides the ability to identify individual industries, such as the primary and secondary wood products processing sectors, in the NWFP area’s 72 counties.
The IMPLAN data also include estimates for the self-employed, which are especially important in the logging industry. The 10-year report used data from Christensen et al. (2000) to identify whether the counties were metropolitan or nonmetropolitan. The 20-year report uses updated 2011 metropolitan and nonmetropolitan data obtained from the Bureau of Labor Statistics (BLS) website. These 72 counties (table 8 -1) constitute the area of analysis for the discussions

Northwest Forest Plan – Socioeconomic Report
Oregon, Washington, and California Report — 49
in this chapter.6 The quantity of resource outputs and uses
for estimating employment and income associated with
Forest Service and BLM managed lands in this chapter are
taken from Chapter 3 through Chapter 7 of this report. The
timber harvest data from all ownerships used here are taken
from state harvest reports that identify timber harvest by
county. The timber data from all ownerships incorporate
other owner responses to the changing timber supply from
federal lands.7
Timber-industry employment and income data are from
IMPLAN data sets for the 72 counties in the NWFP area.
IMPLAN data for the 10-year report are developed for the
years 1990 through 2000. The 20-year report uses IMPLAN
data for the years 2008 through 2012. IMPLAN data are
used in this section to provide specific timber industry level
detail not available in Bureau of Labor Statistics and other
readily available data sets.
The employment and income data are compared to the data in timber harvest from all ownerships in the NWFP area. The division of timber industry employment and income by the volume of logs consumed by primary processing timber industries provides an estimate of the direct employment response to timber harvest. The amount of Forest Service- and BLM-supported timber industry direct employment is a ratio based on the amount of the agencies’ timber harvest to the total amount of logs harvested from all ownerships. Drawing conclusions about timber harvest and employment data for individual counties is inappropriate and not considered because of economic leakages (Sommers 2001). One of the most important leakages is log flows to timber mills across county boundaries (as modified from Charnley et al. 2006).
6http://www.bls.gov/oes/current/county_links.htm
7These reports are available from the Oregon Department of Forestry publications section (http://egov.oregon.gov/ODF/STATE_FORESTS/FRP/annual_reports.shtml), the Washington Department of Natural Resources publications section (http://www.dnr.wa.gov), the Washington Department of Revenue (http://dor.wa.gov/content/FindTaxesAndRates/OtherTaxes/Timber/forst_stat.aspx) and the California Board of Equalization property-tax section (http://www.boe.ca.gov/proptaxes/timbertax.htm) .
A change in timber industry output generates changes in purchases from supporting industries and expenditures by employees, known as indirect and induced effects. In order to estimate timber-related indirect and induced employment and income, IMPLAN impact models were built for the region to produce employment and income multipliers based on the effects of a final demand change in the timber industry.
Recreation-related employment and income cannot be defined using a single tourism industry. Recreation dollars are spent on a variety of goods and services. Associated employment and income were generated by building IMPLAN impact models to identify the direct, indirect, and induced employment and income associated with the total expenditures by the recreation users. The expenditure patterns are based on data identified in the National Visitor-Use Monitoring program. The methods to derive this data are presented in the Updated Spending Profiles for National Forest Recreation Visitors by Activity (White and Stynes 2010).
The following sections discuss results for timber, other forest products, and recreation. The timber section is the most developed because the data identifying the trends in timber flows are readily available and the relationships between timber flows and employment are generally known. Little or no comparable data are available for nontimber forest products.
Results
Timber-Related Jobs and IncomeTimber-related jobs and income are in logging, solid wood product manufacturing, and pulp and paper processing. Solid wood manufacturing and pulp and paper processing can be further subdivided into primary and secondary manufacturing industries. Primary processing in solid wood manufacturing includes sawmills, wood preservation, and veneer and plywood mills. Secondary manufacturing in solid wood products includes industries such as millwork, reconstituted wood products, and cabinetry. Primary processing in pulp and paper includes pulp, paper, and paperboard mills. Secondary manufacturing in pulp and

RepoRt FS/R6/pNW/2015/0006
50 — Oregon, Washington, and California Report
paper includes paperboard containers, paper bags, and stationery.
Chapter 8 describes the shifts in sectoral composition across the NWFP area. In both urban and rural areas of the NWFP area, the role of timber harvesting and processing is declining as a share of total employment. Employment in all timber-related industries declined between 2008 and 2012 in the NWFP area (figure 9-1). Secondary wood manufacturing saw the largest decline – from more than 25,000 jobs in 2008 to approximately 15,000 jobs in 2012. The decline in timber-related industries coincided with the recession, but employment in these industries has not recovered since the end of the recession. Likewise, income in timber-related industries declined between 2008 and 2012 (figure 9-2). However, the decline in income was less stark than the decline in employment. Indeed, income in the logging sector had increased to pre-recession levels by 2012. Both metropolitan and nonmetropolitan areas in the NWFP area saw employment decline in all timber-related sectors between 2001 and 2012 (table 9-1). Timber-related industries account for a larger share of employment and
income in nonmetropolitan counties in the NWFP area. Therefore, the decline of timber-related industries was experienced more acutely in rural areas.
Forest Service and BLM effectsThe 10-year report provides the historical context for broad changes in timber supply and variability in the region by analyzing data from 1965 through 1989 for Oregon, Washington, and California. Data for 1979, however, were missing for all states. Some historical data for California were also unavailable (Charnley et al. 2006). All other analyses in this chapter include data for California.
Annual timber harvest amounts from National Forest System and BLM lands in the NWFP area excluding California averaged about 4.7 billion board feet from 1965 through 1989. Harvests on non-federal ownerships averaged about 8.5 billion board feet. The total across all ownerships was about 13.2 billion board feet. The Forest Service and BLM contribution was about 36 percent of total timber harvest until 1990.
Figure 9-1: Timber industry employment, NWFP area, 2001-2012
Figure 9-2: Timber industry wages and proprietor income, NWFP area, 2001-2012
0
5,000
10,000
15,000
20,000
25,000
30,000
35,000
2001 2002 2003 2004 2006 2007 2008 2009 2010 2011 2012
Empl
oym
ent
Logging Primary solid wood mfg. Secondary wood mfg
Primary pulp and paper Secondary paper
//
-
500
1,000
1,500
2,000
2,500
2001 2002 2003 2004 2006 2007 2008 2009 2010 2011 2012
Wag
es a
nd P
ropr
ieto
r Inc
ome
(M
illio
ns o
f 201
2 U
SD)
Logging Primary solid wood mfg. Secondary wood mfg
Primary pulp and paper Secondary paper
//

Northwest Forest Plan – Socioeconomic Report
Oregon, Washington, and California Report — 51
Table 9-1: Metropolitan and nonmetropolitan job change, 2001 through 2012
Metropolitan 2001 Jobs 2012 Jobs 2001 -2012 Job Change 2001-2012 Percent ChangeLogging 9,914 7,442 -2,472 -24.9Primary solid wood mfg 13,001 10,862 -2,139 -16.5Secondary wood mfg 19,763 9,932 -9,831 -49.7Primary pulp and paper 5,567 4,262 -1,305 -23.4Secondary paper 7,259 5,031 -2,228 -30.7All wood related 55,503 37,529 -17,974 -32.4All industries 5,387,931 5,755,296 367,365 6.8
NonmetropolitanLogging 10,498 8,326 -2,172 -20.7Primary solid wood mfg 19,244 11,028 -8,216 -42.7Secondary wood mfg 10,210 5,308 -4,902 -48.0Primary pulp and paper 7,589 2,762 -4,827 -63.6Secondary paper 1,428 613 -815 -57.1All wood related 48,970 28,038 -20,932 -42.7All industries 859,022* 878,434 19,412 2.3
*Due to data discrepancies, this employment estimate is from the Bureau of Economic Analysis. All other data in this table are from the IMPLAN modeling system.
Figure 9-1: Timber industry employment, NWFP area, 2001-2012
Figure 9-2: Timber industry wages and proprietor income, NWFP area, 2001-2012
0
5,000
10,000
15,000
20,000
25,000
30,000
35,000
2001 2002 2003 2004 2006 2007 2008 2009 2010 2011 2012
Empl
oym
ent
Logging Primary solid wood mfg. Secondary wood mfg
Primary pulp and paper Secondary paper
//
-
500
1,000
1,500
2,000
2,500
2001 2002 2003 2004 2006 2007 2008 2009 2010 2011 2012
Wag
es a
nd P
ropr
ieto
r Inc
ome
(M
illio
ns o
f 201
2 U
SD)
Logging Primary solid wood mfg. Secondary wood mfg
Primary pulp and paper Secondary paper
//

RepoRt FS/R6/pNW/2015/0006
52 — Oregon, Washington, and California Report
Large variations were found in harvest rates during this period. The slumps are typical of national economic downturns such as the large recession of the early 1980s. Excluding the 1980s recession, Forest Service and BLM harvests in the NWFP areas of Oregon and Washington ranged between 4 and 6 billion board feet until 1990. The other ownership harvests ranged between 8 and 10 billion board feet. Since economic recessions and recoveries affect all owners, the peaks and valleys in harvest levels generally coincided across all ownerships. The result was that total harvest levels varied between 12 and 16 billion board feet. The 10-year report also discloses between 1990 and 1994, Forest Service and BLM harvests the NWFP area decreased by 2.5 billion board feet from a level of about 3.3 billion board feet to 0.8 billion board feet. At the same time, harvests on other ownerships in the NWFP area also decreased by 1.5 billion board feet. The decrease in harvest from other ownerships was due primarily to regulation under state forest practices acts, the availability of harvestable volume, and harvesting restrictions on state lands. The combined result was a total loss of 4.0 billion board feet in timber harvest over the first part of the decade from a level of 12.8 billion board feet in 1990 to 8.8 billion board feet in 1994 (as modified from Charnley et al. 2006).
The data for the 20-year report show continued timber harvesting declines on all ownerships between 2004 and 2009 (figure 9-6). Harvests on all ownerships declined by 3.5 billion board feet. Forest Service and BLM harvests declined by 0.2 billion board feet over this period. However, federal timber harvests in the NWFP area rebounded and by 2012 exceeded 2009 harvest volumes (figure 9-5).
Although there is a strong direct cause and effect relationship between timber harvest levels and the number of timber industry jobs and income, this relationship was affected by industry restructuring that included adjusting the amount of logs exported and imported, the closure of
less efficient mills that were unable to compete under new log supply market conditions, and technological change (FEMAT 2003).
The 10-year report shows that the reduction in timber harvest across all ownerships forced the local timber industry to pay higher log prices. This increase in price was similar to log prices in the international market resulting in shifts in log exports and imports. The information on log exports and imports are based on data from the Seattle and Snake-Columbia Customs Districts (Warren 2004, Warren 2009). Since the export and import data generally cover the entire Pacific Northwest, the values were reduced by 10 percent. The factor is the average ratio of east-side harvests in Oregon and Washington to total harvest in these states during the years 2004 through 2007. The resulting import and export data likely represent a better approximation of the values associated with the NWFP area than the unadjusted totals. Softwood log exports dropped from 2.7 billion board feet in 1990 to 0.7 billion board feet by 2000. At the same time, imports increased from about 7 million board feet to almost 250 million board feet. The result was an overall shift in exports and imports providing about 2.3 billion board feet more to local timber processing industries in 2000 than in 1990 (as modified from Charnley et al. 2006).
Changes in the Japanese market and higher log prices led to the redirection of logs from the export market that helped timber manufacturing industries. These changes negatively impacted the timber export industry and reduced revenues for some private land owners (Haynes 2008).
Imports steadily increased as exports decreased until 2005 when they offset each other. However, the imports and export trends reversed beginning in 2006 lowering the amount of logs available for timber processing industries in the NWFP area. Since timber industry employment and income is based on the quantity of logs processed, the net exports are subtracted from the timber harvest amounts to approximate the volume of logs available for processing by

Northwest Forest Plan – Socioeconomic Report
Oregon, Washington, and California Report — 53
Figure 9-3: Average annual real income per job for five wood-products sectors in the NWFP area, 2001-2012
Table 9-1: Metropolitan and nonmetropolitan job change, 2001 through 2012
Metropolitan 2001 Jobs 2012 Jobs 2001 -2012 Job Change 2001-2012 Percent Change
Logging 9,914 7,442 -2,472 -24.9 Primary solid wood mfg 13,001 10,862 -2,139 -16.5 Secondary wood mfg 19,763 9,932 -9,831 -49.7 Primary pulp and paper 5,567 4,262 -1,305 -23.4 Secondary paper 7,259 5,031 -2,228 -30.7 All wood related 55,503 37,529 -17,974 -32.4 All industries 5,387,931 5,755,296 367,365 6.8 Nonmetropolitan Logging 10,498 8,326 -2,172 -20.7 Primary solid wood mfg 19,244 11,028 -8,216 -42.7 Secondary wood mfg 10,210 5,308 -4,902 -48.0 Primary pulp and paper 7,589 2,762 -4,827 -63.6 Secondary paper 1,428 613 -815 -57.1 All wood related 48,970 28,038 -20,932 -42.7 All industries 859,022* 878,434 19,412 2.3 *Due to data discrepancies, this employment estimate is from the Bureau of Economic Analysis. All other data in this table are from the IMPLAN modeling system.
$-
$20,000
$40,000
$60,000
$80,000
$100,000
$120,000
$140,000
2001 2002 2003 2004 2006 2007 2008 2009 2010 2011 2012
Aver
age
Annu
al In
com
e pe
r Job
(2
012
USD
)
Logging Primary solid wood mfg. Secondary wood mfg
Primary pulp and paper Secondary paper
//
0
2
4
6
8
10
12
14
16
18
Tim
ber h
arve
st (b
illio
n bo
ard
feet
)
Plan FS, BLM Plan other Plan total
Figure 9-4. Timber Harvest in the NwFP Area of Oregon and Washington States

RepoRt FS/R6/pNW/2015/0006
54 — Oregon, Washington, and California Report
Figure 9-4: No change to figure
Figure 9-5: Timber harvest by general ownership-class, 1995-2012
Figure 9-6: Timber harvest, net export, and volume processed in NWFP area, 1995-2012
-
1,000
2,000
3,000
4,000
5,000
6,000
7,000
8,000
9,000
10,000
Tim
ber H
arve
st (M
illio
n Bo
ard
Feet
)
NWFP Area, Other Ownership NWFP Area, FS and BLM
-
1,000
2,000
3,000
4,000
5,000
6,000
7,000
8,000
9,000
10,000
1995 1996 1997 1998 1999 2000 2001 2002 2003 2004 2005 2006 2007 2008 2009 2010 2011 2012
Tim
ber V
olum
e (m
illio
n bo
ard
feet
)
NWFP Total Harvest, All Ownership NWFP Area Exports Less Imports
Logs Processed in Region

Northwest Forest Plan – Socioeconomic Report
Oregon, Washington, and California Report — 55
Figure 9-7?
local primary wood products industries in the NWFP area (figure 9-6). Decreasing exports have mitigated some of the effects of the federal harvest reductions.
The 10-year report showed that about two-thirds of the primary-wood-products employment was lost in the first half of the 1990s and that the rate of decline was much slower at the end of the decade. Although most of the job losses were associated with the decline in volume harvested, some of the losses were also due to technological changes in the primary wood manufacturing industries.
To identify potential changes in employment opportunities related to technological advancements, employment in the primary wood products manufacturing and in logging is compared to the volume available to these industries each year from 2001 through 2012. The logging industry is identified separately because this work is done whether or not the logs are processed locally or exported
out of the NWFP area. To identify direct jobs per million board feet of timber harvest, employment in the remaining primary wood products industries is compared to the volume available to these industries. These data are presented in table 9-3.
The jobs per million board feet remain fairly constant in the logging industry across the years 2001 through 2012 analyzed in this report. There was a steady decline in primary wood manufacturing jobs per million board feet between 2001 and 2004. Primary wood manufacturing shows a 19 percent decline in jobs per million board feet during this time period (table 9-3).
In 2012, timber harvested from NFS and BLM-managed lands in the NWFP area supported approximately 2,300 direct jobs and an additional 2,500 indirect and induced jobs throughout the 72 counties (figure 2-1).
0.000.50
1.001.502.002.50
3.00
3.504.004.505.00
Jobs
per
mill
ion
boar
d fe
et
Logging jobs per MMBF Primary wood mfg. jobs per MMBF
2005
data
are n
ot av
ailab
le
Figure 9-7: Jobs per mission board feet of harvest on all ownerships. 2001-2012..

RepoRt FS/R6/pNW/2015/0006
56 — Oregon, Washington, and California Report
Table 9-3: Employment rates for the logging and primary wood manufacturing, 2001-2012
2001 2002 2003 2004 2005 2006 2007 2008 2009 2010 2011 2012Employment Logging 20,412 20,777 20,777 20,322 na 20,936 21,480 22,048 14,598 15,585 15,900 15,768Primary wood manufacturing 45,401 43,183 41,721 42,774 na 42,357 39,068 29,269 21,978 21,565 22,357 21,891Total Employment 65,813 63,959 2,497 63,096 na 63,294 60,548 51,317 36,576 37,149 38,257 37,659 Harvest (million board feet) Total harvest 7,508 7,927 7,866 8,672 8,490 8,072 7,474 6,613 5,099 6,519 6,841 6,758 Logs Processed in Region 6,930 7,388 7,360 8,112 8,008 7,591 6,869 5,914 4,471 5,528 5,362 5,631 Jobs per million board feet Logging 2.7 2.6 2.6 2.3 na 2.6 2.9 3.3 2.9 2.4 2.3 2.3Primary wood manufacturing 6.6 5.8 5.7 5.3 na 5.6 5.7 4.9 4.9 3.9 4.2 3.9
Nontimber and Recreation-Related Jobs and IncomeThe region’s forests contribute to employment and income in several industries based on both commodity and noncommodity products, uses, and services. Dispersed and developed recreation, commercial fishing, hunting, special forest products, mining, and grazing all contribute to the region’s economic health, and they are all affected by changes in federal forest management.
Nontimber Forest IndustriesSeveral nontimber forest-based industries are significant to employment in the Pacific Northwest. The 10-year report discusses these industries and their associated employment to identify potential trends that may be associated with NWFP implementation.
The authors of the 10-year report found that comparing jobs and income associated with the nontimber-related industries to the earlier estimates identified in the FEMAT report was impossible because of differences in reporting techniques and unknown assumptions about full-time job equivalents. For example, many forestry-related activities like gathering floral greens and mushrooms are seasonal and short in duration
so estimating comparable job figures is difficult. Data availability is also a problem, because the proportion of these industries supported by federal lands is unknown. Instead of trying to estimate actual employment opportunities supported by federal forests in these industries, the 10-year report shows trends in employment for related industries using IMPLAN data for 1994 through 2000. These data show the importance, and status and trends of these industries in the region. The results of that analysis was that the nontimber forest industries associated with the livestock industry, forestry products, forestry services, fishing and mining together comprised less than two percent of all employment in the NWFP area, and only a portion of these jobs are associated with federal lands. The 10-year report also reveals that annual changes in these industries varied by less than three percent (as modified from Charnley et al. 2006).
As with the 15-year report, the 20-year report does not carry forward the analysis completed for the 10-year report. The switch from the SIC to the NAICs industry classification system made comparisons of industry data before 2001

Northwest Forest Plan – Socioeconomic Report
Oregon, Washington, and California Report — 57
to data for 2001 and later not possible; Forest Service and BLM related employment in these industries was a small contribution and there was relative employment stability within these industries.
RecreationForest-based recreation associated with the National Forest and BLM lands under the Plan included activities such as off-road vehicle use, sightseeing, hiking, camping, hunting, fishing, boating, rafting, bicycling, and winter sports. Measuring the number of people employed in association with these activities is not easy.
The 10-year report states that employment gains were expected in some of the recreation and tourism industries because of the land-allocation strategies in the NWFP. However, Tuchman et al. (1996) concluded that not enough is known to reliably estimate the effects of NWFP implementation on jobs and income associated with forest-based recreation. The finding was true for the 10-year report, and remains true for the 15-year report. We were not able to conduct an analysis of job and income trends associated with recreation uses. However, an analysis of recreation data current at this time is included to provide an indication about the importance and status of the industry in the region and to document existing data for future use (as modified from Charnley et al. 2006).
Millions of visitors recreate on NFS and BLM-managed lands in the NWFP area. The annual number of visits is estimated at approximately 20 million – with 5.3 million to BLM-managed lands and 14.7 million to NFS lands in the NWFP area (see chapter 7). Visitors to NFS and BLM-managed lands in the NWFP area spend money on lodging, restaurants, souvenirs, and other trip-related expenses. In 2012, NFS and BLM recreation visitors supported approximately 6,800 direct jobs and 2,900 indirect and induced jobs in the NWFP area (figure 2-1). Recreation visitor spending, therefore, is the largest single source of economic activity associated with NFS and BLM management in the NWFP area.
DiscussionThe 10-year report notes the expectation that the NWFP would provide predictable levels of resource outputs and recreation opportunities, which would in turn provide predictable levels of employment. This was not achieved with respect to timber supply. The NWFP’s effect on nontimber resources and recreation opportunities was either minimal or not readily discernable. Federal public lands continue to be an important part of the forest base in the Pacific Northwest, but the amount of forest resources, specifically timber, that support consumptive and commercial uses has lessened along with the relative importance of federal forest resource-related employment and income. Timber outputs from National Forest System and BLM lands vary and remain at a much lower level than before the NWFP. Initial projections in the loss of timber-related employment were realized. Recreation uses of these lands will likely increase as will recreation-related employment. Data associated with nontimber resources and recreation outputs were scarce during NWFP development. At that time, the agencies could not predict the effect of the NWFP standards and guidelines on nontimber commodity and noncommodity products, uses, and services from the region’s forests. The data are still not available, and information on relationships is generally not known. There has been little clarification of the short- and long-term economic effects expected on municipal and nonfederal water systems, grazing, minerals, special forest products, recreation residences, and recreation facilities. Because the economic contribution of all forest resources to the regional economy of the NWFP area in 2000 was small, continued implementation is not likely to change existing economic conditions and trends in the NWFP area overall. As noted earlier, however, resources and effects of the NWFP are not evenly distributed. Subregions, individual businesses, and individuals are not affected equally (as modified from Charnley et al. 2006).

RepoRt FS/R6/pNW/2015/0006
58 — Oregon, Washington, and California Report
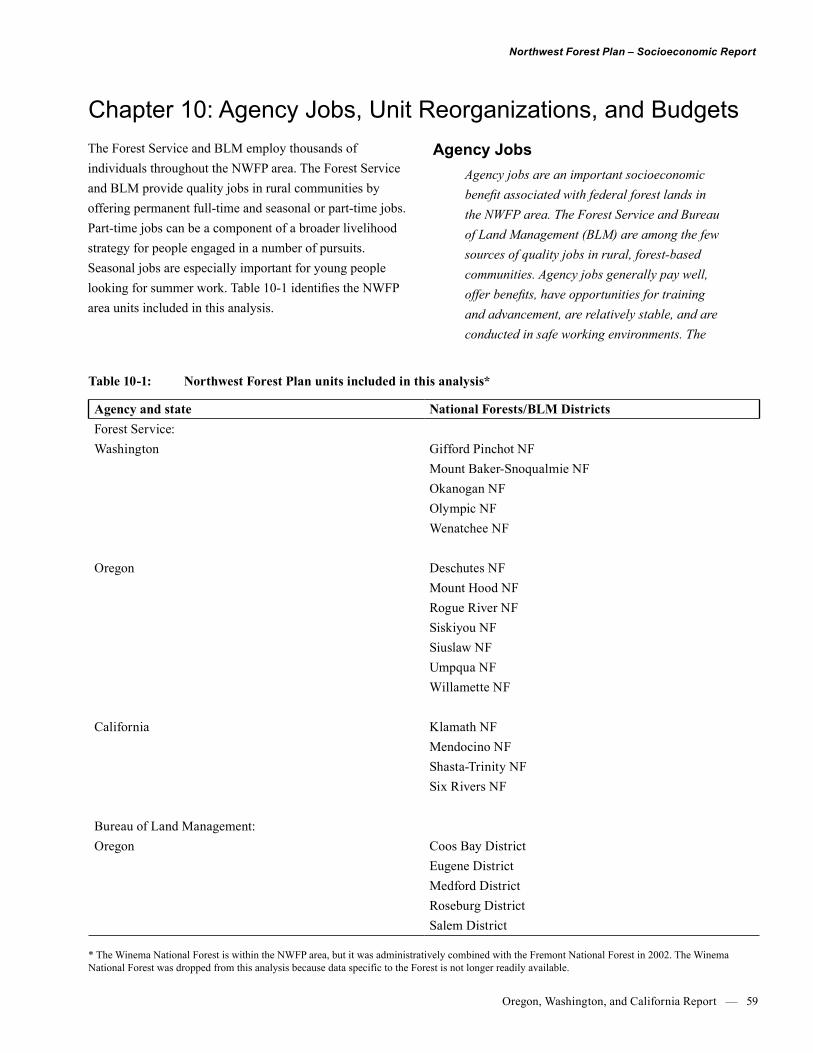
Northwest Forest Plan – Socioeconomic Report
Oregon, Washington, and California Report — 59
Chapter 10: Agency Jobs, Unit Reorganizations, and Budgets The Forest Service and BLM employ thousands of individuals throughout the NWFP area. The Forest Service and BLM provide quality jobs in rural communities by offering permanent full-time and seasonal or part-time jobs. Part-time jobs can be a component of a broader livelihood strategy for people engaged in a number of pursuits. Seasonal jobs are especially important for young people looking for summer work. Table 10-1 identifies the NWFP area units included in this analysis.
Agency JobsAgency jobs are an important socioeconomic benefit associated with federal forest lands in the NWFP area. The Forest Service and Bureau of Land Management (BLM) are among the few sources of quality jobs in rural, forest-based communities. Agency jobs generally pay well, offer benefits, have opportunities for training and advancement, are relatively stable, and are conducted in safe working environments. The
Table 10-1: Northwest Forest Plan units included in this analysis*
Agency and state National Forests/BLM DistrictsForest Service:Washington Gifford Pinchot NF
Mount Baker-Snoqualmie NFOkanogan NFOlympic NFWenatchee NF
Oregon Deschutes NFMount Hood NF Rogue River NFSiskiyou NFSiuslaw NFUmpqua NFWillamette NF
California Klamath NFMendocino NFShasta-Trinity NFSix Rivers NF
Bureau of Land Management:Oregon Coos Bay District
Eugene DistrictMedford DistrictRoseburg DistrictSalem District
* The Winema National Forest is within the NWFP area, but it was administratively combined with the Fremont National Forest in 2002. The Winema National Forest was dropped from this analysis because data specific to the Forest is not longer readily available.

RepoRt FS/R6/pNW/2015/0006
60 — Oregon, Washington, and California Report
Forest Service and BLM historically offered many permanent full-time and seasonal or part-time jobs in local communities. Part-time jobs are especially important for young people looking for summer work, and provide a component of a broader livelihood strategy for people engaged in a number of different employment and social pursuits. Not only are federal jobs valued, but federal employees and their spouses are often well educated and active in their communities. They may be volunteers in local schools, fire departments, and civic groups, and in some cases, they can be looked upon as local leaders. They contribute substantial human capital that enhances the capacity of communities where they reside (as modified from Charnley et al. 2006).
ExpectationsWith the implementation of the Plan, it was estimated that rural communities in the NWFP area would lose fewer than 2,000 Forest Service jobs. Potential staffing changes were not estimated for the BLM (as modified from Charnley et al. 2006).
Data AnalysisThis report uses similar data to previous reports and extends the time series through 2012. The data are reported by BLM state and National Forest region. The Winema NF is excluded from this data set since it was administratively combined with the Fremont NF. There are no trends at the unit level that provide a distinctly different picture than the one provided at the agency scale. The unit data are not included in this report.
Results and DiscussionAnalysis in this 20-year report is consistent with the 15-year report. The 15-year report showed a marked decline in employment on NWFP-area forests in Oregon and Washington (Region 6). This trend has continued, with employment in Region 6 falling to approximately 2,300 by 2012. In 2008 Region 6 NWFP forests had 2,500 employees
and in 1993 they had 5,700 employees (figure 10-1). The decline in employment on NWFP-area forests in California has been less steep. Indeed, in the 15-year monitoring report employment on these forests had risen above 1993 levels. However, by 2012 employment on NWFP-area forests in California had again fallen to the 2007 level (figure 10-1). The BLM units in the NWFP area employ far fewer people than the Forest Service. In the 15-year monitoring report, BLM employment trends mimicked those in the Forest Service. However, between 2008 and 2012 BLM employment grew from about 500 to 1,000. By 2012, BLM units employed as many people as they had in 1993 (figure 10-1). Therefore, over the past 5 years BLM and Forest Service employment trends have diverged.
Unit ReorganizationsMeaningful collaboration between federal agencies and local communities requires that community members have ongoing access to federal decision-makers such as BLM district managers and Forest Service supervisors. Interactions between local people and agency employees also help build trust. One potential effect of reductions in agency staffing levels is office closures. The number of agency offices housing decision-makers changed during the study period affecting the level and type of agency presence in local communities (as modified from Charnley et al. 2006).
ExpectationsAlthough staffing losses were projected for the Forest Service, the projections did not include expectations for a change in the distribution of agency offices (as modified from Charnley et al. 2006).
Data AnalysisThe distribution of offices housing field-unit line officers is used as an indicator to measure the presence of empowered agency officials in NWFP area communities (Charnley et

Northwest Forest Plan – Socioeconomic Report
Oregon, Washington, and California Report — 61
al. 2006). The data analyzed in the 10-year report compares 1990 and 2004. The year 2010 was added to the data set for the 15-year report. The 2010 data were gathered from agency websites and agency contact lists. These data have not been updated for the 20-year report.
Results and DiscussionThe Forest Service in the NWFP area had 17 supervisor offices and 79 district ranger offices in 1990 (table 10-2). In 2004, these numbers had decreased to 15 forest supervisor offices and 59 district ranger offices, and by 2010, there was a further net reduction of four district ranger offices. The reduction included six closures and two openings. This reduction in offices represents a 27 percent decrease by 2010 in the number of Pacific Northwest communities with Forest Service line officers.
In 1990, 24 line officers led local BLM NWFP area units excluding associate district managers. The total includes five district managers and 19 field managers. By 2004, seven line officers positions (almost 30 percent) were lost (table 10-2). All of these positions were field managers. The number of district managers and the locations of offices
housing line officers remained unchanged. There are no differences in the total number of line officers and locations of offices in 2010. However, the number of field managers in offices has changed.
Budgets The budget allocations determine the funding levels for the staffs and offices on units in the NWFP area. For this reason, budgets are assessed as an explanatory factor for the staffing and office consolidation trends identified in the previous sections (Charnley et al. 2006).
ExpectationsEven though no estimates were provided of the funding needed by agency field units or programs to accomplish ecosystem management as envisioned under the Plan, the decreases in timber harvest levels and other resource management activities were expected to result in a downward trend in budgets and programs supporting those activities (Charnley et al. 2006).
Figure 9-7: repeat
Figure 10-1: NWFP area staffing by agency, 1993-2012
2001 2002 2003 2004 2005 2006 2007 2008 2009 2010 2011 2012EmploymentLogging 20,412 20,777 20,777 20,322 na 20,936 21,480 22,048 14,598 15,585 15,900 15,768Primary wood manufacturing 45,401 43,183 41,721 42,774 na 42,357 39,068 29,269 21,978 21,565 22,357 21,891Total Employment 65,813 63,959 62,497 63,096 na 63,294 60,548 51,317 36,576 37,149 38,257 37,659
Harvest (million board feet)Total harvest 7,508 7,927 7,866 8,672 8,490 8,072 7,474 6,613 5,099 6,519 6,841 6,758 Logs Processed in Region 6,930 7,388 7,360 8,112 8,008 7,591 6,869 5,914 4,471 5,528 5,362 5,631
Jobs per million board feetLogging 2.7 2.6 2.6 2.3 na 2.6 2.9 3.3 2.9 2.4 2.3 2.3Primary wood manufacturing 6.6 5.8 5.7 5.3 na 5.6 5.7 4.9 4.9 3.9 4.2 3.9
Table 9-3: Employment rates for the logging and primary wood manufacturing, 2001-2012
-
1,000
2,000
3,000
4,000
5,000
6,000
1993
1994
1995
1996
1997
1998
1999
2000
2001
2002
2003
2004
2005
2006
2007
2008
2009
2010
2011
2012
Region 6 Region 5 BLM Oregon

RepoRt FS/R6/pNW/2015/0006
62 — Oregon, Washington, and California Report
Tabl
e 10
-2:
Loc
atio
ns o
f For
est S
ervi
ce a
nd B
urea
u of
Lan
d M
anag
emen
t offi
ces w
ith li
ne o
ffice
rs, 1
990,
200
4 an
d 20
10.
1990
2004
2010
Fore
st S
ervi
ce (
Was
hing
ton
Stat
e
Vanc
ouve
r (Gif
ford
Pin
chot
SO
)Va
ncou
ver
(Gif
ford
Pin
chot
SO
)Va
ncou
ver
(Gif
ford
Pin
chot
SO
)R
andl
e R
andl
e (C
owlit
z V
alle
y R
D)
Ran
dle
(Cow
litz
Val
ley
RD
)Tr
out L
ake
(Mou
nt A
dam
s RD
)Tr
out L
ake
(Mou
nt A
dam
s RD
)Tr
out L
ake
(Mou
nt A
dam
s RD
)A
mbo
y (M
ount
St.
Hel
ens N
M)
Am
boy
(Mou
nt S
t. H
elen
s NM
)A
mbo
y (M
ount
St.
Hel
ens N
M)
Pack
woo
d C
arso
n (W
ind
Riv
er R
D)
Mou
ntla
ke T
erra
ce (M
t Bak
er-S
noqu
alm
ie S
O)
Mou
ntla
ke T
erra
ce (M
t Bak
er-S
noqu
alm
ie S
O)
Mou
ntla
ke T
erra
ce (M
t Bak
er-S
noqu
alm
ie S
O)
Sedr
o W
oolle
y (M
ount
Bak
er R
D)
Sedr
o W
oolle
y (M
ount
Bak
er R
D)
Sedr
o W
oolle
y (M
ount
Bak
er R
D)
Dar
ring
ton
Dar
ring
ton
Dar
ring
ton
Skyk
omis
h Sk
ykom
ish
Skyk
omis
hN
orth
Ben
d N
orth
Ben
d (S
noqu
alm
ie R
D)
Nor
th B
end
(Sno
qual
mie
RD
)En
umcl
aw (W
hite
Riv
er R
D)
Wen
atch
ee (W
enat
chee
SO
)W
enat
chee
(Oka
noga
n an
d W
enat
chee
SO
)W
enat
chee
(Oka
noga
n an
d W
enat
chee
SO
)C
hela
nC
hela
nC
hela
nC
le E
lum
Cle
Elu
mC
le E
lum
Entia
tEn
tiat
Entia
tLa
ke W
enat
chee
Leav
enw
orth
Leav
enw
orth
(Lak
e W
enat
chee
/Lea
venw
orth
RD
)Le
aven
wor
th (W
enat
chee
Riv
er R
D)
Nac
hes
Nac
hes
Nac
hes
Oka
noga
n (O
kano
gan
SO)
Win
thro
p W
inth
rop
(Met
how
Val
ley
RD
)W
inth
rop
(Met
how
Val
ley
RD
)Tw
isp
Tona
sket
Tona
sket
Tona
sket
Oly
mpi
a (O
lym
pic
SO)
Oly
mpi
a (O
lym
pic
SO)
Oly
mpi
a (O
lym
pic
SO)
Hoo
dspo
rt (H
ood
Can
al R
D)
Hoo
dspo
rt (H
ood
Can
al R
D)
Hoo
dspo
rt (H
ood
Can
al R
D)
Qui
lcen
e Q
uina
ult
Fork
s (So
ledu
ck R
D)
Fork
s (So
ledu
ck R
D)
Fork
s (Pa
cific
RD
)Fo
rest
Ser
vice
b –
Ore
gon
Ben
d (D
esch
utes
SO
)B
end
(Des
chut
es S
O)
Ben
d (D
esch
utes
SO
)B
end
Ben
dB
end
(Ben
d-Ft
. Roc
k R
D)
Cre
scen
tC
resc
ent
Cre
scen
tSi
ster
sSi
ster
sSi
ster
s
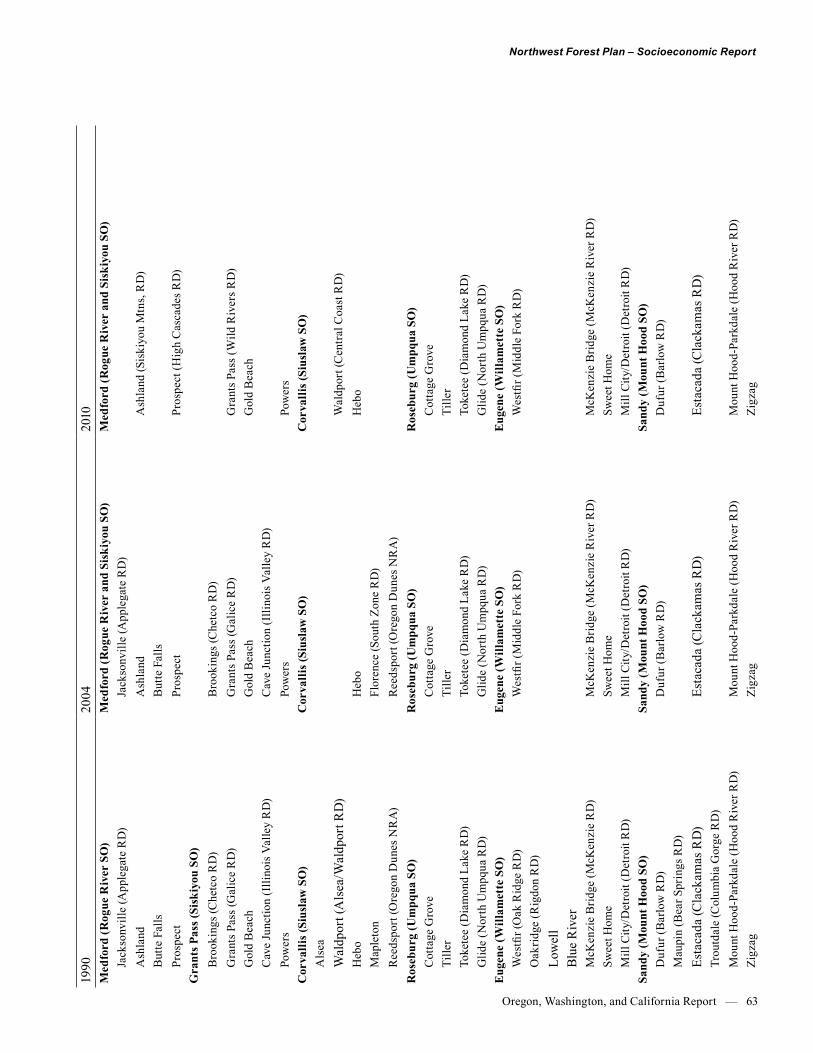
Northwest Forest Plan – Socioeconomic Report
Oregon, Washington, and California Report — 63
1990
2004
2010
Med
ford
(Rog
ue R
iver
SO
)M
edfo
rd (R
ogue
Riv
er a
nd S
iski
you
SO)
Med
ford
(Rog
ue R
iver
and
Sis
kiyo
u SO
)Ja
ckso
nvill
e (A
pple
gate
RD
)Ja
ckso
nvill
e (A
pple
gate
RD
)A
shla
ndA
shla
ndA
shla
nd (S
iski
you
Mtn
s, R
D)
But
te F
alls
But
te F
alls
Pros
pect
Pros
pect
Pros
pect
(Hig
h C
asca
des R
D)
Gra
nts P
ass (
Sisk
iyou
SO
)B
rook
ings
(Che
tco
RD
)B
rook
ings
(Che
tco
RD
)G
rant
s Pas
s (G
alic
e R
D)
Gra
nts P
ass (
Gal
ice
RD
)G
rant
s Pas
s (W
ild R
iver
s RD
)G
old
Bea
chG
old
Bea
chG
old
Bea
ch
Cav
e Ju
nctio
n (I
llino
is V
alle
y R
D)
Cav
e Ju
nctio
n (I
llino
is V
alle
y R
D)
Pow
ers
Pow
ers
Pow
ers
Cor
valli
s (Si
usla
w S
O)
Cor
valli
s (Si
usla
w S
O)
Cor
valli
s (Si
usla
w S
O)
Als
eaW
aldp
ort (
Als
ea/W
aldp
ort R
D)
Wal
dpor
t (C
entr
al C
oast
RD
)H
ebo
Heb
oH
ebo
Map
leto
nFl
oren
ce (S
outh
Zon
e R
D)
Ree
dspo
rt (O
rego
n D
unes
NR
A)
Ree
dspo
rt (O
rego
n D
unes
NR
A)
Ros
ebur
g (U
mpq
ua S
O)
Ros
ebur
g (U
mpq
ua S
O)
Ros
ebur
g (U
mpq
ua S
O)
Cot
tage
Gro
veC
otta
ge G
rove
Cot
tage
Gro
veTi
ller
Tille
rTi
ller
Toke
tee
(Dia
mon
d La
ke R
D)
Toke
tee
(Dia
mon
d La
ke R
D)
Toke
tee
(Dia
mon
d La
ke R
D)
Glid
e (N
orth
Um
pqua
RD
)G
lide
(Nor
th U
mpq
ua R
D)
Glid
e (N
orth
Um
pqua
RD
)E
ugen
e (W
illam
ette
SO
)E
ugen
e (W
illam
ette
SO
)E
ugen
e (W
illam
ette
SO
)W
estfi
r (O
ak R
idge
RD
)W
estfi
r (M
iddl
e Fo
rk R
D)
Wes
tfir (
Mid
dle
Fork
RD
)O
akrid
ge (R
igdo
n R
D)
Low
ell
Blue
Riv
erM
cKen
zie
Brid
ge (M
cKen
zie
RD
)M
cKen
zie
Brid
ge (M
cKen
zie
Riv
er R
D)
McK
enzi
e B
ridge
(McK
enzi
e R
iver
RD
)Sw
eet H
ome
Swee
t Hom
eSw
eet H
ome
Mill
City
/Det
roit
(Det
roit
RD
)M
ill C
ity/D
etro
it (D
etro
it R
D)
Mill
City
/Det
roit
(Det
roit
RD
)Sa
ndy
(Mou
nt H
ood
SO)
Sand
y (M
ount
Hoo
d SO
)Sa
ndy
(Mou
nt H
ood
SO)
Duf
ur (B
arlo
w R
D)
Duf
ur (B
arlo
w R
D)
Duf
ur (B
arlo
w R
D)
Mau
pin
(Bea
r Spr
ings
RD
)Es
taca
da (C
lack
amas
RD
)Es
taca
da (C
lack
amas
RD
)Es
taca
da (C
lack
amas
RD
)Tr
outd
ale
(Col
umbi
a G
orge
RD
)M
ount
Hoo
d-Pa
rkda
le (H
ood
Riv
er R
D)
Mou
nt H
ood-
Park
dale
(Hoo
d R
iver
RD
)M
ount
Hoo
d-Pa
rkda
le (H
ood
Riv
er R
D)
Zigz
agZi
gzag
Zigz
ag

RepoRt FS/R6/pNW/2015/0006
64 — Oregon, Washington, and California Report
1990
2004
2010
Kla
mat
h Fa
lls (W
inem
a SO
)K
lam
ath
Falls
(Win
ema
SO)
Che
mul
tC
hem
ult
Che
mul
tC
hilo
quin
Chi
loqu
inC
hilo
quin
Kla
mat
h Fa
lls (K
lam
ath
RD
)K
lam
ath
Falls
(Kla
mat
h R
D)
Kla
mat
h Fa
lls (K
lam
ath
RD
)Fo
rest
Ser
vice
b –
Cal
iforn
iaY
reka
(Kla
mat
h SO
)Y
reka
(Kla
mat
h SO
)K
lam
ath
Riv
er (O
ak K
noll
RD
)H
appy
Cam
pH
appy
Cam
pH
appy
Cam
p (H
appy
Cam
p/O
ak K
noll
RD
)Et
na (S
alm
on R
iver
RD
)M
ount
Heb
ron
(Goo
sene
st R
D)
Mou
nt H
ebro
n (G
oose
nest
RD
)M
ount
Heb
ron
(Goo
sene
st R
D)
Orle
ans (
Uko
nom
RD
)d
Fort
Jone
s (Sc
ott R
iver
RD
)Fo
rt Jo
nes (
Salm
on R
iver
and
Sco
tt R
iver
RD
s)Fo
rt Jo
nes (
Salm
on R
iver
and
Sco
tt R
iver
RD
s)W
illow
s (M
endo
cino
SO
)W
illow
s (M
endo
cino
SO
)W
illow
s (M
endo
cino
SO
)C
ovel
oC
ovel
o (C
ovel
o R
D)
Upp
er L
ake
Upp
er L
ake
(Cov
elo
and
Upp
er L
ake
RD
s)U
pper
Lak
e (U
pper
Lak
e R
D)
Ston
yfor
dW
illow
s (G
rind
ston
e R
D)
Will
ows (
Gri
ndst
one
RD
)C
orni
ngR
eddi
ng (S
hast
a-Tr
inity
SO
) R
eddi
ng (S
hast
a-Tr
inity
SO
)R
eddi
ng (S
hast
a-Tr
inity
SO
)Bi
g B
ar
Hay
fork
(Yol
la B
olla
and
Hay
fork
RD
s)H
ayfo
rk (H
ayfo
rk a
nd Y
olla
Bol
ly R
Ds)
Hay
fork
(Hay
fork
and
Yol
la B
olly
RD
s)W
eave
rvill
e (W
eave
rvill
e an
d R
eddi
ng R
Ds)
Wea
verv
ille
(Big
Bar
and
Wea
verv
ille
RD
s)W
eave
rvill
e (B
ig B
ar a
nd W
eave
rvill
e R
Ds)
Mou
ntai
n G
ate/
Red
ding
(Sha
sta
Lake
RD
)M
ount
ain
Gat
e/R
eddi
ng (S
hast
a La
ke R
D)
Mou
ntai
n G
ate/
Red
ding
(Sha
sta
Lake
RD
)M
ount
Sha
sta
(Mou
nt S
hast
a an
d M
cClo
ud R
Ds)
McC
loud
(Mou
nt S
hast
a an
d M
cClo
ud R
Ds)
McC
loud
(Mou
nt S
hast
a an
d M
cClo
ud R
Ds)
Eur
eka
(Six
Riv
ers S
O)
Eur
eka
(Six
Riv
ers S
O)
Eur
eka
(Six
Riv
ers S
O)
Orle
ans (
Orle
ans R
D)
Orle
ans (
Orle
ans R
D)
Orle
ans (
Orle
ans R
D)
Will
ow C
reek
(Low
er T
rini
ty R
D)
Will
ow C
reek
(Low
er T
rini
ty R
D)
Will
ow C
reek
(Low
er T
rini
ty R
D)
Brid
gevi
lle (M
ad R
iver
RD
)B
ridge
ville
(Mad
Riv
er R
D)
Brid
gevi
lle (M
ad R
iver
RD
)G
asqu
et (S
mith
Riv
er N
RA
)G
asqu
et (S
mith
Riv
er N
RA
)G
asqu
et (G
asqu
et R
D a
nd S
mith
Riv
er N
RA
)

Northwest Forest Plan – Socioeconomic Report
Oregon, Washington, and California Report — 65
1990
2004
2010
Bur
eau
of L
and
Man
agem
ent –
Ore
gon
Nor
th B
end
(Coo
s Bay
Dis
tric
t Man
ager
and
3
reso
urce
are
a m
anag
ers)
Nor
th B
end
(Coo
s Bay
Dis
tric
t Man
ager
and
2 fi
eld
man
ager
s)N
orth
Ben
d (C
oos B
ay D
istr
ict M
anag
er a
nd 1
fiel
d m
anag
er)
Eug
ene
(Dis
tric
t Man
ager
and
3 re
sour
ce a
rea
man
ager
s)E
ugen
e (D
istr
ict M
anag
er a
nd 2
fiel
d m
anag
ers )
Eug
ene
(Dis
tric
t Man
ager
and
2 fi
eld
man
ager
s )
Sale
m (D
istr
ict M
anag
er a
nd 4
reso
urce
are
a m
anag
ers)
Sa
lem
(Dis
tric
t Man
ager
and
1 fi
eld
man
ager
)Sa
lem
(Dis
tric
t Man
ager
and
2 fi
eld
man
ager
s)
Tilla
moo
k (re
sour
ce a
rea
man
ager
)Ti
llam
ook
(fiel
d m
anag
er)
Tilla
moo
k (fi
eld
man
ager
)M
edfo
rd (D
istr
ict M
anag
er a
nd 4
reso
urce
are
a m
anag
ers)
Med
ford
(Dis
tric
t Man
ager
and
4 fi
eld
man
ager
s)M
edfo
rd (D
istr
ict M
anag
er a
nd 4
fiel
d m
anag
ers)
Ros
ebur
g (D
istr
ict M
anag
er a
nd 4
fiel
d m
anag
ers)
Ros
ebur
g (D
istr
ict M
anag
er a
nd 2
fiel
d m
anag
ers)
Ros
ebur
g (D
istr
ict M
anag
er a
nd 2
fiel
d m
anag
ers)
Not
es:
SO
= su
perv
isor
’s o
ffice
, RD
= ra
nger
dis
trict
offi
ce, N
M =
nat
iona
l mon
umen
t offi
ce, N
RA
= n
atio
nal r
ecre
atio
n ar
ea o
ffice
. Lo
catio
ns o
f For
est S
ervi
ce su
perv
isor
s’ of
fices
and
Bur
eau
of L
and
Man
agem
ent d
istri
ct o
ffice
s are
dis
tingu
ishe
d by
bol
dfac
e.
Fore
st S
ervi
ce d
ata
omit
depu
ty fo
rest
supe
rvis
ors a
nd a
ssis
tant
dis
trict
rang
ers.
Plac
e na
mes
are
show
n. W
here
pla
ce n
ame
and
rang
er d
istri
ct n
ame
diffe
r, bo
th a
re p
rovi
ded.
Adm
inis
tratio
n of
the
Uko
nom
RD
mov
ed fr
om th
e K
lam
ath
NF
to th
e Si
x R
iver
s NF
in 1
999.
Data AnalysisBudget data at several scales across the study period are evaluated in the 10-year report to understand the role budgets play. The 10-year report compares NWFP area budget allocations to agency allocations at the national scale, among local units, and among programs (Charnley et al. 2006).
In the 15-year and 20-year reports, the scales chosen for the budget evaluation are Forest Service regional and BLM state offices, and agency units. This reduces the complexity of the analysis to focus on the important social and economic consequences related to changing budgets. Agency national perspectives were not addressed since they do little to identify social and economic trends in the NWFP area. A program level analysis was also not undertaken since we believe the trends in total budget provide a reliable indicator of how dollar spending affects staffing and office management. Program expenditures tend to vary based on management emphasis during a particular year, and it does not matter which program pays for staffing and facilities. The sources of data for the 15-year and 20-year reports budget analyses are the total annual allocations to NWFP area units from agency regional and state offices. The data are generally available for 2004 through 2012.
The 2003 through 2005 Forest Service budget for Region 6 were increased by 20 percent. During those years, cost pools to pay for items such as overhead were managed off the top so the dollars were not included as part of the individual unit budgets. Without this adjustment, the Forest Service budgets during the three years would not be comparable to the other years. The 20 percent factor is based on an average cost pool amount identified in the 2006 through 2008 budgets.
All budget data presented here were adjusted to constant dollars using 2012 as the base year. Gross domestic product (GDP) price deflators from the Bureau of Economic Analysis were used to convert annual budget amounts to real 2012 dollars.
The 2004 through 2012 data are added to similar 10-year report data. However, the data presented here will not be directly comparable to the earlier report for two reasons. The base year for the budget data was 2003 in the 10-year

RepoRt FS/R6/pNW/2015/0006
66 — Oregon, Washington, and California Report
Figure 10-2: Total budget for all R6 forests in the NWFP area, 1993-2012
Figure 10-3: Budgets for all R6 national forests in the NWFP area, 2003-2012
$-
$100,000
$200,000
$300,000
$400,000
$500,000
$600,000
Thou
sand
dol
lars
, bas
e ye
ar 2
012
NWFP R6 Budget
$-
$10,000.00
$20,000.00
$30,000.00
$40,000.00
$50,000.00
$60,000.00
2003 2004 2005 2006 2007 2008 2009 2010 2011 2012
Thou
sand
dol
lars
, bas
e ye
ar 2
012
Deschutes
CRGNSA
Gifford Pinchot
Mt. Baker - Snoqualmie
Mt. Hood
Olympic
Rogue River - Siskiyou
Siuslaw
Umpqua
Okanogan - Wenatchee
Willamette
report, and secondly, the Winema NF data are removed. The Winema is now administratively combined with the Fremont NF so that budget data for the Winema NF after 2001 are no longer available.
ResultsWhile budget reductions may be one explanation for lower agency employment, the data do not substantiate this explanation. Figures 10-2 and 10-4 show that NWFP-area
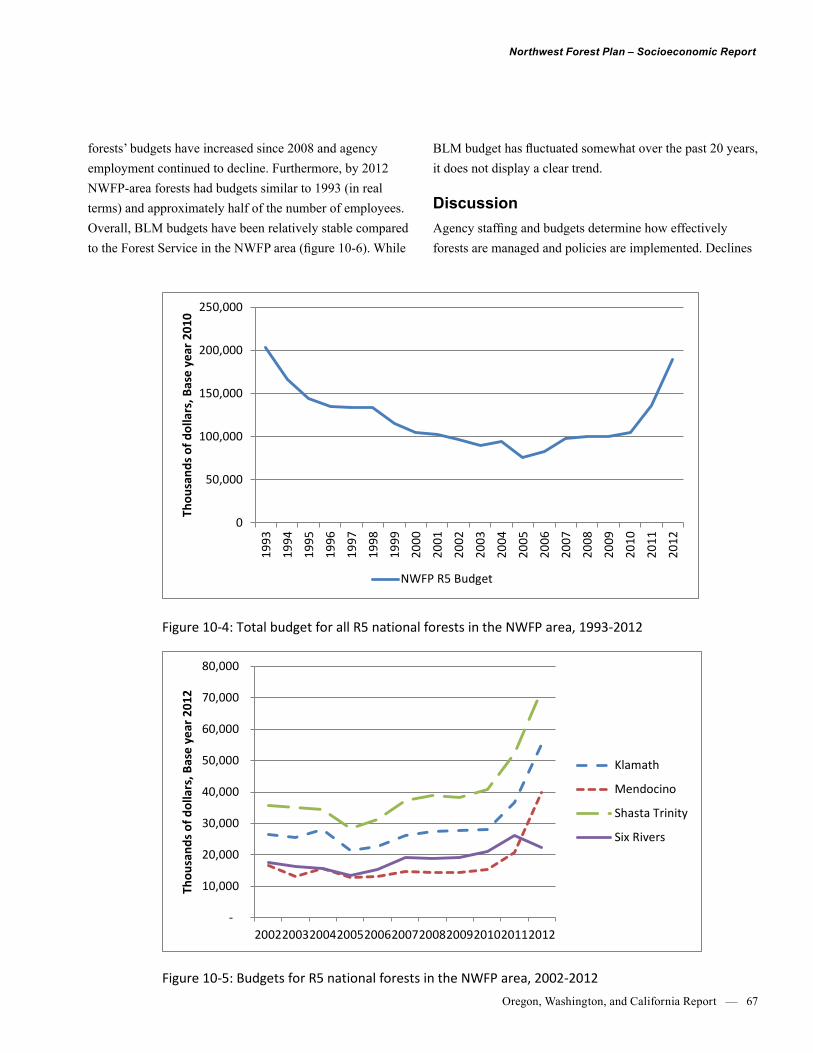
Northwest Forest Plan – Socioeconomic Report
Oregon, Washington, and California Report — 67
Figure 10-4: Total budget for all R5 national forests in the NWFP area, 1993-2012
Figure 10-5: Budgets for R5 national forests in the NWFP area, 2002-2012
0
50,000
100,000
150,000
200,000
250,000
1993
1994
1995
1996
1997
1998
1999
2000
2001
2002
2003
2004
2005
2006
2007
2008
2009
2010
2011
2012
Thou
sand
s of d
olla
rs, B
ase
year
201
0
NWFP R5 Budget
-
10,000
20,000
30,000
40,000
50,000
60,000
70,000
80,000
20022003200420052006200720082009201020112012
Thou
sand
s of d
olla
rs, B
ase
year
201
2
Klamath
Mendocino
Shasta Trinity
Six Rivers
forests’ budgets have increased since 2008 and agency employment continued to decline. Furthermore, by 2012 NWFP-area forests had budgets similar to 1993 (in real terms) and approximately half of the number of employees. Overall, BLM budgets have been relatively stable compared to the Forest Service in the NWFP area (figure 10-6). While
BLM budget has fluctuated somewhat over the past 20 years, it does not display a clear trend.
DiscussionAgency staffing and budgets determine how effectively forests are managed and policies are implemented. Declines

RepoRt FS/R6/pNW/2015/0006
68 — Oregon, Washington, and California Report
Figure 10-6: Total budget for all Oregon BLM districts in the NWFP area, 1993-2012
Figure 10-7: Budgets for Oregon BLM districts in the NWFP area, 1993-2012
0
20,000
40,000
60,000
80,000
100,000
120,000
140,000
160,00019
9319
9419
9519
9619
9719
9819
9920
0020
0120
0220
0320
0420
0520
0620
0720
0820
0920
1020
1120
12
Thou
sand
dol
lars
, 201
2 U
SD
NWFP BLM Budget Average
$-
$10,000
$20,000
$30,000
$40,000
$50,000
$60,000
1993
1994
1995
1996
1997
1998
1999
2000
2001
2002
2003
2004
2005
2006
2007
2008
2009
2010
2011
2012
Expe
nditu
res,
thou
sand
s of 2
012
USD
Salem
Eugene
Roseburg
Medford
Coos Bay
in staffing affect the amount of resource management work that can be accomplished and the amount and quality
of services provided, such as recreation opportunities on federal lands.

Northwest Forest Plan – Socioeconomic Report
Oregon, Washington, and California Report — 69
Chapter 11: Payments to County GovernmentsIn 2000, to increase support to timber-dependent
counties as well as to other counties containing public land, Congress enacted the Secure Rural Schools and Community Self-Determination Act.10 The Secure Rural Schools Act provided payments, which replaced Spotted Owl Safety Net payments. The size of the payment was set equal to the average three highest receipt years, by county, under the Twenty-five Percent Fund Act from 1986-1999. The Secure Rural Schools payments to counties associated with National Forest System lands allocated funds to benefit public education and county road systems.
The Secure Rural Schools payments are also part of BLM revenue sharing associated with O&C and Wagon Road lands. Eighteen counties in western Oregon receive these payments. The funds are allocated to county general purposes.
With the Forest Service portion of the Secure Rural Schools Act, counties are allowed to set aside up to 15 to 20 percent of the full payment amount for use on projects, such as resources improvement projects on, or near, federal lands. Or, the counties can use the 15 to 20 percent of funds to support services including search, rescue, and emergency services on federal lands; community service work camps; easements for conservation or recreational purposes; forestry-related education activities; fire prevention; and county planning.
The last payment under the original Secure Rural Schools Act was planned for Fiscal Year 2006. An extension of the SRS Payments was signed into law in 2007 with the Iraq Accountability Appropriations Act. The next year, the Emergency Stabilization Act of 2008 was signed into law reauthorizing the Secure Rural Schools Act payments through 2011. The Secure Rural School Act payments were reauthorized through 2016.
Another federal program designed to compensate local governments for the presence of tax-exempt federal lands within their jurisdictions is called Payments in Lieu of Taxes (PILT). PILT legislation was passed in 1976. Seventy-one of the seventy-two NWFP counties receive PILT payments.11
10The following counties in the Northwest Forest Plan area do not receive SRS Act payments: Marin, Napa, Sonoma, Sutter, and Yolo in California, Clatsop, Columbia, Sherman, Washington in Oregon, and Adams, Benton, Franklin, Grant, Island, Kitsap, Pacific, San Juan, Wahkiakum in Washington.
11Kitsap is the only county in the NWFP area that does not receive PILT payments.
The federal lands managed by the Forest Service and BLM total approximately 22.1 million acres in the NWFP area.8 Congress has long recognized the loss of tax revenue as compared to what would be received by local governments if the land were retained in private ownership. As compensation, Congress initiated the Twenty-five Percent Fund Act in 1908. The Act allocates 25 percent of revenue generated from timber sales or use of National Forest System land to the states for distribution to the counties. In 1937, Congress passed the Oregon and California Revested Railroad Lands Act (O&C Act). The O&C Act placed management jurisdiction of revested Oregon and California Railroad lands and Coos Bay Wagon Road (Wagon Road) lands under the Department of Interior. The O&C Act allocated 50 percent of timber receipts generated from revested lands to the counties.
The revenue sharing between federal and local governments based on the Twenty-five Percent Fund Act and the O&C Act resulted primarily from the sale of timber from public lands. Up to 1991, because the amount of payment is based on timber markets, and these markets rose and fell, federal revenue sharing was not a dependable source of funds for local governments. In the early 1990s, payments from the Twenty-five Percent Fund began a sharp decline as timber receipts from Forest Service timber sales fell dramatically. The decline in payments impacted rural communities in the West, particularly in the range of the northern spotted owl (Washington, Oregon, and northern California).
Recognizing the loss of timber revenue and the necessity to support county schools and infrastructure, Congress, in 1991, began making payments as stop-gap measures to mitigate the reduction in revenue to 48 counties in western Oregon, Washington, and northern California.9 In 1993, Congress passed the Omnibus Budget Reconciliation Act of 1993 to provide more long-term alternative payments. The payments, known as the Spotted Owl Safety Net payments, began in 1994 at 85 percent of the average of payments made based on timber receipts from fiscal years 1986-1990, and then declined annually by three percent through 2003. In 2004 the payments would terminate.
8NWFP Overview, http://www.reo.gov/general/aboutnwfp.htm, Accessed 9/9/2010.
9Congress also made payments, as part of the stop-gap measures, to Lake County, Oregon, which is not in the NWFP area.

RepoRt FS/R6/pNW/2015/0006
70 — Oregon, Washington, and California Report
Payments are tied to other federal revenue-sharing programs, including the Twenty-five Percent Fund, the O&C Act and Wagon Road. The size of PILT-based payments to local governments depends on the number of acres of federal land in the county,12 the amount of non-PILT revenue-sharing payments received the previous year, and a payment “formula” involving population levels (USDI 2010).
ExpectationPayments-to-states mitigation measures, especially the Secure Rural Schools payments, were expected to offset the effects of reduced federal timber-harvest receipts on county governments. The mitigation measures, however, have termination dates.
Data AnalysisThe primary sources of Forest Service Secure Rural Schools payment data are the annual Forest Service All Service Receipts reports (Forest Service 2012). Forest Service data before 2004 are from the 10-year report (Charnley et al. 2006). The BLM Secure Rural Schools payment data are from the BLM Oregon State website providing official payments made to counties data (BLM 2012). The PILT data source is the U.S. Department of the Interior payments in lieu of taxes website (USDI 2010).
ResultsThe 15-year report indicated the Secure Rural Schools payments were declining. The latest data show that Secure Rural Schools payments have continued to decline from their peak in 2006. By 2012, SRS payments were at half of the 2008 amount (figure 11-1).
Secure Rural Schools Act payments have not been reauthorized, so county payments will revert to the Twenty-five Percent Fund. The Twenty-five Percent Fund gives counties a share of federal timber receipts. As the 15-year report noted, the Secure Rural Schools adjustment resulted in payments to counties over 20 times higher than what would have occurred under Twenty-five Percent Fund revenue sharing.
Figure 11-2 shows the data for the BLM’s O&C Act and the Wagon Road payments which are also called Secure
12Federal lands are generally those administered by natural resource management agencies. Military lands are mostly excluded.
Rural Schools payments. Oregon and California Railroad and Coos Bay Wagon Road payments have also sharply declined since 2008. By 2012 these payments were at about 1/3 the level of the 2007 payments.
Figure 11-3 shows the data for PILT-based payments from 1996 to 2012. PILT increased by approximately 50 percent in the NWFP area between 2008 and 2012. However, the increase in PILT is not enough to offset declines in SRS, O&C, and CBWR payments.
DiscussionThe 48 counties in the NWFP area that qualify for Secure Rural Schools payments received more than $205 million annually from 2001 to 2004. In 2005, payments rose to $219 million. The next year, the payments peaked at $225 million. By 2012, payments had declined to less than $100 million. Since the Secure Rural Schools payments have not been reauthorized, the counties will receive payments under the Twenty-five Percent Fund. The Twenty-five Percent Fund payments will be a small fraction of the money that was paid under the Secure Rural Schools Act.
As stated in the NWFP 10-year report, the initial payments-to-counties legislation generally mitigated the effects of declining timber receipts for the 48 counties covered by the legislation. The intent behind the Omnibus Budget Reconciliation Act of 1993 was to provide a transition to a lower rate of assistance though declining Spotted Owl Safety Net payments (Charnley et al. 2006). Figure 10-1 shows that the transition path downward was replaced by a higher rate of revenue support by the Secure Rural Schools Act.
The Omnibus Budget Reconciliation Act of 1993 and the Secure Rural Schools Act met their goals of replacing past dependence on timber harvest revenues and mitigated the loss of revenues associated with the declines in federal timber harvest in the region. It is still not known how these payments affected overall county financing. As stated in the 10-year report, a guaranteed amount would likely have a stabilizing effect. Because the Secure Rural Schools legislation has not been reauthorized in 2015, the long-term stability of the payments is uncertain. Without new congressional action, counties in the NWFP area will need to address a short fall of several hundred million dollars.

Northwest Forest Plan – Socioeconomic Report
Oregon, Washington, and California Report — 71
Figure 11-1: National Forest payments to counties in NWFP area
Figure 11-2: Oregon and California Railroad and Coos Bay Wagon Road Payments to counties in NWFP area
$-
$50
$100
$150
$200
$250
1991
1992
1993
1994
1995
1996
1997
1998
1999
2000
2001
2002
2003
2004
2005
2006
2007
2008
2009
2010
2011
2012
Paym
ents
(mill
ions
)
Spotted Owl Safety Net Secure Rural Schools Payments
$0.00
$20.00
$40.00
$60.00
$80.00
$100.00
$120.00
$140.00
Mill
ions
O&C and CBWR Payments

RepoRt FS/R6/pNW/2015/0006
72 — Oregon, Washington, and California Report
Figure 11-3: NWFP area payments in lieu of taxes
Figure 12-1: repeat
Figure 12-2: Unemployment in California, Oregon, and Washington (2000-2012)
$0
$2,000,000
$4,000,000
$6,000,000
$8,000,000
$10,000,000
$12,000,000
$14,000,000
1996 1997 1998 1999 2000 2001 2002 2003 2004 2005 2006 2007 2008 2009 2010 2011 2012
CA PILT OR PILT WA PILT
0.0%
2.0%
4.0%
6.0%
8.0%
10.0%
12.0%
14.0%
2000 2001 2002 2003 2004 2005 2006 2007 2008 2009 2010 2011 2012
California Oregon Washington
15-year report

Northwest Forest Plan – Socioeconomic Report
Oregon, Washington, and California Report — 73
Chapter 12: ConclusionTimber harvest and related employment have been key
issues in forest policy discussions since the early 1970s. Total employment in forest products industries, including logging, primary and secondary wood manufacturing, has a history of increasing and decreasing in the NWFP area. Total employment in these sectors has been variable and has declined overall by forty percent since 2001 (figure 2-2).
Timber employment is closely related to timber harvest. From 2005 to 2009, timber harvest levels declined sharply. Most of this decline can be attributed to reductions in timber harvests on non-federal lands. After 2009, timber harvests levels increased. Timber harvested from federal forests has reached volumes not seen since shortly after the adoption of the NWFP. However, timber harvested from non-federal forests remains below the 1995 to 2005 average.
Between 2001 and 2009, timber offered for sale on federal lands more than doubled, and timber harvest in 2009 was 60 percent greater than that of 2001 (figure 12-1). Timber harvested from federal forests increased nearly 70 percent between 2009 and 2012. At its peak in 2012, timber offered for sale was approximately 80 percent of probable sale quantity (PSQ), and timber harvest was also approximately 80 percent of PSQ. From 2001 to 2012, the percentage of timber harvested on federal lands compared to total harvest on all ownerships increased from 3.2 to 9.6 percent.
Population size is often an indicator of economic diversity. Most people in the NWFP area live in counties that the U.S. Department of Labor describes as metropolitan. These counties contain core urban areas of 50,000 or more population. Across the United States, many rural areas have lost population in recent years. However, the non-metropolitan counties of the NWFP area did experience moderate growth between 1999 and 2012 (figure 8-1). Similarly, the metropolitan areas in the NWFP area grew more quickly than metropolitan areas in the three states overall (18 percent vs. 15 percent) (table 8-2).Therefore, the NWFP area counties are attracting more residents than counties outside the NWFP area in the three states (figure 2-4).
Nonmetropolitan counties are less diverse
IntroductionThe aim of this 20-year report is to use social, economic, demographic, and federal agency data to show the potential relationships among these data that may address changes in socioeconomic well-being in the NWFP area. The report provides data and analysis in response to the RIEC’s modified monitoring question: What is the status and trend of socioeconomic well-being? It uses existing data rather than a combination of existing data and new research, as was the protocol for the 10-year report. Data collected for the report indicate possible relationships between comparisons of socioeconomic information with natural resource uses and management activities on federal lands.
ObjectiveSocial and economic issues are part of the controversy that led to development of the Northwest Forest Plan (NWFP) Record of Decision. This controversy emerged in the late 1950s and included three related social and economic issues: (1) the role and quantity of federal timber in the market; (2) federal agency obligations to communities near or among federal timberlands; and, (3) the role forests play, especially federal forests, in local and regional economies.
The social and economic monitoring program assembles existing data to address these issues in the NWFP area. The program tracks demographic data as well as data on agency expenditures and forest-related resources to display potential trends. The data are not suitable for a statistically valid cause-and-effect analysis linking trends in socioeconomic well-being to natural resource management activities on federal lands.
Key ResultsEmployment associated with Forest Service and BLM programs contributes to socioeconomic well-being in the NWFP area. Agency employment, jobs supported by agency timber harvest and recreational activities are especially important. Between 2001 and 2012, overall agency employment declined, while agency timber-harvest-related employment increased slightly (figure 2-1). Data show that recreation-related employment was substantial during the same period.

RepoRt FS/R6/pNW/2015/0006
74 — Oregon, Washington, and California Report
economically and more strongly tied to the wood products industry. Most of the timber harvested in the NWFP area comes from nonmetropolitan counties. Although forest products manufacturing employment is about equally split between metropolitan and nonmetropolitan counties, it accounts for roughly 10 percent of total employment
Figure 11-3: NWFP area payments in lieu of taxes
Figure 12-1: repeat
Figure 12-2: Unemployment in California, Oregon, and Washington (2000-2012)
$0
$2,000,000
$4,000,000
$6,000,000
$8,000,000
$10,000,000
$12,000,000
$14,000,000
1996 1997 1998 1999 2000 2001 2002 2003 2004 2005 2006 2007 2008 2009 2010 2011 2012
CA PILT OR PILT WA PILT
0.0%
2.0%
4.0%
6.0%
8.0%
10.0%
12.0%
14.0%
2000 2001 2002 2003 2004 2005 2006 2007 2008 2009 2010 2011 2012
California Oregon Washington
15-year report
in nonmetropolitan counties and only 1 percent in metropolitan counties. The effects of changes in timber harvest and related employment on well-being are likely more pronounced in nonmetropolitan counties. In periods of economic hardships, such as the one that began in 2008 (figure 12-2), federal lands and federal agencies played
0100200300400500600700800900
1,000M
MBF
Total harvest Total offer PSQ
Figure 12-1. Total timber ovvered for sale, timber harvestm and probable sale quantity (PSQ) on federal lands.

Northwest Forest Plan – Socioeconomic Report
Oregon, Washington, and California Report — 75
especially important roles in contributing to socioeconomic well-being in rural America. While timber harvested on federal land declined in 2008, the harvest was relatively high compared to non-federal lands and reportedly kept mills running during that difficult year.
Next Steps and RecommendationsIn order to make the status and trends available to a wide range of stakeholders, the monitoring team is creating an easy-to-use website that contains all of the socioeconomic monitoring data related to well-being. This responds to stakeholder requests for more transparency from the Forest Service.

RepoRt FS/R6/pNW/2015/0006
76 — Oregon, Washington, and California Report

Northwest Forest Plan – Socioeconomic Report
Oregon, Washington, and California Report — 77
Citations and References
Alexander, S.J.; Fight, R.D. 2003. Managing access to nontimber forest products. In: Monserud, R.A.; Haynes, R.W.; Johnson, A.C., eds. Compatible forest management. Dordrecht, The Netherlands: Kluwer Academic Publishers: 383–400. Chapter 13.
Alexander, S.J.; McLain, R.J. 2001. An overview of non-timber forest products in the United States today. In: Emery, M.R.; McLain, R.J., eds. Non-timber forest products: medicinal herbs, fungi, edible fruits and nuts, and other natural products from the forest. New York: The Haworth Press, Inc.: 59–66.
Baker, D.; Palmer, C.; Tolle, T. et al. 2005. Northwest Forest Plan-the first 10 years (1994-2003): Implementation Monitoring: Summary of Regional Interagency Monitoring Results. R6-RPM-TP-04-2005. 18 pages.
Brown, B.A.; Marin-Hernandez, A. 2000. Voices from the woods: lives and experiences of non-timber forest workers. Wolf Creek, OR: Jefferson Center for Education and Research. 52 p
Bureau of Economic Analysis. 2010. Table 1.1.9. Implicit Price Deflators for Gross Domestic Product, Website: http://www.bea.gov/national/nipaweb/csv/NIPATable.csv. Accessed May 2010.
Bureau of Economic Analysis. 2010. Local area personal income and employment. Regional Economic Information System (REIS). Website: http://www.bea.gov/regional/reis/. Accessed May 2010.
Bureau of Economic Analysis. 2011. Local area personal income and employment. Regional Economic Information System (REIS). Website: http://www.bea.gov/regional/reis/. Accessed February 2014.
Bureau of Labor Statistics [BLS] 2010. Local Area Unemployment Statistics, U.S. Department of Labor, http://www.bls.gov/lau/#data. Accessed 2010 June 06.
Charnley, S., tech. coord. 2006. Northwest Forest Plan: the first ten years (1994-2003): socioeconomic monitoring
results. Gen. Tech. Rep. PNW-GTR-649. Portland, OR: U.S. Department of Agriculture, Forest Service, Pacific Northwest Research Station. 6 vols.
Charnley, S.; Langner, L. 2001. Forest Service roadless area conservation. Final environmental impact statement. Socioeconomic specialist report. Washington, DC: U.S. Department of Agriculture, Forest Service. 136 p.
Christakopoulou, S.; Dawson, J.; Gari, A. 2001. The community well-being questionnaire: theoretical context and initial assessment of its reliability and validity. Social Indicators Research. 56: 321–351.
Christensen, H.H.; McGinnis, W.J.; Raettig, T.L.; Donoghue, E. 2000. Atlas of human adaptation to environmental change, challenge and opportunity: Northern California, Western Oregon, and Western Washington. Gen. Tech. Rep. PNW-GTR-478. Portland, OR: U.S. Department of Agriculture, Forest Service, Pacific Northwest Research Station. 66 p. and companion CD.
Doak, S.; Kusel, J. 1996. Well-being in forest-dependent communities. Part 2: A social assessment. In: Sierra Nevada Ecosystem Project: final report to Congress— assessments and scientific basis for management options. Davis, CA: University of California, Center for Water and Wildland Resources: 375–402. Vol. 2.
Dombeck, M.; Thomas, J.W. 2003. Declare harvest of oldgrowth off limits and move on. Seattle Post-Intelligencer, editorial, August 24.
Donoghue E.M.; Sutton N.L. 2006. Socioeconomic conditions and trends for communities in the Northwest Forest Plan region, 1990 to 2000. In Northwest Forest Plan: the first 10 years (1994-2003): socioeconomic monitoring results. Volume III: Rural communities and economies. Chapter 2. Gen. Tech. Rep. PNW-GTR-649, ed. S Charnley, tech. ed., pp. 7-35. Portland, OR: U.S. Department of Agriculture, Pacific Northwest Research Station.
Force, J.E.; Machlis, G.E. 1997. The human ecosystem. Part II: Social indicators in ecosystem management. Society and Natural Resources. 10: 369–382.
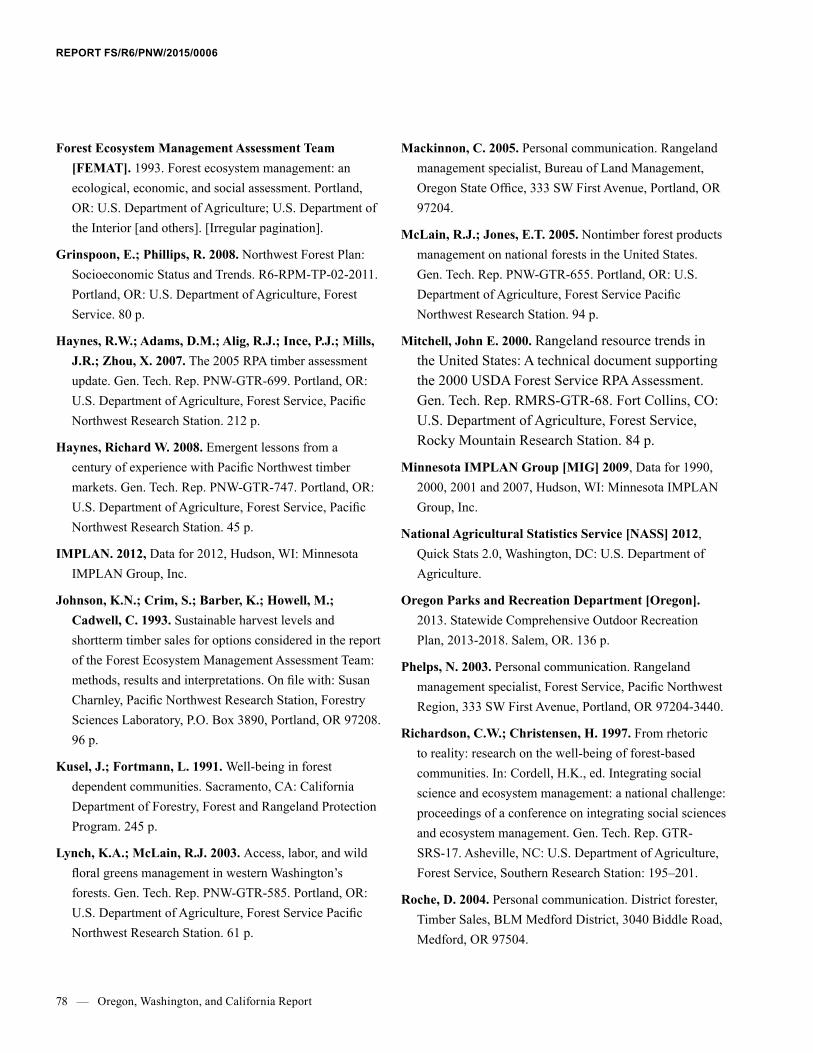
RepoRt FS/R6/pNW/2015/0006
78 — Oregon, Washington, and California Report
Forest Ecosystem Management Assessment Team [FEMAT]. 1993. Forest ecosystem management: an ecological, economic, and social assessment. Portland, OR: U.S. Department of Agriculture; U.S. Department of the Interior [and others]. [Irregular pagination].
Grinspoon, E.; Phillips, R. 2008. Northwest Forest Plan: Socioeconomic Status and Trends. R6-RPM-TP-02-2011. Portland, OR: U.S. Department of Agriculture, Forest Service. 80 p.
Haynes, R.W.; Adams, D.M.; Alig, R.J.; Ince, P.J.; Mills, J.R.; Zhou, X. 2007. The 2005 RPA timber assessment update. Gen. Tech. Rep. PNW-GTR-699. Portland, OR: U.S. Department of Agriculture, Forest Service, Pacific Northwest Research Station. 212 p.
Haynes, Richard W. 2008. Emergent lessons from a century of experience with Pacific Northwest timber markets. Gen. Tech. Rep. PNW-GTR-747. Portland, OR: U.S. Department of Agriculture, Forest Service, Pacific Northwest Research Station. 45 p.
IMPLAN. 2012, Data for 2012, Hudson, WI: Minnesota IMPLAN Group, Inc.
Johnson, K.N.; Crim, S.; Barber, K.; Howell, M.; Cadwell, C. 1993. Sustainable harvest levels and shortterm timber sales for options considered in the report of the Forest Ecosystem Management Assessment Team: methods, results and interpretations. On file with: Susan Charnley, Pacific Northwest Research Station, Forestry Sciences Laboratory, P.O. Box 3890, Portland, OR 97208. 96 p.
Kusel, J.; Fortmann, L. 1991. Well-being in forest dependent communities. Sacramento, CA: California Department of Forestry, Forest and Rangeland Protection Program. 245 p.
Lynch, K.A.; McLain, R.J. 2003. Access, labor, and wild floral greens management in western Washington’s forests. Gen. Tech. Rep. PNW-GTR-585. Portland, OR: U.S. Department of Agriculture, Forest Service Pacific Northwest Research Station. 61 p.
Mackinnon, C. 2005. Personal communication. Rangeland management specialist, Bureau of Land Management, Oregon State Office, 333 SW First Avenue, Portland, OR 97204.
McLain, R.J.; Jones, E.T. 2005. Nontimber forest products management on national forests in the United States. Gen. Tech. Rep. PNW-GTR-655. Portland, OR: U.S. Department of Agriculture, Forest Service Pacific Northwest Research Station. 94 p.
Mitchell, John E. 2000. Rangeland resource trends in the United States: A technical document supporting the 2000 USDA Forest Service RPA Assessment. Gen. Tech. Rep. RMRS-GTR-68. Fort Collins, CO: U.S. Department of Agriculture, Forest Service, Rocky Mountain Research Station. 84 p.
Minnesota IMPLAN Group [MIG] 2009, Data for 1990, 2000, 2001 and 2007, Hudson, WI: Minnesota IMPLAN Group, Inc.
National Agricultural Statistics Service [NASS] 2012, Quick Stats 2.0, Washington, DC: U.S. Department of Agriculture.
Oregon Parks and Recreation Department [Oregon]. 2013. Statewide Comprehensive Outdoor Recreation Plan, 2013-2018. Salem, OR. 136 p.
Phelps, N. 2003. Personal communication. Rangeland management specialist, Forest Service, Pacific Northwest Region, 333 SW First Avenue, Portland, OR 97204-3440.
Richardson, C.W.; Christensen, H. 1997. From rhetoric to reality: research on the well-being of forest-based communities. In: Cordell, H.K., ed. Integrating social science and ecosystem management: a national challenge: proceedings of a conference on integrating social sciences and ecosystem management. Gen. Tech. Rep. GTR-SRS-17. Asheville, NC: U.S. Department of Agriculture, Forest Service, Southern Research Station: 195–201.
Roche, D. 2004. Personal communication. District forester, Timber Sales, BLM Medford District, 3040 Biddle Road, Medford, OR 97504.

Northwest Forest Plan – Socioeconomic Report
Oregon, Washington, and California Report — 79
Sen, A. 1985. Commodities and capabilities. New York: North Holland. 130 p.
Sommers, P. 2001. Monitoring socioeconomic trends in the northern spotted owl region: framework, trends update, and community level monitoring recommendations. Tech. Rep. Seattle, WA: U S Geological Service, Forest and Rangeland Ecosystem Science Center, Cascadia Field Station College of Forest Resources. 48 p.
Thomas, J.W. 2003. Sustainability of the Northwest Forest Plan—dynamic vs. static management. 23 p. Draft report for Forest Service, Pacific Southwest Region NWFP review. On file with: Susan Charnley, Pacific Northwest Research Station, Forestry Sciences Laboratory, P.O. Box 3890, Portland, OR 97208.
Tuchmann, E.T.; Connaughton, K.P.; Freedman, L.E.; Moriwaki, C.B. 1996. The Northwest Forest Plan: a report to the President and Congress. Washington, DC: U.S. Department of Agriculture, Office of Forestry and Economic Assistance. 253 p.
U.S. Census Bureau [US Census] 2010a. Age Groups and Sex for Counties: April 1, 2000 to July 1, 2008. Release Date: May 14, 2009, Population Division, http://www.census.gov/popest/counties/asrh/CC-EST2008-agesex.html. Accessed 2010 June 08.
U.S. Census Bureau [US Census] 2010b. Sex, Race, and Hispanic Origin for Counties: April 1, 2000 to July 1, 2008. Release Date: May 14, 2009, Population Division, U.S. Census Bureau, http://www.census.gov/popest/counties/asrh/CC-EST2008-RACE6.html. Accessed 2010 June 08.
U.S. Census Bureau [US Census] 2011. The 2011 Statistical Abstract, U.S. Census Bureau, http://www.census.gov/compendia/statab/. Accessed 2011 February 08.
U.S. Department of Agriculture, Forest Service [USDA FS]. 2003. National survey on recreation and the environment. http://www.srs.fs.usda.gov/ trends/Nsre/nsre2.html. (July 2004).
U.S. Department of Agriculture, Forest Service [Forest Service] 2010. National Visitor Use Monitoring (NVUM) Results, multiple National Forest reports, http://www.fs.fed.us/recreation/programs/nvum/. Accessed August 2010.
U.S. Department of Agriculture, Forest Service [USDA FS]. 2012. Albuquerque Service Center. FY 2005 and FY2006 data is available at http://fsweb.asc.fs.fed.us/bfm/programs/financial-operations/receivables-collections/asr/reports-2005.php and http://fsweb.asc.fs.fed.us/bfm/programs/financial-operations/receivables-collections/asr/reports-2006.php (Accessed 5/12/2010). FY 2007 data is available at http://fsweb.asc.fs.fed.us/bfm/programs/financial-operations/receivables-collections/asr/reports.php (accessed 5/12/2010).. FY2008 and FY09 data is available in Excel file on Secure Rural Schools website. http://www.fs.fed.us/srs/county.shtml and http://www.fs.fed.us/srs/county2009.shtml (Accessed on 5/12/2010).
U.S. Department of Agriculture, Forest Service; U.S. Department of the Interior, Bureau of Land Management [USDA and USDI]. 1994a. Final supplemental environmental impact statement on management of habitat for late-successional and old-growth forest related species within the range of the northern spotted owl. Portland, OR: Vol. 1. [Irregular pagination].
U.S. Department of Agriculture, Forest Service; U.S. Department of the Interior, Bureau of Land Management [USDA and USDI]. 1994b. Record of decision for amendments to Forest Service and Bureau of Land Management planning documents within the range of the northern spotted owl. [Place of publication unknown]. 74 p. [plus attachment A: standards and guidelines].
U.S. Department of Agriculture, Forest Service; U.S. Department of the Interior, Bureau of Land Management [USDA and USDI]. 2004. Final supplemental environmental impact statement to remove or modify the survey and manage mitigation measure standards and guidelines. Portland, OR. 332 p.

RepoRt FS/R6/pNW/2015/0006
80 — Oregon, Washington, and California Report
U.S. Department of the Interior, Bureau of Land Management [BLM] 2012. BLM Facts: Oregon and Washington, http://www.blm.gov/or/onlineservices/orblmfacts.php, accessed February 1, 2014.
U.S. Department of the Interior [USDI] 2010. Payments in Lieu of Taxes. http://www.doi.gov/pilt/
Warren, D. 2004. Production, prices, employment, and trade in Northwest forest industries, all quarters 2002. Resour. Bull. PNW-RB-241. Portland, OR: U.S. Department of Agriculture, Forest Service, Pacific Northwest Research Station. 171 p.
Warren, D. 2009. Production, prices, employment, and trade in Northwest forest industries, all quarters 2008. Resour. Bull. PNW-RB-258. Portland, OR: U.S. Department of Agriculture, Forest Service, Pacific Northwest Research Station. 163 p.
Washington State Recreation and Conservation Office [Washington]. 2013. Outdoor Recreation in Washington: The 2013 State Comprehensive Outdoor Recreation Plan. Olympia, WA. 196 p.
Weigand, J. 2002. Case study. Overview of cultural traditions, economic trends, and key species in nontimber forest products of the Pacific Northwest. In: Jones, E.T.; McLain, R.J.; Weigand, J., eds. Nontimber forest products in the United States. Lawrence, KS: University Press of Kansas: 57–64.
White, E.M.; Stynes, D.J. 2010. Updated spending profiles for national forest recreation visitors by activity. Unpublished report. 42 pages. Special report under the joint venture agreement between the USDA Forest Service Inventory and Monitoring Institute and Michigan State University.
Wilkinson, K.P. 1991. The community in rural America. New York: Greenwood Press. 152 p.

