the executive guide to microsoft business intelligence by aptera
TRANSCRIPT

2013

•
•
•
•
•
•
•
•
•
•


Integration
• BI infrastructure
• Metadata management
• Development tools
• Collaboration

Information Delivery
• Reporting
• Dashboards
• Ad-hoc query
• Office Integration
• Search-based BI
• Mobile BI

Analysis
• On-Line Analytical Processing (OLAP)
• Interactive Visualization
• Predictive Modeling and Data Mining
• Score Cards


• SQL Server
• Office
• SharePoint

SQL Server Relational Database
• Serves as the data repository
• ODS, MDM, Data Warehouse
• Star Join Query Optimization
• Resource Governor
• Scalability (Scale Up… Scale Out)
• Back up to the Cloud (Blob Storage)
• AlwaysOn High Availability
• PowerPivot
• Table Partitioning
• Partition Elimination
• Partition Parallelism
• 15,000 Partitions
• Tabular Data Models in SSAS
• SQL Server Data Tools
• PowerView

Integration Services
• Responsible for moving the data
• ‘’ The World’s Fastest ETL Tool! ’’
• In-Memory Extract, Transform, Load
• Connect to non-SQL Server instances
• Oracle, DB2, etc…
• Many, many inbuilt transforms
• Where the data gets clean
• Create, Delete, Merge, Split, Group, Count, Sort
• Fuzzy Logic
• .NET and SQL Tasks, too!

Reporting Services
• Many data sources
• Static and semi-dynamic reporting
• Drill through interactivity
• Subscriptions
• Data driven
• Report Builder
• Create and utilize models
Analysis Services
• “Slice and Dice” the information to answer the questions that
YOU need answered
• Centralized KPI engine
• Data Mining for predictive analysis
• Handle large analytical data sets quickly
• Perspectives
• Partitioning
• Write-Back
• Multidimensional and Tabular Models

• Office 2013
• Excel
• Power View
• PowerPivot
• Visio
• Office 365 (To the cloud!)
• Excel
• Power View
• PowerPivot
• Visio
• SharePoint Online
Microsoft Office

• Utilize a vast existing skillset
• Pivot Tables
• Slicers
• Spark Lines
• Connect to lots of different data sources
• Conduct “What if” analysis
• Scenarios
• Goal Seeking
Microsoft Office Excel

• Self-serve BI
• Analyze massive amounts of data
• In Memory Analysis (Tabular Again!)
• Create Relationships between data
• Slice, Dice, Filter, and Sort in sub seconds
• Data Analysis Expressions (DAX)
PowerPivot for Microsoft Office Excel

• Self-serve BI
• Visual, Interactive Data Exploratioin
• In Memory Analysis (Tabular Again!)
• Presentation Ready!
• Based on Data Model
• DEMO!!!
Power View for Microsoft Office Excel
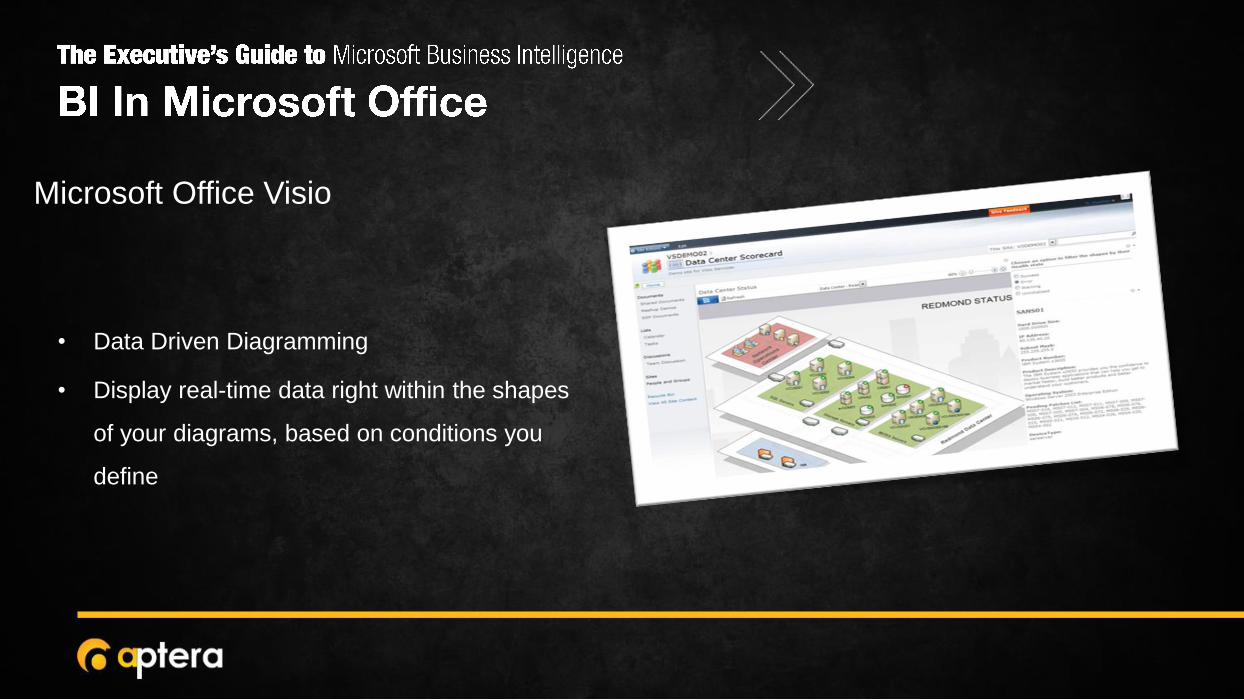
• Data Driven Diagramming
• Display real-time data right within the shapes
of your diagrams, based on conditions you
define
Microsoft Office Visio

• No PerformancePoint
• No Reporting Services Integrated Mode
• No external data sources… yet.
• Make sure you get the right Plan!
• E3/A3/G3
• E4/A4/G4
• SharePoint Online Plan 2
Are there any limitations with office 365 BI features?

• Excel Services
• PowerPivot
• Power View
• Reporting Services
• Visio Services
• PerformancePoint Services
SharePoint “Insights”

• Construct Reports and Pivot Tables in Excel
• Surface Reports in SharePoint from document libraries and Web Parts
• Utilize External Data Sources
• Excel workbook acts as a data source
• Edit workbooks with Office Web Apps
• Capitalize on Existing Skillsets
Excel Services
• PowerPivot Gallery• Elegant interface
• Common location for PowerPivot reports
• Can utilize PowerPivot applications as data sources for other reports from within the Gallery
• Manual or timed automatic refreshes of data
• Power View reports live here too!
PowerPivot Gallery

• Consists of:• Report Designer
• Report Builder
• Integration with SharePoint• SharePoint is the repository for reports,
models, and connections
• Reports are viewed in a web browser through Web Parts or Report Pages
Reporting Services

• Render & View via web browser
• Create Diagrams Which Translate Into SharePoint Workflows
• Create Diagrams That Tie Into External Data Sources
Visio Services

• Bundled with SharePoint 2013 Enterprise
• Dashboard Designer installed
as a Click Once application
• Dashboards and KPI’s are SharePoint content
PerformancePoint Services

PerformancePoint Services
• Dashboards
• Key Performance Indicators
• Scorecards
• Filters
• Data Sources
• Reports (PowerPivot, Power View, SSRS, Excel
Services, etc)
• Analytic Reports
• Graphs/Charts

• Dashboards can utilize
pre-existing reports such as
• Reporting Services
• Excel Services
• PowerPivot applications
• Dashboard Web Parts and visualizations can be
centrally filtered
• Build new KPI’s in the Dashboard Designer, or
use previously created Analysis Services KPI’s
instead
PerformancePoint Services

• Create, Edit, Manage, and Publish Business
Intelligence Content
• PerformancePoint Content Is Reusable
PerformancePoint Services
• What the heck is “Master Data”?
• Useful to the entire organization
• Utilized in many different ways (Not just for reporting)
• Reference and Transactional Data
• MDM and ODS’s
• Multiple Sources
• Cleansed, scrubbed, and validated
• Reduced Redundancy
• Application of business rules
Managing Your Master Data
• Where does this fit?
• Data Governance

Master Data Services
• Control your organizations master data
• Use the master data hub as an authoritative data source.
• Formalize and enforce processes with automated
workflows.
• Help ensure quality in the master data hub by using rules.
• Support ranges of hierarchies and attributes.
• Foster user access with comprehensive role-based
security.
Data Quality Services
• Discover
• Build
• Cleanse
• Business Knowledge Driven
• Business User Driven
• Computer Assisted and
• Interactively Assisted
• Cloud-based Reference Data
What is a Data Warehouse?
• Is it a Dying concept!?
• NOT A JUNK DRAWER!
• Used for reporting
• Offloads report processing from transactional system
• Can utilize data from an MDM solution
• Specially modeled to support reporting
• Foster user access with comprehensive role-based security.


Now What?


THANK YOU!201 West Main Street / Fort Wayne IN 46802
(260) 969.1410