the evolution of the informal economy in north...
TRANSCRIPT

The Evolution of the Informal Economy in North Korea
Byung-Yeon Kim and Min Jung Kim
This paper uses a survey of North Korean refugees to investigate the evolution of informal economic activities of North Korean households. We find little evidence of increases in informal economic activities in terms of the aggregate participation rate in the informal economy from 1996 to 2009. However, service and manufacturing activities in the informal economy increased during 2005–2009 at the sacrifice of informal agricultural activities. Evidence shows that labor productivity has improved in the informal service sector, whereas the informal manufacturing sector has not experienced increases in productivity. These results imply that expansion of the informal service sector contributes to North Korea’s economic growth, but the lack of private property rights constrains the development of manufacturing.
Keywords: North Korea, Informal economic activities, Labor productivity, Propensity score matching model
JEL Classification: J22, J24, O17, P20
Byung-Yeon Kim, Department of Economics, Seoul National University, Seoul, Republic of Korea. (E-mail): [email protected], (Tel): +82-2-880-6370, (Fax): +82-2-886-4231; Min Jung Kim, Corresponding author, SSK Research Group for Research on Innovation and Competition for the Advancement of the Korean Economy, Sogang University, Seoul, Republic of Korea. (E-mail): [email protected], (Tel):+82-10-9764-9928, respectively.
This work was supported by the National Research Foundation of Korea Grant funded by the Korean Government (NRF-2013S1A5A2A0304 4 461).
[Seoul Journal of Economics 2016, Vol. 29, No. 4]

458 SEOUL JOURNAL OF ECONOMICS
I. Introduction
North Korea’s Public Distribution System (PDS) of grain broke down during the so-called “Arduous March” in the mid- and late 1990s. This economic crisis led many households to rely on informal economic activities (IEAs) that had been previously repressed by the North Korean authorities. The authorities decided to tolerate such household activities, without which a considerably worse economic disaster would occur. Consequently, the informal economy in North Korea substantially increased in this period.
The informal economy existed in other socialist countries such as the Soviet Union. The majority of economists maintain that the Soviet informal economy was large (Grossman 1987; Ofer, and Vinokur 1992; Kim 2003). For example, Grossman (1987) estimates that in the late 1970s, private income accounted for 33% of the total income of urban households. By using classified Soviet archival material, Kim (2003) provides annual estimates of the informal economy from 1969 to 1990. The average share of Soviet households’ informal expenditure in total expenditure was 23% during the above period. Furthermore, certain economists ascribe the collapse of the Soviet socialist system to IEAs that range from household’s private economic activity to bribery and even organized crime (Treml, and Alexeev 1994; Grossman 1998; Solnick 1998; Wintrobe 1998).1 These debates produced a number of studies on the informal economy in a socialist system.2
The emergence of the informal economy in North Korea also elicited considerable research attention. Scholars have not only analyzed the size and determinants of the informal economy, but also its effects on the economy (Lee 2007; Kim, and Song 2008; Haggard, and Noland 2009; Lee 2009; Kim 2009; Kim, and Koh 2011; Kim, and Yang 2012). Most research that uses surveys of North Korean refugees finds that the size of informal economy in the North Korean households is at least 70% in terms of the share of total income as well as labor force participation rate. Therefore, North Korea’s informal economy is
1 However, Kim (2003) refutes such a claim. By using the Soviet family budget surveys, he finds that the share of informal income (expenditure) out of total income (expenditure) did not grow over time.
2 As regards the literature on the details of the Soviet informal economy, we refer to Kim (2013).

459THE EVOLUTION OF NORTH KOREA’S INFORMAL ECONOMY
extremely large with a scale that was not found in any former socialist countries.
Compared with the size of the informal economy, its evolution over time attracted relatively less attention mainly because of the deficiency of the data. This is a significant research gap because the dynamics of the informal economy may have important implications for the future of not only the North Korean economy but also its society. Although studies on this issue have been conducted, their findings are based either on aggregated figures or on some case studies. For example, Kim and Song (2008) find that labor participation rate in plot-related activities or stockbreeding significantly increased from 2002 to 2004, whereas market trading did not during the same period. Kim and Yang (2012) evaluate the effects of different market policies by the North Korean government (i.e. appeasement policy vs. anti-market policy) on the informal economy, and find little evidence on an increasing trend of the informal economy from 2002 onwards. However, the above studies are based on a simple test of whether significant discrepancies occur in the size of the informal economy between different periods at the aggregated level; that is, the participation rate in the informal economy. As regards case studies on the development of the informal economy, Kim and Yang (2014) report the specialization of IEAs by illustrating diverse cases that include “suraegi,” which indicates a manufacturing dealer. By using in-depth interviews of 39 North Korean refugees, Lee et al. (2014) assert that markets for consumer goods and services have been expanding. However, these studies are insufficiently rigorous because of the method of analysis based on the small sample.
This study aims to contribute to the literature in two respects. First, we use a large dataset of North Korean refugees settled in South Korea accumulated from 2004 to 2011 to investigate the dynamics of the IEAs in North Korea at the individual level. The surveys were conducted in the four waves of surveys. Thus, we are able to observe the trend of IEAs of North Korean households for a relatively long term. Second, by classifying IEAs into agricultural, service, and manufacturing activities, we evaluate the extent to which IEAs expanded. Moreover, we discuss whether labor productivity has been improved in recent years, particularly in the three sectors of the informal economy.
This paper is organized as follows. Section II provides data description. Section III presents empirical evidence on the evolution of IEAs in North Korea. Section III-A analyzes changes in IEAs using

460 SEOUL JOURNAL OF ECONOMICS
the probit model. Section III-B tests the robustness of our results using the propensity score matching model. Section III-C provides empirical evidence on the association between diverse IEAs and labor productivity. Section IV summarizes our findings.
II. Informal Economic Activities: Data Description
A. Description on Respondents
We use the data from the four surveys of 1,140 North Korean refugees that were conducted from 2004 to 2011. The surveys were carried out in the form of a gang survey in small groups.3 The surveys cover a variety of information on economic activities in both the formal and informal sector in North Korea. More specifically, questions on occupation, labor supply, income, and expenditure were asked. In addition, questions on participation and activities in the informal economy were included in all surveys. To control for the possible disruptions in a refugee’s living conditions caused by her intention to or actual escape from the country, survey questions were designed to provide information on their economic life one year before their departure.4
Table 1 presents descriptive statistics of our dataset. In this survey, 62.7% of the total respondents are women. This composition is similar with the population of North Korean refugees who settled in South Korea by the end of 2011.5 In this dataset, 41.9% of total respondents left North Korea in the late 1990s or 2000, whereas the proportion of refugees who lived in North Korea by the early and late 2000s is 24.9% and 33.2%, respectively. This distribution of years of residence in North Korea enables us to investigate the dynamics of IEAs in North Korean households. As regards education level, more than half of the total respondents were educated up to secondary school. Given that North
3 The first, second, third, and fourth surveys were conducted in 2004–2005, 2007, 2009, and 2011, respectively. The sample size of refugees interviewed in each survey is 675, 115, 227, and 134, respectively. Among 1,152 total refugees, 1,140 refugees who lived in North Korea by the end of 2009 are used.
4 For example, a North Korean woman who escaped from North Korea in 2011 was asked about her economic status in 2010.
5 By the end of 2011, 23,106 of North Korean refugees settled in South Korea; 69.0% of total refugees are female. (Ministry of Unification of Republic of Korea, http://www.unikorea.go.kr/content.do?cmsid=1440).

461THE EVOLUTION OF NORTH KOREA’S INFORMAL ECONOMY
Korea implemented the population census in 2008, we can compare the distribution of education between the population as a whole and our sample. The share of education up to secondary school in the population and sample data is 72.8% and 70.1%, respectively.6 Hence, we can argue that the distribution of education in our sample is not significantly different from that in the population of North Korea. Our dataset is, however, unlikely to be representative of the North Korean population, especially in terms of regions. Of the refugees, 69.0% resided in Hamkyung Province, which shares a border with China. Although this problem is commonly found in other surveys of North Korean refugees, IEAs would be over-estimated if such activities are more widespread in Hamkyung Province than in the other regions. This requires us to control the proportion of different regions and their changes over time in all regressions.
B. Participation of Informal Economic Activities
In our analysis, we consider the following aspects of the IEAs by North Korean households. First, IEAs are diverse. North Korean people have engaged in private plot-related and stockbreeding activities, particularly at the early stage of the development of IEAs. They also engaged with street vending, transportation services, and repair, among other activities. Manufacturing activities are also practiced, such as production of consumer goods or food. By considering such diverse activities, we categorized the IEAs into the following three types:
6 We can compare the composition of education between population and sample data as follows:
Education
Source of Data
2008 Population Census from DPR Korea1) Survey Data2)
Up to primary school (%)Up to secondary school (%)Up to university (%)Number of observations
4.0 72.8 23.2
13,726,646
4.670.125.3174
Note: 1) Source: Central Bureau of Statistics (2009) 2) Refugees who lived in North Korea from 2007 to 2008 are considered
because we compare the population census from DPR Korea that was implemented in 2008.

462 SEOUL JOURNAL OF ECONOMICS
agricultural, service, and manufacturing activities.7 Second, the trend of the informal economy from 1996 to 2009 is considered. Hence, we divide the period into four sub-periods, namely, 1996–2001, 2002–2004, 2005–2006, and 2007–2009. These sub-periods reflect different government attitudes and policies toward IEAs based on previous studies (Kim 2012; Kim, and Yang 2012; Oh 2013; Yang 2010; Lim
7 Private plot-related activities or stockbreeding activities are categorized into the agricultural sector. Service activities include street vending, transportation, and smuggling. Manufacturing activities include producing consumer goods such as food, cigarettes, and ice cream, or cottage industries.
Table 1CharaCteristiCs of respondents
CharacteristicsPersons (unless
otherwise specified)Share (%)
Demographic characteristics Men Women Age (average) Number of family members (average)
425715
37.6 years3.64
37.362.7
Regions Pyungyang and Pyungahn Province Hamkyung Province Hwanghae Province Kangwon Province Jagang Province Yanggang Province Other
1787873320347810
15.669.02.91.83.06.80.9
Reference Year 1)
1996-99 2000-04 2005-09
478284378
41.924.933.2
Education Up to primary school Up to secondary school Up to university
176669291
15.558.925.6
Sample Size 1,140 100
Note: 1) Reference year denotes a year before his or her departure from North Korea.

463THE EVOLUTION OF NORTH KOREA’S INFORMAL ECONOMY
2009; Joung 2014). In more detail, the first period from 1996 to 2001 refers to that during which IEAs were tolerated and implicitly allowed. From 2002 to 2004, government policy changed in the direction that the North Korean authorities even encouraged such activities mainly for tax purposes. In particular, the July 1st Measures of Improvement for Economic Management in 2002 resulted in the construction of general markets to allow fee-paying traders to display and sell their goods. However, starting from 2005, the authorities began to impose restrictions on market activities such as setting age limitations and shortening the opening hours of the markets. Anti-market policies were further strengthened from 2007 when Kim Jong-il criticized markets as the habitat of capitalism. Some markets scaled down or even closed. For example, Pyungsung wholesale market, one of the largest wholesale markets in North Korea, closed in June 2009. The currency denomination, which was announced in November 2009, marked the peak of such policies. To sum up, the period from 1996 to 2009 can be divided into the sub-period of implicit permission of market activities from 1996 to 2001, the appeasement period from 2002 to 2004, anti-market policies from 2005 to 2006, and further anti-market policies from 2007 to 2009.
The trends of aggregate participation rates in the formal and the informal economy are demonstrated in Figure 1. The average participation rate in the informal economy is 70.8% from 1996 to 2009, whereas that in the formal economy is 47.7% during the same period. The participation rate in the former has consistently been higher than that in the latter for the entire period. This implies that the high level of participation of households in the informal economy has become
Figure 1annual partiCipation rate in the formal and informal seCtors by north
Korean households
7
even closed. For example, Pyungsung wholesale market, one of the largest wholesale markets in
North Korea, closed in June 2009. The currency denomination, which was announced in November
2009, marked the peak of such policies. To sum up, the period from 1996 to 2009 can be divided into
the sub-period of implicit permission of market activities from 1996 to 2001, the appeasement period
from 2002 to 2004, anti-market policies from 2005 to 2006, and further anti-market policies from
2007 to 2009.
The trends of aggregate participation rates in the formal and the informal economy are
demonstrated in Figure 1. The average participation rate in the informal economy is 70.8% from 1996
to 2009, whereas that in the formal economy is 47.7% during the same period. The participation rate
in the former has consistently been higher than that in the latter for the entire period. This implies that
the high level of participation of households in the informal economy has become a permanent feature
of the North Korean economy. However, small sample size particularly for some years and non-
representativeness of the sample suggests caution in interpreting these trends.
Figure 1
Annual Participation Rate in the Formal and Informal Sectors by North Korean Households
Figure 2 presents the changes in participation rate in IEAs during the four sub-periods.8 The most
8 The three types of informal economic activities are not mutually exclusive. Thus, the summation of all sectors’
labor participation rates exceeds 100%.
64.153.6
61.7
40.450.8 50.8 52.2
42.9 40.027.3 33.8
53.145.5
51.8
78.168.9
80.3 75.465.6 71.2 68.7
86.9
60.0 63.653.2
71.2 72.7 74.8
1996 1997 1998 1999 2000 2001 2002 2003 2004 2005 2006 2007 2008 2009
Formal Sector Informal Sector

464 SEOUL JOURNAL OF ECONOMICS
a permanent feature of the North Korean economy. However, small sample size particularly for some years and non-representativeness of the sample suggests caution in interpreting these trends.
Figure 2 presents the changes in participation rate in IEAs during the four sub-periods.8 The most popular IEAs are conducted in the service sector, such as market trading. The share of the participants in the manufacturing sector increased from 11.9% in the first sub-period to 28.0% in the last sub-period. In contrast to the rising trend in manufacturing activities, the participation rate in the agricultural sector reduced from 47.5% in the appeasement period to 37.5% in the period of anti-market policies from 2005 to 2009.
III. Empirical Analysis
A. Changes in Informal Economic Activities: Probit Model
We conduct the following two tests on the evolution of the informal economy. First, we test whether the informal economy quantitatively changed from 1996 to 2009. Second, we aim to identify the qualitative changes of IEAs in North Korea. More specifically, we investigate the effects of different policies on the informal economy implemented in four sub-periods, namely, 1996–2001, 2002–2004, 2005–2006, and
8 The three types of informal economic activities are not mutually exclusive. Thus, the summation of all sectors’ labor participation rates exceeds 100%.
Figure 2average labor forCe partiCipation rates in the informal eConomy during
sub-periods
9
Figure 2
Average Labor Force Participation Rates in the Informal Economy during Sub-periods
Ⅲ. Empirical Analysis
A. Changes in Informal Economic Activities: Probit Model
We conduct the following two tests on the evolution of the informal economy. First, we test
whether the informal economy quantitatively changed from 1996 to 2009. Second, we aim to identify
the qualitative changes of IEAs in North Korea. More specifically, we investigate the effects of
different policies on the informal economy implemented in four sub-periods, namely, 1996–2001,
2002–2004, 2005–2006, and 2007–2009. Throughout all regressions, we examine not only the
informal economy in aggregate form but also the three sub-sectors of the informal economy.
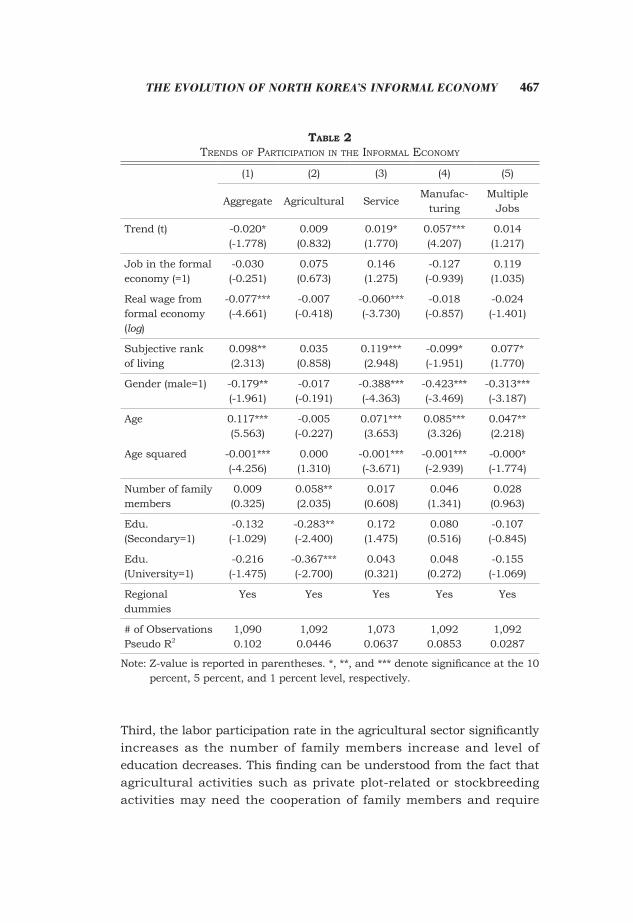
Table 2 shows that the aggregate labor participation rate in the informal economy decreased over
time. However, when we divide the aggregate IEAs into three sectors (i.e., agricultural, service, and
manufacturing), we find that labor participation rates in service and manufacturing activities increased
over time. This trend is consistently observed in the sub-period model presented in Table 3. In the
period from 2005 to 2006, the participation rate in the informal economy decreased compared to the
40.8%
74.5%
11.9%
47.5%
66.4%
13.9%26.5%
63.3%
40.8%40.1%
80.7%
28.0%
agricultural activities service activities manufacturing activities
1996-2001 2002-2004 2005-2006 2007-2009

465THE EVOLUTION OF NORTH KOREA’S INFORMAL ECONOMY
2007–2009. Throughout all regressions, we examine not only the informal economy in aggregate form but also the three sub-sectors of the informal economy.
Table 2 shows that the aggregate labor participation rate in the informal economy decreased over time. However, when we divide the aggregate IEAs into three sectors (i.e. agricultural, service, and manufacturing), we find that labor participation rates in service and manufacturing activities increased over time. This trend is consistently observed in the sub-period model presented in Table 3. In the period from 2005 to 2006, the participation rate in the informal economy decreased compared to the reference sub-period, that is, from 1996 to 2001. However, after categorizing the IEAs into three sectors, we find that service and manufacturing activities measured by participation rate significantly increased in the period from 2005 to 2009, but agricultural activities decreased in the period from 2005 to 2006.9
These findings suggest that overall, the share of the informal sector in which North Korean households participate did not grow over time, and even shrank from 2005 to 2006 driven by decreases in agricultural activities. This finding may be interpreted in two ways. The first is that restrictions towards market activities started from 2005 were effective in North Korea. The second interpretation is that increases in grain production and food aid from South Korea in 2005 discouraged households from participating in agricultural activities. Based on the estimate by Rural Development Administration, the amount of available grain which includes both domestic production and aid from South Korea increased by 10.7%; that is, from 5.16 million ton in 2004 to 5.71 million ton in 2005 (Kim, and Lim 2014). Hence, the shortage of grain was the smallest in 2005 among all the years from 2000 to 2009. Concluding which interpretation is valid from the above findings is difficult. However, government policies that restrict market activities in this period targeted mainly trading at markets. As seen below, however, the informal service sector in which market trading operates did not shrink from 2005 to 2006. This result implies that a decrease in the informal agricultural activities in the period from 2005 to 2006 was affected by rises in food availability rather than the direct effects of
9 When we merge two periods of anti-market policies and consider three sub-periods, namely 1996–2001, 2002–2004, and 2005–2009, our main findings change little.

466 SEOUL JOURNAL OF ECONOMICS
government policies.10 In contrast to the agricultural sector, we find that participation rate
in the informal service and manufacturing sector increased from 2005 to 2009 compared with the reference period of 1996–2001. This finding indicates that the main domain of the informal economy in North Korea has been shifting from agriculture to the service and the manufacturing sector. In addition, multiple jobs holding also increased in the period of 2007–2009. The fact that this evolution took place in the period of anti-market policy suggests that such policy cannot successfully impede the progress of informal economy in the situation in which the planned economic system malfunctions and market demand expands. One reason for such an ineffective government policy was widespread corruption by government officials who overlook market activities by taking bribes from market participants (Kim, and Koh 2011).
The results on various control variables are in line with our expectation. First, we find that the lower the real wage from the formal economy, the greater the increase in the informal labor participation rate, particularly in the service sector. This result implies that certain households participate in the informal service sector for survival. In contrast, the results show that a subjective standard of living is positively associated with participation rate in the service sector. These results are consistent with the findings by Kim and Song (2008), who suggest that both the survival and the profit-taking motive co-exist in the informal sector.11 Second, women rather than men are associated with informal economic activities such as street vending or handcraft.
10 An increase in crop production may discourage households from participating in agricultural activities. Lee et al. (2013) suggest an increase in grain production as one of the major reasons of stability in rice prices in North Korea in the period from 2005 to 2007.
11 Kim and Song (2008) explain various possibilities for these contrasting results. First, this result may be plagued by the endogeneity of the variable of rank. The income of an individual would increase if he or she works in the informal sector, which causes the positive correlation between rank and informal economy participation. Other interpretation is that motives for IEAs have been changing from mere survival to exploiting opportunities over time, and the negative coefficient on real wages refers to the survival motive, whereas the positive one on subjective rank reflects the profit motive. Another possibility is that respondents over-reported their subjective standard of living even though they were objectively poorer in North Korea.
467THE EVOLUTION OF NORTH KOREA’S INFORMAL ECONOMY
Third, the labor participation rate in the agricultural sector significantly increases as the number of family members increase and level of education decreases. This finding can be understood from the fact that agricultural activities such as private plot-related or stockbreeding activities may need the cooperation of family members and require
Table 2trends of partiCipation in the informal eConomy
(1) (2) (3) (4) (5)
Aggregate Agricultural ServiceManufac-
turingMultiple
Jobs
Trend (t) -0.020*(-1.778)
0.009(0.832)
0.019*(1.770)
0.057***(4.207)
0.014(1.217)
Job in the formal economy (=1)
-0.030(-0.251)
0.075(0.673)
0.146(1.275)
-0.127(-0.939)
0.119(1.035)
Real wage from formal economy (log)
-0.077***(-4.661)
-0.007(-0.418)
-0.060***(-3.730)
-0.018(-0.857)
-0.024(-1.401)
Subjective rank of living
0.098**(2.313)
0.035(0.858)
0.119***(2.948)
-0.099*(-1.951)
0.077*(1.770)
Gender (male=1) -0.179**(-1.961)
-0.017(-0.191)
-0.388***(-4.363)
-0.423***(-3.469)
-0.313***(-3.187)
Age 0.117***(5.563)
-0.005(-0.227)
0.071***(3.653)
0.085***(3.326)
0.047**(2.218)
Age squared -0.001***(-4.256)
0.000(1.310)
-0.001***(-3.671)
-0.001***(-2.939)
-0.000*(-1.774)
Number of family members
0.009(0.325)
0.058**(2.035)
0.017(0.608)
0.046(1.341)
0.028(0.963)
Edu. (Secondary=1)
-0.132(-1.029)
-0.283**(-2.400)
0.172(1.475)
0.080(0.516)
-0.107(-0.845)
Edu. (University=1)
-0.216(-1.475)
-0.367***(-2.700)
0.043(0.321)
0.048(0.272)
-0.155(-1.069)
Regional dummies
Yes Yes Yes Yes Yes
# of ObservationsPseudo R2
1,0900.102
1,0920.0446
1,0730.0637
1,0920.0853
1,0920.0287
Note: Z-value is reported in parentheses. *, **, and *** denote significance at the 10 percent, 5 percent, and 1 percent level, respectively.

468 SEOUL JOURNAL OF ECONOMICS
relatively low levels of education compared to other activities.
Table 3partiCipation in the informal eConomy during sub-periods
(1) (2) (3) (4) (5)
Aggregate Agricultural ServiceManufac-
turingMultiple
Jobs
Appeasement time (02-04)
0.195(1.420)
0.194(1.578)
-0.046(-0.382)
0.149(0.920)
0.039(0.292)
Anti-market policies (05-06)
-0.657***(-3.991)
-0.460**(-2.417)
0.362**(2.077)
0.516***(2.812)
-0.308(-1.605)
Further anti-market policies (07-09)
-0.122(-0.971)
0.141(1.193)
0.276**(2.252)
0.643***(4.560)
0.250**(2.059)
Job in the formal economy (=1)
-0.047(-0.391)
0.057(0.509)
0.136(1.183)
-0.144(-1.060)
0.099(0.855)
Real wage from formal economy (log)
-0.079***(-4.727)
-0.007(-0.419)
-0.057***(-3.553)
-0.014(-0.680)
-0.022(-1.332)
Subjective rank of living
0.096**(2.249)
0.038(0.906)
0.116***(2.885)
-0.099*(-1.957)
0.078*(1.789)
Gender (male=1) -0.206**(-2.245)
-0.024(-0.267)
-0.385***(-4.321)
-0.430***(-3.497)
-0.326***(-3.311)
Age 0.117***(5.496)
-0.007(-0.347)
0.072***(3.722)
0.083***(3.268)
0.045**(2.124)
Age squared -0.001***(-4.206)
0.000(1.402)
-0.001***(-3.710)
-0.001***(-2.854)
-0.000*(-1.686)
Number of family members
0.024(0.814)
0.063**(2.219)
0.010(0.368)
0.035(1.002)
0.028(0.950)
Edu. (Secondary=1) -0.073(-0.559)
-0.239**(-2.002)
0.135(1.144)
0.044(0.279)
-0.100(-0.780)
Edu. (University=1) -0.196(-1.321)
-0.360***(-2.622)
0.026(0.197)
0.022(0.124)
-0.168(-1.152)
Regional dummies Yes Yes Yes Yes Yes
# of ObservationsPseudo R2
1,0900.115
1,0920.0536
1,0730.0678
1,0920.0907
1,0920.0357
Note: Z-value is reported in parentheses. *, **, and *** denote significance at the 10 percent, 5 percent, and 1 percent level, respectively.

469THE EVOLUTION OF NORTH KOREA’S INFORMAL ECONOMY
B. Robustness test: Propensity Score Matching (PSM) Model
One possible bias that can affect previous regression results is that the demographics of the respondents are not the same across the different years. In other words, addressing the sample selection bias is necessary as the characteristics of respondents in the earlier surveys are significantly different from those in the later surveys. If the changes in the informal economy are attributed to the different propensities caused by dissimilar groups of the respondents, findings from this sample will be biased. We mitigate such a sample selection bias by using propensity score matching (PSM) model and show the average difference of IEAs between similar pairs of refugees but belonging to different escape year from North Korea.12 The treatment group refers to the latest refugees who lived in North Korea from 2005 to 2009, whereas refugees who lived in North Korea from 1996 to 2004 are regarded as the control group.
The main feature of the matching procedure is the creation of the conditions of a randomized experiment, thereby evaluating a causal effect as in a controlled experiment. Thus, we need the conditional independence assumption (CIA), which states that treatment is random and uncorrelated with outcome, once selected observable characteristics are controlled for. Based on CIA, the treatment effect could be estimated with matching estimators on selected observable characteristics. Another condition that we need to impose is that the propensity score is bounded away from 0 and 1, that is, the common support condition. The common support condition that drop treatment observations whose p-score is higher than maximum or less than the minimum p-score of the controls is imposed in all regressions. In addition, the balancing property is set and satisfied in all regressions at 1% significance level. Based on CIA and common support condition, we may well specify the propensity scores for treatment variables and the treatment effect is estimated non-parametrically. That is, the treated groups were matched with non-treated groups on the basis of p-scores and the average
12 We perform PSM using the STATA command ‘psmatch2,’ which is commonly applied. Leuven and Sianesi (2003) provide the program psmatch2 for implementing different types of matching estimators including covariate and propensity score matching. Furthermore, this program includes routines for common support graphing and covariate imbalance testing. Standard errors are obtained via bootstrapping methods.

470 SEOUL JOURNAL OF ECONOMICS
treatment effect was calculated as the mean difference in outcome of the two groups.
Results of probit formulations of the propensity score are reported in Table 4. Respondents who were working in the formal economy, were educated more than secondary level, and were fairly content with their economic life in North Korea are more likely to escape from North Korea in the period from 2005 to 2009 compared to the period from 1996 to 2004. By contrast, latest refugees are shown to be younger and earned lower income from formal economy. As regards residential region, refugees who lived in Hamkyung or Kangwon Province were more likely to escape from North Korea in the past (i.e. 1996–2004) than in recent years (i.e. 2005–2009).
Figure 3 confirms that the overall matching performance is good, because the bias of all the covariates between treated and control groups is around zero in the matched sample, contrary to the unmatched sample. As suggested by Appendix Table 1, the differences
Table 4estimation of propensity sCore
Variable Coefficient Z-value
Job from FormalReal Wage from FormalSubjective rank of livingGenderAgeEdu. (Secondary=1)Edu. (University=1)Pyungyang and PyungahnHamkyungHwanghaeKangwonJagangYanggang
0.314***-0.114***0.237***-0.068
-0.019***0.999***0.578***-0.267
-1.507***-0.583
-1.319***0.7320.052
(2.63)(-6.42)(5.30)(-0.69)(-4.50)(6.23)(3.27)(-0.52)(-2.97)(-1.05)(-2.22)(1.22)(0.10)
ObservationsPseudo R2
1,1050.2735
Note: Dependent Variable is dummy variable that indicates refugees who escape from North Korea in the period from 2005 to 2009. Two variables of age of squared term and the number of family members, of which statistical significance is low, are excluded in the estimation to satisfy the balancing properties. Z-value is reported in parentheses. *, **, and *** denote significance at the 10 percent, 5 percent, and 1 percent levels, respectively.

471THE EVOLUTION OF NORTH KOREA’S INFORMAL ECONOMY
between control and treatment group for all the variables are not statistically significant after matching, whereas some variables are significantly different between each group before the matching. Particularly, we cannot reject the LR test, a joint test of quality of balancing, for the matched sample. That is, the matched sample appears well-balanced because the means of each covariate do not differ between treated and control units.
Table 5 shows the average treatment effect for the treated (ATT) based on three different matching estimators, that is, the nearest neighbor (NN), kernel-based, and radius matching methods. After matching the sample, we found no significant difference in participation rate in the informal agricultural sector between the treated and the control group, whereas the average treatment effect for the treated (ATT) in the service and manufacturing sector are positively significant. This result suggests that participation rate in the informal service and manufacturing sectors increased in the period from 2005 to 2009 compared to the period from 1996 to 2004. By contrast, agricultural activities were
-100 -50 0 50Standardized % bias across covariates
Hamkyung Province
Wage from Formal Economy
Age
Job from Formal Economy
Edu. (up to Univ.)
Gender
Kangwon Province
Hwanghae Province
Edu.(up to Secondary)
Jagang Province
Subjective Rank of Living
Yanggang Province
Pyungyang and Pyungahn Province
UnmatchedMatched
Figure 3bias aCross Covariates between matChed and unmatChed sample

472 SEOUL JOURNAL OF ECONOMICS
stagnant in the period from 2005 to 2009 compared to the period from 1996 to 2004. Hence, we can conclude that qualitative changes occur in IEAs in North Korea from 2005 to 2009 such that households participate more actively in the informal service and manufacturing sector despite anti-market policies by the North Korean government.
C. Productivity in the Informal Economic Activities
An interesting question is whether increases in IEAs are accompanied with rises in productivity. If so, the North Korean economy will experience positive growth in accordance with the advancement of the informal economy. We use labor productivity measured by log of hourly wage as a dependent variable.13,14 The estimation methods include Tobit
13 We converted nominal income to real income by deflating the former using the consumer price index from 1996 to 2009. The annual consumer price index is presented in the Appendix Table 2.
14 Our survey data set contain the information on average working hours in a week. We calculate the hourly wage from the informal sector by dividing the weekly income by weekly working hours. Given that questions about weekly
Table 5average treatment effeCt for the treated (att) based on different
matChing estimators
Dependent Variable (1) NN (2) Kernela (3) Radius
Agricultural -0.085(-1.514)
-0.042(-1.040)
-0.026(-0.850)
Service 0.143***(2.403)
0.068*(1.653)
0.105***(3.386)
Manufacturing 0.136***(3.405)
0.115***(3.195)
0.119***(4.643)
Balancing Property SatisfiedCommon Support Imposed
YesYes
YesYes
YesYes
Observations Treated Controls
362201
362656
343656
Note: t-statistics is reported in parentheses. a denotes bootstrapped t-statistics. *, **, and *** denote significance at the 10 percent, 5 percent, and 1 percent level, respectively.

473THE EVOLUTION OF NORTH KOREA’S INFORMAL ECONOMY
working hours are not asked in the first survey, we use the survey data from the second to fourth surveys in this analysis.
Table 6produCtivity in the informal eConomiC aCtivities
OLS Tobit
(1) (2)
Agricultural Activities 0.091(1.358)
0.100(1.335)
Service Activities 0.134*(1.933)
0.158**(2.054)
Manufacturing Activities 0.062(0.938)
0.070(0.965)
Multiple Jobs -0.125(-1.476)
-0.149(-1.572)
Job in the formal economy (=1) 0.048(1.192)
0.040(0.881)
Real wage from formal economy (log) 0.001(0.166)
-0.000(-0.059)
Subjective rank of living 0.078***(4.253)
0.087***(4.270)
Gender (male=1) 0.007(0.176)
0.020(0.464)
Age -0.001(-0.136)
0.001(0.089)
Age squared 0.000(0.114)
-0.000(-0.151)
Number of family members -0.012(-0.879)
-0.013(-0.868)
Edu. (secondary=1) 0.066(0.843)
0.070(0.797)
Edu. (University=1) 0.031(0.381)
0.018(0.199)
Regional dummiesTime dummies
YesYes
YesYes
Number of ObservationsR2
2690.182
2690.296
Note: Dependent variable is labor productivity, measured by hourly income. Model (1) is estimated via OLS, whereas Model (2) shows the results based on Tobit estimation. T-value is reported in parentheses. *, **, and *** denote significance at the 10 percent, 5 percent, and 1 percent levels, respectively.
474 SEOUL JOURNAL OF ECONOMICS
as well because the data on labor productivity are censored for those whose informal income is zero.
Table 6 presents the relationship between labor productivity and different IEAs. The results suggest a positive correlation between productivity and participation in the informal service sector. On the basis of the results in column (2), labor productivity rises by 15.8 percent if one participates in the informal service sector. This finding has the following implications for the North Korean economy. First, the informal service sector provides opportunities for households to become better off compared to other economic activities including formal work, informal manufacturing, and informal agricultural activities. Second, the shift of working from other areas to the service sector may contribute to increases in labor productivity and thus economic growth. This finding can be understood from the structure of the socialist economy where the service industry has been repressed. The service sector can develop rapidly because of the ample opportunities to meet demand.15 Third, unlike the service sector, the manufacturing sector fails to contribute to growth. The informal manufacturing sector is likely to be at the primitive stage of development partially because manufacturing requires investment in fixed capital; however, without property rights, such investments would be difficult to make.
IV. Conclusion
This study uses the four waves of the surveys of 1,140 North Korean refugees from 2004 to 2011 to analyze the dynamics of the informal economy in North Korea. The fact that their final year of residence in North Korea was different enables us to identify changes in the IEAs of households for a relatively long-term period. This paper classifies IEAs into three types; agricultural, service, and manufacturing activities, and then divides the period of 1996–2009 into four sub-periods based on North Korea’s different policies toward the informal economy, namely, implicit permission of market activities (1996–2001), appeasement period (2002–2004), anti-market policies (2005–2006), and further anti-
15 The literature suggests that the service sector may induce economic development in developing as well as transition countries (Ghani 2010; Ghani, and Kharas 2010; McMillan, and Harttgen 2014; Noland et al. 2012; Park, and Shin 2012; Easterly et al. 1994).

475THE EVOLUTION OF NORTH KOREA’S INFORMAL ECONOMY
market policies (2007–2009). The main findings of this research can be summarized as follows.
First, little evidence exists on increases in IEAs in terms of the aggregate participation rate in the informal economy from 1996 to 2009. Given the expanding nature of the informal economy, this finding can be interpreted as evidence of the effectiveness of anti-market policy implemented from 2005 to 2009. However, the finding that only informal agricultural activities were negatively affected by such policy implies that IEAs are firmly rooted in the economy as major means of survival and business. Second, service and the manufacturing activities in the informal economy increase during 2005–2009 despite anti-market policies. One possible explanation is widespread corruption of bureaucrats who receive bribes from participants in markets (Kim, and Koh 2011). Third, labor productivity is improved in the service sector, such as market trading, transportation service, and repair. This result implies that the expansion of the informal service sector contributes to North Korea’s economic growth. However, our finding that rise in productivity was not observed in other areas especially in the manufacturing sector implies a lack of private property rights as a source of constraining development of manufacturing.
(Received 26 September 2016; Revised 27 October 2016; Accepted 28 October 2016)

476 SEOUL JOURNAL OF ECONOMICS
Appendix
appendix Table 1test for balanCing after matChing
VariableSample (U or M)
Mean % reduct t-test
Treated Control % bias |bias| t p>|t|
Job from Formal UM
0.47510.4714
0.53700.3914
-12.416.0
-29.3
-1.932.14
0.0530.033
Wage from Formal UM
1.59101.6275
2.99091.3930
-42.77.2 83.2
-6.491.06
0.0000.287
Subjective rank of living
UM
2.94752.9286
2.51682.9600
42.0-3.1
92.7
6.41-0.41
0.0000.683
Gender UM
0.36190.3657
0.37420.3657
-2.50.0
100.0
-0.400.00
0.6921.000
Age UM
34.961035.2370
38.725035.2310
-32.90.0
99.8
-5.090.01
0.0000.994
Edu. (Secondary=1) UM
0.69610.6971
0.53570.6857
33.42.4
92.9
5.140.33
0.0000.744
Edu. (University=1) UM
0.24310.2400
0.26380.2486
-4.8-2.0
58.6
-0.74-0.26
0.4600.792
Pyungyang and Pyungahn
UM
0.28450.2943
0.09830.2857
48.72.2
95.4
8.170.25
0.0000.803
Hamkyung UM
0.41160.4257
0.82770.4286
-94.8-0.7
99.3
-15.50-0.08
0.0000.939
Hwanghae UM
0.03870.0400
0.02420.0371
8.31.6
80.2
1.340.20
0.1790.845
Kangwon UM
0.01660.0171
0.01880.0229
-1.7-4.3
-152.0
-0.27-0.54
0.7910.590
Jagang UM
0.08290.0543
0.00400.0629
39.4-4.3
89.1
7.40-0.48
0.0000.630
Yanggang UM
0.15190.1543
0.02290.1429
46.94.2
91.1
8.410.42
0.0000.671
Sample Ps R2 LR chi2 p>chi2 MeanBias MedBias B R %Var
UnmatchedMatched
0.2740.006
382.355.94
0.0000.948
31.63.7
33.42.4
136.5*18.4
1.370.82
5423

477THE EVOLUTION OF NORTH KOREA’S INFORMAL ECONOMY
appendix Table 2estimated Consumer priCe index based on priCes of porK (north Korean
won)
Year 1996 1997 1998 1999 2000 2001 2002
CPI 100.00 109.73 110.75 153.25 108.55 126.89 184.60
Year 2003 2004 2005 2006 2007 2008 2009
CPI 561.42 1503.98 1530.54 1766.27 3515.93 3458.67 3708.63
Note: Corn and rice are the most important food items for North Korean households. However, constructing the consumer price index of North Korea according to the market prices of these items may yield inaccurate estimations because the prices for such goods are heavily affected by international aid. In other words, constructing a consumer price index according to both prices will underestimate a true price index because rice and corn are supplied partially by foreign governments and international aid organizations. Therefore, we use pork price to represent the prices of other goods and services that are unaffected by international aid.
Sources: For price of pork between 1996 and 1997, information was gathered from our surveys of North Korean refugees that were conducted in 2004–2005, 2007, 2009, and 2011. From 1998 to 2001, the data from the South Korean government provided by Lee (2006) are used. The data from our survey are used for the period from 2002 to 2007. Lastly, the weekly and bi-weekly prices in 2008 and 2009 were obtained from NK daily, a South Korean NGO, and averaged for the respective year.
Reference
Central Bureau of Statistics. Democratic People’s Republic of Korea 2008 Population Census National Report. Pyongyang, DPR Korea, 2009.
Easterly, William, Martha de Melo, and Gur Ofer. Services as a Major Source of Growth in Russia and Other Former Soviet States. Policy Research Working Paper. Washington, D.C.: World Bank, 1994.
Ghani, Ejaz. “Is Service-led Growth a Miracle for South Asia?” In Ejaz Ghani (ed.), The Service Revolution in South Asia. Oxford: Oxford University Press, 2010.
Ghani, Ejaz, and Homi Kharas. “The Service Revolution in South Asia: An Overview.” In Ejaz Ghani (ed.), The Service Revolution in South Asia. Oxford: Oxford University Press, 2010.
Grossman, Gregory. Roots of Gorbachev’s Problems: Private Income and Outlay in the Late 1970s. Joint Economic Committee, US

478 SEOUL JOURNAL OF ECONOMICS
Congress, US Government Printing Office: Washington, DC, 1987.
Grossman, Gregory. Subverted Sovereignty: Historic Role of the Soviet Underground. In Stephen S. Cohen, Andrew Schwartz, and John Zysman (eds.), The Tunnel at the End of the Light: Privatization, Business Networks, and Economic Transformation in Russia. Berkeley: University of California Press, pp. 24-50, 1998.
Haggard, Stephen, and Marcus Noland. Repression and Punishment in North Korea: Survey Evidence of Prison Camp Experiences. MPRA Chapter No. 17705, 2009.
Joung, Eun Lee. “Studies on the Development of North Korean Market-Focusing on the Process of Ratification of the Authorities about the People’s Pressure over the Control and Relaxation.” EXIM North Korean Economic Review (2014) (in Korean).
Kim, Philo. “Segmentalized Marketization and its Socio-Political Implications in North Korea.” North Korean Studies Review 16 (No. 1 2012): 93-121 (in Korean).
Kim, Byung-Yeon. “Informal Economy Activities of Soviet Households: Size and Dynamics.” Journal of Comparative Economics 31 (No. 3 2003): 532-51.
. “The Marketization of the North Korean Economy: Evaluation of the Informalization Hypothesis.” In Youngkwan Yoon and Unchul Yang (eds.), North Korean Economy and Society after the July 1st Economic Management Improvement Measures. Korea Peace Institute Series 2, Hanul, Seoul, 2009 (in Korean).
. “The Unofficial Market in Russia.” In M. Alexeev and W. Shlomo (eds.), Handbook of the Russian Economy. Oxford University Press, 2013.
Kim, Byung-Yeon, and Dongho Song. “The Participation of North Korean Households in the Informal Economy: Size, Determinants, and Effect.” Seoul Journal of Economics 21 (No. 2 2008): 361-85.
Kim, Byung-Yeon, and Moonsoo Yang. Markets and the State in the North Korean Economy. Seoul: Seoul National University Press, 2012 (in Korean).
Kim, Byung-Yeon, and YuMi Koh. “The Informal Economy and Bribery in North Korea.” Asian Economic Papers 10 (No. 3 2011): 104-17.
Kim, Suk-Jin, and Moon-Soo Yang. The Growth of Informal Economy in North Korea. Korea Institute for National Unification, Research Paper Series No. 14-03, 2014 (in Korean).

479THE EVOLUTION OF NORTH KOREA’S INFORMAL ECONOMY
Kim, Younghoon, and Lim Sookyung. Statistics on North Korean Agriculture and Food. Korea Rural Economic Institute, 2014 (in Korean).
Lee, Suk. Size, Trend and Structure of Market in North Korea. Policy Study 2009-12, Korea Development Institute, 2009 (in Korean).
Lee, Seog-Ki, Moon-Soo Yang, and Eun Lee Joung. Analysis on the Markets of North Korea. Research Report 2014-738, Korea Institute for Industrial Economics and Trade, 2014 (in Korean).
Lee, Seog-Ki, Moon-Soo Yang, Suk-Jin Kim, Young-Hoon Lee, Kang-Taek Lim, and Bong-Hyun Cho. Analysis of North Korea’s Economic Issues. Research Report 2013-673, Korea Institute for Industrial Economics and Trade, 2013 (in Korean).
Lee, Young-Hoon. “The Status of North Korea-China Trade and Its Impact on North Korean Economy.” Finance and Economic Studies (No. 246 2006), Bank of Korea (in Korean).
. A Survey of North Korean Economic Conditions Using Data from Refugees’ Survey. Seoul: Bank of Korea, 2007 (in Korean).
Leuven, Edwin, and Barbara Sianesi. PSMATCH2: Stata Module to Perform Full Mahalanobis and Propensity Score Matching, Common Support Graphing, and Covariate Imbalance Testing. Statistical Software Components S432001, Boston College Department of Economics, 2003.
Lim, Kang-Taek. A Study on the Marketization of the North Korean Economy. Research Paper Series 09-04, Korea Institute for National Unification, 2009 (in Korean).
McMillan, Margaret S. and Kenneth Harttgen. What is Driving the ‘African Growth Miracle’?. NBER Working Paper No. 20077, 2014.
Noland, Marcus, Donghyun Park, and Gemma B. Estrada. Developing the Service Sector as Engine of Growth for Asia: An Overview. ADB Economics Working Paper No. 320, 2012.
Ofer, Gur, and Aaron Vinokur. “Private Sources of Income of the Soviet Urban Household.” The Soviet Household under the Old Regime: Economic Conditions and Behavior in the 1970s. Cambridge: Cambridge University Press, 1992.
Oh, Gyeong Seob. “The Formation and Development of the North Korean Market: Focusing on Features and Political effects of Marketization.” Sejong Policy Studies 22 (2013) (in Korean).
Park, Donghyun, and Kwanho Shin. The Service Sector in Asia: Is It an Engine of Growth? ADB Economics Working Paper No. 322,

480 SEOUL JOURNAL OF ECONOMICS
2012.Solnick, Steven. Stealing the State: Control and Collapse in Soviet
Institutions. Cambridge MA: Harvard University Press, 1998. Treml, Vladimir G., and Michael Alexeev. “The Growth of the Second
Economy in the Soviet Union and Its Impact on the System.” In Robert W. Campbell (ed.), The Postcommunist Economic Transformation. Boulder, CO: Westview Press, pp. 221-47, 1994.
Wintrobe, Ronald. The Political Economy of Dictatorship. Cambridge: Cambridge University Press, 1998.
Yang, Moon-Soo. The Marketization in North Korean Economy. Seoul: Hanul, 2010 (in Korean).