the eu response to the crisis - circabc - welcome · outline 1. the origin of the crisis 2. the...
TRANSCRIPT

The EU response to the crisis
Riccardo DE BOSIO, European Commission, DG ECFIN
1 December 2016

The objective
A procedure to capture:
• "Macroeconomic"
• "Imbalances"
Therefore:
• How do you describe the state of the macroeconomy?
• How do you identify an imbalance?
2

Outline 1. The origin of the crisis
2. The EU's response to the crisis: enhanced economic governance
3. The (long) road to recovery
4. Macroeconomic Imbalances Procedure
5. Imbalances: where do we stand? (AMR 2017)
6. Conclusions and next steps
3

1. The origin of the crisis
4
Origin of the crisis: what went wrong?

2007 - Subprime crisis
2008 – Banking crisis
2009 – Economic crisis
2010 – Sovereign debt crisis
2011 – 2012 systemic crisis of the euro
Excess credit + prolonged upswing + expectations
Defaults cause bank losses, distrust rises
Credit crunch; high risk aversion hits trade & investment
Recession hits tax revenues; welfare spending rises; GDP denominator falls
Contagion spreads crisis through financial and economic links; speculation on exit & breakup
5
Stages of the crisis: from financial to economic to institutional crises

2007-2008: the financial crisis
What we missed: the signs • Abundant global liquidity, real estate
bubble (credit backed by the value of the collateral)
• Rapid credit growth, high leveraging
• Supervisory failures : supervision too focused on individual institutions, not the global picture
What was wrong • Originate and distribute model • Complex and opaque financial products
(CDOs…)
• Conflicts of interest of rating agencies • Incentives for short-run risk taking
(Compensation schemes…) • Maturity mismatches in banks’ balance
sheets
Domino effects and feedback loops when
bubbles pop

8
GDP in the face of crisis
-6
-4
-2
0
2
4
6
t-12 t-8 t-4 t = 0 t+4 t+8 t+12
% y
ear
on
yea
r g
row
th
113 historical crises (median)
US (current crisis)
EU (current crisis)
Note: y-o-y grow th rates during tw elve quarters before and after the beginning (0) of a
f inanical stress episode. T = 0 corresponds to 2007Q4. Dotted lines refer to forecasts.
Sources: IMF, OECD, European Commission.
2008-2009: the EU experienced the deepest slump since WWII…

….Or worse
Source: US bureau of Economic Analysis; European Commission (Autumn 2015)
0
20
40
60
80
100
120
0 1 2 3 4 5 6 7 8 9 10
GD
P,
Pre-c
ris
is=
10
0
Number of years since the start of the crisis
US, 1929-392 Greece, 2008-14
GDP in volume US vs Greece

Source: European Commission. 11
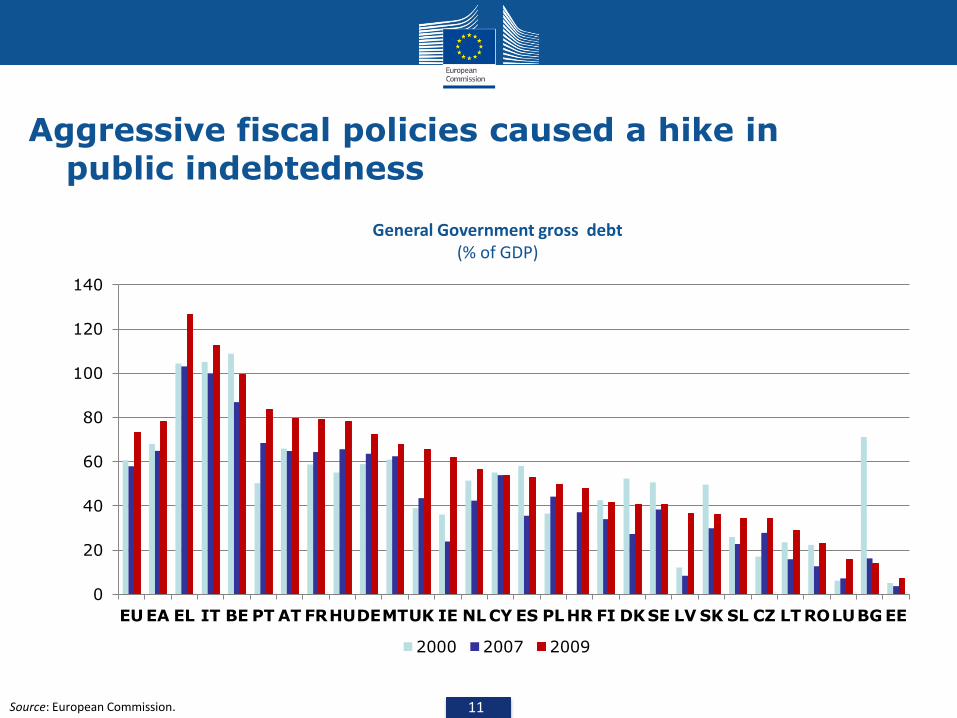
Aggressive fiscal policies caused a hike in public indebtedness
General Government gross debt (% of GDP)
0
20
40
60
80
100
120
140
EU EA EL IT BE PT AT FRHUDEMTUK IE NL CY ES PLHR FI DKSE LV SK SL CZ LT ROLUBG EE
2000 2007 2009

12
FINANCIAL
STABILITY
SOVEREIGN
DEBT
ECONOMIC
GROWTH
FINANCIAL
STABILITY
SOVEREIGN
DEBT
ECONOMIC
GROWTH
The negative feedback loop

Source: European Commission.
-150
-100
-50
0
50
100
150
200
PT ES EL EE IE SK SI IT AT
CY* FR FI
MT
NL
DE
BE*
LU*
2000 2008
2013
NIIP (% of GDP)
40
50
60
70
80
90
100
110
120
20
00
20
02
20
04
20
06
20
08
20
10
20
12
Ireland Spain Germany
Housing prices (2007=100)
(*) start in 2002
13
Meanwhile, unsustainable external positions and asset bubbles contributed to divergences in the EU

2. The EU's response to the crisis: enhanced economic governance
14

The original design of EMU was incomplete
Failure to adapt to requirements of EMU
Accumulation of unsustainable debt levels, both in public and private sector
Excessive risk-taking in the banking sector
Failing market discipline
EMU led Member States to delay necessary structural reforms
Inadequate governance framework
Insufficient monitoring and enforcement tools to safeguard fiscal discipline
No instruments available to address macroeconomic imbalances
No established sovereign-debt crisis resolution mechanism for euro-area Member States
No integrated European supervisory and regulatory architecture for financial institutions
15
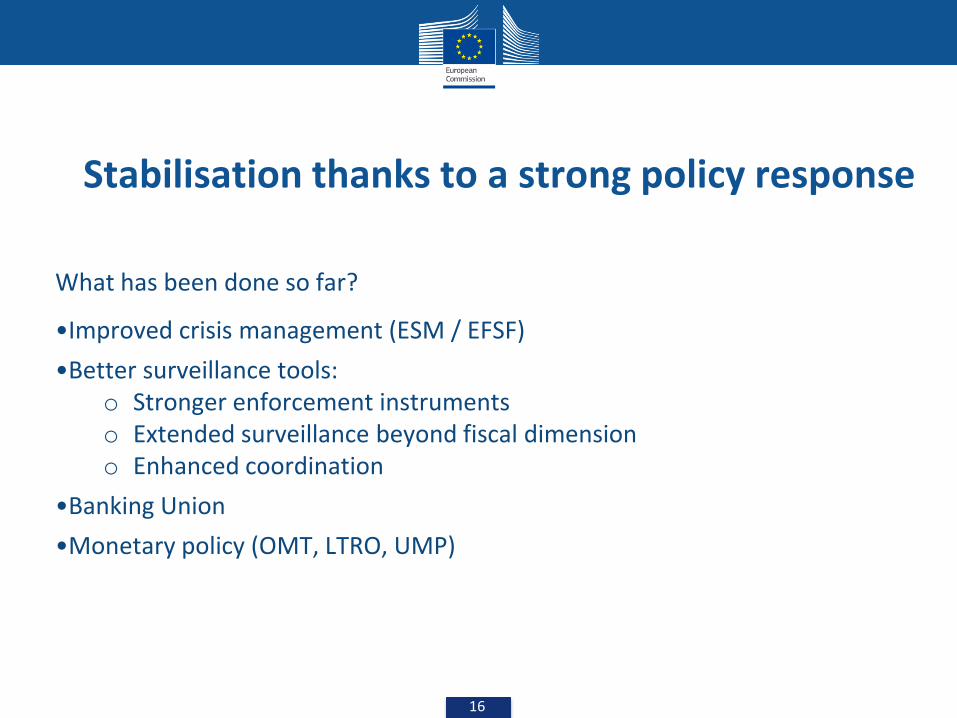
Stabilisation thanks to a strong policy response
What has been done so far?
•Improved crisis management (ESM / EFSF)
•Better surveillance tools: o Stronger enforcement instruments o Extended surveillance beyond fiscal dimension o Enhanced coordination
•Banking Union
•Monetary policy (OMT, LTRO, UMP)
16

Crisis management was improved through the setup of stability funds
Non-euro area
- Balance of Payments Facility
Euro area
-Temporary: - European Financial Stabilisation Mechanism
- European Financial Stability Facility
- Permanent: - European Stability Mechanism
In case of use: macroeconomic adjustment programme and intensive monitoring by so-called Troika: COM, ECB, IMF (two pack)
17
ESM instruments: - loans under a macroeconomic adjustment programme - purchase of debt in the primary and secondary debt markets - credit lines - recapitalisations of financial institutions through loans - direct recapitalisation of banks

18
FINANCIAL
STABILITY
SOVEREIGN
DEBT
ECONOMIC
GROWTH
Improved
Governance
Structural reforms
Fiscal discipline
Differentiated fiscal consolidation & quality
of public finances
Bank funding
Bank recaps
Firewalls
FINANCIAL
STABILITY
SOVEREIGN
DEBT
ECONOMIC
GROWTH
Structural reforms
Fiscal Discipline
Enhanced rules
Differentiated fiscal consolidation & quality
of public finances
Bank funding
Bank recaps
Firewalls
Breaking the negative feedback loop

Fiscal compact
ESM
Strengthened economic governance in EMU
Prevention and
correction of macro
imbalances
New surveillance
procedure and
possible sanctions
Better enforcement of
rules
-Larger range of sanctions,
starting more gradual, quasi-
automaticity (RQMV)
-Strengthened national fiscal
frameworks
More effective
preventive arm of SGP
- Expenditure benchmark
- Draft Budget Plans
- Autonomous recommendations
Focus on debt
developments
Numerical benchmark in the
corrective arm of the SGP
Structural reforms
Europe 2020 strategy
Price stability ECB
- LTRO
- OMT
- Forward guidance
Crisis
Resolution EFSM/EFSF/ ESM
Financial Stability
Sound Fiscal Policy
Sustained Economic Growth
Banking Union •Based on a single rule book for the EU 28 •Single Supervisory Mechanism •Single Resolution Mechanism
19

Key pieces of the EU-wide Financial Reform
20

Making European banks more robust
December 2011: EBA bank recapitalisation exercise
Ensuring the medium-term funding of banks to avoid a
credit crunch
ECB support: two 3-year LTROs
EUR 489bn for 523 participating banks (21/12/2011)
EUR 529bn for 800 participating banks (29/02/2012)
Enhancing the quality and quantity of bank capital to
withstand shocks
Core Tier 1 ratio of 9% to be achieved by end-June
2012
November 2014: AQR and stress tests (comprehensive
assessment. 21

Key elements of the Banking Union
Single Rulebook for EU28 (CRD IV/CRR and BRRD)
Single Supervisory Mechanism
Effective supervision based on high
common standards
Single Resolution Mechanism Effective crisis
resolution, private sector funding
• November 2014 - the ECB becomes the supervisor of all major banks in the Euro Area (around 130) and the MS that 'opted-in'
• AQR and stress tests
• IGA Finally signed in May 2014
• January 2016 – the SRM becomes fully operational
Single Deposit Guarantee Scheme
Harmonised system for depositors
protection
• Final arrangement in 5 PR
22

Extraordinary measures by the ECB
"Securities Market Programme" (SMP)—from May 2010—limited sterilised interventions
Long-term repurchase operations (LTRO)—End 2011
OMT – 2012 - Secondary market purchase of government debt, Response to fears on the reversibility of the euro.

Stability and Growth Pact
• Each Member State required to stay within the limits of (defined in the TFEU):
o government deficit (3% of GDP) & debt (60% of GDP)
• Preventive Arm
o Submission of Annual Stability and Convergence Programmes
o Country-Specific Medium-Term Budgetary Objectives – MTO
• Corrective ('Dissuasive') Arm
o Excessive Deficit Procedure – EDP
o Sanctions
Two Arms to ensure fiscal discipline in the EMU
24

Six Pack, Two Pack & Fiscal Compact
• Preventive arm o Expenditure benchmark to prevent that spending rises faster than medium-term potential GDP
o Balanced Budget Rule - structural deficit must not exceed 0.5% of GDP (or 1.0% of GDP if debt significantly < 60% of GDP)
• Corrective arm
o Debt criterion became enforceable
→ EDP can be launched on deficit and debt criterion
→ 1/20th target - debt must decrease by 1/20th of GDP annually if > 60%
• Strengthened budgetary surveillance
o Draft budgetary plans submitted to the Commission
o Common budgetary timeline for an enhanced coordination
o Independent Fiscal Councils established in the Member States
• Strengthened enforcement o For MS in EDP the deposits and fines kick in earlier
o Reverse QMV for graduated financial sanctions
25

Lessons for economic governance •Scope and nature of surveillance
• Wider, especially on macro-financial issues and competitiveness/imbalances
• Deeper, especially on debt sustainability and key growth-enhancing reforms
• Better integrated, avoiding partial and fragmented approaches
•Follow-up and enforcement
• Stronger enforcement instruments
• Influence on economic policy debates at national level
• Taking account of Euro area dimension
Deepening EMU: 5 Presidents' report + Commission's Blueprint
Growth-enhancing reforms and EU 2020 Strategy
6

3. The (long) road to recovery
27

Policy response has led to a gradual stabilisation of financial markets
28

Financial sector repair – work in progress
0
5
10
15
20
25
EL SI BG CY IE HR
HU IT LT PT
LV CZ ES PL
BE
AT
FR DK SK EE NL
UK
DE
MT SE FI
June 2013
EA (June2013)
2008
Source: ECB consolidated banking data
Gross total doubtful and non-performing loans [% of total debt instruments and total loans and advances)
75
95
115
135
155
175
195
Jan
-04
Oct
-04
Jul-
05
Ap
r-0
6
Jan
-07
Oct
-07
Jul-
08
Ap
r-0
9
Jan
-10
Oct
-10
Jul-
11
Ap
r-1
2
Jan
-13
Oct
-13
EA
DE
IE
ES
IT
PT
Loan to deposit ratio
Source: ECB
Changes in euro area banks' aggregate CT1 ratios, 2011-2013 (% and pps)
Source: ECB, SNL Financial
29

Banking Union – work in progress Financial fragmentation & 'creditless' recovery
Source: Winter Forecast 2014
Interest rates on loans to enterprises (new business, maturity up to 1 year)
Economic and credit cycles, euro area (year-on-year %)
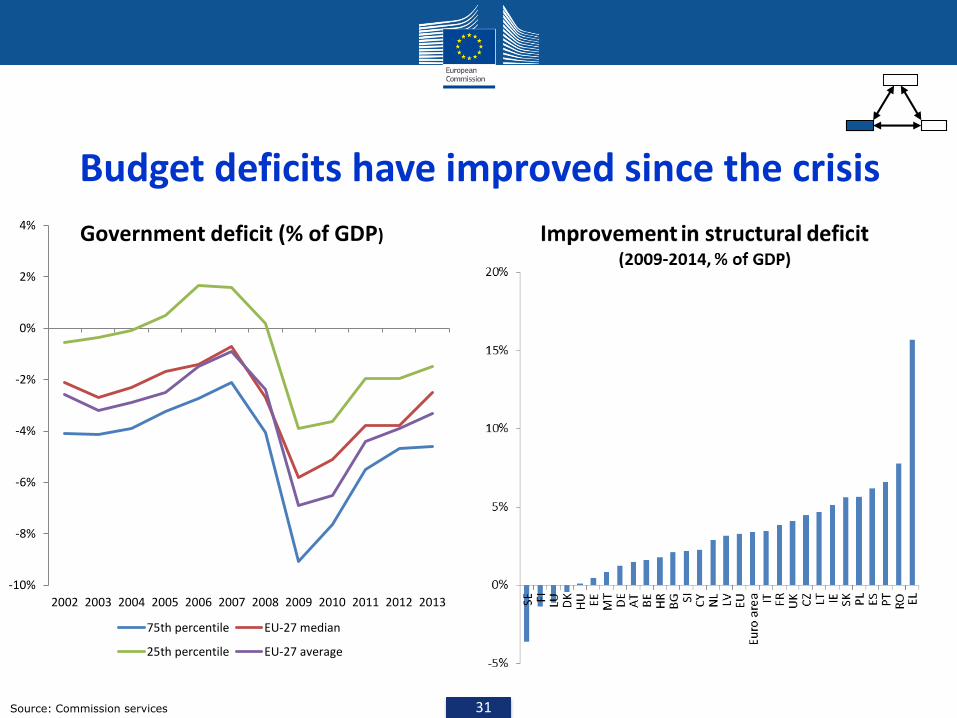
Budget deficits have improved since the crisis
Source: Commission services
-10%
-8%
-6%
-4%
-2%
0%
2%
4%
2002 2003 2004 2005 2006 2007 2008 2009 2010 2011 2012 2013
Government deficit (% of GDP)
75th percentile EU-27 median
25th percentile EU-27 average
31

Government debt is high across the EU and some countries need substantial further fiscal adjustment by 2020
32
-5,00
-3,00
-1,00
1,00
3,00
5,00
7,00
9,00
EE LV DK SE BG LT HU
RO SK DE PL
ES LU CZ
NL IT
MT
AT SI FI HR FR PT
UK IE BE
Autumn 2010
Spring 20140%
20%
40%
60%
80%
100%
120%
140%
160%
180%
EE BG LU LV RO SE LT CZ
DK PL
SK FI HR
MT
NL
DE
HU AT SI EU UK FR EA ES BE IE CY
PT IT EL
2009 2014-2009
S1 indicator: required fiscal adjustment by 2020 to reach a 60% debt-to-GDP ratio in 2030
Government debt (% of GDP)

33
Recovery takes hold, but fragile and uneven
Source: Autumn Forecast 2014
Real GDP, the whole of EU Real GDP, Selected countries 2008=100
60
70
80
90
100
110
120
130
140
BE DE IE EL ES
FR IT UK PT
0,5 2,1
1,8
-0,5
0,2 1,4
1,9 2,0
2,1
-3
-2
-1
0
1
2
3
80
85
90
95
100
105
110
Quarterly GDP growth GDP quarterly (index)
GDP annual (index) Column3
-4.4

What are the economic prospects for the upcoming five years?
34
o Signs of a turnaround in the euro area, including in vulnerable economies
o More weight of domestic demand in the core and external demand in the periphery
o But growth is still weak due, notably, to EA specific factors
96
98
100
102
104
106
108
0 1 2 3 4 5 6 7 8 9 10
previous recoveries
current recovery
index
quarters
Current recovery against past average* (GDP, euro area)

35 35
Case No 1: Full return to earlier path
Case No 2: Permanent loss in GDP level
Case No 3: Permanent loss on growth rates
Slope = long-term potential growth
No loss in potential output level after some
time
Potential output level
Same long-term potential growth after the crisis (same slope)
Potential output level
Years
Permanent loss in potential output level
Lower long-term output growth after the crisis (e.g. 1.5%)(lower post-crisis slope)
Potential growth before crisis (e.g. 2%)
Years
Potential output level
Potential output loss increasing
overtime
The medium- to long-run: possible trajectories for growth

36
4. MACROECONOMIC IMBALANCES PROCEDURE : Aiming to prevent the
next crisis

Crises illustrated gaps in economic
surveillance framework
Compliance with SGP does not guarantee overall
macro-financial stability
Large macroeconomic imbalances accumulated
ahead of the crisis that were not appropriately picked
up.
Unwinding of such imbalances contributed to
unprecedented depth of recession and weighed
heavily on public finances.

38
The macroeconomic imbalance procedure Context: Enhancing economic governance in the EU and the euro area, six-pack
Macroeconomic surveillance New regulation on prevention and correction of macroeconomic imbalances
Enforcement New regulation on effective enforcement of macroeconomic surveillance Sanctions in case of persistent inaction/insufficient action
Enforcement New regulation on effective
enforcement of budgetary surveillance
Stronger incentives & sanctions
Fiscal surveillance
- Prudent fiscal policy
- Debt criterion
- Minimum standards for fiscal frameworks

Autumn forecast
Winter forecast
Spring forecast
15 October
In-Depth Reviews
May/June
November
Annual Growth Survey
15 April
Stability/Convergence Programmes National Reform Programmes
Country-Specific Recommendations
Alert Mechanism Report
The European Surveillance Cycle
Governance architecture
Commission's opinions on Draft Budgetary Plans
Euro-area Member States: Draft Budgetary Plans
39

Challenge 1: complexity of the surveillance mechanisms
• A multiplicity of legal acts which is hard for experts to follow and emphasises process over substance
• The problem of the "complete contract": rules versus discretion
• Communication with stakeholders, especially at national level: ownership
40

Challenge 2: economic analysis in practice
• More difficult to identify problems earlier in the economic cycle, e.g. credit growth, house prices?
• Economic literature is not so conclusive on policy diagnosis and responses, especially in the aftermath of a balance-sheet crisis.
• Requires a lot of country specific knowledge. • Overall, it requires qualitative judgement to
complement quantitative analysis which is contestable.
41

Challenge 3: political economy accountability and ownership
• Respect the subsidiarity principle: when macroeconomic problems at the level of the Euro area require microeconomic actions at MS level.
• Democratic accountability and transparency at both EU and national level.
• The ins and the outs
42

The two arms of the MIP
• PREVENTIVE ARM: Ensure efficient and timely surveillance of macro imbalances where needed and bring the issues to the table. Integrated in European semester.
• CORRECTIVE ARM: Ensure efficient and timely policy action and correction when required. Follow-up by own time line.

a. Alert mechanism
report
Economic reading of the MIP
Scoreboard
November
Programme
countries
have their own
enhanced
surveillance
No risk
identified
Procedure stops
b. In-depth reviews
Commission prepares in-depth country
reviews (IDR), using a wide set of
indicators and analytical tools.
February/March
No problem
Procedure stops
Excessive
imbalances
Decision to
trigger (or not)
the corrective
arm
Imbalances
Recommendatio
ns under
European
Semester
May
The MIP procedure : a 2-step process to detect imbalances
Potential imbalance

The Corrective Arm
Member State is
placed in “Excessive Imbalance Position”
Corrective Action Plan
Surveillance of compliance with
reform commitments
Sufficient abeyance
Insufficient:
interest bearing deposit
Insufficient: Fine
0.1% of GDP
Insufficient fine 0.1% of
GDP

Reverse Qualified Majority Voting
Member State is
placed in an
Excessive Imbalance Position
Corrective Action Plan
Surveillance of compliance with
reform commitments
Sufficient abeyance
Insufficient: interest bearing deposit
Insufficient: Fine
0.1% of GDP
Fine 0.1% of GDP

a. The alert mechanism report and the
MIP scoreboard

Role and scope of the AMR
• Screening device to identify Member States for which in-depth review is warranted
• Programme countries are not assessed
• No policy conclusions or country-specific recommendations
• Based around an economic reading of a scoreboard of indicators
• Commission Report adopted by college

49
• Headline scoreboard: selected 14 indicators with indicative alert thresholds: alert thresholds based on historical data
• Scoreboard complemented by set of additional 28 "reading indicators" (including 9 of social character)
• Presented on t-1 annual statistics but the economic reading considers latest data available at any frequency
• Scoreboard may be adjusted over time (AGS 2015: promotion of some social indicators for AMR-2016)
MIP scoreboard: an analytical tool

50
It is:
• A first step (an initial filter) in the procedure
• An instrument of communication and accountability (COM needs to explain its decision taking into account the scoreboard)
• A set of indicators that helps identifying macroeconomic risks (but needs to be complemented by detailed analysis) ____________________________________________________
It is not:
• A tool for a mechanic decision on the existence of imbalances
• A tool to identify progress in reforms and developments in macro risks
What the scoreboard is and what is not

51
The scope of the scoreboard • External positions (current accounts, net international
investment positions)
• Competitiveness developments (REERs, ULCs)
• Export performance (export market shares)
• Private sector indebtedness (credit, debt)
• Public sector indebtedness
• Assets markets (housing)
• Financial sector developments (fin. Sector liabilities)
• Unemployment
• Activity rates
• Long-term unemployment
• Youth unemployment
Exte
rnal
imb
ala
nces
Inte
rnal
imb
ala
nces
Em
plo
ym
en
t
ind
icato
rs

52
Table 1.1: MIP Scoreboard 2015
Current
account
balance - % of
GDP
(3 year average)
Net
international
investment
position
(% of GDP)
Real effective
exchange rate -
42 trading
partners, HICP
deflator
(3 year % change)
Export market
share - % of
world exports
(5 year %
change)
Nominal unit
labour cost
index
(2010=100)
(3 year %
change)
House price
index
(2010=100),
deflated
(1 year %
change)
Private sector
credit flow,
consolidated
(% of GDP)
Private sector
debt,
consolidated
(% of GDP)
General
government
gross debt
(% of GDP)
Unemployment
rate
(3 year average)
Total financial
sector
liabilities,
non-
consolidated
(1 year %
change)
Activity rate - %
of total
population aged
15-64
(3 year change in
pp)
Long-term
unemployment
rate - % of active
population aged
15-74
(3 year change in
pp)
Youth
unemployment
rate - % of active
population aged
15-24
(3 year change in
pp)
Thresholds -4/6% -35%±5% (EA)
±11% (Non-EA)-6%
9% (EA)
12% (Non-EA)6% 14% 133% 60% 10% 16.5% -0.2 pp 0.5 pp 2 pp
BE -0.2 61.3 -1.2 -11.3 1.5 1.3p 4.5 166.3 105.8 8.5 -1.0 0.7 1.0 2.3
BG 0.6 -60.0 -4.1 12.8 14.9p 1.6bp -0.3 110.5 26.0 11.2 7.0 2.2 -1.2 -6.5
CZ 0.2 -30.7 -8.0 0.1 0.5 3.9p 0.9 68.6 40.3 6.1 7.7 2.4 -0.6 -6.9
DK 8.8 39.0 -1.5 -8.8 4.9 6.3 -3.3 212.8 40.4 6.6 -2.0 -0.1 -0.4 -3.3
DE 7.5 48.7 -1.4 -2.8 5.7 4.1 3.0 98.9 71.2 4.9 2.8 0.4 -0.4 -0.8
EE 0.9 -40.9 6.4 8.5 14.4 6.8 3.3 116.6 10.1 7.4 8.1 1.9 -3.1 -7.8
IE 4.7* -208.0* -5.9 38.3* -18.1 8.3 -6.7 303.4 78.6 11.3 9.5 0.8 -3.7 -9.5
EL -1.2 -134.6 -5.5 -20.6 -11.1p -3.5e -3.1 126.4 177.4 26.3 15.7 0.3 3.7 -5.5
ES 1.3 -89.9 -2.9 -3.5 -0.7p 3.8 -2.7 154.0 99.8 24.2 -2.1 0.0 0.4 -4.6
FR -0.7 -16.4 -2.7 -5.4 2.5p -1.3 4.4 144.3 96.2 10.3 1.8 0.8 0.6 0.3
HR 2.7 -77.7 0.1 -3.5 -5.0 -2.4 -1.3 115.0 86.7 17.0 2.1 2.9 0.1 0.9
IT 1.5 -23.6 -2.2 -8.9 1.5 -2.6p -1.7 117.0 132.3 12.2 1.7 0.5 1.3 5.0
CY -4.1 -130.3 -6.2 -16.8 -10.5p 2.9bp 4.4 353.7 107.5 15.7 2.8 0.4 3.2 5.1
LV -1.8 -62.5 3.1 10.5 16.0 -2.7 0.7 88.8 36.3 10.9 12.2 1.3 -3.3 -12.2
LT 0.9 -44.7 4.0 15.5 11.6 4.6 2.2 55.0 42.7 10.5 6.7 2.3 -2.7 -10.4
LU 5.3 35.8 -0.5 22.9 0.6 6.1 24.2 343.1 22.1 6.1 15.5 1.5b 0.3 -1.4
HU 3.0 -60.8 -6.9 -8.0 3.9 11.6 -3.1 83.9 74.7 8.2 0.4 4.9 -1.9 -10.9
MT 4.3 48.5 -0.2 -8.8 3.9 2.8p 5.4 139.1 64.0 5.9 1.3 4.5 -0.7 -2.3
NL 9.1 63.9 -0.6 -8.3 0.2p 3.6 -1.6p 228.8p 65.1 7.2 3.2p 0.6 1.1 -0.4
AT 2.1 2.9 1.8 -9.6 6.1 3.5 2.1 126.4 85.5 5.6 0.6 0.4 0.5 1.2
PL -1.3 -62.8 -1.0 9.7 -0.4p 2.8 3.2 79.0 51.1 8.9 2.4 1.6 -1.1 -5.7
PT 0.7 -109.3 -2.8 2.8 0.0e 2.3 -2.3 181.5 129.0 14.4 -1.6 0.0 -0.5 -6.0
RO -1.0 -51.9 2.7 21.1 0.5p 1.7 0.2 59.1 37.9 6.9 4.1 1.3 0.0 -0.9
SI 5.4 -38.7 0.6 -3.6 -0.6 1.5 -5.1 87.3 83.1 9.6 -3.4 1.4 0.4 -4.3
SK 1.1 -61.0 -0.7 6.7 2.2 5.5 8.2 81.4 52.5 13.0 4.5 1.5 -1.8 -7.5
FI -1.0 0.6 2.3 -20.5 3.6 -0.4 9.5 155.7 63.6 8.8 1.5 0.6 0.7 3.4
SE 5.0 4.1 -7.9 -9.3 3.6 12.0 6.5 188.6 43.9 7.8 2.3 1.4 0.0 -3.3
UK -4.8 -14.4 11.3 1.0 1.7 5.7 2.5 157.8 89.1 6.3 -7.8 0.8 -1.1 -6.6
Year
2015
External imbalances and competitiveness Internal imbalances Employment indicators¹
Flags: b: break in time series. e: estimated. p: provisional.
Note: * The level shift is due to relocation to Ireland of balance sheets of large multi-national enterprises and inclusion of corresponding transactions in the Irish BoP and IIP statistics. 1) See page 2 of the AM R 2016. 2) House price index e = source NCB of EL. 3) The level of TFSL in Greece is higher than would
otherwise have been recorded, due to the improved treatment o f banks' ho ldings of short-term debt securities issued by banks.
Source: European Commission, Eurostat and Directorate General for Economic and Financial Affairs (for Real Effective Exchange Rate), and International M onetary Fund

53
Table 2.1: Auxiliary indicators, 2015
Year
2015
Real G
DP
(1 y
ear
% c
hange)
Gro
ss f
ixed
cap
ital
form
ati
on
(%
of G
DP
)
Gro
ss d
om
esti
c
exp
en
dit
ure
on
R&
D (
% o
f
GD
P)
Cu
rren
t p
lus c
ap
ital
acco
un
t (N
et
len
din
g-
bo
rro
win
g)
(% o
f G
DP
)
Net
exte
rnal d
eb
t
(% o
f G
DP
)
Fo
reig
n d
irect
investm
en
t in
th
e
rep
ort
ing
eco
no
my -
flo
ws
Fo
reig
n d
irect
investm
en
t in
th
e
rep
ort
ing
eco
no
my -
sto
cks
Net
trad
e b
ala
nce o
f
en
erg
y p
rod
ucts
(% o
f G
DP
)
Real eff
ecti
ve e
xch
an
ge
rate
- E
uro
Are
a t
rad
ing
part
ners
(3 y
ears
% c
hange)
Exp
ort
perf
orm
an
ce
ag
ain
st
ad
van
ced
eco
no
mie
s
(5 y
ears
% c
hange)
Term
s o
f tr
ad
e
(5 y
ears
% c
hange)
Exp
ort
mark
et
sh
are
in
vo
lum
e
(1 y
ear
% c
hange)
Lab
ou
r p
rod
ucti
vit
y
(1 y
ear
% c
hange)
No
min
al u
nit
lab
ou
r co
st
ind
ex (
2010=100)
(10 y
ears
% c
hange)
Un
it lab
ou
r co
st
perf
orm
an
ce r
ela
tive t
o
EA
(10 y
ears
% c
hange)
Ho
use p
rice in
dex
(2010=100)
- n
om
inal
(3 y
ears
% c
hange)
Resid
en
tial co
nstr
ucti
on
(% o
f G
DP
)
Pri
vate
secto
r d
eb
t,
no
n-c
on
so
lid
ate
d
(% o
f G
DP
)
Fin
an
cia
l secto
r le
vera
ge,
no
n-c
on
so
lid
ate
d
(% d
ebt-
to-e
quity
)
BE 1.5 23.0 na 0.5 -67.7 -4.7 213.6 -2.8 0.2 -9.4 0.1 1.6 0.6 20.5 4.0 2.30p 5.8 218.8 176.5
BG 3.6 21.0 1.0p 3.5 3.4 3.7 88.9 -3.8 -3.9 15.2 3.5 3.0 3.3p 78.4p 51.2 2.00bp 1.4 121.5 494.3
CZ 4.5 26.3 na 3.2 -9.8 1.3 74.2 -2.5 -8.0 2.3 0.7 5.0 3.1 14.1 -2.8 6.60p 3.4 77.0 516.4
DK 1.0 19.0 na 9.0 3.6 0.7 49.8 0.1 -1.3 -6.8 0.7 -2.4 -0.1 26.0 7.4 15.3 4.0 218.9 159.9
DE 1.7 19.9 2.9ep 8.4 -10.2 1.4 41.0 -2.0 0.5 -0.7 2.0 2.5 0.8 15.1 -1.6 11.4 5.9 106.1 368.0
EE 1.4 23.7 1.5p 4.3 -10.3 -2.9 99.9 -1.4 1.6 10.8 2.8 -3.3 -1.4 72.0 42.1 34.5 4.4 130.9 366.1
IE 26.3 21.2 na 9.7* -289.0* 72.3* 495.9* -1.6 -1.3 41.2* 3.6 31.7 23.2 -14.9 -22.7 30.7 1.9 323.6 80.6
EL -0.2p 11.5p 1.0p 1.2 138.1 0.6 14.5 -2.2p -5.2 -18.9 5.8p 0.7p -0.7p -0.2p -12.6 -21.70e 0.7p 126.4 1359.6
ES 3.2p 19.7p na 2.0 93.1 2.1 59.8 -2.1p -1.3 -1.5 -4.7p 2.2p 0.7p 8.9p -6.2 -5.6 4.4p 173.1 468.4
FR 1.3p 21.5p na -0.1 37.3 1.5 43.3 -1.8p -0.4 -3.4 2.1p 3.4p 0.8p 17.9p 1.9 -4.9 5.8p 183.3 356.6
HR 1.6 19.5 0.85 5.6 52.7 0.4 55.0 -3.5 -1.1 -1.5 0.6 7.3 0.1 23.3 -4.1 -8.2 na 140.2 427.0
IT 0.7 16.6 na 1.8 59.7 0.7 25.6 -2.0 -0.5 -7.0 2.1 1.6 0.2 17.6 3.0 -12.20p 4.4 120.1 657.3
CY 1.7p 13.3p na -2.6 133.4 41.0 911.2 -4.2p -2.4 -15.0 -0.8p -2.7 0.9p 5.4p -4.1 -4.60bp 4.3p 354.9 85.0
LV 2.7 22.6 0.6p 2.0 28.6 2.8 60.1 -2.9 -2.0 12.8 0.2 -0.1 1.4 71.7 39.1 9.5 1.8 97.6 625.4
LT 1.8 19.3 1.0p 0.7 26.4 2.3 40.0 -3.5 -1.4 17.9 2.2 -3.1 0.5 35.3 10.0 11.7 2.8 57.5 467.9
LU 3.5 19.0 na 4.1 -2220.9 766.4 8616.9 -3.1 0.3 25.5 0.0 10.1 0.9 29.8 11.1 15.5 3.9 425.1 53.9
HU 3.1 21.7 1.38 7.8 23.0 -2.2 222.1 -4.2 -7.1 -6.0 -0.2 5.0 0.5 24.4 8.8 13.0 1.9 99.1 114.1
MT 6.2 25.4 0.8p 4.9 -262.7 25.8 1867.3 -9.8 1.0 -6.8 0.8 -0.6 2.7 29.8 10.7 6.20p 3.4 204.7 37.1
NL 2.0p 19.4p na 3.6 40.0 13.4 580.5 -1.0p 1.0 -6.4 -0.9p 2.3p 1.0p 15.3p 1.5 -1.9 3.7p 236.3p 129.7p
AT 1.0 22.6 3.1ep 1.4 20.1 1.1 80.9 -2.3 2.3 -7.7 -0.2 0.9 0.3 23.3 5.7 14.2 4.3 145.1 186.7
PL 3.9 20.1 1.01 1.7 35.7 3.0 48.6 -1.6 -1.9 12.1 2.8 5.0 2.5p 17.0p 2.5 -2.0 3.1 83.4 305.9
PT 1.6e 15.3e na 1.7 100.8 0.3 71.7 -2.3e -1.0 5.0 4.8e 3.4e 0.2e 0.6e -12.4 5.4 2.5e 195.9 372.0
RO 3.7p 24.7p na 1.2 24.5 2.4 42.6 -0.9p 2.4 23.7 6.1p 2.8p 4.6p 43.9p 23.6 0.5 na 61.2 391.5
SI 2.3 19.5 na 6.1 31.2 3.9 34.5 -2.9 -0.7 -1.5 0.7 2.9 1.2 19.9 1.1 -10.8 2.3 96.0 402.6
SK 3.8 23.0 1.18 3.8 27.3 1.3 60.5 -3.5 -1.2 8.9 -3.2 4.3 1.8 16.1 -1.2 7.8 2.3 83.7 831.7
FI 0.2 20.4 2.9p -0.3 43.9 7.3 58.0 -1.5 1.1 -18.8 2.7 -2.9 0.6 28.1 8.8 0.8 5.5 182.8 299.4
SE 4.1 23.7 na 5.0 46.3 3.4 78.0 -0.9 -7.8 -7.4 0.6 2.9 2.6 25.1 6.8 30.5 4.5 234.9 184.5
UK 2.2 16.9 na -5.4 na 1.8 74.3 -0.6 14.0 3.1 3.5 1.8 0.5 21.9 3.6 17.4 3.7 161.1 628.3
Flags: b: break in time series. e: estimated. p: provisional. na: not available.
Note: * The level shift is due to relocation to Ireland of balance sheets of large multi-national enterprises and inclusion of corresponding transactions in the Irish BoP and IIP statistics. 1) House price index e = source NCB for EL. 2) Official transmission deadline for 2015 data on Gross domestic
expenditure on R&D is 31 October 2016; data as transmitted to Eurostat by the 24 October 2016 were used for this document.
Source: Eurostat, Directorate General for Economic and Financial Affairs (for Real Effective Exchange Rate) and International M onetary Fund data, WEO (for world exports series)

54
Table 2.1 (continued): Auxiliary indicators, 2015
%3 years
change in p.p%
3 years
change in p.p%
3 years
change in p.p%
3 years
change in p.p%
3 years
change in p.p
BE 0.9 67.6 4.4 22.1 12.2 -0.1 21.1 -0.5 14.9 -0.4 5.8p -0.5p 14.9 1.0
BG 0.4p 69.3 5.6 21.6 19.3 -2.2 41.3 -8.0 22.0 0.8 34.2 -9.9 11.6 -0.9
CZ 1.4 74.0 2.4 12.6 7.5 -1.4 14.0 -1.4 9.7 0.1 5.6 -1.0 6.8 0.0
DK 1.1 78.5 1.7 10.8 6.2 -0.4 17.7 0.2 12.2 0.2 3.7 1.0 11.6 1.4
DE 0.9 77.6 2.0 7.2 6.2 -0.9 20.0 0.4 16.7 0.6 4.4 -0.5 9.8 -0.1
EE 2.9 76.7 2.4 13.1 10.8 -1.4 24.2 0.8 21.6 4.1 4.5 -4.9 6.6 -2.5
IE 2.5 70.0 5.3 20.9 14.3 -4.4 na na na na na na na na
EL 0.5p 67.8 18.2 49.8 17.2 -3.0 35.7 1.1 21.4 -1.7 22.2p 2.7p 16.8 2.6
ES 2.5p 74.3 11.4 48.3 15.6 -3.0 28.6 1.4 22.1 1.3 6.4p 0.6p 15.4 1.1
FR 0.5p 71.5 4.3 24.7 12.0 -0.5 17.7 -1.4 13.6 -0.5 4.5 -0.8 8.6 0.2
HR 1.5 66.8 10.3 43.0 18.5 1.9 29.1 -3.5 20.0 -0.4 13.7 -2.2 14.4 -2.3
IT 0.6 64.0 6.9 40.3 21.4 0.4 28.7 -1.2 19.9 0.4 11.5 -3.0 11.7 1.1
CY 0.8p 73.9 6.8 32.8 15.3 -0.7 28.9 1.8 16.2 1.5 15.4 0.4 10.9 4.4
LV 1.3 75.7 4.5 16.3 10.5 -4.4 30.9 -5.3 22.5 3.3 16.4 -9.2 7.8 -3.9
LT 1.3 74.1 3.9 16.3 9.2 -2.0 29.3 -3.2 22.2 3.6 13.9 -5.9 9.2 -2.2
LU 2.6 70.9b 1.9 16.6 6.2b 0.3b 18.5 0.1 15.3 0.2 2.0 0.7 5.7 -0.4
HU 2.6 68.6 3.1 17.3 11.6b -3.2b 28.2 -5.3 14.9 0.6 19.4 -6.9 9.4 -4.1
MT 3.4 67.6 2.4 11.8 10.4 -0.2 22.4 -0.7 16.3 1.2 8.1 -1.1 9.2 0.2
NL 0.9p 79.6 3.0 11.3 4.7 -0.2 16.8p 1.8p 12.1p 2.0p 2.5p 0.2p 10.2 1.3
AT 0.6 75.5 1.7 10.6 7.5 0.7 18.3 -0.2 13.9 -0.5 3.6 -0.4 8.2 0.5
PL 1.4p 68.1 3.0 20.8 11.0 -0.8 23.4 -3.3 17.6 0.5 8.1 -5.4 6.9 0.0
PT 1.4e 73.4 7.2 32.0 11.3 -2.6 26.6 1.3 19.5 1.6 9.6p 1.0p 10.9 0.8
RO -0.9p 66.1 3.0 21.7 18.1 1.3 37.3 -5.9 25.4 2.5 22.7 -8.4 7.9 0.0
SI 1.1 71.8 4.7 16.3 9.5 0.2 19.2 -0.4 14.3 0.8 5.8 -0.8 7.4 -0.1
SK 2.0 70.9 7.6 26.5 13.7 -0.1 18.4 -2.1 12.3 -0.9 9.0 -1.5 7.1 -0.1
FI -0.4 75.8 2.3 22.4 10.6 2.0 16.8 -0.4 12.4 -0.8 2.2p -0.7p 10.8 1.5
SE 1.5 81.7 1.5 20.4 6.7 -1.1 16.0 0.4 14.5 0.4 0.7 -0.6 5.8 0.1
UK 1.8 76.9 1.6 14.6 11.1 -2.8 23.5 -0.6 16.7 0.7 6.1 -1.7 11.9 -1.1
Flags: b: break in time series. e: estimated. p: provisional. na: not available.
Note: 1) IE: Official transmission deadline for 2015 data on People at risk of poverty or social exclusion is 30 November 2016, while data were extracted on 24 October 2016.
Source: European Commission, Eurostat
Year
2015
Employment
rate
(1 year %
change)
Activity rate - %
of total
population
aged 15-64
(%)
Long-term
unemployment
rate - % of
active
population
aged 15-74
(%)
Youth
unemployment
rate - % of
active
population
aged 15-24
(%)
Young people neither in
employment nor in
education and training -
% of total population
aged 15-24
People at risk of poverty
or social exclusion -
% of total population
People at risk of poverty
after social transfers -
% of total population
Severely materially
deprived people -
% of total population
People living in
households with very
low work intensity -
% of total population
aged 0-59

55
Evolution of the total number of flashes per Member State, AMRs from 2012 until 2016, all EU countries except for Greece
Source: DG ECFIN (based on EUROSTAT data).
The indicators are lagged 2 years, hence the AMR at year t uses scoreboard data up to year t-2.
The number of flashes is calculated based on the latest available data (July 2015).
0
1
2
3
4
5
6
7
8
Nu
mb
er
of
fla
she
s
2012 2013 2014 2015 2016
Evolution of number of Scoreboard "flashes" not showing a clear general trend

56
Evolution of flashes per scoreboard indicator, AMRs from 2012 until 2016, all EU countries except Greece
Source: DG ECFIN (based on EUROSTAT data).
The indicators are one year lagged, hence the AMR at year t uses scoreboard data from t-1.
The number of flashes is calculated based on the latest available data (July 2015).
0
5
10
15
20Cu
rren
t Acc
ount
NIIP
REER
Expo
rt m
arke
tsh
ares
ULC
Hou
se p
rices
Priv
ate
cred
it
Priv
ate
debt
Publ
ic D
ebt
Une
mpl
oym
ent R
ate
Fina
ncia
l Ser
vice
Liab
ilitie
s
Num
ber o
f fla
shes
2012 2013 2014 2015 2016
SB flashes linked to stock imbalances remain persistent

57
0
1
2
3
4
5
6
7
8
Num
ber o
f fla
shes
for e
ach
coun
try
No imbalances Imbalances Excessive Imbalances
Number of flashes for each country, by MIP imbalance category, 2012-2016

Results of the AMR 2017
• The 13 countries for which imbalances were identified in 2016 (FR, HR, BG, CY, IT, PT, SI, IE, ES, DE, NL, FI, SE)
• Six countries have been identified with excessive imbalances, and seven countries have been identified with imbalances.
• Programme countries are not under MIP surveillance.
• As was previously the case for Member States expected to exit their financial assistance programme, the situation of Greece will be assessed in the context of the MIP only after the on-going financial assistance programme.

b. In-depth reviews

IDRs in general
• Broad assessment of imbalances complemented with focused
analysis (building on AMR)
• Common framework but assessments are by nature country
specific drawing on common and national sources as well as on
relevant empirical evidence.
• Fact finding missions to Member States (ECFIN, other services,
ECB (EA), ESO)
• Use of widely available and transparent data, analytical tools and
descriptive statistics
• Methodological work progress in tandem (LIME, surplus study,
deleveraging report)

Broad structure of IDRs
• Executive summary and conclusions
• Macroeconomic developments
• Analysis of the nature and causes of imbalances
• Focused sections on key issues
• Policy challenges

62
Spillovers
• Trade linkages
• Financial linkages
EIP
Adjustment capacity
• Price and wage flexibility
• Labour market flexibility
• Financial market intermediation
• Balance sheet adjustment
Policy options and
implementation
• Wage bargaining system
• Financial market regulation
• Fiscal policy
• Growth and structural reforms
Sustainability of macro-trends
• Early warning
• Deviation from equilibrium (competitiveness, credit growth, housing prices)
• Other factors (GDP growth, demography, catching-up,
global imbalances, saving and investment imbalances,
housing and other asset markets, shocks)
• Policy determinants (fiscal policy, financial regulation, labour market institutions)
Identification
of
problematic
imbalances
Policy
Response

63
What is an imbalance? (no numerical benchmark)
• Nature of MIP
• Medium term horizon
• Pre-emptive
• Approach
• Snapshot
• Dynamics
• Reform implementation
• Objective
• Risk assessment and impact

Challenges vary significantly across
Member States
Large stocks of net liabilities concerning a wide range of sectors, both external and internal:
PT, ES, CY, EL, IE, SI, HU, HR, BG
Large and persistent current account surpluses:
DE, NL
Combination of high public debt and declining trend in potential growth or competitiveness:
IT, FR, BE
Vulnerabilities confined to a particular sector:
NL, SE, UK, AT, EE, FI
Large negative NIIP:
RO

65
Analytical tools
• External positions (CACA, CA benchmarks, NIIP stabilising CA)
• Trade performance and competitiveness (allocative
efficiency, access to finance, productivity and export performance)
• Wages and productivity (wage benchmarks)
• Deleveraging pressures
• House price cycle assessment (equilibrium, overvaluations)
• QUEST simulations (impact structural reforms)

66 0% 10% 20% 30% 40% 50% 60%
labour markets
other
financial sector
housing market
external sustainability
public indebtedness
private indebtedness
external competittiveness
average (2012-2014)
% of countries with identified imbalance in the MIP
Source: Commission services; other includes: imbalances stemming from weak domestic demand, weak corporate governance and high level of state involvement in the economy
The MIP identifies competitiveness and indebtedness as the most prevalent imbalances
66

67
Number of CSRs in 2013 and 2014, by policy area
Source: Commission services
CSRs addresses the major reform priorities
Macro imbalances & structural reforms
67
0 5 10 15 20 25 30
Fiscal Consolidation
Long-term sustainability
Taxation
Banking
Housing
Access to finance
ALMP & participation
Wage setting
Education
Social polices
Health care
Childcare
Innov. & competitiveness
Competition
Energy, networks
Public administration
Pu
blic
fin
ance
Fin
anci
al s
ecto
r
Lab
ou
rm
arke
tre
form
sH
um
an c
apit
al a
nd
soci
al p
olic
ies
Pro
du
ct m
arke
tre
form
s.
2013
2014

68
Average number of CSRs per policy area (average 2013,2014 and 2015)
Source: Commission services
In general, countries under MIP surveillance received a higher number of CSRs
Macro imbalances & structural reforms
68
0
0.2
0.4
0.6
0.8
1
1.2
Public finances andtaxation
Financial sector Labour market Social inclusion andeducation
Structural policies Publicadministration and
businessenvironment
MIP countries Non-MIP countries

69
CSR progress indicator for MIP versus non-MIP countries (aritmetic average)
Source: Commission services
And evidence indicates that compliance with CSRs was stronger in MIP countries
Macro imbalances & structural reforms
69
33
34
35
36
37
38
39
40
41
2014 2015
MIP average
Non-MIP average

Specific monitoring
• The corrective arm was not initiated either in 2013 or 2014 despite finding of excessive imbalance
• This is formally in line with legislation ("may")
• EA CSR asks for "specific monitoring" of implementation of reform commitments for countries with excessive imbalances and EA countries with imbalances requiring decisive action.
• Was done for ES and SI (first time) and HR, IT, SI and FR, IE, ES
• COM can at any moment initiate corrective arm

71
5. Imbalances: where do we stand (AMR 2017) ?

72
Macroeconomic context
• Continuing but fragile recovery
• Subdued growth, feeble domestic demand dynamics
• Historically low inflation
• Improving labour market conditions, but social distress
persists
• Tail winds are fading …
• … while uncertainties remain high: (1) geopolitical tensions; (2)
impact of normalisation of US monetary policy; (3) risks to the policy
environment amid rising populism and growing protectionist
sentiment around the world

73
Number of scoreboard flashes, 2013-2015
The same risks and challenges as in the previous year are broadly
confirmed

74
Asymmetric adjustment of CA balances persists
• Adjustment in net debtor countries has broadly run its course
• Some net creditor countries continue to run large, and in some
cases rising, current account surplus
Change in current account balances, net debtor countries
Change in current account balances, net creditor countries

75
EA rebalancing progress still needed, in a low-
inflation environment
• EA current account surplus expected to reach 3.7% of GDP in 2016
• Large surplus underpins the low growth and low inflation
• This hampers the correction of internal imbalances
Euro area current account balance Euro area GDP, aggregate demand and trade balance and core inflation

76
Stock vulnerabilities persist in debtor countries
• Net external liabilities are trending down, but progress is slow
• Vulnerabilities remain in a number of countries
NIIP and net external debt, 2015 Cyclically-adjusted and NIIP-stabilising, NIIP-converging CA balances, 2015

77
Private sector deleveraging is ongoing, but is
slow and uneven
• Deleveraging is hampered by low nominal growth
• Over-indebtedness among HH and NFCs still prevails in many MS
Drivers of HH deleveraging (2016Q1) Drivers of NFCs deleveraging (2016Q1)

78
Public and private indebtedness does not always
decline where leverage is highest Government debt: change from peak vs. 2015 level Private debt: change from peak vs. 2015 level

79
Capital ratios improve, but challenges remain in
the banking sector
• Low profitability
• In some cases, legacy of bad debts
Banks' return on equity Non-performing loans
(% of total loans and advances)

80
Housing market pressures are evident in some
Member States House prices valuation levels and variations (2015)

81
Labour market conditions continue to improve
• Unemployment rates continue to fall across the board
• Social distress persists
Evolution of the unemployment rate (20-64 years old), 2014Q1 vs. 2016Q2

82
Overall findings (1)
• External adjustment remains asymmetric, stock vulnerabilities
remain significant
• Rebalancing within euro area deserves careful consideration:
(1) large and rising CA surplus as symptom of slack in aggregate
demand, with impact on growth and inflation across the EA; (2) net
debtor countries will need to sustain CA surpluses for some time; (3)
net creditor countries have room to strengthen demand dynamics
• Private and public debt deleveraging continues but is slow and
uneven, hampered by low nominal growth: deleveraging also not
always most significant where most needed
• Banking sector faces challenges linked to low profitability and
in some cases legacy of bad debts
• House price dynamics warrant careful monitoring in some MS

83
Overall findings (2)
• MS affected by multiple and interconnected stock and/or flow
vulnerabilities: CY, HR, PT and BG, IE, SI, ES
• MS with vulnerabilities driven by large stocks of general
government debt and concerns about potential output growth:
IT and BE, FR
• MS with large and persistent current account surpluses: DK,
DE, NL, SE
• MS where developments in price or cost variabless show
potential signs of overheating: DK, LU, UK, SE and BG, EE, LV,
LT
• MS with potential vulnerabilities in specific sectors: NL and FI

84
Procedural conclusions
• IDRs are warranted for 13 countries, six fewer than last year:
BG, HR, CY, FI, FR, DE, IE, IT, NL, PT, SI, ES, SE
• All are countries identified with imbalances or excessive
imbalances in the previous cycle
• No countries will be newly subject an IDR
• The surveillance of imbalances in EL continues in the context
in the programme of financial assistance

85
6. Conclusion and next steps

Next steps
• The AMR conclusions to be discussed in the Council and Eurogroup;
• IDRs planned to be published in February, ahead of CSR package as last cycle;
• IDRs embedded in country reports
• After IDR, for some countries imbalances may not any longer be identified
• Specific monitoring is now in place for all Member States with
some level of imbalance

Opportunities
• Earlier detection of imbalances
• Ability to communicate and have impact on domestic policy debates
• Evolving over time to capture macroeconomic priorities: adjustment of flows but outstanding stocks
• Shifting emphasis to reflect topical policy issues: e.g. current account surpluses or social implications of adjustment
• Improved analytical tools
Challenges
• Given the nature of imbalances, less rules-based, more judgement
• Corrective arm not used yet
• Exploit the existing framework (repeated game with potential stigma effects) to ensure its effectiveness
• IDRs for all Member States or more selective?
• Is the framework capturing the main challenges and is it adapting in an adequate manner?
The MIP is now well-established but the full set of instruments has not yet been used
87

88
Useful links • The Macroeconomic Imbalance Procedure Rationale, Process,
Application: A Compendium (November 2016)
http://ec.europa.eu/economy_finance/publications/eeip/pdf/ip039_en.pdf
• Alert Mechanism Report 2017 (November 2016)
https://ec.europa.eu/info/publications/2017-european-semester-alert-mechanism-
report_en
• In-Depths Reviews
http://ec.europa.eu/economy_finance/economic_governance/macroeconomic_imb
alance_procedure/in-depth_reviews/index_en.htm
• Economic Governance
http://ec.europa.eu/economy_finance/economic_governance/index_en.htm
• Banking Union/SSM
http://europa.eu/rapid/pressReleasesAction.do?reference=IP/12/953&format=HTML
&aged=0&language=EN&guiLanguage=en
• Autumn 2016 Economic Forecast
http://ec.europa.eu/economy_finance/eu/forecasts/2016_autumn_forecast_en.htm

89
Thank you for your attention