the eradication of rinderpest – was it (really) worth it?
TRANSCRIPT

Slide 1
The Eradication of Rinderpest – Was It (Really) Worth It?
Joachim Otte, Food & Agriculture Organization (FAO) Karl Rich, Norwegian Institute of International Affairs (NUPI) David Roland-Holst, University of California, Berkeley (UCB)
and Felix Njeumi, Peter Roeder, Bill Taylor, Cheikh Ly, Ahmed El-Idrissi, Jan
Slingenbergh, Leo Loth, Vishnu Songkitti, Laura Rinnovati, et al.
FAO Seminar, Rome, 13 May 2011

Slide 2
Outline
• History of rinderpest (RP) and its control / eradication
• Post WWII ‘cost’ of RP eradication
• Direct impact of ‘endemic’ RP (mortality and morbidity)
• Estimated benefits of RP control and cost-benefit ratios
• CBA of RP eradication: Chad case study (ver 1.0)
• Conclusions, next steps, afterthoughts, and discussion

Slide 3
Caveat
“Cost-benefit analyses of eradication programmes involve biases that tend to underestimate the costs and overestimate the benefits”
Judith Myers et al., 1998

Slide 4
Presumptive Origin of the Rinderpest Virus

Slide 5
RP History, 18th & 19th Century
• 1711: RP spread through Western Europe • 1714: Giovanni Lancisi (personal physician of
pope Clement XI) recommends: slaughter and deep burial of infected and exposed animals accompanied by movement control to be enforced by drastic ‘penalties for offenders’ (death!).
• Thomas Bates, Surgeon of His Majesty’s Household in London, introduced the Lancisi measures to England with ‘compensation of cattle owners’.

Slide 6
RP History, 18th & 19th Century
• 1762: The world's first vet school opened in Lyons to teach Lancisi’s principles of rinderpest control.
• 1857 – 1866: RP again spread through Europe. • 1868: Indian Cattle Plague Commission
appointed by GoI. • 1880s: Veterinary schools and government vet
departments were established in Europe. • 1887 – 1893: RP spread through sub-Saharan
Africa, introduced through port of Massaua

Slide 7
RP History, 20th Century
• E. Semmer discovered the protective powers of serum from recovered animals. This led to the development of serum-virus methods of immunization which became a standard prophylactic procedure until the 1930s.
• 1920s: J.T. Edwards attenuated rinderpest virus by growing it serially (600 passages) in goats (GTRV – Goat tissue rinderpest vaccine). The attenuated virus immunized for life.
• 1924: OIE was created as an inter-governmental effort to combat rinderpest (RP introduction into Belgium).

Slide 8
RP History, 20th Century
• 1950: The Inter-African Bureau of Epizootic Diseases was founded with a directorial plan to eliminate rinderpest from Africa.
• 1950s: It became easy to grow specific cells in tissue culture and propagate viruses therein.
• 1957: W. Plowright and R. Ferris grew rinderpest virus in cultures of calf kidney cells. • The virus was stable, attenuated, and non-infectious by
the 90th serial passage. • The vaccine was cheap to produce and easy to assay
for potency and safety. It quickly became the vaccine of choice.

Slide 9
RP History, 20th Century
• Early 1950s: China embarks on national rinderpest eradication programme (±50 million bovines)
• 1954: India launched the national rinderpest eradication programme (±200 million bovines).
• From 1960s: Regional eradication efforts based on ‘institutionalized mass vaccination’ and international funding (JP15, PARC, WAREC, etc.)
• 1990s: Targeted approaches to eliminate residual ‘pockets of infection’ (CAHWs etc).

Slide 10
Evolution of RP Control • 18th & 19th century: Stamping out and
movement control. • Early 20th century (until 1930): Movement
control and application of serum to bovines to limit spread of outbreaks.
• 1930s to late 1950s: In response to outbreaks, movement control and reactive vaccination, and protective vaccination along borders (buffers) and in high risk areas.
• 1950s / early 1960s: Eradication programmes based on mass vaccination.

Slide 11
Infected countries
Free countries
Rinderpest Occurrence 1800
RP Introductions 1840: Egypt 1887: Horn of Africa
EUROPE AND RUSSIA
CENTRAL ASIA, CHINA, KOREA, JAPAN
SOUTH ASIA

Slide 12
Infected countries
Free countries
Rinderpest Occurrence 1900
RP Introductions 1920: Belgium 1920: Brazil 1923: Australia
EUROPE AND RUSSIA
CENTRAL ASIA, CHINA, KOREA, JAPAN
SOUTH ASIA

Slide 13
Infected countries
Free countries
Rinderpest Occurrence 1950
RP Introductions 1952: Nepal 1954: Italy 1951: Thailand 1955: Philippines 1956: Thailand 1959: Malaya

Slide 14
Infected countries
Free countries
Rinderpest Occurrence 1960
140 (?) million vaccinations later......
RP Introductions 1962: Bahrain 1963: Nepal 1965: Saudi Arabia 1965: Yemen (PDR) 1966: Libya 1968: Bhutan 1969: Iran 1969: Bahrain 1969: Yemen (PDR)

Slide 15
Infected countries
Free countries
Rinderpest Occurrence 1970
400 million vaccinations later......
RP Introductions 1971: Syria 1971: Jordan 1972: Angola 1973: Ghana 1974: Benin 1976: Yemen (AR) 1977: Lebanon 1977: UAE 1978: Senegal 1979: Saudi Arabia 1979: Oman 1979: Uganda 1979: UAE

Slide 16
Infected countries
Free countries
Rinderpest Occurrence 1980
700 million vaccinations later......
RP Introductions 1981: Tanzania 1981: Iran 1982: Egypt 1982: Turkey 1982: Syria 1982: Israel 1982: Oman 1983: Saudi Arabia 1984: UAE 1985: Bahrain 1985: Iraq 1986: Nepal 1987: Sri Lanka 1987: Iran 1988: Bahrain 1989: Georgia

Slide 17
Infected countries
Free countries
Rinderpest Occurrence 1990
1,000 million vaccinations later......
RP Introductions 1991: Turkey (east) 1991: Russia (Tuva) 1991: Mongolia 1994: Iran 1994: Turkey (east) 1996: Turkey (east) 1998: Russia (Amur)

Slide 18
Infected countries
Free countries
Rinderpest Occurrence 2000
900 million vaccinations later......

Slide 19
0
100
200
300
400
500
600
700
800
W&C Africa E&N Africa N East S Asia E&SE Asia
Vac
cin
aton
s (m
illio
ns)
1950s
1960s
1970s
1980s
1990s
Vaccinations by Region & Decade
0.42 bln 0.42 bln
2.15 bln
0.05 bln 0.10 bln
Total: 3.15 billion vaccinations

Slide 20
Vaccination Cost / Head Country Period Animals vaccinated Cost in 2000US$
Nigeria 63 – 65 21,099,000 0.44 Niger 62 – 67 12,201,000 1.20 Mali 64 – 69 10,932,000 0.83 Chad 62 – 69 10,366,000 1.31 Senegal 67 – 69 6,413,000 0.70 Cameroon 62 – 67 2,076,000 1.31 Ivory Coast 64 – 69 793,000 2.63 JP15 I-III 62 – 69 79,768,000 1.26 Ethiopia 90 – 96 50,015,000 0.48 Mali 89 – 96 14,479,000 0.70 Tanzania 93 – 97 10,749,000 0.51 Senegal 90 – 97 10,336,000 0.81 Uganda 92 – 97 8,981,000 0.87 Ivory Coast 90 – 97 3,689,000 3.02 PARC 86 - 99 122,517,000 0.79 Senegal 1996 547,735 0.24 Mauritania 96 – 98 ??? 0.42

Slide 21
App. Total Cost of Eradication
• Vaccination 1950s: US$2.50 • Vaccination 1960s: US$1.25 • Vaccination 1970s: US$1.10 • Vaccination 1980s: US$0.95 • Vaccination 1990s: US$0.80 • Coordination: 5% (JP15 3%) • Verification SSA: PACE &
SERECU (EUR81 million) • Verification ROW: ??? • Miscellaneous (research,
quarantines, movement control, etc): ??? 0.0
0.5
1.0
1.5
2.0
2.5
3.0
3.5
4.0
VerificationSSACoordination
Vacc. 90s
Vacc. 80s
Vacc. 70s
Vacc. 60s
Vacc. 50s
Billion US$(2000)
Total cost of eradication since 1950s very likely to be less than US$ 5 billion !!
???

Slide 22
China, RP Deaths (Bovines)
CFR: 89% !!!
Yellow cattle
0
10,000
20,000
30,000
40,000
50,000
60,000
1949
1950
1951
1952
1953
1954
1955
1956
1957
1958
1959
5-6 years mass vaccination
0.95 deaths/ 1,000/year
0.008 deaths/ 1,000/year
Slide 23
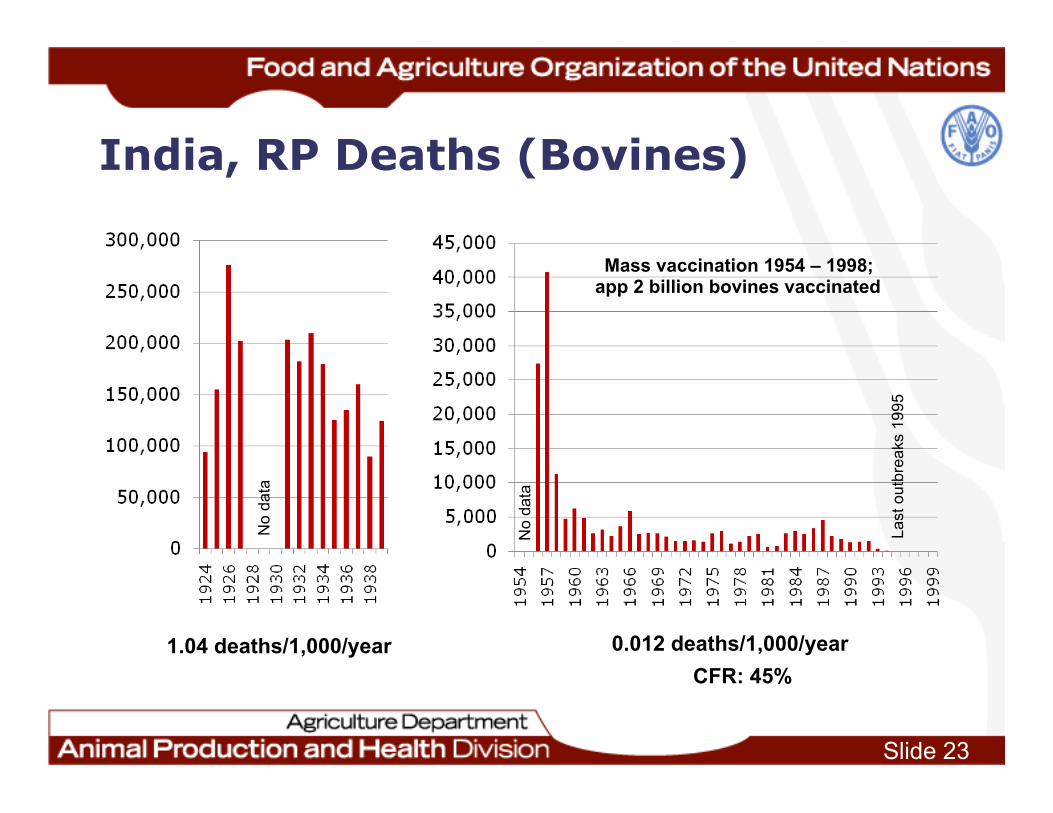
India, RP Deaths (Bovines)
No
data
1.04 deaths/1,000/year
No
data
Last
out
brea
ks 1
995
Mass vaccination 1954 – 1998; app 2 billion bovines vaccinated
0.012 deaths/1,000/year CFR: 45%
Slide 24
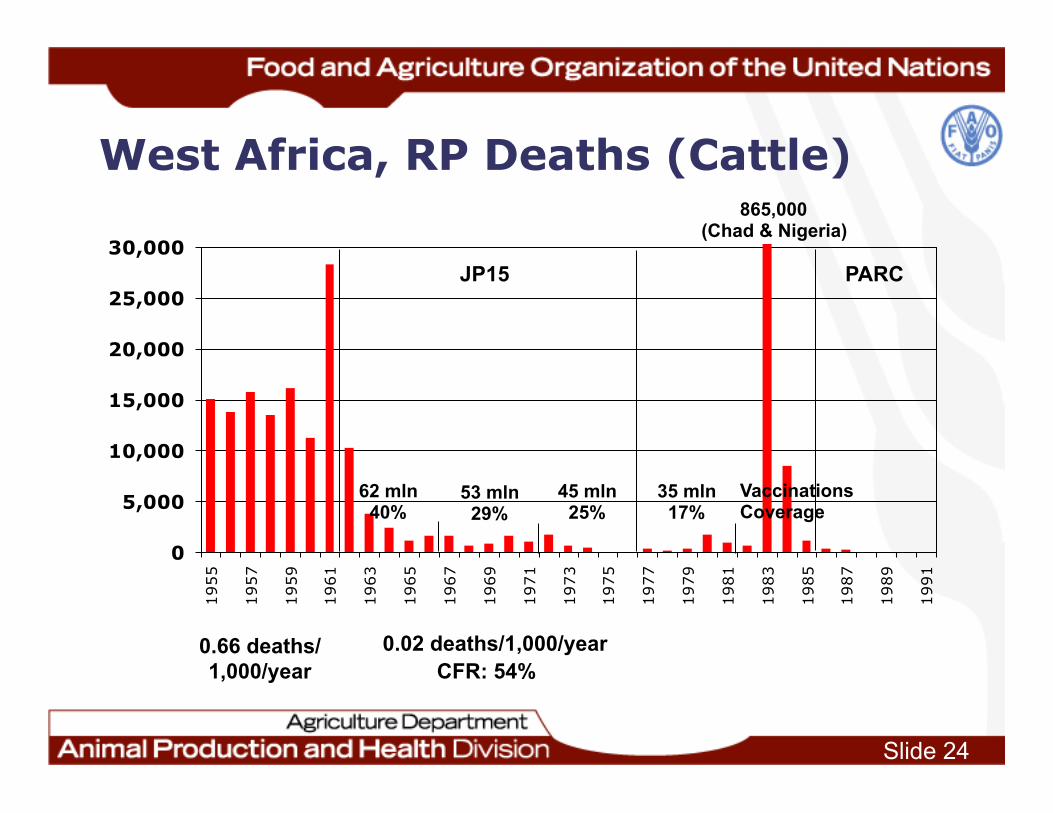
West Africa, RP Deaths (Cattle)
0
5,000
10,000
15,000
20,000
25,000
30,000
1955
1957
1959
1961
1963
1965
1967
1969
1971
1973
1975
1977
1979
1981
1983
1985
1987
1989
1991
JP15 PARC
865,000 (Chad & Nigeria)
0.66 deaths/ 1,000/year
0.02 deaths/1,000/year CFR: 54%
62 mln 40%
53 mln 29%
45 mln 25%
35 mln 17%
Vaccinations Coverage

Slide 25
Interim Conclusions
• Global eradication could have been ‘cheaper’ still had the ‘Chinese model’ been followed.
• But, conventional control (pre-mass vaccination) kept rinderpest at bay (1 RP death/1,000/year).
• Routine vaccination at 25-30% coverage further reduced annual RP-specific mortality to 1 to 2 animals 100,000.

Slide 26
Costs vs. Benefits, Current State of Knowledge • What we know (surprisingly, not a lot …):
• Estimates of global impact are BIG: • Normile (2008) from FAO: US$610 million to date in
control costs versus annual benefits of US$1 billion per year for Africa alone
• Catley (2005), also from FAO: during 1965-1998 estimated benefits at US$289 billion for India, US$47 billion for Africa
• Global BCR would thus be at least 67 (336:5)
• But, these “global” estimates of benefits are not supported by any systematic economic analysis (best guesses?)

Slide 27
Costs vs. Benefits, Current State of knowledge • At country or case study level, existing economic estimates
based on more rigorous economic analyses • BCA, welfare analysis, social accounting matrices (and
combinations)
• Benefit-cost ratios from such studies are usually also high but very variable: • 1.06-3.84 for PACE (Tambi et al. 1999) • 2.48 for JP15 in Nigeria (Felton and Ellis 1978) • 34 for Southern Sudan (Blakeway 1995) • 138 for JP15 and 32 for PARC in Ethiopia; 171 for JP15 and
66 for PACE in Kenya (Omiti and Iringu 2010)

Slide 28
Costs vs. Benefits, Current State of Knowledge • Approach:
• Benefits: mainly changes related to mortality and avoided losses (animals and related sectors).
• Costs associated with and without programs
• But … • No/limited price effects (maybe an OK assumption?) • Limited quantification of downstream impacts (trade, macro
impacts) – more problematic. • No changes in behaviour (producer behaviour, herd dynamics) • Unintended consequences (feedbacks with carrying capacity of
resource base, e.g. stunting reduces meat protein yield of forage)?
• No ‘international’ consequences considered

Slide 29
FMDOvert disease Disease risk
Livestock production- production losses (mortality, weight, milk loss, lameness)
- Treatment, containment costs- other profit losses (idled capacity, timing of sales, price effects)
Other income activities- crop production (manure, draught)- fuel, transport
Natural resources- land use- settlement & migration- ecosystem sustainability
Risk management- preventive control (surveillance,
fencing, zonation, movement controls)
- maintain DVS capacity
Nationaland
Sectoral
Farm householdreal income levels
Household welfare
Farm-level
Household realincome levels
-wage earnings-meat expenditures
Risk management- own control measures
(vaccination)- compulsory control measures
(movement controls)- traceability
Macro-economy- Other sectors (inputs,
trannsport), multiplier effects- foreign exchange- growth- consumer meat prices
Livestock trade- production losses- profit losses (idled capacity, timing of sales)
Market AccessTo export markets
To local markets
Livelihoods-loss of insurance, financial,social networking functions
-increased vulnerability
Containment -slaughter & compensation- movement controls
Animal welfare
Tourism
Environmental concerns
TAD Impact Pathways of TADs
based on Perry and Randolph, 2003

Slide 30
Cattle sector impacts (2)
National economy impacts (4)
Livestock / ag. sector impacts (3)
Farm / household impacts (1)
Valu
e ch
ain
impa
cts
(4)
Glo
bal e
xter
nalit
ies
(6)
Nat
iona
l ext
erna
litie
s (5
) Impact Pathways of TADs

Slide 31
TAD Impact Assessments
• Focus of most TAD impact studies (including rinderpest) has been on level 1 (sometimes levels 2 and 3).
• What’s missing is behaviour – how does the system (individuals & institutions) adjust to an intervention? • Herd demographics: different dynamic patterns of herd growth • Marketing dynamics: adjustments in herds themselves in
response to lower risk • These will influence with vs. without comparisons of disease
ex-post
• Off-farm / ‘macro’ impacts also potentially significant, as are externality impacts within and across borders

Slide 32
Chad Case Study, Approach
• Sequential strategy of measuring impacts at different levels
• Step 1: define counterfactual scenario based on biological impacts (with vs. without) and associated costs
• Step 2: calculate sector-level benefits with vs. without at different stages of the livestock sector, incorporating behaviour aspects (levels 1-3) • “Simple” accounting framework • Utilization of population model (DynMod) to capture herd
dynamics

Slide 33
Chad Case Study, Approach
• Step 3: Compute additional costs associated with rinderpest control to benefits as calculated in step 2 • Derivation of sector-level benefit-cost ratio
• Step 4: Compute multipliers from available SAMs (level 4) • Growth linkages and value chain effects • Short-run impacts of control (without adjustments) • Decomposition of multipliers to assess livelihood effects
• Step 5: Long-term dynamic impacts via CGE analysis based on counterfactual scenarios (levels 4 & 6)

Slide 34
Chad Case Study, Method
• Counterfactual scenario: in absence of campaigns like JP15, etc., disease is controlled mainly by movement controls and targeted interventions when disease discovered. • i.e., similar to situation in 1950s
• So, added costs would simply be those incurred during control campaigns
• What about ‘added’ benefits?

Slide 35
Chad Case Study, Method
• At a sector-level, first need to tease out the additional benefits from lower mortality based on rinderpest campaigns.
• Use of DynMod (Lesnoff et al. 2007; 2008) to project cattle population figures with and without rinderpest control

Slide 36
Chad Case Study, Method
• “Without control” case applies average mortality rates per outbreak from observed data (1963-1970) to observed number of outbreaks in data available pre-JP15 (1958-1961) • Additional 0.33% mortality due to rinderpest (e.g. mortality of
young females 11.53% instead of 11.2%)
• For 1984 drought, shocks decomposed into mortality and rinderpest shock • Assumed rinderpest accounted for 35% of deaths in 1984 • These deaths assumed not to occur in “without” case (low-
level endemicity of disease)

Slide 37
-
1 000 000
2 000 000
3 000 000
4 000 000
5 000 000
6 000 000
7 000 00019
63
1965
1967
1969
1971
1973
1975
1977
1979
1981
1983
1985
1987
1989
1991
1993
1995
1997
1999
2001
2003
2005
2007
Year
Num
ber o
f ani
mal
s
With rinderpest control Without rinderpest control
Chad Case Study, Results
4.7 mio
4.5 mio
3.5 mio
3.7 mio

Slide 38
Chad Case Study, Method
• Population projections then decomposed at sector level to value benefits with vs. without: • Animals • Meat • Milk
• Assumptions and caveats: • No price effects assumed • All figures converted to real CFA (2000) using WDI GDP
deflator • Simple accounting framework given limited data

Slide 39
Chad Case Study, Results
-30
-20
-10
0
10
20
30
40
50
19
63
19
65
19
67
19
69
19
71
19
73
19
75
19
77
19
79
19
81
19
83
19
85
19
87
19
89
19
91
19
93
19
95
19
97
19
99
20
01
CFA
Billion
(2
00
0 p
rices)
Added benefits from RP control Added costs from RP control

Slide 40
• Cattle sector-level benefit-cost ratio over 1963-2002 estimated at 16.45 • Much higher than Tambi et al. (1999) estimates,
reflecting longer time horizon • Lower than some Omiti & Irungu (2010) estimates.
• First-round effects only partly assessed as many benefits and costs poorly estimated due to lack of data.
Chad Case Study, Results

Slide 41
• Economy-wide impacts • Use of social accounting matrix (Garber 2000) for Chad to
assess multipliers and perform ‘short-run’ analysis
• Multiplier analysis suggests strong linkages between livestock and broader economy. Activity multipliers: • 3.5 on total economic output • 2.6 on household incomes
• In the year 2000, without eradication: • Income of rural households would be 8.5% lower, that of
other households 2.5-3.5% lower; • Agriculture output would be nearly 6%, manufacturing
3.4%, and informal sector nearly 5% lower; • GDP % lower compared to “with eradication case”.
Chad Case Study, Results
Slide 42
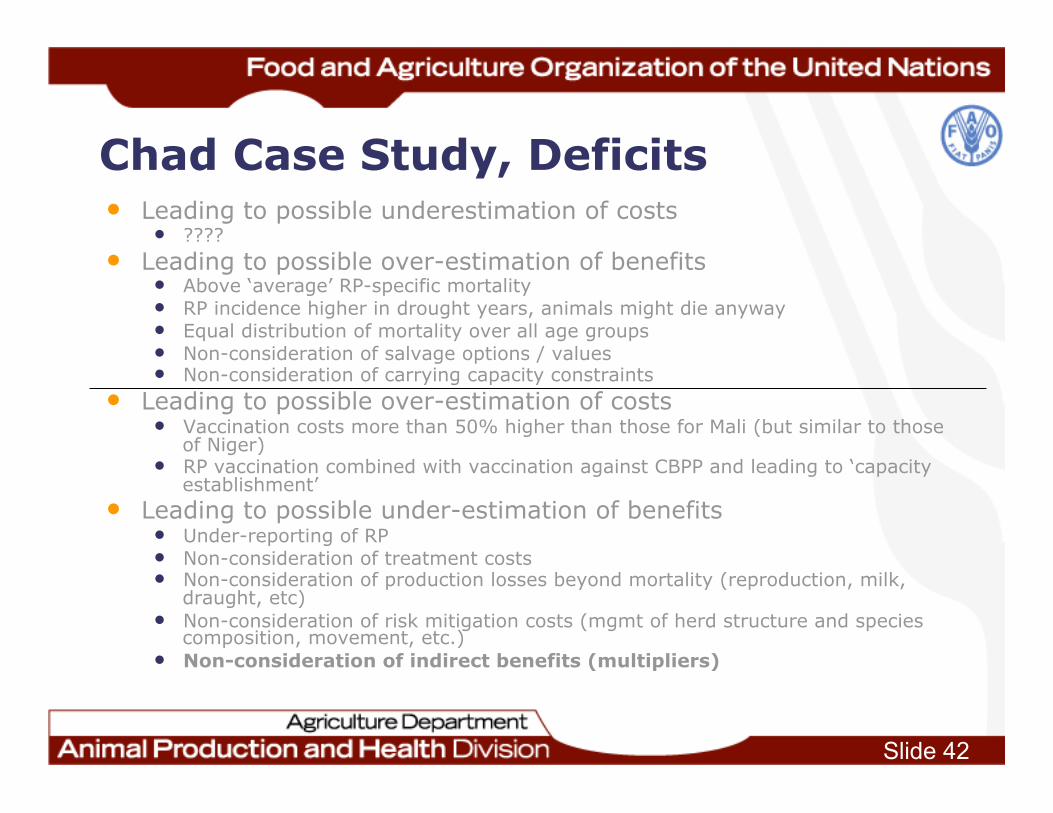
Chad Case Study, Deficits • Leading to possible underestimation of costs
• ???? • Leading to possible over-estimation of benefits
• Above ‘average’ RP-specific mortality • RP incidence higher in drought years, animals might die anyway • Equal distribution of mortality over all age groups • Non-consideration of salvage options / values • Non-consideration of carrying capacity constraints
• Leading to possible over-estimation of costs • Vaccination costs more than 50% higher than those for Mali (but similar to those
of Niger) • RP vaccination combined with vaccination against CBPP and leading to ‘capacity
establishment’ • Leading to possible under-estimation of benefits
• Under-reporting of RP • Non-consideration of treatment costs • Non-consideration of production losses beyond mortality (reproduction, milk,
draught, etc) • Non-consideration of risk mitigation costs (mgmt of herd structure and species
composition, movement, etc.) • Non-consideration of indirect benefits (multipliers)

Slide 43
Was it worth it?
1. For Chad • CBA positive despite biases ‘against’ outweighing those ‘in
favour’. 2. For SSA
• All ‘partial’ analyses report positive CBRs despite usually being limited to assessment of ‘direct’ benefits. CBRs are particularly favourable where draught power and milk are of specific importance (Kenya & Ethiopia).
3. For South and East Asia • Extrapolating from Kenya and Ethiopia very probably.
4. For NENA • Definitely – one incursion every 2 years over the past 40
years. 5. The World as a whole
• (1 + 2 + 3 + 4) * X

Slide 44
Next Steps
• Improve the ‘analytical model’ to address main deficits (find compromise between the desirable and feasible)
• Support AU-IBAR to carry out ‘CBAs’ for a larger number of countries in SSA (check robustness of analyses)
• Expand analysis from country to regional level (SSA with AU-IBAR)
• Carry out analysis for India (as largest single ‘contributor’) and Pakistan
• Estimate rinderpest risk and cost (of risk mitigation and / or incursion) for ‘free’ countries

Slide 45
Afterthoughts
• Global eradication of a ‘dumb’ virus took 50 years, how long would it take to eradicate a ‘smart’ virus?
• Although on a global scale US$ 5 billion over 50 years is ‘peanuts’, raising US$100,000,000 per year for the control of an animal disease is beyond the scope of any single institution.
• Thus, despite being the ‘No 1’ animal disease globally, the lion’s share of the cost of RP control / elimination was borne by individual countries at different times (international contributions were catalytic at best).
• Consequently, ‘second best’ options, i.e. control of disease where it hurts most may prove to be the best short / medium-term strategy

Slide 46
Transvaal, 1896

Slide 47
Application
• Improve the ‘model’ (find compromise between the desirable and feasible)
• Support AU-IBAR to carry out ‘CBAs’ for a larger number of countries in SSA (check robustness of analyses)
• Expand analysis from country to regional level (SSA with AU-IBAR)
• Carry out analysis for India (as largest single ‘contributor’)

Slide 48
Phylogenetic Tree of Rinderpest Viruses

Slide 49
Added Analytical Challenge
1. Disease specifics 2. Production characteristics 3. Market characteristics 4. Livelihoods characteristics 5. Control characteristics
1. Farm / household level 2. Cattle sector level 3. Livestock / ag. sector level 4. Value chain & natl. econ. level 5. Indirect impacts (natl. level) 6. Indirect impacts
(international / global level)
How to reconcile disease-related contextual characteristics with impacts at different levels of analysis?
Vs.

Slide 50
Chad Case Study
• DynMod allows for the projection of cattle population growth based on assumptions and observed data regarding: • Herd demographics • Offtake rates • Death rates • Reproduction rates
• These were calibrated based on assumptions from Lesnoff et al. (2008) applied in Niger and trends in droughts, etc. from FAO time series data.

Slide 51
Chad Case Study, Background
• Rinderpest in Chad: • First detected in 1913 • 1913-1914 pandemic killed 1 million cattle, 70-80% of
cattle stocks • Concerted efforts for control started in 1950s, but
erratic in application until JP15 (1962) • JP15 successful in reducing outbreaks, but vaccination
coverage post-JP15 inconsistent (29-44% during 1971-1977)
• Major outbreak in 1983: about 5% of cattle herd killed (337,500 head)
• PARC increased vaccination coverage, followed by sero-surveillance to confirm absence of disease.

Slide 52
-30.000
-20.000
-10.000
0.000
10.000
20.000
30.000
40.000
50.000
1963
1965
1967
1969
1971
1973
1975
1977
1979
1981
1983
1985
1987
1989
1991
1993
1995
1997
1999
2001bi
llion
CFA
(200
0 pr
ices
)
Added benefits from RP control Added costs from RP control
Chad Case Study, Results

Slide 53
• Short-run simulation analysis (using 2000 as illustrative year, based on costs/benefits from sector analysis) highlights the magnitude of economy-wide impacts.
• In the year 2000, without eradication: • Income of rural households 8.5% lower, that of other
households 2.5-3.5% lower; • Agriculture output nearly 6%, manufacturing 3.4%, and
informal sector nearly 5% lower; • GDP (at factor cost) 3% lower compared to “with eradication
case”.
Chad Case Study, Results

Slide 54
Issues to Address
• Large amount of externalities / spillover effects and adaptive behaviour.
• Problems of valuation / pricing of livestock services and commodities and disease control inputs and shifts in these prices resulting from disease control / eradication.
• Difficulties to ‘capture’ the dynamics of the transformation of the livestock sector and associated value chains over such a long evaluation horizon.

Slide 55
Externalities / Spillover Effects (Examples) • Investments in capacity to control / eradicate
rinderpest (epidemio-surveillance, laboratory diagnostics, vaccine quality assurance, CAHWs, etc.) also accrue to control of other diseases.
• Particular impact of rinderpest in mixed farming systems relying on draft power and linkages of livestock sector and agriculture with the rest of the economy.
• Effects of rinderpest (eradication) on wildlife and the environment.

Slide 56
Externalities / Spillover Effects (Examples)
RP incursion risk, e.g. • Philippines 1955: 250 cases, 15,300 vaccinations. • Bhutan: 1968, persisted for 4 years • Near East epidemic: 1971 to 1973. • Sri Lanka: 1987 to 1994, 18,000 deaths, 1.5
million vaccinations. • Turkey: 1991, 6,000 deaths, 11 million animals
vaccinated

Slide 57
Adaptive Behaviour (Examples)
• Farmers may hedge against rinderpest by managing herd composition (more small ruminants, more reproductive females) and herd movements.
• Rinderpest outbreaks in vicinity may lead to destocking and subsequent (drastic) price falls.
• Presence of rinderpest in neighbouring country prompts ‘defensive’ investment (e.g. border vaccination) in rinderpest-free countries.
• Rinderpest-free countries close markets to infected countries, thus eradication affects international trade flows.

Slide 58
Adaptive Behaviour (Examples)
Vaccinations after RP freedom • Bangladesh: 400 million from 1959 to 1999. • Myanmar: 18 million from 1957 to 1994. • Thailand: 5 million from 1960 to 1995. • Etc…..

Slide 59
Valuation / Pricing (Examples)
• Intangible goods, e.g. farmers’ perceived value of reduced risk of herd loss.
• Non-marketed livestock services and products, e.g. savings and insurance function of livestock.
• Marketed products and services whose prices my be distorted by policy interventions (e.g. taxes, over-/undervalued exchange rate, subsidies, etc.)
• Domestic price shifts due to opening / closing of export markets.

Slide 60
Scope of CBA Version 1.1
• Aspects to include in the analysis without necessarily attempting most precise quantification: • Direct production and livelihoods impacts • Effects on herd structure, species composition (substitution
between cattle and small ruminants) • Effects on crop output and overall economy (through value
chains) • Trade impacts • Rinderpest-specific research (e.g. vaccine development)
and surveillance costs • Coordination and verification costs
Slide 61
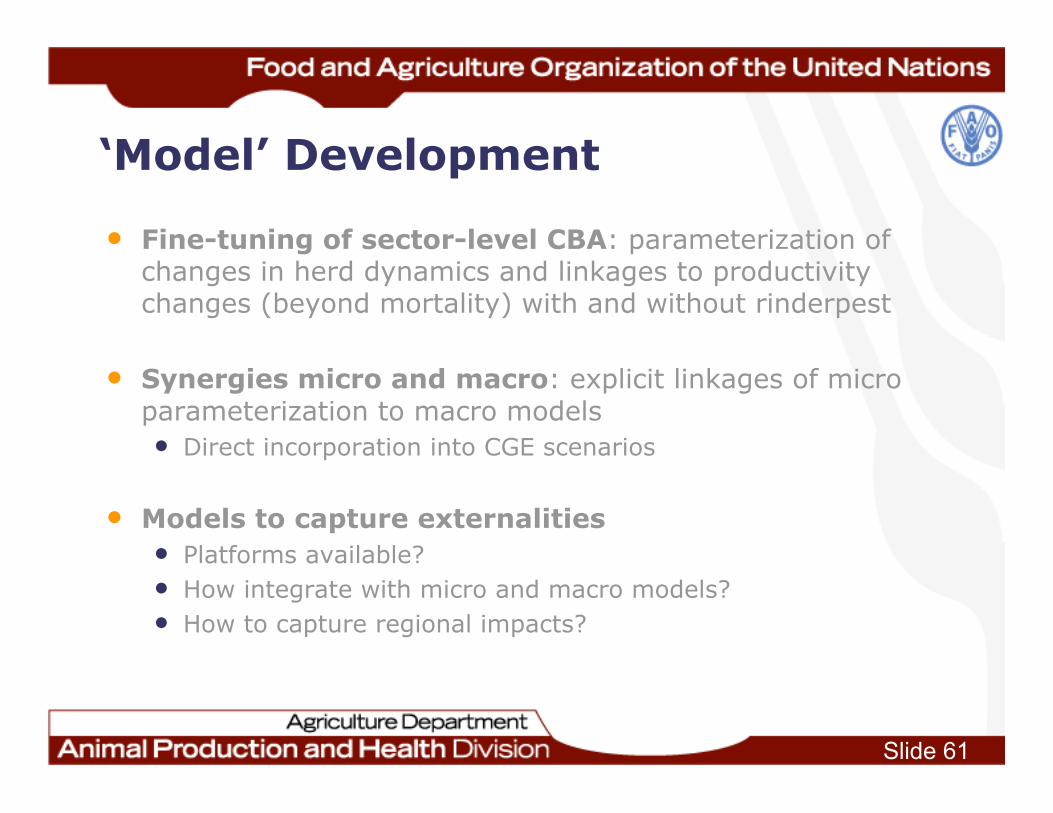
‘Model’ Development
• Fine-tuning of sector-level CBA: parameterization of changes in herd dynamics and linkages to productivity changes (beyond mortality) with and without rinderpest
• Synergies micro and macro: explicit linkages of micro parameterization to macro models • Direct incorporation into CGE scenarios
• Models to capture externalities • Platforms available? • How integrate with micro and macro models? • How to capture regional impacts?

Slide 62
RP Incursion Risk
0
2
4
6
8
10
12
14
16
18
20
1950s 1960s 1970s 1980s 1990s
SE.&E.AsiaS.AsiaNENASSA