the end of the innocence: supply and demand in a stagnant production environment
TRANSCRIPT
The End of the Innocence Supply and Demand in a Stagnant Production Environment Jack Weixel, Vice President, Analysis

Introducing – PointLogic Energy!
And in the blue corner…….

• Full service, energy fundamental data service provider.
• 30 employees consisting of both
upstream, midstream and downstream experts with offices in Houston, Denver, El Paso and Gaithersburg, MD.
• Started over 18 years ago as Lippman Consulting (later renamed LCI Energy Insight).
• Purchased by OPIS in December 2012 and renamed PointLogic Energy in January 2015.
• Over 350 years of combined industry experience.
• Detailed basin, regional and macro
reports spanning multiple delivery platforms.
First off, who is PointLogic Energy?

PointLogic Energy Services
• Detailed Flow Data – Production, Demand, Compressors and Custom Throughputs for Every Interstate Pipeline at Every State Border.
• Notice Service
• Searchable, Interactive IOC Database
• Pipeline Project Data and Details
• Interactive Client Variable Modeling, No Black Boxes
• Customized Subscription Packages and Enterprise Pricing
• Best in Class Customer Service
• Top tier data interface, data delivery in easy to use formats.

PointLogic Energy Data Suite
Easily drill into essential data and generate the analysis you need to boost your bottom line.
Pipelines
Production
Power
Excel Add-In
Forecast Models
More To Come
Energy Data Suite

PointLogic Energy Data Suite
We've taken cumbersome yet critical energy market fundamental data and delivered it in a filterable, mapped web application. www.pointlogicenergy.com

Get the Point PointLogic Energy’s FREE Weekly Trend Report
• Examines key energy market drivers
• Written by veteran energy experts and analysts
• Each weekly issue explores new trends in oil and gas supply, demand and prices
• Trend analyses leverages proprietary PointLogic Energy data, maps and other intelligence
Reliable insight you won’t find anywhere else!
Sign up for free today @ www.PointLogicEnergy.com/Get-the-Point.html

Remember this guy?

Agenda
• Where are we now?
• Supply Expectations
• Demand Expectations
• Impact on 2015 Supply and Demand Balance
• What about price?

4.8
0.0 0.1
4.9
1.8
0.0
-3.3
0.4
-1.1
Dry
Pro
d
LNG
Can
Impo
rts
Supp
ly
Pow
er
Indu
stria
l
Res
/Com
Mex
Ex
Dem
and
2014-15 Winter vs. 2013-14 Winter
Supply Demand
Source: PointLogic Energy Supply & Demand Report
Market Was 6.0 Bcf/d Long Versus Winter 13/14

3.1
-0.1
0.5
3.5 3.0
1.3
-3.4
0.6 1.5
Dry
Pro
d
LNG
Can
Impo
rts
Supp
ly
Pow
er
Indu
stria
l
Res
/Com
Mex
Ex
Dem
and
2015 Summer td vs. 2014 Summer td
Supply Demand
Source: PointLogic Energy Supply & Demand Report
Season to date: 2.0 Bcf/d Long Versus Summer 14 to date
Was 3.1 Bcf/d Long on May 22nd

What’s Going On Production?
63.0064.0065.0066.0067.0068.0069.0070.0071.0072.0073.0074.0075.00
Lower 48 Dry Production (Bcf/d)
2015 2014
Production grew 3.3 Bcf/d from Jan to May 14
Production struggling to grow 0.6 Bcf/d Jan to May 15
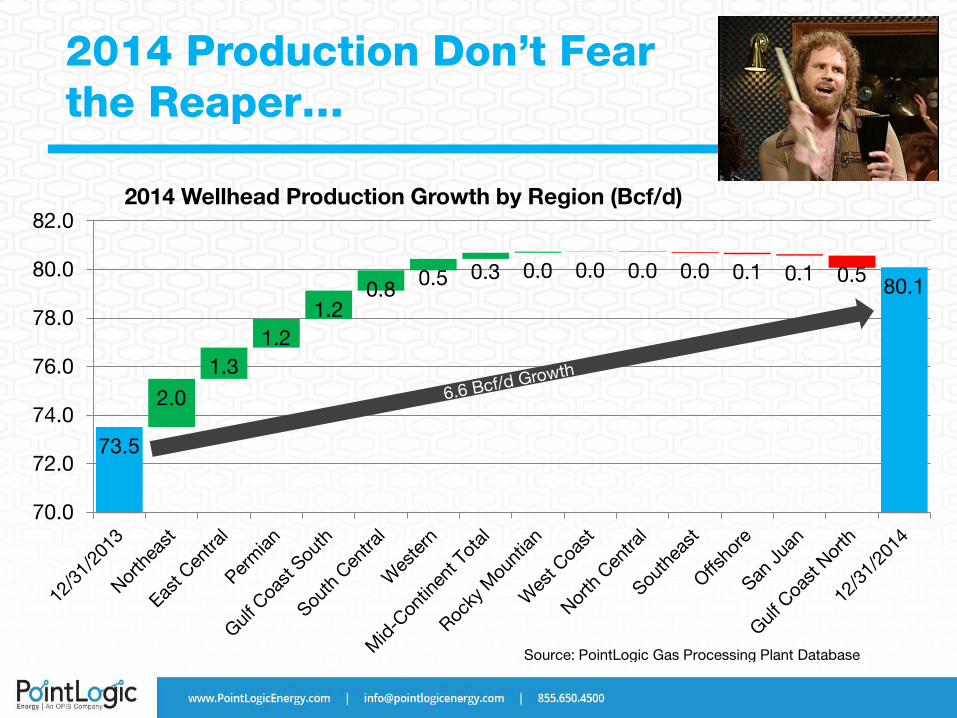
2014 Production Don’t Fear the Reaper…
0.0 0.0 0.1 0.1 0.5
2.0
1.3 1.2
1.2 0.8 0.5 0.3 0.0 0.0
73.5
80.1
70.0
72.0
74.0
76.0
78.0
80.0
82.02014 Wellhead Production Growth by Region (Bcf/d)
Source: PointLogic Gas Processing Plant Database

2015 Production Got a Fever..
0.8 0.1 0.0 0.1 0.1 0.0 0.0 0.5 0.4 0.1 0.1 0.0 0.4 0.0 80.1 79.5
70.0
72.0
74.0
76.0
78.0
80.0
82.02015 Year to Date Production Growth by Region (Bcf/d)
Source: PointLogic Gas Processing Plant Database

2015 Wells First Delivered
53 0 236
176
318 0 18 20 94
2,963
2,048
0
500
1000
1500
2000
2500
3000
3500All Wells First Delivered by Region
I got a fever…
Source: Drilling Info, PointLogic Estimates

35 5 71
62
117 0 9
145 2
1,124
678
0
200
400
600
800
1000
1200
All Gas Wells First Delivered By Region
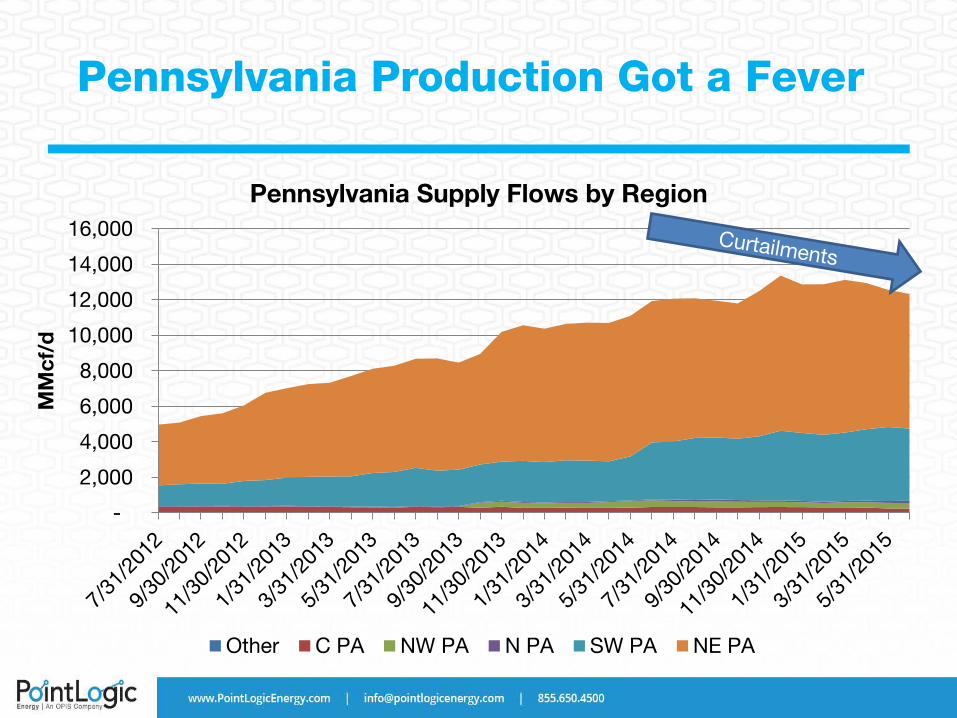
2015 Production Got a Fever.. …and the only prescription is higher prices!
Source: Drilling Info, PointLogic Estimates
-
2,000
4,000
6,000
8,000
10,000
12,000
14,000
16,000
MM
cf/d
Pennsylvania Supply Flows by Region
Other C PA NW PA N PA SW PA NE PA
Pennsylvania Production Got a Fever
-
500
1,000
1,500
2,000
2,500
3,000
3,500
4,000
MM
cf/d
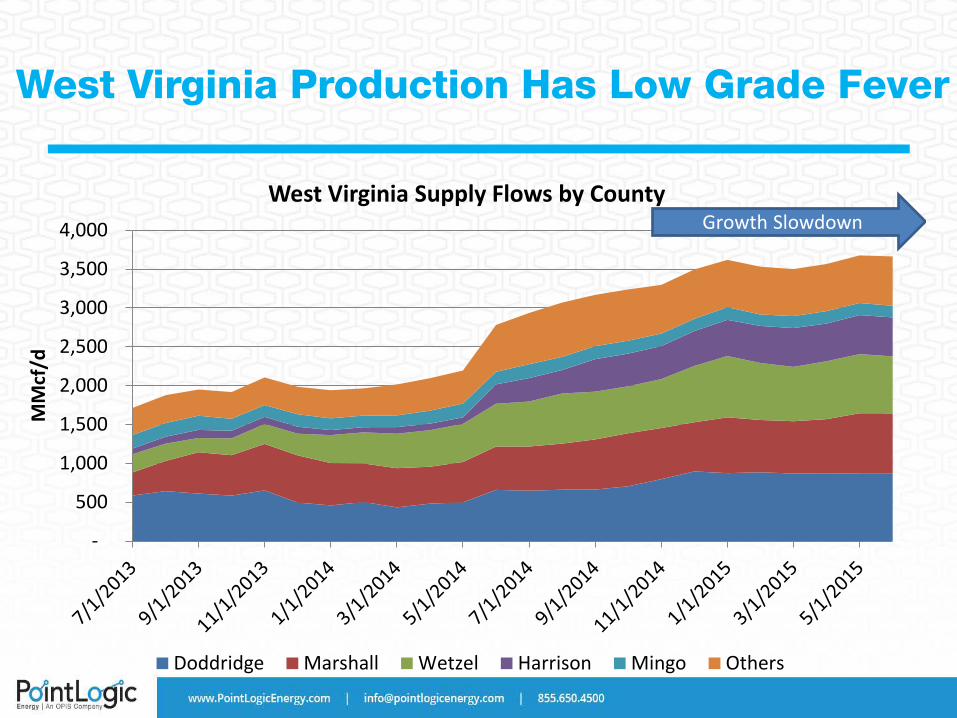
West Virginia Supply Flows by County
Doddridge Marshall Wetzel Harrison Mingo Others
Growth Slowdown
West Virginia Production Has Low Grade Fever

-
500
1,000
1,500
2,000
2,500
3,000
MM
cf/d
Ohio Supply Flows by County
Monroe Columbiana Noble Carroll Mahoning Others
Oh Way to Go Ohio – Not a Pretender
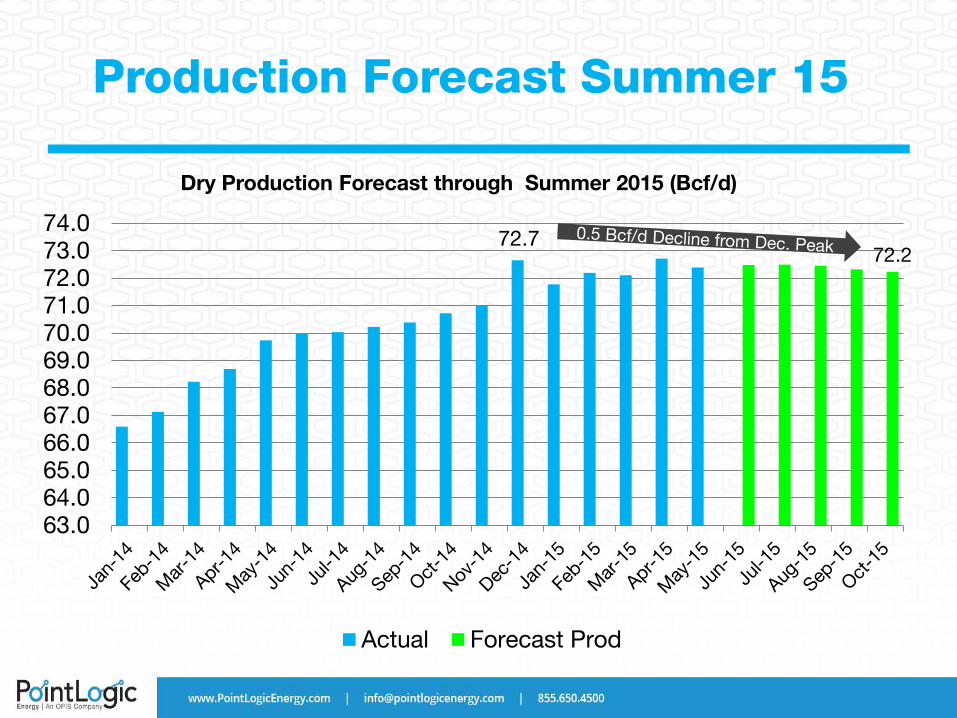
Production Forecast Summer 15
72.7 72.2
63.064.065.066.067.068.069.070.071.072.073.074.0
Dry Production Forecast through Summer 2015 (Bcf/d)
Actual Forecast Prod
21
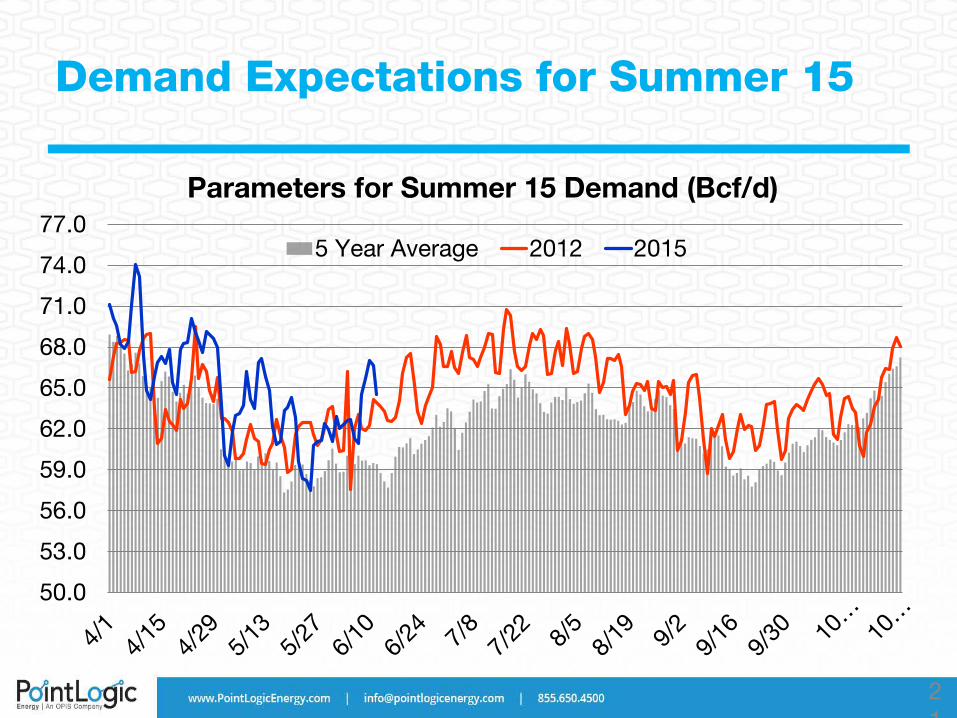
Demand Expectations for Summer 15
50.0
53.0
56.0
59.0
62.0
65.0
68.0
71.0
74.0
77.0Parameters for Summer 15 Demand (Bcf/d)
5 Year Average 2012 2015

22
Demand To Date for Summer 15
0
7
14
21
28
35
42
49
56
63
70
2010 2011 2012 2013 2014 2015
Average Summer Demand to date (Bcf/d)
Power Industrial Res/Com Mexico 5 Year Average
Power: up 2.3 Bcf/d vs. 5 Year Avg
Mexico: up 1.0 Bcf/d vs. 5 Year Avg
Res/Com: off 0.5 Bcf/d vs. 5 Year Avg
Industrial: up 2.8 Bcf/d vs. 5 Year Avg
5 Year Avg Demand = 55.2 Bcf/d Summer 2015 = 60.9 Bcf/d Summer 2012 = 58.4 Bcf/d

Power and Industrial Demand Driving the Bus…
23
5.2
3.6
4.2 4.3
2.5 2.1
3.3
3.9
0.0 0.1
4.9
Week on Week Power Demand Delta Summer 15 Versus Summer 14
(Bcf/d)
0.6 0.7
0.5
1.7 1.8 1.6
1.5
1.8 1.9 1.9
Week on Week Industrial Demand Delta Summer 15 Versus Summer 14
(Bcf/d)

Industrial Demand Has Proven to Be Resilient through June
June 14 -- 19.79
Forecast -- 21.50
15.0
16.0
17.0
18.0
19.0
20.0
21.0
22.0
23.0
Summer Industrial Burn (Bcf/d) 2012 Peak Months vs. June 2015td
2012 June - Aug 2015 Jun Forecast 2014 June - Aug
EIA Forecasts 21.8 Bcf/d for full year 2015

Industrial Demand Has Proven to Be Resilient through June
-50 50 150 250 350 450 550 650 750 850 950
Northwest
Western
California
Rocky Mountain
Southwest
San Juan
North Central
Mid-Continent
Permian
Gulf Coast Onshore
Southeast
South Central
East Central
Northeast
Delta Industrial Demand by Region May 15 vs. May 14 (MMcf/d)

Power Burn Up In All Regions – Gulf, Southeast and Midcon Are Overachievers
26
0 100 200 300 400 500 600 700
Northwest
Western
California
Rocky Mountain
Southwest
North Central
Mid-Continent
Permian
Gulf Coast Onshore
Southeast
South Central
East Central
Northeast
Average Delta Power Burn (MMcf/d) Season to Date

0
200
400
600
800
1,000
1,200
1,400
1,600
1,800
2,000
Georgia Ohio Alabama Illinois Utah Iowa Florida Minnesota Kentucky
Mar-May 2015 Coal Gen Capacity (MW) Retired
Coal Retirements Through May 2015
Significant retirements include Georgia Power units in Georgia, First Energy units in Ohio and TVA Widow’s Creek in Alabama.
4.0 GW ~ 0.36 Bcf/d at 50% Capacity and 7.5 Heat Rate
Source: PointLogic Energy research and EIA

0
200
400
600
800
1,000
1,200
1,400
1,600
Coal Retirements Balance of 2015 (MW)
Jun-15 Dec-15
Coal Retirements Summer 2015
Includes AEP units in West Virginia and Ohio, Appalachian Power units in West Virginia and Virginia, Dayton Power units in Ohio, Indiana Michigan Power units in Indiana and Cane Run in Kentucky plus conversion of Big Sandy in Kentucky. 6.1 GW in June 2015 = 0.55 Bcf/d at 50% Capacity and 7.5 Heat Rate
Source: PointLogic Energy research and EIA

July 6 -- 37.5 July 25th -- 38.1
June 25 -- 34.8
July -- 33.00
August -- 30.00
20.0
22.0
24.0
26.0
28.0
30.0
32.0
34.0
36.0
38.0
40.0
Summer Power Burn (Bcf/d) 2012 Peak Months vs. June 2015td
2012 June - Aug 2015 Jun Forecast
Power Burn Through June, July and August Will Be Critical
If June forecast plays out, June 2015 average power demand is short of June 2012 average by 0.05 Bcf/d (29.39 Bcf/d).

And Mexico Has a Plethora from US Exporters…
30
0.0
0.5
1.0
1.5
2.0
2.5
3.0
Net Mexican Exports from the U.S. (Bcf/d)
Mexican Exports Al Rojo Vivo! Up 31% Summer to date vs.
2014
0
100
200
300
400
500
600
700
800
900
NET Mexico and KM Sierrita Exports (MMcf/d)
NET Mexico KM Sierrita

0
7
14
21
28
35
42
49
56
63
70
2012 2014 2015 est 5 Year Average
Forecast Summer Demand (Bcf/d)
Power IndustrialRes/Com Mexico
31
Demand Expectations for Summer 15
Power: down 1.9 Bcf/d vs. 2012 and up 2.3 Bcf/d vs. 5 Year Avg.
Mexico: up 0.8 Bcf/d vs. 2012 and up 1.0 Bcf/d vs. 5 Year Avg.
Res/Com: up 0.9 Bcf/d vs. 2012 and up 0.3 Bcf/d vs. 5 Year Avg.
Industrial: up 2.5 Bcf/d vs. 2012 and up 2.8 Bcf/d vs. 5 Year Avg.
Total Demand Summer 2015 averages 61.5 Bcf/d vs. 2012 level of 59.2 Bcf/d – Δ of 2.3 Bcf/d
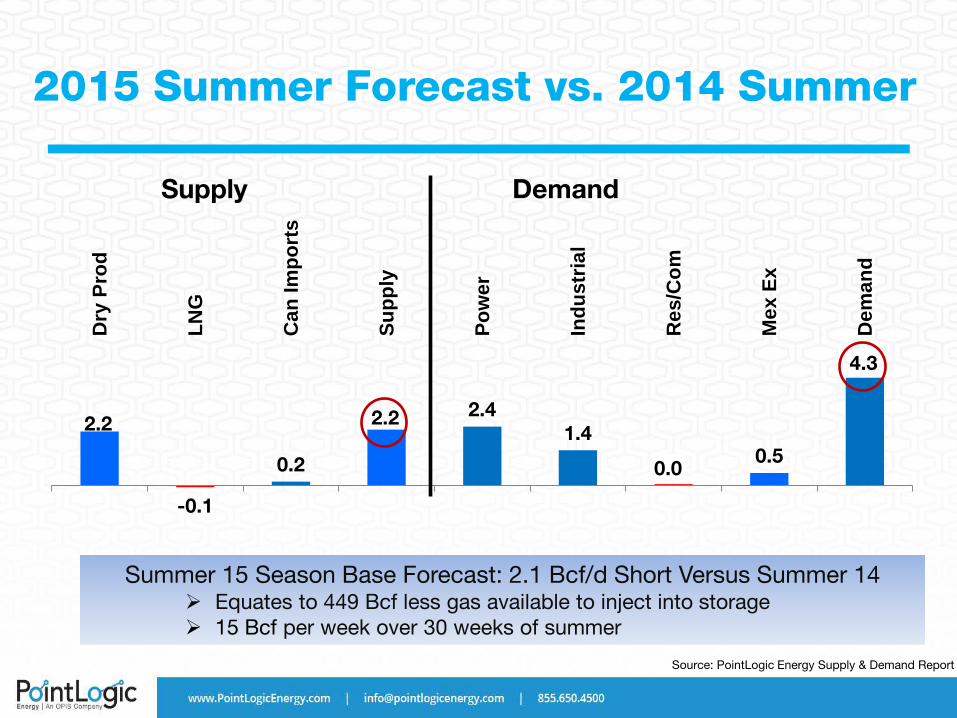
2.2
-0.1
0.2
2.2 2.4 1.4
0.0 0.5
4.3
Dry
Pro
d
LNG
Can
Impo
rts
Supp
ly
Pow
er
Indu
stria
l
Res
/Com
Mex
Ex
Dem
and
2015 Summer Forecast vs. 2014 Summer
Supply Demand
Source: PointLogic Energy Supply & Demand Report
Summer 15 Season Base Forecast: 2.1 Bcf/d Short Versus Summer 14 Equates to 449 Bcf less gas available to inject into storage 15 Bcf per week over 30 weeks of summer

7501,0001,2501,5001,7502,0002,2502,5002,7503,0003,2503,5003,7504,000
5 Yr Avg
5 Yr Min
2014/15
Base Forecast
Storage Injections Could Match 5 Year Average, but that Would Be Boring!
US Storage Inventories (Bcf)
Source: PointLogic Daily Market Report & EIA
Assuming 5 year average injection rate puts inventories at 3,826 Bcf, a mere 44 Bcf above the 5 year average, but
230 Bcf ahead of last year.
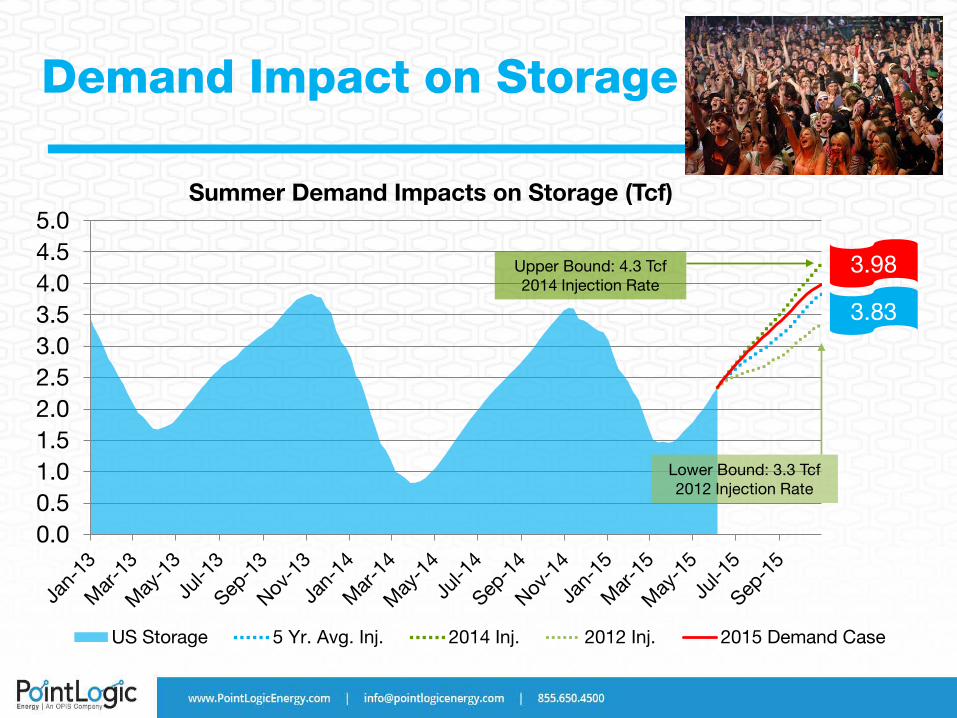
Demand Impact on Storage
0.00.51.01.52.02.53.03.54.04.55.0
Summer Demand Impacts on Storage (Tcf)
US Storage 5 Yr. Avg. Inj. 2014 Inj. 2012 Inj. 2015 Demand Case
Upper Bound: 4.3 Tcf 2014 Injection Rate
Lower Bound: 3.3 Tcf 2012 Injection Rate
3.98
3.83
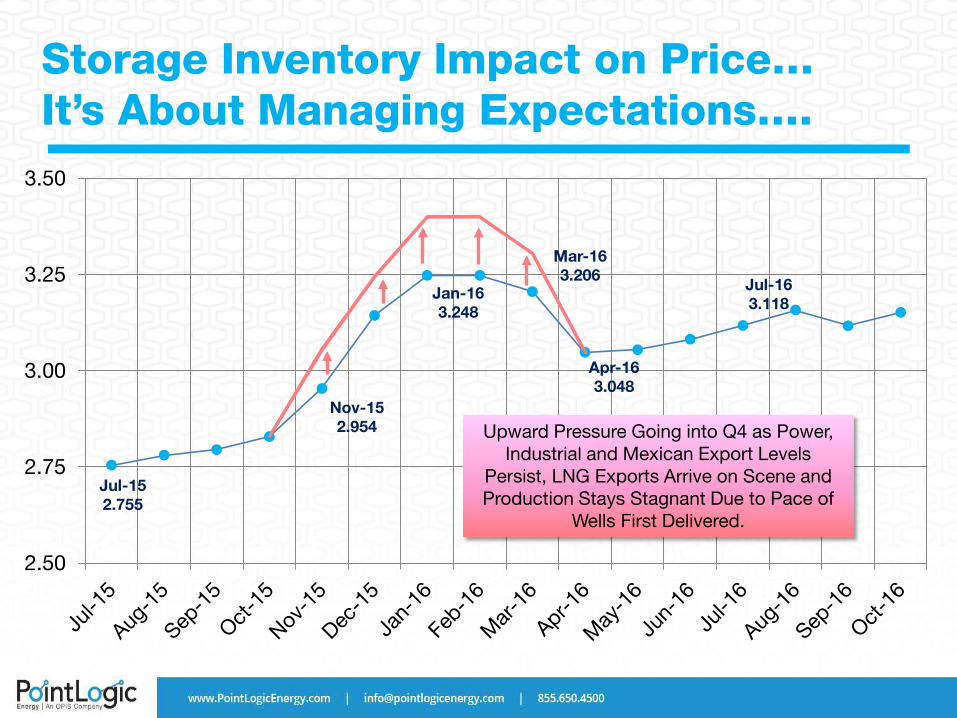
Storage Inventory Impact on Price… It’s About Managing Expectations….
Jul-15 2.755
Nov-15 2.954
Jan-16 3.248
Mar-16 3.206
Apr-16 3.048
Jul-16 3.118
2.50
2.75
3.00
3.25
3.50
Upward Pressure Going into Q4 as Power, Industrial and Mexican Export Levels
Persist, LNG Exports Arrive on Scene and Production Stays Stagnant Due to Pace of
Wells First Delivered.

Key Takeaways
Sustained production and normal winter drives market towards equilibrium.
Production stagnation is evident across most regions of the country.
Summer demand increases in power, industrial and Mexico mark beginning of systemic increases and transition to demand driven market.
Impact on storage is marginal in Summer 15 – market can handle this level of demand in current production environment.
Upward Price Pressure Heading Into Winter 15/16.

Contact Us Today!
Jack Weixel Vice President, Analysis 202.607.6354 [email protected] Customer Support Phone: 855.650.4500 ext. 1 [email protected] Sales Phone: 855.650.4500 ext. 2 [email protected]
Gaithersburg HQ: 9737 Washingtonian Blvd.
Houston Office: 1155 Dairy Ashford Rd.