michigan physician supply and demand through 2020physician populations, a stagnant medical education...
TRANSCRIPT
Physician Supply and Demand through 2020
The Center for Health Workforce StudiesUniversity at Albany, State University of New York
MICHIGAN

Michigan Physician Supply and Demand through 2020
The Center for Health Workforce StudiesUniversity at Albany, State University of New YorkSchool of Public Health7 University Place / Suite B-334Rensselaer, NY 12144-3458
Phone: (518) 402-0250Web: http://chws.albany.eduEmail: [email protected]

Michigan Physician Supply and Demand Through 2020 i
Preface This report presents an analysis of the current physician workforce and forecasts of the future physician workforce in Michigan. It provides forecasts of the supply of and demand for physicians throughout the state by specialty through 2020. This report was prepared for and with funding from the Michigan Blue Ribbon Committee on Physician Workforce. It is one component of the major reform and planning effort initiated by the Michigan Blue Ribbon Committee on Physician Workforce in response to national near-term projections of substantial physician workforce shortages. This report is intended to provide useful information for policy makers, educators, and other interested parties. This report was prepared by the Center for Health Workforce Studies at the University at Albany, State University of New York. The Center is dedicated to the collection, analysis, and distribution of health workforce data to assist health, professional and educational organizations, policy makers, and the public understand issues related to the supply, demand, distribution, and use of health workers. This report was prepared by Gaetano J. Forte and David P. Armstrong. The views expressed in this report are those of the Center for Health Workforce Studies and do not necessarily represent positions or policies of the School of Public Health, University at Albany, State University of New York; Michigan State University; the College of Human Medicine – Michigan State University; the College of Osteopathic Medicine – Michigan State University; the University of Michigan; the University of Michigan Medical School, Wayne State University; the School of Medicine – Wayne State University; Henry Ford Hospital; Ingham Regional Medical Center; the Michigan Department of Community Health; the Michigan Department of Labor and Economic Growth; the Michigan Association of Health Plans; the Michigan Health Council; the Michigan Health and Hospital Association; the Michigan Osteopathic Association; the Michigan Primary Care Association; the Michigan State Medical Society; the Michigan State Area Health Education Center; or the MSU Institute for Health Care Studies. Funding for this report was made possible through a generous grant from the members of the Michigan Blue Ribbon Committee on Physician Workforce Committee. January 2007
Michigan Physician Supply and Demand Through 2020 ii
Acknowledgements The authors wish to acknowledge the fine work conducted by Altarum’s Health Solutions Division on the physician supply and demand forecasts presented in this report. The work and expertise of Charles Roehrig and Sara Eisenstein were especially helpful in developing this report.
Michigan Physician Supply and Demand Through 2020 iii
Table of Contents Executive Summary ..............................................................................................................ES-1
Introduction....................................................................................................................ES-1 Forecasting Physician Supply and Demand through 2020 in Michigan........................ES-2 Physician Supply Forecasting........................................................................................ES-4 Physician Demand Forecasting....................................................................................ES-10 Relationship between Physician Supply and Demand in Michigan in 2020 ...............ES-21 Limitations ...................................................................................................................ES-29
Chapter 1: Overview.................................................................................................................1 Chapter 2: Background.............................................................................................................2 Chapter 3: Demographic Profile of Michigan...........................................................................5 Chapter 4: Michigan Physician Workforce, 2004 ..................................................................22 Chapter 5: Profile of Medical Education and Training in Michigan, 2005 ............................42 Chapter 6: Physician Supply and Demand Forecasting in the U.S........................................61 Chapter 7: Michigan Physician Supply Forecasting..............................................................70 Chapter 8: Michigan Physician Demand Forecasting .........................................................112 Chapter 9: Relationship between Physician Supply and Demand in Michigan ...................173 Chapter 10: Limitations ........................................................................................................246 References ..............................................................................................................................247 Appendix ............................................................................................................................... A-1
Michigan Physician Supply and Demand Through 2020 ES-1
Executive Summary Introduction An adequate supply and distribution of physicians is an essential component of an effective health care system. While there is no simple ratio to determine how many physicians a nation, state, or region should have, it is possible to evaluate the adequacy of physician supply of a particular geographic area by applying supply and demand models to inform physician workforce decisions. Due to the length of time and great expense required for physician education and training, it is prudent to anticipate likely physician supply and demand imbalances well in advance of their occurrence. To that end, a consortium of stakeholders in Michigan, collectively known as the Blue Ribbon Physician Workforce Committee, commissioned the Center for Health Workforce Studies to conduct an assessment of the future supply and demand for physicians in Michigan through 2020. This brief report highlights the main findings of the Center’s physician supply and demand forecasts. National Physician Shortage Context In January 2005, the Federal Council on Graduate Medical Education (COGME) released its sixteenth report, Physician Workforce Policy Guidelines for the United States, 2000 – 2020. The report detailed forecasts of national physician supply and demand that indicated a substantial shortage of physicians by 2020. The magnitude of the shortage was estimated at 85,000 to 96,000 physicians, or between 7.5 and 8.5 percent of the likely number of physicians required to provide services for the nation’s population in 2020. The COGME’s report joined a growing number of voices that had arrived at the same troubling conclusion. In the late 1990s, prominent physician workforce researchers began to question the notion of a national physician surplus widely held earlier in the decade. With aging general and physician populations, a stagnant medical education and training effort, more than 4,000 designated primary care Health Professional Shortage Areas, a decline in the growth of managed care, a willingness of payors to continue supporting rising rates of physician utilization, and reports from a dozen medical specialties of current or impending physician shortages, it no longer made sense to think in terms of physician surpluses. The COGME’s report attempted to bring all of these observations together. One of the failings of the COGME’s report, however, was its lack of attention to regional and specialty-specific variations embedded in its forecasts. Thus, one of the ramifications of the report was movement by concerned stakeholders in a number of states to determine how the projected national physician shortage would play out in their areas. Efforts in Wisconsin, Kentucky, Arizona, California, Oregon, North Carolina, Mississippi, Texas, and Massachusetts have been or are being made that examine physician supply and demand. Moreover, in the past several years, specialty-specific examinations in Cardiology, Endocrinology, Allergy and Immunology, Psychiatry, Neurosurgery, Pediatric Subspecialties, Dermatology, Medical Genetics, Radiology, Geriatric Medicine, and Critical Care have also yielded findings of current or future shortages of physicians.
Michigan Physician Supply and Demand Through 2020 ES-2
Efforts in Michigan In 2004, COGME members from Michigan and other state stakeholders began an effort to assess what the projected national physician shortage meant for the state. Coming together as the Blue Ribbon Committee on Physician Workforce, they sought out the same team who conducted the national study that had been summarized in the COGME’s report and charged them with replicating as closely as possible the previous study for the Michigan physician workforce. Two complementary efforts were initiated in Michigan to understand the dynamics around their physician workforce. First, the Michigan Department of Community Health began a 3-year census survey of all physicians licensed to practice medicine in the state in 2005. The survey included a battery of items to collect information on physicians’ employment characteristics, demographics, medical specialty, time spent providing patient care, practice capacity and acceptance of Medicaid, plans to continue practice, educational background, professional activities, use of technology, and foreign language proficiency. In the first year, approximately 55 percent of the licensed physicians responded to the survey. A report on the first-year responses was issued in January 2006. Second, in 2004, the Michigan State Medical Society commissioned a compilation of information to develop physician supply and demand forecasts for the state through 2020. The resultant report was released in June 2005. Using a methodology loosely based on Richard “Buz” Cooper’s Trend Model, the medical society’s report indicated Michigan could face a shortage of 6,000 physicians by 2020. The Blue Ribbon Committee-commissioned study furthers the work of the Michigan State Medical Society project. It examined Michigan’s physician workforce at a finer level of detail, compiled additional information on Michigan’s population and health status trends, applied a more formal modeling approach to its forecast, developed state-level physician supply and demand forecasts under multiple scenarios, and developed specialty-specific regional physician supply and demand forecasts under multiple scenarios. The current report presents the key findings of the Blue Ribbon Committee on Physician Workforce’s study on the future physician supply and demand in Michigan. Forecasting Physician Supply and Demand through 2020 in Michigan There are many factors to be considered when forecasting physician supply and demand in a particular area. These include (but are not limited to): the size and characteristics of the current physician supply and of new physicians entering the workforce; how physician services are utilized in terms of the characteristics of patients, the location where they are provided, and who provides them; and the characteristics of the population in the particular area. Also important are potential medical advances, physician practice and migration patterns, public and private health care cost-containment efforts, changes in the health care delivery system and health insurance coverage, and a host of other related factors.
Michigan Physician Supply and Demand Through 2020 ES-3
Using forecasting models adapted to include data specific to Michigan, the Center developed a number of supply and demand scenarios to estimate the potential impact of some of the factors listed above. The Center concluded that between 2005 and 2020, growth in the demand for physicians in Michigan will likely outpace growth in the supply of physicians. Thus, Michigan is likely to face a physician shortage by 2020. The expected magnitude of the shortage is approximately 4,400 physicians, or about 12 percent of the number of physicians required to meet the forecast demand for physician services in 2020. Characteristics of Physicians in Michigan in 2004 The Center obtained the American Medical Association’s year-end 2004 Physician Masterfile in order to describe the current physician workforce in Michigan and seed the models with base year information. There were 29,261 active, patient care physicians practicing in Michigan in 2004. Of those:
• 23,769 (81 percent) were post-resident, active, patient care physicians; 3,981 were training in graduate medical programs; and 1,511 were primarily practicing medicine in non-patient care positions (e.g., administration, research, teaching, etc.);
• slightly more than a quarter (27 percent) were women;
• sixty-eight percent were non-Hispanic White, and 19 percent were Asian/Pacific
Islander. Eight percent were underrepresented minorities: 5 percent were Black/African-American and 3 percent were Hispanic/Latino;
• more than half (58 percent) were older than 45 years of age and 11 percent were
65 years of age and older;
• twenty-eight percent were International Medical Graduates (IMGS); that is, they had graduated from a medical school outside the United States and Canada. Nearly three quarters (72 percent) had graduated from a medical school in the United States or Canada (United States Medical Graduates or USMGs), and slightly more than half had graduated from one of the four medical schools in Michigan (note: 38 percent of all active, patient care physicians practicing in Michigan in 2004 graduated from a Michigan medical school); and
• approximately 39 percent practiced in one of the primary care specialties:
General/Family Medicine, General Internal Medicine, or General Pediatrics. Six percent were practicing as Obstetrician/Gynecologists. Ten percent were practicing in Internal Medicine Subspecialties. Fifteen percent were practicing in Surgery and related subspecialties. Twelve percent were practicing in facility-based specialties (i.e., Anesthesiology, Pathology, and Radiology). Six percent were practicing in Adult or Child and Adolescent Psychiatry. The remainder (13 percent) were practicing in other specialties.

Michigan Physician Supply and Demand Through 2020 ES-4
Physician Supply Forecasting The model used to forecast the future supply of physicians in Michigan considered the following supply determinants:
• the overall number and composition (gender, age, year of medical school graduation, location of medical school, and practice activity) of the current supply of active physicians in Michigan;
• the overall number and composition of new entrants into the physician workforce
by source (allopathic, osteopathic, USMGs, and IMGs);
• retirement, death, and other rates of separation from the physician workforce; and
• rates of physician migration into and out of the state. For the state-level supply forecasts, the baseline model assumed the physician production, practice patterns, rates of separation from the workforce, and migration patterns would remain constant over the forecast period. Scenarios allowing for variation in the level of physician productivity were developed. Below, the results of the baseline forecasts are presented. Michigan Physician Supply, 2005 – 2020 The supply model forecast a 10 percent increase in the supply of physicians between 2005 and 2020, with the number of active physicians predicted to increase from 30,366 in 2005 to 33,462 in 2020. Adjusting for the projected population growth in the state (5 percent), the physician to population ratio was predicted to grow from 297 physicians per 100,000 population to 313 physicians per 100,000 population. Figure ES-1 – Michigan Physician Supply Forecast, 2005-2020
Year Physicians Population2005 30,366 10,207,4212010 31,756 10,428,6832015 32,814 10,599,1222020 33,462 10,695,993
Percent Change 2005-2020 10% 5% 5%
Physicians per 100,000 Population
297305310313
Primary care physicians were forecast to grow by 10 percent between 2005 and 2020, with the number of active physicians predicted to increase from 11,744 in 2005 to 12,889 in 2020. Adjusting for the projected population growth in the state, the physician to population ratio was predicted to grow from 115 physicians per 100,000 population to 121 physicians per 100,000 population.
Michigan Physician Supply and Demand Through 2020 ES-5
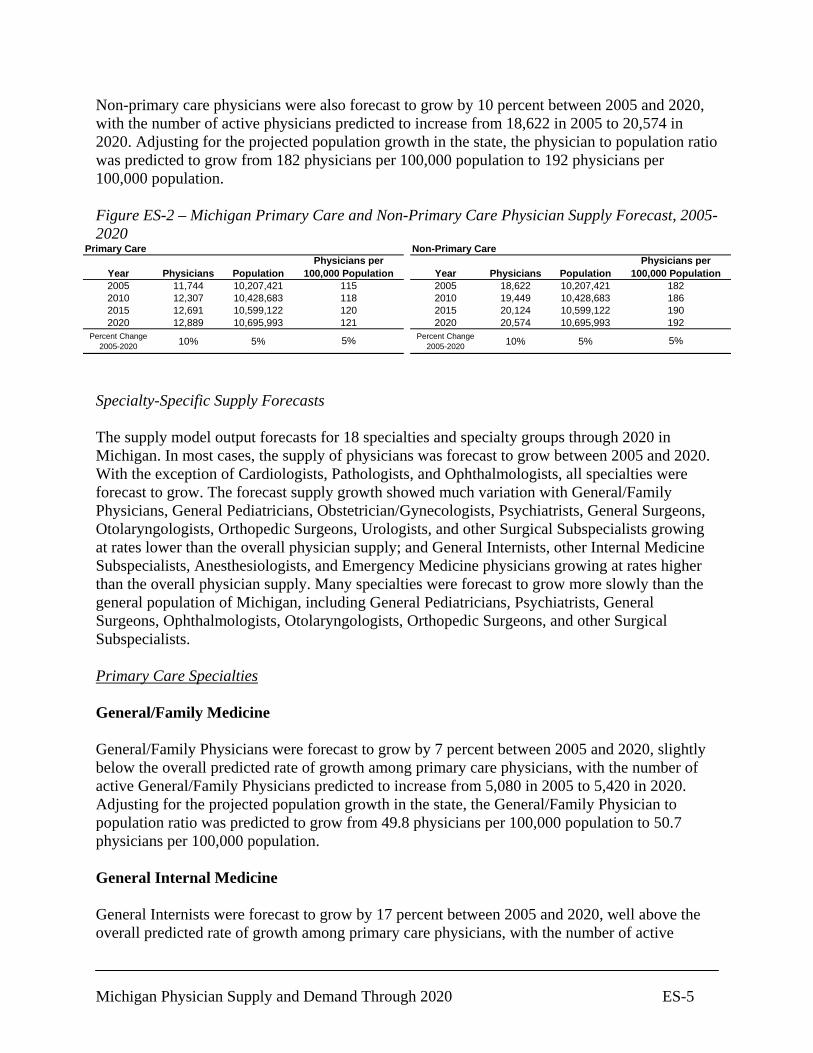
Non-primary care physicians were also forecast to grow by 10 percent between 2005 and 2020, with the number of active physicians predicted to increase from 18,622 in 2005 to 20,574 in 2020. Adjusting for the projected population growth in the state, the physician to population ratio was predicted to grow from 182 physicians per 100,000 population to 192 physicians per 100,000 population. Figure ES-2 – Michigan Primary Care and Non-Primary Care Physician Supply Forecast, 2005-2020
Primary Care
Year Physicians Population2005 11,744 10,207,4212010 12,307 10,428,6832015 12,691 10,599,1222020 12,889 10,695,993
Percent Change 2005-2020 10% 5% 5%
Physicians per 100,000 Population
115118120121
Non-Primary Care
Year Physicians Population2005 18,622 10,207,4212010 19,449 10,428,6832015 20,124 10,599,1222020 20,574 10,695,993
Percent Change 2005-2020 10% 5%
192
5%
Physicians per 100,000 Population
182186190
Specialty-Specific Supply Forecasts The supply model output forecasts for 18 specialties and specialty groups through 2020 in Michigan. In most cases, the supply of physicians was forecast to grow between 2005 and 2020. With the exception of Cardiologists, Pathologists, and Ophthalmologists, all specialties were forecast to grow. The forecast supply growth showed much variation with General/Family Physicians, General Pediatricians, Obstetrician/Gynecologists, Psychiatrists, General Surgeons, Otolaryngologists, Orthopedic Surgeons, Urologists, and other Surgical Subspecialists growing at rates lower than the overall physician supply; and General Internists, other Internal Medicine Subspecialists, Anesthesiologists, and Emergency Medicine physicians growing at rates higher than the overall physician supply. Many specialties were forecast to grow more slowly than the general population of Michigan, including General Pediatricians, Psychiatrists, General Surgeons, Ophthalmologists, Otolaryngologists, Orthopedic Surgeons, and other Surgical Subspecialists. Primary Care Specialties General/Family Medicine General/Family Physicians were forecast to grow by 7 percent between 2005 and 2020, slightly below the overall predicted rate of growth among primary care physicians, with the number of active General/Family Physicians predicted to increase from 5,080 in 2005 to 5,420 in 2020. Adjusting for the projected population growth in the state, the General/Family Physician to population ratio was predicted to grow from 49.8 physicians per 100,000 population to 50.7 physicians per 100,000 population. General Internal Medicine General Internists were forecast to grow by 17 percent between 2005 and 2020, well above the overall predicted rate of growth among primary care physicians, with the number of active
Michigan Physician Supply and Demand Through 2020 ES-6
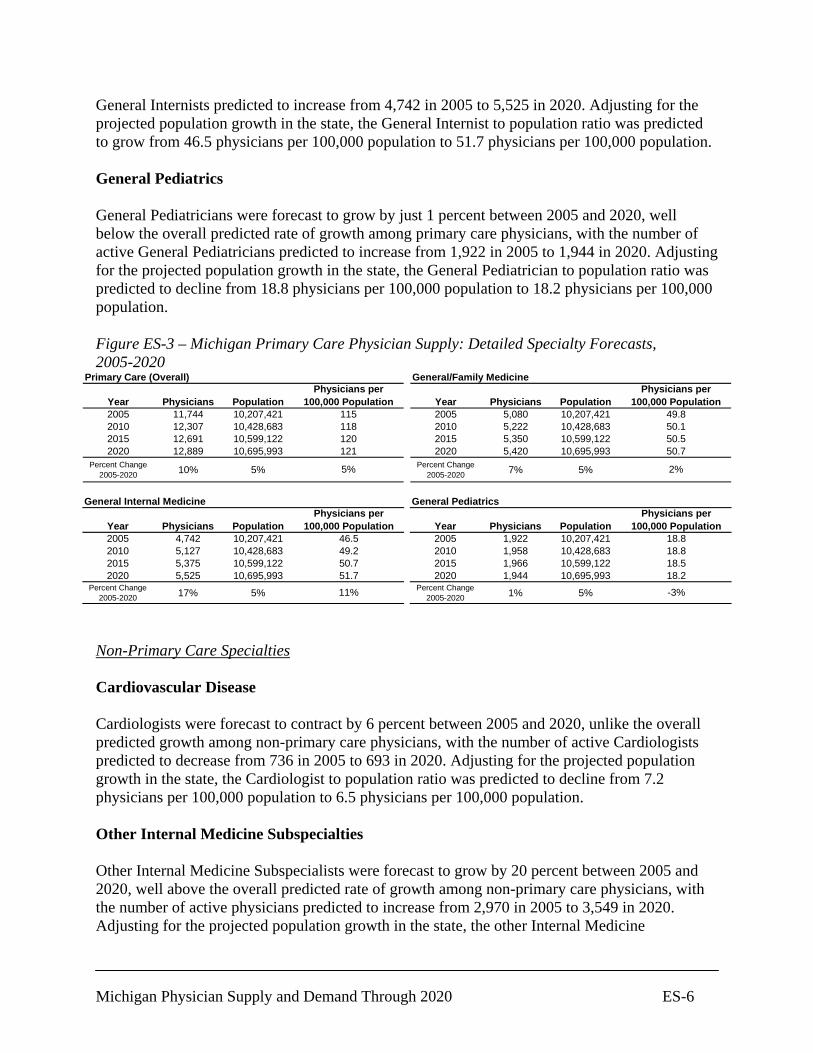
General Internists predicted to increase from 4,742 in 2005 to 5,525 in 2020. Adjusting for the projected population growth in the state, the General Internist to population ratio was predicted to grow from 46.5 physicians per 100,000 population to 51.7 physicians per 100,000 population. General Pediatrics General Pediatricians were forecast to grow by just 1 percent between 2005 and 2020, well below the overall predicted rate of growth among primary care physicians, with the number of active General Pediatricians predicted to increase from 1,922 in 2005 to 1,944 in 2020. Adjusting for the projected population growth in the state, the General Pediatrician to population ratio was predicted to decline from 18.8 physicians per 100,000 population to 18.2 physicians per 100,000 population. Figure ES-3 – Michigan Primary Care Physician Supply: Detailed Specialty Forecasts, 2005-2020
Primary Care (Overall)
Year Physicians Population2005 11,744 10,207,4212010 12,307 10,428,6832015 12,691 10,599,1222020 12,889 10,695,993
Percent Change 2005-2020 10% 5% 5%
Physicians per 100,000 Population
115118120121
General/Family Medicine
Year Physicians Population2005 5,080 10,207,4212010 5,222 10,428,6832015 5,350 10,599,1222020 5,420 10,695,993
Percent Change 2005-2020 7% 5%
50.7
2%
Physicians per 100,000 Population
49.850.150.5
General Internal Medicine
Year Physicians Population2005 4,742 10,207,4212010 5,127 10,428,6832015 5,375 10,599,1222020 5,525 10,695,993
Percent Change 2005-2020 17% 5%
50.751.7
11%
Physicians per 100,000 Population
46.549.2
General Pediatrics
Year Physicians Population2005 1,922 10,207,4212010 1,958 10,428,6832015 1,966 10,599,1222020 1,944 10,695,993
Percent Change 2005-2020 1% 5%
Physicians per 100,000 Population
18.818.818.518.2
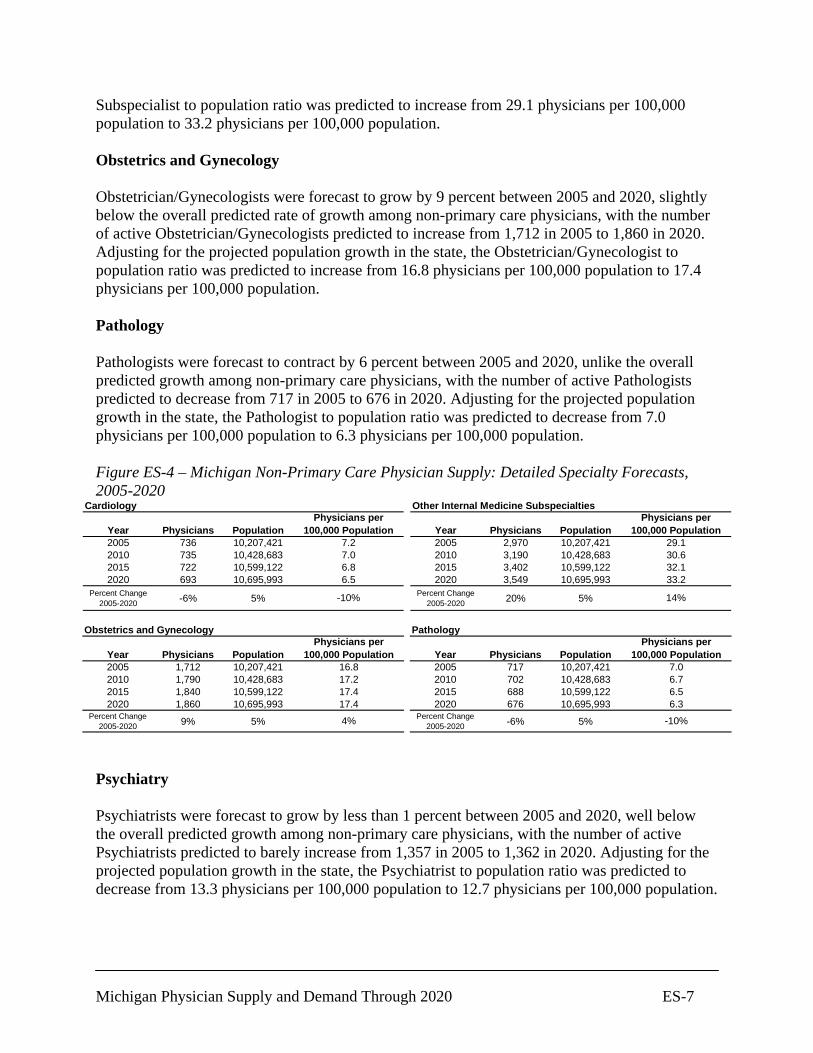
-3% Non-Primary Care Specialties Cardiovascular Disease Cardiologists were forecast to contract by 6 percent between 2005 and 2020, unlike the overall predicted growth among non-primary care physicians, with the number of active Cardiologists predicted to decrease from 736 in 2005 to 693 in 2020. Adjusting for the projected population growth in the state, the Cardiologist to population ratio was predicted to decline from 7.2 physicians per 100,000 population to 6.5 physicians per 100,000 population. Other Internal Medicine Subspecialties Other Internal Medicine Subspecialists were forecast to grow by 20 percent between 2005 and 2020, well above the overall predicted rate of growth among non-primary care physicians, with the number of active physicians predicted to increase from 2,970 in 2005 to 3,549 in 2020. Adjusting for the projected population growth in the state, the other Internal Medicine
Michigan Physician Supply and Demand Through 2020 ES-7
Subspecialist to population ratio was predicted to increase from 29.1 physicians per 100,000 population to 33.2 physicians per 100,000 population. Obstetrics and Gynecology Obstetrician/Gynecologists were forecast to grow by 9 percent between 2005 and 2020, slightly below the overall predicted rate of growth among non-primary care physicians, with the number of active Obstetrician/Gynecologists predicted to increase from 1,712 in 2005 to 1,860 in 2020. Adjusting for the projected population growth in the state, the Obstetrician/Gynecologist to population ratio was predicted to increase from 16.8 physicians per 100,000 population to 17.4 physicians per 100,000 population. Pathology Pathologists were forecast to contract by 6 percent between 2005 and 2020, unlike the overall predicted growth among non-primary care physicians, with the number of active Pathologists predicted to decrease from 717 in 2005 to 676 in 2020. Adjusting for the projected population growth in the state, the Pathologist to population ratio was predicted to decrease from 7.0 physicians per 100,000 population to 6.3 physicians per 100,000 population. Figure ES-4 – Michigan Non-Primary Care Physician Supply: Detailed Specialty Forecasts, 2005-2020
Cardiology
Year Physicians Population2005 736 10,207,4212010 735 10,428,6832015 722 10,599,1222020 693 10,695,993
Percent Change 2005-2020 -6% 5% -10%
Physicians per 100,000 Population
7.27.06.86.5
Other Internal Medicine Subspecialties
Year Physicians Population2005 2,970 10,207,4212010 3,190 10,428,6832015 3,402 10,599,1222020 3,549 10,695,993
Percent Change 2005-2020 20% 5%
33.2
14%
Physicians per 100,000 Population
29.130.632.1
Obstetrics and Gynecology
Year Physicians Population2005 1,712 10,207,4212010 1,790 10,428,6832015 1,840 10,599,1222020 1,860 10,695,993
Percent Change 2005-2020 9% 5%
16.817.217.417.4
4%
Physicians per 100,000 Population
Pathology
Year Physicians Population2005 717 10,207,4212010 702 10,428,6832015 688 10,599,1222020 676 10,695,993
Percent Change 2005-2020 -6% 5%
Physicians per 100,000 Population
7.06.76.56.3
-10% Psychiatry Psychiatrists were forecast to grow by less than 1 percent between 2005 and 2020, well below the overall predicted growth among non-primary care physicians, with the number of active Psychiatrists predicted to barely increase from 1,357 in 2005 to 1,362 in 2020. Adjusting for the projected population growth in the state, the Psychiatrist to population ratio was predicted to decrease from 13.3 physicians per 100,000 population to 12.7 physicians per 100,000 population.

Michigan Physician Supply and Demand Through 2020 ES-8
Anesthesiology Anesthesiologists were forecast to grow by 17 percent between 2005 and 2020, well above the overall predicted growth among non-primary care physicians, with the number of active Anesthesiologists predicted to increase from 1,292 in 2005 to 1,506 in 2020. Adjusting for the projected population growth in the state, the Anesthesiologist to population ratio was predicted to increase from 12.7 physicians per 100,000 population to 14.1 physicians per 100,000 population. Radiology Radiologists were forecast to grow by 10 percent between 2005 and 2020, about the same as the overall predicted growth among non-primary care physicians, with the number of active Radiologists predicted to increase from 1,375 in 2005 to 1,511 in 2020. Adjusting for the projected population growth in the state, the Radiologist to population ratio was predicted to increase from 13.5 physicians per 100,000 population to 14.1 physicians per 100,000 population. Emergency Medicine Emergency Medicine physicians were forecast to grow by 31 percent between 2005 and 2020, far above the overall predicted growth among non-primary care physicians, with the number of active Emergency Medicine physicians predicted to increase from 1,655 in 2005 to 2,175 in 2020. Adjusting for the projected population growth in the state, the Emergency Medicine physician to population ratio was predicted to increase from 16.2 physicians per 100,000 population to 20.3 physicians per 100,000 population. Figure ES-5 – Michigan Non-Primary Care Physician Supply: Detailed Specialty Forecasts, 2005-2020
Psychiatry
Year Physicians Population2005 1,357 10,207,4212010 1,352 10,428,6832015 1,363 10,599,1222020 1,362 10,695,993
Percent Change 2005-2020 0% 5% -4%
Physicians per 100,000 Population
13.313.012.912.7
Anesthesiology
Year Physicians Population2005 1,292 10,207,4212010 1,376 10,428,6832015 1,448 10,599,1222020 1,506 10,695,993
Percent Change 2005-2020 17% 5%
14.1
11%
Physicians per 100,000 Population
12.713.213.7
Radiology
Year Physicians Population2005 1,375 10,207,4212010 1,440 10,428,6832015 1,478 10,599,1222020 1,511 10,695,993
Percent Change 2005-2020 10% 5%
13.513.813.914.1
5%
Physicians per 100,000 Population
Emergency Medicine
Year Physicians Population2005 1,655 10,207,4212010 1,841 10,428,6832015 2,020 10,599,1222020 2,175 10,695,993
Percent Change 2005-2020 31% 5%
Physicians per 100,000 Population
16.217.719.120.3
25% General Surgery General Surgeons were forecast to grow by 3 percent between 2005 and 2020, somewhat below the overall predicted growth among non-primary care physicians, with the number of active General Surgeons predicted to only increase from 1,648 in 2005 to 1,695 in 2020. Adjusting for

Michigan Physician Supply and Demand Through 2020 ES-9
the projected population growth in the state, the General Surgeons to population ratio was predicted to decrease from 16.1 physicians per 100,000 population to 15.8 physicians per 100,000 population. Ophthalmology Ophthalmologists were forecast to contract by 1 percent between 2005 and 2020, unlike the overall predicted growth among non-primary care physicians, with the number of active Ophthalmologists predicted to decrease from 668 in 2005 to 663 in 2020. Adjusting for the projected population growth in the state, the Ophthalmologist to population ratio was predicted to decrease from 6.5 physicians per 100,000 population to 6.2 physicians per 100,000 population. Otolaryngology Otolaryngologists were forecast to grow by only 3 percent between 2005 and 2020, somewhat below the overall predicted growth among non-primary care physicians, with the number of active Otolaryngologists predicted to increase from 317 in 2005 to 328 in 2020. Adjusting for the projected population growth in the state, the Otolaryngologist to population ratio was predicted to remain about the same at 3.1 physicians per 100,000 population throughout the forecast period. Orthopedic Surgery Orthopedic Surgeons were forecast to grow by 3 percent between 2005 and 2020, somewhat below the overall predicted growth among non-primary care physicians, with the number of active Orthopedic Surgeons predicted to increase from 844 in 2005 to 872 in 2020. Adjusting for the projected population growth in the state, the Orthopedic Surgeon to population ratio was predicted to decrease very slightly from 8.3 physicians per 100,000 population to 8.2 physicians per 100,000 population. Figure ES-6 – Michigan Non-Primary Care Physician Supply: Detailed Specialty Forecasts, 2005-2020
General Surgery
Year Physicians Population2005 1,648 10,207,4212010 1,681 10,428,6832015 1,686 10,599,1222020 1,695 10,695,993
Percent Change 2005-2020 3% 5% -2%
Physicians per 100,000 Population
16.116.115.915.8
Ophthalmology
Year Physicians Population2005 668 10,207,4212010 671 10,428,6832015 662 10,599,1222020 663 10,695,993
Percent Change 2005-2020 -1% 5%
6.2
-5%
Physicians per 100,000 Population
6.56.46.3
Otolaryngology
Year Physicians Population2005 317 10,207,4212010 320 10,428,6832015 325 10,599,1222020 328 10,695,993
Percent Change 2005-2020 3% 5%
3.13.1
-1%
Physicians per 100,000 Population
3.13.1
Orthopedic Surgery
Year Physicians Population2005 844 10,207,4212010 857 10,428,6832015 866 10,599,1222020 872 10,695,993
Percent Change 2005-2020 3% 5%
Physicians per 100,000 Population
8.38.28.28.2
-1%
Michigan Physician Supply and Demand Through 2020 ES-10
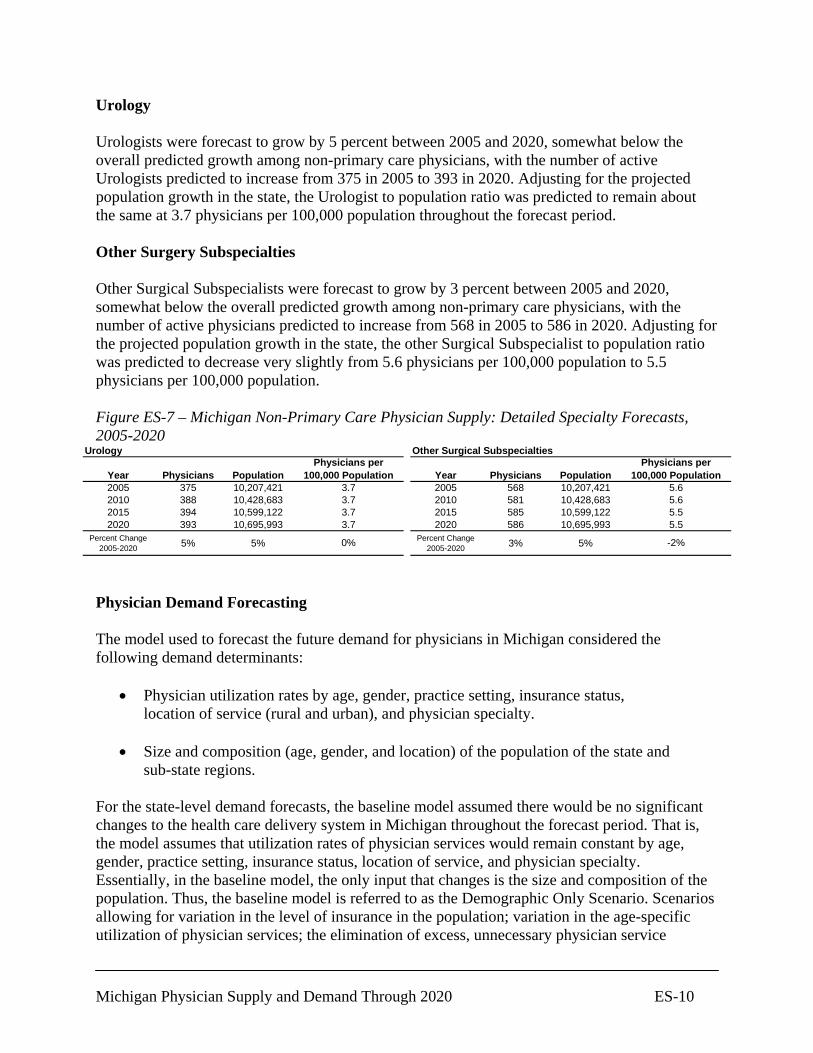
Urology Urologists were forecast to grow by 5 percent between 2005 and 2020, somewhat below the overall predicted growth among non-primary care physicians, with the number of active Urologists predicted to increase from 375 in 2005 to 393 in 2020. Adjusting for the projected population growth in the state, the Urologist to population ratio was predicted to remain about the same at 3.7 physicians per 100,000 population throughout the forecast period. Other Surgery Subspecialties Other Surgical Subspecialists were forecast to grow by 3 percent between 2005 and 2020, somewhat below the overall predicted growth among non-primary care physicians, with the number of active physicians predicted to increase from 568 in 2005 to 586 in 2020. Adjusting for the projected population growth in the state, the other Surgical Subspecialist to population ratio was predicted to decrease very slightly from 5.6 physicians per 100,000 population to 5.5 physicians per 100,000 population. Figure ES-7 – Michigan Non-Primary Care Physician Supply: Detailed Specialty Forecasts, 2005-2020
Urology
Year Physicians Population2005 375 10,207,4212010 388 10,428,6832015 394 10,599,1222020 393 10,695,993
Percent Change 2005-2020 5% 5% 0%
Physicians per 100,000 Population
3.73.73.73.7
Other Surgical Subspecialties
Year Physicians Population2005 568 10,207,4212010 581 10,428,6832015 585 10,599,1222020 586 10,695,993
Percent Change 2005-2020 3% 5%
5.5
-2%
Physicians per 100,000 Population
5.65.65.5
Physician Demand Forecasting The model used to forecast the future demand for physicians in Michigan considered the following demand determinants:
• Physician utilization rates by age, gender, practice setting, insurance status, location of service (rural and urban), and physician specialty.
• Size and composition (age, gender, and location) of the population of the state and
sub-state regions. For the state-level demand forecasts, the baseline model assumed there would be no significant changes to the health care delivery system in Michigan throughout the forecast period. That is, the model assumes that utilization rates of physician services would remain constant by age, gender, practice setting, insurance status, location of service, and physician specialty. Essentially, in the baseline model, the only input that changes is the size and composition of the population. Thus, the baseline model is referred to as the Demographic Only Scenario. Scenarios allowing for variation in the level of insurance in the population; variation in the age-specific utilization of physician services; the elimination of excess, unnecessary physician service
Michigan Physician Supply and Demand Through 2020 ES-11
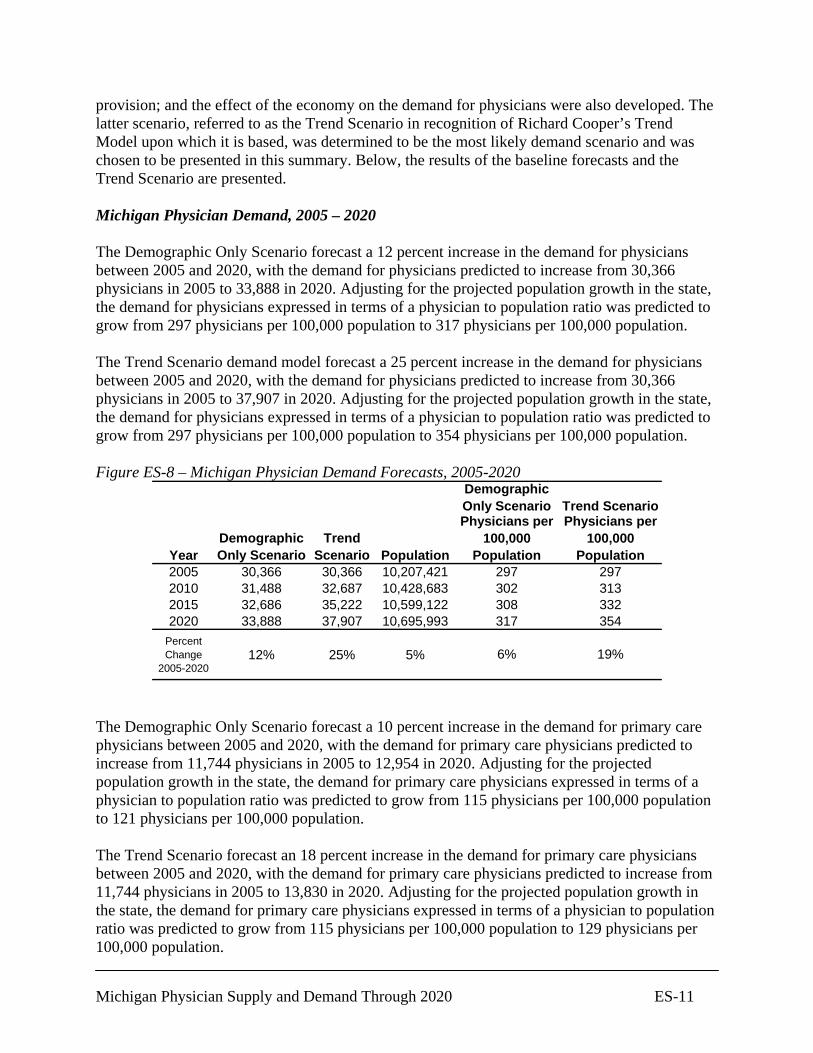
provision; and the effect of the economy on the demand for physicians were also developed. The latter scenario, referred to as the Trend Scenario in recognition of Richard Cooper’s Trend Model upon which it is based, was determined to be the most likely demand scenario and was chosen to be presented in this summary. Below, the results of the baseline forecasts and the Trend Scenario are presented. Michigan Physician Demand, 2005 – 2020 The Demographic Only Scenario forecast a 12 percent increase in the demand for physicians between 2005 and 2020, with the demand for physicians predicted to increase from 30,366 physicians in 2005 to 33,888 in 2020. Adjusting for the projected population growth in the state, the demand for physicians expressed in terms of a physician to population ratio was predicted to grow from 297 physicians per 100,000 population to 317 physicians per 100,000 population. The Trend Scenario demand model forecast a 25 percent increase in the demand for physicians between 2005 and 2020, with the demand for physicians predicted to increase from 30,366 physicians in 2005 to 37,907 in 2020. Adjusting for the projected population growth in the state, the demand for physicians expressed in terms of a physician to population ratio was predicted to grow from 297 physicians per 100,000 population to 354 physicians per 100,000 population. Figure ES-8 – Michigan Physician Demand Forecasts, 2005-2020
YearDemographic Only Scenario
Trend Scenario Population
2005 30,366 30,366 10,207,4212010 31,488 32,687 10,428,6832015 32,686 35,222 10,599,1222020 33,888 37,907 10,695,993
Percent Change
2005-202012% 25% 5%
297302308317 354
19%
Demographic Only Scenario Trend Scenario
Physicians per 100,000
Population297313332
6%
Physicians per 100,000
Population
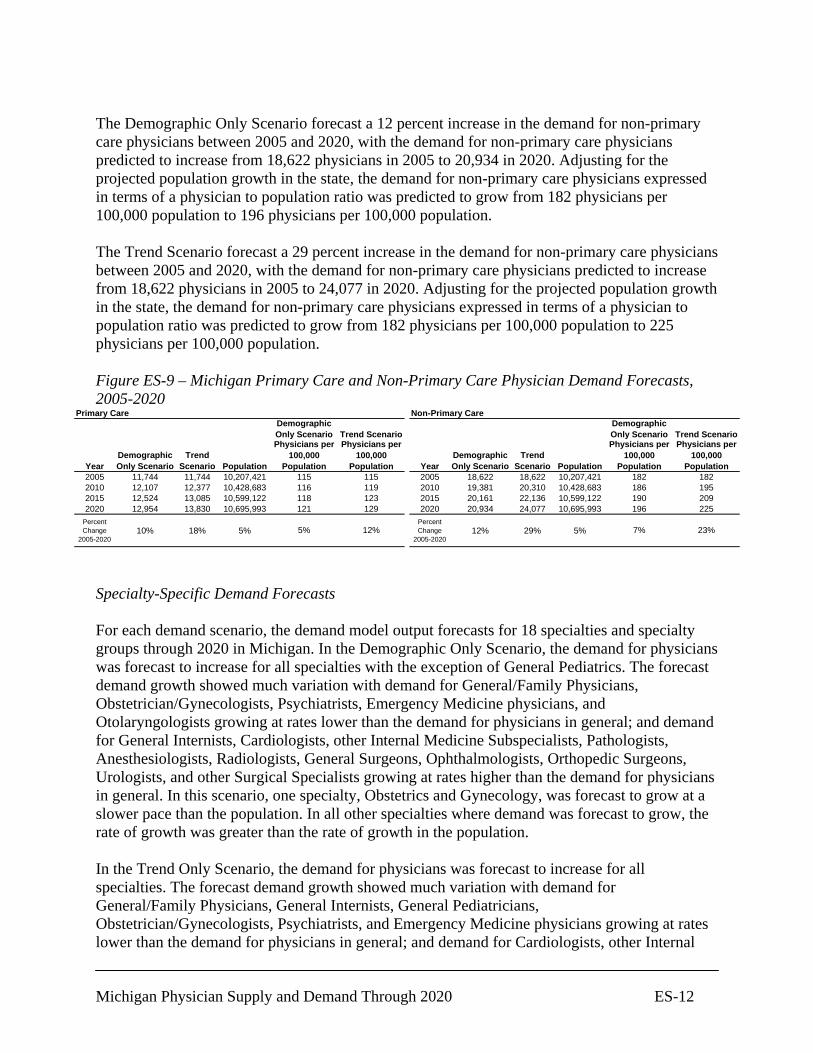
The Demographic Only Scenario forecast a 10 percent increase in the demand for primary care physicians between 2005 and 2020, with the demand for primary care physicians predicted to increase from 11,744 physicians in 2005 to 12,954 in 2020. Adjusting for the projected population growth in the state, the demand for primary care physicians expressed in terms of a physician to population ratio was predicted to grow from 115 physicians per 100,000 population to 121 physicians per 100,000 population. The Trend Scenario forecast an 18 percent increase in the demand for primary care physicians between 2005 and 2020, with the demand for primary care physicians predicted to increase from 11,744 physicians in 2005 to 13,830 in 2020. Adjusting for the projected population growth in the state, the demand for primary care physicians expressed in terms of a physician to population ratio was predicted to grow from 115 physicians per 100,000 population to 129 physicians per 100,000 population.
Michigan Physician Supply and Demand Through 2020 ES-12
The Demographic Only Scenario forecast a 12 percent increase in the demand for non-primary care physicians between 2005 and 2020, with the demand for non-primary care physicians predicted to increase from 18,622 physicians in 2005 to 20,934 in 2020. Adjusting for the projected population growth in the state, the demand for non-primary care physicians expressed in terms of a physician to population ratio was predicted to grow from 182 physicians per 100,000 population to 196 physicians per 100,000 population. The Trend Scenario forecast a 29 percent increase in the demand for non-primary care physicians between 2005 and 2020, with the demand for non-primary care physicians predicted to increase from 18,622 physicians in 2005 to 24,077 in 2020. Adjusting for the projected population growth in the state, the demand for non-primary care physicians expressed in terms of a physician to population ratio was predicted to grow from 182 physicians per 100,000 population to 225 physicians per 100,000 population. Figure ES-9 – Michigan Primary Care and Non-Primary Care Physician Demand Forecasts, 2005-2020
Primary Care
YearDemographic Only Scenario
Trend Scenario Population
2005 11,744 11,744 10,207,4212010 12,107 12,377 10,428,6832015 12,524 13,085 10,599,1222020 12,954 13,830 10,695,993
Percent Change
2005-202010% 18% 5%
129
12%
Demographic Only Scenario Trend Scenario
Physicians per 100,000
Population115119123
5%
Physicians per 100,000
Population115116118121
Non-Primary Care
YearDemographic Only Scenario
Trend Scenario Population
2005 18,622 18,622 10,207,4212010 19,381 20,310 10,428,6832015 20,161 22,136 10,599,1222020 20,934 24,077 10,695,993
Percent Change
2005-202012% 29% 5%
Demographic Only Scenario Trend ScenarioPhysicians per
100,000 Population
Physicians per 100,000
Population182 182186 195
7% 23%
190 209196 225
Specialty-Specific Demand Forecasts For each demand scenario, the demand model output forecasts for 18 specialties and specialty groups through 2020 in Michigan. In the Demographic Only Scenario, the demand for physicians was forecast to increase for all specialties with the exception of General Pediatrics. The forecast demand growth showed much variation with demand for General/Family Physicians, Obstetrician/Gynecologists, Psychiatrists, Emergency Medicine physicians, and Otolaryngologists growing at rates lower than the demand for physicians in general; and demand for General Internists, Cardiologists, other Internal Medicine Subspecialists, Pathologists, Anesthesiologists, Radiologists, General Surgeons, Ophthalmologists, Orthopedic Surgeons, Urologists, and other Surgical Specialists growing at rates higher than the demand for physicians in general. In this scenario, one specialty, Obstetrics and Gynecology, was forecast to grow at a slower pace than the population. In all other specialties where demand was forecast to grow, the rate of growth was greater than the rate of growth in the population. In the Trend Only Scenario, the demand for physicians was forecast to increase for all specialties. The forecast demand growth showed much variation with demand for General/Family Physicians, General Internists, General Pediatricians, Obstetrician/Gynecologists, Psychiatrists, and Emergency Medicine physicians growing at rates lower than the demand for physicians in general; and demand for Cardiologists, other Internal
Michigan Physician Supply and Demand Through 2020 ES-13
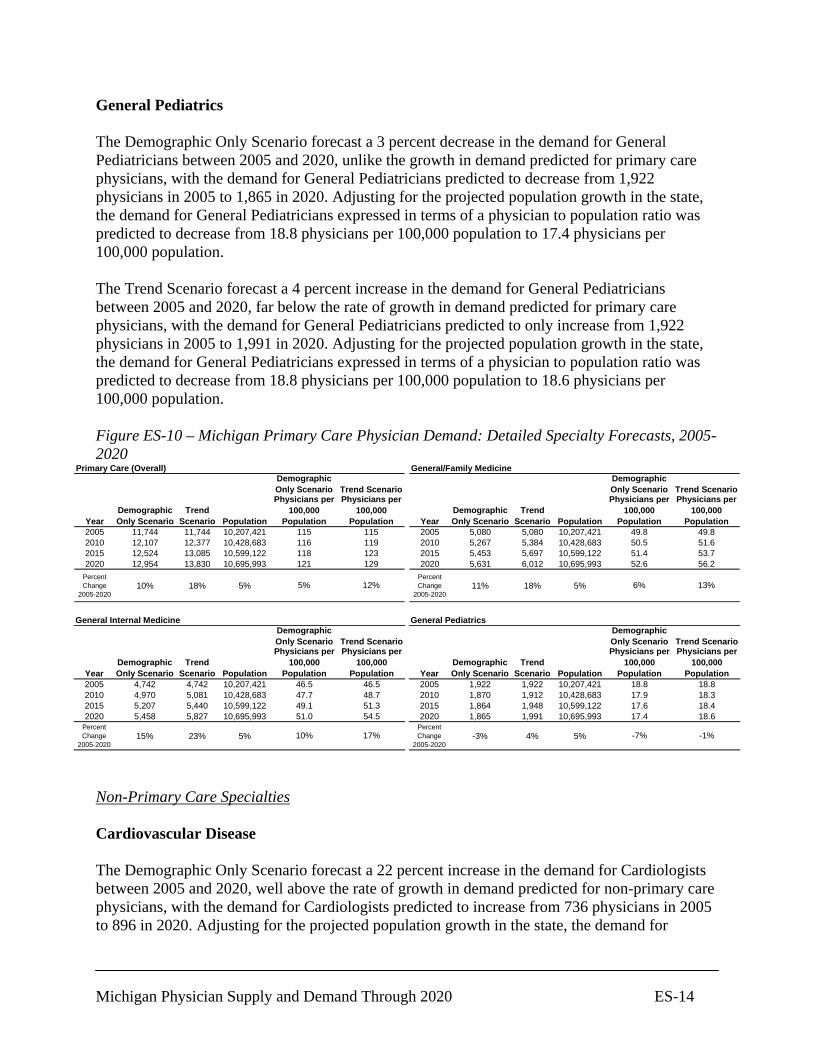
Medicine Subspecialists, Pathologists, Anesthesiologists, Radiologists, General Surgeons, Ophthalmologists, Orthopedic Surgeons, Otolaryngologists, Urologists, and other Surgical Specialists growing at rates higher than the demand for physicians in general. In this scenario, one specialty, Pediatrics, was forecast to grow at a slower pace than the population. In all other specialties where demand was forecast to grow, the rate of growth was greater than the rate of growth in the population. Primary Care Specialties General/Family Medicine The Demographic Only Scenario forecast an 11 percent increase in the demand for General/Family Physicians between 2005 and 2020, slightly above the level of growth in demand predicted for primary care physicians, with the demand for General/Family Physicians predicted to increase from 5,080 physicians in 2005 to 5,631 in 2020. Adjusting for the projected population growth in the state, the demand for General/Family Physicians expressed in terms of a physician to population ratio was predicted to grow from 49.8 physicians per 100,000 population to 52.6 physicians per 100,000 population. The Trend Scenario forecast an 18 percent increase in the demand for General/Family Physicians between 2005 and 2020, about the same rate of growth in demand predicted for primary care physicians, with the demand for General/Family Physicians predicted to increase from 5,080 physicians in 2005 to 6,012 in 2020. Adjusting for the projected population growth in the state, the demand for General/Family Physicians expressed in terms of a physician to population ratio was predicted to grow from 49.8 physicians per 100,000 population to 56.2 physicians per 100,000 population. General Internal Medicine The Demographic Only Scenario forecast a 15 percent increase in the demand for General Internists between 2005 and 2020, somewhat above the level of growth in demand predicted for primary care physicians, with the demand for General Internists predicted to increase from 4,742 physicians in 2005 to 5,458 in 2020. Adjusting for the projected population growth in the state, the demand for General Internists expressed in terms of a physician to population ratio was predicted to grow from 46.5 physicians per 100,000 population to 51.0 physicians per 100,000 population. The Trend Scenario forecast a 23 percent increase in the demand for General Internists between 2005 and 2020, somewhat above the rate of growth in demand predicted for primary care physicians, with the demand for General Internists predicted to increase from 4,742 physicians in 2005 to 5,827 in 2020. Adjusting for the projected population growth in the state, the demand for General Internists expressed in terms of a physician to population ratio was predicted to grow from 46.5 physicians per 100,000 population to 54.5 physicians per 100,000 population.
Michigan Physician Supply and Demand Through 2020 ES-14
General Pediatrics The Demographic Only Scenario forecast a 3 percent decrease in the demand for General Pediatricians between 2005 and 2020, unlike the growth in demand predicted for primary care physicians, with the demand for General Pediatricians predicted to decrease from 1,922 physicians in 2005 to 1,865 in 2020. Adjusting for the projected population growth in the state, the demand for General Pediatricians expressed in terms of a physician to population ratio was predicted to decrease from 18.8 physicians per 100,000 population to 17.4 physicians per 100,000 population. The Trend Scenario forecast a 4 percent increase in the demand for General Pediatricians between 2005 and 2020, far below the rate of growth in demand predicted for primary care physicians, with the demand for General Pediatricians predicted to only increase from 1,922 physicians in 2005 to 1,991 in 2020. Adjusting for the projected population growth in the state, the demand for General Pediatricians expressed in terms of a physician to population ratio was predicted to decrease from 18.8 physicians per 100,000 population to 18.6 physicians per 100,000 population. Figure ES-10 – Michigan Primary Care Physician Demand: Detailed Specialty Forecasts, 2005-2020
Primary Care (Overall)
YearDemographic Only Scenario
Trend Scenario Population
2005 11,744 11,744 10,207,4212010 12,107 12,377 10,428,6832015 12,524 13,085 10,599,1222020 12,954 13,830 10,695,993
Percent Change
2005-202010% 18% 5%
115116118121 129
12%
Demographic Only Scenario Trend Scenario
Physicians per 100,000
Population115119123
5%
Physicians per 100,000
Population
General/Family Medicine
YearDemographic Only Scenario
Trend Scenario Population
2005 5,080 5,080 10,207,4212010 5,267 5,384 10,428,6832015 5,453 5,697 10,599,1222020 5,631 6,012 10,695,993
Percent Change
2005-202011% 18% 5% 6% 13%
51.4 53.752.6 56.2
49.8 49.850.5 51.6
Demographic Only Scenario Trend ScenarioPhysicians per
100,000 Population
Physicians per 100,000
Population
General Internal Medicine
YearDemographic Only Scenario
Trend Scenario Population
2005 4,742 4,742 10,207,4212010 4,970 5,081 10,428,6832015 5,207 5,440 10,599,1222020 5,458 5,827 10,695,993
Percent Change
2005-202015% 23% 5%
Demographic Only Scenario Trend ScenarioPhysicians per
100,000 Population
Physicians per 100,000
Population46.5 46.547.7 48.749.1 51.351.0 54.5
10% 17%
General Pediatrics
YearDemographic Only Scenario
Trend Scenario Population
2005 1,922 1,922 10,207,4212010 1,870 1,912 10,428,6832015 1,864 1,948 10,599,1222020 1,865 1,991 10,695,993
Percent Change
2005-2020-3% 4% 5%
Demographic Only Scenario Trend ScenarioPhysicians per
100,000 Population
Physicians per 100,000
Population18.8 18.817.9 18.3
-7% -1%
17.6 18.417.4 18.6
Non-Primary Care Specialties Cardiovascular Disease The Demographic Only Scenario forecast a 22 percent increase in the demand for Cardiologists between 2005 and 2020, well above the rate of growth in demand predicted for non-primary care physicians, with the demand for Cardiologists predicted to increase from 736 physicians in 2005 to 896 in 2020. Adjusting for the projected population growth in the state, the demand for

Michigan Physician Supply and Demand Through 2020 ES-15
Cardiologists expressed in terms of a physician to population ratio was predicted to increase from 7.2 physicians per 100,000 population to 8.4 physicians per 100,000 population. The Trend Scenario forecast a 40 percent increase in the demand for Cardiologists between 2005 and 2020, well above the rate of growth in demand predicted for non-primary care physicians, with the demand for Cardiologists predicted to increase from 736 physicians in 2005 to 1,031 in 2020. Adjusting for the projected population growth in the state, the demand for Cardiologists expressed in terms of a physician to population ratio was predicted to increase from 7.2 physicians per 100,000 population to 9.6 physicians per 100,000 population. Other Internal Medicine Subspecialties The Demographic Only Scenario forecast a 17 percent increase in the demand for other Internal Medicine Subspecialists between 2005 and 2020, somewhat above the rate of growth in demand predicted for non-primary care physicians, with the demand for other Internal Medicine Subspecialists predicted to increase from 2,970 physicians in 2005 to 3,470 in 2020. Adjusting for the projected population growth in the state, the demand for other Internal Medicine Subspecialists expressed in terms of a physician to population ratio was predicted to increase from 29.1 physicians per 100,000 population to 32.4 physicians per 100,000 population. The Trend Scenario forecast a 34 percent increase in the demand for other Internal Medicine Subspecialists between 2005 and 2020, somewhat above the rate of growth in demand predicted for non-primary care physicians, with the demand for other Internal Medicine Subspecialists predicted to increase from 2,970 physicians in 2005 to 3,991 in 2020. Adjusting for the projected population growth in the state, the demand for other Internal Medicine Subspecialists expressed in terms of a physician to population ratio was predicted to increase from 29.1 physicians per 100,000 population to 37.3 physicians per 100,000 population. Obstetrics and Gynecology The Demographic Only Scenario forecast a 1 percent increase in the demand for Obstetrician/Gynecologists between 2005 and 2020, well below the rate of growth in demand predicted for non-primary care physicians, with the demand for Obstetrician/Gynecologists predicted to slightly increase from 1,712 physicians in 2005 to 1,725 in 2020. Adjusting for the projected population growth in the state, the demand for Obstetrician/Gynecologists expressed in terms of a physician to population ratio was predicted to decrease from 16.8 physicians per 100,000 population to 16.1 physicians per 100,000 population. The Trend Scenario forecast a 16 percent increase in the demand for Obstetrician/Gynecologists between 2005 and 2020, well below the rate of growth in demand predicted for non-primary care physicians, with the demand for Obstetrician/Gynecologists predicted to increase from 1,712 physicians in 2005 to 1,984 in 2020. Adjusting for the projected population growth in the state, the demand for Obstetrician/Gynecologists expressed in terms of a physician to population ratio was predicted to increase from 16.8 physicians per 100,000 population to 18.6 physicians per 100,000 population.

Michigan Physician Supply and Demand Through 2020 ES-16
Pathology The Demographic Only Scenario forecast a 13 percent increase in the demand for Pathologists between 2005 and 2020, slightly above the rate of growth in demand predicted for non-primary care physicians, with the demand for Pathologists predicted to increase from 717 physicians in 2005 to 809 in 2020. Adjusting for the projected population growth in the state, the demand for Pathologists expressed in terms of a physician to population ratio was predicted to increase slightly from 7.0 physicians per 100,000 population to 7.6 physicians per 100,000 population. The Trend Scenario forecast a 30 percent increase in the demand for Pathologists between 2005 and 2020, slightly above the rate of growth in demand predicted for non-primary care physicians, with the demand for Pathologists predicted to increase from 717 physicians in 2005 to 931 in 2020. Adjusting for the projected population growth in the state, the demand for Pathologists expressed in terms of a physician to population ratio was predicted to increase from 7.0 physicians per 100,000 population to 8.7 physicians per 100,000 population. Figure ES-11 – Michigan Non-Primary Care Physician Demand: Detailed Specialty Forecasts, 2005-2020
Cardiology
YearDemographic Only Scenario
Trend Scenario Population
2005 736 736 10,207,4212010 780 817 10,428,6832015 835 917 10,599,1222020 896 1,031 10,695,993
Percent Change
2005-202022% 40% 5%
9.6
34%
Demographic Only Scenario Trend Scenario
Physicians per 100,000
Population7.27.88.6
16%
Physicians per 100,000
Population7.27.57.98.4
Other Internal Medicine Subspecialties
YearDemographic Only Scenario
Trend Scenario Population
2005 2,970 2,970 10,207,4212010 3,128 3,277 10,428,6832015 3,298 3,308 10,599,1222020 3,470 3,991 10,695,993
Percent Change
2005-202017% 34% 5%
Demographic Only Scenario Trend ScenarioPhysicians per
100,000 Population
Physicians per 100,000
Population29.1 29.130.0 31.4
12% 28%
31.1 31.232.4 37.3
Obstetrics and Gynecology
YearDemographic Only Scenario
Trend Scenario Population
2005 1,712 1,712 10,207,4212010 1,740 1,824 10,428,6832015 1,742 1,912 10,599,1222020 1,725 1,984 10,695,993
Percent Change
2005-20201% 16% 5% -4% 11%
16.4 18.016.1 18.6
16.8 16.816.7 17.5
Demographic Only Scenario Trend ScenarioPhysicians per
100,000 Population
Physicians per 100,000
Population
Pathology
YearDemographic Only Scenario
Trend Scenario Population
2005 717 717 10,207,4212010 750 786 10,428,6832015 781 857 10,599,1222020 809 931 10,695,993
Percent Change
2005-202013% 30% 5% 8% 24%
7.4 8.17.6 8.7
Demographic Only Scenario Trend ScenarioPhysicians per
100,000 Population
Physicians per 100,000
Population7.0 7.07.2 7.5
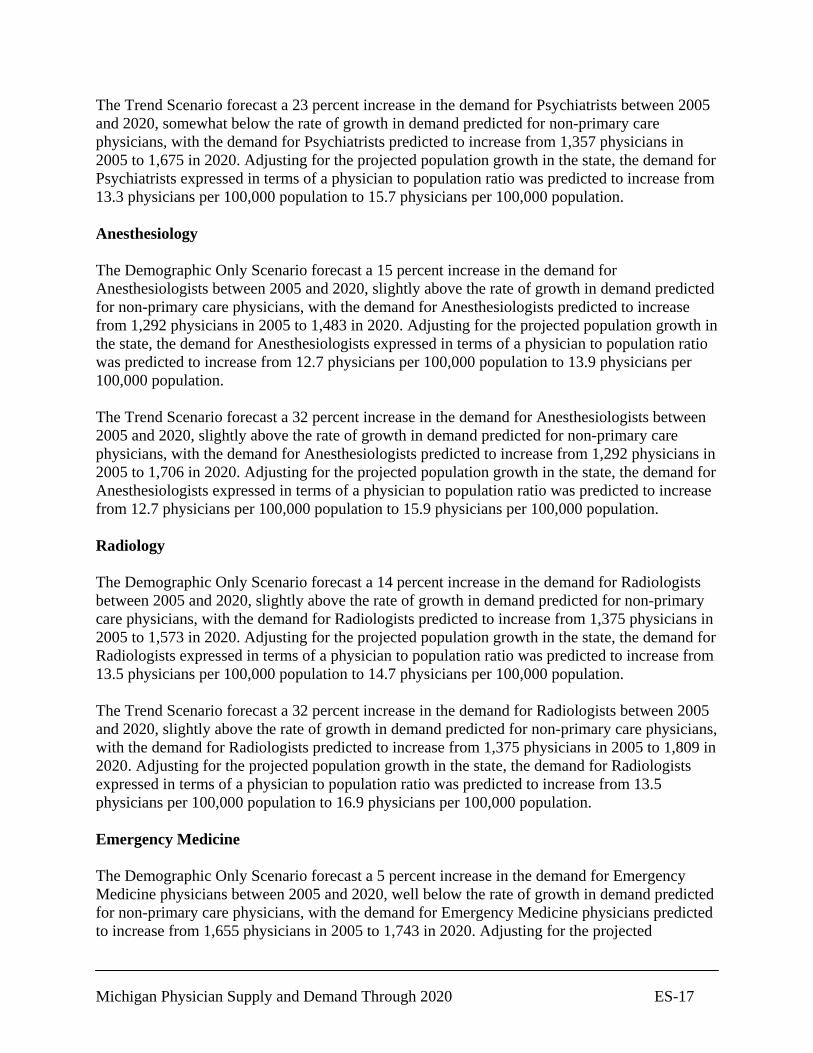
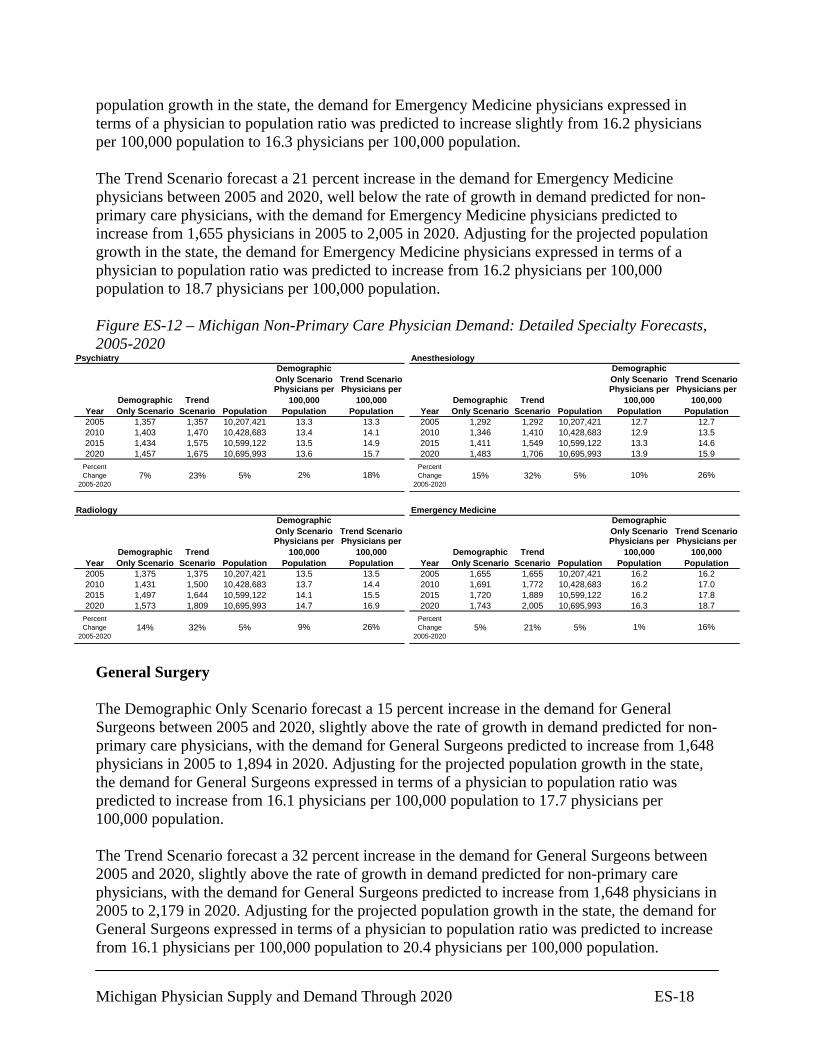
Psychiatry The Demographic Only Scenario forecast a 7 percent increase in the demand for Psychiatrists between 2005 and 2020, somewhat below the rate of growth in demand predicted for non-primary care physicians, with the demand for Psychiatrists predicted to increase from 1,357 physicians in 2005 to 1,457 in 2020. Adjusting for the projected population growth in the state, the demand for Psychiatrists expressed in terms of a physician to population ratio was predicted to increase slightly from 13.3 physicians per 100,000 population to 13.6 physicians per 100,000 population.
Michigan Physician Supply and Demand Through 2020 ES-17
The Trend Scenario forecast a 23 percent increase in the demand for Psychiatrists between 2005 and 2020, somewhat below the rate of growth in demand predicted for non-primary care physicians, with the demand for Psychiatrists predicted to increase from 1,357 physicians in 2005 to 1,675 in 2020. Adjusting for the projected population growth in the state, the demand for Psychiatrists expressed in terms of a physician to population ratio was predicted to increase from 13.3 physicians per 100,000 population to 15.7 physicians per 100,000 population. Anesthesiology The Demographic Only Scenario forecast a 15 percent increase in the demand for Anesthesiologists between 2005 and 2020, slightly above the rate of growth in demand predicted for non-primary care physicians, with the demand for Anesthesiologists predicted to increase from 1,292 physicians in 2005 to 1,483 in 2020. Adjusting for the projected population growth in the state, the demand for Anesthesiologists expressed in terms of a physician to population ratio was predicted to increase from 12.7 physicians per 100,000 population to 13.9 physicians per 100,000 population. The Trend Scenario forecast a 32 percent increase in the demand for Anesthesiologists between 2005 and 2020, slightly above the rate of growth in demand predicted for non-primary care physicians, with the demand for Anesthesiologists predicted to increase from 1,292 physicians in 2005 to 1,706 in 2020. Adjusting for the projected population growth in the state, the demand for Anesthesiologists expressed in terms of a physician to population ratio was predicted to increase from 12.7 physicians per 100,000 population to 15.9 physicians per 100,000 population. Radiology The Demographic Only Scenario forecast a 14 percent increase in the demand for Radiologists between 2005 and 2020, slightly above the rate of growth in demand predicted for non-primary care physicians, with the demand for Radiologists predicted to increase from 1,375 physicians in 2005 to 1,573 in 2020. Adjusting for the projected population growth in the state, the demand for Radiologists expressed in terms of a physician to population ratio was predicted to increase from 13.5 physicians per 100,000 population to 14.7 physicians per 100,000 population. The Trend Scenario forecast a 32 percent increase in the demand for Radiologists between 2005 and 2020, slightly above the rate of growth in demand predicted for non-primary care physicians, with the demand for Radiologists predicted to increase from 1,375 physicians in 2005 to 1,809 in 2020. Adjusting for the projected population growth in the state, the demand for Radiologists expressed in terms of a physician to population ratio was predicted to increase from 13.5 physicians per 100,000 population to 16.9 physicians per 100,000 population. Emergency Medicine The Demographic Only Scenario forecast a 5 percent increase in the demand for Emergency Medicine physicians between 2005 and 2020, well below the rate of growth in demand predicted for non-primary care physicians, with the demand for Emergency Medicine physicians predicted to increase from 1,655 physicians in 2005 to 1,743 in 2020. Adjusting for the projected
Michigan Physician Supply and Demand Through 2020 ES-18
population growth in the state, the demand for Emergency Medicine physicians expressed in terms of a physician to population ratio was predicted to increase slightly from 16.2 physicians per 100,000 population to 16.3 physicians per 100,000 population. The Trend Scenario forecast a 21 percent increase in the demand for Emergency Medicine physicians between 2005 and 2020, well below the rate of growth in demand predicted for non-primary care physicians, with the demand for Emergency Medicine physicians predicted to increase from 1,655 physicians in 2005 to 2,005 in 2020. Adjusting for the projected population growth in the state, the demand for Emergency Medicine physicians expressed in terms of a physician to population ratio was predicted to increase from 16.2 physicians per 100,000 population to 18.7 physicians per 100,000 population. Figure ES-12 – Michigan Non-Primary Care Physician Demand: Detailed Specialty Forecasts, 2005-2020
Psychiatry
YearDemographic Only Scenario
Trend Scenario Population
2005 1,357 1,357 10,207,4212010 1,403 1,470 10,428,6832015 1,434 1,575 10,599,1222020 1,457 1,675 10,695,993
Percent Change
2005-20207% 23% 5%
13.313.413.513.6 15.7
18%
Demographic Only Scenario Trend Scenario
Physicians per 100,000
Population13.314.114.9
2%
Physicians per 100,000
Population
Anesthesiology
YearDemographic Only Scenario
Trend Scenario Population
2005 1,292 1,292 10,207,4212010 1,346 1,410 10,428,6832015 1,411 1,549 10,599,1222020 1,483 1,706 10,695,993
Percent Change
2005-202015% 32% 5% 10% 26%
13.3 14.613.9 15.9
12.7 12.712.9 13.5
Demographic Only Scenario Trend ScenarioPhysicians per
100,000 Population
Physicians per 100,000
Population
Radiology
YearDemographic Only Scenario
Trend Scenario Population
2005 1,375 1,375 10,207,4212010 1,431 1,500 10,428,6832015 1,497 1,644 10,599,1222020 1,573 1,809 10,695,993
Percent Change
2005-202014% 32% 5%
Demographic Only Scenario Trend ScenarioPhysicians per
100,000 Population
Physicians per 100,000
Population13.5 13.513.7 14.414.1 15.514.7 16.9
9% 26%
Emergency Medicine
YearDemographic Only Scenario
Trend Scenario Population
2005 1,655 1,655 10,207,4212010 1,691 1,772 10,428,6832015 1,720 1,889 10,599,1222020 1,743 2,005 10,695,993
Percent Change
2005-20205% 21% 5%
Demographic Only Scenario Trend ScenarioPhysicians per
100,000 Population
Physicians per 100,000
Population16.2 16.216.2 17.0
1% 16%
16.2 17.816.3 18.7
General Surgery The Demographic Only Scenario forecast a 15 percent increase in the demand for General Surgeons between 2005 and 2020, slightly above the rate of growth in demand predicted for non-primary care physicians, with the demand for General Surgeons predicted to increase from 1,648 physicians in 2005 to 1,894 in 2020. Adjusting for the projected population growth in the state, the demand for General Surgeons expressed in terms of a physician to population ratio was predicted to increase from 16.1 physicians per 100,000 population to 17.7 physicians per 100,000 population. The Trend Scenario forecast a 32 percent increase in the demand for General Surgeons between 2005 and 2020, slightly above the rate of growth in demand predicted for non-primary care physicians, with the demand for General Surgeons predicted to increase from 1,648 physicians in 2005 to 2,179 in 2020. Adjusting for the projected population growth in the state, the demand for General Surgeons expressed in terms of a physician to population ratio was predicted to increase from 16.1 physicians per 100,000 population to 20.4 physicians per 100,000 population.

Michigan Physician Supply and Demand Through 2020 ES-19
Ophthalmology The Demographic Only Scenario forecast an 18 percent increase in the demand for Ophthalmologists between 2005 and 2020, somewhat above the rate of growth in demand predicted for non-primary care physicians, with the demand for Ophthalmologists predicted to increase from 668 physicians in 2005 to 786 in 2020. Adjusting for the projected population growth in the state, the demand for Ophthalmologists expressed in terms of a physician to population ratio was predicted to increase from 6.5 physicians per 100,000 population to 7.3 physicians per 100,000 population. The Trend Scenario forecast a 35 percent increase in the demand for Ophthalmologists between 2005 and 2020, somewhat above the rate of growth in demand predicted for non-primary care physicians, with the demand for Ophthalmologists predicted to increase from 668 physicians in 2005 to 904 in 2020. Adjusting for the projected population growth in the state, the demand for Ophthalmologists expressed in terms of a physician to population ratio was predicted to increase from 6.5 physicians per 100,000 population to 8.5 physicians per 100,000 population. Otolaryngology The Demographic Only Scenario forecast a 9 percent increase in the demand for Otolaryngologists between 2005 and 2020, slightly below the rate of growth in demand predicted for non-primary care physicians, with the demand for Otolaryngologists predicted to increase from 317 physicians in 2005 to 347 in 2020. Adjusting for the projected population growth in the state, the demand for Otolaryngologists expressed in terms of a physician to population ratio was predicted to increase slightly from 3.1 physicians per 100,000 population to 3.2 physicians per 100,000 population. The Trend Scenario forecast a 26 percent increase in the demand for Otolaryngologists between 2005 and 2020, slightly below the rate of growth in demand predicted for non-primary care physicians, with the demand for Otolaryngologists predicted to increase from 317 physicians in 2005 to 399 in 2020. Adjusting for the projected population growth in the state, the demand for Otolaryngologists expressed in terms of a physician to population ratio was predicted to increase from 3.1 physicians per 100,000 population to 3.7 physicians per 100,000 population. Orthopedic Surgery The Demographic Only Scenario forecast a 14 percent increase in the demand for Orthopedic Surgeons between 2005 and 2020, slightly above the rate of growth in demand predicted for non-primary care physicians, with the demand for Orthopedic Surgeons predicted to increase from 844 physicians in 2005 to 958 in 2020. Adjusting for the projected population growth in the state, the demand for Orthopedic Surgeons expressed in terms of a physician to population ratio was predicted to increase from 8.3 physicians per 100,000 population to 9.0 physicians per 100,000 population.
Michigan Physician Supply and Demand Through 2020 ES-20
The Trend Scenario forecast a 31 percent increase in the demand for Orthopedic Surgeons between 2005 and 2020, slightly above the rate of growth in demand predicted for non-primary care physicians, with the demand for Orthopedic Surgeons predicted to increase from 844 physicians in 2005 to 1,102 in 2020. Adjusting for the projected population growth in the state, the demand for Orthopedic Surgeons expressed in terms of a physician to population ratio was predicted to increase from 8.3 physicians per 100,000 population to 10.3 physicians per 100,000 population. Figure ES-13 – Michigan Non-Primary Care Physician Demand: Detailed Specialty Forecasts, 2005-2020
General Surgery
YearDemographic Only Scenario
Trend Scenario Population
2005 1,648 1,648 10,207,4212010 1,726 1,809 10,428,6832015 1,811 1,989 10,599,1222020 1,894 2,179 10,695,993
Percent Change
2005-202015% 32% 5%
20.4
26%
Demographic Only Scenario Trend Scenario
Physicians per 100,000
Population16.117.318.8
10%
Physicians per 100,000
Population16.116.617.117.7
Ophthalmology
YearDemographic Only Scenario
Trend Scenario Population
2005 668 668 10,207,4212010 701 734 10,428,6832015 741 814 10,599,1222020 786 904 10,695,993
Percent Change
2005-202018% 35% 5%
Demographic Only Scenario Trend ScenarioPhysicians per
100,000 Population
Physicians per 100,000
Population6.5 6.56.7 7.0
12% 29%
7.0 7.77.3 8.5
Otolaryngology
YearDemographic Only Scenario
Trend Scenario Population
2005 317 317 10,207,4212010 327 343 10,428,6832015 337 370 10,599,1222020 347 399 10,695,993
Percent Change
2005-20209% 26% 5% 4% 20%
3.2 3.53.2 3.7
3.1 3.13.1 3.3
Demographic Only Scenario Trend ScenarioPhysicians per
100,000 Population
Physicians per 100,000
Population
Orthopedic Surgery
YearDemographic Only Scenario
Trend Scenario Population
2005 844 844 10,207,4212010 878 921 10,428,6832015 917 1,007 10,599,1222020 958 1,102 10,695,993
Percent Change
2005-202014% 31% 5% 8% 25%
8.7 9.59.0 10.3
Demographic Only Scenario Trend ScenarioPhysicians per
100,000 Population
Physicians per 100,000
Population8.3 8.38.4 8.8
Urology The Demographic Only Scenario forecast a 19 percent increase in the demand for Urologists between 2005 and 2020, well above the rate of growth in demand predicted for non-primary care physicians, with the demand for Urologists predicted to increase from 375 physicians in 2005 to 445 in 2020. Adjusting for the projected population growth in the state, the demand for Urologists expressed in terms of a physician to population ratio was predicted to increase from 3.7 physicians per 100,000 population to 4.2 physicians per 100,000 population. The Trend Scenario forecast a 37 percent increase in the demand for Urologists between 2005 and 2020, well above the rate of growth in demand predicted for non-primary care physicians, with the demand for Urologists predicted to increase from 375 physicians in 2005 to 512 in 2020. Adjusting for the projected population growth in the state, the demand for Urologists expressed in terms of a physician to population ratio was predicted to increase from 3.7 physicians per 100,000 population to 4.8 physicians per 100,000 population. Other Surgical Specialties The Demographic Only Scenario forecast a 17 percent increase in the demand for other Surgical Subspecialists between 2005 and 2020, somewhat above the rate of growth in demand predicted

Michigan Physician Supply and Demand Through 2020 ES-21
for non-primary care physicians, with the demand for other Surgical Subspecialists predicted to increase from 568 physicians in 2005 to 662 in 2020. Adjusting for the projected population growth in the state, the demand for other Surgical Subspecialists expressed in terms of a physician to population ratio was predicted to increase from 5.6 physicians per 100,000 population to 6.2 physicians per 100,000 population. The Trend Scenario forecast a 34 percent increase in the demand for other Surgical Specialists between 2005 and 2020, somewhat above the rate of growth in demand predicted for non-primary care physicians, with the demand for other Surgical Subspecialists predicted to increase from 568 physicians in 2005 to 762 in 2020. Adjusting for the projected population growth in the state, the demand for other Surgical Subspecialists expressed in terms of a physician to population ratio was predicted to increase from 5.6 physicians per 100,000 population to 7.1 physicians per 100,000 population. Figure ES-14 – Michigan Non-Primary Care Physician Demand: Detailed Specialty Forecasts, 2005-2020
Urology
YearDemographic Only Scenario
Trend Scenario Population
2005 375 375 10,207,4212010 394 413 10,428,6832015 419 460 10,599,1222020 445 512 10,695,993
Percent Change
2005-202019% 37% 5%
3.73.84.04.2 4.8
30%
Demographic Only Scenario Trend Scenario
Physicians per 100,000
Population3.74.04.3
13%
Physicians per 100,000
Population
Other Surgical Subspecialties
YearDemographic Only Scenario
Trend Scenario Population
2005 568 568 10,207,4212010 598 627 10,428,6832015 631 693 10,599,1222020 662 762 10,695,993
Percent Change
2005-202017% 34% 5% 11% 28%
6.0 6.56.2 7.1
5.6 5.65.7 6.0
Demographic Only Scenario Trend ScenarioPhysicians per
100,000 Population
Physicians per 100,000
Population
Relationship between Physician Supply and Demand in Michigan in 2020 In order to clearly indicate the relationship between the projected physician supply and demand in Michigan in 2020, the results of the supply and demand projections are compared in a side-by-side fashion in this section. Figure ES-15 – Projected Difference Between Physician Supply and Demand in Michigan in 2020
Projected Difference in
2020
Projected Difference as a Percent of Demand in
2020
Projected Difference in
2020
Projected Difference as a Percent of Demand in
2020All Physicians -425 -1% -4,444 -12%
Demographic Only Scenario Trend Scenario
At the state level, physician demand was projected to grow at a faster pace than physician supply. In the Demographic Only Scenario forecast, demand growth outpaced supply growth by 2 percent, or 425 physicians by 2020. Expressed as a percentage of the number of physicians

Michigan Physician Supply and Demand Through 2020 ES-22
required to meet the demand for their services, the shortage predicted in the Demographic Only Scenario amounted to 1 percent in 2020. In the Trend Scenario, demand growth outpaced supply growth by 15 percent, or 4,444 physicians by 2020. Expressed as a percentage of the number of physicians required to meet the demand for their services, the shortage predicted in the Trend Scenario amounted to 12 percent in 2020. Figure ES-16 – Projected Difference Between Physician Supply and Demand in Michigan in 2020, Primary Care and Non-Primary Care Specialties
Projected Difference in
2020
Projected Difference as a Percent of Demand in
2020
Projected Difference in
2020
Projected Difference as a Percent of Demand in
2020Primary Care -65 -1% -941 -7%
Non-Primary Care -360 -2% -3,503 -15%
Demographic Only Scenario Trend Scenario
Primary care physician demand was also projected to grow at a faster pace than primary care physician supply. In the Demographic Only Scenario forecast, demand growth outpaced supply growth by less than 1percent, or 65 physicians by 2020. Expressed as a percentage of the number of physicians required to meet the demand for their services, the shortage predicted in the Demographic Only Scenario amounted to about 1 percent in 2020. In the Trend Scenario, demand growth outpaced supply growth by 8 percent, or 941 physicians by 2020. Expressed as a percentage of the number of physicians required to meet the demand for their services, the shortage predicted in the Trend Scenario amounted to 7 percent in 2020. Non-primary care physician demand was also projected to grow at a faster pace than non-primary care physician supply. In the Demographic Only Scenario forecast, demand growth outpaced supply growth by 2 percent, or 360 physicians by 2020. Expressed as a percentage of the number of physicians required to meet the demand for their services, the shortage predicted in the Demographic Only Scenario amounted to about 2 percent in 2020. In the Trend Scenario, demand growth outpaced supply growth by 19 percent, or 3,503 physicians by 2020. Expressed as a percentage of the number of physicians required to meet the demand for their services, the shortage predicted in the Trend Scenario amounted to 15 percent in 2020. Specialty-Specific Supply and Demand Relationships In the Demographic Only Scenario, demand was forecast to grow at a faster rate than supply in General/Family Medicine, Cardiology, Pathology, Psychiatry, Radiology, General Surgery, Ophthalmology, Otolaryngology, Orthopedic Surgery, Urology, and other Surgical Subspecialties. Thus, in these specialties, the Demographic Only Scenario forecasts suggested there would be a shortage of physicians in the state in 2020. The shortage was forecast to be most acute in Cardiology, Pathology, General Surgery, Ophthalmology, Urology, and other
Michigan Physician Supply and Demand Through 2020 ES-23
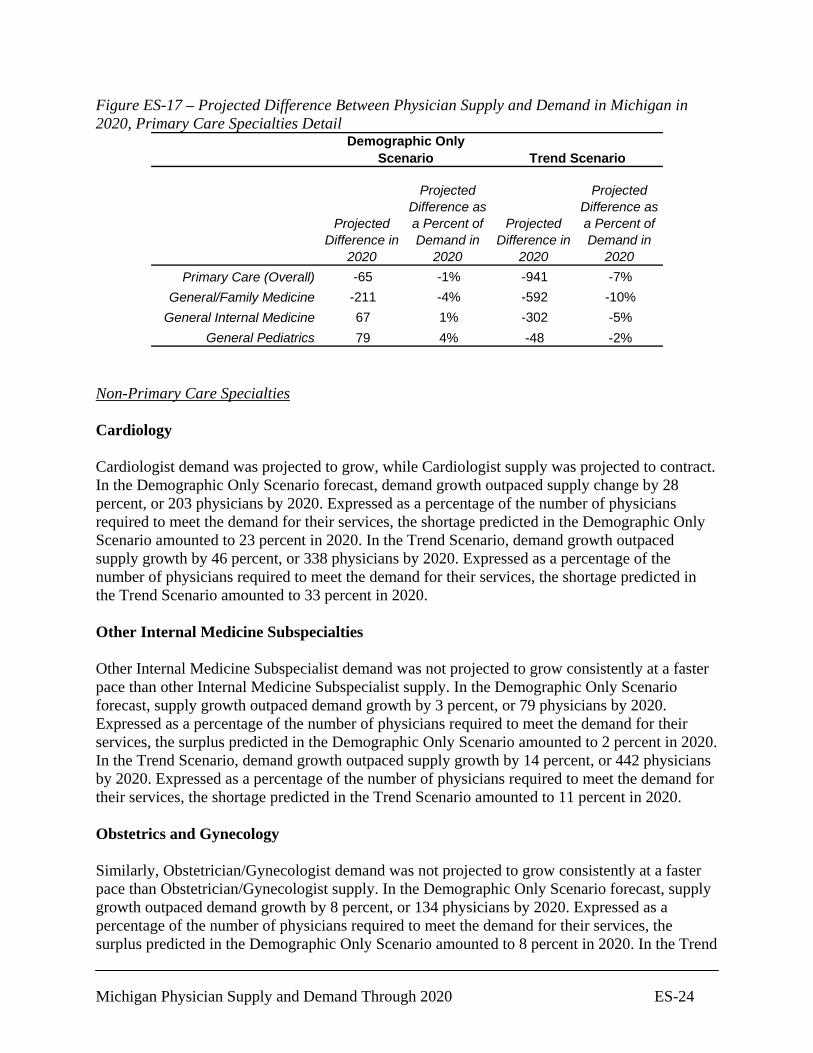
Surgical Subspecialties where the difference between physician supply and demand was forecast to be at least 10 percent of the forecast demand for physicians in those specialties. In the Trend Scenario, demand was forecast to grow at a faster rate than supply in all specialties except Emergency Medicine. Thus, in all specialties, except Emergency Medicine, the Trend Scenario forecasts suggested there would be a shortage of physicians in the state in 2020. The shortage was forecast to be most acute in Cardiology, Pathology, General Surgery, Ophthalmology, Orthopedic Surgery, Urology, and other Surgical Subspecialties where the difference between physician supply and demand was forecast to be at least 20 percent of the forecast demand for physicians in those specialties. Primary Care Specialties General/Family Medicine General/Family physician demand was projected to grow at a faster pace than General/Family physician supply. In the Demographic Only Scenario forecast, demand growth outpaced supply growth by 4 percent, or 211 physicians by 2020. Expressed as a percentage of the number of physicians required to meet the demand for their services, the shortage predicted in the Demographic Only Scenario amounted to 4 percent in 2020. In the Trend Scenario, demand growth outpaced supply growth by 11 percent, or 592 physicians by 2020. Expressed as a percentage of the number of physicians required to meet the demand for their services, the shortage predicted in the Trend Scenario amounted to 10 percent in 2020. General Internal Medicine General Internist demand was not projected to grow consistently at a faster pace than General Internist supply. In the Demographic Only Scenario forecast, supply growth outpaced demand growth by 2 percent, or 67 physicians by 2020. Expressed as a percentage of the number of physicians required to meet the demand for their services, the surplus predicted in the Demographic Only Scenario amounted to 1 percent in 2020. In the Trend Scenario, demand growth outpaced supply growth by 6 percent, or 302 physicians by 2020. Expressed as a percentage of the number of physicians required to meet the demand for their services, the shortage predicted in the Trend Scenario amounted to 5 percent in 2020. General Pediatrics Similarly, General Pediatrician demand was not projected to grow consistently at a faster pace than General Pediatrician supply. In the Demographic Only Scenario forecast, supply growth outpaced demand growth by 4 percent, or 79 physicians by 2020. Expressed as a percentage of the number of physicians required to meet the demand for their services, the surplus predicted in the Demographic Only Scenario amounted to 4 percent in 2020. In the Trend Scenario, demand growth outpaced supply growth by 3 percent, or 48 physicians by 2020. Expressed as a percentage of the number of physicians required to meet the demand for their services, the shortage predicted in the Trend Scenario amounted to 2 percent in 2020.
Michigan Physician Supply and Demand Through 2020 ES-24
Figure ES-17 – Projected Difference Between Physician Supply and Demand in Michigan in 2020, Primary Care Specialties Detail
Projected Difference in
2020
Projected Difference as a Percent of Demand in
2020
Projected Difference in
2020
Projected Difference as a Percent of Demand in
2020Primary Care (Overall) -65 -1% -941 -7%
General/Family Medicine -211 -4% -592 -10%General Internal Medicine 67 1% -302 -5%
General Pediatrics 79 4% -48 -2%
Demographic Only Scenario Trend Scenario
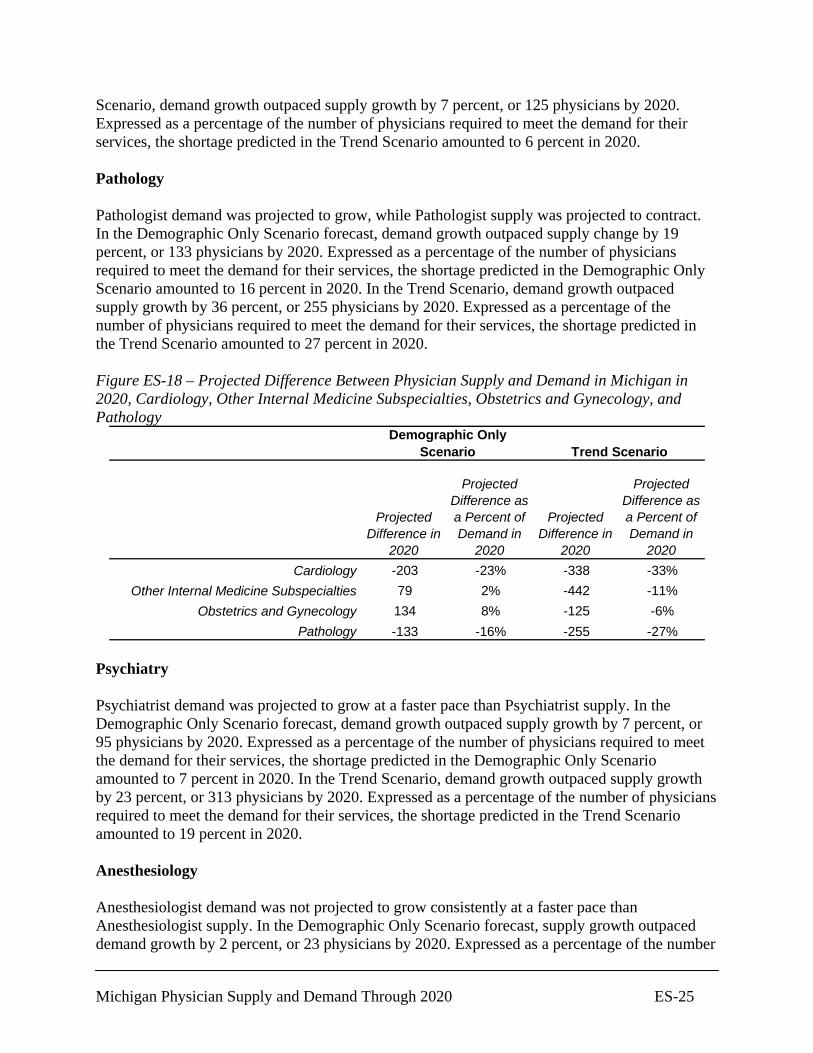
Non-Primary Care Specialties Cardiology Cardiologist demand was projected to grow, while Cardiologist supply was projected to contract. In the Demographic Only Scenario forecast, demand growth outpaced supply change by 28 percent, or 203 physicians by 2020. Expressed as a percentage of the number of physicians required to meet the demand for their services, the shortage predicted in the Demographic Only Scenario amounted to 23 percent in 2020. In the Trend Scenario, demand growth outpaced supply growth by 46 percent, or 338 physicians by 2020. Expressed as a percentage of the number of physicians required to meet the demand for their services, the shortage predicted in the Trend Scenario amounted to 33 percent in 2020. Other Internal Medicine Subspecialties Other Internal Medicine Subspecialist demand was not projected to grow consistently at a faster pace than other Internal Medicine Subspecialist supply. In the Demographic Only Scenario forecast, supply growth outpaced demand growth by 3 percent, or 79 physicians by 2020. Expressed as a percentage of the number of physicians required to meet the demand for their services, the surplus predicted in the Demographic Only Scenario amounted to 2 percent in 2020. In the Trend Scenario, demand growth outpaced supply growth by 14 percent, or 442 physicians by 2020. Expressed as a percentage of the number of physicians required to meet the demand for their services, the shortage predicted in the Trend Scenario amounted to 11 percent in 2020. Obstetrics and Gynecology Similarly, Obstetrician/Gynecologist demand was not projected to grow consistently at a faster pace than Obstetrician/Gynecologist supply. In the Demographic Only Scenario forecast, supply growth outpaced demand growth by 8 percent, or 134 physicians by 2020. Expressed as a percentage of the number of physicians required to meet the demand for their services, the surplus predicted in the Demographic Only Scenario amounted to 8 percent in 2020. In the Trend
Michigan Physician Supply and Demand Through 2020 ES-25
Scenario, demand growth outpaced supply growth by 7 percent, or 125 physicians by 2020. Expressed as a percentage of the number of physicians required to meet the demand for their services, the shortage predicted in the Trend Scenario amounted to 6 percent in 2020. Pathology Pathologist demand was projected to grow, while Pathologist supply was projected to contract. In the Demographic Only Scenario forecast, demand growth outpaced supply change by 19 percent, or 133 physicians by 2020. Expressed as a percentage of the number of physicians required to meet the demand for their services, the shortage predicted in the Demographic Only Scenario amounted to 16 percent in 2020. In the Trend Scenario, demand growth outpaced supply growth by 36 percent, or 255 physicians by 2020. Expressed as a percentage of the number of physicians required to meet the demand for their services, the shortage predicted in the Trend Scenario amounted to 27 percent in 2020. Figure ES-18 – Projected Difference Between Physician Supply and Demand in Michigan in 2020, Cardiology, Other Internal Medicine Subspecialties, Obstetrics and Gynecology, and Pathology
Projected Difference in
2020
Projected Difference as a Percent of Demand in
2020
Projected Difference in
2020
Projected Difference as a Percent of Demand in
2020Cardiology -203 -23% -338 -33%
Other Internal Medicine Subspecialties 79 2% -442 -11%Obstetrics and Gynecology 134 8% -125 -6%
Pathology -133 -16% -255 -27%
Demographic Only Scenario Trend Scenario
Psychiatry Psychiatrist demand was projected to grow at a faster pace than Psychiatrist supply. In the Demographic Only Scenario forecast, demand growth outpaced supply growth by 7 percent, or 95 physicians by 2020. Expressed as a percentage of the number of physicians required to meet the demand for their services, the shortage predicted in the Demographic Only Scenario amounted to 7 percent in 2020. In the Trend Scenario, demand growth outpaced supply growth by 23 percent, or 313 physicians by 2020. Expressed as a percentage of the number of physicians required to meet the demand for their services, the shortage predicted in the Trend Scenario amounted to 19 percent in 2020. Anesthesiology Anesthesiologist demand was not projected to grow consistently at a faster pace than Anesthesiologist supply. In the Demographic Only Scenario forecast, supply growth outpaced demand growth by 2 percent, or 23 physicians by 2020. Expressed as a percentage of the number
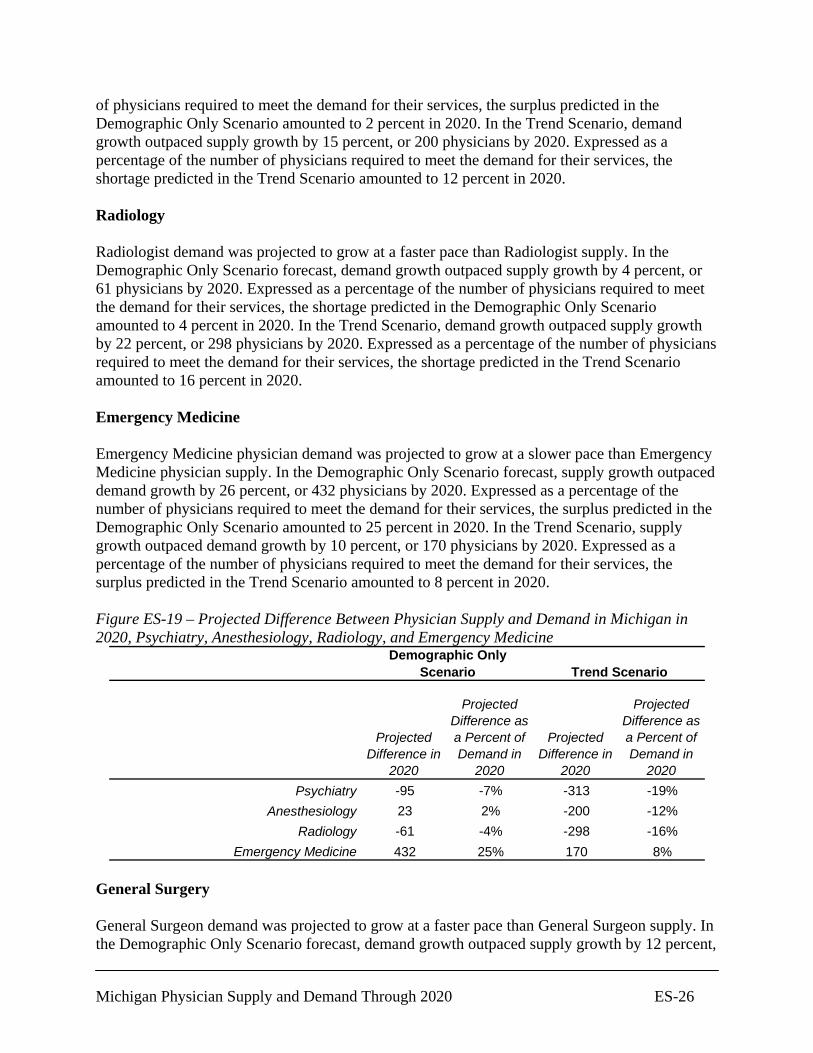
Michigan Physician Supply and Demand Through 2020 ES-26
of physicians required to meet the demand for their services, the surplus predicted in the Demographic Only Scenario amounted to 2 percent in 2020. In the Trend Scenario, demand growth outpaced supply growth by 15 percent, or 200 physicians by 2020. Expressed as a percentage of the number of physicians required to meet the demand for their services, the shortage predicted in the Trend Scenario amounted to 12 percent in 2020. Radiology Radiologist demand was projected to grow at a faster pace than Radiologist supply. In the Demographic Only Scenario forecast, demand growth outpaced supply growth by 4 percent, or 61 physicians by 2020. Expressed as a percentage of the number of physicians required to meet the demand for their services, the shortage predicted in the Demographic Only Scenario amounted to 4 percent in 2020. In the Trend Scenario, demand growth outpaced supply growth by 22 percent, or 298 physicians by 2020. Expressed as a percentage of the number of physicians required to meet the demand for their services, the shortage predicted in the Trend Scenario amounted to 16 percent in 2020. Emergency Medicine Emergency Medicine physician demand was projected to grow at a slower pace than Emergency Medicine physician supply. In the Demographic Only Scenario forecast, supply growth outpaced demand growth by 26 percent, or 432 physicians by 2020. Expressed as a percentage of the number of physicians required to meet the demand for their services, the surplus predicted in the Demographic Only Scenario amounted to 25 percent in 2020. In the Trend Scenario, supply growth outpaced demand growth by 10 percent, or 170 physicians by 2020. Expressed as a percentage of the number of physicians required to meet the demand for their services, the surplus predicted in the Trend Scenario amounted to 8 percent in 2020. Figure ES-19 – Projected Difference Between Physician Supply and Demand in Michigan in 2020, Psychiatry, Anesthesiology, Radiology, and Emergency Medicine
Projected Difference in
2020
Projected Difference as a Percent of Demand in
2020
Projected Difference in
2020
Projected Difference as a Percent of Demand in
2020Psychiatry -95 -7% -313 -19%
Anesthesiology 23 2% -200 -12%Radiology -61 -4% -298 -16%
Emergency Medicine 432 25% 170 8%
Demographic Only Scenario Trend Scenario
General Surgery General Surgeon demand was projected to grow at a faster pace than General Surgeon supply. In the Demographic Only Scenario forecast, demand growth outpaced supply growth by 12 percent,
Michigan Physician Supply and Demand Through 2020 ES-27
or 200 physicians by 2020. Expressed as a percentage of the number of physicians required to meet the demand for their services, the shortage predicted in the Demographic Only Scenario amounted to 11 percent in 2020. In the Trend Scenario, demand growth outpaced supply growth by 32 percent, or 484 physicians by 2020. Expressed as a percentage of the number of physicians required to meet the demand for their services, the shortage predicted in the Trend Scenario amounted to 22 percent in 2020. Ophthalmology Ophthalmologist demand was projected to grow, while Ophthalmologist supply was projected to contract. In the Demographic Only Scenario forecast, demand growth outpaced supply change by 19 percent, or 123 physicians by 2020. Expressed as a percentage of the number of physicians required to meet the demand for their services, the shortage predicted in the Demographic Only Scenario amounted to 16 percent in 2020. In the Trend Scenario, demand growth outpaced supply growth by 36 percent, or 241 physicians by 2020. Expressed as a percentage of the number of physicians required to meet the demand for their services, the shortage predicted in the Trend Scenario amounted to 27 percent in 2020. Otolaryngology Otolaryngologist demand was projected to grow at a faster pace than Otolaryngologist supply. In the Demographic Only Scenario forecast, demand growth outpaced supply growth by 6 percent, or 19 physicians by 2020. Expressed as a percentage of the number of physicians required to meet the demand for their services, the shortage predicted in the Demographic Only Scenario amounted to 5 percent in 2020. In the Trend Scenario, demand growth outpaced supply growth by 23 percent, or 71 physicians by 2020. Expressed as a percentage of the number of physicians required to meet the demand for their services, the shortage predicted in the Trend Scenario amounted to 18 percent in 2020. Orthopedic Surgery Similarly, Orthopedic Surgeon demand was projected to grow at a faster pace than Orthopedic Surgeon supply. In the Demographic Only Scenario forecast, demand growth outpaced supply growth by 11 percent, or 86 physicians by 2020. Expressed as a percentage of the number of physicians required to meet the demand for their services, the shortage predicted in the Demographic Only Scenario amounted to 9 percent in 2020. In the Trend Scenario, demand growth outpaced supply growth by 28 percent, or 230 physicians by 2020. Expressed as a percentage of the number of physicians required to meet the demand for their services, the shortage predicted in the Trend Scenario amounted to 21 percent in 2020.

Michigan Physician Supply and Demand Through 2020 ES-28
Figure ES-20 – Projected Difference Between Physician Supply and Demand in Michigan in 2020, General Surgery, Ophthalmology, Otolaryngology, and Orthopedic Surgery
Projected Difference in
2020
Projected Difference as a Percent of Demand in
2020
Projected Difference in
2020
Projected Difference as a Percent of Demand in
2020General Surgery -200 -11% -484 -22%
Ophthalmology -123 -16% -241 -27%Otolaryngology -19 -5% -71 -18%
Orthopedic Surgery -86 -9% -230 -21%
Demographic Only Scenario Trend Scenario
Urology Urologist demand was projected to grow at a faster pace than Urologist supply. In the Demographic Only Scenario forecast, demand growth outpaced supply growth by 14 percent, or 52 physicians by 2020. Expressed as a percentage of the number of physicians required to meet the demand for their services, the shortage predicted in the Demographic Only Scenario amounted to 12 percent in 2020. In the Trend Scenario, demand growth outpaced supply growth by 32 percent, or 118 physicians by 2020. Expressed as a percentage of the number of physicians required to meet the demand for their services, the shortage predicted in the Trend Scenario amounted to 23 percent in 2020. Other Surgical Subspecialties Other Surgical Subspecialist demand was projected to grow at a faster pace than other Surgical Subspecialist supply. In the Demographic Only Scenario forecast, demand growth outpaced supply growth by 14 percent, or 77 physicians by 2020. Expressed as a percentage of the number of physicians required to meet the demand for their services, the shortage predicted in the Demographic Only Scenario amounted to 12 percent in 2020. In the Trend Scenario, demand growth outpaced supply growth by 31 percent, or 176 physicians by 2020. Expressed as a percentage of the number of physicians required to meet the demand for their services, the shortage predicted in the Trend Scenario amounted to 23 percent in 2020.
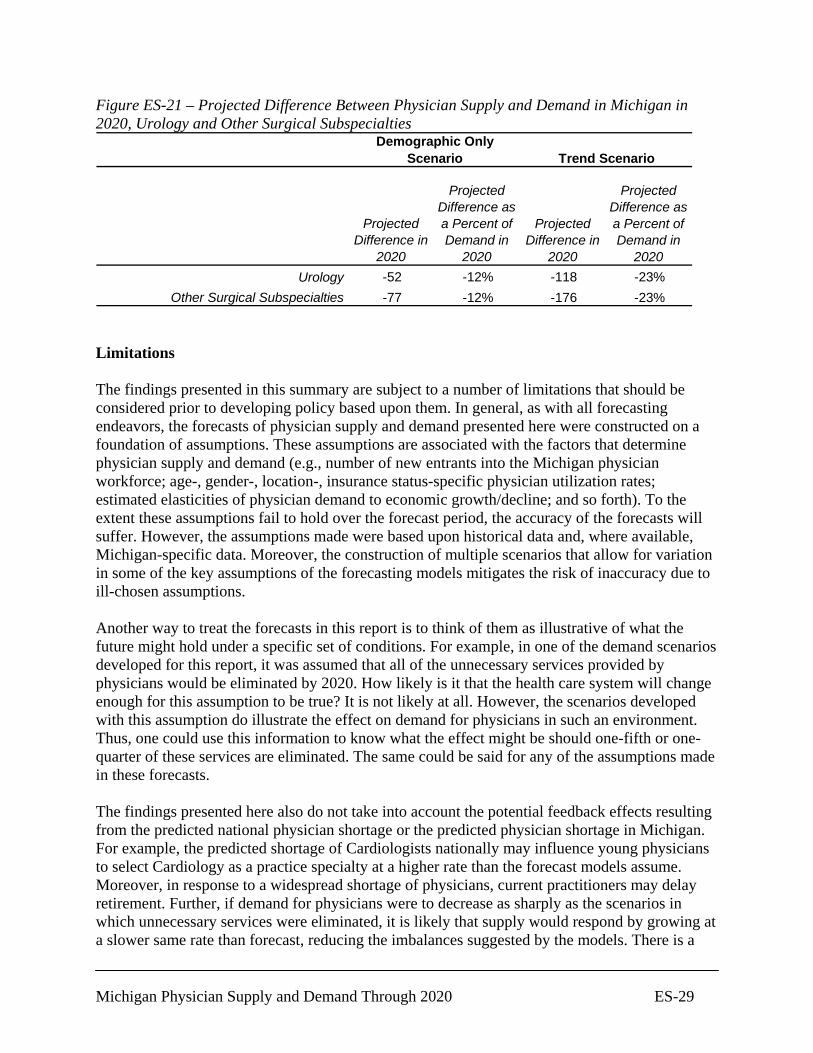
Michigan Physician Supply and Demand Through 2020 ES-29
Figure ES-21 – Projected Difference Between Physician Supply and Demand in Michigan in 2020, Urology and Other Surgical Subspecialties
Projected Difference in
2020
Projected Difference as a Percent of Demand in
2020
Projected Difference in
2020
Projected Difference as a Percent of Demand in
2020Urology -52 -12% -118 -23%
Other Surgical Subspecialties -77 -12% -176 -23%
Demographic Only Scenario Trend Scenario
Limitations The findings presented in this summary are subject to a number of limitations that should be considered prior to developing policy based upon them. In general, as with all forecasting endeavors, the forecasts of physician supply and demand presented here were constructed on a foundation of assumptions. These assumptions are associated with the factors that determine physician supply and demand (e.g., number of new entrants into the Michigan physician workforce; age-, gender-, location-, insurance status-specific physician utilization rates; estimated elasticities of physician demand to economic growth/decline; and so forth). To the extent these assumptions fail to hold over the forecast period, the accuracy of the forecasts will suffer. However, the assumptions made were based upon historical data and, where available, Michigan-specific data. Moreover, the construction of multiple scenarios that allow for variation in some of the key assumptions of the forecasting models mitigates the risk of inaccuracy due to ill-chosen assumptions. Another way to treat the forecasts in this report is to think of them as illustrative of what the future might hold under a specific set of conditions. For example, in one of the demand scenarios developed for this report, it was assumed that all of the unnecessary services provided by physicians would be eliminated by 2020. How likely is it that the health care system will change enough for this assumption to be true? It is not likely at all. However, the scenarios developed with this assumption do illustrate the effect on demand for physicians in such an environment. Thus, one could use this information to know what the effect might be should one-fifth or one-quarter of these services are eliminated. The same could be said for any of the assumptions made in these forecasts. The findings presented here also do not take into account the potential feedback effects resulting from the predicted national physician shortage or the predicted physician shortage in Michigan. For example, the predicted shortage of Cardiologists nationally may influence young physicians to select Cardiology as a practice specialty at a higher rate than the forecast models assume. Moreover, in response to a widespread shortage of physicians, current practitioners may delay retirement. Further, if demand for physicians were to decrease as sharply as the scenarios in which unnecessary services were eliminated, it is likely that supply would respond by growing at a slower same rate than forecast, reducing the imbalances suggested by the models. There is a
Michigan Physician Supply and Demand Through 2020 ES-30
nearly infinite list of other potential feedback effects in response to physician shortages that could affect supply and demand in the future. Similarly, the findings presented in this summary do not take into account any policy changes that might be wrought as a result of the publication of the findings. While national policies around the physician workforce do not appear to have been affected by the COGME’s Sixteenth Report as yet, state level initiatives have begun to respond to the predicted shortage of physicians. With a shortage looming, it is likely that competition for physicians among states will increase. In the way states now compete feverishly for new businesses and their accompanying jobs, it will not be surprising if states act similarly with regard to physicians. The nature of this competition is likely to have ramifications for the relationship between physician supply and demand that cannot be accounted for in the current forecasting models.

Michigan Physician Supply and Demand Through 2020 1
Chapter 1: Overview In order to understand how the likely national shortage of physicians will affect the relationship between physicians supply and demand in Michigan, a consortium of concerned stakeholders, the Blue Ribbon Committee on Physician Workforce, contracted with the Center for Health Workforce Studies to assess the adequacy of the physician supply in Michigan through 2020. The project’s objective is to provide up-to-date and comprehensive information to state stakeholders to facilitate their efforts to implement policies that assure and adequate supply of physicians throughout the state and minimize the effects of the national shortage of physicians in the state. This report detailing the results of the Center’s assessment of the physician workforce in Michigan is organized as follows: 1) Michigan Population Profile The population profile presents data compiled from a number of sources, including the U.S. Census Bureau’s population estimates and projections, results from the American Community Survey and the Area Resource File. The profile also presents a number of health status indicators derived from the Centers for Disease Control and Prevention’s Behavioral Risk Factor Surveillance System. 2) Current Michigan Physician Workforce Profile The physician profile presents data compiled from the American Medical Association’s Masterfile of Physicians in the U.S. The profile includes the demographic characteristics (age, gender, race/ethnicity); professional activities (patient care, teaching, research, administration); practice characteristics (specialty, setting, board certification, location of education and training); and county-level and regional distributions of physicians currently practicing in Michigan. More detailed information by specialty, region, and county has been compiled in a stand-alone profile of physicians in Physician Supply and Distribution in Michigan, 2004 (Forte and Armstrong 2006). 3) Michigan Medical Education and Training Profile The medical education and training profile presents data on medical education and training efforts in Michigan compiled from the AMA’s Graduate Medical Education Database, as well as historical trend data from the Journal of the American Medical Association’s Annual Medical Education theme issues, and the American Association of Colleges of Osteopathic Medicine. 4) Michigan Physician Supply and Demand Forecasts through 2020 In this section of the report, the Center’s efforts to forecast physician supply and demand in Michigan through 2020 are presented. The supply and demand forecasts include state-level and regional-level, specialty-specific projections. In addition, descriptions of the models employed to generate the forecasts are provided. In order to provide a meaningful context to interpret the models and their results, the chapter also includes a broader discussion of the factors affecting physician supply and demand. The forecasting results are presented in three chapters (Chapters 6 through 9), one on the supply forecasts, one on the demand forecasts, and one summarizing the comparisons of the supply and demand forecasts.
Michigan Physician Supply and Demand Through 2020 2
Chapter 2: Background Physician Supply and Demand Forecasting in the U.S. Nearly 30 years ago, the Graduate Medical Education National Advisory Committee (GMENAC) predicted the nation would possess a relatively large surplus of physicians by the turn of the century. This prediction was made following a 20-year expansion in medical education capacity in the U.S., where the number of annual medical school graduates more than doubled. After the GMENAC report, allopathic medical schools around the country voluntarily capped the production of new physicians. Osteopathic medical schools, on the other hand, did not limit their production of new physicians, growing by more than 100 percent between 1980 and 2000. Graduate medical education did not heed GMENAC’s warning either. Between 1980 and 1990, the number of residents training in the U.S. increased by close to 50 percent, from 62,000 to 92,000 residents (Salsberg and Forte, 2002). Concerns about producing too many physicians continued at the national level, and by the mid-1990s, a number of organizations had joined in a call to limit or reduce the number of physicians being produced in the country. The well-known mantra, “110-50/50,” a reference to the federal Council on Graduate Medical Education’s (COGME) suggested physician production strategy, was first articulated in the COGME’s Third Report (1993). The “110” referred to the total number of residency training slots available: 110 percent of the number of U.S. medical school graduates in 1993; while the “50/50” referred to the suggested specialty mix of new physicians: 50 percent primary care and 50 percent specialty disciplines. In 1994, an influential report suggested that under certain managed care delivery systems, physicians were being used much more sparingly (Weiner, 1994). Other recommendations from a consortium of organizations (including the American Medical Association, the American Osteopathic Association, the Association of American Medical Colleges, the American Associations of Colleges of Osteopathic Medicine, the Association of Academic Health Centers, and the National Medical Association) (Consensus Statement, 1997) and the Pew Health Professions Commission (1995) reinforced the COGME suggestions. Finally, in 1997, the federal Balanced Budget Act placed a real cap (in the form of economic disincentives to train more than a certain number of physicians) on graduate medical education. It was not long, however, before the appropriateness of these recommendations was questioned. Consumer and provider backlash against the cost-cutting limitations imposed by managed care halted staff model HMO penetration well shy of its predicted pervasiveness. Anecdotal evidence began to circulate suggesting primary care physicians were having a more difficult time finding satisfactory practice positions than their specialist counterparts. Reports of specialist shortages (particularly anesthesiologists, radiologists, urologists, child and adolescent psychiatrists) also became more common (Schubert et al., 2003; Miller and Lanier, 2001; Schubert et al., 2001; Foot et al., 2000; Kim et al., 2001; Suneja et al., 2001; Neilson et al., 2001; Angus et al., 2000; Pronovost et al., 2002; Sunshine, 2001; Organ, 2002; Etzoni et al., 2003; Fleming et al., 2003). The concern raised by the rapid aging of the population played into the questioning as well. Ultimately, in 2002 the COGME commissioned a report to re-examine their physician workforce projections.

Michigan Physician Supply and Demand Through 2020 3
In January 2005, the COGME released the findings of its re-examination of the previous physician workforce projections in its Sixteenth Report, Physician Workforce Policy Guidelines for the United States, 2000 – 2020. The report detailed forecasts of national physician supply and demand that indicated a substantial shortage of physicians by 2020. The magnitude of the shortage was estimated at 85,000 to 96,000 physicians, or between 7.5 and 8.5 percent of the likely number of physicians required to provide services for the nation’s population in 2020. The COGME’s report joined a growing number of voices that had arrived at the same troubling conclusion. In the late 1990s, prominent physician workforce researchers began to question the notion of a national physician surplus widely held earlier in the decade. With aging general and physician populations, a stagnant medical education and training effort, more than 4,000 designated primary care Health Professional Shortage Areas, a decline in the growth of managed care, a willingness of payors to continue supporting rising rates of physician utilization, and reports from a dozen medical specialties of current or impending physician shortages, it no longer made sense to think in terms of physician surpluses. The COGME’s report attempted to bring all of these observations together. One of the failings of the COGME’s report, however, was its lack of attention to regional and specialty-specific variations embedded in its forecasts. Thus, one of the ramifications of the report was movement by concerned stakeholders in a number of states to determine how the projected national physician shortage would play out in their areas. Amid renewed discussion of the adequacy of the physician workforce nationally, several pioneering states have taken it upon themselves to conduct assessments of the adequacy of their supplies of physicians now and with an eye to the future. Arizona, California, Florida, Kentucky University of Kentucky Center, Massachusetts, Michigan, Mississippi, New Mexico, North Carolina, Oregon, Texas, Wisconsin, and others have either finished an assessment or are in the midst of one. Arizona, Florida, and Texas have deemed it necessary to expand medical school capacity in their states in order to assure an adequate supply of physicians in the future. Moreover, as was stated above, in the past several years, specialty-specific examinations in Cardiology, Endocrinology, Allergy and Immunology, Psychiatry, Neurosurgery, Pediatric Subspecialties, Dermatology, Medical Genetics, Radiology, Geriatric Medicine, and Critical Care have also yielded findings of current or future shortages of physicians. Efforts in Michigan In 2004, COGME members from Michigan and other state stakeholders began an effort to assess what the projected national physician shortage meant for the state. Coming together as the Blue Ribbon Committee on Physician Workforce, they sought out the same team who conducted the national study that had been summarized in the COGME’s report and charged them with replicating as closely as possible the previous study for the Michigan physician workforce. Two complementary efforts were initiated in Michigan to understand the dynamics around their physician workforce. First, the Michigan Department of Community Health began a 3-year census survey of all physicians licensed to practice medicine in the state in 2005. The survey included a battery of items to collect information on physicians’ employment characteristics, demographics, medical specialty, time spent providing patient care, practice capacity and
Michigan Physician Supply and Demand Through 2020 4
acceptance of Medicaid, plans to continue practice, educational background, professional activities, use of technology, and foreign language proficiency. In the first year, approximately 55 percent of the licensed physicians responded to the survey. A report on the first-year responses was issued in January 2006. Second, in 2004, the Michigan State Medical Society commissioned a compilation of information to develop physician supply and demand forecasts for the state through 2020. The resultant report was released in June 2005 (Rosen 2005). Using a methodology loosely based on Richard “Buz” Cooper and colleagues’ Trend Model (Cooper 2000a – Conceptual framework, Cooper 2000b – Proceedings, Cooper et al., 2002), the medical society’s report indicated Michigan could face a shortage of 6,000 physicians by 2020. The Blue Ribbon Committee-commissioned study (the current study) furthers the work of the Michigan State Medical Society project. It examines Michigan’s physician workforce at a finer level of detail, compiles additional information on Michigan’s population and health status trends, applies a more formal modeling approach to its forecast, develops state-level physician supply and demand forecasts under multiple scenarios, and develops specialty-specific regional physician supply and demand forecasts under multiple scenarios.
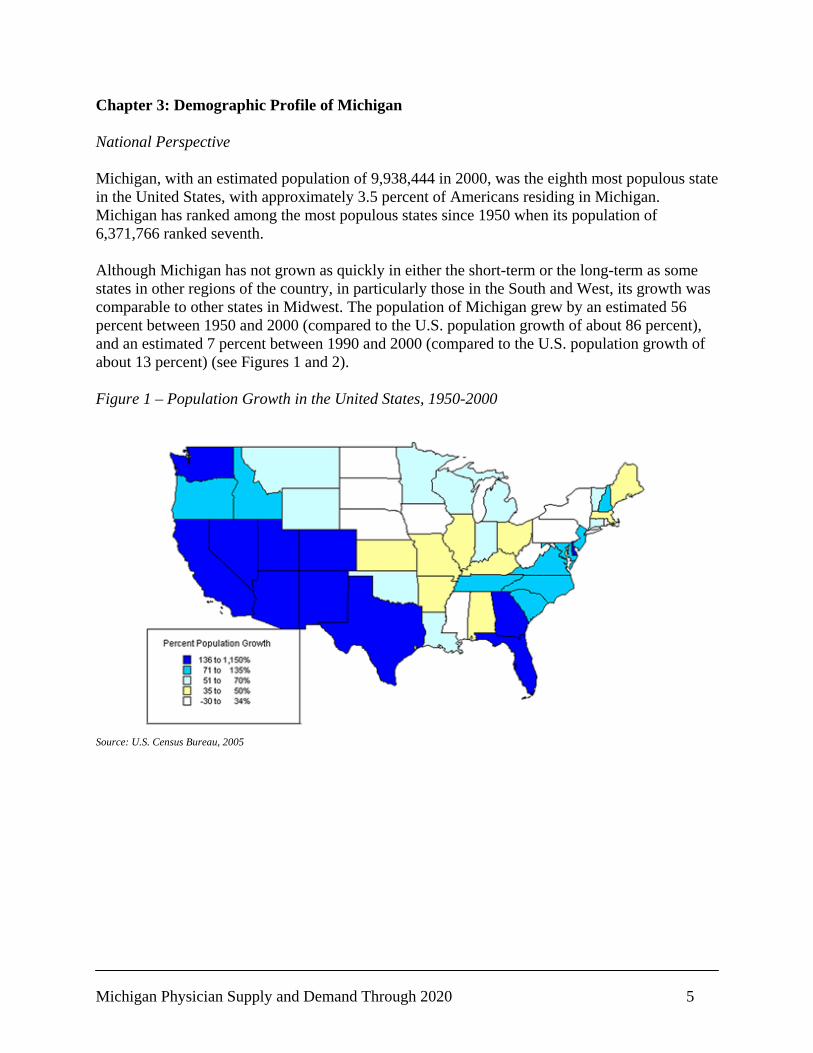
Michigan Physician Supply and Demand Through 2020 5
Chapter 3: Demographic Profile of Michigan National Perspective Michigan, with an estimated population of 9,938,444 in 2000, was the eighth most populous state in the United States, with approximately 3.5 percent of Americans residing in Michigan. Michigan has ranked among the most populous states since 1950 when its population of 6,371,766 ranked seventh. Although Michigan has not grown as quickly in either the short-term or the long-term as some states in other regions of the country, in particularly those in the South and West, its growth was comparable to other states in Midwest. The population of Michigan grew by an estimated 56 percent between 1950 and 2000 (compared to the U.S. population growth of about 86 percent), and an estimated 7 percent between 1990 and 2000 (compared to the U.S. population growth of about 13 percent) (see Figures 1 and 2). Figure 1 – Population Growth in the United States, 1950-2000
Source: U.S. Census Bureau, 2005

Michigan Physician Supply and Demand Through 2020 6
Figure 2 – Population Growth in the United States, 1990-2000
Source: U.S. Census Bureau, 2005 Projected Population Growth Michigan’s moderate to slow population growth was expected to continue through the year 2020, with overall growth for the state between 2005 and 2020 at 4.8 percent. This compared to projected growth of 13.6 percent for the U.S. during the same period. Certain regions of Michigan were expected to grow more rapidly than others during this period, and a few regions were expected to experience population loss (U.S. Census Bureau). Figure 3 – Projected Population Growth, Michigan, 2005 through 2020
0
2,000,000
4,000,000
6,000,000
8,000,000
10,000,000
12,000,000
2005 2006 2007 2008 2009 2010 2011 2012 2013 2014 2015 2016 2017 2018 2019 2020
Source: U.S. Census Bureau, 2005.

Michigan Physician Supply and Demand Through 2020 7
For the purpose of this examination, Michigan’s 82 counties were divided into 14 regions. All of the regions consisted of multiple counties. The Detroit Area region had the largest population in 2005 (4,278,279), followed by the Grand Rapids-Muskegon region (1,183,252). The Northeast region had the smallest population (142,971), followed by the East Central region (150,382). The Ann Arbor region experienced the most growth over both the past 15 years and past five years, followed by the Northwest region and Grand Rapids-Muskegon regions, as shown in Figure 4. Many areas of Michigan experienced very little growth in the past five years, however. The population of the Upper Peninsula actually declined by approximately 1 percent since 2000, while the population of Detroit did not grow during this period. Figure 4 – Historical Population Change by Region, 1990-2005 and 2000-2005
1%
3%
6%
7%
16%
7%
17%
4%
5%
18%
12%
22%
25%
31%
2%
2%
4%
4%
5%
6%
9%
-1%
0%
1%
1%
1%
1%
2%
-5% 0% 5% 10% 15% 20% 25% 30% 35%
Upper Peninsula
Detroit
Southwest
Saginaw-Thumb
East Central
Kalamazoo-Battle Creek
Northeast
Flint
Lansing
West Central
Jackson
Grand Rapids-Muskegon
Northwest
Ann Arbor
1990-2005 2000-2005
Source: Area Resource File, 2005; U.S. Bureau of the Census, 2006 Most regions in Michigan were expected to grow between 2005 and 2020. Projected rates of growth varied widely by region (Table 1). The region expected to experience the most growth between 2005 and 2020 was the Northwest region (17.3 percent), followed by the Ann Arbor Area region (16.8 percent), and Grand Rapids-Muskegon (14.5 percent). Three regions were expected to experience a population loss by 2020: the Flint Area region (-1.9 percent), the Upper Peninsula region (-1.0 percent), and the Southwest Michigan region (-0.6 percent). Projected population growth also varied by geographic location within regions. The largest discrepancy in population growth between 2005 and 2020 between rural and urban locations occurred in the Northwest region (15.4 percent versus 22.1 percent), followed by the Jackson Area region (0.2 percent versus 6.7 percent), and the Upper Peninsula region (-4.0 percent versus 2.2 percent).

Michigan Physician Supply and Demand Through 2020 8
Table 1 – Population Size and Projected Growth by Region, 2005-2020
Region Location 2005 2010 2015 2020
Rural 127,980 134,903 140,985 145,930 14.0%Urban 399,398 425,147 448,953 469,961 17.7%Total 527,378 560,050 589,938 615,891 16.8%Rural 200,046 203,553 206,061 207,255 3.6%Urban 4,078,233 4,121,701 4,143,339 4,137,729 1.5%Total 4,278,279 4,325,255 4,349,400 4,344,984 1.6%Rural 116,416 120,103 123,512 126,053 8.3%Urban 33,967 35,669 37,246 38,537 13.5%Total 150,382 155,772 160,758 164,590 9.4%Rural 132,426 130,856 128,734 125,915 -4.9%Urban 384,568 385,634 384,783 381,335 -0.8%Total 516,994 516,490 513,518 507,250 -1.9%Rural 299,860 313,096 324,307 332,675 10.9%Urban 883,393 935,008 982,303 1,021,726 15.7%Total 1,183,252 1,248,104 1,306,610 1,354,402 14.5%Rural 210,689 211,808 212,083 211,035 0.2%Urban 253,269 260,324 266,184 270,130 6.7%Total 463,958 472,132 478,267 481,165 3.7%Rural 201,250 203,826 205,414 205,490 2.1%Urban 352,643 360,075 365,917 369,034 4.6%Total 553,893 563,902 571,330 574,525 3.7%Rural 118,908 121,465 123,308 124,232 4.5%Urban 342,697 349,601 355,154 358,360 4.6%Total 461,605 471,067 478,463 482,592 4.5%Rural 106,169 109,503 112,408 114,610 8.0%Urban 36,802 38,420 39,891 41,085 11.6%Total 142,971 147,923 152,298 155,695 8.9%Rural 211,314 223,623 234,685 243,762 15.4%Urban 86,919 93,843 100,411 106,149 22.1%Total 298,233 317,466 335,096 349,912 17.3%Rural 294,736 296,643 297,263 296,106 0.5%Urban 339,070 342,359 344,168 343,694 1.4%Total 633,806 639,002 641,430 639,800 0.9%Rural 143,899 143,852 143,239 141,706 -1.5%Urban 148,054 148,987 149,295 148,501 0.3%Total 291,953 292,839 292,535 290,207 -0.6%Rural 162,617 161,108 159,060 156,139 -4.0%Urban 151,294 153,176 154,500 154,682 2.2%Total 313,911 314,284 313,560 310,821 -1.0%Rural 261,273 269,331 275,820 280,088 7.2%Urban 129,534 135,067 140,100 144,073 11.2%Total 390,807 404,398 415,920 424,161 8.5%
Total 10,207,421 10,428,683 10,599,122 10,695,993 4.8%
Ann Arbor Area
Grand Rapids-Muskegon
Flint Area
East Central
Detroit Area
% Change 2005 to 2020
West Central
Upper Peninsula
Southwest Michigan
Saginaw-Thumb
Northwest
Northeast
Lansing Area
Kalamazoo-Battle Creek
Jackson Area
Sources: Center for Health Workforce Studies, Albany, NY, U.S. Bureau of the Census, 2006 The Aging Population One of the most notable demographic trends projected for the U.S. as a whole as well as the state of Michigan was aging of the population. Lower rates of mortality and greater life expectancy have steadily increased both the number and percentage of the population age 65 and older since the beginning of the 20th century. This increase is expected to accelerate dramatically, too, as members of the baby boom generation (the large cohort born between 1946 and 1964) begin to
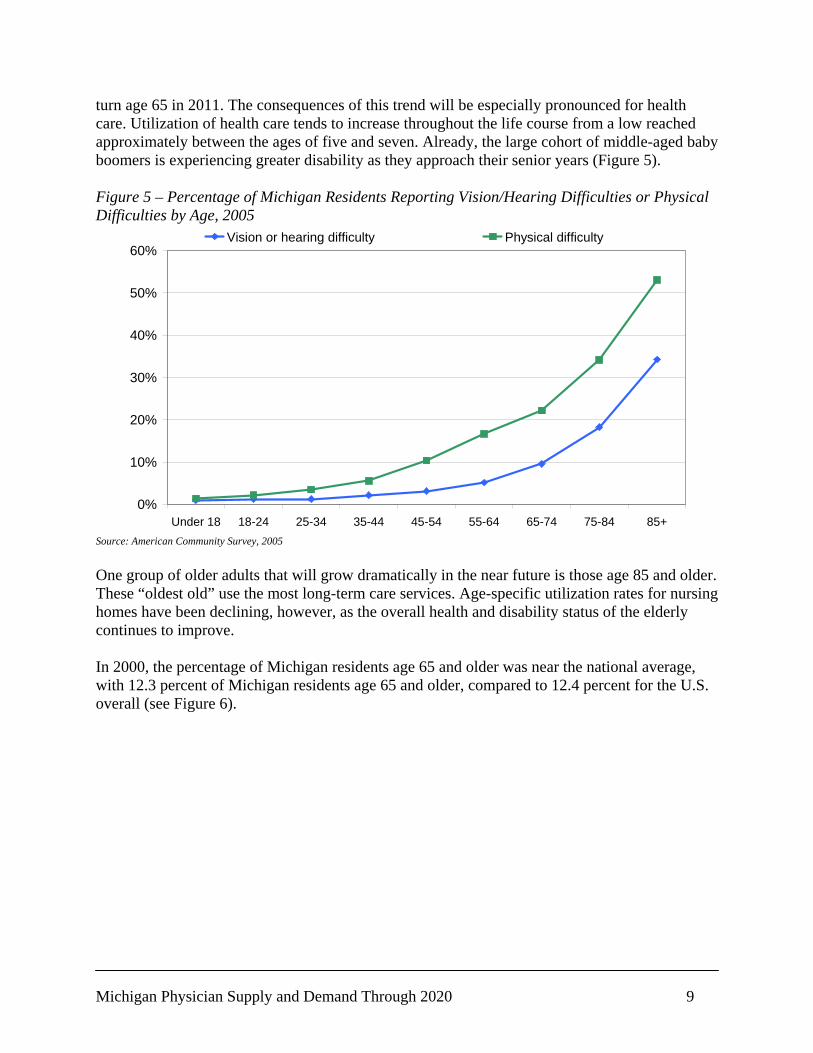
Michigan Physician Supply and Demand Through 2020 9
turn age 65 in 2011. The consequences of this trend will be especially pronounced for health care. Utilization of health care tends to increase throughout the life course from a low reached approximately between the ages of five and seven. Already, the large cohort of middle-aged baby boomers is experiencing greater disability as they approach their senior years (Figure 5). Figure 5 – Percentage of Michigan Residents Reporting Vision/Hearing Difficulties or Physical Difficulties by Age, 2005
0%
10%
20%
30%
40%
50%
60%
Under 18 18-24 25-34 35-44 45-54 55-64 65-74 75-84 85+
Vision or hearing difficulty Physical difficulty
Source: American Community Survey, 2005 One group of older adults that will grow dramatically in the near future is those age 85 and older. These “oldest old” use the most long-term care services. Age-specific utilization rates for nursing homes have been declining, however, as the overall health and disability status of the elderly continues to improve. In 2000, the percentage of Michigan residents age 65 and older was near the national average, with 12.3 percent of Michigan residents age 65 and older, compared to 12.4 percent for the U.S. overall (see Figure 6).
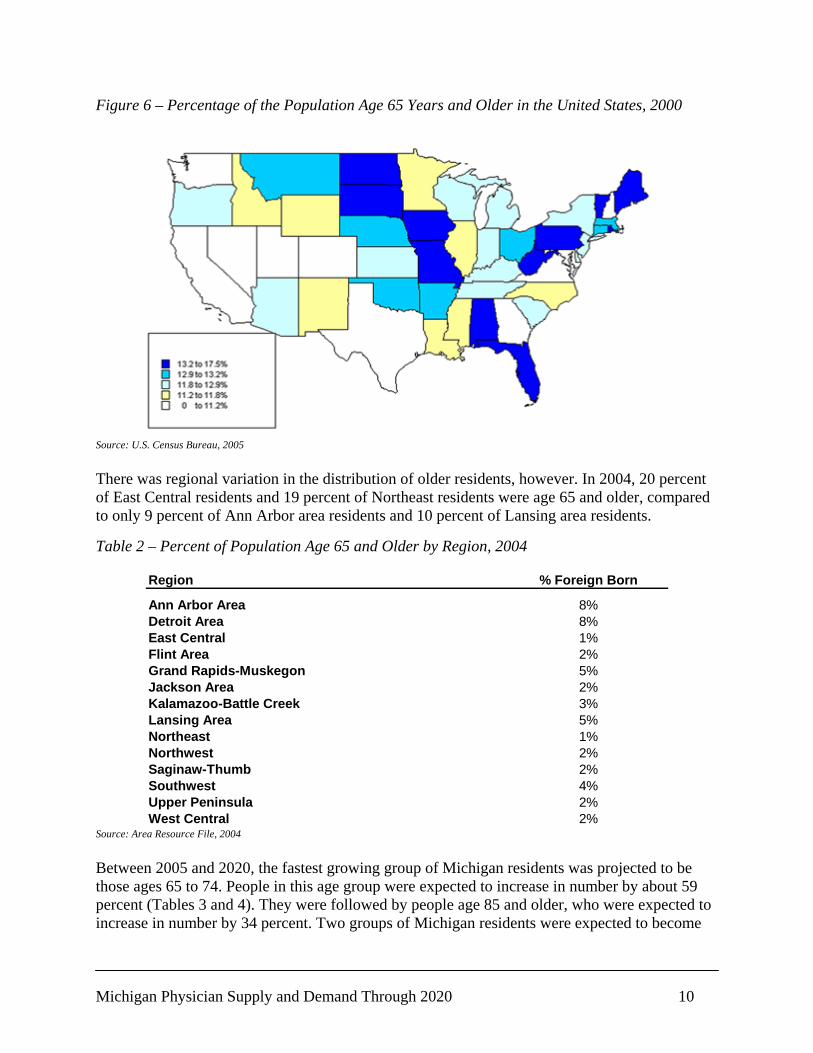
Michigan Physician Supply and Demand Through 2020 10
Figure 6 – Percentage of the Population Age 65 Years and Older in the United States, 2000
Source: U.S. Census Bureau, 2005 There was regional variation in the distribution of older residents, however. In 2004, 20 percent of East Central residents and 19 percent of Northeast residents were age 65 and older, compared to only 9 percent of Ann Arbor area residents and 10 percent of Lansing area residents. Table 2 – Percent of Population Age 65 and Older by Region, 2004
Region
Ann Arbor Area 8%Detroit Area 8%East Central 1%Flint Area 2%Grand Rapids-Muskegon 5%Jackson Area 2%Kalamazoo-Battle Creek 3%Lansing Area 5%Northeast 1%Northwest 2%Saginaw-Thumb 2%Southwest 4%Upper Peninsula 2%West Central 2%
% Foreign Born
Source: Area Resource File, 2004 Between 2005 and 2020, the fastest growing group of Michigan residents was projected to be those ages 65 to 74. People in this age group were expected to increase in number by about 59 percent (Tables 3 and 4). They were followed by people age 85 and older, who were expected to increase in number by 34 percent. Two groups of Michigan residents were expected to become
Michigan Physician Supply and Demand Through 2020 11
smaller. Those ages 18 to 24 were projected to decline in number by about 7 percent, and those ages 5 to 17 were projected to decline in number by about 5 percent. Other groups were growing more slowly than the state as a whole. Though the population of Michigan was projected to increase about 5 percent between 2005 and 2020, the number of people ages 25 to 44 was expected to increase by less than 1 percent, and the number of children ages 5 and younger was expected to increase less than 4 percent. Despite the overall trend towards population aging, the number of Michigan residents ages 75 to 84 was expected to increase by only 9 percent by 2020. Those reaching the age of 75 between 2005 and 2020 were born between 1930 and 1945, and were a relatively small birth cohort due to smaller family sizes during the Great Depression (Hauser, 1976).

Michigan Physician Supply and Demand Through 2020 12
Table 3 – Projected Regional Population Change by Age Group and Geographic Area, 2005-2020 Region Location Under 5 5 to 17 18 to 24 25 to 44 45 to 64 65 to 74 75 to 84 85 +
Rural 1,314 1,003 2,799 -622 5,094 6,303 1,611 448Urban 4,982 3,364 3,680 7,552 18,018 23,143 7,852 1,971Total 6,296 4,368 6,479 6,930 23,112 29,446 9,463 2,419Rural -7 -1,165 2,067 -4,448 4,597 6,098 -830 897Urban -3,230 -58,490 -9,364 -64,195 52,677 126,903 -6,453 21,648Total -3,237 -59,655 -7,298 -68,643 57,274 133,001 -7,282 22,545Rural 264 -2,172 -2,313 3,044 4,308 3,834 1,048 1,624Urban 161 -523 -909 1,581 1,538 1,372 730 621Total 425 -2,696 -3,222 4,625 5,846 5,206 1,778 2,245Rural -648 -2,436 -393 -5,355 -770 3,048 -171 214Urban -436 -5,717 -4,097 -6,990 118 10,899 1,774 1,217Total -1,084 -8,153 -4,490 -12,345 -652 13,947 1,603 1,431Rural 2,090 2,123 1,524 7,858 8,044 9,708 463 1,006Urban 9,520 8,880 -3,512 46,742 30,375 34,775 6,802 4,751Total 11,610 11,003 -1,987 54,599 38,419 44,483 7,265 5,757Rural -170 -4,028 -2,370 -3,122 1,628 7,471 274 663Urban 902 -3,204 -4,541 3,547 5,032 11,384 2,328 1,413Total 732 -7,232 -6,912 425 6,660 18,856 2,602 2,075Rural 433 -524 -781 -2,027 883 5,689 93 475Urban 1,577 -885 -5,267 3,299 2,446 11,610 2,219 1,391Total 2,011 -1,408 -6,048 1,272 3,329 17,299 2,312 1,866Rural 334 -233 -735 -1,668 1,550 4,845 836 394Urban 1,174 -2,022 -7,558 -306 3,293 15,389 4,178 1,514Total 1,508 -2,254 -8,293 -1,973 4,843 20,233 5,014 1,908Rural 330 -1,674 -1,714 2,757 2,489 4,275 986 992Urban 177 -537 -886 1,601 999 1,719 752 458Total 507 -2,211 -2,600 4,358 3,487 5,994 1,738 1,450Rural 1,614 -2,074 -2,409 9,758 7,518 12,162 3,366 2,513Urban 931 -485 -1,600 6,354 4,043 6,095 2,485 1,407Total 2,546 -2,558 -4,010 16,112 11,561 18,257 5,851 3,920Rural -532 -6,243 -3,238 -4,397 1,129 10,657 1,406 2,589Urban -264 -8,024 -7,296 -802 215 13,414 3,663 3,718Total -797 -14,267 -10,534 -5,199 1,344 24,070 5,069 6,307Rural -318 -2,197 -2,032 -866 -1,648 4,294 -67 641Urban -47 -2,384 -3,534 1,411 -1,710 4,992 787 932Total -365 -4,581 -5,566 545 -3,358 9,287 720 1,572Rural -410 -3,929 -4,596 -3,108 -1,810 6,044 -117 1,447Urban 133 -2,835 -5,451 1,057 -43 7,108 1,377 2,043Total -277 -6,765 -10,048 -2,051 -1,853 13,152 1,260 3,490Rural 1,298 -1,428 -4,162 4,064 8,253 8,527 1,297 965Urban 1,003 -399 -3,561 5,104 4,960 5,087 1,605 740Total 2,302 -1,827 -7,723 9,168 13,213 13,614 2,902 1,706
Total 22,178 -98,236 -72,252 7,824 163,226 366,845 40,295 58,692
Upper Peninsula
West Central
Northeast
Northwest
Saginaw-Thumb
Southwest Michigan
Grand Rapids-Muskegon
Jackson Area
Kalamazoo-Battle Creek
Lansing Area
Ann Arbor Area
Detroit Area
East Central
Flint Area
Sources: Center for Health Workforce Studies, Albany, NY, U.S. Bureau of the Census, 2006
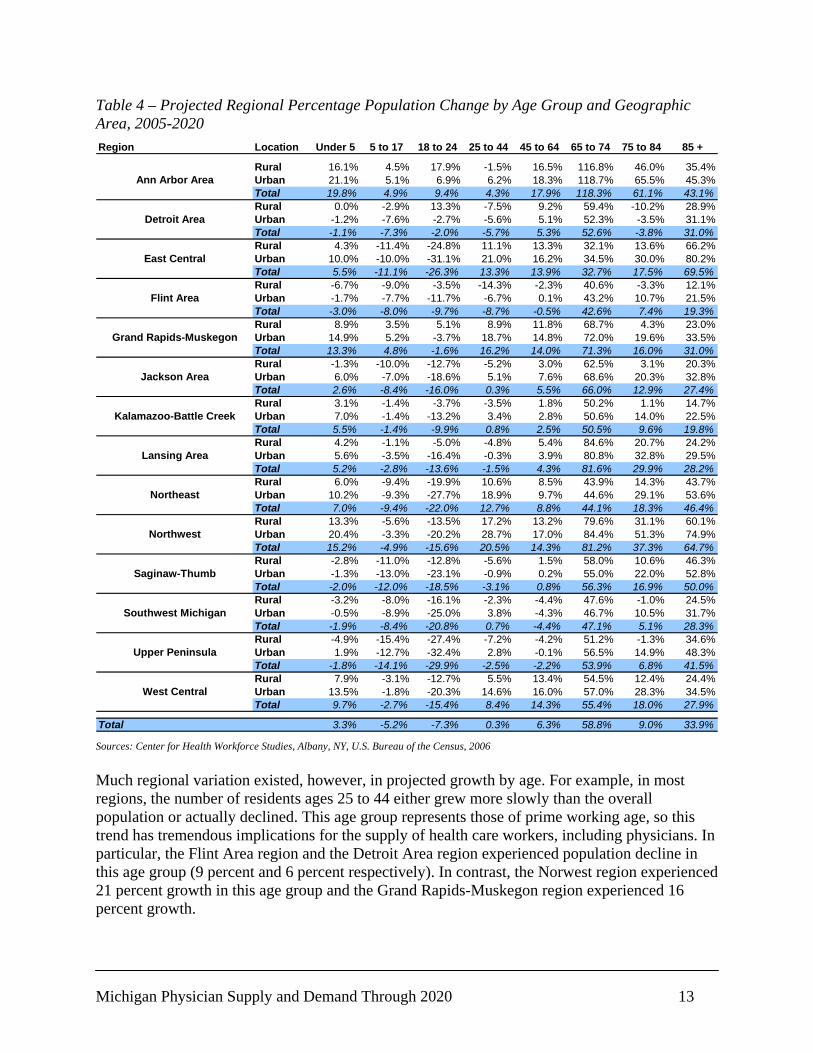
Michigan Physician Supply and Demand Through 2020 13
Table 4 – Projected Regional Percentage Population Change by Age Group and Geographic Area, 2005-2020 Region Location Under 5 5 to 17 18 to 24 25 to 44 45 to 64 65 to 74 75 to 84 85 +
Rural 16.1% 4.5% 17.9% -1.5% 16.5% 116.8% 46.0% 35.4%Urban 21.1% 5.1% 6.9% 6.2% 18.3% 118.7% 65.5% 45.3%Total 19.8% 4.9% 9.4% 4.3% 17.9% 118.3% 61.1% 43.1%Rural 0.0% -2.9% 13.3% -7.5% 9.2% 59.4% -10.2% 28.9%Urban -1.2% -7.6% -2.7% -5.6% 5.1% 52.3% -3.5% 31.1%Total -1.1% -7.3% -2.0% -5.7% 5.3% 52.6% -3.8% 31.0%Rural 4.3% -11.4% -24.8% 11.1% 13.3% 32.1% 13.6% 66.2%Urban 10.0% -10.0% -31.1% 21.0% 16.2% 34.5% 30.0% 80.2%Total 5.5% -11.1% -26.3% 13.3% 13.9% 32.7% 17.5% 69.5%Rural -6.7% -9.0% -3.5% -14.3% -2.3% 40.6% -3.3% 12.1%Urban -1.7% -7.7% -11.7% -6.7% 0.1% 43.2% 10.7% 21.5%Total -3.0% -8.0% -9.7% -8.7% -0.5% 42.6% 7.4% 19.3%Rural 8.9% 3.5% 5.1% 8.9% 11.8% 68.7% 4.3% 23.0%Urban 14.9% 5.2% -3.7% 18.7% 14.8% 72.0% 19.6% 33.5%Total 13.3% 4.8% -1.6% 16.2% 14.0% 71.3% 16.0% 31.0%Rural -1.3% -10.0% -12.7% -5.2% 3.0% 62.5% 3.1% 20.3%Urban 6.0% -7.0% -18.6% 5.1% 7.6% 68.6% 20.3% 32.8%Total 2.6% -8.4% -16.0% 0.3% 5.5% 66.0% 12.9% 27.4%Rural 3.1% -1.4% -3.7% -3.5% 1.8% 50.2% 1.1% 14.7%Urban 7.0% -1.4% -13.2% 3.4% 2.8% 50.6% 14.0% 22.5%Total 5.5% -1.4% -9.9% 0.8% 2.5% 50.5% 9.6% 19.8%Rural 4.2% -1.1% -5.0% -4.8% 5.4% 84.6% 20.7% 24.2%Urban 5.6% -3.5% -16.4% -0.3% 3.9% 80.8% 32.8% 29.5%Total 5.2% -2.8% -13.6% -1.5% 4.3% 81.6% 29.9% 28.2%Rural 6.0% -9.4% -19.9% 10.6% 8.5% 43.9% 14.3% 43.7%Urban 10.2% -9.3% -27.7% 18.9% 9.7% 44.6% 29.1% 53.6%Total 7.0% -9.4% -22.0% 12.7% 8.8% 44.1% 18.3% 46.4%Rural 13.3% -5.6% -13.5% 17.2% 13.2% 79.6% 31.1% 60.1%Urban 20.4% -3.3% -20.2% 28.7% 17.0% 84.4% 51.3% 74.9%Total 15.2% -4.9% -15.6% 20.5% 14.3% 81.2% 37.3% 64.7%Rural -2.8% -11.0% -12.8% -5.6% 1.5% 58.0% 10.6% 46.3%Urban -1.3% -13.0% -23.1% -0.9% 0.2% 55.0% 22.0% 52.8%Total -2.0% -12.0% -18.5% -3.1% 0.8% 56.3% 16.9% 50.0%Rural -3.2% -8.0% -16.1% -2.3% -4.4% 47.6% -1.0% 24.5%Urban -0.5% -8.9% -25.0% 3.8% -4.3% 46.7% 10.5% 31.7%Total -1.9% -8.4% -20.8% 0.7% -4.4% 47.1% 5.1% 28.3%Rural -4.9% -15.4% -27.4% -7.2% -4.2% 51.2% -1.3% 34.6%Urban 1.9% -12.7% -32.4% 2.8% -0.1% 56.5% 14.9% 48.3%Total -1.8% -14.1% -29.9% -2.5% -2.2% 53.9% 6.8% 41.5%Rural 7.9% -3.1% -12.7% 5.5% 13.4% 54.5% 12.4% 24.4%Urban 13.5% -1.8% -20.3% 14.6% 16.0% 57.0% 28.3% 34.5%Total 9.7% -2.7% -15.4% 8.4% 14.3% 55.4% 18.0% 27.9%
Total 3.3% -5.2% -7.3% 0.3% 6.3% 58.8% 9.0% 33.9%
Saginaw-Thumb
Southwest Michigan
Upper Peninsula
West Central
Kalamazoo-Battle Creek
Lansing Area
Northeast
Northwest
East Central
Flint Area
Grand Rapids-Muskegon
Jackson Area
Ann Arbor Area
Detroit Area
Sources: Center for Health Workforce Studies, Albany, NY, U.S. Bureau of the Census, 2006 Much regional variation existed, however, in projected growth by age. For example, in most regions, the number of residents ages 25 to 44 either grew more slowly than the overall population or actually declined. This age group represents those of prime working age, so this trend has tremendous implications for the supply of health care workers, including physicians. In particular, the Flint Area region and the Detroit Area region experienced population decline in this age group (9 percent and 6 percent respectively). In contrast, the Norwest region experienced 21 percent growth in this age group and the Grand Rapids-Muskegon region experienced 16 percent growth.
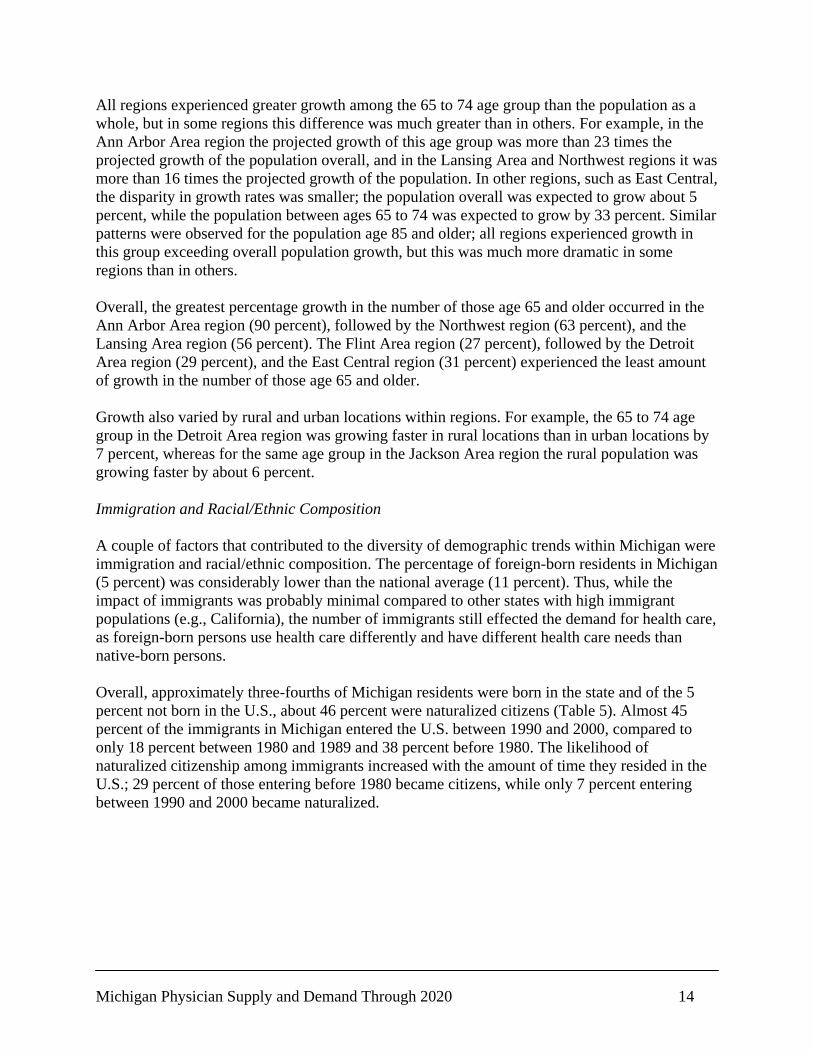
Michigan Physician Supply and Demand Through 2020 14
All regions experienced greater growth among the 65 to 74 age group than the population as a whole, but in some regions this difference was much greater than in others. For example, in the Ann Arbor Area region the projected growth of this age group was more than 23 times the projected growth of the population overall, and in the Lansing Area and Northwest regions it was more than 16 times the projected growth of the population. In other regions, such as East Central, the disparity in growth rates was smaller; the population overall was expected to grow about 5 percent, while the population between ages 65 to 74 was expected to grow by 33 percent. Similar patterns were observed for the population age 85 and older; all regions experienced growth in this group exceeding overall population growth, but this was much more dramatic in some regions than in others. Overall, the greatest percentage growth in the number of those age 65 and older occurred in the Ann Arbor Area region (90 percent), followed by the Northwest region (63 percent), and the Lansing Area region (56 percent). The Flint Area region (27 percent), followed by the Detroit Area region (29 percent), and the East Central region (31 percent) experienced the least amount of growth in the number of those age 65 and older. Growth also varied by rural and urban locations within regions. For example, the 65 to 74 age group in the Detroit Area region was growing faster in rural locations than in urban locations by 7 percent, whereas for the same age group in the Jackson Area region the rural population was growing faster by about 6 percent. Immigration and Racial/Ethnic Composition A couple of factors that contributed to the diversity of demographic trends within Michigan were immigration and racial/ethnic composition. The percentage of foreign-born residents in Michigan (5 percent) was considerably lower than the national average (11 percent). Thus, while the impact of immigrants was probably minimal compared to other states with high immigrant populations (e.g., California), the number of immigrants still effected the demand for health care, as foreign-born persons use health care differently and have different health care needs than native-born persons. Overall, approximately three-fourths of Michigan residents were born in the state and of the 5 percent not born in the U.S., about 46 percent were naturalized citizens (Table 5). Almost 45 percent of the immigrants in Michigan entered the U.S. between 1990 and 2000, compared to only 18 percent between 1980 and 1989 and 38 percent before 1980. The likelihood of naturalized citizenship among immigrants increased with the amount of time they resided in the U.S.; 29 percent of those entering before 1980 became citizens, while only 7 percent entering between 1990 and 2000 became naturalized.
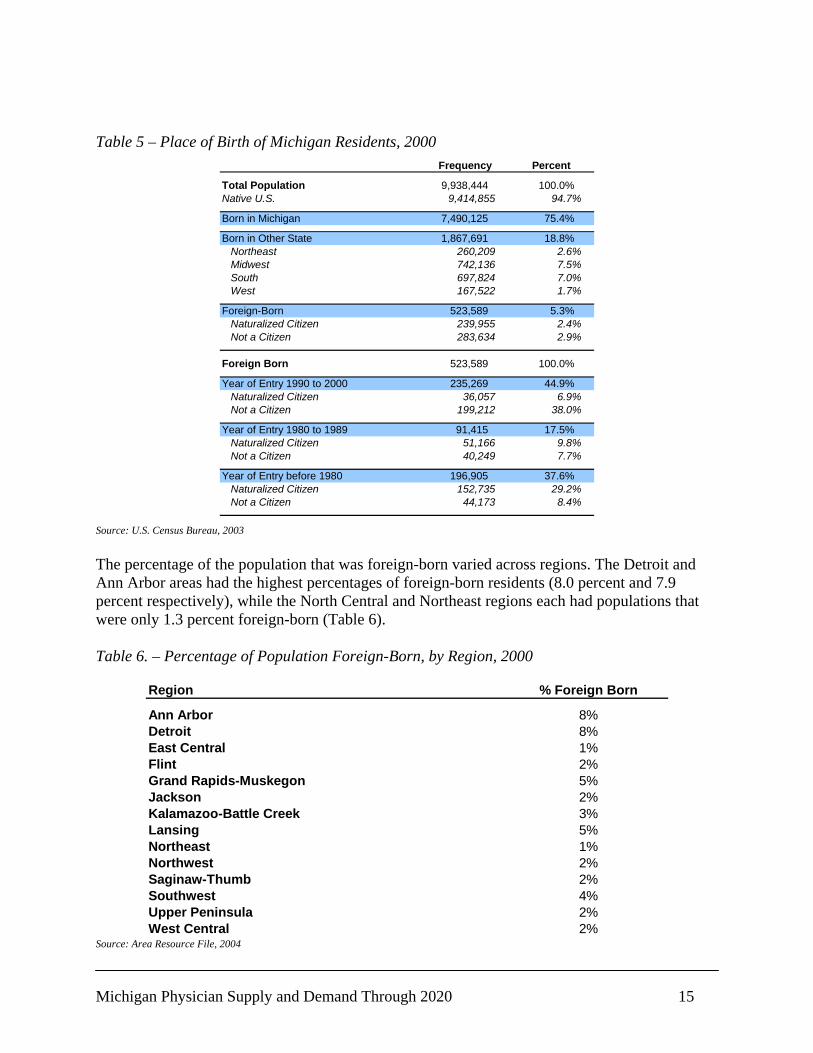
Michigan Physician Supply and Demand Through 2020 15
Table 5 – Place of Birth of Michigan Residents, 2000
Frequency Percent
Total Population 9,938,444 100.0%Native U.S. 9,414,855 94.7%
Born in Michigan 7,490,125 75.4%
Born in Other State 1,867,691 18.8%Northeast 260,209 2.6%Midwest 742,136 7.5%South 697,824 7.0%West 167,522 1.7%
Foreign-Born 523,589 5.3%Naturalized Citizen 239,955 2.4%Not a Citizen 283,634 2.9%
Foreign Born 523,589 100.0%
Year of Entry 1990 to 2000 235,269 44.9%Naturalized Citizen 36,057 6.9%Not a Citizen 199,212 38.0%
Year of Entry 1980 to 1989 91,415 17.5%Naturalized Citizen 51,166 9.8%Not a Citizen 40,249 7.7%
Year of Entry before 1980 196,905 37.6%Naturalized Citizen 152,735 29.2%Not a Citizen 44,173 8.4%
Source: U.S. Census Bureau, 2003 The percentage of the population that was foreign-born varied across regions. The Detroit and Ann Arbor areas had the highest percentages of foreign-born residents (8.0 percent and 7.9 percent respectively), while the North Central and Northeast regions each had populations that were only 1.3 percent foreign-born (Table 6). Table 6. – Percentage of Population Foreign-Born, by Region, 2000
Region
Ann Arbor 8%Detroit 8%East Central 1%Flint 2%Grand Rapids-Muskegon 5%Jackson 2%Kalamazoo-Battle Creek 3%Lansing 5%Northeast 1%Northwest 2%Saginaw-Thumb 2%Southwest 4%Upper Peninsula 2%West Central 2%
% Foreign Born
Source: Area Resource File, 2004

Michigan Physician Supply and Demand Through 2020 16
Compared to the nation as a whole in 2003, Michigan had a larger non-Hispanic White population (78 percent compared to 69 percent) (Figure 7). On the other hand, the Black/African-American population was slightly larger than it was nationally (14 percent compared to 13 percent). The most striking feature of Michigan’s racial and ethnic composition, however, was the underrepresentation of Hispanics/Latinos. Only 4 percent of Michigan residents were of Hispanic/Latino origins, while the national average was 14 percent. Figure 7– Racial/Ethnic Composition of Michigan Residents, 2003
Hispanic/ Latino
4%
American Indian1%
Asian/ Pacific Islander
2% Other/ Multiracial1%
Non-Hispanic Black14%
Non-Hispanic White78%
Source: U.S. Census Bureau, 2005
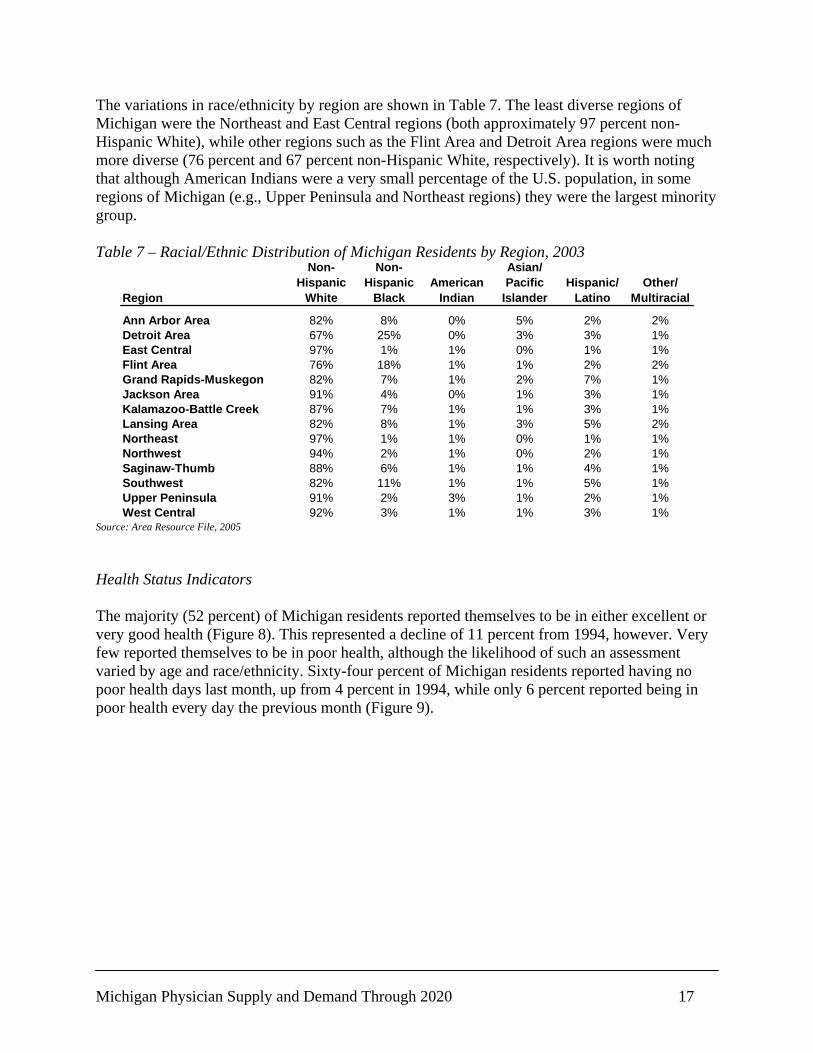
Michigan Physician Supply and Demand Through 2020 17
The variations in race/ethnicity by region are shown in Table 7. The least diverse regions of Michigan were the Northeast and East Central regions (both approximately 97 percent non-Hispanic White), while other regions such as the Flint Area and Detroit Area regions were much more diverse (76 percent and 67 percent non-Hispanic White, respectively). It is worth noting that although American Indians were a very small percentage of the U.S. population, in some regions of Michigan (e.g., Upper Peninsula and Northeast regions) they were the largest minority group. Table 7 – Racial/Ethnic Distribution of Michigan Residents by Region, 2003
Region
Non-Hispanic
White
Non-Hispanic
BlackAmerican
Indian
Asian/ Pacific
IslanderHispanic/
LatinoOther/
Multiracial
Ann Arbor Area 82% 8% 0% 5% 2% 2%Detroit Area 67% 25% 0% 3% 3% 1%East Central 97% 1% 1% 0% 1% 1%Flint Area 76% 18% 1% 1% 2% 2%Grand Rapids-Muskegon 82% 7% 1% 2% 7% 1%Jackson Area 91% 4% 0% 1% 3% 1%Kalamazoo-Battle Creek 87% 7% 1% 1% 3% 1%Lansing Area 82% 8% 1% 3% 5% 2%Northeast 97% 1% 1% 0% 1% 1%Northwest 94% 2% 1% 0% 2% 1%Saginaw-Thumb 88% 6% 1% 1% 4% 1%Southwest 82% 11% 1% 1% 5% 1%Upper Peninsula 91% 2% 3% 1% 2% 1%West Central 92% 3% 1% 1% 3% 1%
Source: Area Resource File, 2005 Health Status Indicators The majority (52 percent) of Michigan residents reported themselves to be in either excellent or very good health (Figure 8). This represented a decline of 11 percent from 1994, however. Very few reported themselves to be in poor health, although the likelihood of such an assessment varied by age and race/ethnicity. Sixty-four percent of Michigan residents reported having no poor health days last month, up from 4 percent in 1994, while only 6 percent reported being in poor health every day the previous month (Figure 9).
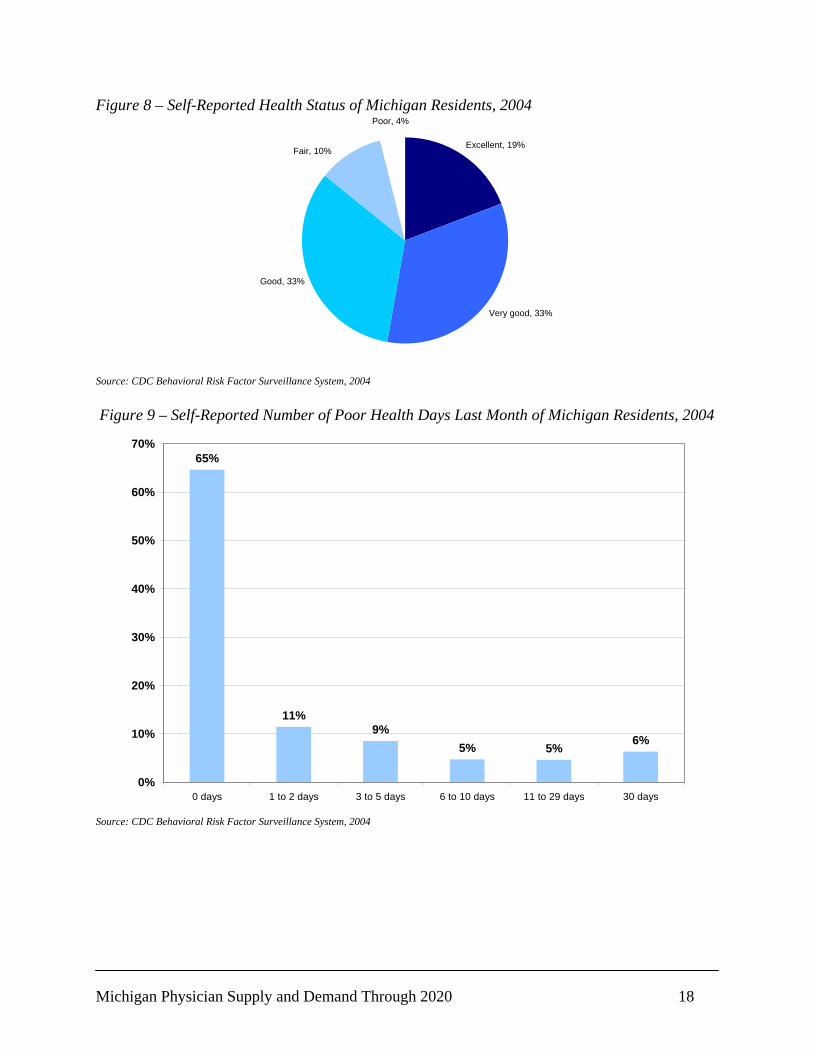
Michigan Physician Supply and Demand Through 2020 18
Figure 8 – Self-Reported Health Status of Michigan Residents, 2004
Excellent, 19%
Very good, 33%
Good, 33%
Fair, 10%
Poor, 4%
Source: CDC Behavioral Risk Factor Surveillance System, 2004 Figure 9 – Self-Reported Number of Poor Health Days Last Month of Michigan Residents, 2004
65%
11%9%
5% 5% 6%
0%
10%
20%
30%
40%
50%
60%
70%
0 days 1 to 2 days 3 to 5 days 6 to 10 days 11 to 29 days 30 days
Source: CDC Behavioral Risk Factor Surveillance System, 2004

Michigan Physician Supply and Demand Through 2020 19
Furthermore, about 88 percent of Michigan residents reported having a health plan, down slightly from 90 percent in 1994 (Figure 10). Regional data from 2004 was not available, but 2000 Census data indicated that certain regions had more uninsured individuals than other regions (Table 8). In particular, the East Central, Southwest, and Flint Area regions had large numbers of uninsured individuals (14 percent, 13 percent, and 13 percent, respectively). In contrast, only 8 percent of the residents of Ann Arbor Area region lacked health insurance. Figure 10 – Percentage of Michigan Residents Reporting Having a Health Plan, 2004
Have Health Plan, 88%
Do Not Have Health Plan, 12%
Source: CDC Behavioral Risk Factor Surveillance System, 2004 Table 8 – Percent without Health Insurance, by Region, 2000
Region
Ann Arbor Area 8%Detroit Area 12%East Central 14%Flint Area 13%Grand Rapids-Muskegon 10%Jackson Area 10%Kalamazoo-Battle Creek 11%Lansing Area 11%Northeast 12%Northwest 11%Saginaw-Thumb 11%Southwest 13%Upper Peninsula 11%West Central 12%
% Without Health Insurance
Source: Area Resource File, 2005
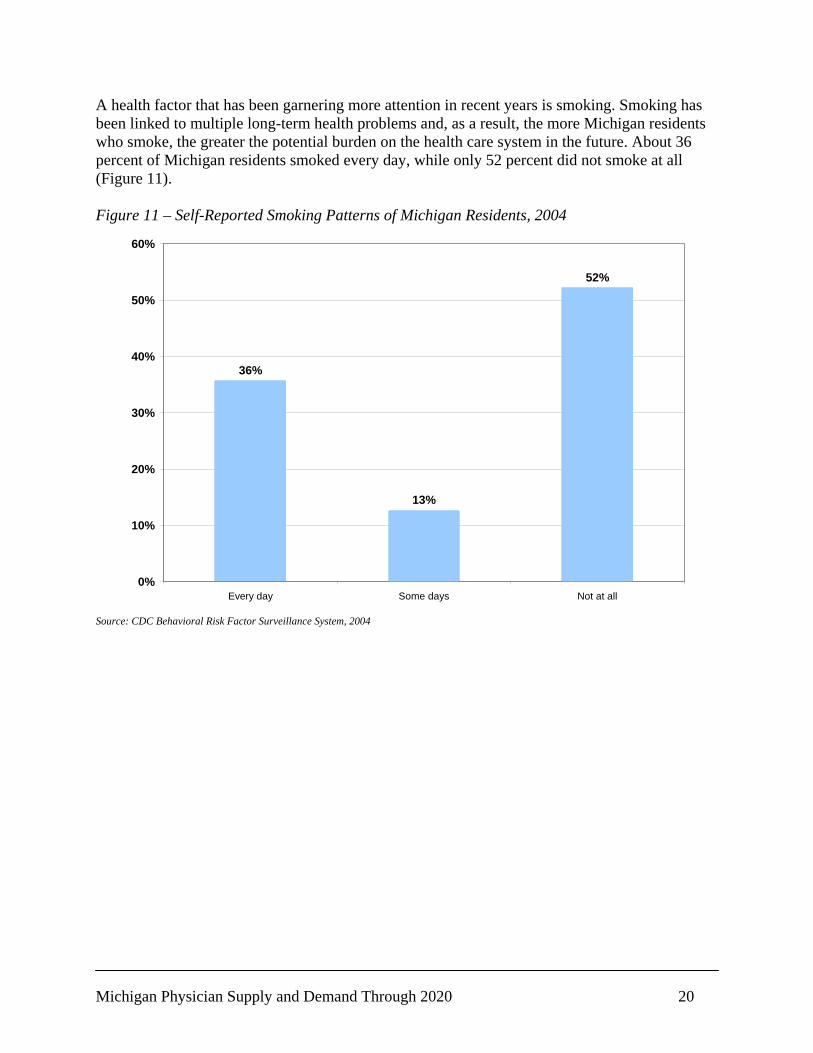
Michigan Physician Supply and Demand Through 2020 20
A health factor that has been garnering more attention in recent years is smoking. Smoking has been linked to multiple long-term health problems and, as a result, the more Michigan residents who smoke, the greater the potential burden on the health care system in the future. About 36 percent of Michigan residents smoked every day, while only 52 percent did not smoke at all (Figure 11). Figure 11 – Self-Reported Smoking Patterns of Michigan Residents, 2004
36%
13%
52%
0%
10%
20%
30%
40%
50%
60%
Every day Some days Not at all
Source: CDC Behavioral Risk Factor Surveillance System, 2004
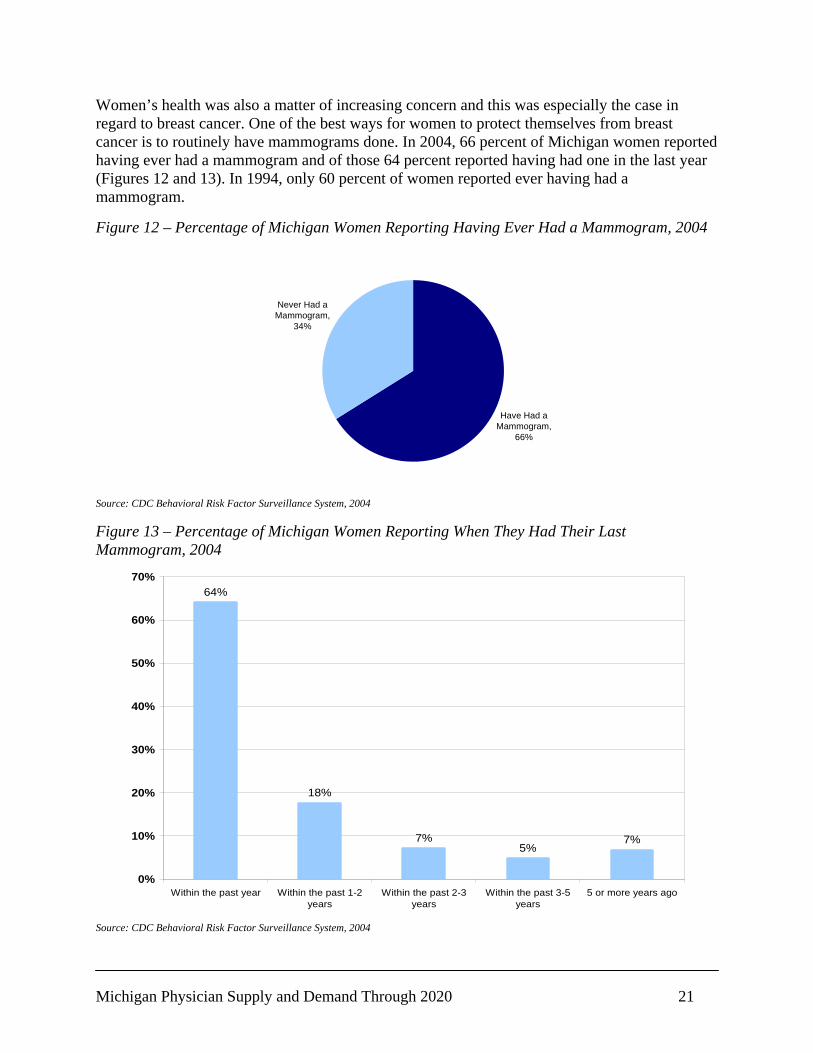
Michigan Physician Supply and Demand Through 2020 21
Women’s health was also a matter of increasing concern and this was especially the case in regard to breast cancer. One of the best ways for women to protect themselves from breast cancer is to routinely have mammograms done. In 2004, 66 percent of Michigan women reported having ever had a mammogram and of those 64 percent reported having had one in the last year (Figures 12 and 13). In 1994, only 60 percent of women reported ever having had a mammogram. Figure 12 – Percentage of Michigan Women Reporting Having Ever Had a Mammogram, 2004
Have Had a Mammogram,
66%
Never Had a Mammogram,
34%
Source: CDC Behavioral Risk Factor Surveillance System, 2004 Figure 13 – Percentage of Michigan Women Reporting When They Had Their Last Mammogram, 2004
64%
18%
7%5%
7%
0%
10%
20%
30%
40%
50%
60%
70%
Within the past year Within the past 1-2years
Within the past 2-3years
Within the past 3-5years
5 or more years ago
Source: CDC Behavioral Risk Factor Surveillance System, 2004

Michigan Physician Supply and Demand Through 2020 22
Chapter 4: Michigan Physician Workforce, 2004 Physicians are central to the delivery of health care to the citizens of Michigan. This report provides a variety of quantitative measures on the size, distribution, and characteristics of the physician workforce in Michigan. An effort was made to present tables and charts that reveal patterns to help readers better understand the dynamics of the physician workforce and to design programs and policies to help improve access to health care in the state. Physician Profile Overview In 2004, more than 29,000 physicians were active in the state of Michigan. In profiling this population, data were drawn from the American Medical Association (AMA) Physician Masterfile as well as the AMA’s Graduate Medical Education Database. Figure 1 – Active Physicians in Michigan, 2004
29,261
27,750
23,769
0 5,000 10,000 15,000 20,000 25,000 30,000 35,000
Professionally ActivePhysicians
Professionally Active, PatientCare Physicians
Professionally Active, Non-Resident, Patient Care
Physicians
Number of Physicians
Exclude 3,981 physicians in residency training.
Exclude 1,511 physicians not providing patient care.
Source: American Medical Association Physician Masterfile, December 2004 In 2004, there were 29,261 professionally active physicians1 in the state of Michigan. Of these, 23,769 (81 percent) were active patient care physicians. Another 1,511 (5 percent) were active in
1 Physicians were considered professionally active if the AMA classified them as neither retired nor inactive in medicine. Physicians whose activity status was unclassified (approximately 2,900) were proportionally allocated to the known activity categories.
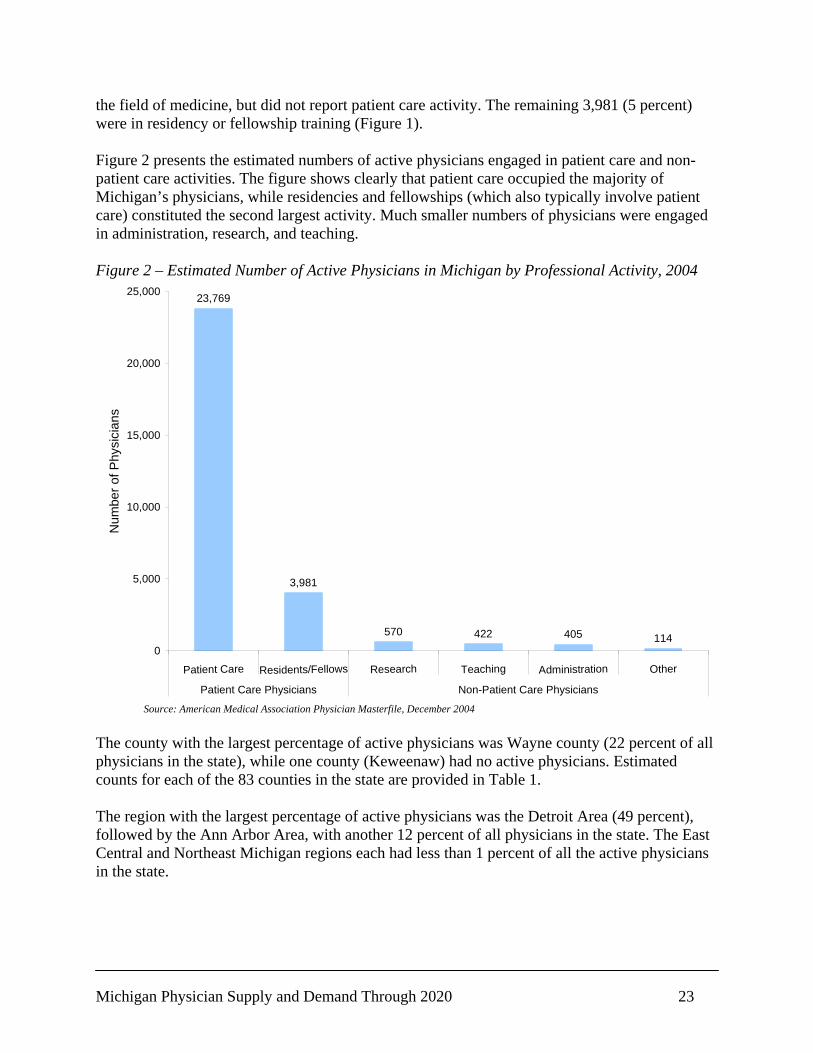
Michigan Physician Supply and Demand Through 2020 23
the field of medicine, but did not report patient care activity. The remaining 3,981 (5 percent) were in residency or fellowship training (Figure 1). Figure 2 presents the estimated numbers of active physicians engaged in patient care and non-patient care activities. The figure shows clearly that patient care occupied the majority of Michigan’s physicians, while residencies and fellowships (which also typically involve patient care) constituted the second largest activity. Much smaller numbers of physicians were engaged in administration, research, and teaching. Figure 2 – Estimated Number of Active Physicians in Michigan by Professional Activity, 2004
23,769
3,981
570 422 405 1140
5,000
10,000
15,000
20,000
25,000
Patient Care Residents/Fellows Research Teaching Administration Other
Patient Care Physicians Non-Patient Care Physicians
Num
ber o
f Phy
sici
ans
Source: American Medical Association Physician Masterfile, December 2004 The county with the largest percentage of active physicians was Wayne county (22 percent of all physicians in the state), while one county (Keweenaw) had no active physicians. Estimated counts for each of the 83 counties in the state are provided in Table 1. The region with the largest percentage of active physicians was the Detroit Area (49 percent), followed by the Ann Arbor Area, with another 12 percent of all physicians in the state. The East Central and Northeast Michigan regions each had less than 1 percent of all the active physicians in the state.
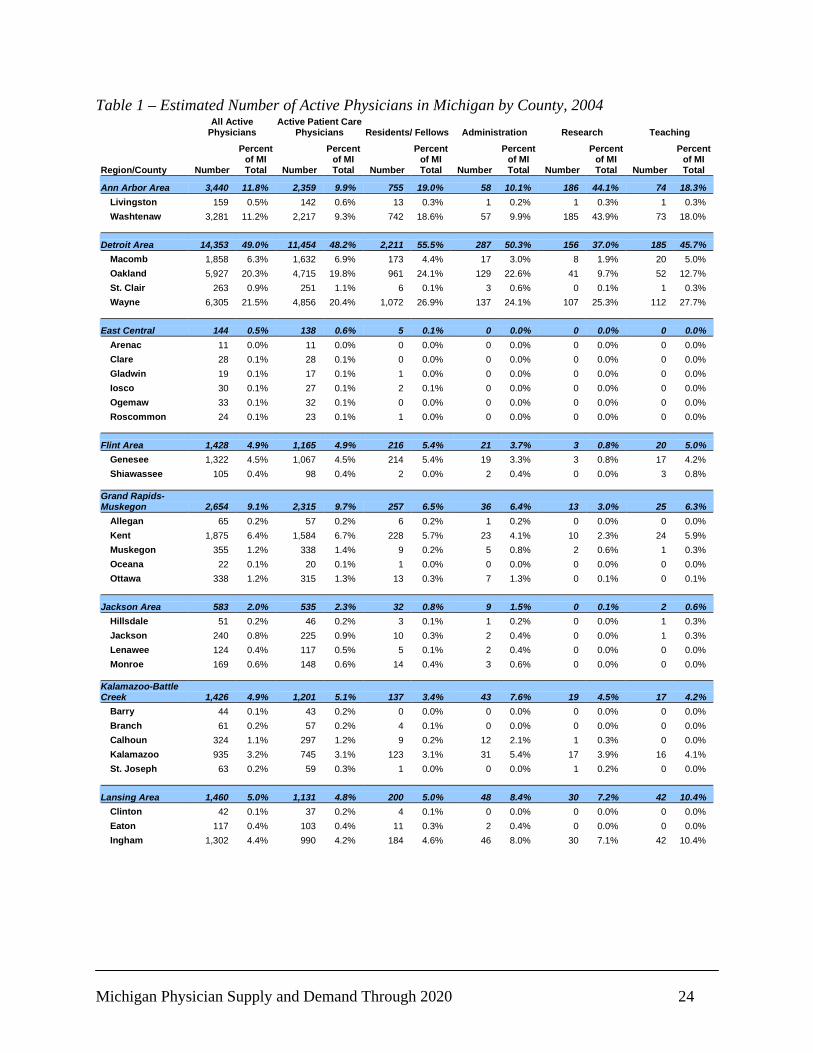
Michigan Physician Supply and Demand Through 2020 24
Table 1 – Estimated Number of Active Physicians in Michigan by County, 2004
All Active Physicians
Active Patient Care Physicians Residents/ Fellows Administration Research Teaching
Region/County Number
Percent of MI Total Number
Percent of MI Total Number
Percent of MI Total Number
Percent of MI Total Number
Percent of MI Total Number
Percent of MI Total
Ann Arbor Area 3,440 11.8% 2,359 9.9% 755 19.0% 58 10.1% 186 44.1% 74 18.3% Livingston 159 0.5% 142 0.6% 13 0.3% 1 0.2% 1 0.3% 1 0.3% Washtenaw 3,281 11.2% 2,217 9.3% 742 18.6% 57 9.9% 185 43.9% 73 18.0%
Detroit Area 14,353 49.0% 11,454 48.2% 2,211 55.5% 287 50.3% 156 37.0% 185 45.7% Macomb 1,858 6.3% 1,632 6.9% 173 4.4% 17 3.0% 8 1.9% 20 5.0% Oakland 5,927 20.3% 4,715 19.8% 961 24.1% 129 22.6% 41 9.7% 52 12.7% St. Clair 263 0.9% 251 1.1% 6 0.1% 3 0.6% 0 0.1% 1 0.3% Wayne 6,305 21.5% 4,856 20.4% 1,072 26.9% 137 24.1% 107 25.3% 112 27.7%
East Central 144 0.5% 138 0.6% 5 0.1% 0 0.0% 0 0.0% 0 0.0% Arenac 11 0.0% 11 0.0% 0 0.0% 0 0.0% 0 0.0% 0 0.0% Clare 28 0.1% 28 0.1% 0 0.0% 0 0.0% 0 0.0% 0 0.0% Gladwin 19 0.1% 17 0.1% 1 0.0% 0 0.0% 0 0.0% 0 0.0% Iosco 30 0.1% 27 0.1% 2 0.1% 0 0.0% 0 0.0% 0 0.0% Ogemaw 33 0.1% 32 0.1% 0 0.0% 0 0.0% 0 0.0% 0 0.0% Roscommon 24 0.1% 23 0.1% 1 0.0% 0 0.0% 0 0.0% 0 0.0%
Flint Area 1,428 4.9% 1,165 4.9% 216 5.4% 21 3.7% 3 0.8% 20 5.0% Genesee 1,322 4.5% 1,067 4.5% 214 5.4% 19 3.3% 3 0.8% 17 4.2% Shiawassee 105 0.4% 98 0.4% 2 0.0% 2 0.4% 0 0.0% 3 0.8%
Grand Rapids-Muskegon 2,654 9.1% 2,315 9.7% 257 6.5% 36 6.4% 13 3.0% 25 6.3%
Allegan 65 0.2% 57 0.2% 6 0.2% 1 0.2% 0 0.0% 0 0.0% Kent 1,875 6.4% 1,584 6.7% 228 5.7% 23 4.1% 10 2.3% 24 5.9% Muskegon 355 1.2% 338 1.4% 9 0.2% 5 0.8% 2 0.6% 1 0.3% Oceana 22 0.1% 20 0.1% 1 0.0% 0 0.0% 0 0.0% 0 0.0% Ottawa 338 1.2% 315 1.3% 13 0.3% 7 1.3% 0 0.1% 0 0.1%
Jackson Area 583 2.0% 535 2.3% 32 0.8% 9 1.5% 0 0.1% 2 0.6% Hillsdale 51 0.2% 46 0.2% 3 0.1% 1 0.2% 0 0.0% 1 0.3% Jackson 240 0.8% 225 0.9% 10 0.3% 2 0.4% 0 0.0% 1 0.3% Lenawee 124 0.4% 117 0.5% 5 0.1% 2 0.4% 0 0.0% 0 0.0% Monroe 169 0.6% 148 0.6% 14 0.4% 3 0.6% 0 0.0% 0 0.0%
Kalamazoo-Battle Creek 1,426 4.9% 1,201 5.1% 137 3.4% 43 7.6% 19 4.5% 17 4.2%
Barry 44 0.1% 43 0.2% 0 0.0% 0 0.0% 0 0.0% 0 0.0% Branch 61 0.2% 57 0.2% 4 0.1% 0 0.0% 0 0.0% 0 0.0% Calhoun 324 1.1% 297 1.2% 9 0.2% 12 2.1% 1 0.3% 0 0.0% Kalamazoo 935 3.2% 745 3.1% 123 3.1% 31 5.4% 17 3.9% 16 4.1% St. Joseph 63 0.2% 59 0.3% 1 0.0% 0 0.0% 1 0.2% 0 0.0%
Lansing Area 1,460 5.0% 1,131 4.8% 200 5.0% 48 8.4% 30 7.2% 42 10.4% Clinton 42 0.1% 37 0.2% 4 0.1% 0 0.0% 0 0.0% 0 0.0% Eaton 117 0.4% 103 0.4% 11 0.3% 2 0.4% 0 0.0% 0 0.0% Ingham 1,302 4.4% 990 4.2% 184 4.6% 46 8.0% 30 7.1% 42 10.4%
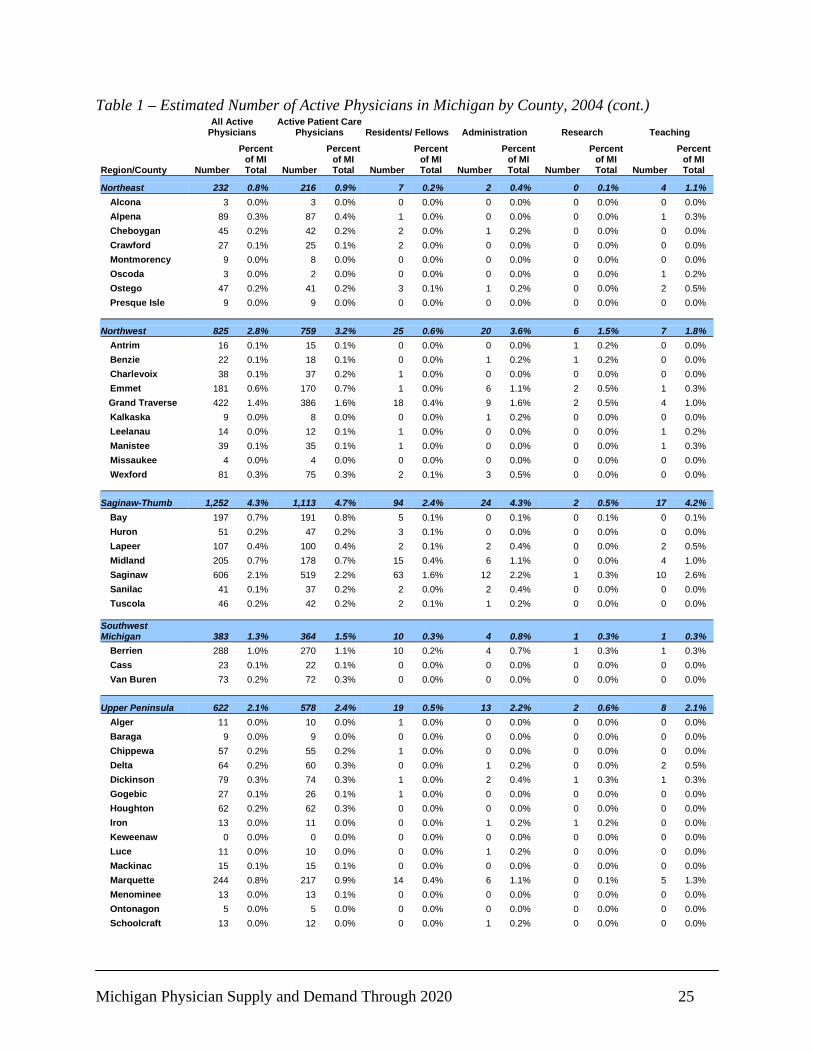
Michigan Physician Supply and Demand Through 2020 25
Table 1 – Estimated Number of Active Physicians in Michigan by County, 2004 (cont.)
All Active Physicians
Active Patient Care Physicians Residents/ Fellows Administration Research Teaching
Region/County Number
Percent of MI Total Number
Percent of MI Total Number
Percent of MI Total Number
Percent of MI Total Number
Percent of MI Total Number
Percent of MI Total
Northeast 232 0.8% 216 0.9% 7 0.2% 2 0.4% 0 0.1% 4 1.1% Alcona 3 0.0% 3 0.0% 0 0.0% 0 0.0% 0 0.0% 0 0.0% Alpena 89 0.3% 87 0.4% 1 0.0% 0 0.0% 0 0.0% 1 0.3% Cheboygan 45 0.2% 42 0.2% 2 0.0% 1 0.2% 0 0.0% 0 0.0% Crawford 27 0.1% 25 0.1% 2 0.0% 0 0.0% 0 0.0% 0 0.0% Montmorency 9 0.0% 8 0.0% 0 0.0% 0 0.0% 0 0.0% 0 0.0% Oscoda 3 0.0% 2 0.0% 0 0.0% 0 0.0% 0 0.0% 1 0.2% Ostego 47 0.2% 41 0.2% 3 0.1% 1 0.2% 0 0.0% 2 0.5% Presque Isle 9 0.0% 9 0.0% 0 0.0% 0 0.0% 0 0.0% 0 0.0%
Northwest 825 2.8% 759 3.2% 25 0.6% 20 3.6% 6 1.5% 7 1.8% Antrim 16 0.1% 15 0.1% 0 0.0% 0 0.0% 1 0.2% 0 0.0% Benzie 22 0.1% 18 0.1% 0 0.0% 1 0.2% 1 0.2% 0 0.0% Charlevoix 38 0.1% 37 0.2% 1 0.0% 0 0.0% 0 0.0% 0 0.0% Emmet 181 0.6% 170 0.7% 1 0.0% 6 1.1% 2 0.5% 1 0.3% Grand Traverse 422 1.4% 386 1.6% 18 0.4% 9 1.6% 2 0.5% 4 1.0% Kalkaska 9 0.0% 8 0.0% 0 0.0% 1 0.2% 0 0.0% 0 0.0% Leelanau 14 0.0% 12 0.1% 1 0.0% 0 0.0% 0 0.0% 1 0.2% Manistee 39 0.1% 35 0.1% 1 0.0% 0 0.0% 0 0.0% 1 0.3% Missaukee 4 0.0% 4 0.0% 0 0.0% 0 0.0% 0 0.0% 0 0.0% Wexford 81 0.3% 75 0.3% 2 0.1% 3 0.5% 0 0.0% 0 0.0%
Saginaw-Thumb 1,252 4.3% 1,113 4.7% 94 2.4% 24 4.3% 2 0.5% 17 4.2% Bay 197 0.7% 191 0.8% 5 0.1% 0 0.1% 0 0.1% 0 0.1% Huron 51 0.2% 47 0.2% 3 0.1% 0 0.0% 0 0.0% 0 0.0% Lapeer 107 0.4% 100 0.4% 2 0.1% 2 0.4% 0 0.0% 2 0.5% Midland 205 0.7% 178 0.7% 15 0.4% 6 1.1% 0 0.0% 4 1.0% Saginaw 606 2.1% 519 2.2% 63 1.6% 12 2.2% 1 0.3% 10 2.6% Sanilac 41 0.1% 37 0.2% 2 0.0% 2 0.4% 0 0.0% 0 0.0% Tuscola 46 0.2% 42 0.2% 2 0.1% 1 0.2% 0 0.0% 0 0.0%
Southwest Michigan 383 1.3% 364 1.5% 10 0.3% 4 0.8% 1 0.3% 1 0.3%
Berrien 288 1.0% 270 1.1% 10 0.2% 4 0.7% 1 0.3% 1 0.3% Cass 23 0.1% 22 0.1% 0 0.0% 0 0.0% 0 0.0% 0 0.0% Van Buren 73 0.2% 72 0.3% 0 0.0% 0 0.0% 0 0.0% 0 0.0%
Upper Peninsula 622 2.1% 578 2.4% 19 0.5% 13 2.2% 2 0.6% 8 2.1% Alger 11 0.0% 10 0.0% 1 0.0% 0 0.0% 0 0.0% 0 0.0% Baraga 9 0.0% 9 0.0% 0 0.0% 0 0.0% 0 0.0% 0 0.0% Chippewa 57 0.2% 55 0.2% 1 0.0% 0 0.0% 0 0.0% 0 0.0% Delta 64 0.2% 60 0.3% 0 0.0% 1 0.2% 0 0.0% 2 0.5% Dickinson 79 0.3% 74 0.3% 1 0.0% 2 0.4% 1 0.3% 1 0.3% Gogebic 27 0.1% 26 0.1% 1 0.0% 0 0.0% 0 0.0% 0 0.0% Houghton 62 0.2% 62 0.3% 0 0.0% 0 0.0% 0 0.0% 0 0.0% Iron 13 0.0% 11 0.0% 0 0.0% 1 0.2% 1 0.2% 0 0.0% Keweenaw 0 0.0% 0 0.0% 0 0.0% 0 0.0% 0 0.0% 0 0.0% Luce 11 0.0% 10 0.0% 0 0.0% 1 0.2% 0 0.0% 0 0.0% Mackinac 15 0.1% 15 0.1% 0 0.0% 0 0.0% 0 0.0% 0 0.0% Marquette 244 0.8% 217 0.9% 14 0.4% 6 1.1% 0 0.1% 5 1.3% Menominee 13 0.0% 13 0.1% 0 0.0% 0 0.0% 0 0.0% 0 0.0% Ontonagon 5 0.0% 5 0.0% 0 0.0% 0 0.0% 0 0.0% 0 0.0% Schoolcraft 13 0.0% 12 0.0% 0 0.0% 1 0.2% 0 0.0% 0 0.0%

Michigan Physician Supply and Demand Through 2020 26
Table 1 – Estimated Number of Active Physicians in Michigan by County, 2004 (cont.)
All Active Physicians
Active Patient Care Physicians Residents/ Fellows Administration Research Teaching
Region/County Number
Percent of MI Total Number
Percent of MI Total Number
Percent of MI Total Number
Percent of MI Total Number
Percent of MI Total Number
Percent of MI Total
West Central 459 1.6% 439 1.8% 12 0.3% 4 0.7% 2 0.4% 1 0.1% Gratiot 67 0.2% 65 0.3% 2 0.0% 0 0.0% 0 0.0% 0 0.0% Ionia 49 0.2% 45 0.2% 2 0.1% 1 0.2% 0 0.0% 0 0.0% Isabella 98 0.3% 94 0.4% 2 0.1% 1 0.2% 0 0.0% 0 0.0% Lake 6 0.0% 5 0.0% 0 0.0% 0 0.0% 1 0.2% 0 0.0% Mason 56 0.2% 55 0.2% 0 0.0% 0 0.0% 0 0.0% 0 0.0% Mecosta 44 0.2% 42 0.2% 0 0.0% 1 0.2% 0 0.0% 0 0.0% Montcalm 79 0.3% 78 0.3% 1 0.0% 0 0.0% 0 0.0% 0 0.0% Newaygo 43 0.1% 39 0.2% 3 0.1% 0 0.0% 0 0.0% 0 0.0% Osceola 18 0.1% 17 0.1% 0 0.0% 0 0.0% 0 0.0% 0 0.0%
Total 29,261 100% 23,769 100% 3,981 100% 570 100% 422 100% 405 100%
Note: Total column does not sum to total due to missing activity information in the AMA Masterfile. Source: American Medical Association Physician Masterfile, December 2004 Physician Demographics Physicians in Michigan were predominantly male (73 percent in 2004), as shown in Figure 3. The representation of women varied greatly by specialty. Pediatrics had the largest contingent of women (56 percent). Primary care specialties and obstetrics/gynecology were among the specialties with the greatest proportion of women. Surgery and its related subspecialties had the smallest representation of women. Figure 3 – Gender of Active Patient Care Physicians in Michigan, 2004
Female27%
Male73%
Source: American Medical Association Physician Masterfile, December 2004
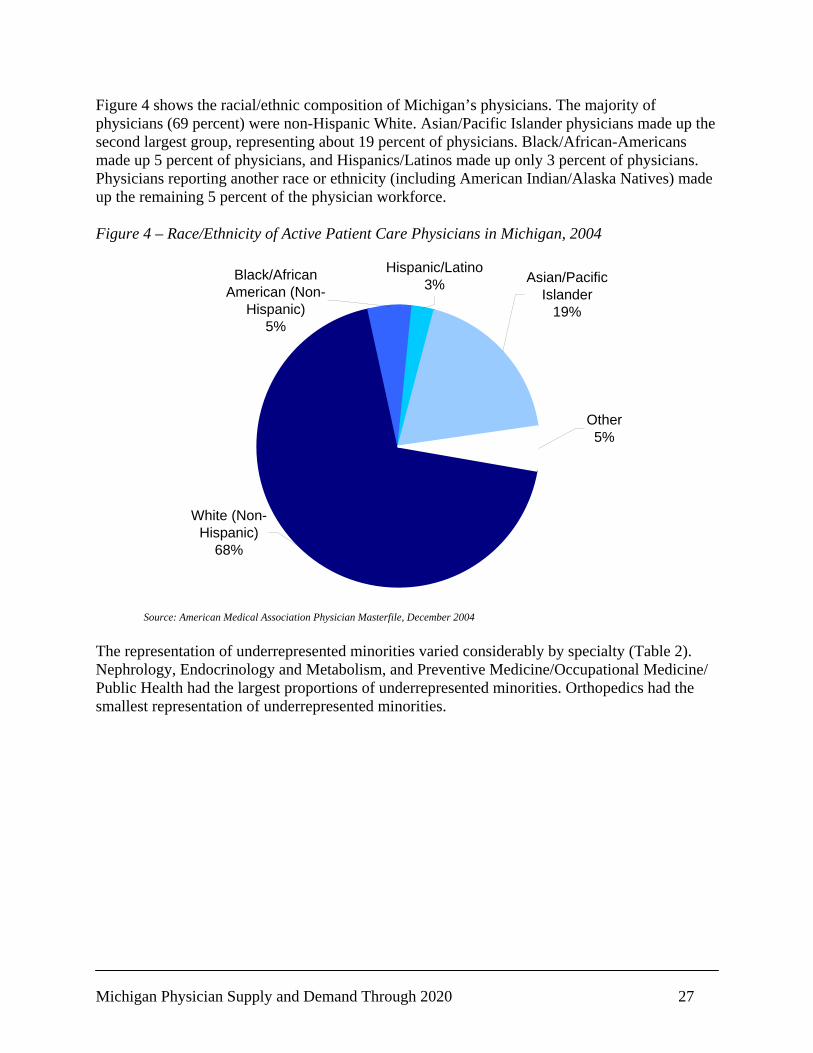
Michigan Physician Supply and Demand Through 2020 27
Figure 4 shows the racial/ethnic composition of Michigan’s physicians. The majority of physicians (69 percent) were non-Hispanic White. Asian/Pacific Islander physicians made up the second largest group, representing about 19 percent of physicians. Black/African-Americans made up 5 percent of physicians, and Hispanics/Latinos made up only 3 percent of physicians. Physicians reporting another race or ethnicity (including American Indian/Alaska Natives) made up the remaining 5 percent of the physician workforce. Figure 4 – Race/Ethnicity of Active Patient Care Physicians in Michigan, 2004
White (Non-Hispanic)
68%
Hispanic/Latino3%
Black/African American (Non-
Hispanic)5%
Other5%
Asian/Pacific Islander
19%
Source: American Medical Association Physician Masterfile, December 2004 The representation of underrepresented minorities varied considerably by specialty (Table 2). Nephrology, Endocrinology and Metabolism, and Preventive Medicine/Occupational Medicine/ Public Health had the largest proportions of underrepresented minorities. Orthopedics had the smallest representation of underrepresented minorities.
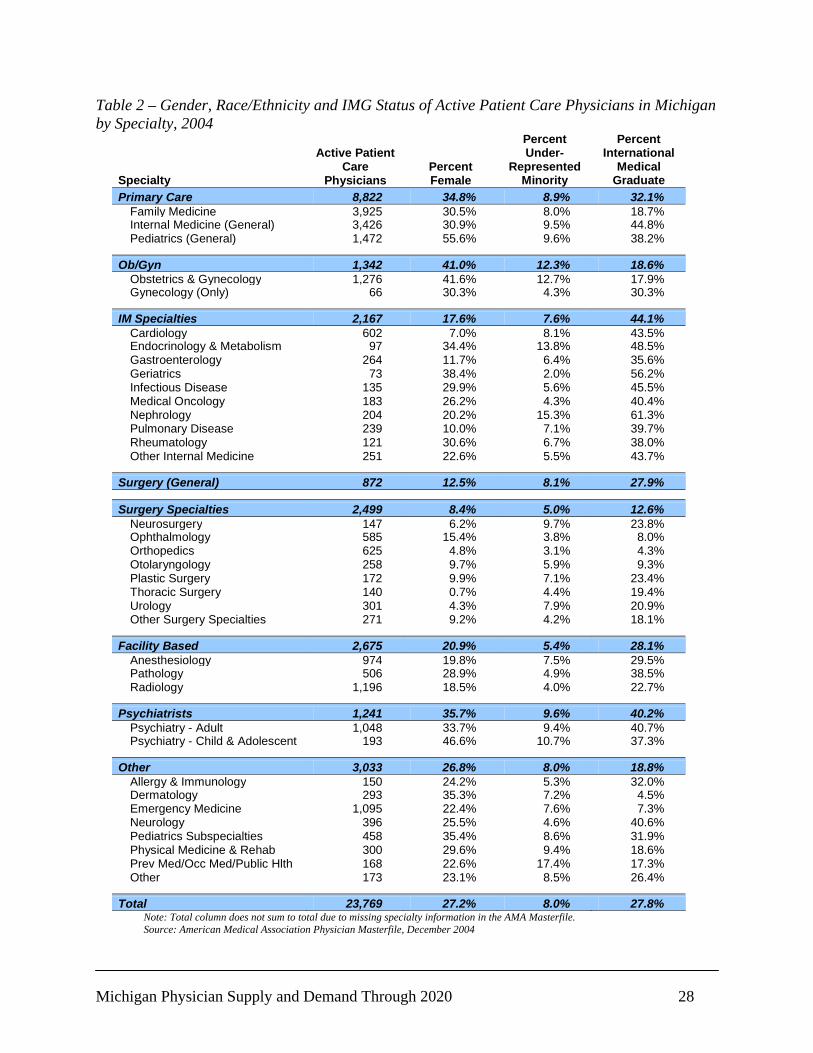
Michigan Physician Supply and Demand Through 2020 28
Table 2 – Gender, Race/Ethnicity and IMG Status of Active Patient Care Physicians in Michigan by Specialty, 2004
Specialty
Active Patient Care
Physicians Percent Female
Percent Under-
Represented Minority
Percent International
Medical Graduate
Primary Care 8,822 34.8% 8.9% 32.1% Family Medicine 3,925 30.5% 8.0% 18.7%Internal Medicine (General) 3,426 30.9% 9.5% 44.8% Pediatrics (General) 1,472 55.6% 9.6% 38.2%
Ob/Gyn 1,342 41.0% 12.3% 18.6% Obstetrics & Gynecology 1,276 41.6% 12.7% 17.9%Gynecology (Only) 66 30.3% 4.3% 30.3%
IM Specialties 2,167 17.6% 7.6% 44.1% Cardiology 602 7.0% 8.1% 43.5%Endocrinology & Metabolism 97 34.4% 13.8% 48.5% Gastroenterology 264 11.7% 6.4% 35.6% Geriatrics 73 38.4% 2.0% 56.2% Infectious Disease 135 29.9% 5.6% 45.5% Medical Oncology 183 26.2% 4.3% 40.4% Nephrology 204 20.2% 15.3% 61.3% Pulmonary Disease 239 10.0% 7.1% 39.7% Rheumatology 121 30.6% 6.7% 38.0% Other Internal Medicine 251 22.6% 5.5% 43.7%
Surgery (General) 872 12.5% 8.1% 27.9%
Surgery Specialties 2,499 8.4% 5.0% 12.6% Neurosurgery 147 6.2% 9.7% 23.8%Ophthalmology 585 15.4% 3.8% 8.0% Orthopedics 625 4.8% 3.1% 4.3% Otolaryngology 258 9.7% 5.9% 9.3% Plastic Surgery 172 9.9% 7.1% 23.4% Thoracic Surgery 140 0.7% 4.4% 19.4% Urology 301 4.3% 7.9% 20.9% Other Surgery Specialties 271 9.2% 4.2% 18.1%
Facility Based 2,675 20.9% 5.4% 28.1% Anesthesiology 974 19.8% 7.5% 29.5%Pathology 506 28.9% 4.9% 38.5% Radiology 1,196 18.5% 4.0% 22.7%
Psychiatrists 1,241 35.7% 9.6% 40.2% Psychiatry - Adult 1,048 33.7% 9.4% 40.7%Psychiatry - Child & Adolescent 193 46.6% 10.7% 37.3%
Other 3,033 26.8% 8.0% 18.8% Allergy & Immunology 150 24.2% 5.3% 32.0%Dermatology 293 35.3% 7.2% 4.5% Emergency Medicine 1,095 22.4% 7.6% 7.3% Neurology 396 25.5% 4.6% 40.6% Pediatrics Subspecialties 458 35.4% 8.6% 31.9% Physical Medicine & Rehab 300 29.6% 9.4% 18.6% Prev Med/Occ Med/Public Hlth 168 22.6% 17.4% 17.3% Other 173 23.1% 8.5% 26.4%
Total 23,769 27.2% 8.0% 27.8% Note: Total column does not sum to total due to missing specialty information in the AMA Masterfile. Source: American Medical Association Physician Masterfile, December 2004
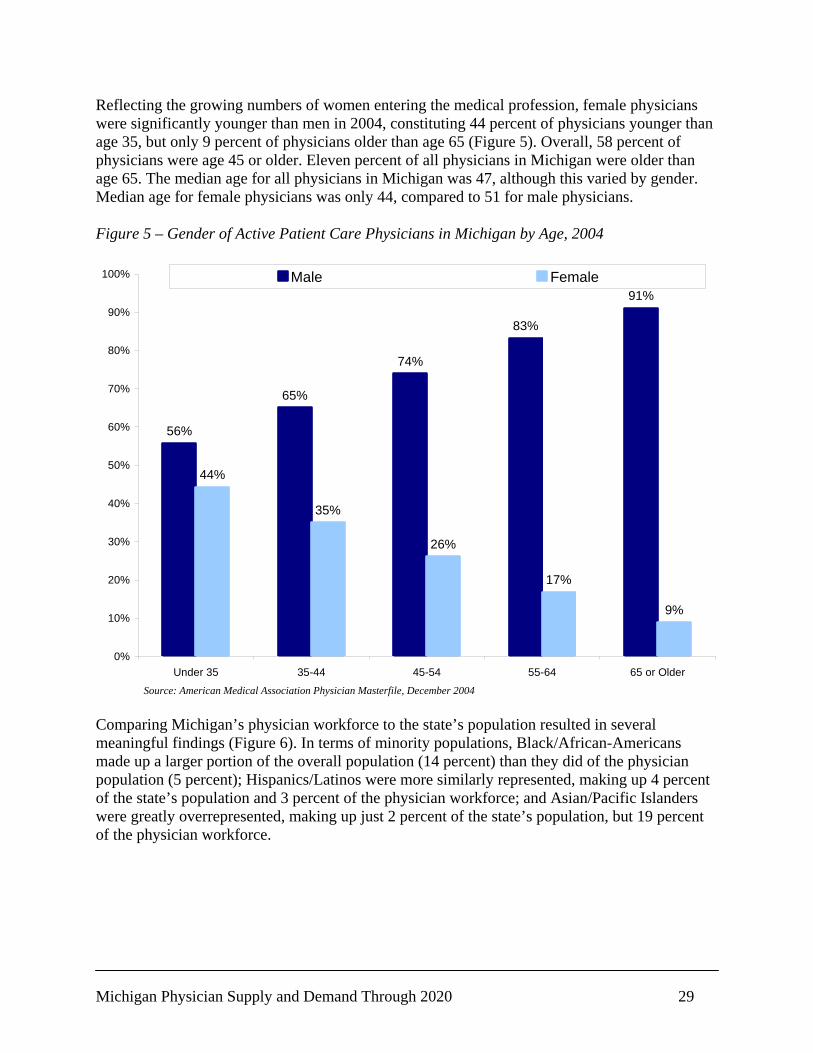
Michigan Physician Supply and Demand Through 2020 29
Reflecting the growing numbers of women entering the medical profession, female physicians were significantly younger than men in 2004, constituting 44 percent of physicians younger than age 35, but only 9 percent of physicians older than age 65 (Figure 5). Overall, 58 percent of physicians were age 45 or older. Eleven percent of all physicians in Michigan were older than age 65. The median age for all physicians in Michigan was 47, although this varied by gender. Median age for female physicians was only 44, compared to 51 for male physicians. Figure 5 – Gender of Active Patient Care Physicians in Michigan by Age, 2004
56%
65%
74%
83%
91%
44%
35%
26%
17%
9%
0%
10%
20%
30%
40%
50%
60%
70%
80%
90%
100%
Under 35 35-44 45-54 55-64 65 or Older
Male Female
Source: American Medical Association Physician Masterfile, December 2004 Comparing Michigan’s physician workforce to the state’s population resulted in several meaningful findings (Figure 6). In terms of minority populations, Black/African-Americans made up a larger portion of the overall population (14 percent) than they did of the physician population (5 percent); Hispanics/Latinos were more similarly represented, making up 4 percent of the state’s population and 3 percent of the physician workforce; and Asian/Pacific Islanders were greatly overrepresented, making up just 2 percent of the state’s population, but 19 percent of the physician workforce.
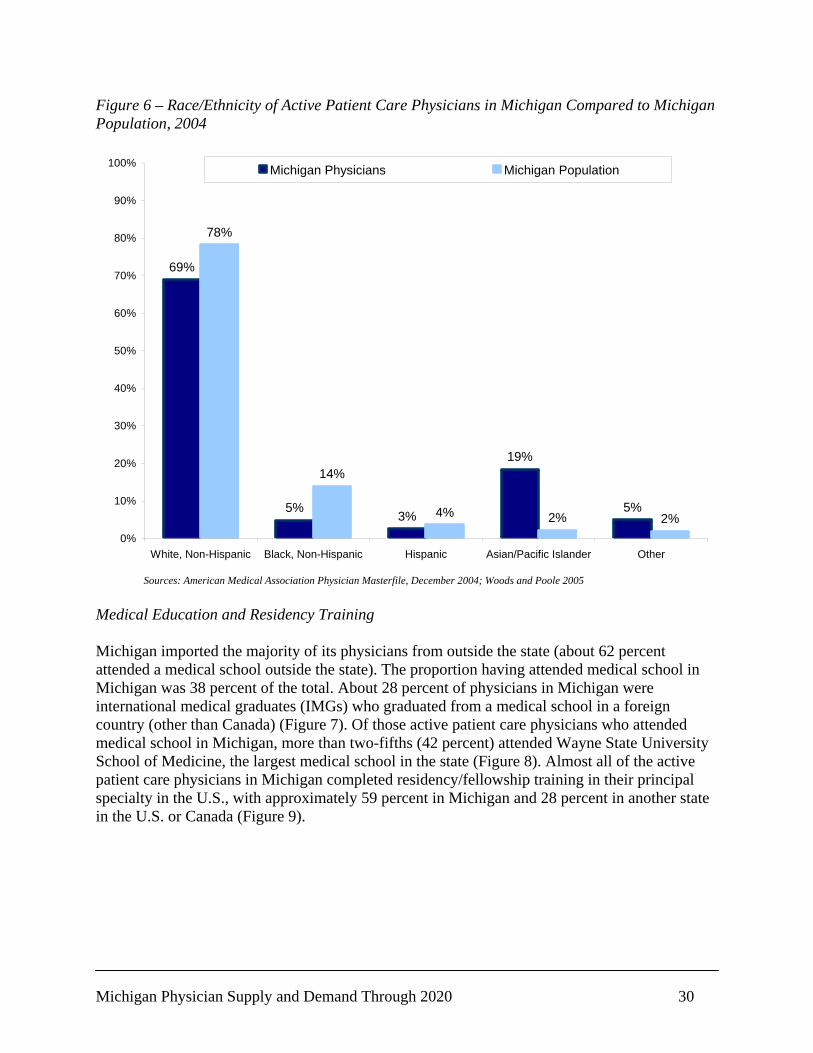
Michigan Physician Supply and Demand Through 2020 30
Figure 6 – Race/Ethnicity of Active Patient Care Physicians in Michigan Compared to Michigan Population, 2004
69%
5%3%
19%
5%
78%
14%
4% 2% 2%0%
10%
20%
30%
40%
50%
60%
70%
80%
90%
100%
White, Non-Hispanic Black, Non-Hispanic Hispanic Asian/Pacific Islander Other
Michigan Physicians Michigan Population
Sources: American Medical Association Physician Masterfile, December 2004; Woods and Poole 2005 Medical Education and Residency Training Michigan imported the majority of its physicians from outside the state (about 62 percent attended a medical school outside the state). The proportion having attended medical school in Michigan was 38 percent of the total. About 28 percent of physicians in Michigan were international medical graduates (IMGs) who graduated from a medical school in a foreign country (other than Canada) (Figure 7). Of those active patient care physicians who attended medical school in Michigan, more than two-fifths (42 percent) attended Wayne State University School of Medicine, the largest medical school in the state (Figure 8). Almost all of the active patient care physicians in Michigan completed residency/fellowship training in their principal specialty in the U.S., with approximately 59 percent in Michigan and 28 percent in another state in the U.S. or Canada (Figure 9).

Michigan Physician Supply and Demand Through 2020 31
Figure 7 – Location of Medical Education of Active Patient Care Physicians in Michigan, 2004
Michigan, 38%
Other Foreign Country, 28%
Other US/Canada, 34%
Source: American Medical Association Physician Masterfile, December 2004 Figure 8 – Location of Primary Residency Training of Active Patient Care Physicians in Michigan, 2004
Michigan, 59%Other US, 28%
Foreign Country, 14%
Source: American Medical Association Physician Masterfile, December 2004
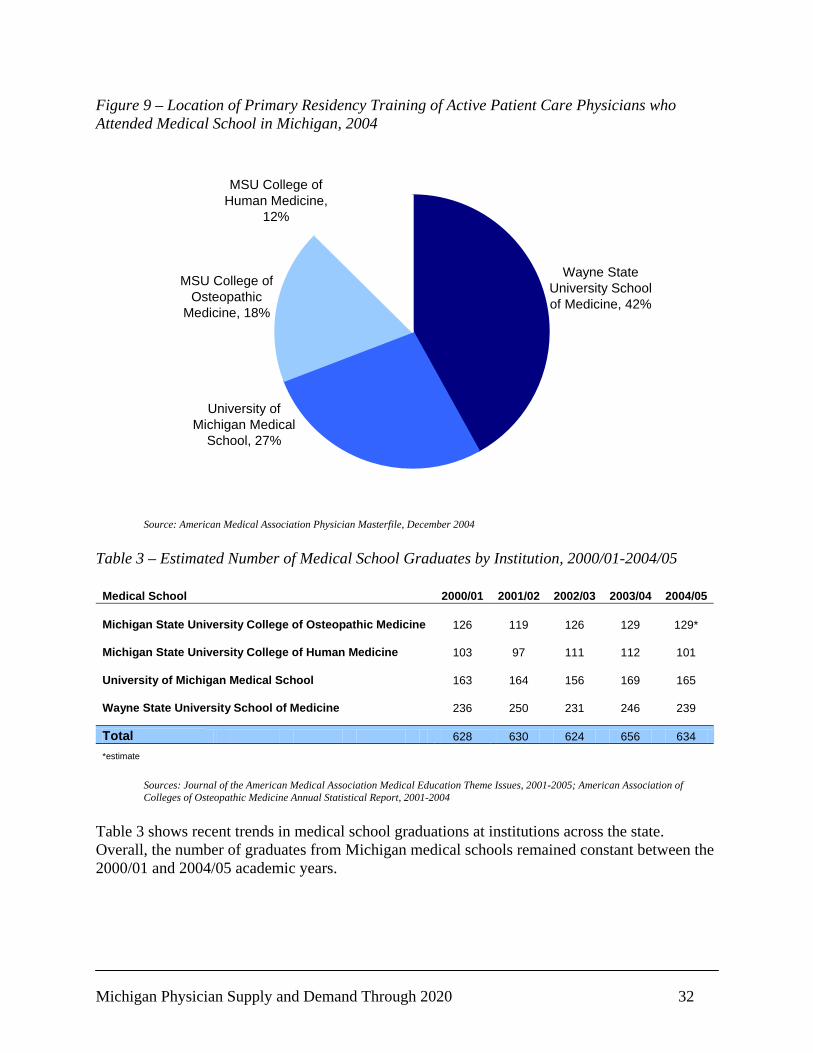
Michigan Physician Supply and Demand Through 2020 32
Figure 9 – Location of Primary Residency Training of Active Patient Care Physicians who Attended Medical School in Michigan, 2004
Wayne State University School of Medicine, 42%
MSU College of Osteopathic
Medicine, 18%
MSU College of Human Medicine,
12%
University of Michigan Medical
School, 27%
Source: American Medical Association Physician Masterfile, December 2004 Table 3 – Estimated Number of Medical School Graduates by Institution, 2000/01-2004/05
Medical School 2000/01 2001/02 2002/03 2003/04 2004/05
Michigan State University College of Osteopathic Medicine 126 119 126 129 129*
Michigan State University College of Human Medicine 103 97 111 112 101
University of Michigan Medical School 163 164 156 169 165
Wayne State University School of Medicine 236 250 231 246 239
Total 628 630 624 656 634 *estimate
Sources: Journal of the American Medical Association Medical Education Theme Issues, 2001-2005; American Association of
Colleges of Osteopathic Medicine Annual Statistical Report, 2001-2004 Table 3 shows recent trends in medical school graduations at institutions across the state. Overall, the number of graduates from Michigan medical schools remained constant between the 2000/01 and 2004/05 academic years.

Michigan Physician Supply and Demand Through 2020 33
Figure 10 – Percent Change in Number of Medical School Students, Population and Students per 100,000 Population in Michigan and the U.S., 1994/95-2003/04
-4%
5%6%
8%
-3%
-9%
-15%
-10%
-5%
0%
5%
10%
15%
Michigan United States
Medical Students Population Medical Students per 100,000 Population
Sources: Center for Health Workforce Studies; Association of American Medical Colleges; U.S. Census Bureau Figure 10 compares the growth in medical enrollment, population, and medical enrollment per 100,000 population between the 1994/95 and 2003/04 academic years in Michigan and the U.S. Overall, Michigan was not faring as well as the U.S. in terms of medical school enrollment keeping pace with population growth. While Michigan’s population grew by 6 percent over the 10 year period of interest, medical school enrollment in the state decreased by 4 percent, leading to a net loss of nearly 9 percent in the medical student to population ratio in the state. This compared to a net loss of 3 percent in the medical students to population ratio across the country. Table 4 shows the proportions of physicians who attended medical school in Michigan and those who received residency/fellowship training in their principal specialty in Michigan by principal specialty. More than half of Michigan’s active patient care Dermatologists, Emergency Medicine physicians, Orthopedic Surgeons, and Ophthalmologists attended a medical school in Michigan. More than 70 percent of Michigan’s active patient care General Internists, Adult Psychiatrists, and Child and Adolescent Psychiatrists completed graduate medical training in Michigan.
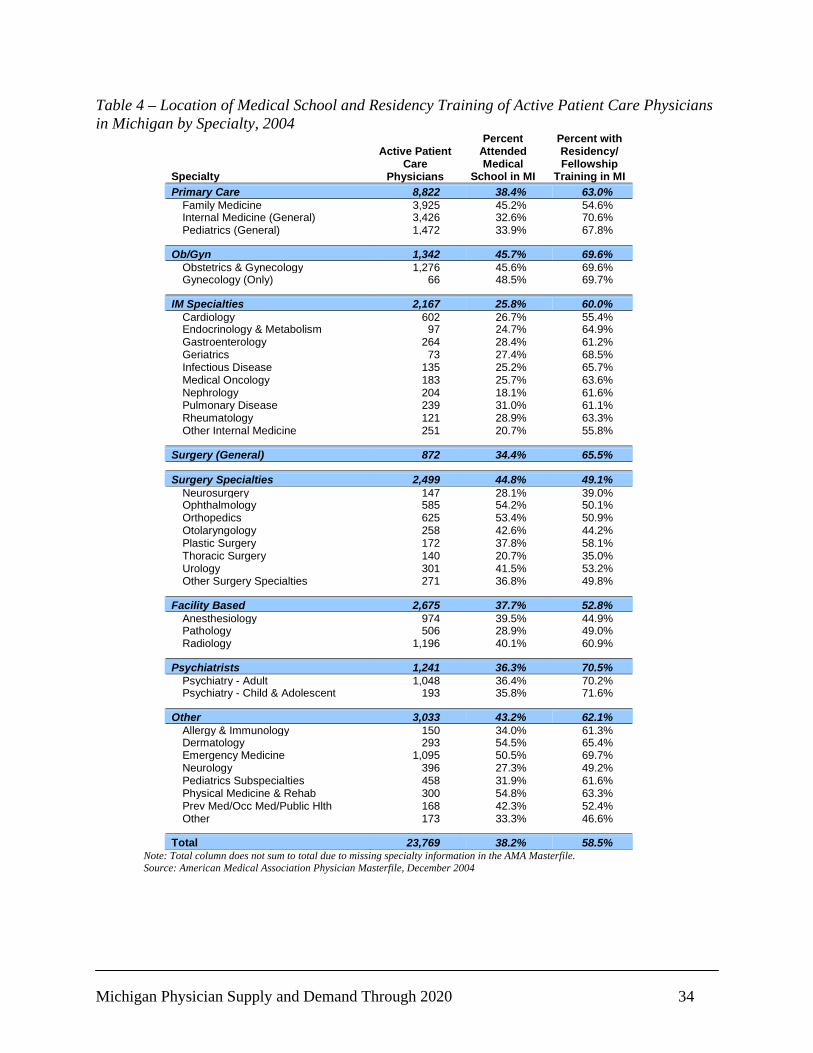
Michigan Physician Supply and Demand Through 2020 34
Table 4 – Location of Medical School and Residency Training of Active Patient Care Physicians in Michigan by Specialty, 2004
Specialty
Active Patient Care
Physicians
Percent Attended Medical
School in MI
Percent with Residency/ Fellowship
Training in MI Primary Care 8,822 38.4% 63.0%
Family Medicine 3,925 45.2% 54.6% Internal Medicine (General) 3,426 32.6% 70.6% Pediatrics (General) 1,472 33.9% 67.8%
Ob/Gyn 1,342 45.7% 69.6% Obstetrics & Gynecology 1,276 45.6% 69.6% Gynecology (Only) 66 48.5% 69.7%
IM Specialties 2,167 25.8% 60.0% Cardiology 602 26.7% 55.4% Endocrinology & Metabolism 97 24.7% 64.9% Gastroenterology 264 28.4% 61.2% Geriatrics 73 27.4% 68.5% Infectious Disease 135 25.2% 65.7% Medical Oncology 183 25.7% 63.6% Nephrology 204 18.1% 61.6% Pulmonary Disease 239 31.0% 61.1% Rheumatology 121 28.9% 63.3% Other Internal Medicine 251 20.7% 55.8%
Surgery (General) 872 34.4% 65.5%
Surgery Specialties 2,499 44.8% 49.1% Neurosurgery 147 28.1% 39.0% Ophthalmology 585 54.2% 50.1% Orthopedics 625 53.4% 50.9% Otolaryngology 258 42.6% 44.2% Plastic Surgery 172 37.8% 58.1% Thoracic Surgery 140 20.7% 35.0% Urology 301 41.5% 53.2% Other Surgery Specialties 271 36.8% 49.8%
Facility Based 2,675 37.7% 52.8% Anesthesiology 974 39.5% 44.9% Pathology 506 28.9% 49.0% Radiology 1,196 40.1% 60.9%
Psychiatrists 1,241 36.3% 70.5% Psychiatry - Adult 1,048 36.4% 70.2% Psychiatry - Child & Adolescent 193 35.8% 71.6%
Other 3,033 43.2% 62.1% Allergy & Immunology 150 34.0% 61.3% Dermatology 293 54.5% 65.4% Emergency Medicine 1,095 50.5% 69.7% Neurology 396 27.3% 49.2% Pediatrics Subspecialties 458 31.9% 61.6% Physical Medicine & Rehab 300 54.8% 63.3% Prev Med/Occ Med/Public Hlth 168 42.3% 52.4% Other 173 33.3% 46.6%
Total 23,769 38.2% 58.5% Note: Total column does not sum to total due to missing specialty information in the AMA Masterfile. Source: American Medical Association Physician Masterfile, December 2004
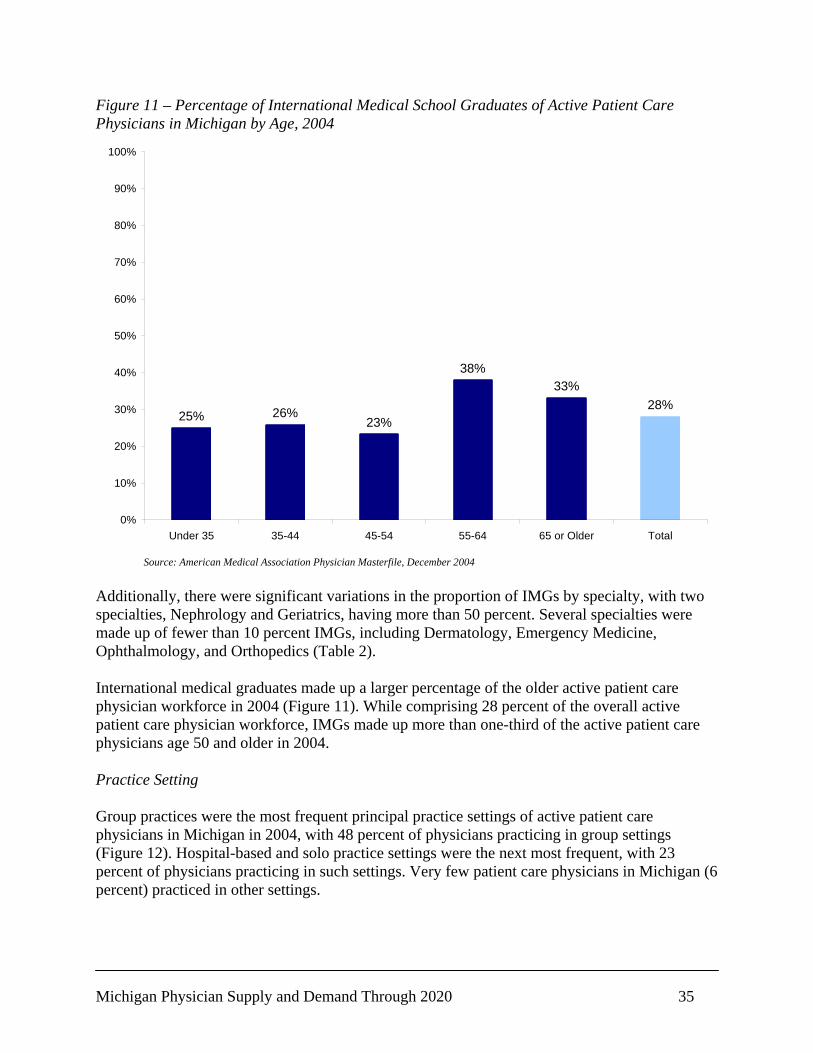
Michigan Physician Supply and Demand Through 2020 35
Figure 11 – Percentage of International Medical School Graduates of Active Patient Care Physicians in Michigan by Age, 2004
25% 26%23%
38%33%
28%
0%
10%
20%
30%
40%
50%
60%
70%
80%
90%
100%
Under 35 35-44 45-54 55-64 65 or Older Total
Source: American Medical Association Physician Masterfile, December 2004 Additionally, there were significant variations in the proportion of IMGs by specialty, with two specialties, Nephrology and Geriatrics, having more than 50 percent. Several specialties were made up of fewer than 10 percent IMGs, including Dermatology, Emergency Medicine, Ophthalmology, and Orthopedics (Table 2). International medical graduates made up a larger percentage of the older active patient care physician workforce in 2004 (Figure 11). While comprising 28 percent of the overall active patient care physician workforce, IMGs made up more than one-third of the active patient care physicians age 50 and older in 2004. Practice Setting Group practices were the most frequent principal practice settings of active patient care physicians in Michigan in 2004, with 48 percent of physicians practicing in group settings (Figure 12). Hospital-based and solo practice settings were the next most frequent, with 23 percent of physicians practicing in such settings. Very few patient care physicians in Michigan (6 percent) practiced in other settings.
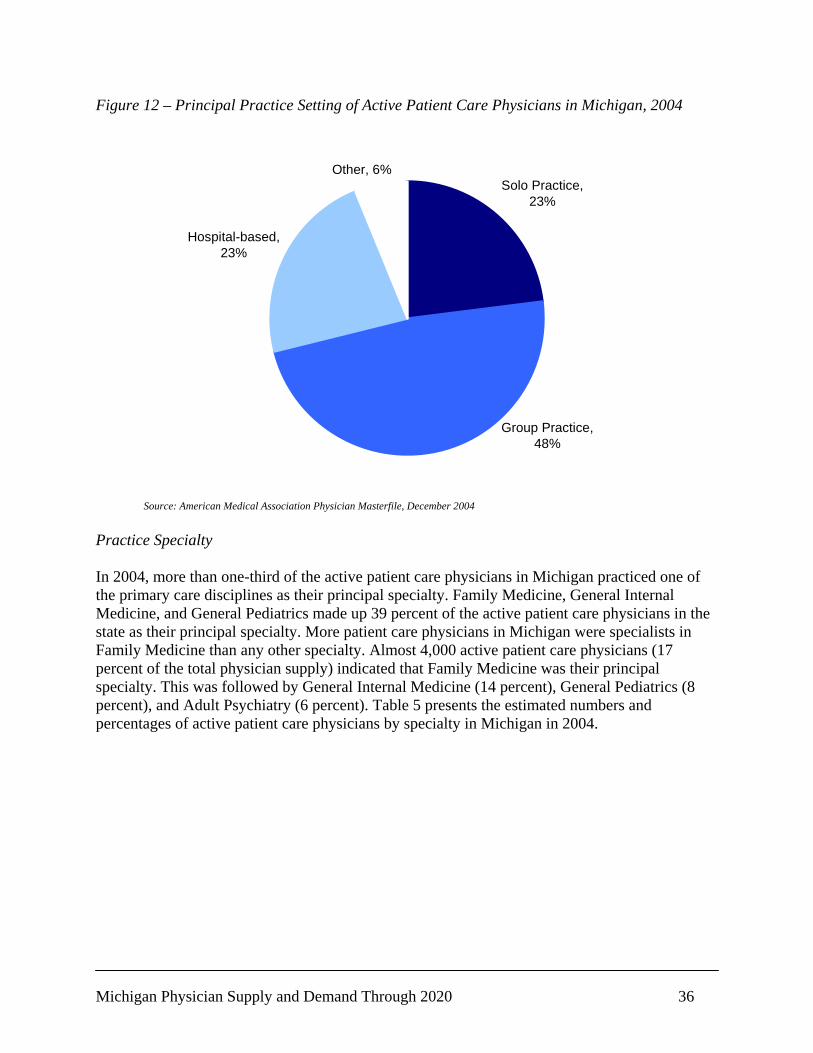
Michigan Physician Supply and Demand Through 2020 36
Figure 12 – Principal Practice Setting of Active Patient Care Physicians in Michigan, 2004
Solo Practice, 23%
Hospital-based, 23%
Other, 6%
Group Practice, 48%
Source: American Medical Association Physician Masterfile, December 2004 Practice Specialty In 2004, more than one-third of the active patient care physicians in Michigan practiced one of the primary care disciplines as their principal specialty. Family Medicine, General Internal Medicine, and General Pediatrics made up 39 percent of the active patient care physicians in the state as their principal specialty. More patient care physicians in Michigan were specialists in Family Medicine than any other specialty. Almost 4,000 active patient care physicians (17 percent of the total physician supply) indicated that Family Medicine was their principal specialty. This was followed by General Internal Medicine (14 percent), General Pediatrics (8 percent), and Adult Psychiatry (6 percent). Table 5 presents the estimated numbers and percentages of active patient care physicians by specialty in Michigan in 2004.
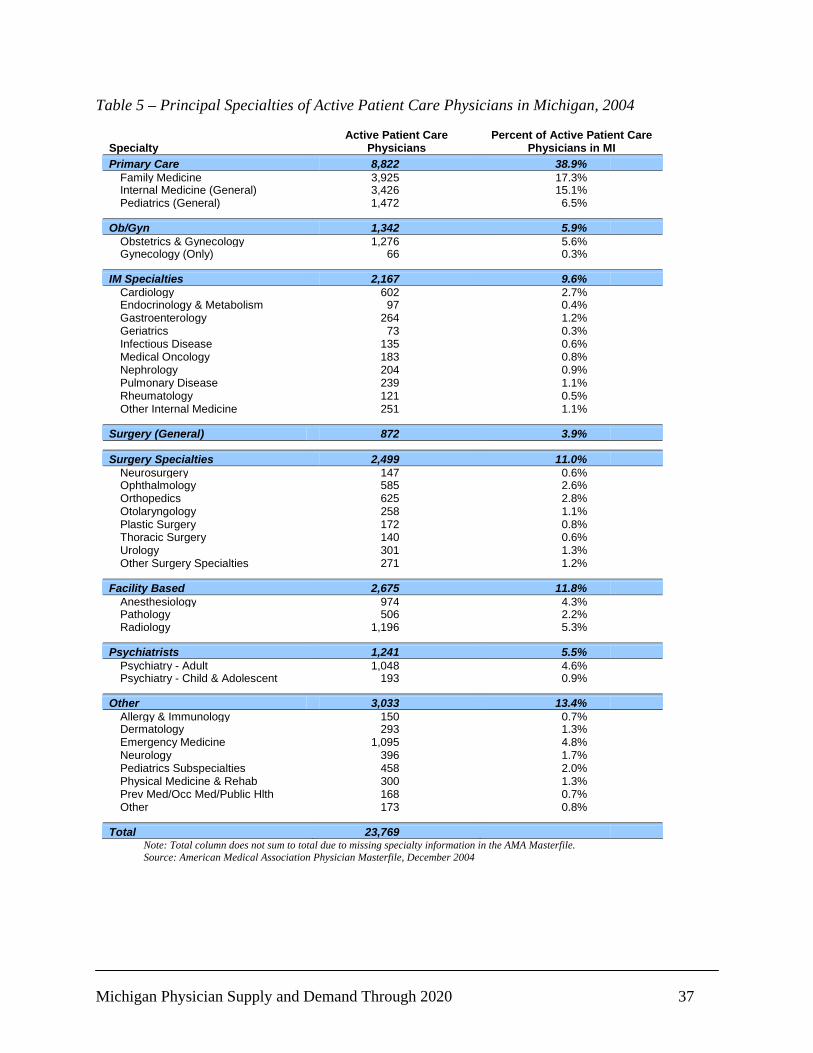
Michigan Physician Supply and Demand Through 2020 37
Table 5 – Principal Specialties of Active Patient Care Physicians in Michigan, 2004
Specialty Active Patient Care
Physicians Percent of Active Patient Care
Physicians in MI Primary Care 8,822 38.9%
Family Medicine 3,925 17.3% Internal Medicine (General) 3,426 15.1% Pediatrics (General) 1,472 6.5%
Ob/Gyn 1,342 5.9% Obstetrics & Gynecology 1,276 5.6% Gynecology (Only) 66 0.3%
IM Specialties 2,167 9.6% Cardiology 602 2.7% Endocrinology & Metabolism 97 0.4% Gastroenterology 264 1.2% Geriatrics 73 0.3% Infectious Disease 135 0.6% Medical Oncology 183 0.8% Nephrology 204 0.9% Pulmonary Disease 239 1.1% Rheumatology 121 0.5% Other Internal Medicine 251 1.1%
Surgery (General) 872 3.9%
Surgery Specialties 2,499 11.0% Neurosurgery 147 0.6% Ophthalmology 585 2.6% Orthopedics 625 2.8% Otolaryngology 258 1.1% Plastic Surgery 172 0.8% Thoracic Surgery 140 0.6% Urology 301 1.3% Other Surgery Specialties 271 1.2%
Facility Based 2,675 11.8% Anesthesiology 974 4.3% Pathology 506 2.2% Radiology 1,196 5.3%
Psychiatrists 1,241 5.5% Psychiatry - Adult 1,048 4.6% Psychiatry - Child & Adolescent 193 0.9%
Other 3,033 13.4% Allergy & Immunology 150 0.7% Dermatology 293 1.3% Emergency Medicine 1,095 4.8% Neurology 396 1.7% Pediatrics Subspecialties 458 2.0% Physical Medicine & Rehab 300 1.3% Prev Med/Occ Med/Public Hlth 168 0.7% Other 173 0.8%
Total 23,769 Note: Total column does not sum to total due to missing specialty information in the AMA Masterfile. Source: American Medical Association Physician Masterfile, December 2004

Michigan Physician Supply and Demand Through 2020 38
Potential Shortage Areas In 2004, the East Central region had the lowest number of active patient care physicians per 100,000 population (92 per 100,000). The Ann Arbor Area had the highest number of active patient care physicians per 100,000 population (449 per 100,000). As is evident in Table 6, this five-fold difference means there were several regions that fell well below established benchmarks of adequate physician supply. Moreover, these disparities were important to consider when interpreting regional supply and demand forecasts. In the mid-1990s, the Council on Graduate Medical Education developed physician supply recommendations. Based on the results of a meta-analysis of a handful of national level physician requirement studies, the COGME recommended ratios of 60-80 primary care physicians per 100,000 population and 85-105 non-primary care physicians per 100,000 COGME 1996). The Division of Shortage Designation of the U.S. Department of Health and Human Services formally defined Health Professional Shortage Areas (HPSAs). One of the key factors in the assessment of whether an area, population, or facility qualifies as a HPSA was the population-to-provider ratio.2 Thus, with the available data on physicians, it was possible to make some crude assessments of the potential designation of areas of Michigan as HPSAs. Table 6 provides the active patient care physicians and primary care physicians per 100,000 resident population by county. As shown in the table, a number of counties in the state fell below the provider-to-population ratios recommended by the COGME and the federal Division of Shortage Designation. While this method of identifying shortage areas was crude, it did indicate there were certain areas of the state that deserved more attention than others in terms of the current physician supply.
2 Other key factors for designating primary care HPSAs include whether the area is rational for the delivery of services; primary care services in contiguous areas are overutilized, excessively distant, or otherwise inaccessible; characteristics of the population, such as low-income, Medicaid eligible, migrant or season farm workers, and the homeless; as well as a host of other factors. The population to primary care ratio for designation of a HPSA is 3,500:1 (about 28.6 providers per 100,000 population), but may be as low as 3,000:1 (about 33.3 providers per 100,000 population) in a special population HPSA.

Michigan Physician Supply and Demand Through 2020 39
Table 6 – Estimated Numbers of Active Patient Care Physicians in Michigan by County, 2004
Region/County
Active Patient
Care Physicians Population
Active Patient Care Physicians/
100,000 Population
Primary Care* Physicians/
100,000 Population
Non-Primary Care
Physicians/ 100,000
Population Ann Arbor Area 2,359 524,869 449 146 293
Livingston 142 180,335 79 50*** 28*** Washtenaw 2,217 344,534 643 195 432
Detroit Area 11,454 4,257,928 269 113 141
Macomb 1,632 829,441 197 94 86 Oakland 4,715 1,223,341 385 153 209 St. Clair 251 172,325 146 62 79*** Wayne 4,856 2,032,822 239 101 127
East Central 138 149,667 92 55*** 32***
Arenac 11 17,142 64 46*** 17*** Clare 28 31,510 89 64 19*** Gladwin 17 26,892 63 44*** 18*** Iosco 27 26,596 102 53*** 41*** Ogemaw 32 21,693 148 65 74*** Roscommon 23 25,834 89 51*** 31***
Flint Area 1,165 514,535 226 115 94
Genesee 1,067 441,769 242 123 100 Shiawassee 98 72,766 135 62 62***
Grand Rapids-Muskegon 2,315 1,177,624 197 84 105
Allegan 57 114,034 50 34*** 16*** Kent 1,584 602,121 263 104 148 Muskegon 338 176,816 191 90 94 Oceana 20 28,808 69 41*** 21*** Ottawa 315 255,845 123 62 57***
Jackson Area 535 461,751 116 52*** 60***
Hillsdale 46 47,162 98 44*** 42*** Jackson 225 161,917 139 59*** 78*** Lenawee 117 101,108 116 51*** 63*** Monroe 148 151,563 98 49*** 44***
Kalamazoo-Battle Creek 1,201 551,258 218 93 120
Barry 43 59,662 72 40*** 29*** Branch 57 46,672 122 52*** 54*** Calhoun 297 139,748 213 98 112 Kalamazoo 745 241,903 308 120 183 St. Joseph 59 63,273 93 57*** 37***
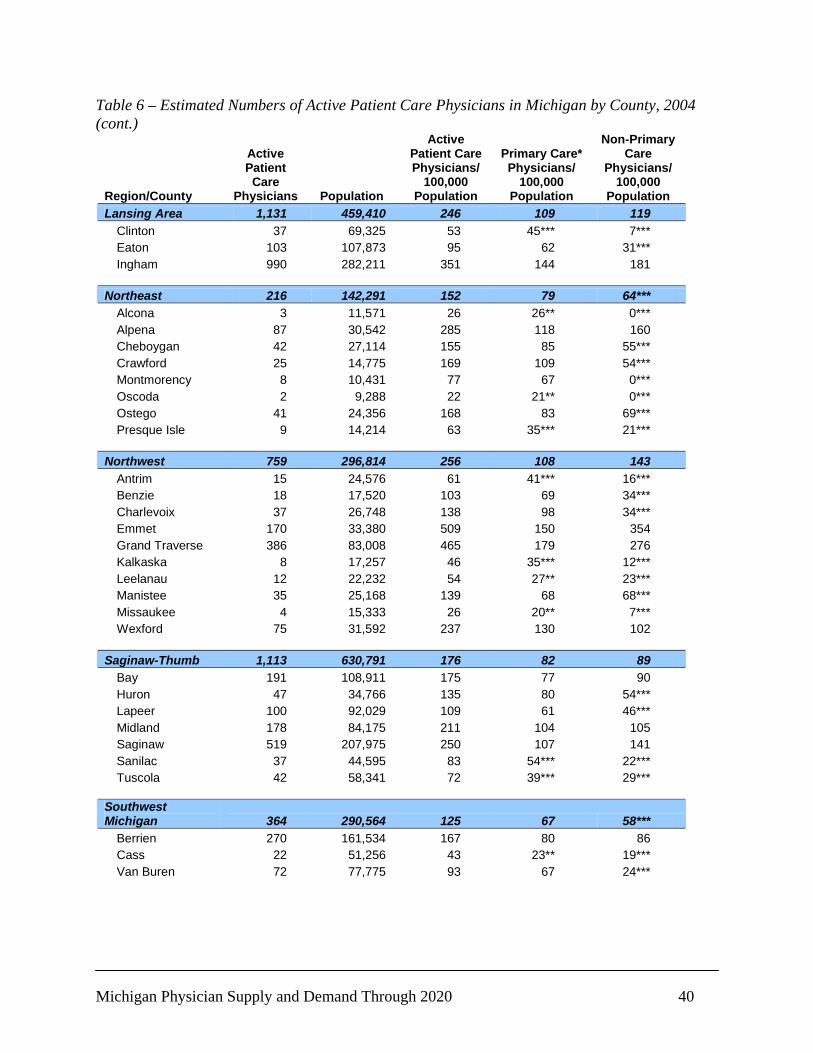
Michigan Physician Supply and Demand Through 2020 40
Table 6 – Estimated Numbers of Active Patient Care Physicians in Michigan by County, 2004 (cont.)
Region/County
Active Patient
Care Physicians Population
Active Patient Care Physicians/
100,000 Population
Primary Care* Physicians/
100,000 Population
Non-Primary Care
Physicians/ 100,000
Population Lansing Area 1,131 459,410 246 109 119
Clinton 37 69,325 53 45*** 7*** Eaton 103 107,873 95 62 31*** Ingham 990 282,211 351 144 181
Northeast 216 142,291 152 79 64***
Alcona 3 11,571 26 26** 0*** Alpena 87 30,542 285 118 160 Cheboygan 42 27,114 155 85 55*** Crawford 25 14,775 169 109 54*** Montmorency 8 10,431 77 67 0*** Oscoda 2 9,288 22 21** 0*** Ostego 41 24,356 168 83 69*** Presque Isle 9 14,214 63 35*** 21***
Northwest 759 296,814 256 108 143
Antrim 15 24,576 61 41*** 16*** Benzie 18 17,520 103 69 34*** Charlevoix 37 26,748 138 98 34*** Emmet 170 33,380 509 150 354 Grand Traverse 386 83,008 465 179 276 Kalkaska 8 17,257 46 35*** 12*** Leelanau 12 22,232 54 27** 23*** Manistee 35 25,168 139 68 68*** Missaukee 4 15,333 26 20** 7*** Wexford 75 31,592 237 130 102
Saginaw-Thumb 1,113 630,791 176 82 89
Bay 191 108,911 175 77 90 Huron 47 34,766 135 80 54*** Lapeer 100 92,029 109 61 46*** Midland 178 84,175 211 104 105 Saginaw 519 207,975 250 107 141 Sanilac 37 44,595 83 54*** 22*** Tuscola 42 58,341 72 39*** 29***
Southwest Michigan 364 290,564 125 67 58***
Berrien 270 161,534 167 80 86 Cass 22 51,256 43 23** 19*** Van Buren 72 77,775 93 67 24***
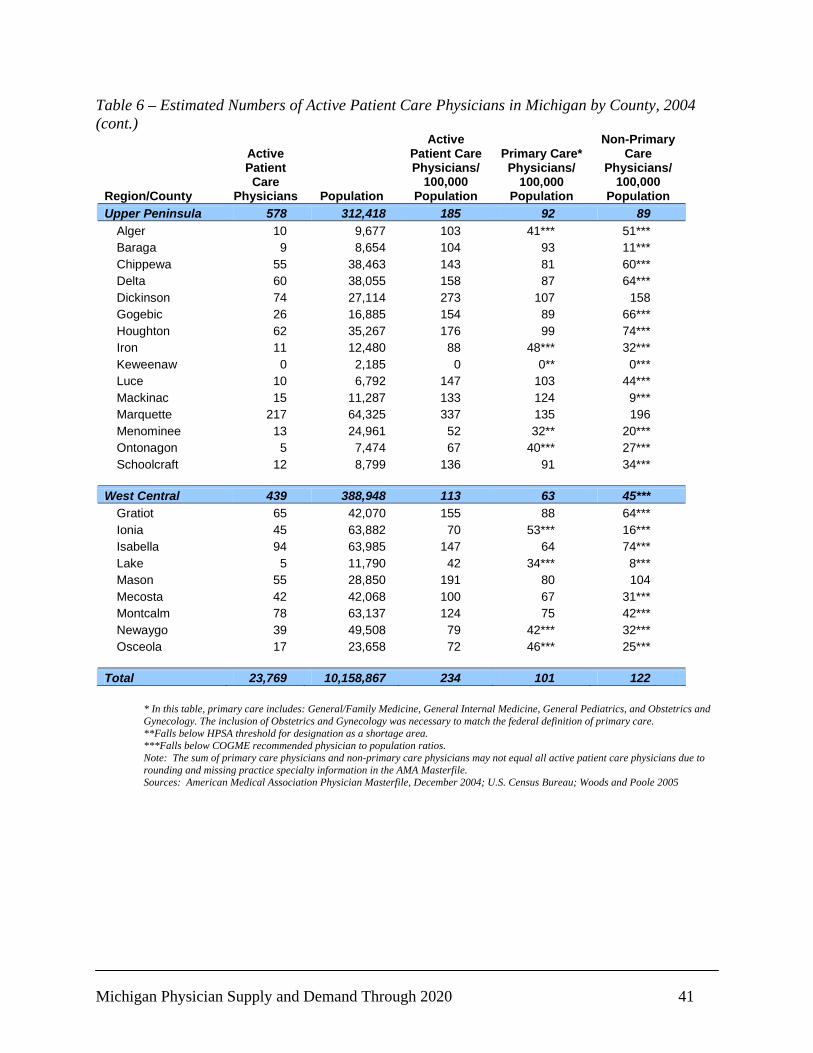
Michigan Physician Supply and Demand Through 2020 41
Table 6 – Estimated Numbers of Active Patient Care Physicians in Michigan by County, 2004 (cont.)
Region/County
Active Patient
Care Physicians Population
Active Patient Care Physicians/
100,000 Population
Primary Care* Physicians/
100,000 Population
Non-Primary Care
Physicians/ 100,000
Population Upper Peninsula 578 312,418 185 92 89
Alger 10 9,677 103 41*** 51*** Baraga 9 8,654 104 93 11*** Chippewa 55 38,463 143 81 60*** Delta 60 38,055 158 87 64*** Dickinson 74 27,114 273 107 158 Gogebic 26 16,885 154 89 66*** Houghton 62 35,267 176 99 74*** Iron 11 12,480 88 48*** 32*** Keweenaw 0 2,185 0 0** 0*** Luce 10 6,792 147 103 44*** Mackinac 15 11,287 133 124 9*** Marquette 217 64,325 337 135 196 Menominee 13 24,961 52 32** 20*** Ontonagon 5 7,474 67 40*** 27*** Schoolcraft 12 8,799 136 91 34***
West Central 439 388,948 113 63 45***
Gratiot 65 42,070 155 88 64*** Ionia 45 63,882 70 53*** 16*** Isabella 94 63,985 147 64 74*** Lake 5 11,790 42 34*** 8*** Mason 55 28,850 191 80 104 Mecosta 42 42,068 100 67 31*** Montcalm 78 63,137 124 75 42*** Newaygo 39 49,508 79 42*** 32*** Osceola 17 23,658 72 46*** 25***
Total 23,769 10,158,867 234 101 122
* In this table, primary care includes: General/Family Medicine, General Internal Medicine, General Pediatrics, and Obstetrics and Gynecology. The inclusion of Obstetrics and Gynecology was necessary to match the federal definition of primary care. **Falls below HPSA threshold for designation as a shortage area. ***Falls below COGME recommended physician to population ratios. Note: The sum of primary care physicians and non-primary care physicians may not equal all active patient care physicians due to rounding and missing practice specialty information in the AMA Masterfile. Sources: American Medical Association Physician Masterfile, December 2004; U.S. Census Bureau; Woods and Poole 2005
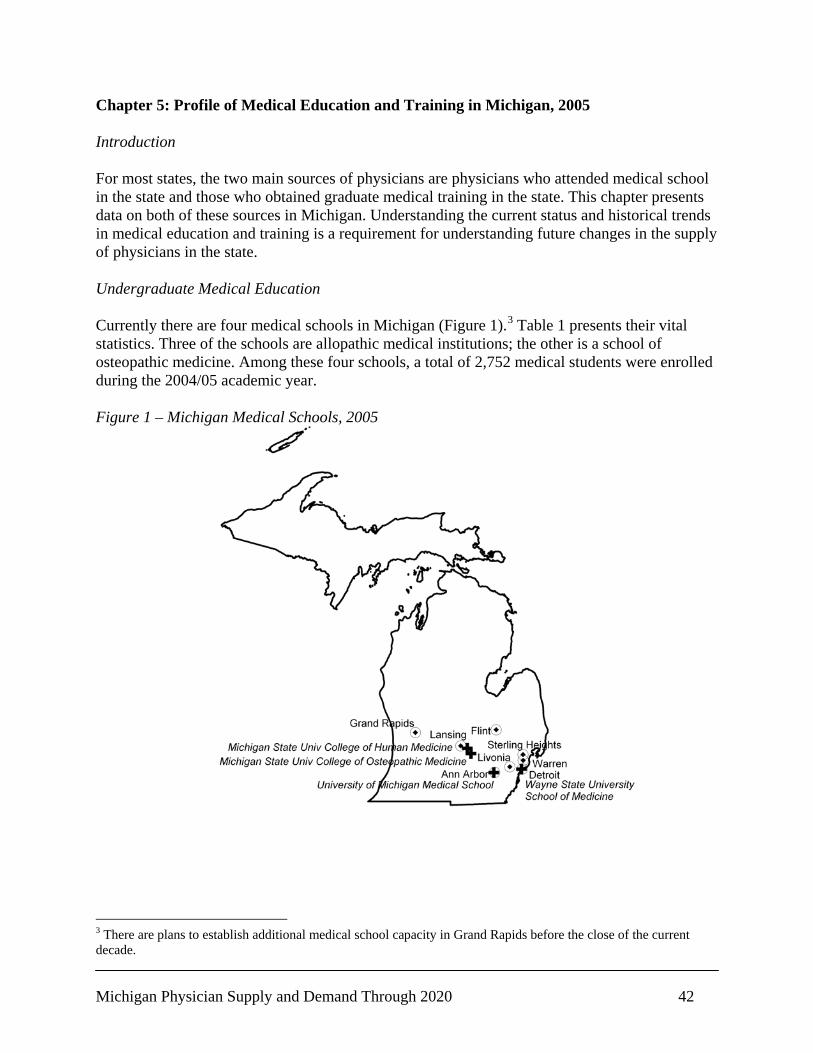
Michigan Physician Supply and Demand Through 2020 42
Chapter 5: Profile of Medical Education and Training in Michigan, 2005 Introduction For most states, the two main sources of physicians are physicians who attended medical school in the state and those who obtained graduate medical training in the state. This chapter presents data on both of these sources in Michigan. Understanding the current status and historical trends in medical education and training is a requirement for understanding future changes in the supply of physicians in the state. Undergraduate Medical Education Currently there are four medical schools in Michigan (Figure 1).3 Table 1 presents their vital statistics. Three of the schools are allopathic medical institutions; the other is a school of osteopathic medicine. Among these four schools, a total of 2,752 medical students were enrolled during the 2004/05 academic year. Figure 1 – Michigan Medical Schools, 2005
3 There are plans to establish additional medical school capacity in Grand Rapids before the close of the current decade.

Michigan Physician Supply and Demand Through 2020 43
Table 1 – Michigan Medical School Characteristics, 2004/05
Medical School Est. Dean Location
Tuition (resident/ non-resid;
in 000s) Enrollment AffiliationMichigan State University College of Human Medicine 1964 Marsha D. Rappley, MD East Lansing $23 / $49 428 Public
Michigan State University College of Osteopathic Medicine 1969 William D. Strampel, DO East Lansing $21 / $45 567 Public
University of Michigan Medical School 1850 James O. Woolliscroft, MD Ann Arbor $24 / $35 693 Public
Wayne State University School of Medicine 1868 Robert M. Mentzer, MD Detroit $20 / $39 1,064 Public
Sources: Appendix IA, Table 1. “U.S. Medical Schools with Liaison Committee on Medical Education (LCME)-Accredited Programs. 2004-2005.” Journal of the American Medical Association 294(9): 1119-1123; Singer, Allen. 2004 Annual Report on Osteopathic Medical Education. Table 14. Chevy Chase, MD: American Association of Colleges of Osteopathic Medicine. Trends in Medical School Enrollment The trend in enrollment between the 1995/96 academic year and the 2004/05 academic year is presented in Figure 2. Over the course of the previous ten years, while the Michigan State University College of Osteopathic Medicine increased its capacity to educate new physicians (from 526 to 587 students, 7.9 percent), the allopathic schools, with the exception of Wayne State University School of Medicine, experienced a slight decrease in their capacity. Figure 2 – Historical Enrollment in Michigan Medical Schools, 1995/96 – 2004/05
0
200
400
600
800
1,000
1,200
MSU College of Human Medicine 487 473 466 452 434 435 438 437 439 428UMich Medical School 718 671 663 681 679 689 680 678 696 693Wayne State SOM 1051 1049 1049 1043 1044 1036 1045 1041 1049 1064MSU College of Osteo. Medicine 526 522 512 523 507 523 527 527 533 567
1995/96 1996/97 1997/98 1998/99 1999/00 2000/01 2001/02 2002/03 2003/04 2004/05
Sources: Appendix IA. Table 2. Journal of the American Medical Association Medical Education Theme Issues, 1997-2005. 1997-2004 Annual Reports on Osteopathic Medical Education. Chevy Chase, MD: American Association of Colleges of Osteopathic Medicine.

Michigan Physician Supply and Demand Through 2020 44
Michigan State University College of Human Medicine experienced a decline 487 students in 1995/96 to 428 in 2004/05, a 12 percent decline; whereas University of Michigan School of Medicine declined from 718 students in 1995/96 to 693 in 2004/05, a decline of 3 percent. These losses were great enough to erase the increases in enrollment by the osteopathic school, and for the decade, Michigan as a whole experienced a 1 percent (30 students) decline in medical school enrollment. To put these trends into perspective, it was helpful to compare how the state fared over the same period relative to its neighbors, region of the country, and finally, the nation as a whole (Figure 3). Taking into account the changes in population across all of the states, Michigan experienced a slightly greater decline in medical school enrollment compared to its immediate neighbors in the East North Central division (Illinois, Indiana, Ohio, and Wisconsin) over the past decade, moving from 28.6 enrolled medical students per 100,000 population to 27.2 (a 5 percent decline) compared to a 3 percent decline from 32.3 to 31.3 in the East North Central division. A similar comparison can be made between Michigan and the entire Midwest region (including Iowa, Kansas, Minnesota Missouri, Nebraska, North Dakota, and South Dakota in addition to the other states mentioned above) which experienced a 4 percent decline over the same time period. As a whole, the U.S. experienced a decline of 5 percent, very similar to the Michigan experience. Figure 3 – Historical Medical School Enrollment per 100,000 Population in Michigan, the North East Central Region, the Midwest, and the U.S., 1995/96 – 2004/05
0
5
10
15
20
25
30
35
40
Michigan 28.6 27.7 27.4 27.4 26.8 26.8 26.8 26.6 26.9 27.2East North Central Division 32.3 32.2 31.9 31.7 31.2 31.0 30.9 30.9 31.2 31.3Midwest Region 35.5 35.4 35.0 34.8 34.2 33.9 33.7 33.7 33.8 34.1US 28.4 28.3 28.2 28.0 27.2 27.0 26.8 26.9 26.9 27.0
1995/96 1996/97 1997/98 1998/99 1999/00 2000/01 2001/02 2002/03 2003/04 2004/05
Sources: Appendix IA. Table 2. Journal of the American Medical Association Medical Education Theme Issues, 1997-2005. 1997-2004 Annual Reports on Osteopathic Medical Education. Chevy Chase, MD: American Association of Colleges of Osteopathic Medicine.
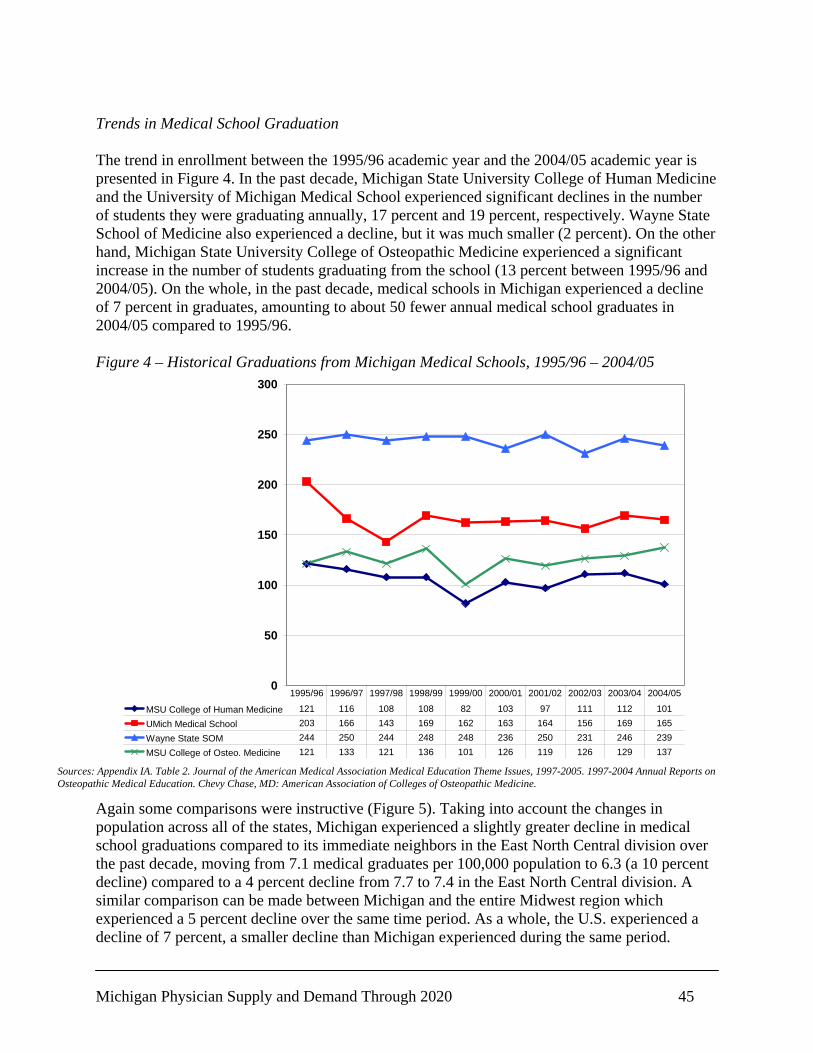
Michigan Physician Supply and Demand Through 2020 45
Trends in Medical School Graduation The trend in enrollment between the 1995/96 academic year and the 2004/05 academic year is presented in Figure 4. In the past decade, Michigan State University College of Human Medicine and the University of Michigan Medical School experienced significant declines in the number of students they were graduating annually, 17 percent and 19 percent, respectively. Wayne State School of Medicine also experienced a decline, but it was much smaller (2 percent). On the other hand, Michigan State University College of Osteopathic Medicine experienced a significant increase in the number of students graduating from the school (13 percent between 1995/96 and 2004/05). On the whole, in the past decade, medical schools in Michigan experienced a decline of 7 percent in graduates, amounting to about 50 fewer annual medical school graduates in 2004/05 compared to 1995/96. Figure 4 – Historical Graduations from Michigan Medical Schools, 1995/96 – 2004/05
0
50
100
150
200
250
300
MSU College of Human Medicine 121 116 108 108 82 103 97 111 112 101UMich Medical School 203 166 143 169 162 163 164 156 169 165Wayne State SOM 244 250 244 248 248 236 250 231 246 239MSU College of Osteo. Medicine 121 133 121 136 101 126 119 126 129 137
1995/96 1996/97 1997/98 1998/99 1999/00 2000/01 2001/02 2002/03 2003/04 2004/05
Again some comparisons were instructive (Figure 5). Taking into account the changes in population across all of the states, Michigan experienced a slightly greater decline in medical school graduations compared to its immediate neighbors in the East North Central division over the past decade, moving from 7.1 medical graduates per 100,000 population to 6.3 (a 10 percent decline) compared to a 4 percent decline from 7.7 to 7.4 in the East North Central division. A similar comparison can be made between Michigan and the entire Midwest region which experienced a 5 percent decline over the same time period. As a whole, the U.S. experienced a decline of 7 percent, a smaller decline than Michigan experienced during the same period.
Sources: Appendix IA. Table 2. Journal of the American Medical Association Medical Education Theme Issues, 1997-2005. 1997-2004 Annual Reports on Osteopathic Medical Education. Chevy Chase, MD: American Association of Colleges of Osteopathic Medicine.
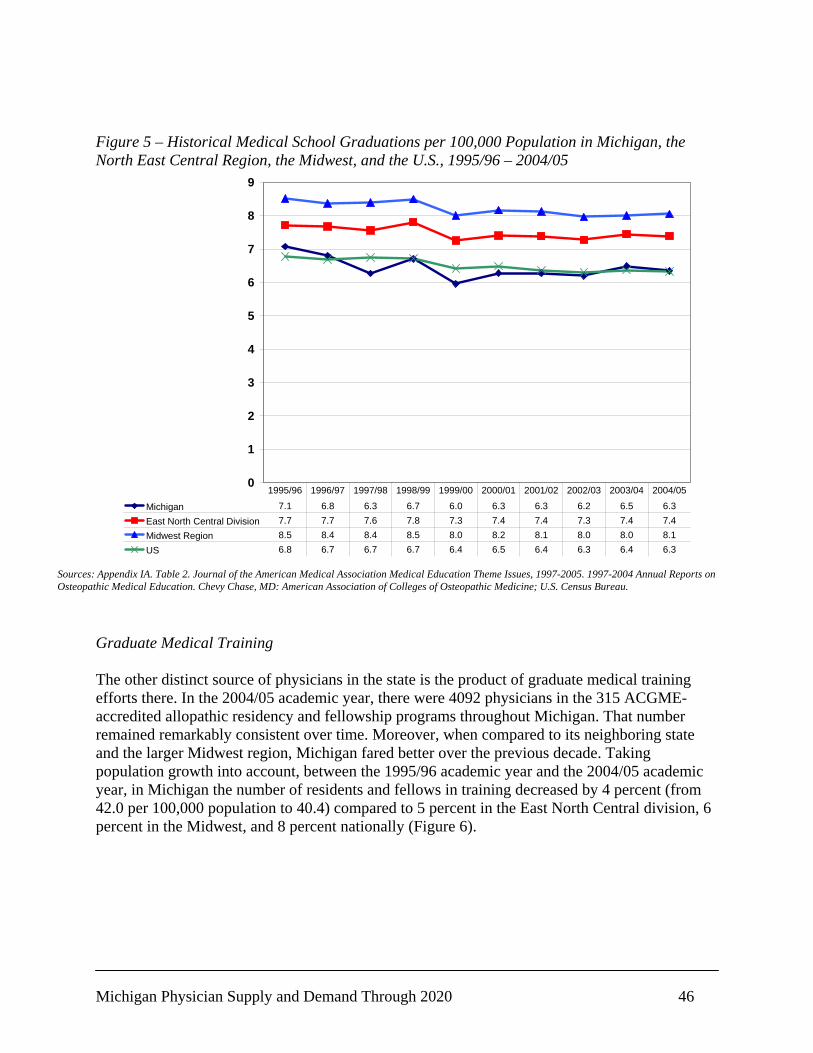
Michigan Physician Supply and Demand Through 2020 46
Figure 5 – Historical Medical School Graduations per 100,000 Population in Michigan, the North East Central Region, the Midwest, and the U.S., 1995/96 – 2004/05
0
1
2
3
4
5
6
7
8
9
Michigan 7.1 6.8 6.3 6.7 6.0 6.3 6.3 6.2 6.5 6.3East North Central Division 7.7 7.7 7.6 7.8 7.3 7.4 7.4 7.3 7.4 7.4Midwest Region 8.5 8.4 8.4 8.5 8.0 8.2 8.1 8.0 8.0 8.1US 6.8 6.7 6.7 6.7 6.4 6.5 6.4 6.3 6.4 6.3
1995/96 1996/97 1997/98 1998/99 1999/00 2000/01 2001/02 2002/03 2003/04 2004/05
Graduate Medical Training The other distinct source of physicians in the state is the product of graduate medical training efforts there. In the 2004/05 academic year, there were 4092 physicians in the 315 ACGME-accredited allopathic residency and fellowship programs throughout Michigan. That number remained remarkably consistent over time. Moreover, when compared to its neighboring state and the larger Midwest region, Michigan fared better over the previous decade. Taking population growth into account, between the 1995/96 academic year and the 2004/05 academic year, in Michigan the number of residents and fellows in training decreased by 4 percent (from 42.0 per 100,000 population to 40.4) compared to 5 percent in the East North Central division, 6 percent in the Midwest, and 8 percent nationally (Figure 6).
Sources: Appendix IA. Table 2. Journal of the American Medical Association Medical Education Theme Issues, 1997-2005. 1997-2004 Annual Reports on Osteopathic Medical Education. Chevy Chase, MD: American Association of Colleges of Osteopathic Medicine; U.S. Census Bureau.

Michigan Physician Supply and Demand Through 2020 47
Figure 6 – Historical Number of Residents and Fellows in Training per 100,000 Population in Michigan, the North East Central Region, the Midwest, and the U.S., 1995/96 – 2004/05
0
5
10
15
20
25
30
35
40
45
50
Michigan 42.0 43.4 42.6 41.0 40.5 40.1 39.6 40.3 40.7 40.4East North Central Division 38.8 39.0 38.9 38.0 37.1 36.4 36.0 36.5 36.8 37.1Midwest Region 38.0 37.9 37.7 36.7 35.9 35.1 34.9 35.3 35.6 35.8US 37.0 36.6 36.3 35.7 34.7 34.0 33.5 33.8 34.0 34.2
1995/96 1996/97 1997/98 1998/99 1999/00 2000/01 2001/02 2002/03 2003/04 2004/05
While the total number of residents in training did not change noticeably over time, the composition of the residents in training did, and in some cases, dramatically (Table 2). In terms of the specialties in which residents and fellows were training, there were 10 percent fewer residents/fellows training in primary care specialties in 2004/05 than in 1995/96. Nationally, the numbers of primary care residents/fellows were about equal over the time period. Hospital-based specialties experienced the largest growth, with the number of anesthesiology residents increasing by almost 75 percent and emergency medicine residents increasing by one-third over the course of the decade. This trend was generally consistent with the trend at the national level, although the increases experienced in Michigan were far greater than those nationally. While most surgical residencies in the state declined slightly, plastic surgery and urology experienced increases in the number of residents/fellows in training, with plastic surgery nearly doubling and urology increasing by 11 percent. The same trend was evident nationally, except for urology, where there was a decline rather than an increase; and the increase in plastic surgery nationally while large (25 percent) was significantly smaller than in the state. Internal medicine subspecialties also experienced a large increase in residents in the state and nationally (26 percent and 9 percent, respectively). Finally, while the number of residents/fellows training in psychiatry declined by 7 percent nationally, the number in Michigan increased by 29 percent between 1995/96 and 2004/05.
Sources: Appendix II. Table 2. Journal of the American Medical Association Medical Education Theme Issues, 1997-2005.

Michigan Physician Supply and Demand Through 2020 48
Table 2 – Number of Residents/Fellows by Specialty in Graduate Medical Training in Michigan, 1995/96 and 2004/05 1995/96 2004/05 Change
Residents/
Fellows Residents/
Fellows Number Percent NationalChange
Primary Care Specialties Family Medicine 408 367 -41 -10% 1% Internal Medicine 863 759 -104 -12% 1% Obstetrics and Gynecology 254 233 -21 -8% -6% Pediatrics 280 249 -31 -11% 6% Hospital-based Specialties Anesthesiology 76 131 55 72% 2% Emergency Medicine 256 337 81 32% 46% Pathology - Anatomic and Clinical 92 69 -23 -25% -19% Radiology - Diagnostic 203 227 24 12% 2% Surgical Specialties and Subspecialties General Surgery 336 342 6 2% -6% Colon and Rectal Surgery 4 2 -2 -50% 2% Neurological Surgery 31 28 -3 -10% -2% Ophthalmology 63 60 -3 -5% -20% Orthopedic Surgery 151 148 -3 -2% 7% Otolaryngology 45 34 -11 -24% -10% Plastic Surgery 16 30 14 88% 25% Thoracic Surgery 14 10 -4 -29% -14% Urology 38 42 4 11% -7% Surgical Subspecialties 23 21 -2 -9% 25% Internal Medicine Subspecialties 237 299 62 26% 9% Pediatric Subspecialties 60 74 14 23% 24% Combined Specialties 161 121 -40 -25% 31% Other Specialties and Subspecialties Allergy and Immunology 9 9 0 0% 0% Dermatology 45 46 1 2% 21% Neurology 50 48 -2 -4% -6% Physical Medicine and Rehabilitation 63 51 -12 -19% -1% Preventive Medicine 4 2 -2 -50% -27% Psychiatry 94 121 27 29% -7% Transitional Year 137 118 -19 -14% -13% All Others 79 114 35 44% 56% Total 4092 4092 0 0% 3%
Sources: State-level Data for Accredited Graduate Medical Education Programs in the U.S., 1995/96 and 2004/05. American Medical Association.

Michigan Physician Supply and Demand Through 2020 49
Sources: State-level Data for Accredited Graduate Medical Education Programs in the U.S., 1995/96 and 2004/05. American Medical Association.
Origin of Physicians in Michigan Graduate Medical Training Programs Table 3 – Origins of Physicians Training in Michigan Allopathic Graduate Medical Training Programs, 1995/96 and 2004/05
1995/96 2004/05 In-state*
Out of state*
Interna-tional Canada
Osteo-pathic In-state*
Out of state*
Interna-tional Canada
Osteo-pathic
Primary Care Specialties Family Medicine 37% 20% 37% 0% 6% 22% 9% 60% 0% 9%Internal Medicine 13% 15% 69% 0% 3% 18% 18% 62% 0% 2%Obstetrics and Gynecology 46% 47% 5% 2% 1% 31% 30% 33% 0% 5%Pediatrics 20% 17% 56% 0% 6% 27% 18% 47% 0% 9% Hospital-based Specialties Anesthesiology 37% 20% 32% 0% 11% 27% 40% 29% 0% 4%Emergency Medicine 32% 58% 2% 0% 8% 28% 51% 13% 0% 8%Pathology - Anatomic and Clinical 29% 22% 45% 1% 3% 25% 17% 55% 0% 3%Radiology - Diagnostic 41% 49% 7% 2% 0% 36% 49% 11% 1% 3% Surgical Specialties and Subspecialties General Surgery 35% 52% 11% 1% 0% 26% 47% 24% 1% 1%Colon and Rectal Surgery 25% 75% 0% 0% 0% 0% 50% 50% 0% 0%Neurological Surgery 6% 71% 19% 3% 0% 32% 61% 7% 0% 0%Ophthalmology 35% 49% 16% 0% 0% 35% 57% 7% 0% 2%Orthopedic Surgery 32% 67% 1% 0% 0% 32% 68% 1% 0% 0%Otolaryngology 27% 69% 4% 0% 0% 26% 74% 0% 0% 0%Plastic Surgery 6% 69% 19% 6% 0% 30% 60% 10% 0% 0%Thoracic Surgery 0% 86% 14% 0% 0% 0% 90% 10% 0% 0%Urology 21% 74% 5% 0% 0% 29% 55% 14% 0% 2%Surgical Subspecialties 22% 61% 17% 0% 0% 14% 76% 10% 0% 0% Internal Medicine Subspecialties 17% 22% 57% 0% 4% 16% 31% 50% 0% 2% Pediatric Subspecialties 8% 30% 55% 3% 3% 9% 35% 47% 4% 4% Combined Specialties 37% 35% 24% 0% 4% 29% 39% 29% 0% 3% Other Specialties and Subspecialties Allergy and Immunology 22% 33% 44% 0% 0% 22% 56% 22% 0% 0%Dermatology 29% 60% 9% 2% 0% 35% 59% 4% 2% 0%Neurology 14% 28% 50% 0% 8% 13% 38% 42% 0% 8%Physical Medicine and Rehabilitation 35% 30% 11% 0% 24% 20% 29% 16% 0% 35%Preventive Medicine 0% 50% 50% 0% 0% 50% 0% 50% 0% 0%Psychiatry 33% 17% 38% 0% 12% 32% 21% 31% 0% 17%Transitional Year 41% 15% 42% 1% 1% 40% 34% 17% 0% 9%All Others 24% 46% 22% 0% 9% 18% 32% 43% 0% 6% Total 28% 33% 35% 1% 4% 25% 33% 36% 0% 5%* In-state and Out-of-state refer to allopathic schools only.
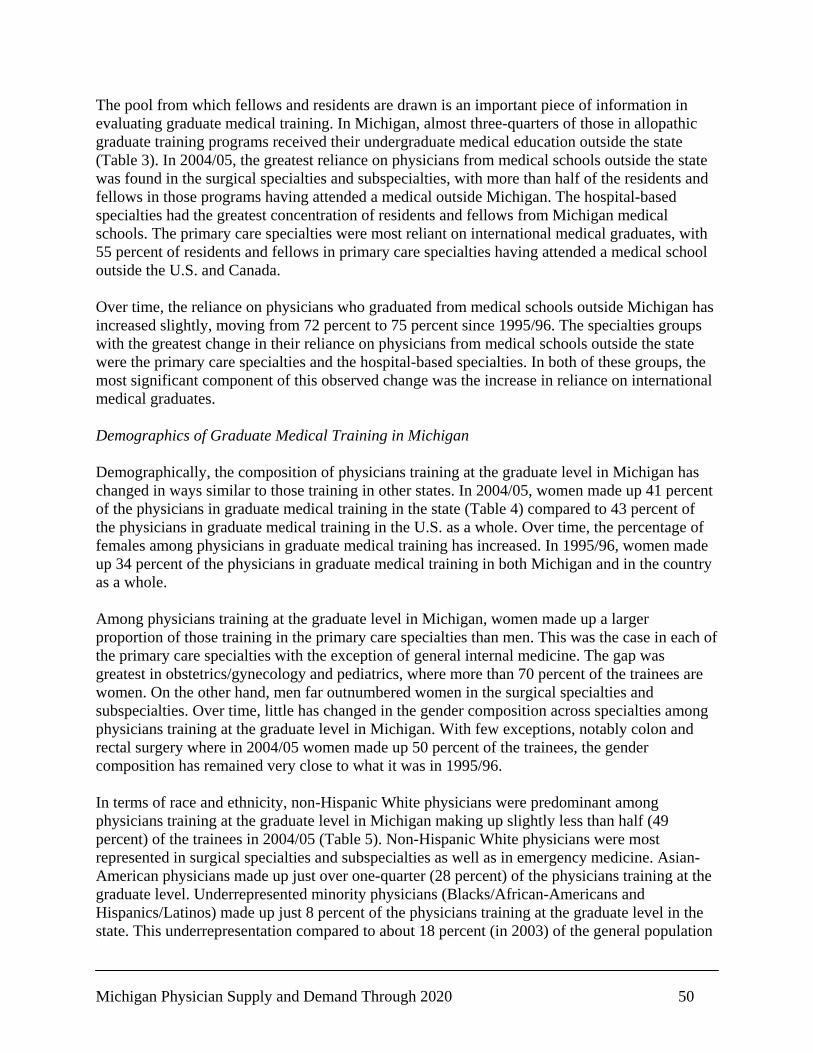
Michigan Physician Supply and Demand Through 2020 50
The pool from which fellows and residents are drawn is an important piece of information in evaluating graduate medical training. In Michigan, almost three-quarters of those in allopathic graduate training programs received their undergraduate medical education outside the state (Table 3). In 2004/05, the greatest reliance on physicians from medical schools outside the state was found in the surgical specialties and subspecialties, with more than half of the residents and fellows in those programs having attended a medical outside Michigan. The hospital-based specialties had the greatest concentration of residents and fellows from Michigan medical schools. The primary care specialties were most reliant on international medical graduates, with 55 percent of residents and fellows in primary care specialties having attended a medical school outside the U.S. and Canada. Over time, the reliance on physicians who graduated from medical schools outside Michigan has increased slightly, moving from 72 percent to 75 percent since 1995/96. The specialties groups with the greatest change in their reliance on physicians from medical schools outside the state were the primary care specialties and the hospital-based specialties. In both of these groups, the most significant component of this observed change was the increase in reliance on international medical graduates. Demographics of Graduate Medical Training in Michigan Demographically, the composition of physicians training at the graduate level in Michigan has changed in ways similar to those training in other states. In 2004/05, women made up 41 percent of the physicians in graduate medical training in the state (Table 4) compared to 43 percent of the physicians in graduate medical training in the U.S. as a whole. Over time, the percentage of females among physicians in graduate medical training has increased. In 1995/96, women made up 34 percent of the physicians in graduate medical training in both Michigan and in the country as a whole. Among physicians training at the graduate level in Michigan, women made up a larger proportion of those training in the primary care specialties than men. This was the case in each of the primary care specialties with the exception of general internal medicine. The gap was greatest in obstetrics/gynecology and pediatrics, where more than 70 percent of the trainees are women. On the other hand, men far outnumbered women in the surgical specialties and subspecialties. Over time, little has changed in the gender composition across specialties among physicians training at the graduate level in Michigan. With few exceptions, notably colon and rectal surgery where in 2004/05 women made up 50 percent of the trainees, the gender composition has remained very close to what it was in 1995/96. In terms of race and ethnicity, non-Hispanic White physicians were predominant among physicians training at the graduate level in Michigan making up slightly less than half (49 percent) of the trainees in 2004/05 (Table 5). Non-Hispanic White physicians were most represented in surgical specialties and subspecialties as well as in emergency medicine. Asian-American physicians made up just over one-quarter (28 percent) of the physicians training at the graduate level. Underrepresented minority physicians (Blacks/African-Americans and Hispanics/Latinos) made up just 8 percent of the physicians training at the graduate level in the state. This underrepresentation compared to about 18 percent (in 2003) of the general population
Michigan Physician Supply and Demand Through 2020 51
of the state comprised of Blacks/African-Americans and Hispanics/Latinos. Underrepresented minorities had the highest level of representation in obstetrics and gynecology (19 percent), pediatrics (18 percent), and general surgery (14 percent). Between the 1995/96 and 2004/05 academic years, the most noticeable trend in racial/ethnic make-up of the physicians training at the graduate level in Michigan was an increase in the representation of Asian-American trainees and subsequent decrease in the representation of non Hispanic White trainees. This closely follows the trend at the national level over the same time period.

Michigan Physician Supply and Demand Through 2020 52
Table 4 – Gender Distribution of Physicians Training in Michigan Allopathic Graduate Medical Training Programs, 1995/96 and 2004/05
1995/96 2004/05 Male Female Male Female Primary Care Specialties Family Medicine 53% 47% 43% 57%Internal Medicine 68% 32% 59% 41%Obstetrics and Gynecology 37% 63% 24% 76%Pediatrics 45% 55% 29% 71% Hospital-based Specialties Anesthesiology 79% 21% 74% 26%Emergency Medicine 77% 23% 72% 28%Pathology - Anatomic and Clinical 54% 46% 55% 45%Radiology - Diagnostic 75% 25% 76% 24% Surgical Specialties and Subspecialties General Surgery 83% 17% 72% 28%Colon and Rectal Surgery 100% 0% 50% 50%Neurological Surgery 90% 10% 86% 14%Ophthalmology 79% 21% 67% 33%Orthopedic Surgery 92% 8% 95% 5%Otolaryngology 89% 11% 88% 12%Plastic Surgery 69% 31% 87% 13%Thoracic Surgery 100% 0% 80% 20%Urology 84% 16% 90% 10%Surgical Subspecialties 91% 9% 76% 24% Internal Medicine Subspecialties 78% 22% 64% 36% Pediatric Subspecialties 55% 45% 51% 49% Combined Specialties 55% 45% 50% 50% Other Specialties and Subspecialties Allergy and Immunology 44% 56% 67% 33%Dermatology 47% 53% 35% 65%Neurology 66% 34% 54% 46%Physical Medicine and Rehabilitation 67% 33% 57% 43%Preventive Medicine 75% 25% 50% 50%Psychiatry 43% 57% 36% 64%Transitional Year 66% 34% 65% 35%All Others 71% 29% 73% 27% Total 66% 34% 59% 41%
Sources: State-level Data for Accredited Graduate Medical Education Programs in the U.S., 1995/96 and 2004/05. American Medical Association.
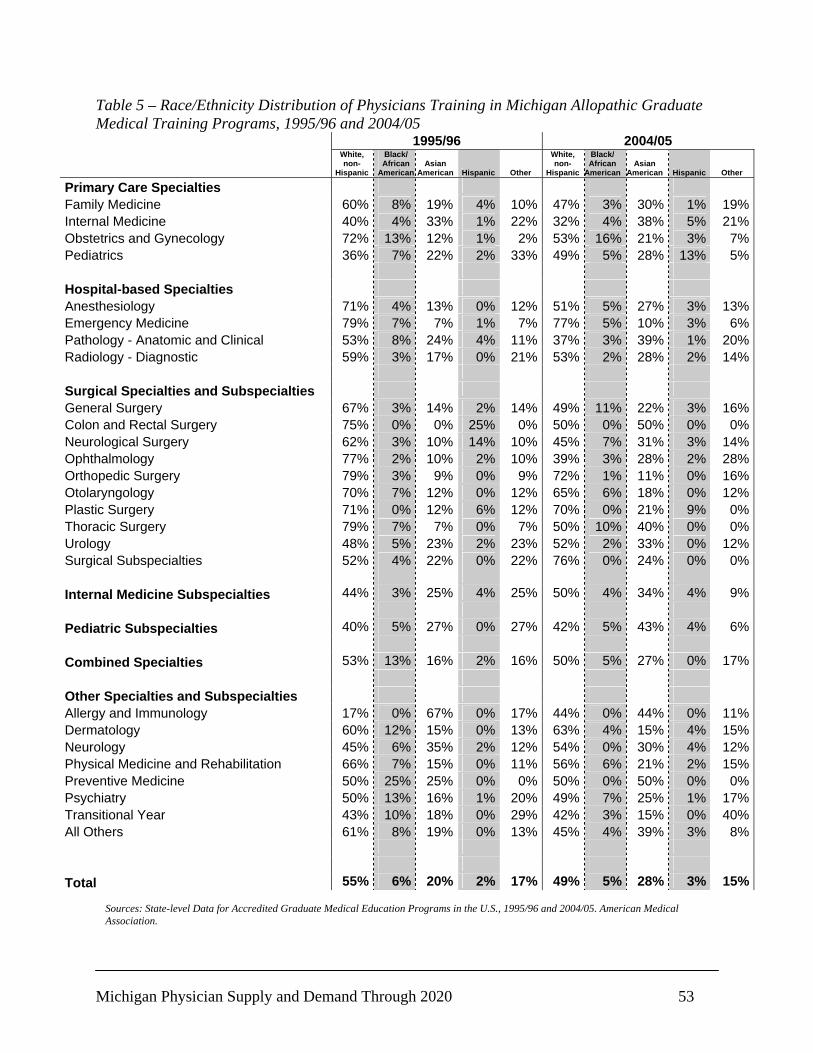
Michigan Physician Supply and Demand Through 2020 53
Table 5 – Race/Ethnicity Distribution of Physicians Training in Michigan Allopathic Graduate Medical Training Programs, 1995/96 and 2004/05
1995/96 2004/05
White, non-
Hispanic
Black/ African
AmericanAsian
American Hispanic Other
White, non-
Hispanic
Black/ African
American Asian
American Hispanic Other
Primary Care Specialties Family Medicine 60% 8% 19% 4% 10% 47% 3% 30% 1% 19%Internal Medicine 40% 4% 33% 1% 22% 32% 4% 38% 5% 21%Obstetrics and Gynecology 72% 13% 12% 1% 2% 53% 16% 21% 3% 7%Pediatrics 36% 7% 22% 2% 33% 49% 5% 28% 13% 5% Hospital-based Specialties Anesthesiology 71% 4% 13% 0% 12% 51% 5% 27% 3% 13%Emergency Medicine 79% 7% 7% 1% 7% 77% 5% 10% 3% 6%Pathology - Anatomic and Clinical 53% 8% 24% 4% 11% 37% 3% 39% 1% 20%Radiology - Diagnostic 59% 3% 17% 0% 21% 53% 2% 28% 2% 14% Surgical Specialties and Subspecialties General Surgery 67% 3% 14% 2% 14% 49% 11% 22% 3% 16%Colon and Rectal Surgery 75% 0% 0% 25% 0% 50% 0% 50% 0% 0%Neurological Surgery 62% 3% 10% 14% 10% 45% 7% 31% 3% 14%Ophthalmology 77% 2% 10% 2% 10% 39% 3% 28% 2% 28%Orthopedic Surgery 79% 3% 9% 0% 9% 72% 1% 11% 0% 16%Otolaryngology 70% 7% 12% 0% 12% 65% 6% 18% 0% 12%Plastic Surgery 71% 0% 12% 6% 12% 70% 0% 21% 9% 0%Thoracic Surgery 79% 7% 7% 0% 7% 50% 10% 40% 0% 0%Urology 48% 5% 23% 2% 23% 52% 2% 33% 0% 12%Surgical Subspecialties 52% 4% 22% 0% 22% 76% 0% 24% 0% 0% Internal Medicine Subspecialties 44% 3% 25% 4% 25% 50% 4% 34% 4% 9% Pediatric Subspecialties 40% 5% 27% 0% 27% 42% 5% 43% 4% 6% Combined Specialties 53% 13% 16% 2% 16% 50% 5% 27% 0% 17% Other Specialties and Subspecialties Allergy and Immunology 17% 0% 67% 0% 17% 44% 0% 44% 0% 11%Dermatology 60% 12% 15% 0% 13% 63% 4% 15% 4% 15%Neurology 45% 6% 35% 2% 12% 54% 0% 30% 4% 12%Physical Medicine and Rehabilitation 66% 7% 15% 0% 11% 56% 6% 21% 2% 15%Preventive Medicine 50% 25% 25% 0% 0% 50% 0% 50% 0% 0%Psychiatry 50% 13% 16% 1% 20% 49% 7% 25% 1% 17%Transitional Year 43% 10% 18% 0% 29% 42% 3% 15% 0% 40%All Others 61% 8% 19% 0% 13% 45% 4% 39% 3% 8% Total 55% 6% 20% 2% 17% 49% 5% 28% 3% 15%
Sources: State-level Data for Accredited Graduate Medical Education Programs in the U.S., 1995/96 and 2004/05. American Medical Association.

Michigan Physician Supply and Demand Through 2020 54
Production of New Physicians in Michigan In the 2004/05 academic year, 1,223 physicians training at the graduate level in Michigan completed a training program (Table 6).4 This represented an increase of 60 physicians (5 percent) compared to the 1995/96 academic year. This increase was also slightly higher than a similar increase at the national level of 3 percent. The greatest numbers of physicians completed training in general internal medicine (237), internal medicine subspecialties (135), and family medicine (134). For specialty groups, pediatric subspecialties (56 percent) and hospital-based specialties (35 percent) experienced the greatest growth in production. In terms of growth or decline in particular specialties, the greatest growth was observed in the number physicians completing training in plastic surgery (200 percent), emergency medicine (59 percent), and anesthesiology (36 percent). With the exception of emergency medicine, these rates of change were far greater than the change observed at the national level in these specialties. On the other hand, the production of new primary care physicians was essentially flat over the time period. Moreover, the number of physicians completing in a handful of specialties declined over the time period. Preventive medicine, neurological surgery, neurology, urology, obstetrics and gynecology, orthopedic surgery, and general internal medicine experienced declines ranging from 50 percent in preventive medicine to 4 percent in general internal medicine. These observed declines were relatively similar to the changes at the national level.5
4 This number does not include physicians who completed a preliminary year in a program. 5 Individual specialty-level change was difficult to compare because there were so few program completers in many specialties.
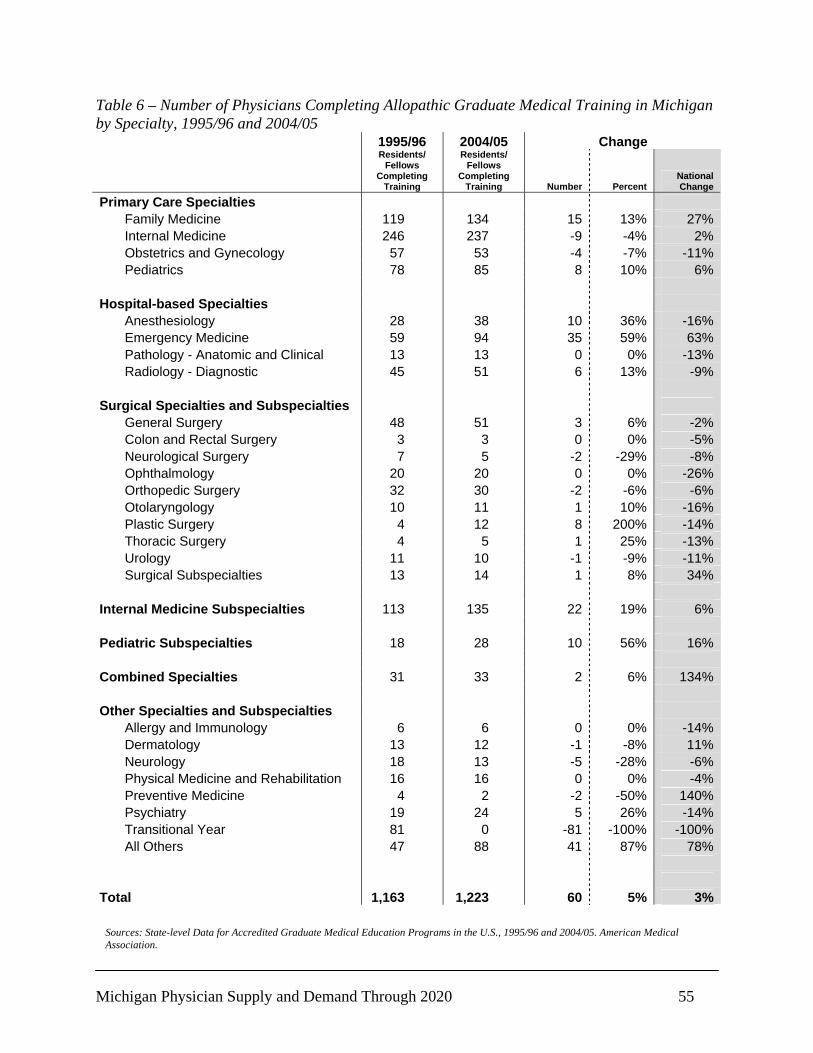
Michigan Physician Supply and Demand Through 2020 55
Table 6 – Number of Physicians Completing Allopathic Graduate Medical Training in Michigan by Specialty, 1995/96 and 2004/05 1995/96 2004/05 Change
Residents/ Fellows
Completing Training
Residents/ Fellows
Completing Training Number Percent
NationalChange
Primary Care Specialties Family Medicine 119 134 15 13% 27% Internal Medicine 246 237 -9 -4% 2% Obstetrics and Gynecology 57 53 -4 -7% -11% Pediatrics 78 85 8 10% 6% Hospital-based Specialties Anesthesiology 28 38 10 36% -16% Emergency Medicine 59 94 35 59% 63% Pathology - Anatomic and Clinical 13 13 0 0% -13% Radiology - Diagnostic 45 51 6 13% -9% Surgical Specialties and Subspecialties General Surgery 48 51 3 6% -2% Colon and Rectal Surgery 3 3 0 0% -5% Neurological Surgery 7 5 -2 -29% -8% Ophthalmology 20 20 0 0% -26% Orthopedic Surgery 32 30 -2 -6% -6% Otolaryngology 10 11 1 10% -16% Plastic Surgery 4 12 8 200% -14% Thoracic Surgery 4 5 1 25% -13% Urology 11 10 -1 -9% -11% Surgical Subspecialties 13 14 1 8% 34% Internal Medicine Subspecialties 113 135 22 19% 6% Pediatric Subspecialties 18 28 10 56% 16% Combined Specialties 31 33 2 6% 134% Other Specialties and Subspecialties Allergy and Immunology 6 6 0 0% -14% Dermatology 13 12 -1 -8% 11% Neurology 18 13 -5 -28% -6% Physical Medicine and Rehabilitation 16 16 0 0% -4% Preventive Medicine 4 2 -2 -50% 140% Psychiatry 19 24 5 26% -14% Transitional Year 81 0 -81 -100% -100% All Others 47 88 41 87% 78% Total 1,163 1,223 60 5% 3% Sources: State-level Data for Accredited Graduate Medical Education Programs in the U.S., 1995/96 and 2004/05. American Medical
Association.
Michigan Physician Supply and Demand Through 2020 56
Post Training Plans of Physicians Completing Graduate Medical Training in Michigan6 Fewer than half (40 percent) of the physicians who completed allopathic graduate medical training in Michigan in the 2003/04 academic year planned to enter practice after their training was completed (Table 7). Physicians completing training in hospital-based specialties were the most likely (51 percent) to have plans to enter practice after their training was completed. They were followed closely by physicians completing training in primary care specialties (46 percent). The physicians least likely to have plans to enter practice after training were those completing training in surgical specialties and subspecialties; just 23 percent of the physicians had plans to enter practice upon completion of their training. In terms of specific specialties, physicians in obstetrics and gynecology, emergency medicine, and allergy and immunology were the most likely to have plans to enter practice upon completion of their training. Slightly more than one-quarter (26 percent) of the physicians who completed allopathic graduate medical training in the 2003/04 academic year planned to pursue additional training upon the completion of their training. Those completing surgical specialty and subspecialty training were the most likely to have such plans (close to 40 percent). The least likely were those physicians completing internal medicine subspecialty and pediatric subspecialty training, with 13 percent and 7 percent, respectively, having plans to pursue additional training upon the completion of their training. In terms of specific specialties, physicians completing training in neurology and diagnostic radiology were the most likely to have plans to seek additional training upon completion of their current training, with more than 70 percent of the physicians reporting to have such plans. Academia was the last significant defined post-completion activity with 11 percent of the physicians completing training in Michigan in 2003/04 planning to enter academia upon completion of their current training. Those completing pediatric subspecialty and internal medicine subspecialty training were the most likely to have plans to enter academia after their training was completed. In terms of specific specialties, physicians completing training in thoracic surgery (40 percent), urology (40 percent), and neurological surgery (20 percent) were the most likely to have plans to enter academia upon completion of their training. The least likely to have plans to enter academia were those completing training in primary care specialties and hospital-based specialties. In terms of specific specialties, physicians completing training in diagnostic radiology, colon and rectal surgery, orthopedic surgery, allergy and immunology, dermatology, neurology, preventive medicine, and psychiatry did not have plans to enter academic medicine upon completion of their current training. Very few physicians completing graduate medical training in Michigan in 2003/04 had plans involving military service (1 percent), being unemployed (1 percent), or leaving the country (less than 1 percent). It is, however, rather disconcerting that 12 percent of the physicians completing training in general pediatrics were reported to be unemployed. 6 Data on post-training plans of physicians completing training in Michigan were obtained through their program directors to the American Medical Association.
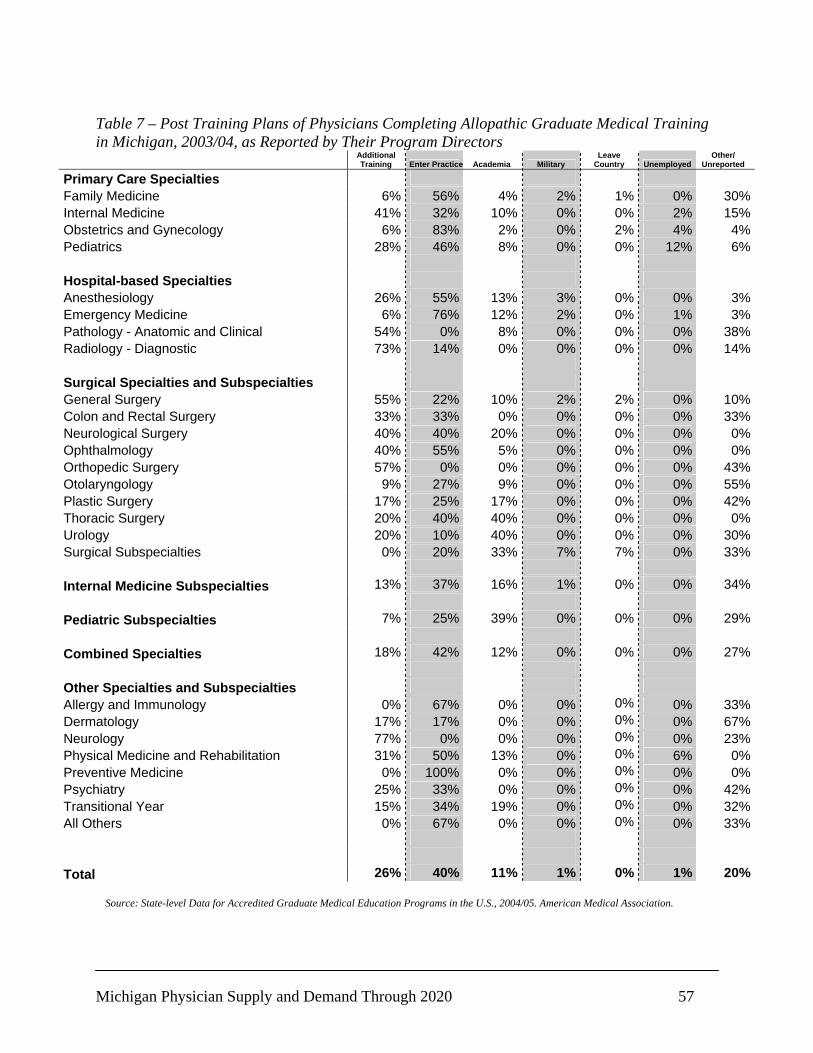
Michigan Physician Supply and Demand Through 2020 57
Table 7 – Post Training Plans of Physicians Completing Allopathic Graduate Medical Training in Michigan, 2003/04, as Reported by Their Program Directors
Additional Training Enter Practice Academia Military
Leave Country Unemployed
Other/ Unreported
Primary Care Specialties Family Medicine 6% 56% 4% 2% 1% 0% 30%Internal Medicine 41% 32% 10% 0% 0% 2% 15%Obstetrics and Gynecology 6% 83% 2% 0% 2% 4% 4%Pediatrics 28% 46% 8% 0% 0% 12% 6% Hospital-based Specialties Anesthesiology 26% 55% 13% 3% 0% 0% 3%Emergency Medicine 6% 76% 12% 2% 0% 1% 3%Pathology - Anatomic and Clinical 54% 0% 8% 0% 0% 0% 38%Radiology - Diagnostic 73% 14% 0% 0% 0% 0% 14% Surgical Specialties and Subspecialties General Surgery 55% 22% 10% 2% 2% 0% 10%Colon and Rectal Surgery 33% 33% 0% 0% 0% 0% 33%Neurological Surgery 40% 40% 20% 0% 0% 0% 0%Ophthalmology 40% 55% 5% 0% 0% 0% 0%Orthopedic Surgery 57% 0% 0% 0% 0% 0% 43%Otolaryngology 9% 27% 9% 0% 0% 0% 55%Plastic Surgery 17% 25% 17% 0% 0% 0% 42%Thoracic Surgery 20% 40% 40% 0% 0% 0% 0%Urology 20% 10% 40% 0% 0% 0% 30%Surgical Subspecialties 0% 20% 33% 7% 7% 0% 33% Internal Medicine Subspecialties 13% 37% 16% 1% 0% 0% 34% Pediatric Subspecialties 7% 25% 39% 0% 0% 0% 29% Combined Specialties 18% 42% 12% 0% 0% 0% 27% Other Specialties and Subspecialties Allergy and Immunology 0% 67% 0% 0% 0% 0% 33%Dermatology 17% 17% 0% 0% 0% 0% 67%Neurology 77% 0% 0% 0% 0% 0% 23%Physical Medicine and Rehabilitation 31% 50% 13% 0% 0% 6% 0%Preventive Medicine 0% 100% 0% 0% 0% 0% 0%Psychiatry 25% 33% 0% 0% 0% 0% 42%Transitional Year 15% 34% 19% 0% 0% 0% 32%All Others 0% 67% 0% 0% 0% 0% 33% Total 26% 40% 11% 1% 0% 1% 20%
Source: State-level Data for Accredited Graduate Medical Education Programs in the U.S., 2004/05. American Medical Association.
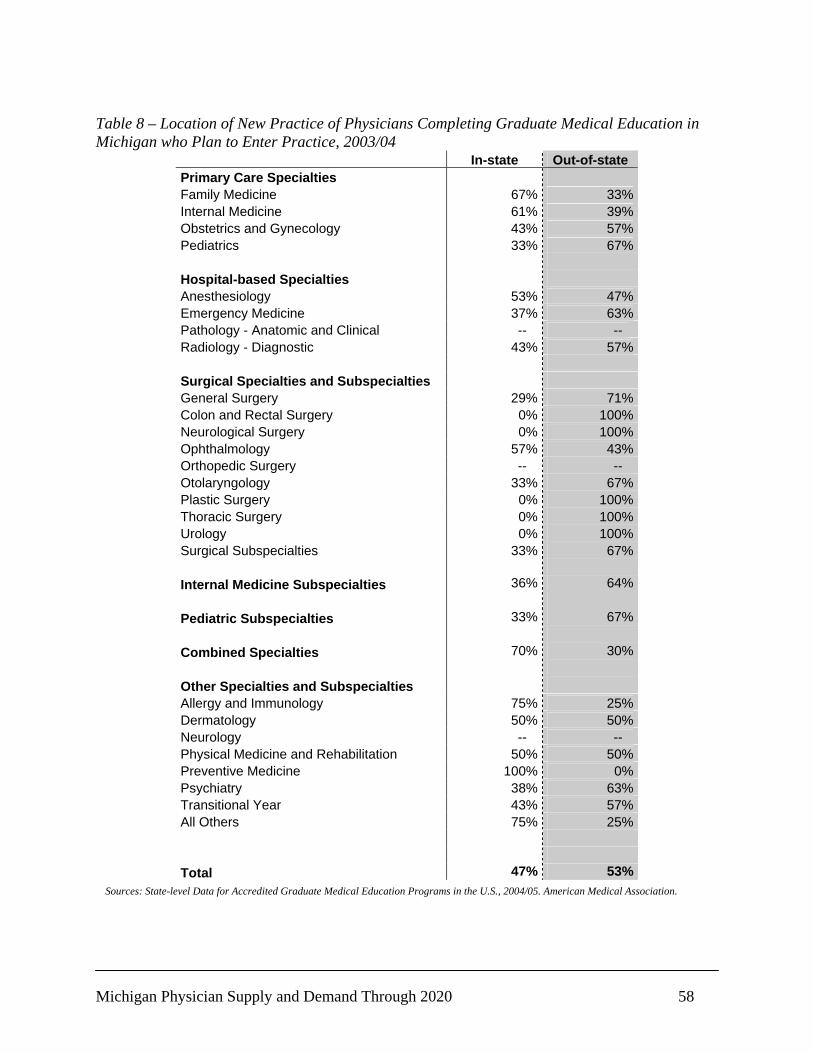
Michigan Physician Supply and Demand Through 2020 58
Table 8 – Location of New Practice of Physicians Completing Graduate Medical Education in Michigan who Plan to Enter Practice, 2003/04
In-state Out-of-state Primary Care Specialties Family Medicine 67% 33% Internal Medicine 61% 39% Obstetrics and Gynecology 43% 57% Pediatrics 33% 67% Hospital-based Specialties Anesthesiology 53% 47% Emergency Medicine 37% 63% Pathology - Anatomic and Clinical -- -- Radiology - Diagnostic 43% 57% Surgical Specialties and Subspecialties General Surgery 29% 71% Colon and Rectal Surgery 0% 100% Neurological Surgery 0% 100% Ophthalmology 57% 43% Orthopedic Surgery -- -- Otolaryngology 33% 67% Plastic Surgery 0% 100% Thoracic Surgery 0% 100% Urology 0% 100% Surgical Subspecialties 33% 67% Internal Medicine Subspecialties 36% 64% Pediatric Subspecialties 33% 67% Combined Specialties 70% 30% Other Specialties and Subspecialties Allergy and Immunology 75% 25% Dermatology 50% 50% Neurology -- -- Physical Medicine and Rehabilitation 50% 50% Preventive Medicine 100% 0% Psychiatry 38% 63% Transitional Year 43% 57% All Others 75% 25% Total 47% 53%
Sources: State-level Data for Accredited Graduate Medical Education Programs in the U.S., 2004/05. American Medical Association.
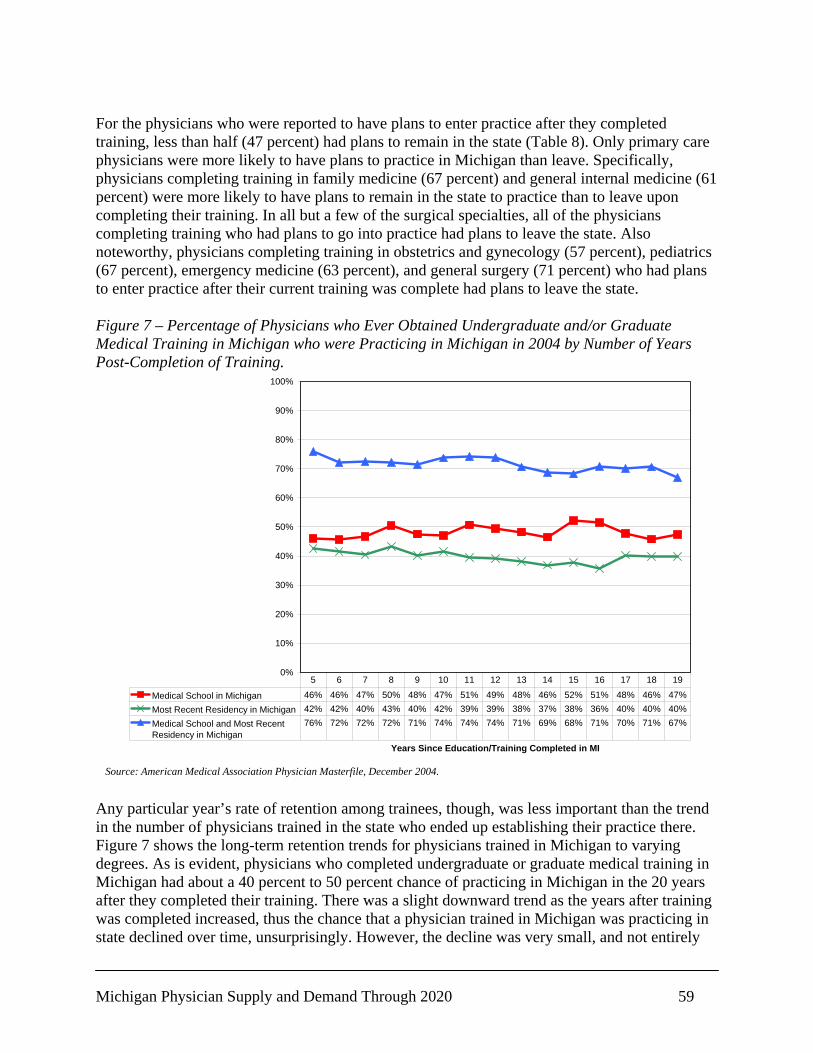
Michigan Physician Supply and Demand Through 2020 59
For the physicians who were reported to have plans to enter practice after they completed training, less than half (47 percent) had plans to remain in the state (Table 8). Only primary care physicians were more likely to have plans to practice in Michigan than leave. Specifically, physicians completing training in family medicine (67 percent) and general internal medicine (61 percent) were more likely to have plans to remain in the state to practice than to leave upon completing their training. In all but a few of the surgical specialties, all of the physicians completing training who had plans to go into practice had plans to leave the state. Also noteworthy, physicians completing training in obstetrics and gynecology (57 percent), pediatrics (67 percent), emergency medicine (63 percent), and general surgery (71 percent) who had plans to enter practice after their current training was complete had plans to leave the state. Figure 7 – Percentage of Physicians who Ever Obtained Undergraduate and/or Graduate Medical Training in Michigan who were Practicing in Michigan in 2004 by Number of Years Post-Completion of Training.
0%
10%
20%
30%
40%
50%
60%
70%
80%
90%
100%
Years Since Education/Training Completed in MI
Medical School in Michigan 46% 46% 47% 50% 48% 47% 51% 49% 48% 46% 52% 51% 48% 46% 47%Most Recent Residency in Michigan 42% 42% 40% 43% 40% 42% 39% 39% 38% 37% 38% 36% 40% 40% 40%Medical School and Most RecentResidency in Michigan
76% 72% 72% 72% 71% 74% 74% 74% 71% 69% 68% 71% 70% 71% 67%
5 6 7 8 9 10 11 12 13 14 15 16 17 18 19
Any particular year’s rate of retention among trainees, though, was less important than the trend in the number of physicians trained in the state who ended up establishing their practice there. Figure 7 shows the long-term retention trends for physicians trained in Michigan to varying degrees. As is evident, physicians who completed undergraduate or graduate medical training in Michigan had about a 40 percent to 50 percent chance of practicing in Michigan in the 20 years after they completed their training. There was a slight downward trend as the years after training was completed increased, thus the chance that a physician trained in Michigan was practicing in state declined over time, unsurprisingly. However, the decline was very small, and not entirely
Source: American Medical Association Physician Masterfile, December 2004.

Michigan Physician Supply and Demand Through 2020 60
consistent. For physicians who completed both their undergraduate medical education and their most recent graduate medical training in Michigan, the likelihood of practicing in the state in 2004 was very high, exceeding 70 percent over time. As was the case with physicians who either graduated from a Michigan medical school or who had completed their graduate medical training in the state, there was a very slight decline in the likelihood of practicing in Michigan in 2004 as the years since graduation increased.
Michigan Physician Supply and Demand Through 2020 61
Chapter 6: Physician Supply and Demand Forecasting in the U.S. Since the mid-1960s, the nation has struggled with a series of physician workforce issues: determining the appropriate number of physicians needed to adequately care for the population, the role of international medical school graduates, the mix of primary care and non-primary care physicians, lack of diversity in medicine, mal-distribution of existing physician resources, and, more recently, the evolving demographics of the profession. Growth of the Physician Workforce in the U.S.: 1960 to the present Between 1960 and 1980, the number of allopathic medical schools in the U.S. grew from 85 to 126, and the number of graduates more than doubled from 7,081 to 15,113 (AAMC 2001). Moreover, the nation’s physician supply grew rapidly, increasing from 235,303 active allopathic physicians in 1965 to 316,491 in 1975 (AMA 1976). In 1976, in response to concerns about the rapidly growing supply of physicians, the Graduate Medical Education National Advisory Committee (GMENAC) was established to advise the nation on how many physicians were needed in the U.S., in total and by specialty (GMENAC 1981). In 1980, GMENAC concluded that the nation faced a potentially serious surplus and recommended the nation limit the number of medical school positions and severely restrict the number of international medical school graduates (IMGs) entering the U.S. (GMENAC 1981). When GMENAC issued its report in 1980, there were 419,228 active physicians in the U.S. (Salsberg and Forte 2002). The surplus GMENAC envisioned was based on an estimate that the number of physicians would grow to 535,750 by 1990 and 642,950 by 2000 unless steps were taken to reduce the growth in physicians (GMENAC 1981). Concerns about a potential surplus escalated with the publication of several papers in the early 1990s suggesting that the expansion of managed care and its emphasis on primary care would lead to an even greater surplus of physicians than predicted by GMENAC, especially medical and surgical specialists (Weiner, 1994, 1995; Gamliel, et al., 1995; Wennberg, 1993). In fact, Weiner estimated that under certain managed care expansion scenarios the nation required between 138 and 144 patient care physicians per 100,000 population, a level well below the 191 physicians per 100,000 population suggested by GMENAC (Salsberg and Forte, 2002). Since the nation already had 214 active physicians per 100,000 in 1990 and was experiencing a period of physician supply growth, the specter of a massive surplus of physicians by the turn of the century was raised. This concern was also echoed by the federal Council on Graduate Medical Education (COGME). In several reports between 1992 and 1998, the COGME reaffirmed its concern with a potential surplus of physicians (COGME 1992; 1994; 1995a; 1995b; 1996; 1998). In 2000, there were approximately 779,723 active physicians in the U.S., or 276 physicians per 100,000 population. However, if the GMENAC methodology for calculating physician supply was used, including a downward adjustment for physicians in training, the supply of physicians in 2000 would have been 676,381, or 240 physicians per 100,000 population. Thus, as predicted by GMENAC, the physician supply in the U.S. grew very rapidly. Between 1980 and 2000, the physician supply in the U.S. increased by more than 320,000 physicians.
Michigan Physician Supply and Demand Through 2020 62
Physician Workforce Policy: 1986 to the present Although the federal government does not control the education, training, and supply of physicians in the U.S., a series of publicly supported reports and studies along with the work of the federal Council on Graduate Medical Education (COGME) have provided important guidance to the medical education and training community. COGME was authorized by Congress in 1986 to act as the federal physician workforce planning group (Grumbach, 2002a). A central charge of COGME was to make policy recommendations with respect to the adequacy of the supply and distribution of physicians in the U.S. including current and future shortages or excesses of physicians in the medical and surgical specialties and subspecialties. Since 1992, COGME held a set of physician workforce policy goals centered on its 110/50-50 recommendations, first articulated in its Third Report: Improving Access to Health Care Through Physician Workforce Reform: Directions for the 21st Century (1992). The 110/50-50 recommendations called for reducing the number of physicians entering residency training from what was then 140 percent to 110 percent of the number of graduates from allopathic and osteopathic medical schools in the U.S. in 1993 and increasing the percentage of those graduates who complete training and enter practice as generalists from the level then at 30 percent to at least 50 percent. Several years later, COGME’s Eighth Report: Patient Care Physician Supply and Requirements: Testing COGME Recommendations (1996) provided projections of physician supply and requirements that supported the sagacity of the recommendations laid out in the Third Report. In assessing the progress made towards the COGME 110/50-50 goals, COGME’s Fourteenth Report: COGME Physician Workforce Policies: Recent Developments and Remaining Challenges in Meeting National Goals (1999), found that as of the 1997-98 academic year, the nation’s first year residents numbered approximately 129 percent of the number of graduates of allopathic and osteopathic medical schools in the U.S., and that it would be necessary to reduce the number of first year residents by about 3,400 to reach the 110 percent goal. Moreover, the Fourteenth Report found that while the number of generalists completing training each year had increased from earlier periods, the nation was still training too few generalists and too many specialists. Moreover, several examinations of the balance of supply of and demand for physicians suggested that the nation may be facing a shortage rather than a surplus of physicians in the coming years (Cooper, 2002; Cooper et al., 2002; Cooper et al., 2003; Bland and Isaacs, 2002; Forte et al., 2000). The work of Cooper, especially, started with the premise of a physician marketplace where consumers purchase services from physicians – the important drivers in such a system are population growth and population wealth. The arguments and justifications employed in the Third Report, however, were not based on market considerations. Instead, they were based on public health considerations including universal access to health care, cost efficiency, and the goals of cost-effective levels of physician supply and the appropriate mix of generalists to provide for the health needs of the U.S. The empirical evidence to support the recommended generalist/specialist mix (50-50) was drawn
Michigan Physician Supply and Demand Through 2020 63
from international comparisons and from staffing patterns of closed managed care health care systems. As was revealed in Fourteen Report and other work, the models that informed the 110/50-50 recommendations were based on a health care delivery systems which had never been implemented as pervasively as predicted (Grumbach, 2002a), had changed sufficiently to render the recommendations obsolete, or had problems of their own (i.e., international supply/need imbalances). Ultimately, in 2002 the COGME commissioned a report to take another look at physician workforce projections. In January 2005, the COGME released the findings of its re-examination of the previous physician workforce projections in its Sixteenth Report: Physician Workforce Policy Guidelines for the United States, 2000 – 2020. The report detailed forecasts of national physician supply and demand that indicated a substantial shortage of physicians by 2020. The magnitude of the shortage was estimated at 85,000 to 96,000 physicians, or between 7.5 and 8.5 percent of the likely number of physicians required to provide services for the nation’s population in 2020. The Sixteenth Report joined a growing number of voices that had arrived at the same troubling conclusion. In the late 1990s, prominent physician workforce researchers began to question the notion of a national physician surplus widely held earlier in the decade. With aging general and physician populations, a stagnant medical education and training effort, more than 4,000 designated primary care Health Professional Shortage Areas, a decline in the growth of managed care, a willingness of payors to continue supporting rising rates of physician utilization, and reports from a dozen medical specialties of current or impending physician shortages, it no longer made sense to think in terms of physician surpluses. The COGME’s report attempted to bring all of these observations together. One of the failings of the Sixteenth Report, however, was its lack of attention to regional and specialty-specific variations embedded in its forecasts. Thus, one of the ramifications of the report was movement by concerned stakeholders in a number of states to determine how the projected national physician shortage would play out in their areas. Amid renewed discussion of the adequacy of the physician workforce nationally, several pioneering states took it upon themselves to conduct assessments of the adequacy of their supplies of physicians now and with an eye to the future. Arizona, California, Florida, Kentucky, Massachusetts, Michigan, Mississippi, New Mexico, North Carolina, Oregon, Texas, Wisconsin, and others have either finished an assessment or are in the midst of one. Arizona, Florida, and Texas deemed it necessary to expand medical school capacity in their states in order to assure an adequate supply of physicians in the future. Moreover, as was stated above, in the past several years, specialty-specific examinations in Cardiology, Endocrinology, Allergy and Immunology, Psychiatry, Neurosurgery, Pediatric Subspecialties, Dermatology, Medical Genetics, Radiology, Geriatric Medicine, and Critical Care also yielded findings of current or future shortages of physicians.

Michigan Physician Supply and Demand Through 2020 64
Approaches to Forecasting Physician Supply and Demand The two basic approaches to examining physician workforce requirements, the first based on market demand, the other based on public health goals (need), have been long recognized by health workforce researchers. The demand approaches examine economic indicators such as the functional relationships between the volume of medical services populations desire to consume at given levels of cost, financial resources, population size, individual desires and preferences as reflected in the psychological wants of populations, and the quality of the job market for physicians in specific specialties in specific geographical areas. The need approaches attempt to incorporate concerns around public health and normative public policy that promotes the health of the nation in a financially responsible manner. Not surprisingly, as the assumptions underlying the two basic approaches are different, many times the conclusions and policy recommendations drawn from analyses based on these approaches differ. Proponents of both approaches have argued that employing only one of these approaches may be a necessary but insufficient basis for developing physician workforce policy. Using a market-based approach alone can produce recommendations which mirror the current health care delivery system, with all of its advantages and disadvantages, while considering a need-based approach alone can produce unreachable policy goals and untenable policy recommendations due to disagreement with society’s desires and preferences. Factors Affecting Physicians Supply and Demand Supply In order to accurately forecast the supply of physicians in a geographic location, it is helpful to take into consideration the following: 1) The overall number of new entrants into the physician workforce and the source of the new entrants; 2) The gender distribution of the current physician supply and of new entrants and its effect on the relative number of hours spent in professional activities (to accurately calculate full-time equivalents or FTEs); 3) The age distribution of the current physician supply; 4) Retirement, death, and other separation rates of the current physician supply; 5) The specialty distribution of the current physician supply and the specialty choices of new entrants; 6) The rates of different types of professional activities (patient care, teaching, research, etc.) of the current physician supply; and 7) Physician migration patterns (both into and out of a particular area).
Michigan Physician Supply and Demand Through 2020 65
In addition, over the last two decades, the physician workforce experienced a number of key transformations. To the extent that data are available, these transformations should be taken into consideration when forecasting the future supply of physicians: Demographic Evolution and Physician Work Effort Women in Medicine Women have made great strides in medicine over the past 20 years, nearly tripling their representation in the profession. Currently making up more than 28 percent of the physician workforce (Smart, 2006), women will continue to become a larger part of the workforce; women comprise nearly 50 percent of the students enrolled in U.S. medical schools (Journal of the American Medical Association, 2005). A number of studies have documented that women work fewer hours over the course of their professional work life than men (Kletke, Marder and Silberger, 1990; Bobula, 1980; Martin et al., 1988; Cooper, 1994; AMWAC/AHIW, 1996, 1998; Sullivan and Buske, 1998; Forte and Salsberg, 1999). This phenomenon may reflect time taken for child-rearing, providing care for elderly parents or other relatives, and other family concerns. Recent research has, however, suggested that women are not the only physicians working less. Instead, some (Bland and Isaacs, 2002; Gelfand et al., 2002; Dorsey et al., 2003) claim this phenomenon of women working fewer hours is part of a larger generational phenomenon, perhaps not limited to medicine (Bond et al., 1998; Lang, 2000; Gutner, 2002). Interestingly, there are also some indications that older physicians are reducing the hours they work (Cooper, 2002). Aging of the Physician Workforce Like the general U.S. population, physicians, as a group, are growing older. In fact, between 1982 and 2004 the proportion of active physicians ages 65 and older increased from 8 percent to 11 percent. In 2004, there were more than 84,000 active physicians who were 65 years of age or older, another 142,000 between ages 55 and 64 who will reach age 65 by 2014, and another 215,000 between ages 45 and 54 who will reach age 65 by 2024 (AMA, 1984; AMA, 2006). Separation from the Physician Workforce In some ways separation from the physician workforce is related to age. As a physician ages, he/she is more likely to leave practice for one reason or another, be it retirement, death, or other reasons. With the aging of the physician population, a larger and larger proportion of the physician workforce will be reaching the traditional age of retirement in the near future. There is no way to know with certainty the actual retirement patterns of physicians in future years. If the baby boom generation of physicians retires earlier than past generations, this would significantly reduce the supply of physicians in the next decade. On the other hand, if physicians are working fewer hours per week due to changing lifestyle choices, they may stay in practice for a longer period of time, not having as much chance to “burn-out” or become dissatisfied for

Michigan Physician Supply and Demand Through 2020 66
some other reason. This phenomenon might lead to an increase in the supply of physicians in the future. Productivity Changes due to Technology Developments Another important factor than can influence the available supply of physicians is their productivity. Productivity, in this instance, is defined as output per unit of time spent in practice. Currently, there are, and certainly in the future, there will be more, changes occurring in medical practice that allow physicians to practice more efficiently. New medical technologies, particularly in the area of information systems, could lead to an increase in physician productivity; for example, the electronic medical record could allow physicians to quickly, easily, and accurately access and assess all the necessary information on a patient’s history instead of having to order the file be sent to him/her, then shuffling through the pages in the file. Estimates of the potential productivity gains through the use of new technologies or implementation of already existing technologies are widely variable (Blumenthal, 2002; Masys, 2002; Goldsmith et al., 2003). A recent study suggests a potential gain of up to 20 percent through the use of technology (Corrigan, 2003). Resident and Fellow Work Hour Restrictions The recent implementation of regulations limiting resident and fellow work hours to 80 or fewer should be taken into account when estimating the future physician supply. While the general impact of these regulations is clear – the total supply of physicians (FTEs) will decrease -- it is unclear what the magnitude of the effect will be. It is unclear how much of the reduction in hours worked per week will come from patient care compared to educational activities. It is also possible that reduced work hours during training and increased flexibility in scheduling will contribute to changes in new physicians’ practice patterns after training such as increased job sharing and reduced patient care hours, potentially amplifying the different practice patterns already observed among the newest generation of physicians. Specialty Distribution and Choices The issue of specialty distribution and choice has less to do with the overall supply of physicians than with the types of services provided by physicians. The specific specialty a physician practices has implications for the types of services provided. There have been a number of attempts at understanding the reasons behind physicians’ specialty choices (Hay, 1991; Hurley, 1991; Nicholson, 2002; Puccio et al., 2002; Newton and Grayson, 2003; Dorsey et al., 2003). The factors most often cited to explain variation in specialty choice include expected income, intellectual content of the specialty, research opportunities in the specialty, prestige of the specialty, gender and race/ethnicity of the physician, family considerations, and so forth. Changing Physician Professional Activities Being a physician involves a variety of activities, including patient care, medical teaching, medical research, and other professional activities. Physicians, however, are not limited to those types of activities. The rate at which the supply of physicians participates in activities within
Michigan Physician Supply and Demand Through 2020 67
their field of expertise (i.e., medicine) and activities outside the realm of medicine directly affects the number of available physicians. If activities outside of the scope of what are currently considered the professional activities of a physician (e.g., physicians working as financial analysts, insurance consultants, pharmaceutical consultants) become more attractive to physicians, the supply of physicians will decrease. Moreover, changes in the distribution of activities in which a physician participates could also have effects on the supply of physicians. For example, the average physician typically spends the most amount of his/her time in patient care. If more physicians devoted more time to research, the supply of physicians providing patient care services would decrease. Demand In order to accurately forecast the demand for physicians in a geographic location, it is helpful to take into consideration the following: 1) Physician utilization rates by age, gender, and race/ethnicity; 2) Physician utilization rates by practice setting and insurance status; and 3) Current and future population counts by age, gender, race/ethnicity, practice setting, and insurance status. In addition, forecasts of the future demand for physicians should seek to account for the following key factors: Population Wealth Based on a perspective currently championed by Cooper et al. (2002; 2003) (past proponents include Schwartz and colleagues in the late 1980s and early 1990s [1989; 1990] and Roehrig and Eisenstein [1999]), the trend in population wealth should be considered in demand forecasts. This perspective suggests that there are four major factors driving demand for physician services: economic expansion, population growth, work effort of physicians, and services provided by other practitioners (i.e., non-physician clinicians). Cooper et al. suggested the most important of the four factors affecting physician demand is economic expansion. They found a consistent correlation between the supply of physicians and economic growth. However, Cooper and colleagues suggested that the relationship is complex. Economic growth induced growth in demand for health services, causing a rise in health care spending. This growth in health care spending, in turn, led to a growth in the health care workforce, of which physicians are an important part. This perspective is certainly not without opponents (e.g., Grumbach, 2002b; Barer, 2002; Weiner, 2002). It is easy to believe that in an environment of increasing health care costs and declining budgets, resistance to this sort of perspective is assured. However, only one peer-reviewed research article has presented data that challenge Cooper and colleagues’ findings (Anderson et al., 2003).

Michigan Physician Supply and Demand Through 2020 68
Utilization Rate Changes By definition, the most important drivers of demand for physicians are utilization rates. Thus, it is important to understand how those rates might be changing over time. With respect to age, independent investigation shows that utilization rates are changing. Most observers are familiar with findings that indicate that as the population grows older, overall utilization increases because utilization rates increase with age. The number of people older than age 65 is increasing and will increase significantly in the coming years. Clearly, the aging of the population will lead to an increase in demand for physician services. However, if one examines utilization rates over time, especially physician office visits, it becomes evident that use rates by age group are changing. Analysis of the National Ambulatory Medical Care Survey (NAMCS) data from 1980, 1990, and 2000 on visits to physician offices by age group indicated that the number of physician visits per capita for age groups over age 45 has been increasing over the past couple of decades. There is reason to believe that this trend will continue over the next decade and may even accelerate as the baby boom generation ages. The baby boom generation has grown up with high expectations for health care and experienced higher utilization rates than those of previous generations. In addition, as baby boomers age, many, although certainly not all, will have disposable income that they may choose to spend on health care (Knickman et al., 2003). Between 1980 and 2000 crude per capita visits to physician offices increased from 2.4 to 2.9. This increase was not evenly distributed across age groups, however. The largest gain was experienced among persons 75 to 84 years of age, increasing from 3.5 visits to 6.3 visits annually. All of the other groups older than age 45 experienced gains as well, except the 85 years of age and older group. It turns out, however, that even though there was a global increase in utilization, for persons in the 15 to 24 year old and the 25 to 34 year old age groups utilization rates declined between 1980 and 2000. Further, the more recent changes in utilization (i.e., 1990 compared to 2000) demonstrated a uniform set of increases and declines, with all groups younger than age 45 experiencing declines in annual per capita visits to physician offices and those ages 45 and older experiencing increases in annual per capita physician office visit rates. Elimination of Unnecessary Services One of the problems associated with using actual utilization rates observed in the population under study is that while they are accurate, they too closely resemble reality, including not only the beneficial qualities of the current health care delivery system, but also its faults. In particular, the unnecessary services common in the current health care delivery system are reflected in those utilization rates. There are a number of reasons to believe some current use is unnecessary or only marginally beneficial. Possible causes include poor physician performance due to an oversupply of physicians in a geographical area, the complexities of current treatment modalities and the inability of individual physicians to sort through them competently enough to make an appropriate decision about which test(s)/treatment(s) is(are) appropriate, advertisements targeted
Michigan Physician Supply and Demand Through 2020 69
toward the public that induce patients to request services from their physicians, the financial pressure on facilities, the outright greed of a very small minority in the medical profession, the ongoing medical liability crisis and the resultant practice of “defensive medicine,” a financing/reimbursement system that gives incentives to provide services without regard to outcomes. Regardless of the causes of the unnecessary provision, there exists a long-standing, compelling argument that a substantial portion of the services provided by physicians and other practitioners in the health care delivery system are simply unnecessary or of marginal benefit. Further, it is argued that it is these unnecessary services that are driving up health care costs and spending in the aggregate. And thus, proponents of this perspective argue that the elimination of these unnecessary and marginal services provides two essential goods: efficiency and cost savings (Fisher et al., 2003a). The work of Wennberg and colleagues showing the diminishing rates of benefit to the community of additional physicians can certainly be thought of as supporting this perspective. Recently, the work of Fisher et al. (2003a; 2003b) showing the lack of a relationship (and sometimes a negative relationship) between the provision of services, level of spending on services, health care outcomes, and patient satisfaction provides additional support for the perspective. Recent work by Goodman et al. (2006) also provides evidence of the lack of relationship between quantity of end-of-life services and quality of care provided to Medicare beneficiaries. Approaching the issue from a slightly different perspective, Weiner (1994; 1995; 2004) and others (Hart et al., 1997; Goodman et al., 1997) have attempted to estimate demand for physician services in a way that bypasses these unnecessary services by examining closed, organized systems of health care delivery that employ more or less rigorous utilization review. In the early and mid 1990s, these examinations revolved around staff-model HMOs. This work has most recently evolved to examine large prepaid group practices having contracts with managed care plans (Weiner, 2004). The earlier work found that staff-model HMOs were able to provide equivalent quality of care with drastically smaller physician staffing levels. Those who looked more closely at these organizations found that patients were actually using quite a bit of out-of-network services and challenged this early work (Hart et al., 1997). This work continues, however; and the most recent updates show that while in the past these delivery systems may have required lower staffing levels, over time they expanded – although not quite to the levels observed outside of these delivery systems (Weiner, 2004). The most recent research in this area (Fisher et al., 2003b; Weiner, 2004), suggests that between 20 percent and 35 percent of the services currently provided are unnecessary or would not occur under a more rigorous system of utilization review.

Michigan Physician Supply and Demand Through 2020 70
Chapter 7: Michigan Physician Supply Forecasting State Level Physician Supply Forecasts Forecasts of the supply of physicians in Michigan were based upon the methodology employed in the Physician Supply Model (PSM) developed and maintained by the Bureau of Health Professions, in the Health Resources and Services Administration of the Department of Health and Human Services and used to generate national forecasts for the COGME report referenced above. The PSM forecasts the future supply of physicians according to the following steps:
• Current counts of active physicians (allopathic and osteopathic) are tabulated by age, sex, year of graduation, and specialty
• Numbers of newly trained physicians expected to enter graduate medical education (GME) each year (new entrants) are estimated by age and sex
• Forecast counts of active physicians are generated by reducing current counts by the estimated numbers of deaths and retirements and then adding in new entrants
• Forecast counts are converted to full-time equivalents (FTEs) using information on hours worked by age, sex, and specialty.
In order to apply this national methodology to the state of Michigan, it was necessary to adjust the model results to account for interstate migration of active physicians. The methodology described above was implemented for Michigan as follows:
• Counts of active physicians by age, sex, and specialty were tabulated from the year-end 2004 AMA Physician Masterfile
• Numbers of new GME entrants were estimated from historical data on first-year-GME physicians in Michigan culled from the AMA’s Graduate Medical Education Database archive
• Specialty distributions were estimated for newly entering cohorts based upon historical trends in specialties of recent Michigan physician cohorts
• PSM parameters were used to forecast deaths and retirements and to convert counts into FTEs
• The net migration adjustment was estimated based upon a study of historical trends in net migration.
State Level Supply Scenario 1: Baseline Forecast. Baseline forecasts were generated through 2020 and rescaled slightly to match the 2005 benchmark.7 In this scenario, it was assumed that all of the parameters and inputs of the supply model would remain constant over the forecast period. The baseline forecast did incorporate reductions in work hours due to the demographic changes occurring in the physician workforce over time, e.g., increasing percentage of female physicians and older physicians.
7 The 2005 benchmark was based upon the Michigan State Medical Society-sponsored report (Rosen 2005) completed in the summer of 2005. The benchmark was chosen as a way of bringing the two projects more closely in line in terms of starting points. The actual rescaling amounted to a 1 percent increase.
Michigan Physician Supply and Demand Through 2020 71
In addition to this baseline forecast of state-level physicians by specialty, a number of scenarios generated with alternative assumptions. Each is discussed below. State Level Supply Scenario 2: Reduced Work Hours Forecast. The purpose of this scenario was to examine the effect of an additional decline in work hours that affects all physicians. Under this scenario, work hours of all physicians were forecast to decline steadily between 2010 and 2020 with a final overall decline of 5 percent. This scenario was implemented by reducing the number of FTEs evenly between 2010 and 2020 such that the 2020 figure was five percent below the baseline. State Level Supply Scenario 3: Increased Productivity Forecast. The baseline forecast assumed no change in physician productivity. In this scenario, physician productivity was projected to increase by ten percent between 2010 and 2020 – roughly one percent per year. This could occur for a number of reasons including increased automation of physician practices and greater use of non-physician staff. For modeling purposes, increases in productivity are the equivalent of increasing the supply of services that can be delivered by a given number of physician hours. The effect was equivalent to increasing the number of hours physicians work by ten percent. Therefore, this scenario was implemented by increasing the number of FTEs evenly between 2010 and 2020 such that the 2020 figure was ten percent above the baseline. State Level Supply Scenario 4: Reduced Work Hours and Increased Productivity Forecast. This scenario brought together Supply Scenarios 2 and 3 by combining a five percent reduction in work hours with a ten percent increase in productivity. The net effect of the combination was a five percent increase in productivity and was implemented as such. Regional Physician Supply Forecasts Regional forecasts of physician supply were developed under two scenarios:
• Non-responsive Supply Forecast. The proportion of statewide physicians allocated to each region remains constant.
• Responsive Supply Forecast. The proportion of statewide physicians allocated to each region changes over time to reflect changes in the regional share of physician demand.
In effect, the first regional scenario assumed no locational adjustment in response to changes in demand, while the second assumed complete adjustment, that is, physicians distribute themselves in exact accordance with regional changes in demand. While it is acknowledged that actual physician location decisions are likely to fall somewhere between these two scenarios, it is likely that they would more closely resemble the latter than the former. Michigan Physician Supply, 2005 – 2020 State Level Supply Scenario 1: Baseline The supply model forecast a 10 percent increase in the supply of physicians between 2005 and 2020, with the number of active physicians predicted to increase from 30,366 in 2005 to 33,462 in 2020. Adjusting for the projected population growth in the state (5 percent), the physician to
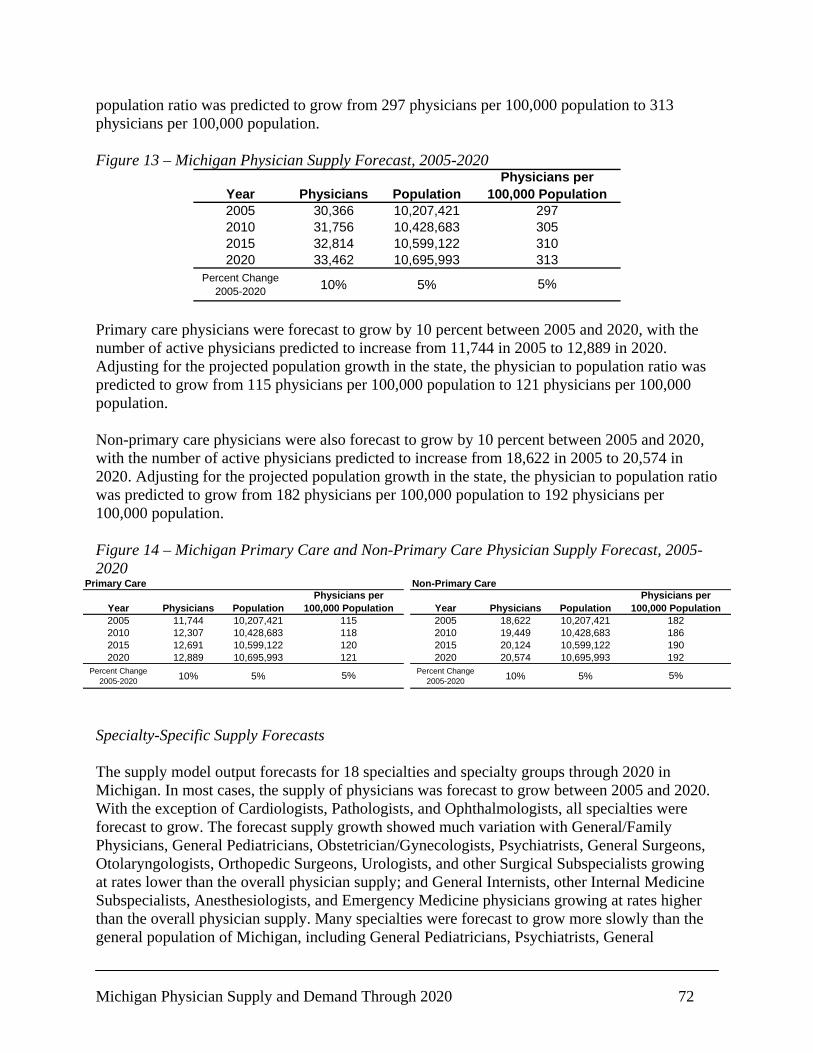
Michigan Physician Supply and Demand Through 2020 72
population ratio was predicted to grow from 297 physicians per 100,000 population to 313 physicians per 100,000 population. Figure 13 – Michigan Physician Supply Forecast, 2005-2020
Year Physicians Population2005 30,366 10,207,4212010 31,756 10,428,6832015 32,814 10,599,1222020 33,462 10,695,993
Percent Change 2005-2020 10% 5% 5%
Physicians per 100,000 Population
297305310313
Primary care physicians were forecast to grow by 10 percent between 2005 and 2020, with the number of active physicians predicted to increase from 11,744 in 2005 to 12,889 in 2020. Adjusting for the projected population growth in the state, the physician to population ratio was predicted to grow from 115 physicians per 100,000 population to 121 physicians per 100,000 population. Non-primary care physicians were also forecast to grow by 10 percent between 2005 and 2020, with the number of active physicians predicted to increase from 18,622 in 2005 to 20,574 in 2020. Adjusting for the projected population growth in the state, the physician to population ratio was predicted to grow from 182 physicians per 100,000 population to 192 physicians per 100,000 population. Figure 14 – Michigan Primary Care and Non-Primary Care Physician Supply Forecast, 2005-2020
Primary Care
Year Physicians Population2005 11,744 10,207,4212010 12,307 10,428,6832015 12,691 10,599,1222020 12,889 10,695,993
Percent Change 2005-2020 10% 5% 5%
Physicians per 100,000 Population
115118120121
Non-Primary Care
Year Physicians Population2005 18,622 10,207,4212010 19,449 10,428,6832015 20,124 10,599,1222020 20,574 10,695,993
Percent Change 2005-2020 10% 5%
192
5%
Physicians per 100,000 Population
182186190
Specialty-Specific Supply Forecasts The supply model output forecasts for 18 specialties and specialty groups through 2020 in Michigan. In most cases, the supply of physicians was forecast to grow between 2005 and 2020. With the exception of Cardiologists, Pathologists, and Ophthalmologists, all specialties were forecast to grow. The forecast supply growth showed much variation with General/Family Physicians, General Pediatricians, Obstetrician/Gynecologists, Psychiatrists, General Surgeons, Otolaryngologists, Orthopedic Surgeons, Urologists, and other Surgical Subspecialists growing at rates lower than the overall physician supply; and General Internists, other Internal Medicine Subspecialists, Anesthesiologists, and Emergency Medicine physicians growing at rates higher than the overall physician supply. Many specialties were forecast to grow more slowly than the general population of Michigan, including General Pediatricians, Psychiatrists, General

Michigan Physician Supply and Demand Through 2020 73
Surgeons, Ophthalmologists, Otolaryngologists, Orthopedic Surgeons, and other Surgical Subspecialists. Primary Care Specialties General/Family Medicine General/Family Physicians were forecast to grow by 7 percent between 2005 and 2020, slightly below the overall predicted rate of growth among primary care physicians, with the number of active General/Family Physicians predicted to increase from 5,080 in 2005 to 5,420 in 2020. Adjusting for the projected population growth in the state, the General/Family Physician to population ratio was predicted to grow from 49.8 physicians per 100,000 population to 50.7 physicians per 100,000 population. General Internal Medicine General Internists were forecast to grow by 17 percent between 2005 and 2020, well above the overall predicted rate of growth among primary care physicians, with the number of active General Internists predicted to increase from 4,742 in 2005 to 5,525 in 2020. Adjusting for the projected population growth in the state, the General Internist to population ratio was predicted to grow from 46.5 physicians per 100,000 population to 51.7 physicians per 100,000 population. General Pediatrics General Pediatricians were forecast to grow by just 1 percent between 2005 and 2020, well below the overall predicted rate of growth among primary care physicians, with the number of active General Pediatricians predicted to increase from 1,922 in 2005 to 1,944 in 2020. Adjusting for the projected population growth in the state, the General Pediatrician to population ratio was predicted to decline from 18.8 physicians per 100,000 population to 18.2 physicians per 100,000 population. Figure 15 – Michigan Primary Care Physician Supply: Detailed Specialty Forecasts, 2005-2020
Primary Care (Overall)
Year Physicians Population2005 11,744 10,207,4212010 12,307 10,428,6832015 12,691 10,599,1222020 12,889 10,695,993
Percent Change 2005-2020 10% 5% 5%
Physicians per 100,000 Population
115118120121
General/Family Medicine
Year Physicians Population2005 5,080 10,207,4212010 5,222 10,428,6832015 5,350 10,599,1222020 5,420 10,695,993
Percent Change 2005-2020 7% 5%
50.7
2%
Physicians per 100,000 Population
49.850.150.5
General Internal Medicine
Year Physicians Population2005 4,742 10,207,4212010 5,127 10,428,6832015 5,375 10,599,1222020 5,525 10,695,993
Percent Change 2005-2020 17% 5%
50.751.7
11%
Physicians per 100,000 Population
46.549.2
General Pediatrics
Year Physicians Population2005 1,922 10,207,4212010 1,958 10,428,6832015 1,966 10,599,1222020 1,944 10,695,993
Percent Change 2005-2020 1% 5%
Physicians per 100,000 Population
18.818.818.518.2
-3%
Michigan Physician Supply and Demand Through 2020 74
Non-Primary Care Specialties Cardiovascular Disease Cardiologists were forecast to contract by 6 percent between 2005 and 2020, unlike the overall predicted growth among non-primary care physicians, with the number of active Cardiologists predicted to decrease from 736 in 2005 to 693 in 2020. Adjusting for the projected population growth in the state, the Cardiologist to population ratio was predicted to decline from 7.2 physicians per 100,000 population to 6.5 physicians per 100,000 population. Other Internal Medicine Subspecialties Other Internal Medicine Subspecialists were forecast to grow by 20 percent between 2005 and 2020, well above the overall predicted rate of growth among non-primary care physicians, with the number of active physicians predicted to increase from 2,970 in 2005 to 3,549 in 2020. Adjusting for the projected population growth in the state, the other Internal Medicine Subspecialist to population ratio was predicted to increase from 29.1 physicians per 100,000 population to 33.2 physicians per 100,000 population. Obstetrics and Gynecology Obstetrician/Gynecologists were forecast to grow by 9 percent between 2005 and 2020, slightly below the overall predicted rate of growth among non-primary care physicians, with the number of active Obstetrician/Gynecologists predicted to increase from 1,712 in 2005 to 1,860 in 2020. Adjusting for the projected population growth in the state, the Obstetrician/Gynecologist to population ratio was predicted to increase from 16.8 physicians per 100,000 population to 17.4 physicians per 100,000 population. Pathology Pathologists were forecast to contract by 6 percent between 2005 and 2020, unlike the overall predicted growth among non-primary care physicians, with the number of active Pathologists predicted to decrease from 717 in 2005 to 676 in 2020. Adjusting for the projected population growth in the state, the Pathologist to population ratio was predicted to decrease from 7.0 physicians per 100,000 population to 6.3 physicians per 100,000 population.
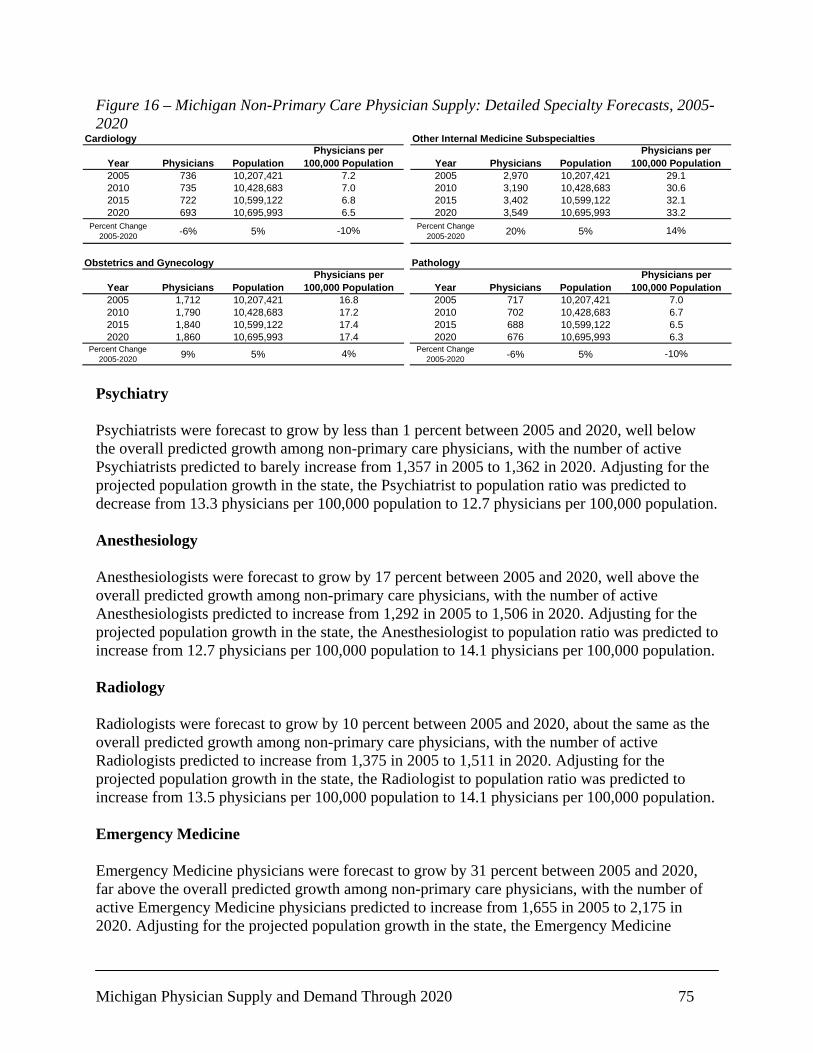
Michigan Physician Supply and Demand Through 2020 75
Figure 16 – Michigan Non-Primary Care Physician Supply: Detailed Specialty Forecasts, 2005-2020
Cardiology
Year Physicians Population2005 736 10,207,4212010 735 10,428,6832015 722 10,599,1222020 693 10,695,993
Percent Change 2005-2020 -6% 5% -10%
Physicians per 100,000 Population
7.27.06.86.5
Other Internal Medicine Subspecialties
Year Physicians Population2005 2,970 10,207,4212010 3,190 10,428,6832015 3,402 10,599,1222020 3,549 10,695,993
Percent Change 2005-2020 20% 5%
33.2
14%
Physicians per 100,000 Population
29.130.632.1
Obstetrics and Gynecology
Year Physicians Population2005 1,712 10,207,4212010 1,790 10,428,6832015 1,840 10,599,1222020 1,860 10,695,993
Percent Change 2005-2020 9% 5%
16.817.217.417.4
4%
Physicians per 100,000 Population
Pathology
Year Physicians Population2005 717 10,207,4212010 702 10,428,6832015 688 10,599,1222020 676 10,695,993
Percent Change 2005-2020 -6% 5%
Physicians per 100,000 Population
7.06.76.56.3
-10% Psychiatry Psychiatrists were forecast to grow by less than 1 percent between 2005 and 2020, well below the overall predicted growth among non-primary care physicians, with the number of active Psychiatrists predicted to barely increase from 1,357 in 2005 to 1,362 in 2020. Adjusting for the projected population growth in the state, the Psychiatrist to population ratio was predicted to decrease from 13.3 physicians per 100,000 population to 12.7 physicians per 100,000 population. Anesthesiology Anesthesiologists were forecast to grow by 17 percent between 2005 and 2020, well above the overall predicted growth among non-primary care physicians, with the number of active Anesthesiologists predicted to increase from 1,292 in 2005 to 1,506 in 2020. Adjusting for the projected population growth in the state, the Anesthesiologist to population ratio was predicted to increase from 12.7 physicians per 100,000 population to 14.1 physicians per 100,000 population. Radiology Radiologists were forecast to grow by 10 percent between 2005 and 2020, about the same as the overall predicted growth among non-primary care physicians, with the number of active Radiologists predicted to increase from 1,375 in 2005 to 1,511 in 2020. Adjusting for the projected population growth in the state, the Radiologist to population ratio was predicted to increase from 13.5 physicians per 100,000 population to 14.1 physicians per 100,000 population. Emergency Medicine Emergency Medicine physicians were forecast to grow by 31 percent between 2005 and 2020, far above the overall predicted growth among non-primary care physicians, with the number of active Emergency Medicine physicians predicted to increase from 1,655 in 2005 to 2,175 in 2020. Adjusting for the projected population growth in the state, the Emergency Medicine

Michigan Physician Supply and Demand Through 2020 76
physician to population ratio was predicted to increase from 16.2 physicians per 100,000 population to 20.3 physicians per 100,000 population. Figure 17 – Michigan Non-Primary Care Physician Supply: Detailed Specialty Forecasts, 2005-2020
Psychiatry
Year Physicians Population2005 1,357 10,207,4212010 1,352 10,428,6832015 1,363 10,599,1222020 1,362 10,695,993
Percent Change 2005-2020 0% 5% -4%
Physicians per 100,000 Population
13.313.012.912.7
Anesthesiology
Year Physicians Population2005 1,292 10,207,4212010 1,376 10,428,6832015 1,448 10,599,1222020 1,506 10,695,993
Percent Change 2005-2020 17% 5%
14.1
11%
Physicians per 100,000 Population
12.713.213.7
Radiology
Year Physicians Population2005 1,375 10,207,4212010 1,440 10,428,6832015 1,478 10,599,1222020 1,511 10,695,993
Percent Change 2005-2020 10% 5%
13.513.813.914.1
5%
Physicians per 100,000 Population
Emergency Medicine
Year Physicians Population2005 1,655 10,207,4212010 1,841 10,428,6832015 2,020 10,599,1222020 2,175 10,695,993
Percent Change 2005-2020 31% 5%
Physicians per 100,000 Population
16.217.719.120.3
25% General Surgery General Surgeons were forecast to grow by 3 percent between 2005 and 2020, somewhat below the overall predicted growth among non-primary care physicians, with the number of active General Surgeons predicted to only increase from 1,648 in 2005 to 1,695 in 2020. Adjusting for the projected population growth in the state, the General Surgeons to population ratio was predicted to decrease from 16.1 physicians per 100,000 population to 15.8 physicians per 100,000 population. Ophthalmology Ophthalmologists were forecast to contract by 1 percent between 2005 and 2020, unlike the overall predicted growth among non-primary care physicians, with the number of active Ophthalmologists predicted to decrease from 668 in 2005 to 663 in 2020. Adjusting for the projected population growth in the state, the Ophthalmologist to population ratio was predicted to decrease from 6.5 physicians per 100,000 population to 6.2 physicians per 100,000 population. Otolaryngology Otolaryngologists were forecast to grow by only 3 percent between 2005 and 2020, somewhat below the overall predicted growth among non-primary care physicians, with the number of active Otolaryngologists predicted to increase from 317 in 2005 to 328 in 2020. Adjusting for the projected population growth in the state, the Otolaryngologist to population ratio was predicted to remain about the same at 3.1 physicians per 100,000 population throughout the forecast period.

Michigan Physician Supply and Demand Through 2020 77
Orthopedic Surgery Orthopedic Surgeons were forecast to grow by 3 percent between 2005 and 2020, somewhat below the overall predicted growth among non-primary care physicians, with the number of active Orthopedic Surgeons predicted to increase from 844 in 2005 to 872 in 2020. Adjusting for the projected population growth in the state, the Orthopedic Surgeon to population ratio was predicted to decrease very slightly from 8.3 physicians per 100,000 population to 8.2 physicians per 100,000 population. Figure 18 – Michigan Non-Primary Care Physician Supply: Detailed Specialty Forecasts, 2005-2020
General Surgery
Year Physicians Population2005 1,648 10,207,4212010 1,681 10,428,6832015 1,686 10,599,1222020 1,695 10,695,993
Percent Change 2005-2020 3% 5% -2%
Physicians per 100,000 Population
16.116.115.915.8
Ophthalmology
Year Physicians Population2005 668 10,207,4212010 671 10,428,6832015 662 10,599,1222020 663 10,695,993
Percent Change 2005-2020 -1% 5%
6.2
-5%
Physicians per 100,000 Population
6.56.46.3
Otolaryngology
Year Physicians Population2005 317 10,207,4212010 320 10,428,6832015 325 10,599,1222020 328 10,695,993
Percent Change 2005-2020 3% 5%
3.13.1
-1%
Physicians per 100,000 Population
3.13.1
Orthopedic Surgery
Year Physicians Population2005 844 10,207,4212010 857 10,428,6832015 866 10,599,1222020 872 10,695,993
Percent Change 2005-2020 3% 5%
Physicians per 100,000 Population
8.38.28.28.2
-1% Urology Urologists were forecast to grow by 5 percent between 2005 and 2020, somewhat below the overall predicted growth among non-primary care physicians, with the number of active Urologists predicted to increase from 375 in 2005 to 393 in 2020. Adjusting for the projected population growth in the state, the Urologist to population ratio was predicted to remain about the same at 3.7 physicians per 100,000 population throughout the forecast period. Other Surgery Subspecialties Other Surgical Subspecialists were forecast to grow by 3 percent between 2005 and 2020, somewhat below the overall predicted growth among non-primary care physicians, with the number of active physicians predicted to increase from 568 in 2005 to 586 in 2020. Adjusting for the projected population growth in the state, the other Surgical Subspecialist to population ratio was predicted to decrease very slightly from 5.6 physicians per 100,000 population to 5.5 physicians per 100,000 population.
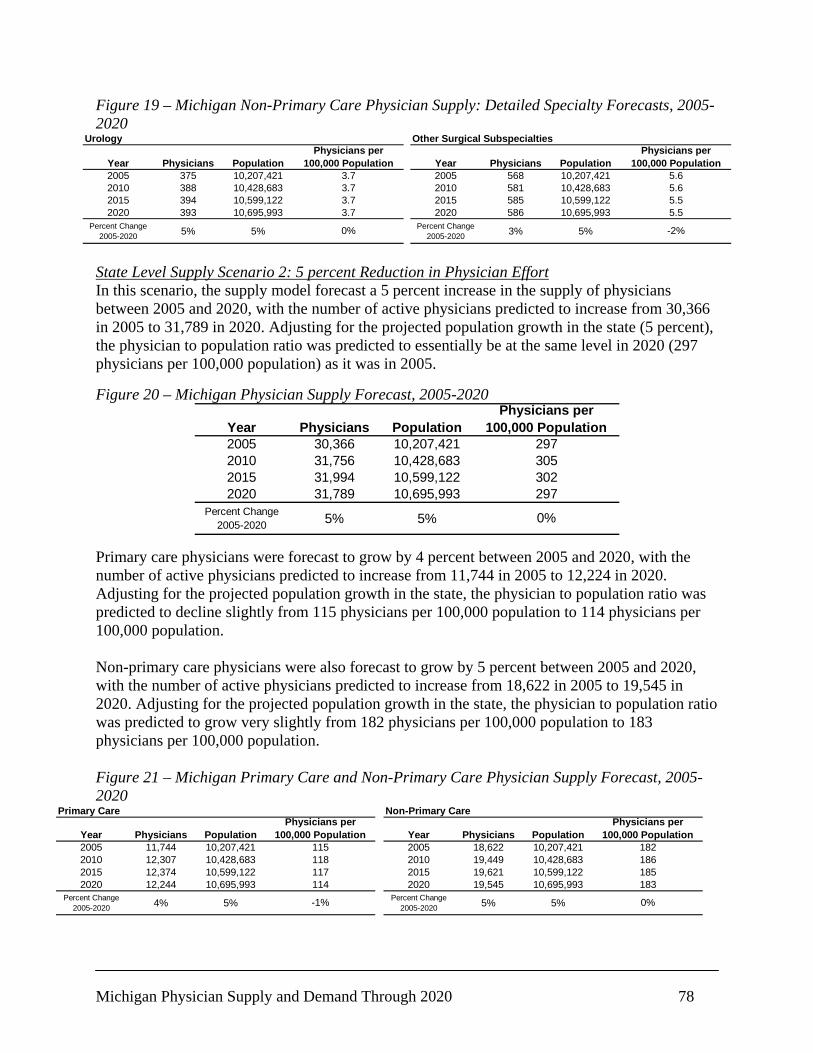
Michigan Physician Supply and Demand Through 2020 78
Figure 19 – Michigan Non-Primary Care Physician Supply: Detailed Specialty Forecasts, 2005-2020
Urology
Year Physicians Population2005 375 10,207,4212010 388 10,428,6832015 394 10,599,1222020 393 10,695,993
Percent Change 2005-2020 5% 5% 0%
Physicians per 100,000 Population
3.73.73.73.7
Other Surgical Subspecialties
Year Physicians Population2005 568 10,207,4212010 581 10,428,6832015 585 10,599,1222020 586 10,695,993
Percent Change 2005-2020 3% 5%
5.5
-2%
Physicians per 100,000 Population
5.65.65.5
State Level Supply Scenario 2: 5 percent Reduction in Physician Effort In this scenario, the supply model forecast a 5 percent increase in the supply of physicians between 2005 and 2020, with the number of active physicians predicted to increase from 30,366 in 2005 to 31,789 in 2020. Adjusting for the projected population growth in the state (5 percent), the physician to population ratio was predicted to essentially be at the same level in 2020 (297 physicians per 100,000 population) as it was in 2005. Figure 20 – Michigan Physician Supply Forecast, 2005-2020
Year Physicians Population2005 30,366 10,207,4212010 31,756 10,428,6832015 31,994 10,599,1222020 31,789 10,695,993
Percent Change 2005-2020 5% 5% 0%
Physicians per 100,000 Population
297305302297
Primary care physicians were forecast to grow by 4 percent between 2005 and 2020, with the number of active physicians predicted to increase from 11,744 in 2005 to 12,224 in 2020. Adjusting for the projected population growth in the state, the physician to population ratio was predicted to decline slightly from 115 physicians per 100,000 population to 114 physicians per 100,000 population. Non-primary care physicians were also forecast to grow by 5 percent between 2005 and 2020, with the number of active physicians predicted to increase from 18,622 in 2005 to 19,545 in 2020. Adjusting for the projected population growth in the state, the physician to population ratio was predicted to grow very slightly from 182 physicians per 100,000 population to 183 physicians per 100,000 population. Figure 21 – Michigan Primary Care and Non-Primary Care Physician Supply Forecast, 2005-2020
Primary Care
Year Physicians Population2005 11,744 10,207,4212010 12,307 10,428,6832015 12,374 10,599,1222020 12,244 10,695,993
Percent Change 2005-2020 4% 5% -1%
Physicians per 100,000 Population
115118117114
Non-Primary Care
Year Physicians Population2005 18,622 10,207,4212010 19,449 10,428,6832015 19,621 10,599,1222020 19,545 10,695,993
Percent Change 2005-2020 5% 5%
183
0%
Physicians per 100,000 Population
182186185
Michigan Physician Supply and Demand Through 2020 79
Specialty-Specific Supply Forecasts In some cases, the supply of physicians was forecast to grow between 2005 and 2020 under this scenario. However, more specialties, including General Pediatrics, Cardiology, Pathology, Psychiatry, General Surgery, Ophthalmology, Otolaryngology, Orthopedic Surgery, and other Surgical Subspecialists were forecast to contract in this scenario compared to the baseline. The forecast supply decline showed much variation with Cardiologists, Pathologists, and Ophthalmologists contracting at rates higher than 5 percent; and General Pediatricians, General Surgeons, Otolaryngologists, Orthopedic Surgeons, and other Surgical Subspecialists declining at rates lower than 5 percent. Growth in several specialties was forecast: General/Family Medicine (1 percent), General Internal Medicine (11 percent), Internal Medicine Subspecialists (other than Cardiology) (14 percent),Obstetrics and Gynecology (3 percent), Anesthesiology (11 percent), Radiology (4 percent), and Emergency Medicine (25 percent). Primary Care Specialties General/Family Medicine General/Family Physicians were forecast to grow by 1 percent between 2005 and 2020, slightly below the overall predicted rate of growth among primary care physicians, with the number of active General/Family Physicians predicted to increase from 5,080 in 2005 to 5,149 in 2020. Adjusting for the projected population growth in the state, the General/Family Physician to population ratio was predicted to decline from 49.8 physicians per 100,000 population to 48.1 physicians per 100,000 population. General Internal Medicine General Internists were forecast to grow by 11 percent between 2005 and 2020, well above the overall predicted rate of growth among primary care physicians, with the number of active General Internists predicted to increase from 4,742 in 2005 to 5,249 in 2020. Adjusting for the projected population growth in the state, the General Internist to population ratio was predicted to grow from 46.5 physicians per 100,000 population to 49.1 physicians per 100,000 population. General Pediatrics General Pediatricians were forecast to decline by 4 percent between 2005 and 2020, unlike the overall predicted rate of growth among primary care physicians, with the number of active General Pediatricians predicted to decrease from 1,922 in 2005 to 1,846 in 2020. Adjusting for the projected population growth in the state, the General Pediatrician to population ratio was predicted to decline from 18.8 physicians per 100,000 population to 17.3 physicians per 100,000 population.
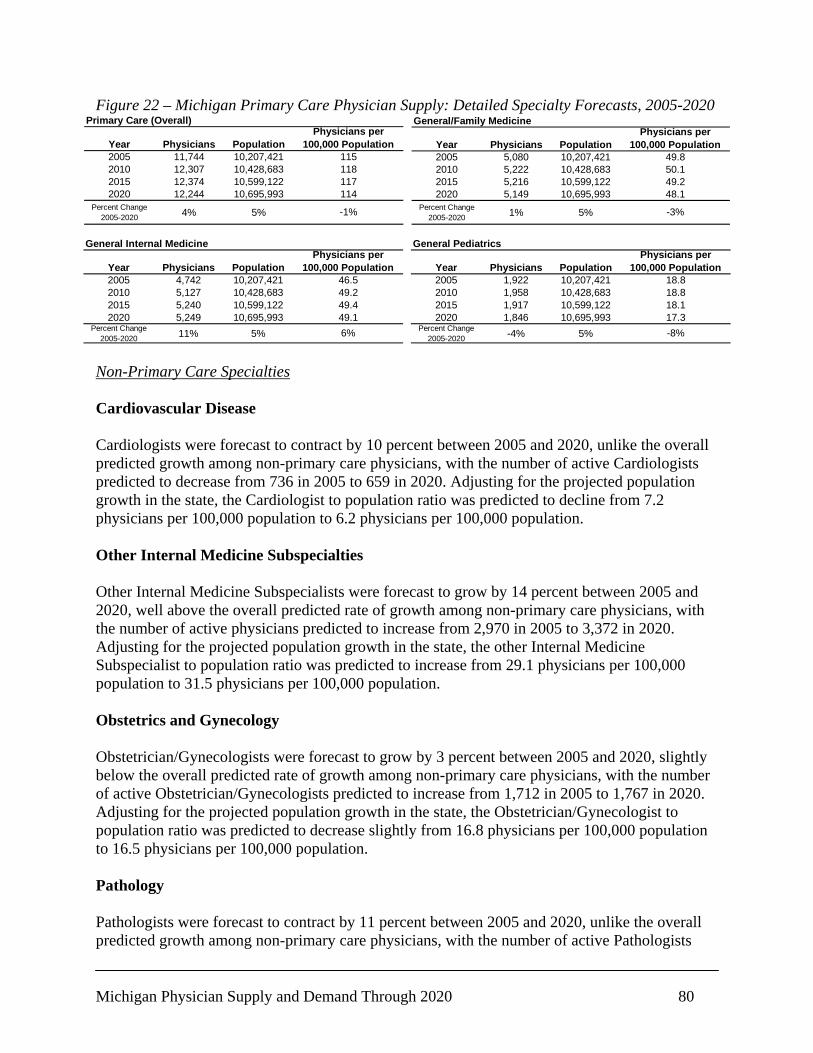
Michigan Physician Supply and Demand Through 2020 80
Figure 22 – Michigan Primary Care Physician Supply: Detailed Specialty Forecasts, 2005-2020 Primary Care (Overall)
Year Physicians Population2005 11,744 10,207,4212010 12,307 10,428,6832015 12,374 10,599,1222020 12,244 10,695,993
Percent Change 2005-2020 4% 5% -1%
Physicians per 100,000 Population
115118117114
General/Family Medicine
Year Physicians Population2005 5,080 10,207,4212010 5,222 10,428,6832015 5,216 10,599,1222020 5,149 10,695,993
Percent Change 2005-2020 1% 5%
48.1
-3%
Physicians per 100,000 Population
49.850.149.2
General Internal Medicine
Year Physicians Population2005 4,742 10,207,4212010 5,127 10,428,6832015 5,240 10,599,1222020 5,249 10,695,993
Percent Change 2005-2020 11% 5%
46.549.249.449.16%
Physicians per 100,000 Population
General Pediatrics
Year Physicians Population2005 1,922 10,207,4212010 1,958 10,428,6832015 1,917 10,599,1222020 1,846 10,695,993
Percent Change 2005-2020 -4% 5%
Physicians per 100,000 Population
18.818.818.117.3-8%
Non-Primary Care Specialties Cardiovascular Disease Cardiologists were forecast to contract by 10 percent between 2005 and 2020, unlike the overall predicted growth among non-primary care physicians, with the number of active Cardiologists predicted to decrease from 736 in 2005 to 659 in 2020. Adjusting for the projected population growth in the state, the Cardiologist to population ratio was predicted to decline from 7.2 physicians per 100,000 population to 6.2 physicians per 100,000 population. Other Internal Medicine Subspecialties Other Internal Medicine Subspecialists were forecast to grow by 14 percent between 2005 and 2020, well above the overall predicted rate of growth among non-primary care physicians, with the number of active physicians predicted to increase from 2,970 in 2005 to 3,372 in 2020. Adjusting for the projected population growth in the state, the other Internal Medicine Subspecialist to population ratio was predicted to increase from 29.1 physicians per 100,000 population to 31.5 physicians per 100,000 population. Obstetrics and Gynecology Obstetrician/Gynecologists were forecast to grow by 3 percent between 2005 and 2020, slightly below the overall predicted rate of growth among non-primary care physicians, with the number of active Obstetrician/Gynecologists predicted to increase from 1,712 in 2005 to 1,767 in 2020. Adjusting for the projected population growth in the state, the Obstetrician/Gynecologist to population ratio was predicted to decrease slightly from 16.8 physicians per 100,000 population to 16.5 physicians per 100,000 population. Pathology Pathologists were forecast to contract by 11 percent between 2005 and 2020, unlike the overall predicted growth among non-primary care physicians, with the number of active Pathologists
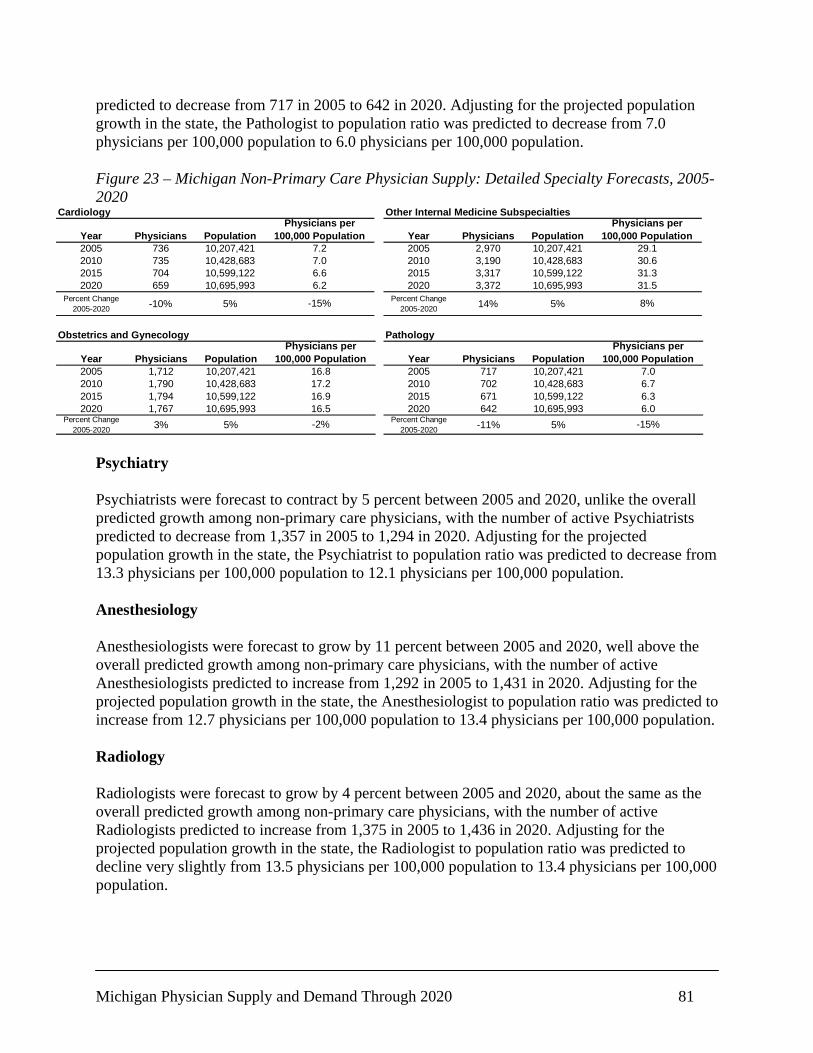
Michigan Physician Supply and Demand Through 2020 81
predicted to decrease from 717 in 2005 to 642 in 2020. Adjusting for the projected population growth in the state, the Pathologist to population ratio was predicted to decrease from 7.0 physicians per 100,000 population to 6.0 physicians per 100,000 population. Figure 23 – Michigan Non-Primary Care Physician Supply: Detailed Specialty Forecasts, 2005-2020
Cardiology
Year Physicians Population2005 736 10,207,4212010 735 10,428,6832015 704 10,599,1222020 659 10,695,993
Percent Change 2005-2020 -10% 5% -15%
Physicians per 100,000 Population
7.27.06.66.2
Other Internal Medicine Subspecialties
Year Physicians Population2005 2,970 10,207,4212010 3,190 10,428,6832015 3,317 10,599,1222020 3,372 10,695,993
Percent Change 2005-2020 14% 5%
31.5
8%
Physicians per 100,000 Population
29.130.631.3
Obstetrics and Gynecology
Year Physicians Population2005 1,712 10,207,4212010 1,790 10,428,6832015 1,794 10,599,1222020 1,767 10,695,993
Percent Change 2005-2020 3% 5%
16.916.5-2%
Physicians per 100,000 Population
16.817.2
Pathology
Year Physicians Population2005 717 10,207,4212010 702 10,428,6832015 671 10,599,1222020 642 10,695,993
Percent Change 2005-2020 -11% 5%
Physicians per 100,000 Population
7.06.76.36.0
-15% Psychiatry Psychiatrists were forecast to contract by 5 percent between 2005 and 2020, unlike the overall predicted growth among non-primary care physicians, with the number of active Psychiatrists predicted to decrease from 1,357 in 2005 to 1,294 in 2020. Adjusting for the projected population growth in the state, the Psychiatrist to population ratio was predicted to decrease from 13.3 physicians per 100,000 population to 12.1 physicians per 100,000 population. Anesthesiology Anesthesiologists were forecast to grow by 11 percent between 2005 and 2020, well above the overall predicted growth among non-primary care physicians, with the number of active Anesthesiologists predicted to increase from 1,292 in 2005 to 1,431 in 2020. Adjusting for the projected population growth in the state, the Anesthesiologist to population ratio was predicted to increase from 12.7 physicians per 100,000 population to 13.4 physicians per 100,000 population. Radiology Radiologists were forecast to grow by 4 percent between 2005 and 2020, about the same as the overall predicted growth among non-primary care physicians, with the number of active Radiologists predicted to increase from 1,375 in 2005 to 1,436 in 2020. Adjusting for the projected population growth in the state, the Radiologist to population ratio was predicted to decline very slightly from 13.5 physicians per 100,000 population to 13.4 physicians per 100,000 population.
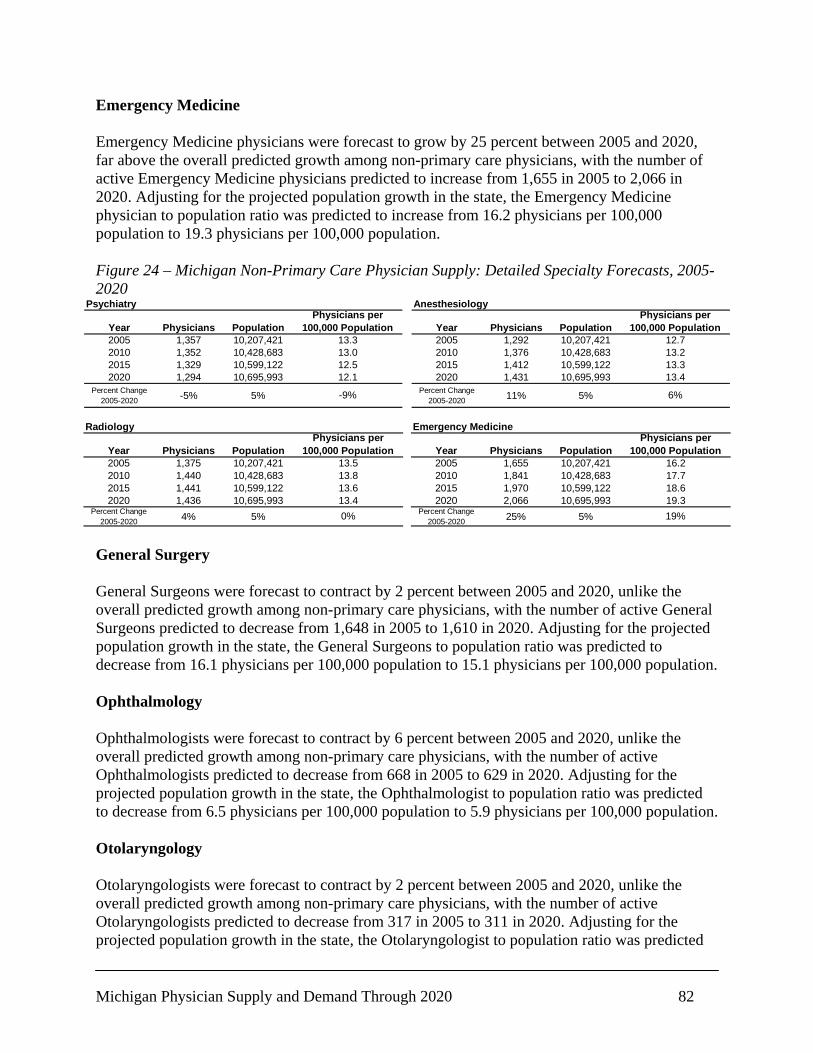
Michigan Physician Supply and Demand Through 2020 82
Emergency Medicine Emergency Medicine physicians were forecast to grow by 25 percent between 2005 and 2020, far above the overall predicted growth among non-primary care physicians, with the number of active Emergency Medicine physicians predicted to increase from 1,655 in 2005 to 2,066 in 2020. Adjusting for the projected population growth in the state, the Emergency Medicine physician to population ratio was predicted to increase from 16.2 physicians per 100,000 population to 19.3 physicians per 100,000 population. Figure 24 – Michigan Non-Primary Care Physician Supply: Detailed Specialty Forecasts, 2005-2020
Psychiatry
Year Physicians Population2005 1,357 10,207,4212010 1,352 10,428,6832015 1,329 10,599,1222020 1,294 10,695,993
Percent Change 2005-2020 -5% 5% -9%
Physicians per 100,000 Population
13.313.012.512.1
Anesthesiology
Year Physicians Population2005 1,292 10,207,4212010 1,376 10,428,6832015 1,412 10,599,1222020 1,431 10,695,993
Percent Change 2005-2020 11% 5%
13.4
6%
Physicians per 100,000 Population
12.713.213.3
Radiology
Year Physicians Population2005 1,375 10,207,4212010 1,440 10,428,6832015 1,441 10,599,1222020 1,436 10,695,993
Percent Change 2005-2020 4% 5%
13.513.813.613.40%
Physicians per 100,000 Population
Emergency Medicine
Year Physicians Population2005 1,655 10,207,4212010 1,841 10,428,6832015 1,970 10,599,1222020 2,066 10,695,993
Percent Change 2005-2020 25% 5%
Physicians per 100,000 Population
16.217.718.619.319%
General Surgery General Surgeons were forecast to contract by 2 percent between 2005 and 2020, unlike the overall predicted growth among non-primary care physicians, with the number of active General Surgeons predicted to decrease from 1,648 in 2005 to 1,610 in 2020. Adjusting for the projected population growth in the state, the General Surgeons to population ratio was predicted to decrease from 16.1 physicians per 100,000 population to 15.1 physicians per 100,000 population. Ophthalmology Ophthalmologists were forecast to contract by 6 percent between 2005 and 2020, unlike the overall predicted growth among non-primary care physicians, with the number of active Ophthalmologists predicted to decrease from 668 in 2005 to 629 in 2020. Adjusting for the projected population growth in the state, the Ophthalmologist to population ratio was predicted to decrease from 6.5 physicians per 100,000 population to 5.9 physicians per 100,000 population. Otolaryngology Otolaryngologists were forecast to contract by 2 percent between 2005 and 2020, unlike the overall predicted growth among non-primary care physicians, with the number of active Otolaryngologists predicted to decrease from 317 in 2005 to 311 in 2020. Adjusting for the projected population growth in the state, the Otolaryngologist to population ratio was predicted

Michigan Physician Supply and Demand Through 2020 83
to decrease slightly from 3.1 physicians per 100,000 population to 2.9 physicians per 100,000 population. Orthopedic Surgery Orthopedic Surgeons were forecast to contract by 2 percent between 2005 and 2020, unlike the overall predicted growth among non-primary care physicians, with the number of active Orthopedic Surgeons predicted to decrease from 844 in 2005 to 829 in 2020. Adjusting for the projected population growth in the state, the Orthopedic Surgeon to population ratio was predicted to decrease from 8.3 physicians per 100,000 population to 7.7 physicians per 100,000 population. Figure 25 – Michigan Non-Primary Care Physician Supply: Detailed Specialty Forecasts, 2005-2020
General Surgery
Year Physicians Population2005 1,648 10,207,4212010 1,681 10,428,6832015 1,644 10,599,1222020 1,610 10,695,993
Percent Change 2005-2020 -2% 5% -7%
Physicians per 100,000 Population
16.116.115.515.1
Ophthalmology
Year Physicians Population2005 668 10,207,4212010 671 10,428,6832015 646 10,599,1222020 629 10,695,993
Percent Change 2005-2020 -6% 5%
5.9
-10%
Physicians per 100,000 Population
6.56.46.1
Otolaryngology
Year Physicians Population2005 317 10,207,4212010 320 10,428,6832015 316 10,599,1222020 311 10,695,993
Percent Change 2005-2020 -2% 5%
3.02.9-6%
Physicians per 100,000 Population
3.13.1
Orthopedic Surgery
Year Physicians Population2005 844 10,207,4212010 857 10,428,6832015 845 10,599,1222020 829 10,695,993
Percent Change 2005-2020 -2% 5%
Physicians per 100,000 Population
8.38.28.07.7-6%
Urology Urologists were forecast to remain essentially unchanged between 2005 and 2020, unlike the overall predicted growth among non-primary care physicians, with the number of active Urologists predicted to increase from 375 in 2005 to 374 in 2020. Adjusting for the projected population growth in the state, the Urologist to population ratio was predicted to decline slightly from 3.7 physicians per 100,000 population to 3.5 physicians per 100,000 population. Other Surgery Subspecialties Other Surgical Subspecialists were forecast to contract by 2 percent between 2005 and 2020, unlike the overall predicted growth among non-primary care physicians, with the number of active physicians predicted to increase from 568 in 2005 to 556 in 2020. Adjusting for the projected population growth in the state, the other Surgical Subspecialist to population ratio was predicted to decrease slightly from 5.6 physicians per 100,000 population to 5.2 physicians per 100,000 population.

Michigan Physician Supply and Demand Through 2020 84
Figure 26 – Michigan Non-Primary Care Physician Supply: Detailed Specialty Forecasts, 2005-2020
Urology
Year Physicians Population2005 375 10,207,4212010 388 10,428,6832015 384 10,599,1222020 374 10,695,993
Percent Change 2005-2020 0% 5% -5%
Physicians per 100,000 Population
3.73.73.63.5
Other Surgical Subspecialties
Year Physicians Population2005 568 10,207,4212010 581 10,428,6832015 570 10,599,1222020 556 10,695,993
Percent Change 2005-2020 -2% 5%
5.2
-7%
Physicians per 100,000 Population
5.65.65.4
State Level Supply Scenario 3: 10 percent Increase in Physician Productivity In this scenario, the supply model forecast a 21 percent increase in the supply of physicians between 2005 and 2020, with the number of active physicians predicted to increase from 30,366 in 2005 to 36,809 in 2020. Adjusting for the projected population growth in the state (5 percent), the physician to population ratio was predicted to grow from 297 physicians per 100,000 population to 344 physicians per 100,000 population. Figure 27– Michigan Physician Supply Forecast, 2005-2020
Year Physicians Population2005 30,366 10,207,4212010 31,756 10,428,6832015 34,455 10,599,1222020 36,809 10,695,993
Percent Change 2005-2020 21% 5% 16%
Physicians per 100,000 Population
297305325344
Primary care physicians were forecast to grow by 21 percent between 2005 and 2020, with the number of active physicians predicted to increase from 11,744 in 2005 to 14,178 in 2020. Adjusting for the projected population growth in the state, the physician to population ratio was predicted to increase from 115 physicians per 100,000 population to 133 physicians per 100,000 population. Non-primary care physicians were also forecast to grow by 22 percent between 2005 and 2020, with the number of active physicians predicted to increase from 18,622 in 2005 to 22,631 in 2020. Adjusting for the projected population growth in the state, the physician to population ratio was predicted to grow from 182 physicians per 100,000 population to 212 physicians per 100,000 population. Figure 28 – Michigan Primary Care and Non-Primary Care Physician Supply Forecast, 2005-2020
Primary Care
Year Physicians Population2005 11,744 10,207,4212010 12,307 10,428,6832015 13,325 10,599,1222020 14,178 10,695,993
Percent Change 2005-2020 21% 5% 15%
Physicians per 100,000 Population
115118126133
Non-Primary Care
Year Physicians Population2005 18,622 10,207,4212010 19,449 10,428,6832015 21,130 10,599,1222020 22,631 10,695,993
Percent Change 2005-2020 22% 5%
212
16%
Physicians per 100,000 Population
182186199
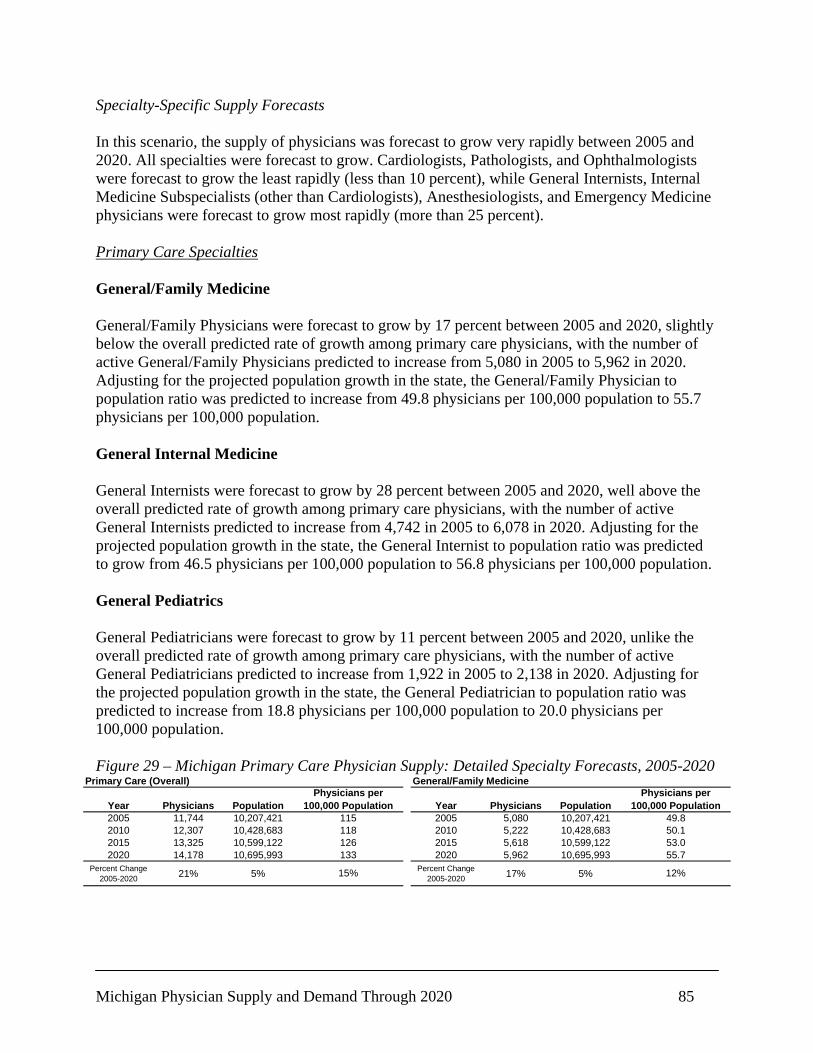
Michigan Physician Supply and Demand Through 2020 85
Specialty-Specific Supply Forecasts In this scenario, the supply of physicians was forecast to grow very rapidly between 2005 and 2020. All specialties were forecast to grow. Cardiologists, Pathologists, and Ophthalmologists were forecast to grow the least rapidly (less than 10 percent), while General Internists, Internal Medicine Subspecialists (other than Cardiologists), Anesthesiologists, and Emergency Medicine physicians were forecast to grow most rapidly (more than 25 percent). Primary Care Specialties General/Family Medicine General/Family Physicians were forecast to grow by 17 percent between 2005 and 2020, slightly below the overall predicted rate of growth among primary care physicians, with the number of active General/Family Physicians predicted to increase from 5,080 in 2005 to 5,962 in 2020. Adjusting for the projected population growth in the state, the General/Family Physician to population ratio was predicted to increase from 49.8 physicians per 100,000 population to 55.7 physicians per 100,000 population. General Internal Medicine General Internists were forecast to grow by 28 percent between 2005 and 2020, well above the overall predicted rate of growth among primary care physicians, with the number of active General Internists predicted to increase from 4,742 in 2005 to 6,078 in 2020. Adjusting for the projected population growth in the state, the General Internist to population ratio was predicted to grow from 46.5 physicians per 100,000 population to 56.8 physicians per 100,000 population. General Pediatrics General Pediatricians were forecast to grow by 11 percent between 2005 and 2020, unlike the overall predicted rate of growth among primary care physicians, with the number of active General Pediatricians predicted to increase from 1,922 in 2005 to 2,138 in 2020. Adjusting for the projected population growth in the state, the General Pediatrician to population ratio was predicted to increase from 18.8 physicians per 100,000 population to 20.0 physicians per 100,000 population. Figure 29 – Michigan Primary Care Physician Supply: Detailed Specialty Forecasts, 2005-2020
Primary Care (Overall)
Year Physicians Population2005 11,744 10,207,4212010 12,307 10,428,6832015 13,325 10,599,1222020 14,178 10,695,993
Percent Change 2005-2020 21% 5% 15%
Physicians per 100,000 Population
115118126133
General/Family Medicine
Year Physicians Population2005 5,080 10,207,4212010 5,222 10,428,6832015 5,618 10,599,1222020 5,962 10,695,993
Percent Change 2005-2020 17% 5%
55.7
12%
Physicians per 100,000 Population
49.850.153.0
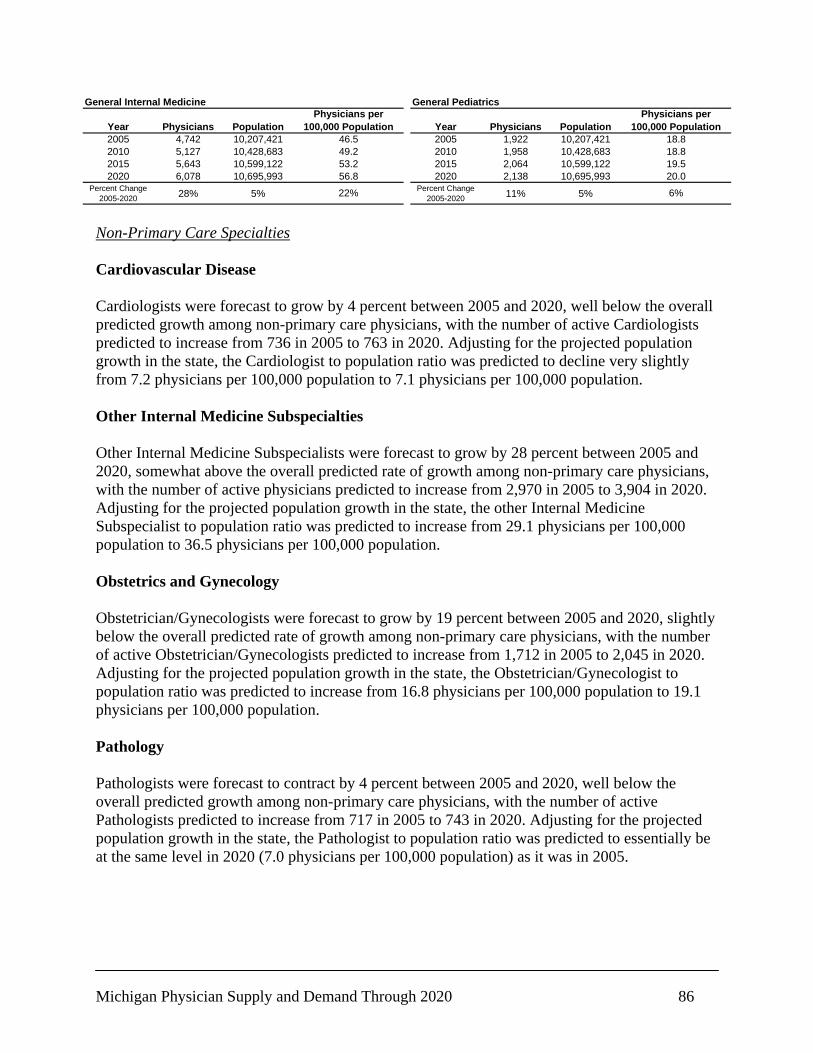
Michigan Physician Supply and Demand Through 2020 86
General Internal Medicine
Year Physicians Population2005 4,742 10,207,4212010 5,127 10,428,6832015 5,643 10,599,1222020 6,078 10,695,993
Percent Change 2005-2020 28% 5%
46.549.253.256.8
22%
Physicians per 100,000 Population
General Pediatrics
Year Physicians Population2005 1,922 10,207,4212010 1,958 10,428,6832015 2,064 10,599,1222020 2,138 10,695,993
Percent Change 2005-2020 11% 5%
Physicians per 100,000 Population
18.818.819.520.0
6% Non-Primary Care Specialties Cardiovascular Disease Cardiologists were forecast to grow by 4 percent between 2005 and 2020, well below the overall predicted growth among non-primary care physicians, with the number of active Cardiologists predicted to increase from 736 in 2005 to 763 in 2020. Adjusting for the projected population growth in the state, the Cardiologist to population ratio was predicted to decline very slightly from 7.2 physicians per 100,000 population to 7.1 physicians per 100,000 population. Other Internal Medicine Subspecialties Other Internal Medicine Subspecialists were forecast to grow by 28 percent between 2005 and 2020, somewhat above the overall predicted rate of growth among non-primary care physicians, with the number of active physicians predicted to increase from 2,970 in 2005 to 3,904 in 2020. Adjusting for the projected population growth in the state, the other Internal Medicine Subspecialist to population ratio was predicted to increase from 29.1 physicians per 100,000 population to 36.5 physicians per 100,000 population. Obstetrics and Gynecology Obstetrician/Gynecologists were forecast to grow by 19 percent between 2005 and 2020, slightly below the overall predicted rate of growth among non-primary care physicians, with the number of active Obstetrician/Gynecologists predicted to increase from 1,712 in 2005 to 2,045 in 2020. Adjusting for the projected population growth in the state, the Obstetrician/Gynecologist to population ratio was predicted to increase from 16.8 physicians per 100,000 population to 19.1 physicians per 100,000 population. Pathology Pathologists were forecast to contract by 4 percent between 2005 and 2020, well below the overall predicted growth among non-primary care physicians, with the number of active Pathologists predicted to increase from 717 in 2005 to 743 in 2020. Adjusting for the projected population growth in the state, the Pathologist to population ratio was predicted to essentially be at the same level in 2020 (7.0 physicians per 100,000 population) as it was in 2005.
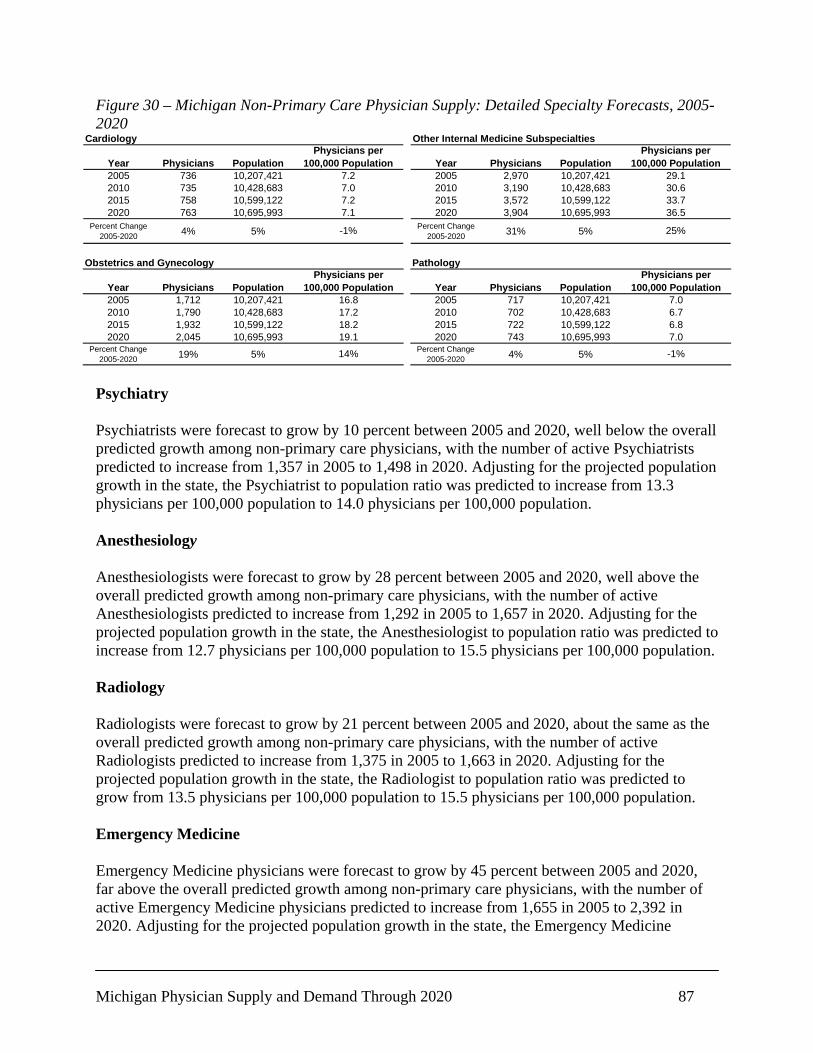
Michigan Physician Supply and Demand Through 2020 87
Figure 30 – Michigan Non-Primary Care Physician Supply: Detailed Specialty Forecasts, 2005-2020
Cardiology
Year Physicians Population2005 736 10,207,4212010 735 10,428,6832015 758 10,599,1222020 763 10,695,993
Percent Change 2005-2020 4% 5% -1%
Physicians per 100,000 Population
7.27.07.27.1
Other Internal Medicine Subspecialties
Year Physicians Population2005 2,970 10,207,4212010 3,190 10,428,6832015 3,572 10,599,1222020 3,904 10,695,993
Percent Change 2005-2020 31% 5%
36.5
25%
Physicians per 100,000 Population
29.130.633.7
Obstetrics and Gynecology
Year Physicians Population2005 1,712 10,207,4212010 1,790 10,428,6832015 1,932 10,599,1222020 2,045 10,695,993
Percent Change 2005-2020 19% 5%
18.219.1
14%
Physicians per 100,000 Population
16.817.2
Pathology
Year Physicians Population2005 717 10,207,4212010 702 10,428,6832015 722 10,599,1222020 743 10,695,993
Percent Change 2005-2020 4% 5%
Physicians per 100,000 Population
7.06.76.87.0
-1% Psychiatry Psychiatrists were forecast to grow by 10 percent between 2005 and 2020, well below the overall predicted growth among non-primary care physicians, with the number of active Psychiatrists predicted to increase from 1,357 in 2005 to 1,498 in 2020. Adjusting for the projected population growth in the state, the Psychiatrist to population ratio was predicted to increase from 13.3 physicians per 100,000 population to 14.0 physicians per 100,000 population. Anesthesiology Anesthesiologists were forecast to grow by 28 percent between 2005 and 2020, well above the overall predicted growth among non-primary care physicians, with the number of active Anesthesiologists predicted to increase from 1,292 in 2005 to 1,657 in 2020. Adjusting for the projected population growth in the state, the Anesthesiologist to population ratio was predicted to increase from 12.7 physicians per 100,000 population to 15.5 physicians per 100,000 population. Radiology Radiologists were forecast to grow by 21 percent between 2005 and 2020, about the same as the overall predicted growth among non-primary care physicians, with the number of active Radiologists predicted to increase from 1,375 in 2005 to 1,663 in 2020. Adjusting for the projected population growth in the state, the Radiologist to population ratio was predicted to grow from 13.5 physicians per 100,000 population to 15.5 physicians per 100,000 population. Emergency Medicine Emergency Medicine physicians were forecast to grow by 45 percent between 2005 and 2020, far above the overall predicted growth among non-primary care physicians, with the number of active Emergency Medicine physicians predicted to increase from 1,655 in 2005 to 2,392 in 2020. Adjusting for the projected population growth in the state, the Emergency Medicine
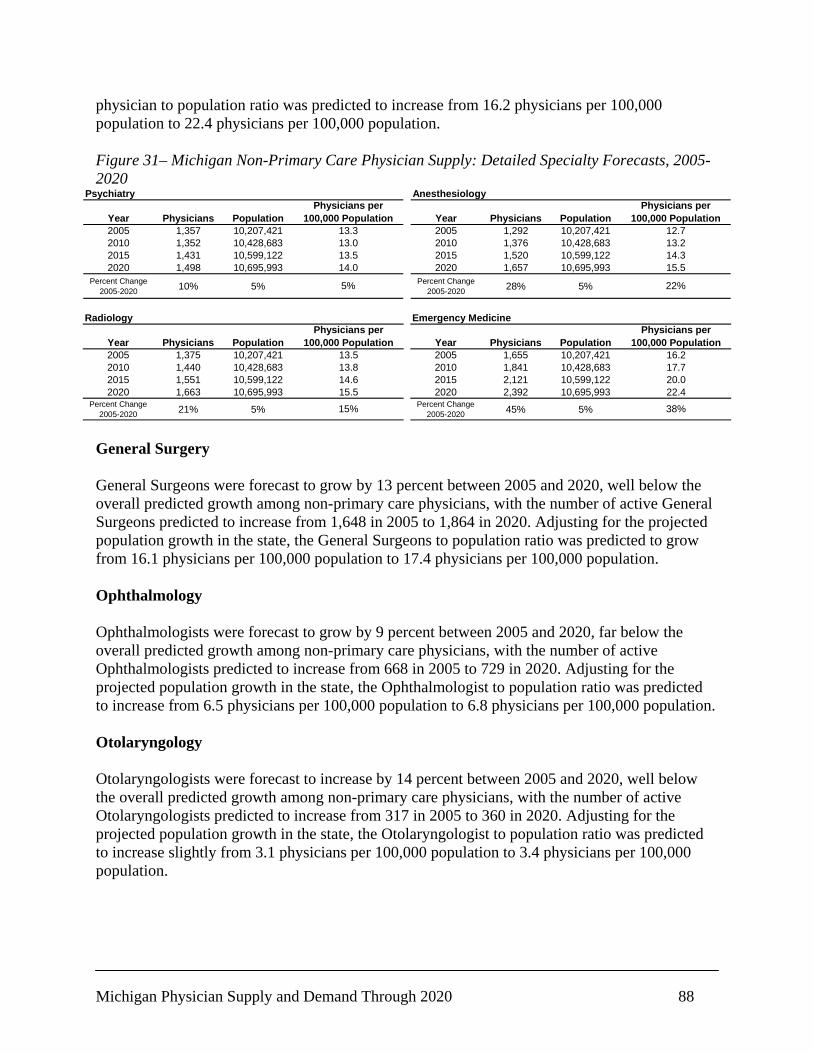
Michigan Physician Supply and Demand Through 2020 88
physician to population ratio was predicted to increase from 16.2 physicians per 100,000 population to 22.4 physicians per 100,000 population. Figure 31– Michigan Non-Primary Care Physician Supply: Detailed Specialty Forecasts, 2005-2020
Psychiatry
Year Physicians Population2005 1,357 10,207,4212010 1,352 10,428,6832015 1,431 10,599,1222020 1,498 10,695,993
Percent Change 2005-2020 10% 5% 5%
Physicians per 100,000 Population
13.313.013.514.0
Anesthesiology
Year Physicians Population2005 1,292 10,207,4212010 1,376 10,428,6832015 1,520 10,599,1222020 1,657 10,695,993
Percent Change 2005-2020 28% 5%
15.5
22%
Physicians per 100,000 Population
12.713.214.3
Radiology
Year Physicians Population2005 1,375 10,207,4212010 1,440 10,428,6832015 1,551 10,599,1222020 1,663 10,695,993
Percent Change 2005-2020 21% 5%
13.513.814.615.5
15%
Physicians per 100,000 Population
Emergency Medicine
Year Physicians Population2005 1,655 10,207,4212010 1,841 10,428,6832015 2,121 10,599,1222020 2,392 10,695,993
Percent Change 2005-2020 45% 5%
Physicians per 100,000 Population
16.217.720.022.4
38% General Surgery General Surgeons were forecast to grow by 13 percent between 2005 and 2020, well below the overall predicted growth among non-primary care physicians, with the number of active General Surgeons predicted to increase from 1,648 in 2005 to 1,864 in 2020. Adjusting for the projected population growth in the state, the General Surgeons to population ratio was predicted to grow from 16.1 physicians per 100,000 population to 17.4 physicians per 100,000 population. Ophthalmology Ophthalmologists were forecast to grow by 9 percent between 2005 and 2020, far below the overall predicted growth among non-primary care physicians, with the number of active Ophthalmologists predicted to increase from 668 in 2005 to 729 in 2020. Adjusting for the projected population growth in the state, the Ophthalmologist to population ratio was predicted to increase from 6.5 physicians per 100,000 population to 6.8 physicians per 100,000 population. Otolaryngology Otolaryngologists were forecast to increase by 14 percent between 2005 and 2020, well below the overall predicted growth among non-primary care physicians, with the number of active Otolaryngologists predicted to increase from 317 in 2005 to 360 in 2020. Adjusting for the projected population growth in the state, the Otolaryngologist to population ratio was predicted to increase slightly from 3.1 physicians per 100,000 population to 3.4 physicians per 100,000 population.
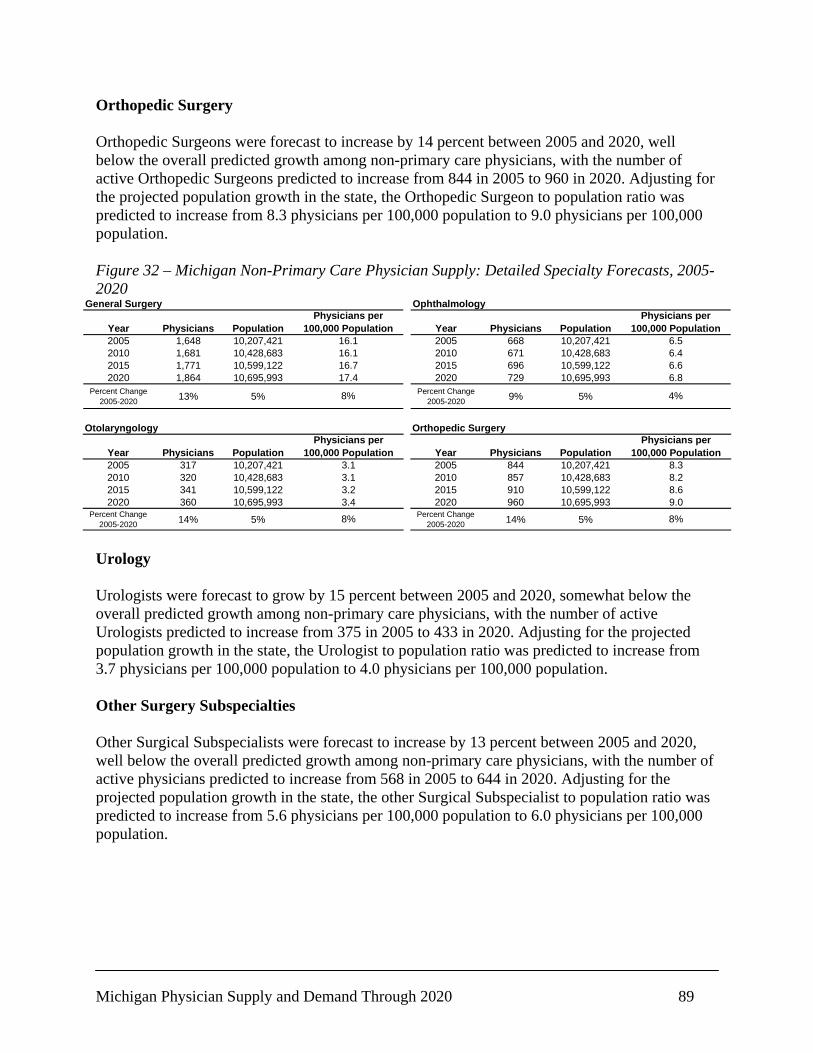
Michigan Physician Supply and Demand Through 2020 89
Orthopedic Surgery Orthopedic Surgeons were forecast to increase by 14 percent between 2005 and 2020, well below the overall predicted growth among non-primary care physicians, with the number of active Orthopedic Surgeons predicted to increase from 844 in 2005 to 960 in 2020. Adjusting for the projected population growth in the state, the Orthopedic Surgeon to population ratio was predicted to increase from 8.3 physicians per 100,000 population to 9.0 physicians per 100,000 population. Figure 32 – Michigan Non-Primary Care Physician Supply: Detailed Specialty Forecasts, 2005-2020
General Surgery
Year Physicians Population2005 1,648 10,207,4212010 1,681 10,428,6832015 1,771 10,599,1222020 1,864 10,695,993
Percent Change 2005-2020 13% 5% 8%
Physicians per 100,000 Population
16.116.116.717.4
Ophthalmology
Year Physicians Population2005 668 10,207,4212010 671 10,428,6832015 696 10,599,1222020 729 10,695,993
Percent Change 2005-2020 9% 5%
6.8
4%
Physicians per 100,000 Population
6.56.46.6
Otolaryngology
Year Physicians Population2005 317 10,207,4212010 320 10,428,6832015 341 10,599,1222020 360 10,695,993
Percent Change 2005-2020 14% 5%
3.23.4
8%
Physicians per 100,000 Population
3.13.1
Orthopedic Surgery
Year Physicians Population2005 844 10,207,4212010 857 10,428,6832015 910 10,599,1222020 960 10,695,993
Percent Change 2005-2020 14% 5%
Physicians per 100,000 Population
8.38.28.69.0
8% Urology Urologists were forecast to grow by 15 percent between 2005 and 2020, somewhat below the overall predicted growth among non-primary care physicians, with the number of active Urologists predicted to increase from 375 in 2005 to 433 in 2020. Adjusting for the projected population growth in the state, the Urologist to population ratio was predicted to increase from 3.7 physicians per 100,000 population to 4.0 physicians per 100,000 population. Other Surgery Subspecialties Other Surgical Subspecialists were forecast to increase by 13 percent between 2005 and 2020, well below the overall predicted growth among non-primary care physicians, with the number of active physicians predicted to increase from 568 in 2005 to 644 in 2020. Adjusting for the projected population growth in the state, the other Surgical Subspecialist to population ratio was predicted to increase from 5.6 physicians per 100,000 population to 6.0 physicians per 100,000 population.
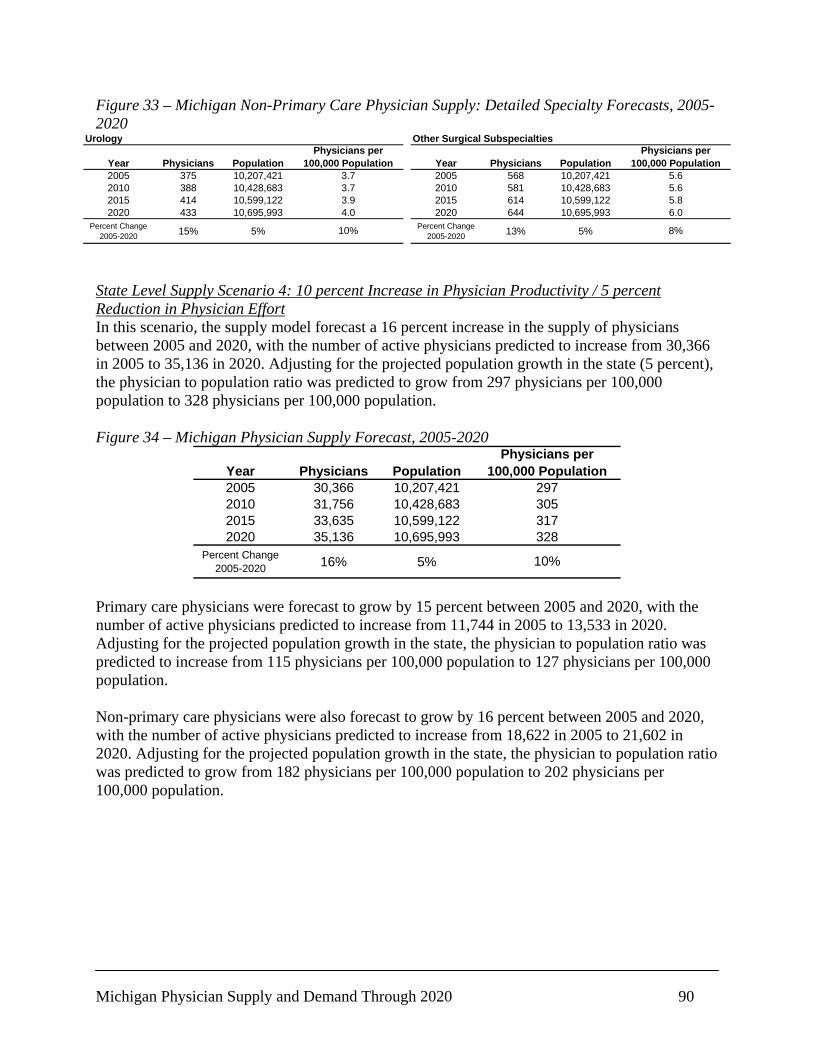
Michigan Physician Supply and Demand Through 2020 90
Figure 33 – Michigan Non-Primary Care Physician Supply: Detailed Specialty Forecasts, 2005-2020
Urology
Year Physicians Population2005 375 10,207,4212010 388 10,428,6832015 414 10,599,1222020 433 10,695,993
Percent Change 2005-2020 15% 5% 10%
Physicians per 100,000 Population
3.73.73.94.0
Other Surgical Subspecialties
Year Physicians Population2005 568 10,207,4212010 581 10,428,6832015 614 10,599,1222020 644 10,695,993
Percent Change 2005-2020 13% 5%
6.0
8%
Physicians per 100,000 Population
5.65.65.8
State Level Supply Scenario 4: 10 percent Increase in Physician Productivity / 5 percent Reduction in Physician Effort In this scenario, the supply model forecast a 16 percent increase in the supply of physicians between 2005 and 2020, with the number of active physicians predicted to increase from 30,366 in 2005 to 35,136 in 2020. Adjusting for the projected population growth in the state (5 percent), the physician to population ratio was predicted to grow from 297 physicians per 100,000 population to 328 physicians per 100,000 population. Figure 34 – Michigan Physician Supply Forecast, 2005-2020
Year Physicians Population2005 30,366 10,207,4212010 31,756 10,428,6832015 33,635 10,599,1222020 35,136 10,695,993
Percent Change 2005-2020 16% 5% 10%
Physicians per 100,000 Population
297305317328
Primary care physicians were forecast to grow by 15 percent between 2005 and 2020, with the number of active physicians predicted to increase from 11,744 in 2005 to 13,533 in 2020. Adjusting for the projected population growth in the state, the physician to population ratio was predicted to increase from 115 physicians per 100,000 population to 127 physicians per 100,000 population. Non-primary care physicians were also forecast to grow by 16 percent between 2005 and 2020, with the number of active physicians predicted to increase from 18,622 in 2005 to 21,602 in 2020. Adjusting for the projected population growth in the state, the physician to population ratio was predicted to grow from 182 physicians per 100,000 population to 202 physicians per 100,000 population.
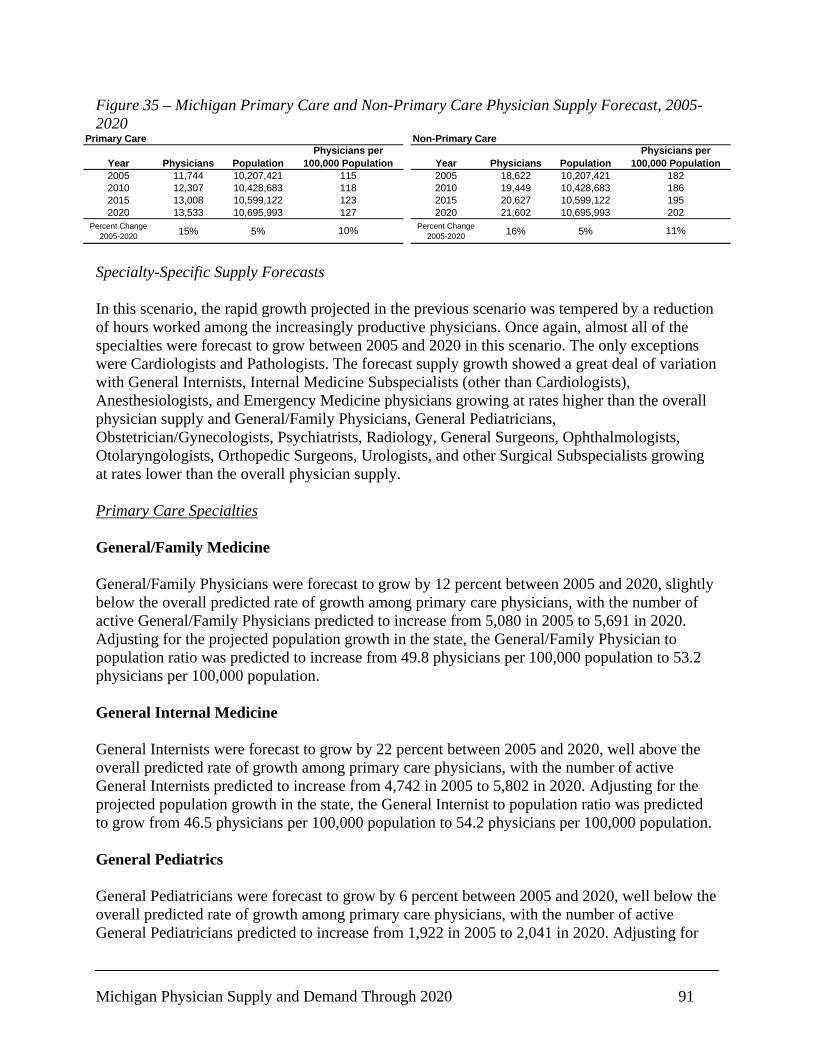
Michigan Physician Supply and Demand Through 2020 91
Figure 35 – Michigan Primary Care and Non-Primary Care Physician Supply Forecast, 2005-2020
Primary Care
Year Physicians Population2005 11,744 10,207,4212010 12,307 10,428,6832015 13,008 10,599,1222020 13,533 10,695,993
Percent Change 2005-2020 15% 5% 10%
Physicians per 100,000 Population
115118123127
Non-Primary Care
Year Physicians Population2005 18,622 10,207,4212010 19,449 10,428,6832015 20,627 10,599,1222020 21,602 10,695,993
Percent Change 2005-2020 16% 5%
202
11%
Physicians per 100,000 Population
182186195
Specialty-Specific Supply Forecasts In this scenario, the rapid growth projected in the previous scenario was tempered by a reduction of hours worked among the increasingly productive physicians. Once again, almost all of the specialties were forecast to grow between 2005 and 2020 in this scenario. The only exceptions were Cardiologists and Pathologists. The forecast supply growth showed a great deal of variation with General Internists, Internal Medicine Subspecialists (other than Cardiologists), Anesthesiologists, and Emergency Medicine physicians growing at rates higher than the overall physician supply and General/Family Physicians, General Pediatricians, Obstetrician/Gynecologists, Psychiatrists, Radiology, General Surgeons, Ophthalmologists, Otolaryngologists, Orthopedic Surgeons, Urologists, and other Surgical Subspecialists growing at rates lower than the overall physician supply. Primary Care Specialties General/Family Medicine General/Family Physicians were forecast to grow by 12 percent between 2005 and 2020, slightly below the overall predicted rate of growth among primary care physicians, with the number of active General/Family Physicians predicted to increase from 5,080 in 2005 to 5,691 in 2020. Adjusting for the projected population growth in the state, the General/Family Physician to population ratio was predicted to increase from 49.8 physicians per 100,000 population to 53.2 physicians per 100,000 population. General Internal Medicine General Internists were forecast to grow by 22 percent between 2005 and 2020, well above the overall predicted rate of growth among primary care physicians, with the number of active General Internists predicted to increase from 4,742 in 2005 to 5,802 in 2020. Adjusting for the projected population growth in the state, the General Internist to population ratio was predicted to grow from 46.5 physicians per 100,000 population to 54.2 physicians per 100,000 population. General Pediatrics General Pediatricians were forecast to grow by 6 percent between 2005 and 2020, well below the overall predicted rate of growth among primary care physicians, with the number of active General Pediatricians predicted to increase from 1,922 in 2005 to 2,041 in 2020. Adjusting for
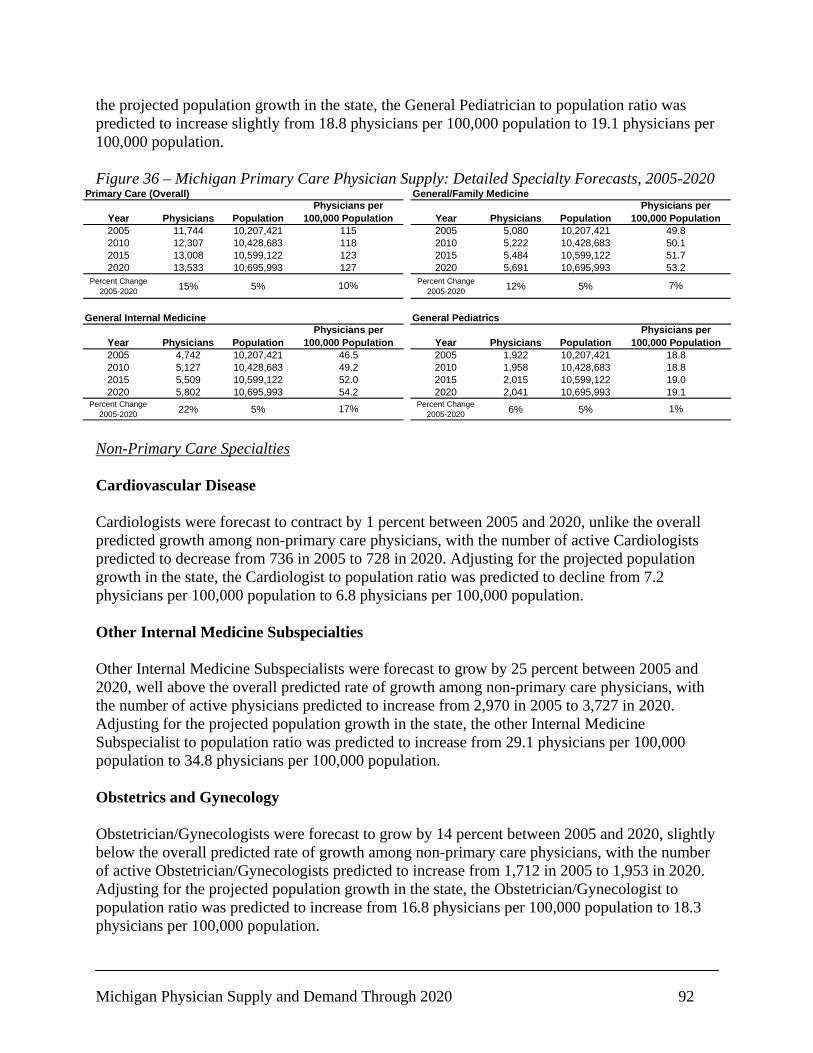
Michigan Physician Supply and Demand Through 2020 92
the projected population growth in the state, the General Pediatrician to population ratio was predicted to increase slightly from 18.8 physicians per 100,000 population to 19.1 physicians per 100,000 population. Figure 36 – Michigan Primary Care Physician Supply: Detailed Specialty Forecasts, 2005-2020
Primary Care (Overall)
Year Physicians Population2005 11,744 10,207,4212010 12,307 10,428,6832015 13,008 10,599,1222020 13,533 10,695,993
Percent Change 2005-2020 15% 5% 10%
Physicians per 100,000 Population
115118123127
General/Family Medicine
Year Physicians Population2005 5,080 10,207,4212010 5,222 10,428,6832015 5,484 10,599,1222020 5,691 10,695,993
Percent Change 2005-2020 12% 5%
53.2
7%
Physicians per 100,000 Population
49.850.151.7
General Internal Medicine
Year Physicians Population2005 4,742 10,207,4212010 5,127 10,428,6832015 5,509 10,599,1222020 5,802 10,695,993
Percent Change 2005-2020 22% 5%
46.549.252.054.2
17%
Physicians per 100,000 Population
General Pediatrics
Year Physicians Population2005 1,922 10,207,4212010 1,958 10,428,6832015 2,015 10,599,1222020 2,041 10,695,993
Percent Change 2005-2020 6% 5%
Physicians per 100,000 Population
18.818.819.019.1
1% Non-Primary Care Specialties Cardiovascular Disease Cardiologists were forecast to contract by 1 percent between 2005 and 2020, unlike the overall predicted growth among non-primary care physicians, with the number of active Cardiologists predicted to decrease from 736 in 2005 to 728 in 2020. Adjusting for the projected population growth in the state, the Cardiologist to population ratio was predicted to decline from 7.2 physicians per 100,000 population to 6.8 physicians per 100,000 population. Other Internal Medicine Subspecialties Other Internal Medicine Subspecialists were forecast to grow by 25 percent between 2005 and 2020, well above the overall predicted rate of growth among non-primary care physicians, with the number of active physicians predicted to increase from 2,970 in 2005 to 3,727 in 2020. Adjusting for the projected population growth in the state, the other Internal Medicine Subspecialist to population ratio was predicted to increase from 29.1 physicians per 100,000 population to 34.8 physicians per 100,000 population. Obstetrics and Gynecology Obstetrician/Gynecologists were forecast to grow by 14 percent between 2005 and 2020, slightly below the overall predicted rate of growth among non-primary care physicians, with the number of active Obstetrician/Gynecologists predicted to increase from 1,712 in 2005 to 1,953 in 2020. Adjusting for the projected population growth in the state, the Obstetrician/Gynecologist to population ratio was predicted to increase from 16.8 physicians per 100,000 population to 18.3 physicians per 100,000 population.
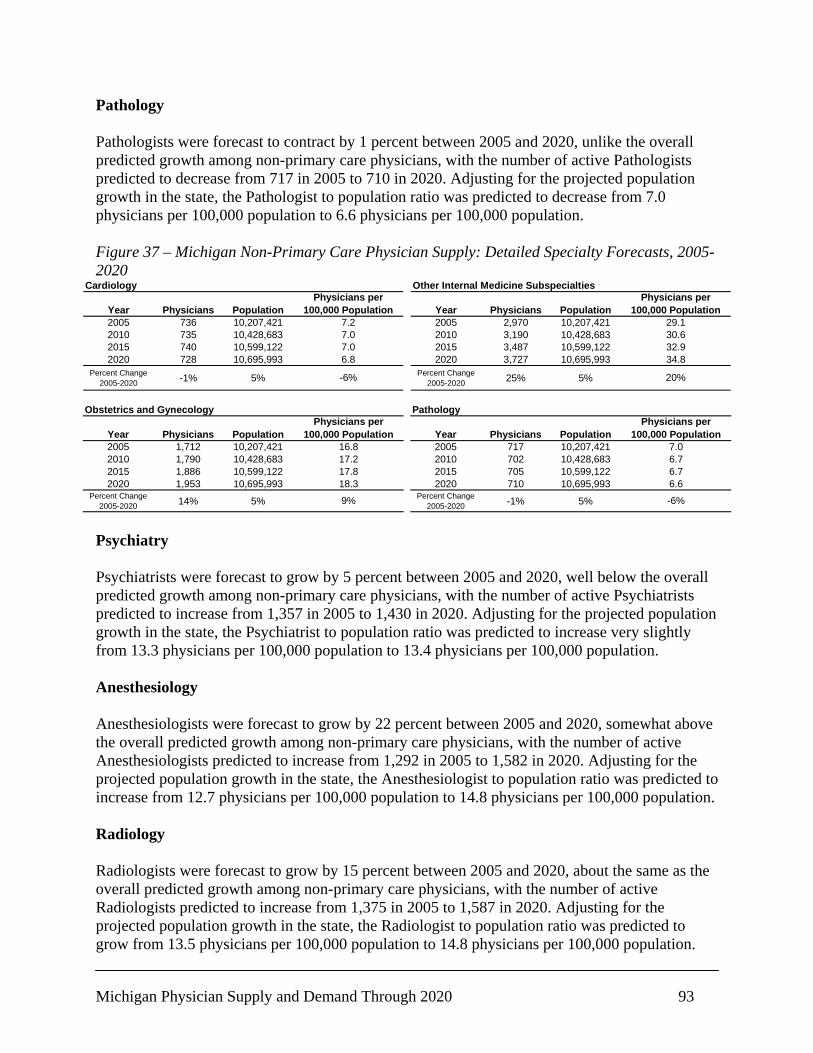
Michigan Physician Supply and Demand Through 2020 93
Pathology Pathologists were forecast to contract by 1 percent between 2005 and 2020, unlike the overall predicted growth among non-primary care physicians, with the number of active Pathologists predicted to decrease from 717 in 2005 to 710 in 2020. Adjusting for the projected population growth in the state, the Pathologist to population ratio was predicted to decrease from 7.0 physicians per 100,000 population to 6.6 physicians per 100,000 population. Figure 37 – Michigan Non-Primary Care Physician Supply: Detailed Specialty Forecasts, 2005-2020
Cardiology
Year Physicians Population2005 736 10,207,4212010 735 10,428,6832015 740 10,599,1222020 728 10,695,993
Percent Change 2005-2020 -1% 5% -6%
Physicians per 100,000 Population
7.27.07.06.8
Other Internal Medicine Subspecialties
Year Physicians Population2005 2,970 10,207,4212010 3,190 10,428,6832015 3,487 10,599,1222020 3,727 10,695,993
Percent Change 2005-2020 25% 5%
34.8
20%
Physicians per 100,000 Population
29.130.632.9
Obstetrics and Gynecology
Year Physicians Population2005 1,712 10,207,4212010 1,790 10,428,6832015 1,886 10,599,1222020 1,953 10,695,993
Percent Change 2005-2020 14% 5%
17.818.3
9%
Physicians per 100,000 Population
16.817.2
Pathology
Year Physicians Population2005 717 10,207,4212010 702 10,428,6832015 705 10,599,1222020 710 10,695,993
Percent Change 2005-2020 -1% 5%
Physicians per 100,000 Population
7.06.76.76.6
-6% Psychiatry Psychiatrists were forecast to grow by 5 percent between 2005 and 2020, well below the overall predicted growth among non-primary care physicians, with the number of active Psychiatrists predicted to increase from 1,357 in 2005 to 1,430 in 2020. Adjusting for the projected population growth in the state, the Psychiatrist to population ratio was predicted to increase very slightly from 13.3 physicians per 100,000 population to 13.4 physicians per 100,000 population. Anesthesiology Anesthesiologists were forecast to grow by 22 percent between 2005 and 2020, somewhat above the overall predicted growth among non-primary care physicians, with the number of active Anesthesiologists predicted to increase from 1,292 in 2005 to 1,582 in 2020. Adjusting for the projected population growth in the state, the Anesthesiologist to population ratio was predicted to increase from 12.7 physicians per 100,000 population to 14.8 physicians per 100,000 population. Radiology Radiologists were forecast to grow by 15 percent between 2005 and 2020, about the same as the overall predicted growth among non-primary care physicians, with the number of active Radiologists predicted to increase from 1,375 in 2005 to 1,587 in 2020. Adjusting for the projected population growth in the state, the Radiologist to population ratio was predicted to grow from 13.5 physicians per 100,000 population to 14.8 physicians per 100,000 population.
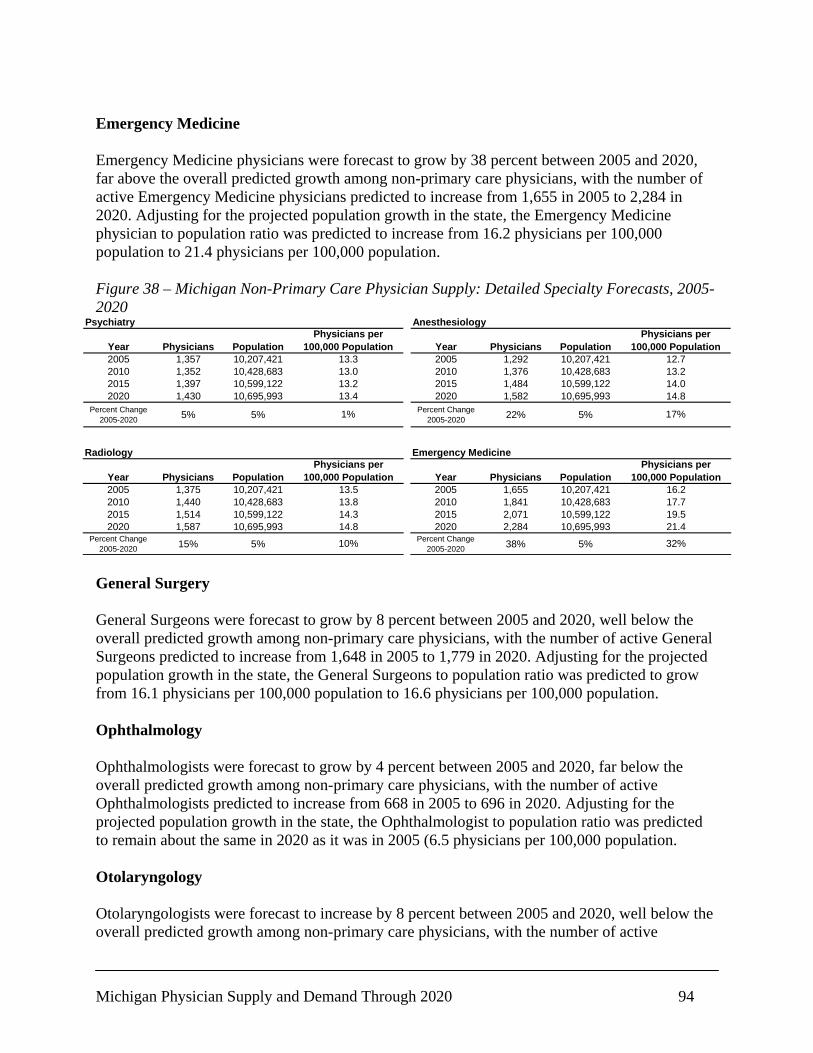
Michigan Physician Supply and Demand Through 2020 94
Emergency Medicine Emergency Medicine physicians were forecast to grow by 38 percent between 2005 and 2020, far above the overall predicted growth among non-primary care physicians, with the number of active Emergency Medicine physicians predicted to increase from 1,655 in 2005 to 2,284 in 2020. Adjusting for the projected population growth in the state, the Emergency Medicine physician to population ratio was predicted to increase from 16.2 physicians per 100,000 population to 21.4 physicians per 100,000 population. Figure 38 – Michigan Non-Primary Care Physician Supply: Detailed Specialty Forecasts, 2005-2020
Psychiatry
Year Physicians Population2005 1,357 10,207,4212010 1,352 10,428,6832015 1,397 10,599,1222020 1,430 10,695,993
Percent Change 2005-2020 5% 5% 1%
Physicians per 100,000 Population
13.313.013.213.4
Anesthesiology
Year Physicians Population2005 1,292 10,207,4212010 1,376 10,428,6832015 1,484 10,599,1222020 1,582 10,695,993
Percent Change 2005-2020 22% 5%
14.8
17%
Physicians per 100,000 Population
12.713.214.0
Radiology
Year Physicians Population2005 1,375 10,207,4212010 1,440 10,428,6832015 1,514 10,599,1222020 1,587 10,695,993
Percent Change 2005-2020 15% 5%
13.513.814.314.8
10%
Physicians per 100,000 Population
Emergency Medicine
Year Physicians Population2005 1,655 10,207,4212010 1,841 10,428,6832015 2,071 10,599,1222020 2,284 10,695,993
Percent Change 2005-2020 38% 5%
Physicians per 100,000 Population
16.217.719.521.4
32% General Surgery General Surgeons were forecast to grow by 8 percent between 2005 and 2020, well below the overall predicted growth among non-primary care physicians, with the number of active General Surgeons predicted to increase from 1,648 in 2005 to 1,779 in 2020. Adjusting for the projected population growth in the state, the General Surgeons to population ratio was predicted to grow from 16.1 physicians per 100,000 population to 16.6 physicians per 100,000 population. Ophthalmology Ophthalmologists were forecast to grow by 4 percent between 2005 and 2020, far below the overall predicted growth among non-primary care physicians, with the number of active Ophthalmologists predicted to increase from 668 in 2005 to 696 in 2020. Adjusting for the projected population growth in the state, the Ophthalmologist to population ratio was predicted to remain about the same in 2020 as it was in 2005 (6.5 physicians per 100,000 population. Otolaryngology Otolaryngologists were forecast to increase by 8 percent between 2005 and 2020, well below the overall predicted growth among non-primary care physicians, with the number of active

Michigan Physician Supply and Demand Through 2020 95
Otolaryngologists predicted to increase from 317 in 2005 to 344 in 2020. Adjusting for the projected population growth in the state, the Otolaryngologist to population ratio was predicted to increase slightly from 3.1 physicians per 100,000 population to 3.2 physicians per 100,000 population. Orthopedic Surgery Orthopedic Surgeons were forecast to increase by 8 percent between 2005 and 2020, well below the overall predicted growth among non-primary care physicians, with the number of active Orthopedic Surgeons predicted to increase from 844 in 2005 to 916 in 2020. Adjusting for the projected population growth in the state, the Orthopedic Surgeon to population ratio was predicted to increase from 8.3 physicians per 100,000 population to 8.6 physicians per 100,000 population. Figure 39 – Michigan Non-Primary Care Physician Supply: Detailed Specialty Forecasts, 2005-2020
General Surgery
Year Physicians Population2005 1,648 10,207,4212010 1,681 10,428,6832015 1,729 10,599,1222020 1,779 10,695,993
Percent Change 2005-2020 8% 5% 3%
Physicians per 100,000 Population
16.116.116.316.6
Ophthalmology
Year Physicians Population2005 668 10,207,4212010 671 10,428,6832015 679 10,599,1222020 696 10,695,993
Percent Change 2005-2020 4% 5%
6.5
-1%
Physicians per 100,000 Population
6.56.46.4
Otolaryngology
Year Physicians Population2005 317 10,207,4212010 320 10,428,6832015 333 10,599,1222020 344 10,695,993
Percent Change 2005-2020 8% 5%
3.13.2
3%
Physicians per 100,000 Population
3.13.1
Orthopedic Surgery
Year Physicians Population2005 844 10,207,4212010 857 10,428,6832015 888 10,599,1222020 916 10,695,993
Percent Change 2005-2020 8% 5%
Physicians per 100,000 Population
8.38.28.48.6
4% Urology Urologists were forecast to grow by 10 percent between 2005 and 2020, somewhat below the overall predicted growth among non-primary care physicians, with the number of active Urologists predicted to increase from 375 in 2005 to 413 in 2020. Adjusting for the projected population growth in the state, the Urologist to population ratio was predicted to increase from 3.7 physicians per 100,000 population to 3.9 physicians per 100,000 population. Other Surgery Subspecialties Other Surgical Subspecialists were forecast to increase by 8 percent between 2005 and 2020, well below the overall predicted growth among non-primary care physicians, with the number of active physicians predicted to increase from 568 in 2005 to 615 in 2020. Adjusting for the projected population growth in the state, the other Surgical Subspecialist to population ratio was predicted to increase from 5.6 physicians per 100,000 population to 5.7 physicians per 100,000 population.
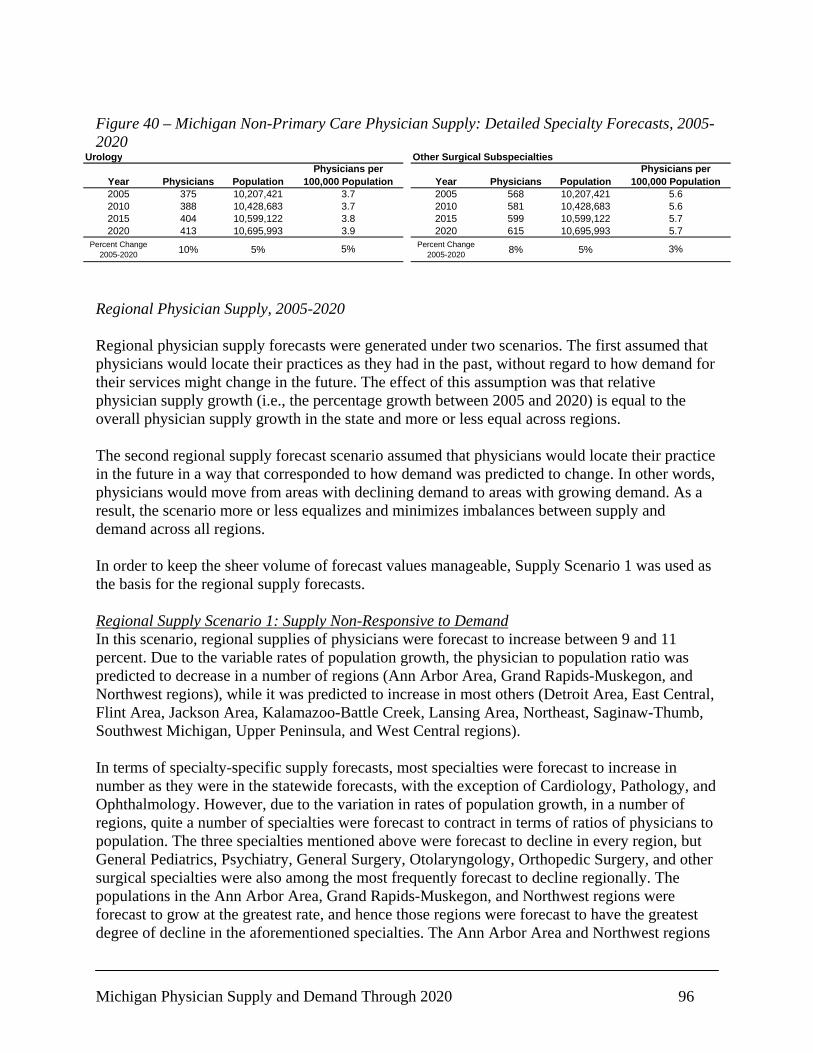
Michigan Physician Supply and Demand Through 2020 96
Figure 40 – Michigan Non-Primary Care Physician Supply: Detailed Specialty Forecasts, 2005-2020
Urology
Year Physicians Population2005 375 10,207,4212010 388 10,428,6832015 404 10,599,1222020 413 10,695,993
Percent Change 2005-2020 10% 5% 5%
Physicians per 100,000 Population
3.73.73.83.9
Other Surgical Subspecialties
Year Physicians Population2005 568 10,207,4212010 581 10,428,6832015 599 10,599,1222020 615 10,695,993
Percent Change 2005-2020 8% 5%
5.7
3%
Physicians per 100,000 Population
5.65.65.7
Regional Physician Supply, 2005-2020 Regional physician supply forecasts were generated under two scenarios. The first assumed that physicians would locate their practices as they had in the past, without regard to how demand for their services might change in the future. The effect of this assumption was that relative physician supply growth (i.e., the percentage growth between 2005 and 2020) is equal to the overall physician supply growth in the state and more or less equal across regions. The second regional supply forecast scenario assumed that physicians would locate their practice in the future in a way that corresponded to how demand was predicted to change. In other words, physicians would move from areas with declining demand to areas with growing demand. As a result, the scenario more or less equalizes and minimizes imbalances between supply and demand across all regions. In order to keep the sheer volume of forecast values manageable, Supply Scenario 1 was used as the basis for the regional supply forecasts. Regional Supply Scenario 1: Supply Non-Responsive to Demand In this scenario, regional supplies of physicians were forecast to increase between 9 and 11 percent. Due to the variable rates of population growth, the physician to population ratio was predicted to decrease in a number of regions (Ann Arbor Area, Grand Rapids-Muskegon, and Northwest regions), while it was predicted to increase in most others (Detroit Area, East Central, Flint Area, Jackson Area, Kalamazoo-Battle Creek, Lansing Area, Northeast, Saginaw-Thumb, Southwest Michigan, Upper Peninsula, and West Central regions). In terms of specialty-specific supply forecasts, most specialties were forecast to increase in number as they were in the statewide forecasts, with the exception of Cardiology, Pathology, and Ophthalmology. However, due to the variation in rates of population growth, in a number of regions, quite a number of specialties were forecast to contract in terms of ratios of physicians to population. The three specialties mentioned above were forecast to decline in every region, but General Pediatrics, Psychiatry, General Surgery, Otolaryngology, Orthopedic Surgery, and other surgical specialties were also among the most frequently forecast to decline regionally. The populations in the Ann Arbor Area, Grand Rapids-Muskegon, and Northwest regions were forecast to grow at the greatest rate, and hence those regions were forecast to have the greatest degree of decline in the aforementioned specialties. The Ann Arbor Area and Northwest regions
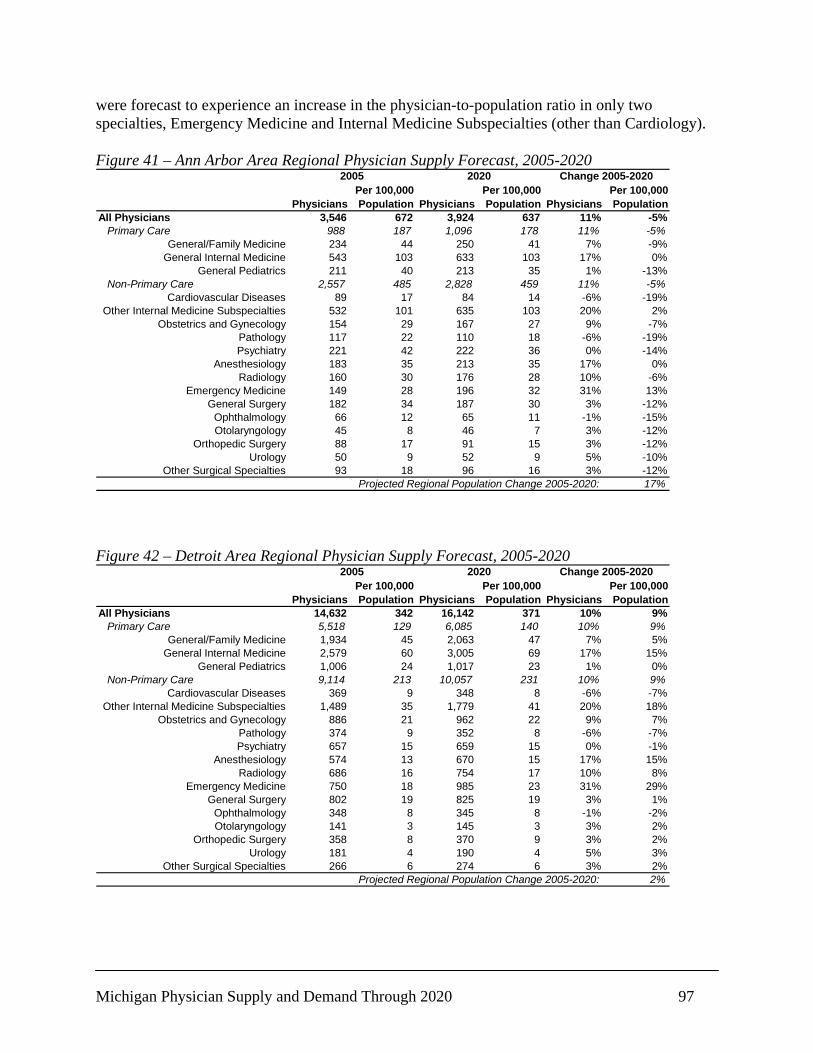
Michigan Physician Supply and Demand Through 2020 97
were forecast to experience an increase in the physician-to-population ratio in only two specialties, Emergency Medicine and Internal Medicine Subspecialties (other than Cardiology). Figure 41 – Ann Arbor Area Regional Physician Supply Forecast, 2005-2020
PhysiciansPer 100,000 Population Physicians
Per 100,000 Population Physicians
Per 100,000 Population
All Physicians 3,546 672 3,924 637 11% -5%Primary Care 988 187 1,096 178 11% -5%
General/Family Medicine 234 44 250 41 7% -9%General Internal Medicine 543 103 633 103 17% 0%
General Pediatrics 211 40 213 35 1% -13%Non-Primary Care 2,557 485 2,828 459 11% -5%
Cardiovascular Diseases 89 17 84 14 -6% -19%Other Internal Medicine Subspecialties 532 101 635 103 20% 2%
Obstetrics and Gynecology 154 29 167 27 9% -7%Pathology 117 22 110 18 -6% -19%Psychiatry 221 42 222 36 0% -14%
Anesthesiology 183 35 213 35 17% 0%Radiology 160 30 176 28 10% -6%
Emergency Medicine 149 28 196 32 31% 13%General Surgery 182 34 187 30 3% -12%
Ophthalmology 66 12 65 11 -1% -15%Otolaryngology 45 8 46 7 3% -12%
Orthopedic Surgery 88 17 91 15 3% -12%Urology 50 9 52 9 5% -10%
Other Surgical Specialties 93 18 96 16 3% -12%17%Projected Regional Population Change 2005-2020:
Change 2005-202020202005
Figure 42 – Detroit Area Regional Physician Supply Forecast, 2005-2020
PhysiciansPer 100,000 Population Physicians
Per 100,000 Population Physicians
Per 100,000 Population
All Physicians 14,632 342 16,142 371 10% 9%Primary Care 5,518 129 6,085 140 10% 9%
General/Family Medicine 1,934 45 2,063 47 7% 5%General Internal Medicine 2,579 60 3,005 69 17% 15%
General Pediatrics 1,006 24 1,017 23 1% 0%Non-Primary Care 9,114 213 10,057 231 10% 9%
Cardiovascular Diseases 369 9 348 8 -6% -7%Other Internal Medicine Subspecialties 1,489 35 1,779 41 20% 18%
Obstetrics and Gynecology 886 21 962 22 9% 7%Pathology 374 9 352 8 -6% -7%Psychiatry 657 15 659 15 0% -1%
Anesthesiology 574 13 670 15 17% 15%Radiology 686 16 754 17 10% 8%
Emergency Medicine 750 18 985 23 31% 29%General Surgery 802 19 825 19 3% 1%
Ophthalmology 348 8 345 8 -1% -2%Otolaryngology 141 3 145 3 3% 2%
Orthopedic Surgery 358 8 370 9 3% 2%Urology 181 4 190 4 5% 3%
Other Surgical Specialties 266 6 274 6 3% 2%2%Projected Regional Population Change 2005-2020:
Change 2005-202020202005
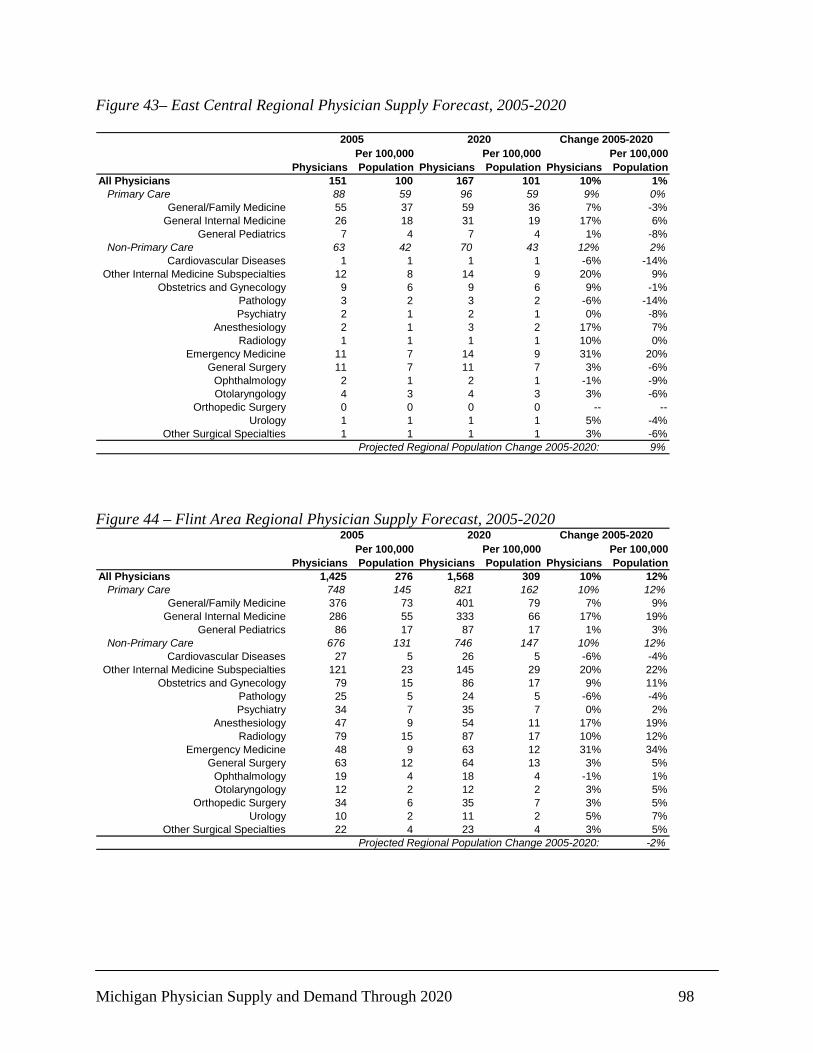
Michigan Physician Supply and Demand Through 2020 98
Figure 43– East Central Regional Physician Supply Forecast, 2005-2020
PhysiciansPer 100,000 Population Physicians
Per 100,000 Population Physicians
Per 100,000 Population
All Physicians 151 100 167 101 10% 1%Primary Care 88 59 96 59 9% 0%
General/Family Medicine 55 37 59 36 7% -3%General Internal Medicine 26 18 31 19 17% 6%
General Pediatrics 7 4 7 4 1% -8%Non-Primary Care 63 42 70 43 12% 2%
Cardiovascular Diseases 1 1 1 1 -6% -14%Other Internal Medicine Subspecialties 12 8 14 9 20% 9%
Obstetrics and Gynecology 9 6 9 6 9% -1%Pathology 3 2 3 2 -6% -14%Psychiatry 2 1 2 1 0% -8%
Anesthesiology 2 1 3 2 17% 7%Radiology 1 1 1 1 10% 0%
Emergency Medicine 11 7 14 9 31% 20%General Surgery 11 7 11 7 3% -6%
Ophthalmology 2 1 2 1 -1% -9%Otolaryngology 4 3 4 3 3% -6%
Orthopedic Surgery 0 0 0 0 -- --Urology 1 1 1 1 5% -4%
Other Surgical Specialties 1 1 1 1 3% -6%9%Projected Regional Population Change 2005-2020:
Change 2005-202020202005
Figure 44 – Flint Area Regional Physician Supply Forecast, 2005-2020
PhysiciansPer 100,000 Population Physicians
Per 100,000 Population Physicians
Per 100,000 Population
All Physicians 1,425 276 1,568 309 10% 12%Primary Care 748 145 821 162 10% 12%
General/Family Medicine 376 73 401 79 7% 9%General Internal Medicine 286 55 333 66 17% 19%
General Pediatrics 86 17 87 17 1% 3%Non-Primary Care 676 131 746 147 10% 12%
Cardiovascular Diseases 27 5 26 5 -6% -4%Other Internal Medicine Subspecialties 121 23 145 29 20% 22%
Obstetrics and Gynecology 79 15 86 17 9% 11%Pathology 25 5 24 5 -6% -4%Psychiatry 34 7 35 7 0% 2%
Anesthesiology 47 9 54 11 17% 19%Radiology 79 15 87 17 10% 12%
Emergency Medicine 48 9 63 12 31% 34%General Surgery 63 12 64 13 3% 5%
Ophthalmology 19 4 18 4 -1% 1%Otolaryngology 12 2 12 2 3% 5%
Orthopedic Surgery 34 6 35 7 3% 5%Urology 10 2 11 2 5% 7%
Other Surgical Specialties 22 4 23 4 3% 5%-2%Projected Regional Population Change 2005-2020:
Change 2005-202020202005
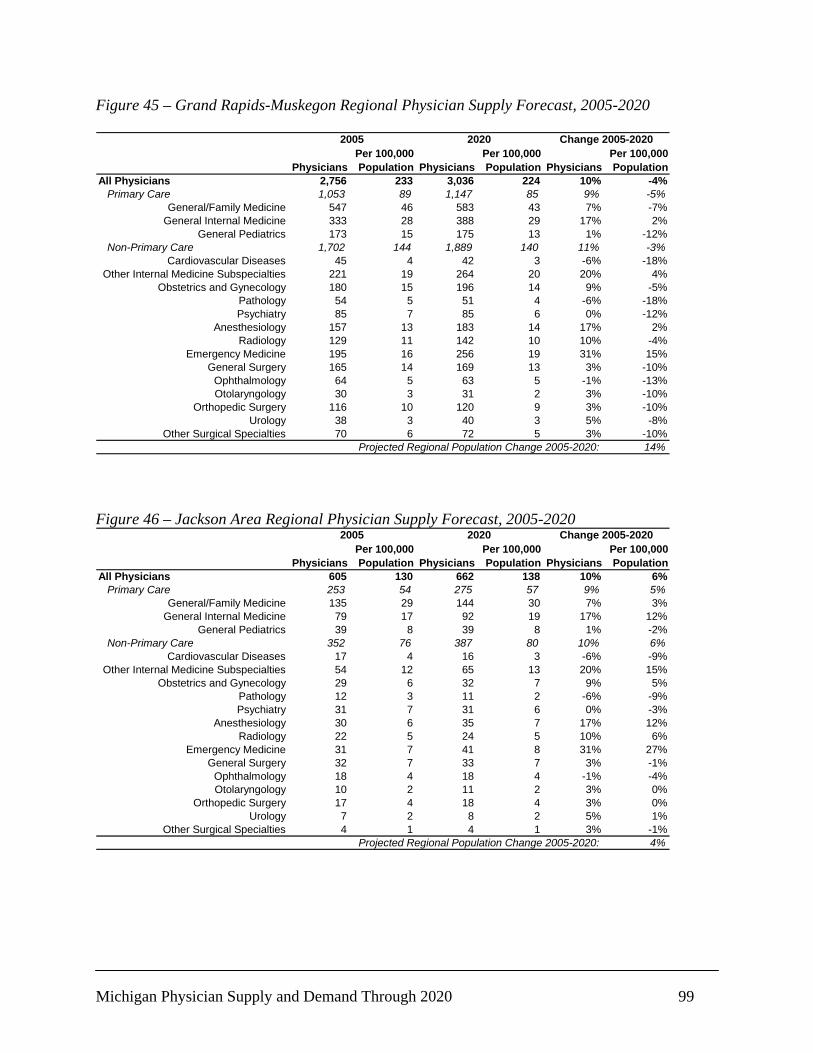
Michigan Physician Supply and Demand Through 2020 99
Figure 45 – Grand Rapids-Muskegon Regional Physician Supply Forecast, 2005-2020
PhysiciansPer 100,000 Population Physicians
Per 100,000 Population Physicians
Per 100,000 Population
All Physicians 2,756 233 3,036 224 10% -4%Primary Care 1,053 89 1,147 85 9% -5%
General/Family Medicine 547 46 583 43 7% -7%General Internal Medicine 333 28 388 29 17% 2%
General Pediatrics 173 15 175 13 1% -12%Non-Primary Care 1,702 144 1,889 140 11% -3%
Cardiovascular Diseases 45 4 42 3 -6% -18%Other Internal Medicine Subspecialties 221 19 264 20 20% 4%
Obstetrics and Gynecology 180 15 196 14 9% -5%Pathology 54 5 51 4 -6% -18%Psychiatry 85 7 85 6 0% -12%
Anesthesiology 157 13 183 14 17% 2%Radiology 129 11 142 10 10% -4%
Emergency Medicine 195 16 256 19 31% 15%General Surgery 165 14 169 13 3% -10%
Ophthalmology 64 5 63 5 -1% -13%Otolaryngology 30 3 31 2 3% -10%
Orthopedic Surgery 116 10 120 9 3% -10%Urology 38 3 40 3 5% -8%
Other Surgical Specialties 70 6 72 5 3% -10%14%Projected Regional Population Change 2005-2020:
Change 2005-202020202005
Figure 46 – Jackson Area Regional Physician Supply Forecast, 2005-2020
PhysiciansPer 100,000 Population Physicians
Per 100,000 Population Physicians
Per 100,000 Population
All Physicians 605 130 662 138 10% 6%Primary Care 253 54 275 57 9% 5%
General/Family Medicine 135 29 144 30 7% 3%General Internal Medicine 79 17 92 19 17% 12%
General Pediatrics 39 8 39 8 1% -2%Non-Primary Care 352 76 387 80 10% 6%
Cardiovascular Diseases 17 4 16 3 -6% -9%Other Internal Medicine Subspecialties 54 12 65 13 20% 15%
Obstetrics and Gynecology 29 6 32 7 9% 5%Pathology 12 3 11 2 -6% -9%Psychiatry 31 7 31 6 0% -3%
Anesthesiology 30 6 35 7 17% 12%Radiology 22 5 24 5 10% 6%
Emergency Medicine 31 7 41 8 31% 27%General Surgery 32 7 33 7 3% -1%
Ophthalmology 18 4 18 4 -1% -4%Otolaryngology 10 2 11 2 3% 0%
Orthopedic Surgery 17 4 18 4 3% 0%Urology 7 2 8 2 5% 1%
Other Surgical Specialties 4 1 4 1 3% -1%4%Projected Regional Population Change 2005-2020:
Change 2005-202020202005

Michigan Physician Supply and Demand Through 2020 100
Figure 47 – Kalamazoo-Battle Creek Regional Physician Supply Forecast, 2005-2020
PhysiciansPer 100,000 Population Physicians
Per 100,000 Population Physicians
Per 100,000 Population
All Physicians 1,521 275 1,679 292 10% 6%Primary Care 576 104 629 109 9% 5%
General/Family Medicine 254 46 271 47 7% 3%General Internal Medicine 214 39 250 43 17% 12%
General Pediatrics 107 19 108 19 1% -3%Non-Primary Care 945 171 1,050 183 11% 7%
Cardiovascular Diseases 38 7 36 6 -6% -9%Other Internal Medicine Subspecialties 146 26 174 30 20% 15%
Obstetrics and Gynecology 69 12 75 13 9% 5%Pathology 27 5 26 4 -6% -9%Psychiatry 99 18 100 17 0% -3%
Anesthesiology 51 9 60 10 17% 12%Radiology 53 9 58 10 10% 6%
Emergency Medicine 127 23 167 29 31% 27%General Surgery 83 15 85 15 3% -1%
Ophthalmology 30 5 30 5 -1% -4%Otolaryngology 15 3 16 3 3% 0%
Orthopedic Surgery 60 11 62 11 3% 0%Urology 17 3 18 3 5% 1%
Other Surgical Specialties 28 5 29 5 3% -1%4%Projected Regional Population Change 2005-2020:
Change 2005-202020202005
Figure 48 – Lansing Area Regional Physician Supply Forecast, 2005-2020
PhysiciansPer 100,000 Population Physicians
Per 100,000 Population Physicians
Per 100,000 Population
All Physicians 1,523 330 1,672 347 10% 5%Primary Care 629 136 682 141 8% 4%
General/Family Medicine 334 72 357 74 7% 2%General Internal Medicine 181 39 210 44 17% 11%
General Pediatrics 114 25 115 24 1% -3%Non-Primary Care 894 194 990 205 11% 6%
Cardiovascular Diseases 43 9 41 8 -6% -10%Other Internal Medicine Subspecialties 119 26 143 30 20% 14%
Obstetrics and Gynecology 86 19 93 19 9% 4%Pathology 23 5 22 4 -6% -10%Psychiatry 95 21 95 20 0% -4%
Anesthesiology 61 13 71 15 17% 12%Radiology 54 12 60 12 10% 5%
Emergency Medicine 98 21 129 27 31% 26%General Surgery 68 15 70 14 3% -2%
Ophthalmology 27 6 27 6 -1% -5%Otolaryngology 11 2 11 2 3% -1%
Orthopedic Surgery 35 7 36 7 3% -1%Urology 15 3 15 3 5% 0%
Other Surgical Specialties 24 5 25 5 3% -1%5%Projected Regional Population Change 2005-2020:
Change 2005-202020202005
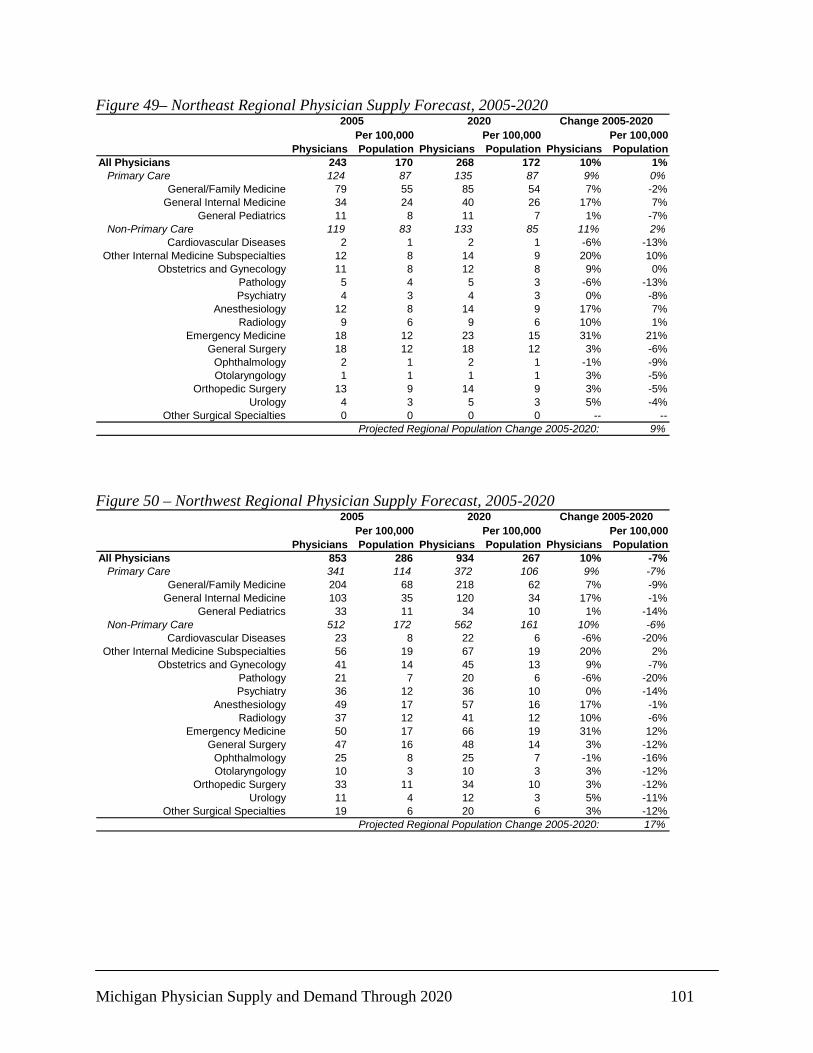
Michigan Physician Supply and Demand Through 2020 101
Figure 49– Northeast Regional Physician Supply Forecast, 2005-2020
PhysiciansPer 100,000 Population Physicians
Per 100,000 Population Physicians
Per 100,000 Population
All Physicians 243 170 268 172 10% 1%Primary Care 124 87 135 87 9% 0%
General/Family Medicine 79 55 85 54 7% -2%General Internal Medicine 34 24 40 26 17% 7%
General Pediatrics 11 8 11 7 1% -7%Non-Primary Care 119 83 133 85 11% 2%
Cardiovascular Diseases 2 1 2 1 -6% -13%Other Internal Medicine Subspecialties 12 8 14 9 20% 10%
Obstetrics and Gynecology 11 8 12 8 9% 0%Pathology 5 4 5 3 -6% -13%Psychiatry 4 3 4 3 0% -8%
Anesthesiology 12 8 14 9 17% 7%Radiology 9 6 9 6 10% 1%
Emergency Medicine 18 12 23 15 31% 21%General Surgery 18 12 18 12 3% -6%
Ophthalmology 2 1 2 1 -1% -9%Otolaryngology 1 1 1 1 3% -5%
Orthopedic Surgery 13 9 14 9 3% -5%Urology 4 3 5 3 5% -4%
Other Surgical Specialties 0 0 0 0 -- --9%Projected Regional Population Change 2005-2020:
Change 2005-202020202005
Figure 50 – Northwest Regional Physician Supply Forecast, 2005-2020
PhysiciansPer 100,000 Population Physicians
Per 100,000 Population Physicians
Per 100,000 Population
All Physicians 853 286 934 267 10% -7%Primary Care 341 114 372 106 9% -7%
General/Family Medicine 204 68 218 62 7% -9%General Internal Medicine 103 35 120 34 17% -1%
General Pediatrics 33 11 34 10 1% -14%Non-Primary Care 512 172 562 161 10% -6%
Cardiovascular Diseases 23 8 22 6 -6% -20%Other Internal Medicine Subspecialties 56 19 67 19 20% 2%
Obstetrics and Gynecology 41 14 45 13 9% -7%Pathology 21 7 20 6 -6% -20%Psychiatry 36 12 36 10 0% -14%
Anesthesiology 49 17 57 16 17% -1%Radiology 37 12 41 12 10% -6%
Emergency Medicine 50 17 66 19 31% 12%General Surgery 47 16 48 14 3% -12%
Ophthalmology 25 8 25 7 -1% -16%Otolaryngology 10 3 10 3 3% -12%
Orthopedic Surgery 33 11 34 10 3% -12%Urology 11 4 12 3 5% -11%
Other Surgical Specialties 19 6 20 6 3% -12%17%Projected Regional Population Change 2005-2020:
Change 2005-202020202005
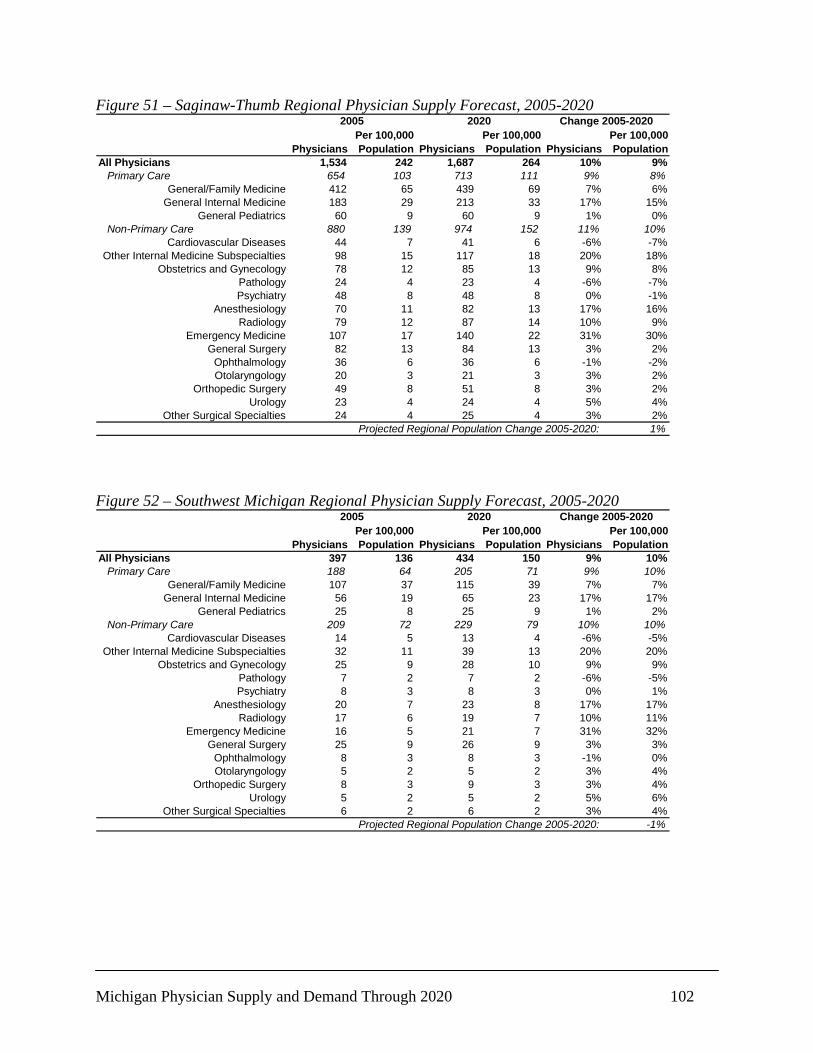
Michigan Physician Supply and Demand Through 2020 102
Figure 51 – Saginaw-Thumb Regional Physician Supply Forecast, 2005-2020
PhysiciansPer 100,000 Population Physicians
Per 100,000 Population Physicians
Per 100,000 Population
All Physicians 1,534 242 1,687 264 10% 9%Primary Care 654 103 713 111 9% 8%
General/Family Medicine 412 65 439 69 7% 6%General Internal Medicine 183 29 213 33 17% 15%
General Pediatrics 60 9 60 9 1% 0%Non-Primary Care 880 139 974 152 11% 10%
Cardiovascular Diseases 44 7 41 6 -6% -7%Other Internal Medicine Subspecialties 98 15 117 18 20% 18%
Obstetrics and Gynecology 78 12 85 13 9% 8%Pathology 24 4 23 4 -6% -7%Psychiatry 48 8 48 8 0% -1%
Anesthesiology 70 11 82 13 17% 16%Radiology 79 12 87 14 10% 9%
Emergency Medicine 107 17 140 22 31% 30%General Surgery 82 13 84 13 3% 2%
Ophthalmology 36 6 36 6 -1% -2%Otolaryngology 20 3 21 3 3% 2%
Orthopedic Surgery 49 8 51 8 3% 2%Urology 23 4 24 4 5% 4%
Other Surgical Specialties 24 4 25 4 3% 2%1%Projected Regional Population Change 2005-2020:
Change 2005-202020202005
Figure 52 – Southwest Michigan Regional Physician Supply Forecast, 2005-2020
PhysiciansPer 100,000 Population Physicians
Per 100,000 Population Physicians
Per 100,000 Population
All Physicians 397 136 434 150 9% 10%Primary Care 188 64 205 71 9% 10%
General/Family Medicine 107 37 115 39 7% 7%General Internal Medicine 56 19 65 23 17% 17%
General Pediatrics 25 8 25 9 1% 2%Non-Primary Care 209 72 229 79 10% 10%
Cardiovascular Diseases 14 5 13 4 -6% -5%Other Internal Medicine Subspecialties 32 11 39 13 20% 20%
Obstetrics and Gynecology 25 9 28 10 9% 9%Pathology 7 2 7 2 -6% -5%Psychiatry 8 3 8 3 0% 1%
Anesthesiology 20 7 23 8 17% 17%Radiology 17 6 19 7 10% 11%
Emergency Medicine 16 5 21 7 31% 32%General Surgery 25 9 26 9 3% 3%
Ophthalmology 8 3 8 3 -1% 0%Otolaryngology 5 2 5 2 3% 4%
Orthopedic Surgery 8 3 9 3 3% 4%Urology 5 2 5 2 5% 6%
Other Surgical Specialties 6 2 6 2 3% 4%-1%Projected Regional Population Change 2005-2020:
Change 2005-202020202005

Michigan Physician Supply and Demand Through 2020 103
Figure 53 – Upper Peninsula Regional Physician Supply Forecast, 2005-2020
PhysiciansPer 100,000 Population Physicians
Per 100,000 Population Physicians
Per 100,000 Population
All Physicians 700 223 764 246 9% 10%Primary Care 336 107 363 117 8% 9%
General/Family Medicine 239 76 255 82 7% 8%General Internal Medicine 65 21 76 24 17% 18%
General Pediatrics 31 10 32 10 1% 2%Non-Primary Care 364 116 400 129 10% 11%
Cardiovascular Diseases 12 4 11 4 -6% -5%Other Internal Medicine Subspecialties 53 17 63 20 20% 21%
Obstetrics and Gynecology 34 11 37 12 9% 10%Pathology 16 5 15 5 -6% -5%Psychiatry 26 8 26 8 0% 1%
Anesthesiology 22 7 26 8 17% 18%Radiology 30 9 33 11 10% 11%
Emergency Medicine 31 10 40 13 31% 33%General Surgery 39 12 40 13 3% 4%
Ophthalmology 16 5 16 5 -1% 0%Otolaryngology 9 3 9 3 3% 4%
Orthopedic Surgery 17 5 18 6 3% 4%Urology 7 2 8 2 5% 6%
Other Surgical Specialties 8 3 8 3 3% 4%-1%Projected Regional Population Change 2005-2020:
Change 2005-202020202005
Figure 54 – West Central Regional Physician Supply Forecast, 2005-2020
PhysiciansPer 100,000 Population Physicians
Per 100,000 Population Physicians
Per 100,000 Population
All Physicians 481 123 526 124 9% 1%Primary Care 247 63 268 63 9% 0%
General/Family Medicine 168 43 179 42 7% -2%General Internal Medicine 60 15 70 16 17% 7%
General Pediatrics 19 5 19 5 1% -7%Non-Primary Care 234 60 257 61 10% 1%
Cardiovascular Diseases 11 3 11 2 -6% -13%Other Internal Medicine Subspecialties 26 7 31 7 20% 10%
Obstetrics and Gynecology 30 8 33 8 9% 0%Pathology 8 2 8 2 -6% -13%Psychiatry 11 3 11 3 0% -8%
Anesthesiology 13 3 15 4 17% 7%Radiology 20 5 22 5 10% 1%
Emergency Medicine 25 6 33 8 31% 21%General Surgery 33 8 34 8 3% -5%
Ophthalmology 6 2 6 1 -1% -9%Otolaryngology 3 1 3 1 3% -5%
Orthopedic Surgery 16 4 17 4 3% -5%Urology 5 1 6 1 5% -3%
Other Surgical Specialties 1 0 1 0 3% -5%9%Projected Regional Population Change 2005-2020:
Change 2005-202020202005
Michigan Physician Supply and Demand Through 2020 104
Regional Supply Scenario 2: Supply Responsive to Demand In this scenario, regional supplies of physicians were forecast to increase between 3 and 27 percent. The greatest rates of growth (over 20 percent) were forecast for the Ann Arbor Area and Northwest regions. The smallest rates of growth (3 percent) were forecast for the Flint Area and Southwest Michigan regions. Moreover, the physician to population ratio was predicted to increase in all regions at rates ranging from 3 and 9 percent. Regions that were forecast to experience the greatest rates of population growth were also forecast to experience the greatest rates of growth in regional physician to population ratio. The Ann Arbor and Northwest regions were forecast to experience the greatest rates of growth in the physician to population ratio (9 percent and 8 percent, respectively), followed by the Lansing Area, Saginaw-Thumb, and Upper Peninsula regions (7 percent each). The Detroit Area and Grand Rapids-Muskegon regions were forecast to experience the least growth in the physician-to-population ratio (3 percent). In terms of specialty-specific supply forecasts, significant variation was forecast across regions. Regions forecast to experience the greatest rates of population growth were most likely to be forecast to experience the greatest rates of growth across specialties. For example, the Ann Arbor Area region was forecast to experience the greatest rate of growth in population and was forecast to experience rates of physician supply growth greater than 10 percent in all but a few specialties. However, in a number of these regions, the forecast growth in the number of physicians could not keep up with the forecast growth of the population. For instance, another region forecast to experience very high rates of population growth, the Northwest region, while forecast to experience rates of growth in many specialties of higher than 10 percent, was also forecast to experience declines in the physician to population ratio in several of those specialties, including Pathology, Psychiatry, Ophthalmology, and Urology. Further, even in specialties that were not forecast to decline, in this region (and others like it), the growth of the physician to population ratio was minimal. It was particularly interesting to examine the forecasts of physician supply for the Detroit Area and Flint Area regions. Both of these regions were forecast to change very little in terms of population (2 percent growth and 2 percent decline, respectively), and thus both were forecast to experience very little growth in overall physician supply. However, examining the change across specialties, the findings were somewhat different. In all but the very fastest growing specialties, there were declines in the specialty-specific supply of physicians. For example, in the Detroit Area region, the supplies of Pediatricians, Cardiologists, Pathologists, Psychiatrists, General Surgeons, Ophthalmologists, Otolaryngologists, Orthopedic Surgeons, Urologists, and other surgical specialists were all forecast to decrease in number. Further, the physician to population ratios in these specialties were also forecast to decrease.
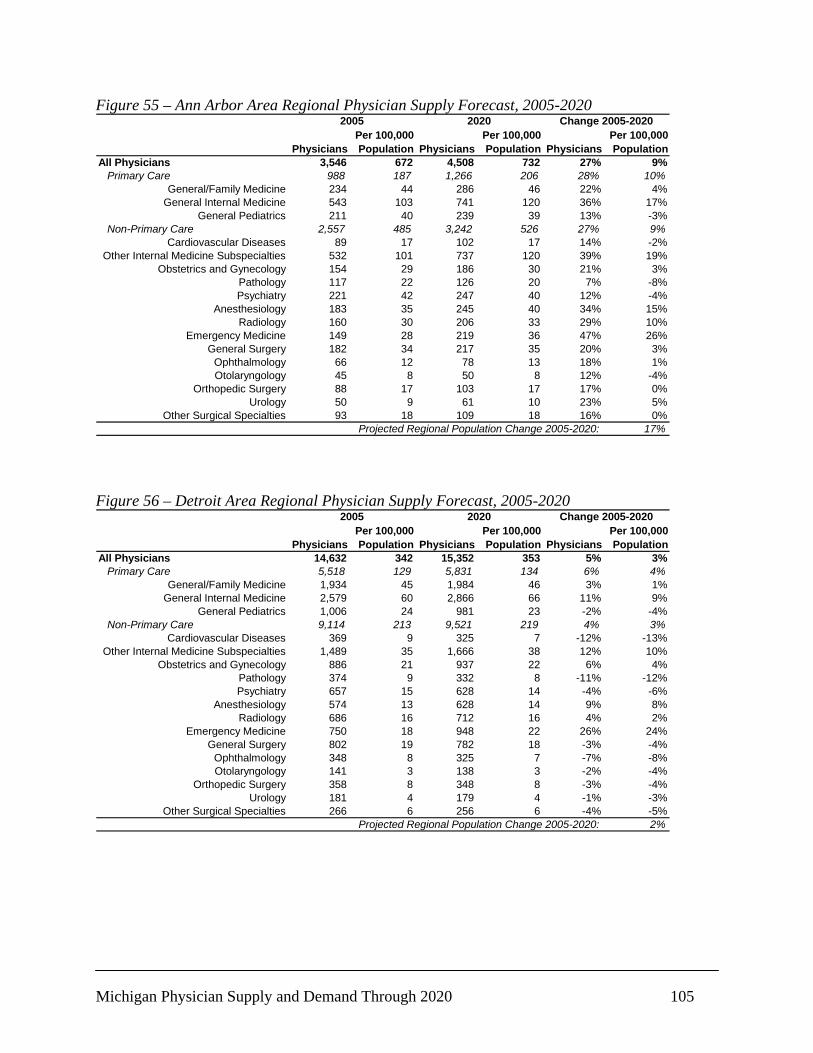
Michigan Physician Supply and Demand Through 2020 105
Figure 55 – Ann Arbor Area Regional Physician Supply Forecast, 2005-2020
PhysiciansPer 100,000 Population Physicians
Per 100,000 Population Physicians
Per 100,000 Population
All Physicians 3,546 672 4,508 732 27% 9%Primary Care 988 187 1,266 206 28% 10%
General/Family Medicine 234 44 286 46 22% 4%General Internal Medicine 543 103 741 120 36% 17%
General Pediatrics 211 40 239 39 13% -3%Non-Primary Care 2,557 485 3,242 526 27% 9%
Cardiovascular Diseases 89 17 102 17 14% -2%Other Internal Medicine Subspecialties 532 101 737 120 39% 19%
Obstetrics and Gynecology 154 29 186 30 21% 3%Pathology 117 22 126 20 7% -8%Psychiatry 221 42 247 40 12% -4%
Anesthesiology 183 35 245 40 34% 15%Radiology 160 30 206 33 29% 10%
Emergency Medicine 149 28 219 36 47% 26%General Surgery 182 34 217 35 20% 3%
Ophthalmology 66 12 78 13 18% 1%Otolaryngology 45 8 50 8 12% -4%
Orthopedic Surgery 88 17 103 17 17% 0%Urology 50 9 61 10 23% 5%
Other Surgical Specialties 93 18 109 18 16% 0%17%Projected Regional Population Change 2005-2020:
Change 2005-202020202005
Figure 56 – Detroit Area Regional Physician Supply Forecast, 2005-2020
PhysiciansPer 100,000 Population Physicians
Per 100,000 Population Physicians
Per 100,000 Population
All Physicians 14,632 342 15,352 353 5% 3%Primary Care 5,518 129 5,831 134 6% 4%
General/Family Medicine 1,934 45 1,984 46 3% 1%General Internal Medicine 2,579 60 2,866 66 11% 9%
General Pediatrics 1,006 24 981 23 -2% -4%Non-Primary Care 9,114 213 9,521 219 4% 3%
Cardiovascular Diseases 369 9 325 7 -12% -13%Other Internal Medicine Subspecialties 1,489 35 1,666 38 12% 10%
Obstetrics and Gynecology 886 21 937 22 6% 4%Pathology 374 9 332 8 -11% -12%Psychiatry 657 15 628 14 -4% -6%
Anesthesiology 574 13 628 14 9% 8%Radiology 686 16 712 16 4% 2%
Emergency Medicine 750 18 948 22 26% 24%General Surgery 802 19 782 18 -3% -4%
Ophthalmology 348 8 325 7 -7% -8%Otolaryngology 141 3 138 3 -2% -4%
Orthopedic Surgery 358 8 348 8 -3% -4%Urology 181 4 179 4 -1% -3%
Other Surgical Specialties 266 6 256 6 -4% -5%2%Projected Regional Population Change 2005-2020:
Change 2005-202020202005
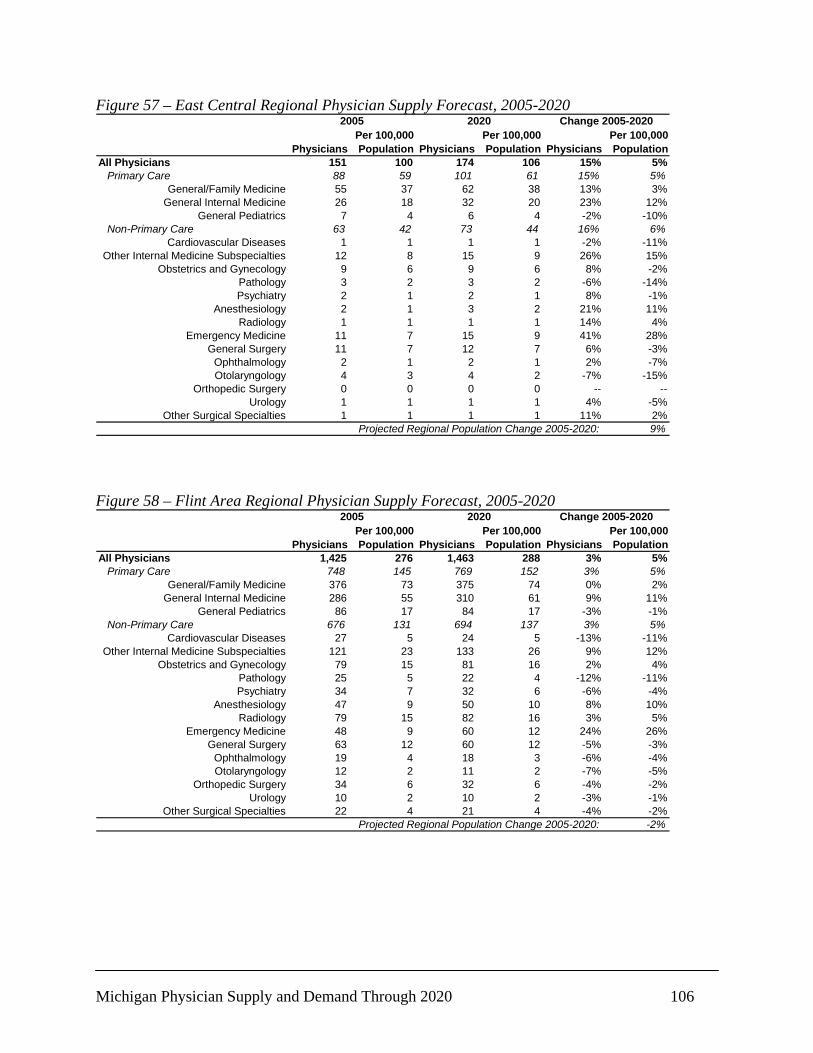
Michigan Physician Supply and Demand Through 2020 106
Figure 57 – East Central Regional Physician Supply Forecast, 2005-2020
PhysiciansPer 100,000 Population Physicians
Per 100,000 Population Physicians
Per 100,000 Population
All Physicians 151 100 174 106 15% 5%Primary Care 88 59 101 61 15% 5%
General/Family Medicine 55 37 62 38 13% 3%General Internal Medicine 26 18 32 20 23% 12%
General Pediatrics 7 4 6 4 -2% -10%Non-Primary Care 63 42 73 44 16% 6%
Cardiovascular Diseases 1 1 1 1 -2% -11%Other Internal Medicine Subspecialties 12 8 15 9 26% 15%
Obstetrics and Gynecology 9 6 9 6 8% -2%Pathology 3 2 3 2 -6% -14%Psychiatry 2 1 2 1 8% -1%
Anesthesiology 2 1 3 2 21% 11%Radiology 1 1 1 1 14% 4%
Emergency Medicine 11 7 15 9 41% 28%General Surgery 11 7 12 7 6% -3%
Ophthalmology 2 1 2 1 2% -7%Otolaryngology 4 3 4 2 -7% -15%
Orthopedic Surgery 0 0 0 0 -- --Urology 1 1 1 1 4% -5%
Other Surgical Specialties 1 1 1 1 11% 2%9%Projected Regional Population Change 2005-2020:
Change 2005-202020202005
Figure 58 – Flint Area Regional Physician Supply Forecast, 2005-2020
PhysiciansPer 100,000 Population Physicians
Per 100,000 Population Physicians
Per 100,000 Population
All Physicians 1,425 276 1,463 288 3% 5%Primary Care 748 145 769 152 3% 5%
General/Family Medicine 376 73 375 74 0% 2%General Internal Medicine 286 55 310 61 9% 11%
General Pediatrics 86 17 84 17 -3% -1%Non-Primary Care 676 131 694 137 3% 5%
Cardiovascular Diseases 27 5 24 5 -13% -11%Other Internal Medicine Subspecialties 121 23 133 26 9% 12%
Obstetrics and Gynecology 79 15 81 16 2% 4%Pathology 25 5 22 4 -12% -11%Psychiatry 34 7 32 6 -6% -4%
Anesthesiology 47 9 50 10 8% 10%Radiology 79 15 82 16 3% 5%
Emergency Medicine 48 9 60 12 24% 26%General Surgery 63 12 60 12 -5% -3%
Ophthalmology 19 4 18 3 -6% -4%Otolaryngology 12 2 11 2 -7% -5%
Orthopedic Surgery 34 6 32 6 -4% -2%Urology 10 2 10 2 -3% -1%
Other Surgical Specialties 22 4 21 4 -4% -2%-2%Projected Regional Population Change 2005-2020:
Change 2005-202020202005
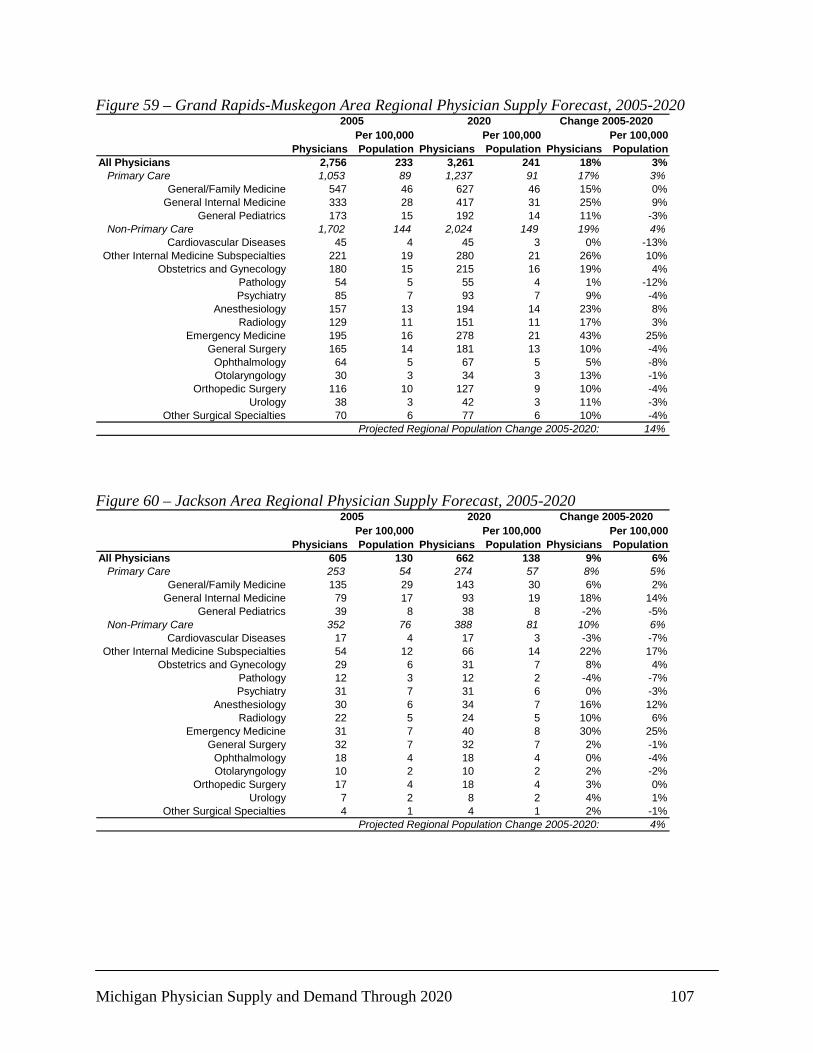
Michigan Physician Supply and Demand Through 2020 107
Figure 59 – Grand Rapids-Muskegon Area Regional Physician Supply Forecast, 2005-2020
PhysiciansPer 100,000 Population Physicians
Per 100,000 Population Physicians
Per 100,000 Population
All Physicians 2,756 233 3,261 241 18% 3%Primary Care 1,053 89 1,237 91 17% 3%
General/Family Medicine 547 46 627 46 15% 0%General Internal Medicine 333 28 417 31 25% 9%
General Pediatrics 173 15 192 14 11% -3%Non-Primary Care 1,702 144 2,024 149 19% 4%
Cardiovascular Diseases 45 4 45 3 0% -13%Other Internal Medicine Subspecialties 221 19 280 21 26% 10%
Obstetrics and Gynecology 180 15 215 16 19% 4%Pathology 54 5 55 4 1% -12%Psychiatry 85 7 93 7 9% -4%
Anesthesiology 157 13 194 14 23% 8%Radiology 129 11 151 11 17% 3%
Emergency Medicine 195 16 278 21 43% 25%General Surgery 165 14 181 13 10% -4%
Ophthalmology 64 5 67 5 5% -8%Otolaryngology 30 3 34 3 13% -1%
Orthopedic Surgery 116 10 127 9 10% -4%Urology 38 3 42 3 11% -3%
Other Surgical Specialties 70 6 77 6 10% -4%14%Projected Regional Population Change 2005-2020:
Change 2005-202020202005
Figure 60 – Jackson Area Regional Physician Supply Forecast, 2005-2020
PhysiciansPer 100,000 Population Physicians
Per 100,000 Population Physicians
Per 100,000 Population
All Physicians 605 130 662 138 9% 6%Primary Care 253 54 274 57 8% 5%
General/Family Medicine 135 29 143 30 6% 2%General Internal Medicine 79 17 93 19 18% 14%
General Pediatrics 39 8 38 8 -2% -5%Non-Primary Care 352 76 388 81 10% 6%
Cardiovascular Diseases 17 4 17 3 -3% -7%Other Internal Medicine Subspecialties 54 12 66 14 22% 17%
Obstetrics and Gynecology 29 6 31 7 8% 4%Pathology 12 3 12 2 -4% -7%Psychiatry 31 7 31 6 0% -3%
Anesthesiology 30 6 34 7 16% 12%Radiology 22 5 24 5 10% 6%
Emergency Medicine 31 7 40 8 30% 25%General Surgery 32 7 32 7 2% -1%
Ophthalmology 18 4 18 4 0% -4%Otolaryngology 10 2 10 2 2% -2%
Orthopedic Surgery 17 4 18 4 3% 0%Urology 7 2 8 2 4% 1%
Other Surgical Specialties 4 1 4 1 2% -1%4%Projected Regional Population Change 2005-2020:
Change 2005-202020202005

Michigan Physician Supply and Demand Through 2020 108
Figure 61 – Kalamazoo-Battle Creek Regional Physician Supply Forecast, 2005-2020
PhysiciansPer 100,000 Population Physicians
Per 100,000 Population Physicians
Per 100,000 Population
All Physicians 1,521 275 1,636 285 8% 4%Primary Care 576 104 618 108 7% 4%
General/Family Medicine 254 46 265 46 4% 1%General Internal Medicine 214 39 242 42 13% 9%
General Pediatrics 107 19 111 19 4% 0%Non-Primary Care 945 171 1,018 177 8% 4%
Cardiovascular Diseases 38 7 34 6 -10% -14%Other Internal Medicine Subspecialties 146 26 168 29 15% 11%
Obstetrics and Gynecology 69 12 74 13 6% 3%Pathology 27 5 25 4 -10% -13%Psychiatry 99 18 98 17 -1% -5%
Anesthesiology 51 9 57 10 11% 7%Radiology 53 9 56 10 7% 3%
Emergency Medicine 127 23 164 29 29% 24%General Surgery 83 15 82 14 -1% -5%
Ophthalmology 30 5 29 5 -4% -7%Otolaryngology 15 3 16 3 7% 3%
Orthopedic Surgery 60 11 60 10 0% -3%Urology 17 3 17 3 1% -3%
Other Surgical Specialties 28 5 28 5 -1% -5%4%Projected Regional Population Change 2005-2020:
Change 2005-202020202005
Figure 62 – Lansing Area Regional Physician Supply Forecast, 2005-2020
PhysiciansPer 100,000 Population Physicians
Per 100,000 Population Physicians
Per 100,000 Population
All Physicians 1,523 330 1,699 352 12% 7%Primary Care 629 136 700 145 11% 6%
General/Family Medicine 334 72 364 75 9% 4%General Internal Medicine 181 39 218 45 21% 15%
General Pediatrics 114 25 118 24 4% -1%Non-Primary Care 894 194 1,000 207 12% 7%
Cardiovascular Diseases 43 9 43 9 1% -4%Other Internal Medicine Subspecialties 119 26 145 30 22% 16%
Obstetrics and Gynecology 86 19 90 19 5% 0%Pathology 23 5 22 4 -5% -9%Psychiatry 95 21 94 20 -1% -5%
Anesthesiology 61 13 72 15 19% 13%Radiology 54 12 61 13 13% 8%
Emergency Medicine 98 21 127 26 29% 24%General Surgery 68 15 72 15 6% 1%
Ophthalmology 27 6 29 6 5% 1%Otolaryngology 11 2 11 2 1% -4%
Orthopedic Surgery 35 7 36 8 5% 0%Urology 15 3 16 3 10% 5%
Other Surgical Specialties 24 5 25 5 5% 1%5%Projected Regional Population Change 2005-2020:
Change 2005-202020202005

Michigan Physician Supply and Demand Through 2020 109
Figure 63 – Northeast Regional Physician Supply Forecast, 2005-2020
PhysiciansPer 100,000 Population Physicians
Per 100,000 Population Physicians
Per 100,000 Population
All Physicians 243 170 279 179 15% 5%Primary Care 124 87 141 91 13% 4%
General/Family Medicine 79 55 89 57 12% 3%General Internal Medicine 34 24 42 27 22% 12%
General Pediatrics 11 8 11 7 -2% -10%Non-Primary Care 119 83 138 88 16% 6%
Cardiovascular Diseases 2 1 2 1 -2% -10%Other Internal Medicine Subspecialties 12 8 15 10 27% 17%
Obstetrics and Gynecology 11 8 12 8 15% 5%Pathology 5 4 5 3 -6% -13%Psychiatry 4 3 5 3 8% -1%
Anesthesiology 12 8 15 10 23% 13%Radiology 9 6 10 6 16% 6%
Emergency Medicine 18 12 24 15 32% 21%General Surgery 18 12 19 12 7% -1%
Ophthalmology 2 1 2 1 4% -4%Otolaryngology 1 1 1 1 -7% -14%
Orthopedic Surgery 13 9 14 9 8% -1%Urology 4 3 5 3 4% -4%
Other Surgical Specialties 0 0 0 0 -- --9%Projected Regional Population Change 2005-2020:
Change 2005-202020202005
Figure 64 – Northwest Regional Physician Supply Forecast, 2005-2020
PhysiciansPer 100,000 Population Physicians
Per 100,000 Population Physicians
Per 100,000 Population
All Physicians 853 286 1,076 307 26% 8%Primary Care 341 114 427 122 25% 7%
General/Family Medicine 204 68 251 72 23% 5%General Internal Medicine 103 35 141 40 37% 16%
General Pediatrics 33 11 35 10 4% -12%Non-Primary Care 512 172 649 185 27% 8%
Cardiovascular Diseases 23 8 25 7 9% -7%Other Internal Medicine Subspecialties 56 19 79 22 41% 20%
Obstetrics and Gynecology 41 14 50 14 20% 3%Pathology 21 7 24 7 14% -3%Psychiatry 36 12 41 12 14% -3%
Anesthesiology 49 17 65 19 33% 13%Radiology 37 12 48 14 29% 10%
Emergency Medicine 50 17 74 21 47% 26%General Surgery 47 16 56 16 20% 2%
Ophthalmology 25 8 29 8 15% -2%Otolaryngology 10 3 13 4 31% 12%
Orthopedic Surgery 33 11 41 12 23% 5%Urology 11 4 13 4 16% -1%
Other Surgical Specialties 19 6 23 7 20% 2%17%Projected Regional Population Change 2005-2020:
Change 2005-202020202005

Michigan Physician Supply and Demand Through 2020 110
Figure 65 – Saginaw-Thumb Regional Physician Supply Forecast, 2005-2020
PhysiciansPer 100,000 Population Physicians
Per 100,000 Population Physicians
Per 100,000 Population
All Physicians 1,534 242 1,659 259 8% 7%Primary Care 654 103 703 110 7% 6%
General/Family Medicine 412 65 433 68 5% 4%General Internal Medicine 183 29 214 33 17% 16%
General Pediatrics 60 9 56 9 -6% -7%Non-Primary Care 880 139 957 150 9% 8%
Cardiovascular Diseases 44 7 42 7 -5% -6%Other Internal Medicine Subspecialties 98 15 116 18 18% 17%
Obstetrics and Gynecology 78 12 81 13 4% 3%Pathology 24 4 22 3 -8% -9%Psychiatry 48 8 46 7 -3% -4%
Anesthesiology 70 11 80 13 14% 13%Radiology 79 12 87 14 10% 9%
Emergency Medicine 107 17 134 21 26% 24%General Surgery 82 13 83 13 2% 1%
Ophthalmology 36 6 37 6 1% 1%Otolaryngology 20 3 20 3 0% -1%
Orthopedic Surgery 49 8 51 8 3% 2%Urology 23 4 24 4 4% 3%
Other Surgical Specialties 24 4 25 4 3% 2%1%Projected Regional Population Change 2005-2020:
Change 2005-202020202005
Figure 66 – Southwest Michigan Regional Physician Supply Forecast, 2005-2020
PhysiciansPer 100,000 Population Physicians
Per 100,000 Population Physicians
Per 100,000 Population
All Physicians 397 136 410 141 3% 4%Primary Care 188 64 194 67 3% 4%
General/Family Medicine 107 37 108 37 1% 1%General Internal Medicine 56 19 62 21 10% 11%
General Pediatrics 25 8 24 8 -3% -2%Non-Primary Care 209 72 216 74 3% 4%
Cardiovascular Diseases 14 5 12 4 -15% -14%Other Internal Medicine Subspecialties 32 11 36 13 13% 14%
Obstetrics and Gynecology 25 9 26 9 2% 3%Pathology 7 2 6 2 -12% -11%Psychiatry 8 3 7 3 -7% -7%
Anesthesiology 20 7 22 7 10% 10%Radiology 17 6 18 6 4% 5%
Emergency Medicine 16 5 19 7 24% 25%General Surgery 25 9 24 8 -2% -2%
Ophthalmology 8 3 7 3 -7% -6%Otolaryngology 5 2 5 2 -7% -6%
Orthopedic Surgery 8 3 8 3 -2% -1%Urology 5 2 5 2 -4% -4%
Other Surgical Specialties 6 2 6 2 -1% -1%-1%Projected Regional Population Change 2005-2020:
Change 2005-202020202005
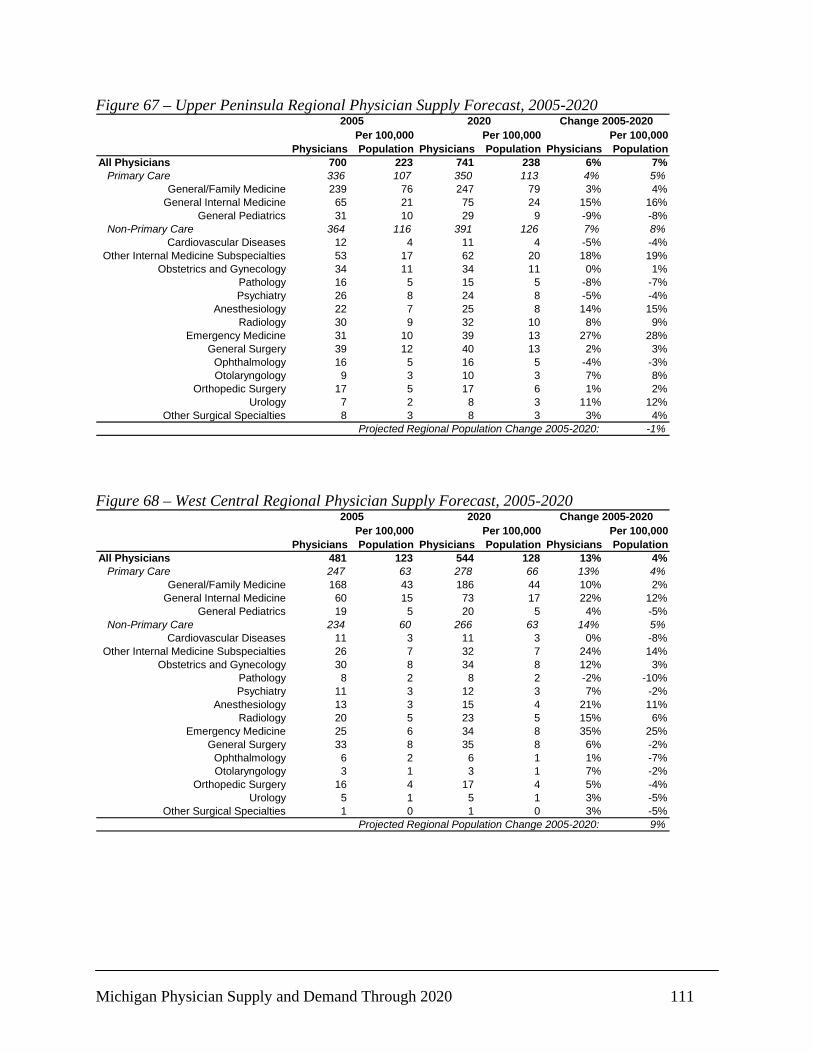
Michigan Physician Supply and Demand Through 2020 111
Figure 67 – Upper Peninsula Regional Physician Supply Forecast, 2005-2020
PhysiciansPer 100,000 Population Physicians
Per 100,000 Population Physicians
Per 100,000 Population
All Physicians 700 223 741 238 6% 7%Primary Care 336 107 350 113 4% 5%
General/Family Medicine 239 76 247 79 3% 4%General Internal Medicine 65 21 75 24 15% 16%
General Pediatrics 31 10 29 9 -9% -8%Non-Primary Care 364 116 391 126 7% 8%
Cardiovascular Diseases 12 4 11 4 -5% -4%Other Internal Medicine Subspecialties 53 17 62 20 18% 19%
Obstetrics and Gynecology 34 11 34 11 0% 1%Pathology 16 5 15 5 -8% -7%Psychiatry 26 8 24 8 -5% -4%
Anesthesiology 22 7 25 8 14% 15%Radiology 30 9 32 10 8% 9%
Emergency Medicine 31 10 39 13 27% 28%General Surgery 39 12 40 13 2% 3%
Ophthalmology 16 5 16 5 -4% -3%Otolaryngology 9 3 10 3 7% 8%
Orthopedic Surgery 17 5 17 6 1% 2%Urology 7 2 8 3 11% 12%
Other Surgical Specialties 8 3 8 3 3% 4%-1%Projected Regional Population Change 2005-2020:
Change 2005-202020202005
Figure 68 – West Central Regional Physician Supply Forecast, 2005-2020
PhysiciansPer 100,000 Population Physicians
Per 100,000 Population Physicians
Per 100,000 Population
All Physicians 481 123 544 128 13% 4%Primary Care 247 63 278 66 13% 4%
General/Family Medicine 168 43 186 44 10% 2%General Internal Medicine 60 15 73 17 22% 12%
General Pediatrics 19 5 20 5 4% -5%Non-Primary Care 234 60 266 63 14% 5%
Cardiovascular Diseases 11 3 11 3 0% -8%Other Internal Medicine Subspecialties 26 7 32 7 24% 14%
Obstetrics and Gynecology 30 8 34 8 12% 3%Pathology 8 2 8 2 -2% -10%Psychiatry 11 3 12 3 7% -2%
Anesthesiology 13 3 15 4 21% 11%Radiology 20 5 23 5 15% 6%
Emergency Medicine 25 6 34 8 35% 25%General Surgery 33 8 35 8 6% -2%
Ophthalmology 6 2 6 1 1% -7%Otolaryngology 3 1 3 1 7% -2%
Orthopedic Surgery 16 4 17 4 5% -4%Urology 5 1 5 1 3% -5%
Other Surgical Specialties 1 0 1 0 3% -5%9%Projected Regional Population Change 2005-2020:
Change 2005-202020202005
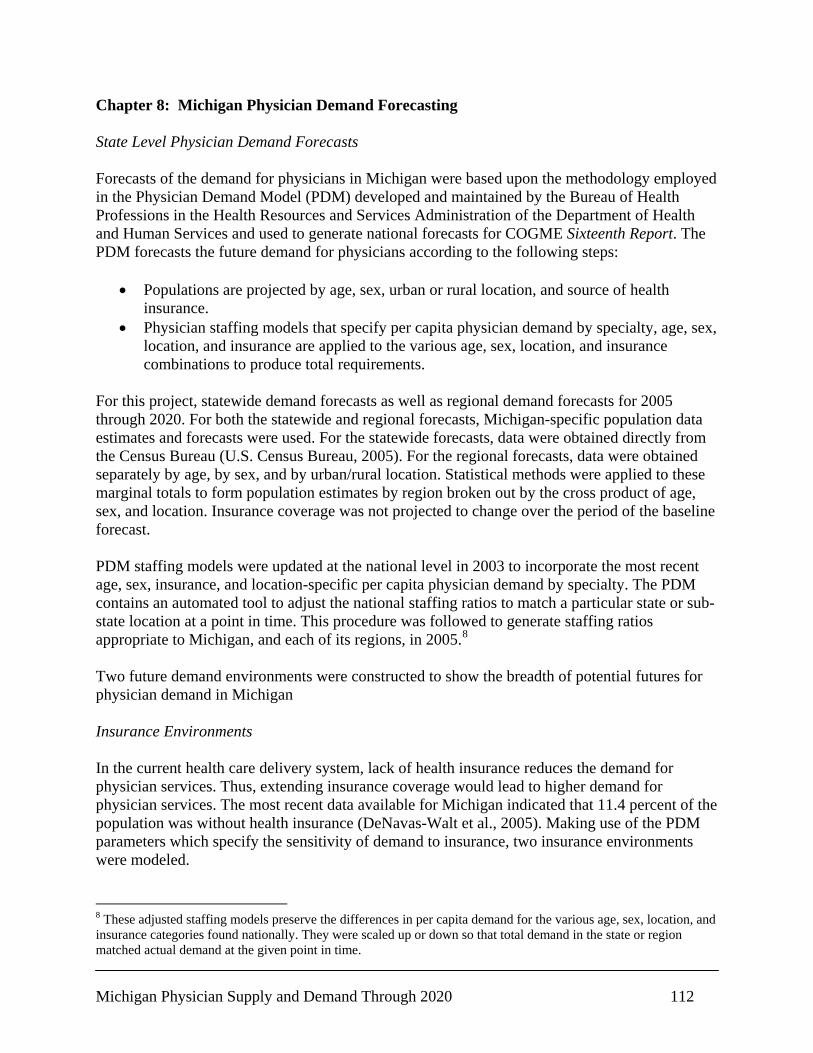
Michigan Physician Supply and Demand Through 2020 112
Chapter 8: Michigan Physician Demand Forecasting State Level Physician Demand Forecasts Forecasts of the demand for physicians in Michigan were based upon the methodology employed in the Physician Demand Model (PDM) developed and maintained by the Bureau of Health Professions in the Health Resources and Services Administration of the Department of Health and Human Services and used to generate national forecasts for COGME Sixteenth Report. The PDM forecasts the future demand for physicians according to the following steps:
• Populations are projected by age, sex, urban or rural location, and source of health insurance.
• Physician staffing models that specify per capita physician demand by specialty, age, sex, location, and insurance are applied to the various age, sex, location, and insurance combinations to produce total requirements.
For this project, statewide demand forecasts as well as regional demand forecasts for 2005 through 2020. For both the statewide and regional forecasts, Michigan-specific population data estimates and forecasts were used. For the statewide forecasts, data were obtained directly from the Census Bureau (U.S. Census Bureau, 2005). For the regional forecasts, data were obtained separately by age, by sex, and by urban/rural location. Statistical methods were applied to these marginal totals to form population estimates by region broken out by the cross product of age, sex, and location. Insurance coverage was not projected to change over the period of the baseline forecast. PDM staffing models were updated at the national level in 2003 to incorporate the most recent age, sex, insurance, and location-specific per capita physician demand by specialty. The PDM contains an automated tool to adjust the national staffing ratios to match a particular state or sub-state location at a point in time. This procedure was followed to generate staffing ratios appropriate to Michigan, and each of its regions, in 2005.8 Two future demand environments were constructed to show the breadth of potential futures for physician demand in Michigan Insurance Environments In the current health care delivery system, lack of health insurance reduces the demand for physician services. Thus, extending insurance coverage would lead to higher demand for physician services. The most recent data available for Michigan indicated that 11.4 percent of the population was without health insurance (DeNavas-Walt et al., 2005). Making use of the PDM parameters which specify the sensitivity of demand to insurance, two insurance environments were modeled. 8 These adjusted staffing models preserve the differences in per capita demand for the various age, sex, location, and insurance categories found nationally. They were scaled up or down so that total demand in the state or region matched actual demand at the given point in time.
Michigan Physician Supply and Demand Through 2020 113
Constant Insurance Environment. The first insurance environment assumed that the current insurance environment remains intact over the forecast period. In the Constant Insurance Environment forecasts, demand in 2005 was benchmarked to supply in 2005. Full Insurance Environment. The second insurance environment assumed that the health care system changes in such a way that the entire population has insurance. In this environment, the entire change was modeled to occur in the first year of the forecast period (2005). Thus, in the Full Insurance Environment forecasts, demand in 2005 was greater than the supply of physicians in 2005. Demand Forecast Scenarios For each of the constructed insurance environments, a number of scenarios were developed to present the future physician requirements under a number of sets of assumptions. The demand scenarios were as follows: State Level Demand Scenario 1: Demographic Only (Baseline) Scenario. The baseline scenario incorporated the effect of population growth and aging on the demand for physician services. Demand forecasts were produced for additional scenarios as described below. State Level Demand Scenario 2: Trend Scenario. The Trend Scenario added the effect of economic growth to the demographic only baseline. Over time, the demand for physician services has increased dramatically over and above what would be suggested by population growth and aging. This has generally been attributed to the effect of economic growth – as people have more disposable resources they consume more of most things including physician services (see discussion of the Cooper’s Trend Model on p. 33). Following the algorithm used in COGME’s Sixteenth Report, this scenario assumed a 0.75 percent increase per year in the demand for physician services due to economic growth. The demand for specialty care has been shown to be much more sensitive to income than the demand for primary care. In the trend scenario, the economic effect on demand for specialists was set at twice the effect on primary care, with the combined increase limited to 0.75 percent per year. State Level Demand Scenarios 3 and 4: Reduction of Unnecessary Services Scenarios. In this scenario, it is assumed that unnecessary services are steadily reduced between 2010 and 2020 such that all are eliminated by 2020. It is implemented by decreasing demand by 13.75 percent in 2015 and by 27.50 percent in 2020. The decrease in demand was applied separately to both the baseline demographic only scenario and the trend scenario forecasts. Michigan Physician Demand Forecasts, 2005 – 2020 Constant Insurance Environment State Level Demand Scenario 1: Demographic Only Scenario In this scenario, demand for physicians was forecast to increase by 12 percent between 2005 and 2020, with the demand for physicians predicted to increase from 30,366 physicians in 2005 to 33,888 in 2020. Adjusting for the projected population growth in the state, the demand for
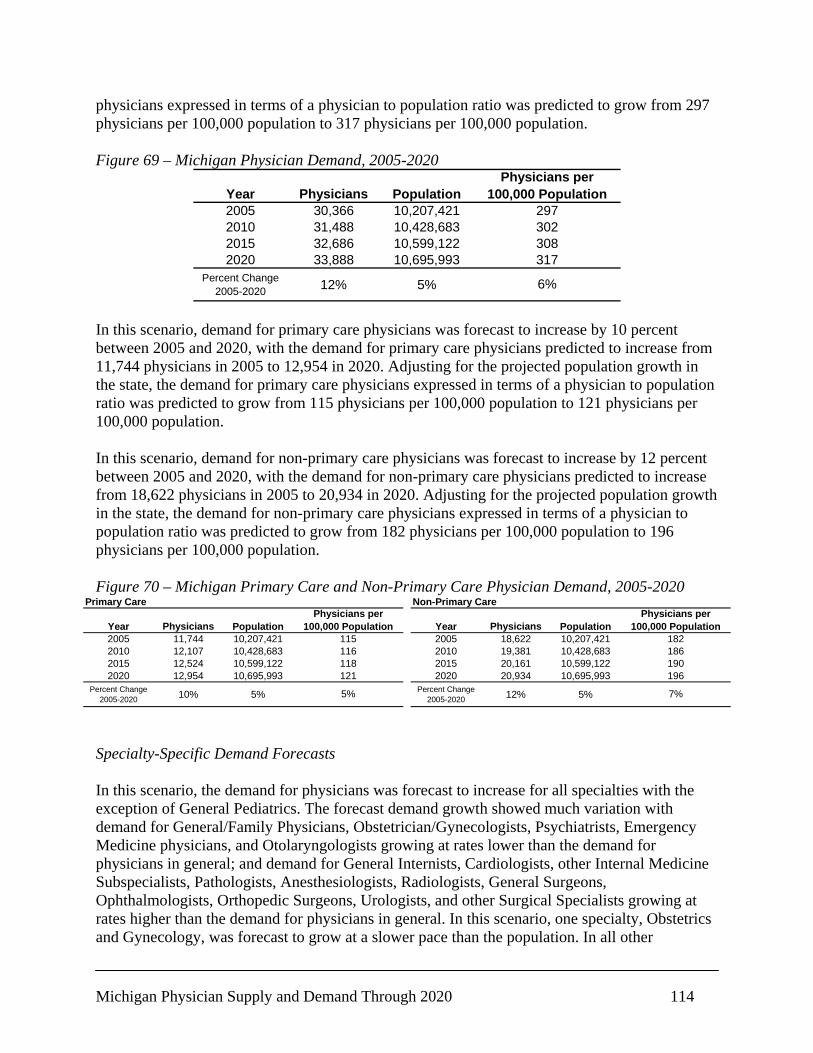
Michigan Physician Supply and Demand Through 2020 114
physicians expressed in terms of a physician to population ratio was predicted to grow from 297 physicians per 100,000 population to 317 physicians per 100,000 population. Figure 69 – Michigan Physician Demand, 2005-2020
Year Physicians Population2005 30,366 10,207,4212010 31,488 10,428,6832015 32,686 10,599,1222020 33,888 10,695,993
Percent Change 2005-2020 12% 5% 6%
Physicians per 100,000 Population
297302308317
In this scenario, demand for primary care physicians was forecast to increase by 10 percent between 2005 and 2020, with the demand for primary care physicians predicted to increase from 11,744 physicians in 2005 to 12,954 in 2020. Adjusting for the projected population growth in the state, the demand for primary care physicians expressed in terms of a physician to population ratio was predicted to grow from 115 physicians per 100,000 population to 121 physicians per 100,000 population. In this scenario, demand for non-primary care physicians was forecast to increase by 12 percent between 2005 and 2020, with the demand for non-primary care physicians predicted to increase from 18,622 physicians in 2005 to 20,934 in 2020. Adjusting for the projected population growth in the state, the demand for non-primary care physicians expressed in terms of a physician to population ratio was predicted to grow from 182 physicians per 100,000 population to 196 physicians per 100,000 population. Figure 70 – Michigan Primary Care and Non-Primary Care Physician Demand, 2005-2020
Primary Care
Year Physicians Population2005 11,744 10,207,4212010 12,107 10,428,6832015 12,524 10,599,1222020 12,954 10,695,993
Percent Change 2005-2020 10% 5%
118121
5%
Physicians per 100,000 Population
115116
Non-Primary Care
Year Physicians Population2005 18,622 10,207,4212010 19,381 10,428,6832015 20,161 10,599,1222020 20,934 10,695,993
Percent Change 2005-2020 12% 5%
Physicians per 100,000 Population
7%
190196
182186
Specialty-Specific Demand Forecasts In this scenario, the demand for physicians was forecast to increase for all specialties with the exception of General Pediatrics. The forecast demand growth showed much variation with demand for General/Family Physicians, Obstetrician/Gynecologists, Psychiatrists, Emergency Medicine physicians, and Otolaryngologists growing at rates lower than the demand for physicians in general; and demand for General Internists, Cardiologists, other Internal Medicine Subspecialists, Pathologists, Anesthesiologists, Radiologists, General Surgeons, Ophthalmologists, Orthopedic Surgeons, Urologists, and other Surgical Specialists growing at rates higher than the demand for physicians in general. In this scenario, one specialty, Obstetrics and Gynecology, was forecast to grow at a slower pace than the population. In all other
Michigan Physician Supply and Demand Through 2020 115
specialties where demand was forecast to grow, the rate of growth was greater than the rate of growth in the population. Primary Care Specialties General/Family Medicine The Demographic Only Scenario forecast an 11 percent increase in the demand for General/Family Physicians between 2005 and 2020, slightly above the level of growth in demand predicted for primary care physicians, with the demand for General/Family Physicians predicted to increase from 5,080 physicians in 2005 to 5,631 in 2020. Adjusting for the projected population growth in the state, the demand for General/Family Physicians expressed in terms of a physician to population ratio was predicted to grow from 49.8 physicians per 100,000 population to 52.6 physicians per 100,000 population. General Internal Medicine The Demographic Only Scenario forecast a 15 percent increase in the demand for General Internists between 2005 and 2020, somewhat above the level of growth in demand predicted for primary care physicians, with the demand for General Internists predicted to increase from 4,742 physicians in 2005 to 5,458 in 2020. Adjusting for the projected population growth in the state, the demand for General Internists expressed in terms of a physician to population ratio was predicted to grow from 46.5 physicians per 100,000 population to 51.0 physicians per 100,000 population. General Pediatrics The Demographic Only Scenario forecast a 3 percent decrease in the demand for General Pediatricians between 2005 and 2020, unlike the growth in demand predicted for primary care physicians, with the demand for General Pediatricians predicted to decrease from 1,922 physicians in 2005 to 1,865 in 2020. Adjusting for the projected population growth in the state, the demand for General Pediatricians expressed in terms of a physician to population ratio was predicted to decrease from 18.8 physicians per 100,000 population to 17.4 physicians per 100,000 population.
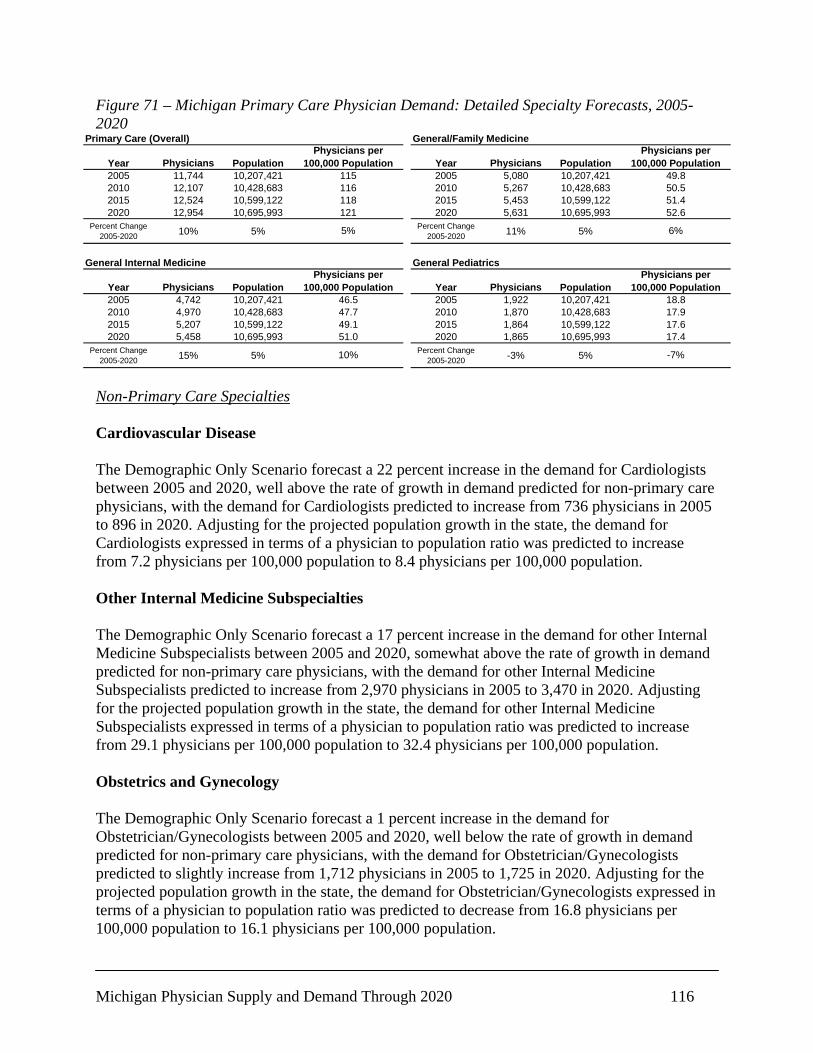
Michigan Physician Supply and Demand Through 2020 116
Figure 71 – Michigan Primary Care Physician Demand: Detailed Specialty Forecasts, 2005-2020
Primary Care (Overall)
Year Physicians Population2005 11,744 10,207,4212010 12,107 10,428,6832015 12,524 10,599,1222020 12,954 10,695,993
Percent Change 2005-2020 10% 5% 5%
Physicians per 100,000 Population
115116118121
General/Family Medicine
Year Physicians Population2005 5,080 10,207,4212010 5,267 10,428,6832015 5,453 10,599,1222020 5,631 10,695,993
Percent Change 2005-2020 11% 5% 6%
51.452.6
Physicians per 100,000 Population
49.850.5
General Internal Medicine
Year Physicians Population2005 4,742 10,207,4212010 4,970 10,428,6832015 5,207 10,599,1222020 5,458 10,695,993
Percent Change 2005-2020 15% 5%
46.547.7
Physicians per 100,000 Population
10%
49.151.0
General Pediatrics
Year Physicians Population2005 1,922 10,207,4212010 1,870 10,428,6832015 1,864 10,599,1222020 1,865 10,695,993
Percent Change 2005-2020 -3% 5%
Physicians per 100,000 Population
18.817.9
-7%
17.617.4
Non-Primary Care Specialties Cardiovascular Disease The Demographic Only Scenario forecast a 22 percent increase in the demand for Cardiologists between 2005 and 2020, well above the rate of growth in demand predicted for non-primary care physicians, with the demand for Cardiologists predicted to increase from 736 physicians in 2005 to 896 in 2020. Adjusting for the projected population growth in the state, the demand for Cardiologists expressed in terms of a physician to population ratio was predicted to increase from 7.2 physicians per 100,000 population to 8.4 physicians per 100,000 population. Other Internal Medicine Subspecialties The Demographic Only Scenario forecast a 17 percent increase in the demand for other Internal Medicine Subspecialists between 2005 and 2020, somewhat above the rate of growth in demand predicted for non-primary care physicians, with the demand for other Internal Medicine Subspecialists predicted to increase from 2,970 physicians in 2005 to 3,470 in 2020. Adjusting for the projected population growth in the state, the demand for other Internal Medicine Subspecialists expressed in terms of a physician to population ratio was predicted to increase from 29.1 physicians per 100,000 population to 32.4 physicians per 100,000 population. Obstetrics and Gynecology The Demographic Only Scenario forecast a 1 percent increase in the demand for Obstetrician/Gynecologists between 2005 and 2020, well below the rate of growth in demand predicted for non-primary care physicians, with the demand for Obstetrician/Gynecologists predicted to slightly increase from 1,712 physicians in 2005 to 1,725 in 2020. Adjusting for the projected population growth in the state, the demand for Obstetrician/Gynecologists expressed in terms of a physician to population ratio was predicted to decrease from 16.8 physicians per 100,000 population to 16.1 physicians per 100,000 population.
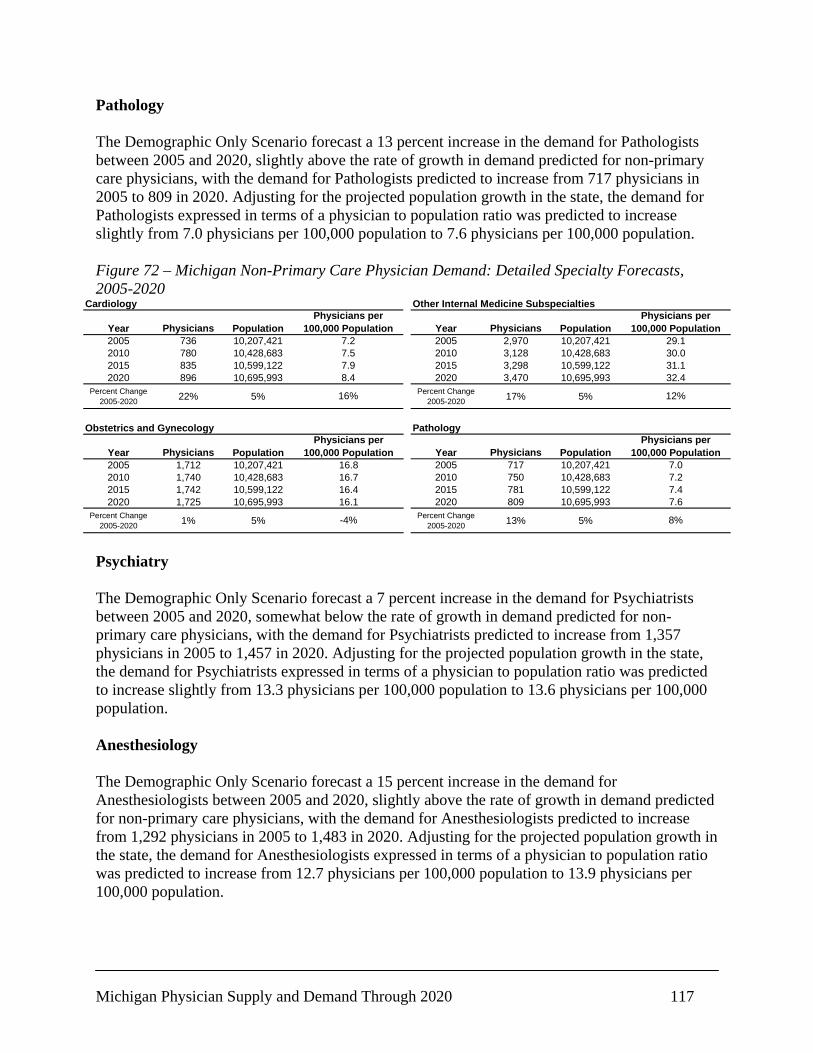
Michigan Physician Supply and Demand Through 2020 117
Pathology The Demographic Only Scenario forecast a 13 percent increase in the demand for Pathologists between 2005 and 2020, slightly above the rate of growth in demand predicted for non-primary care physicians, with the demand for Pathologists predicted to increase from 717 physicians in 2005 to 809 in 2020. Adjusting for the projected population growth in the state, the demand for Pathologists expressed in terms of a physician to population ratio was predicted to increase slightly from 7.0 physicians per 100,000 population to 7.6 physicians per 100,000 population. Figure 72 – Michigan Non-Primary Care Physician Demand: Detailed Specialty Forecasts, 2005-2020
Cardiology
Year Physicians Population2005 736 10,207,4212010 780 10,428,6832015 835 10,599,1222020 896 10,695,993
Percent Change 2005-2020 22% 5%
7.98.4
16%
Physicians per 100,000 Population
7.27.5
Other Internal Medicine Subspecialties
Year Physicians Population2005 2,970 10,207,4212010 3,128 10,428,6832015 3,298 10,599,1222020 3,470 10,695,993
Percent Change 2005-2020 17% 5%
Physicians per 100,000 Population
12%
31.132.4
29.130.0
Obstetrics and Gynecology
Year Physicians Population2005 1,712 10,207,4212010 1,740 10,428,6832015 1,742 10,599,1222020 1,725 10,695,993
Percent Change 2005-2020 1% 5%
16.416.1
-4%
Physicians per 100,000 Population
16.816.7
Pathology
Year Physicians Population2005 717 10,207,4212010 750 10,428,6832015 781 10,599,1222020 809 10,695,993
Percent Change 2005-2020 13% 5%
Physicians per 100,000 Population
7.07.2
8%
7.47.6
Psychiatry The Demographic Only Scenario forecast a 7 percent increase in the demand for Psychiatrists between 2005 and 2020, somewhat below the rate of growth in demand predicted for non-primary care physicians, with the demand for Psychiatrists predicted to increase from 1,357 physicians in 2005 to 1,457 in 2020. Adjusting for the projected population growth in the state, the demand for Psychiatrists expressed in terms of a physician to population ratio was predicted to increase slightly from 13.3 physicians per 100,000 population to 13.6 physicians per 100,000 population. Anesthesiology The Demographic Only Scenario forecast a 15 percent increase in the demand for Anesthesiologists between 2005 and 2020, slightly above the rate of growth in demand predicted for non-primary care physicians, with the demand for Anesthesiologists predicted to increase from 1,292 physicians in 2005 to 1,483 in 2020. Adjusting for the projected population growth in the state, the demand for Anesthesiologists expressed in terms of a physician to population ratio was predicted to increase from 12.7 physicians per 100,000 population to 13.9 physicians per 100,000 population.
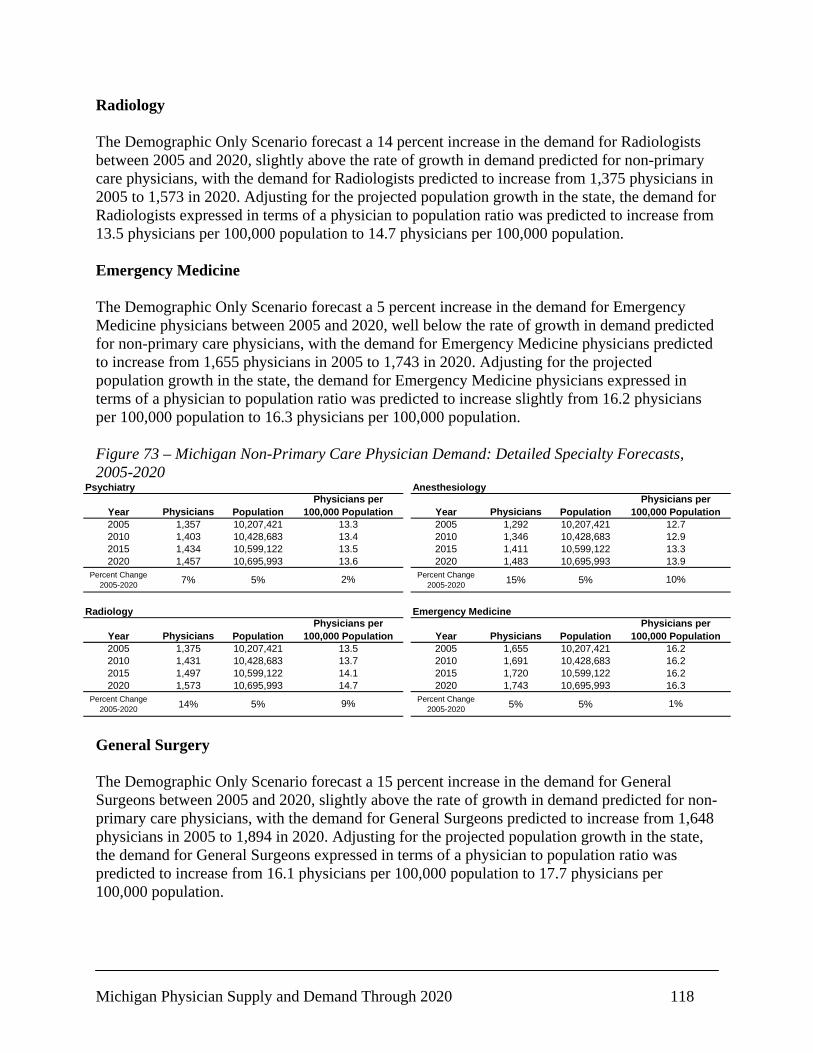
Michigan Physician Supply and Demand Through 2020 118
Radiology The Demographic Only Scenario forecast a 14 percent increase in the demand for Radiologists between 2005 and 2020, slightly above the rate of growth in demand predicted for non-primary care physicians, with the demand for Radiologists predicted to increase from 1,375 physicians in 2005 to 1,573 in 2020. Adjusting for the projected population growth in the state, the demand for Radiologists expressed in terms of a physician to population ratio was predicted to increase from 13.5 physicians per 100,000 population to 14.7 physicians per 100,000 population. Emergency Medicine The Demographic Only Scenario forecast a 5 percent increase in the demand for Emergency Medicine physicians between 2005 and 2020, well below the rate of growth in demand predicted for non-primary care physicians, with the demand for Emergency Medicine physicians predicted to increase from 1,655 physicians in 2005 to 1,743 in 2020. Adjusting for the projected population growth in the state, the demand for Emergency Medicine physicians expressed in terms of a physician to population ratio was predicted to increase slightly from 16.2 physicians per 100,000 population to 16.3 physicians per 100,000 population. Figure 73 – Michigan Non-Primary Care Physician Demand: Detailed Specialty Forecasts, 2005-2020
Psychiatry
Year Physicians Population2005 1,357 10,207,4212010 1,403 10,428,6832015 1,434 10,599,1222020 1,457 10,695,993
Percent Change 2005-2020 7% 5% 2%
Physicians per 100,000 Population
13.313.413.513.6
Anesthesiology
Year Physicians Population2005 1,292 10,207,4212010 1,346 10,428,6832015 1,411 10,599,1222020 1,483 10,695,993
Percent Change 2005-2020 15% 5% 10%
13.313.9
Physicians per 100,000 Population
12.712.9
Radiology
Year Physicians Population2005 1,375 10,207,4212010 1,431 10,428,6832015 1,497 10,599,1222020 1,573 10,695,993
Percent Change 2005-2020 14% 5%
13.513.7
Physicians per 100,000 Population
9%
14.114.7
Emergency Medicine
Year Physicians Population2005 1,655 10,207,4212010 1,691 10,428,6832015 1,720 10,599,1222020 1,743 10,695,993
Percent Change 2005-2020 5% 5%
Physicians per 100,000 Population
16.216.2
1%
16.216.3
General Surgery The Demographic Only Scenario forecast a 15 percent increase in the demand for General Surgeons between 2005 and 2020, slightly above the rate of growth in demand predicted for non-primary care physicians, with the demand for General Surgeons predicted to increase from 1,648 physicians in 2005 to 1,894 in 2020. Adjusting for the projected population growth in the state, the demand for General Surgeons expressed in terms of a physician to population ratio was predicted to increase from 16.1 physicians per 100,000 population to 17.7 physicians per 100,000 population.
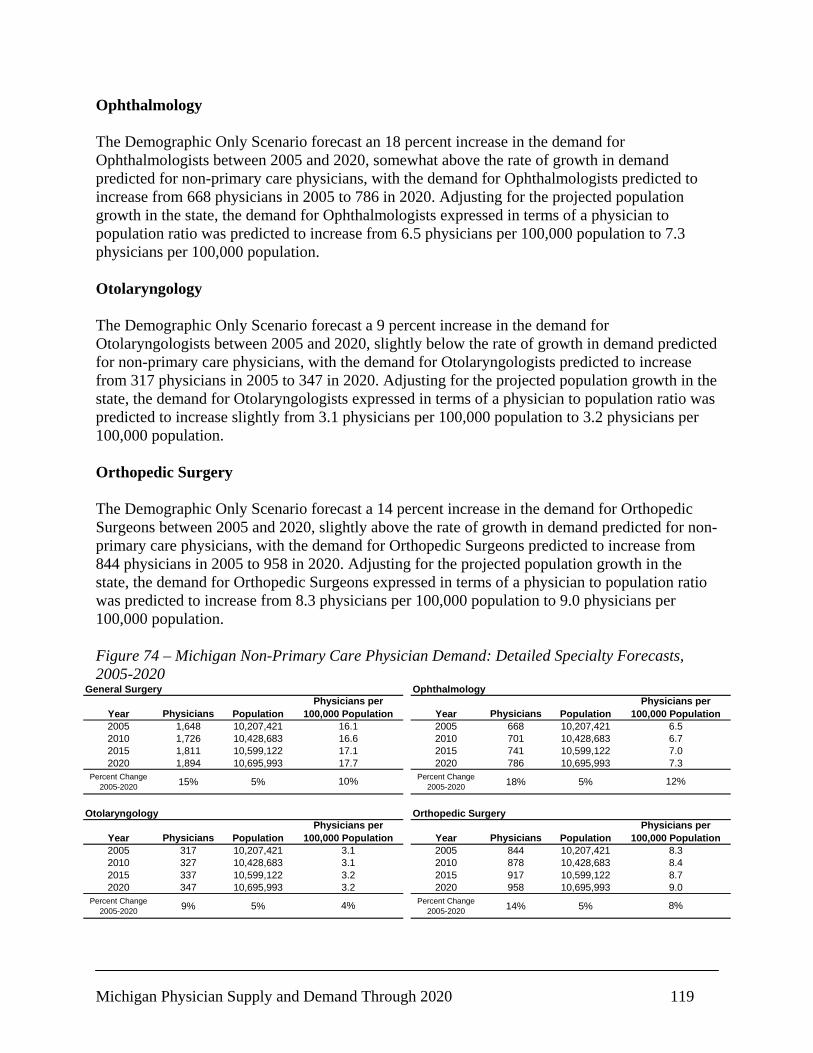
Michigan Physician Supply and Demand Through 2020 119
Ophthalmology The Demographic Only Scenario forecast an 18 percent increase in the demand for Ophthalmologists between 2005 and 2020, somewhat above the rate of growth in demand predicted for non-primary care physicians, with the demand for Ophthalmologists predicted to increase from 668 physicians in 2005 to 786 in 2020. Adjusting for the projected population growth in the state, the demand for Ophthalmologists expressed in terms of a physician to population ratio was predicted to increase from 6.5 physicians per 100,000 population to 7.3 physicians per 100,000 population. Otolaryngology The Demographic Only Scenario forecast a 9 percent increase in the demand for Otolaryngologists between 2005 and 2020, slightly below the rate of growth in demand predicted for non-primary care physicians, with the demand for Otolaryngologists predicted to increase from 317 physicians in 2005 to 347 in 2020. Adjusting for the projected population growth in the state, the demand for Otolaryngologists expressed in terms of a physician to population ratio was predicted to increase slightly from 3.1 physicians per 100,000 population to 3.2 physicians per 100,000 population. Orthopedic Surgery The Demographic Only Scenario forecast a 14 percent increase in the demand for Orthopedic Surgeons between 2005 and 2020, slightly above the rate of growth in demand predicted for non-primary care physicians, with the demand for Orthopedic Surgeons predicted to increase from 844 physicians in 2005 to 958 in 2020. Adjusting for the projected population growth in the state, the demand for Orthopedic Surgeons expressed in terms of a physician to population ratio was predicted to increase from 8.3 physicians per 100,000 population to 9.0 physicians per 100,000 population. Figure 74 – Michigan Non-Primary Care Physician Demand: Detailed Specialty Forecasts, 2005-2020
General Surgery
Year Physicians Population2005 1,648 10,207,4212010 1,726 10,428,6832015 1,811 10,599,1222020 1,894 10,695,993
Percent Change 2005-2020 15% 5%
17.117.7
10%
Physicians per 100,000 Population
16.116.6
Ophthalmology
Year Physicians Population2005 668 10,207,4212010 701 10,428,6832015 741 10,599,1222020 786 10,695,993
Percent Change 2005-2020 18% 5%
Physicians per 100,000 Population
12%
7.07.3
6.56.7
Otolaryngology
Year Physicians Population2005 317 10,207,4212010 327 10,428,6832015 337 10,599,1222020 347 10,695,993
Percent Change 2005-2020 9% 5%
3.23.2
4%
Physicians per 100,000 Population
3.13.1
Orthopedic Surgery
Year Physicians Population2005 844 10,207,4212010 878 10,428,6832015 917 10,599,1222020 958 10,695,993
Percent Change 2005-2020 14% 5%
Physicians per 100,000 Population
8.38.4
8%
8.79.0
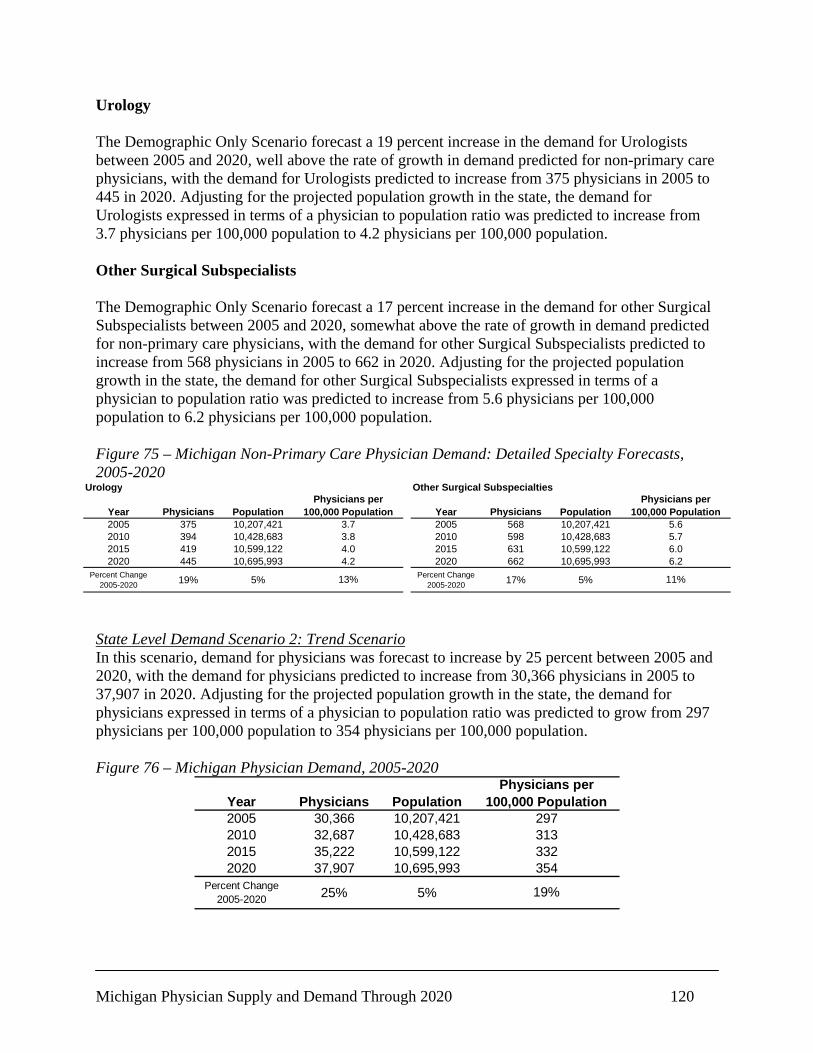
Michigan Physician Supply and Demand Through 2020 120
Urology The Demographic Only Scenario forecast a 19 percent increase in the demand for Urologists between 2005 and 2020, well above the rate of growth in demand predicted for non-primary care physicians, with the demand for Urologists predicted to increase from 375 physicians in 2005 to 445 in 2020. Adjusting for the projected population growth in the state, the demand for Urologists expressed in terms of a physician to population ratio was predicted to increase from 3.7 physicians per 100,000 population to 4.2 physicians per 100,000 population. Other Surgical Subspecialists The Demographic Only Scenario forecast a 17 percent increase in the demand for other Surgical Subspecialists between 2005 and 2020, somewhat above the rate of growth in demand predicted for non-primary care physicians, with the demand for other Surgical Subspecialists predicted to increase from 568 physicians in 2005 to 662 in 2020. Adjusting for the projected population growth in the state, the demand for other Surgical Subspecialists expressed in terms of a physician to population ratio was predicted to increase from 5.6 physicians per 100,000 population to 6.2 physicians per 100,000 population. Figure 75 – Michigan Non-Primary Care Physician Demand: Detailed Specialty Forecasts, 2005-2020
Urology
Year Physicians Population2005 375 10,207,4212010 394 10,428,6832015 419 10,599,1222020 445 10,695,993
Percent Change 2005-2020 19% 5% 13%
Physicians per 100,000 Population
3.73.84.04.2
Other Surgical Subspecialties
Year Physicians Population2005 568 10,207,4212010 598 10,428,6832015 631 10,599,1222020 662 10,695,993
Percent Change 2005-2020 17% 5% 11%
6.06.2
Physicians per 100,000 Population
5.65.7
State Level Demand Scenario 2: Trend Scenario In this scenario, demand for physicians was forecast to increase by 25 percent between 2005 and 2020, with the demand for physicians predicted to increase from 30,366 physicians in 2005 to 37,907 in 2020. Adjusting for the projected population growth in the state, the demand for physicians expressed in terms of a physician to population ratio was predicted to grow from 297 physicians per 100,000 population to 354 physicians per 100,000 population. Figure 76 – Michigan Physician Demand, 2005-2020
Year Physicians Population2005 30,366 10,207,4212010 32,687 10,428,6832015 35,222 10,599,1222020 37,907 10,695,993
Percent Change 2005-2020 25% 5%
354
19%
Physicians per 100,000 Population
297313332
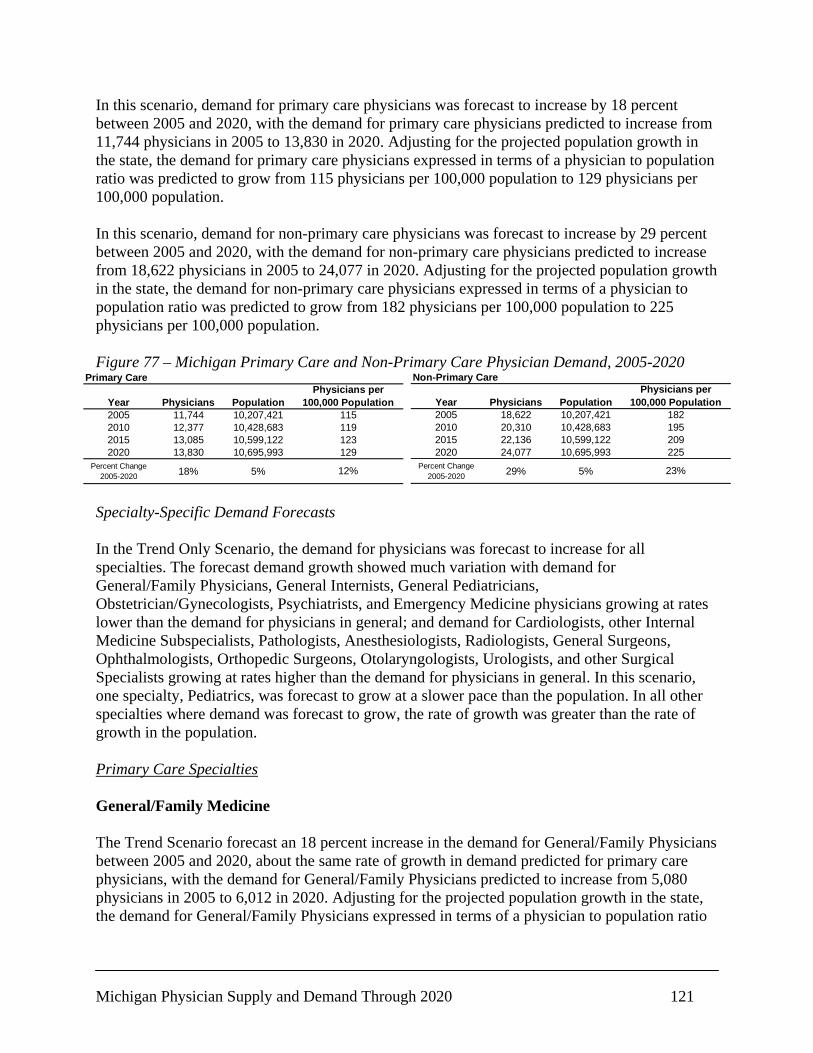
Michigan Physician Supply and Demand Through 2020 121
In this scenario, demand for primary care physicians was forecast to increase by 18 percent between 2005 and 2020, with the demand for primary care physicians predicted to increase from 11,744 physicians in 2005 to 13,830 in 2020. Adjusting for the projected population growth in the state, the demand for primary care physicians expressed in terms of a physician to population ratio was predicted to grow from 115 physicians per 100,000 population to 129 physicians per 100,000 population. In this scenario, demand for non-primary care physicians was forecast to increase by 29 percent between 2005 and 2020, with the demand for non-primary care physicians predicted to increase from 18,622 physicians in 2005 to 24,077 in 2020. Adjusting for the projected population growth in the state, the demand for non-primary care physicians expressed in terms of a physician to population ratio was predicted to grow from 182 physicians per 100,000 population to 225 physicians per 100,000 population. Figure 77 – Michigan Primary Care and Non-Primary Care Physician Demand, 2005-2020
Primary Care
Year Physicians Population2005 11,744 10,207,4212010 12,377 10,428,6832015 13,085 10,599,1222020 13,830 10,695,993
Percent Change 2005-2020 18% 5%
129
12%
Physicians per 100,000 Population
115119123
Non-Primary Care
Year Physicians Population2005 18,622 10,207,4212010 20,310 10,428,6832015 22,136 10,599,1222020 24,077 10,695,993
Percent Change 2005-2020 29% 5%
209225
182195
Physicians per 100,000 Population
23% Specialty-Specific Demand Forecasts In the Trend Only Scenario, the demand for physicians was forecast to increase for all specialties. The forecast demand growth showed much variation with demand for General/Family Physicians, General Internists, General Pediatricians, Obstetrician/Gynecologists, Psychiatrists, and Emergency Medicine physicians growing at rates lower than the demand for physicians in general; and demand for Cardiologists, other Internal Medicine Subspecialists, Pathologists, Anesthesiologists, Radiologists, General Surgeons, Ophthalmologists, Orthopedic Surgeons, Otolaryngologists, Urologists, and other Surgical Specialists growing at rates higher than the demand for physicians in general. In this scenario, one specialty, Pediatrics, was forecast to grow at a slower pace than the population. In all other specialties where demand was forecast to grow, the rate of growth was greater than the rate of growth in the population. Primary Care Specialties General/Family Medicine The Trend Scenario forecast an 18 percent increase in the demand for General/Family Physicians between 2005 and 2020, about the same rate of growth in demand predicted for primary care physicians, with the demand for General/Family Physicians predicted to increase from 5,080 physicians in 2005 to 6,012 in 2020. Adjusting for the projected population growth in the state, the demand for General/Family Physicians expressed in terms of a physician to population ratio
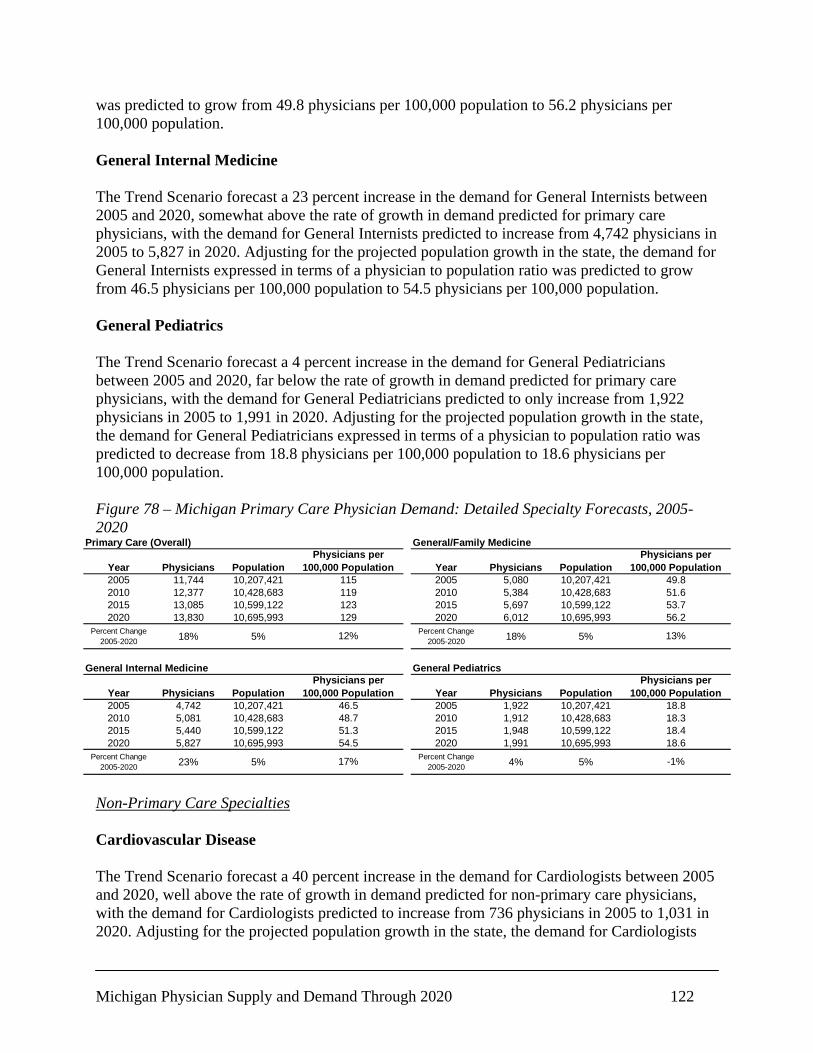
Michigan Physician Supply and Demand Through 2020 122
was predicted to grow from 49.8 physicians per 100,000 population to 56.2 physicians per 100,000 population. General Internal Medicine The Trend Scenario forecast a 23 percent increase in the demand for General Internists between 2005 and 2020, somewhat above the rate of growth in demand predicted for primary care physicians, with the demand for General Internists predicted to increase from 4,742 physicians in 2005 to 5,827 in 2020. Adjusting for the projected population growth in the state, the demand for General Internists expressed in terms of a physician to population ratio was predicted to grow from 46.5 physicians per 100,000 population to 54.5 physicians per 100,000 population. General Pediatrics The Trend Scenario forecast a 4 percent increase in the demand for General Pediatricians between 2005 and 2020, far below the rate of growth in demand predicted for primary care physicians, with the demand for General Pediatricians predicted to only increase from 1,922 physicians in 2005 to 1,991 in 2020. Adjusting for the projected population growth in the state, the demand for General Pediatricians expressed in terms of a physician to population ratio was predicted to decrease from 18.8 physicians per 100,000 population to 18.6 physicians per 100,000 population. Figure 78 – Michigan Primary Care Physician Demand: Detailed Specialty Forecasts, 2005-2020
Primary Care (Overall)
Year Physicians Population2005 11,744 10,207,4212010 12,377 10,428,6832015 13,085 10,599,1222020 13,830 10,695,993
Percent Change 2005-2020 18% 5%
129
12%
Physicians per 100,000 Population
115119123
General/Family Medicine
Year Physicians Population2005 5,080 10,207,4212010 5,384 10,428,6832015 5,697 10,599,1222020 6,012 10,695,993
Percent Change 2005-2020 18% 5% 13%
53.756.2
Physicians per 100,000 Population
49.851.6
General Internal Medicine
Year Physicians Population2005 4,742 10,207,4212010 5,081 10,428,6832015 5,440 10,599,1222020 5,827 10,695,993
Percent Change 2005-2020 23% 5% 17%
51.354.5
46.548.7
Physicians per 100,000 Population
General Pediatrics
Year Physicians Population2005 1,922 10,207,4212010 1,912 10,428,6832015 1,948 10,599,1222020 1,991 10,695,993
Percent Change 2005-2020 4% 5% -1%
18.418.6
Physicians per 100,000 Population
18.818.3
Non-Primary Care Specialties Cardiovascular Disease The Trend Scenario forecast a 40 percent increase in the demand for Cardiologists between 2005 and 2020, well above the rate of growth in demand predicted for non-primary care physicians, with the demand for Cardiologists predicted to increase from 736 physicians in 2005 to 1,031 in 2020. Adjusting for the projected population growth in the state, the demand for Cardiologists

Michigan Physician Supply and Demand Through 2020 123
expressed in terms of a physician to population ratio was predicted to increase from 7.2 physicians per 100,000 population to 9.6 physicians per 100,000 population. Other Internal Medicine Subspecialties The Trend Scenario forecast a 34 percent increase in the demand for other Internal Medicine Subspecialists between 2005 and 2020, somewhat above the rate of growth in demand predicted for non-primary care physicians, with the demand for other Internal Medicine Subspecialists predicted to increase from 2,970 physicians in 2005 to 3,991 in 2020. Adjusting for the projected population growth in the state, the demand for other Internal Medicine Subspecialists expressed in terms of a physician to population ratio was predicted to increase from 29.1 physicians per 100,000 population to 37.3 physicians per 100,000 population. Obstetrics and Gynecology The Trend Scenario forecast a 16 percent increase in the demand for Obstetrician/Gynecologists between 2005 and 2020, well below the rate of growth in demand predicted for non-primary care physicians, with the demand for Obstetrician/Gynecologists predicted to increase from 1,712 physicians in 2005 to 1,984 in 2020. Adjusting for the projected population growth in the state, the demand for Obstetrician/Gynecologists expressed in terms of a physician to population ratio was predicted to increase from 16.8 physicians per 100,000 population to 18.6 physicians per 100,000 population. Pathology The Trend Scenario forecast a 30 percent increase in the demand for Pathologists between 2005 and 2020, slightly above the rate of growth in demand predicted for non-primary care physicians, with the demand for Pathologists predicted to increase from 717 physicians in 2005 to 931 in 2020. Adjusting for the projected population growth in the state, the demand for Pathologists expressed in terms of a physician to population ratio was predicted to increase from 7.0 physicians per 100,000 population to 8.7 physicians per 100,000 population.
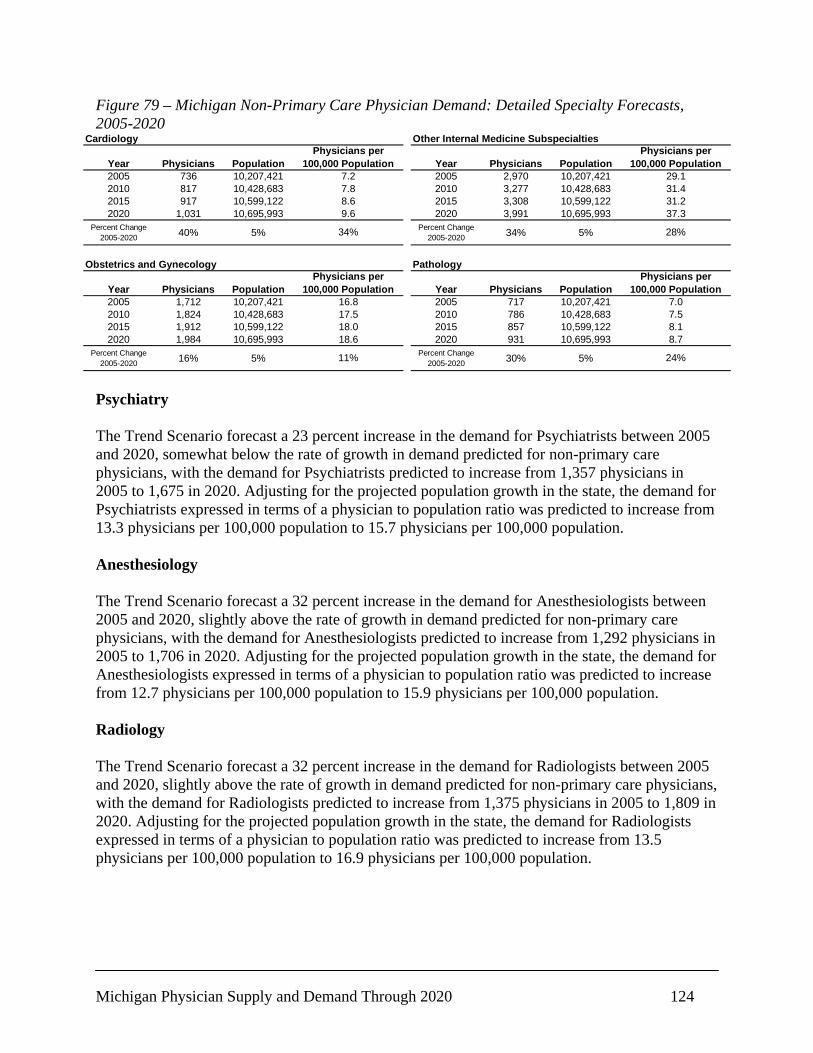
Michigan Physician Supply and Demand Through 2020 124
Figure 79 – Michigan Non-Primary Care Physician Demand: Detailed Specialty Forecasts, 2005-2020
Cardiology
Year Physicians Population2005 736 10,207,4212010 817 10,428,6832015 917 10,599,1222020 1,031 10,695,993
Percent Change 2005-2020 40% 5%
9.6
34%
Physicians per 100,000 Population
7.27.88.6
Other Internal Medicine Subspecialties
Year Physicians Population2005 2,970 10,207,4212010 3,277 10,428,6832015 3,308 10,599,1222020 3,991 10,695,993
Percent Change 2005-2020 34% 5%
31.237.3
29.131.4
Physicians per 100,000 Population
28%
Obstetrics and Gynecology
Year Physicians Population2005 1,712 10,207,4212010 1,824 10,428,6832015 1,912 10,599,1222020 1,984 10,695,993
Percent Change 2005-2020 16% 5%
Physicians per 100,000 Population
16.817.518.018.6
11%
Pathology
Year Physicians Population2005 717 10,207,4212010 786 10,428,6832015 857 10,599,1222020 931 10,695,993
Percent Change 2005-2020 30% 5%
Physicians per 100,000 Population
7.07.5
24%
8.18.7
Psychiatry The Trend Scenario forecast a 23 percent increase in the demand for Psychiatrists between 2005 and 2020, somewhat below the rate of growth in demand predicted for non-primary care physicians, with the demand for Psychiatrists predicted to increase from 1,357 physicians in 2005 to 1,675 in 2020. Adjusting for the projected population growth in the state, the demand for Psychiatrists expressed in terms of a physician to population ratio was predicted to increase from 13.3 physicians per 100,000 population to 15.7 physicians per 100,000 population. Anesthesiology The Trend Scenario forecast a 32 percent increase in the demand for Anesthesiologists between 2005 and 2020, slightly above the rate of growth in demand predicted for non-primary care physicians, with the demand for Anesthesiologists predicted to increase from 1,292 physicians in 2005 to 1,706 in 2020. Adjusting for the projected population growth in the state, the demand for Anesthesiologists expressed in terms of a physician to population ratio was predicted to increase from 12.7 physicians per 100,000 population to 15.9 physicians per 100,000 population. Radiology The Trend Scenario forecast a 32 percent increase in the demand for Radiologists between 2005 and 2020, slightly above the rate of growth in demand predicted for non-primary care physicians, with the demand for Radiologists predicted to increase from 1,375 physicians in 2005 to 1,809 in 2020. Adjusting for the projected population growth in the state, the demand for Radiologists expressed in terms of a physician to population ratio was predicted to increase from 13.5 physicians per 100,000 population to 16.9 physicians per 100,000 population.
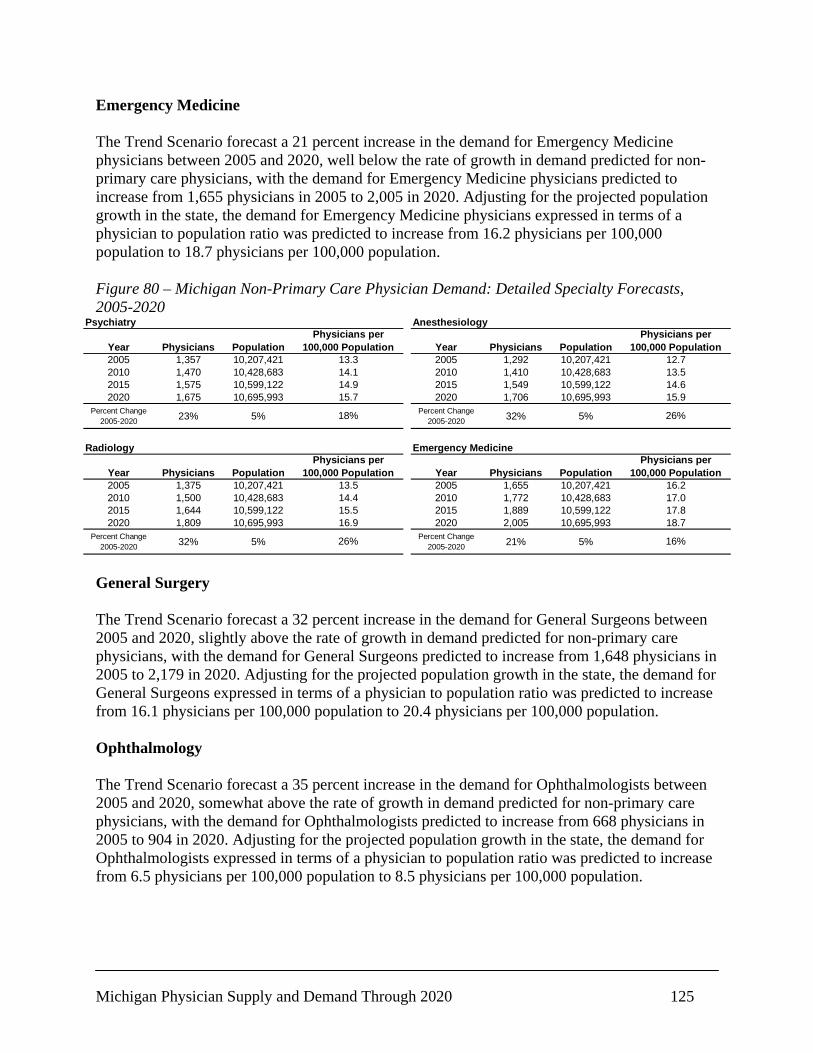
Michigan Physician Supply and Demand Through 2020 125
Emergency Medicine The Trend Scenario forecast a 21 percent increase in the demand for Emergency Medicine physicians between 2005 and 2020, well below the rate of growth in demand predicted for non-primary care physicians, with the demand for Emergency Medicine physicians predicted to increase from 1,655 physicians in 2005 to 2,005 in 2020. Adjusting for the projected population growth in the state, the demand for Emergency Medicine physicians expressed in terms of a physician to population ratio was predicted to increase from 16.2 physicians per 100,000 population to 18.7 physicians per 100,000 population. Figure 80 – Michigan Non-Primary Care Physician Demand: Detailed Specialty Forecasts, 2005-2020
Psychiatry
Year Physicians Population2005 1,357 10,207,4212010 1,470 10,428,6832015 1,575 10,599,1222020 1,675 10,695,993
Percent Change 2005-2020 23% 5%
15.7
18%
Physicians per 100,000 Population
13.314.114.9
Anesthesiology
Year Physicians Population2005 1,292 10,207,4212010 1,410 10,428,6832015 1,549 10,599,1222020 1,706 10,695,993
Percent Change 2005-2020 32% 5% 26%
14.615.9
Physicians per 100,000 Population
12.713.5
Radiology
Year Physicians Population2005 1,375 10,207,4212010 1,500 10,428,6832015 1,644 10,599,1222020 1,809 10,695,993
Percent Change 2005-2020 32% 5% 26%
15.516.9
13.514.4
Physicians per 100,000 Population
Emergency Medicine
Year Physicians Population2005 1,655 10,207,4212010 1,772 10,428,6832015 1,889 10,599,1222020 2,005 10,695,993
Percent Change 2005-2020 21% 5% 16%
17.818.7
Physicians per 100,000 Population
16.217.0
General Surgery The Trend Scenario forecast a 32 percent increase in the demand for General Surgeons between 2005 and 2020, slightly above the rate of growth in demand predicted for non-primary care physicians, with the demand for General Surgeons predicted to increase from 1,648 physicians in 2005 to 2,179 in 2020. Adjusting for the projected population growth in the state, the demand for General Surgeons expressed in terms of a physician to population ratio was predicted to increase from 16.1 physicians per 100,000 population to 20.4 physicians per 100,000 population. Ophthalmology The Trend Scenario forecast a 35 percent increase in the demand for Ophthalmologists between 2005 and 2020, somewhat above the rate of growth in demand predicted for non-primary care physicians, with the demand for Ophthalmologists predicted to increase from 668 physicians in 2005 to 904 in 2020. Adjusting for the projected population growth in the state, the demand for Ophthalmologists expressed in terms of a physician to population ratio was predicted to increase from 6.5 physicians per 100,000 population to 8.5 physicians per 100,000 population.

Michigan Physician Supply and Demand Through 2020 126
Otolaryngology The Trend Scenario forecast a 26 percent increase in the demand for Otolaryngologists between 2005 and 2020, slightly below the rate of growth in demand predicted for non-primary care physicians, with the demand for Otolaryngologists predicted to increase from 317 physicians in 2005 to 399 in 2020. Adjusting for the projected population growth in the state, the demand for Otolaryngologists expressed in terms of a physician to population ratio was predicted to increase from 3.1 physicians per 100,000 population to 3.7 physicians per 100,000 population. Orthopedic Surgery The Trend Scenario forecast a 31 percent increase in the demand for Orthopedic Surgeons between 2005 and 2020, slightly above the rate of growth in demand predicted for non-primary care physicians, with the demand for Orthopedic Surgeons predicted to increase from 844 physicians in 2005 to 1,102 in 2020. Adjusting for the projected population growth in the state, the demand for Orthopedic Surgeons expressed in terms of a physician to population ratio was predicted to increase from 8.3 physicians per 100,000 population to 10.3 physicians per 100,000 population. Figure 81 – Michigan Non-Primary Care Physician Demand: Detailed Specialty Forecasts, 2005-2020
General Surgery
Year Physicians Population2005 1,648 10,207,4212010 1,809 10,428,6832015 1,989 10,599,1222020 2,179 10,695,993
Percent Change 2005-2020 32% 5%
20.4
26%
Physicians per 100,000 Population
16.117.318.8
Ophthalmology
Year Physicians Population2005 668 10,207,4212010 734 10,428,6832015 814 10,599,1222020 904 10,695,993
Percent Change 2005-2020 35% 5%
7.78.5
6.57.0
Physicians per 100,000 Population
29%
Otolaryngology
Year Physicians Population2005 317 10,207,4212010 343 10,428,6832015 370 10,599,1222020 399 10,695,993
Percent Change 2005-2020 26% 5%
Physicians per 100,000 Population
3.13.33.53.7
20%
Orthopedic Surgery
Year Physicians Population2005 844 10,207,4212010 921 10,428,6832015 1,007 10,599,1222020 1,102 10,695,993
Percent Change 2005-2020 31% 5%
Physicians per 100,000 Population
8.38.8
25%
9.510.3
Urology The Trend Scenario forecast a 37 percent increase in the demand for Urologists between 2005 and 2020, well above the rate of growth in demand predicted for non-primary care physicians, with the demand for Urologists predicted to increase from 375 physicians in 2005 to 512 in 2020. Adjusting for the projected population growth in the state, the demand for Urologists expressed in terms of a physician to population ratio was predicted to increase from 3.7 physicians per 100,000 population to 4.8 physicians per 100,000 population.
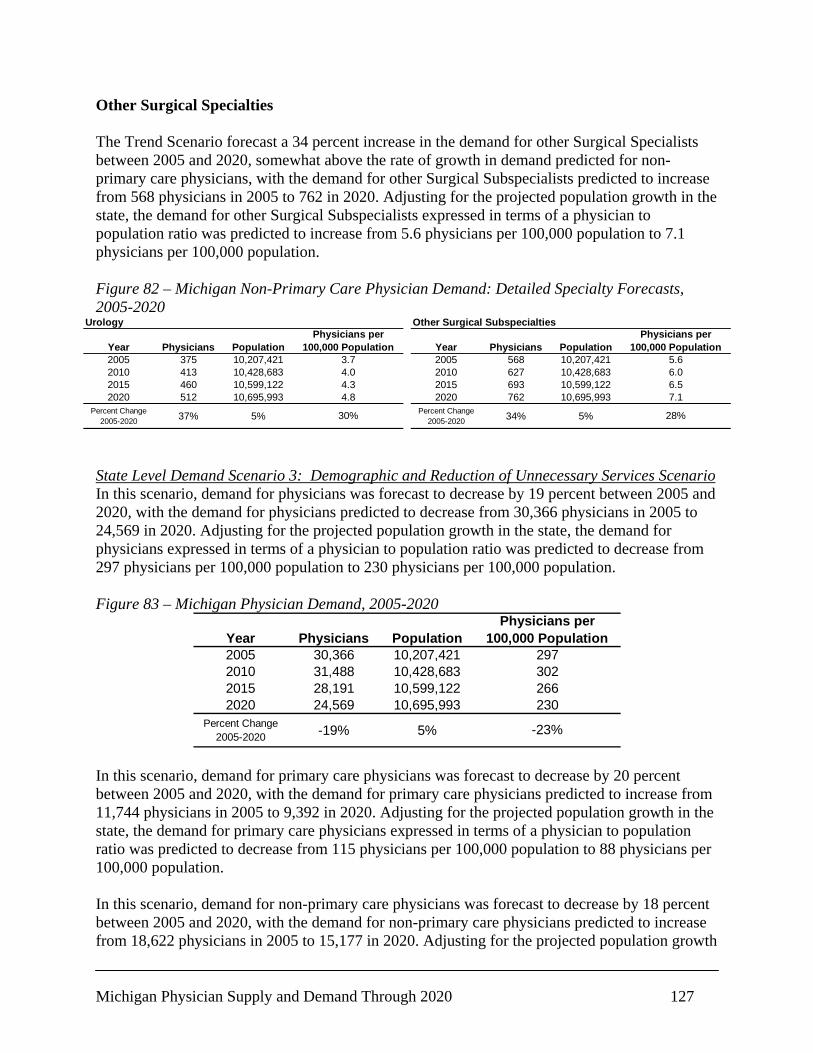
Michigan Physician Supply and Demand Through 2020 127
Other Surgical Specialties The Trend Scenario forecast a 34 percent increase in the demand for other Surgical Specialists between 2005 and 2020, somewhat above the rate of growth in demand predicted for non-primary care physicians, with the demand for other Surgical Subspecialists predicted to increase from 568 physicians in 2005 to 762 in 2020. Adjusting for the projected population growth in the state, the demand for other Surgical Subspecialists expressed in terms of a physician to population ratio was predicted to increase from 5.6 physicians per 100,000 population to 7.1 physicians per 100,000 population. Figure 82 – Michigan Non-Primary Care Physician Demand: Detailed Specialty Forecasts, 2005-2020
Urology
Year Physicians Population2005 375 10,207,4212010 413 10,428,6832015 460 10,599,1222020 512 10,695,993
Percent Change 2005-2020 37% 5%
4.8
30%
Physicians per 100,000 Population
3.74.04.3
Other Surgical Subspecialties
Year Physicians Population2005 568 10,207,4212010 627 10,428,6832015 693 10,599,1222020 762 10,695,993
Percent Change 2005-2020 34% 5% 28%
6.57.1
Physicians per 100,000 Population
5.66.0
State Level Demand Scenario 3: Demographic and Reduction of Unnecessary Services Scenario In this scenario, demand for physicians was forecast to decrease by 19 percent between 2005 and 2020, with the demand for physicians predicted to decrease from 30,366 physicians in 2005 to 24,569 in 2020. Adjusting for the projected population growth in the state, the demand for physicians expressed in terms of a physician to population ratio was predicted to decrease from 297 physicians per 100,000 population to 230 physicians per 100,000 population. Figure 83 – Michigan Physician Demand, 2005-2020
Year Physicians Population2005 30,366 10,207,4212010 31,488 10,428,6832015 28,191 10,599,1222020 24,569 10,695,993
Percent Change 2005-2020 -19% 5%
230
-23%
Physicians per 100,000 Population
297302266
In this scenario, demand for primary care physicians was forecast to decrease by 20 percent between 2005 and 2020, with the demand for primary care physicians predicted to increase from 11,744 physicians in 2005 to 9,392 in 2020. Adjusting for the projected population growth in the state, the demand for primary care physicians expressed in terms of a physician to population ratio was predicted to decrease from 115 physicians per 100,000 population to 88 physicians per 100,000 population. In this scenario, demand for non-primary care physicians was forecast to decrease by 18 percent between 2005 and 2020, with the demand for non-primary care physicians predicted to increase from 18,622 physicians in 2005 to 15,177 in 2020. Adjusting for the projected population growth
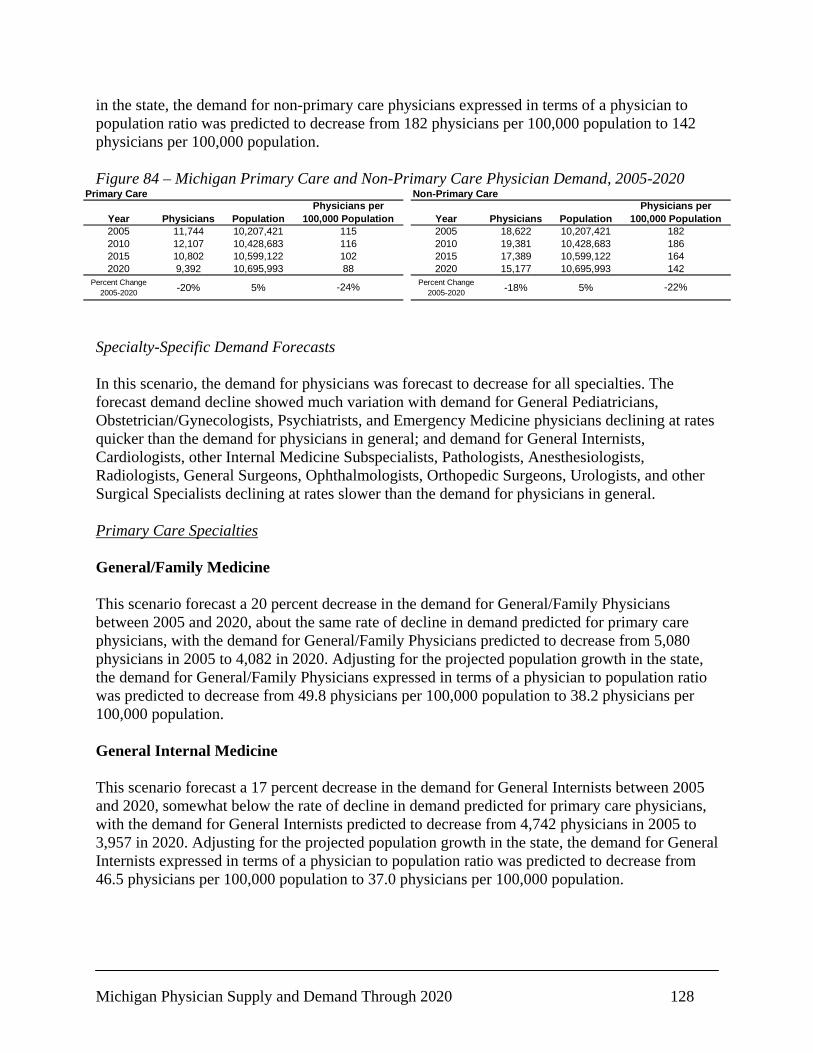
Michigan Physician Supply and Demand Through 2020 128
in the state, the demand for non-primary care physicians expressed in terms of a physician to population ratio was predicted to decrease from 182 physicians per 100,000 population to 142 physicians per 100,000 population. Figure 84 – Michigan Primary Care and Non-Primary Care Physician Demand, 2005-2020
Primary Care
Year Physicians Population2005 11,744 10,207,4212010 12,107 10,428,6832015 10,802 10,599,1222020 9,392 10,695,993
Percent Change 2005-2020 -20% 5%
88
-24%
Physicians per 100,000 Population
115116102
Non-Primary Care
Year Physicians Population2005 18,622 10,207,4212010 19,381 10,428,6832015 17,389 10,599,1222020 15,177 10,695,993
Percent Change 2005-2020 -18% 5%
Physicians per 100,000 Population
-22%
164142
182186
Specialty-Specific Demand Forecasts In this scenario, the demand for physicians was forecast to decrease for all specialties. The forecast demand decline showed much variation with demand for General Pediatricians, Obstetrician/Gynecologists, Psychiatrists, and Emergency Medicine physicians declining at rates quicker than the demand for physicians in general; and demand for General Internists, Cardiologists, other Internal Medicine Subspecialists, Pathologists, Anesthesiologists, Radiologists, General Surgeons, Ophthalmologists, Orthopedic Surgeons, Urologists, and other Surgical Specialists declining at rates slower than the demand for physicians in general. Primary Care Specialties General/Family Medicine This scenario forecast a 20 percent decrease in the demand for General/Family Physicians between 2005 and 2020, about the same rate of decline in demand predicted for primary care physicians, with the demand for General/Family Physicians predicted to decrease from 5,080 physicians in 2005 to 4,082 in 2020. Adjusting for the projected population growth in the state, the demand for General/Family Physicians expressed in terms of a physician to population ratio was predicted to decrease from 49.8 physicians per 100,000 population to 38.2 physicians per 100,000 population. General Internal Medicine This scenario forecast a 17 percent decrease in the demand for General Internists between 2005 and 2020, somewhat below the rate of decline in demand predicted for primary care physicians, with the demand for General Internists predicted to decrease from 4,742 physicians in 2005 to 3,957 in 2020. Adjusting for the projected population growth in the state, the demand for General Internists expressed in terms of a physician to population ratio was predicted to decrease from 46.5 physicians per 100,000 population to 37.0 physicians per 100,000 population.
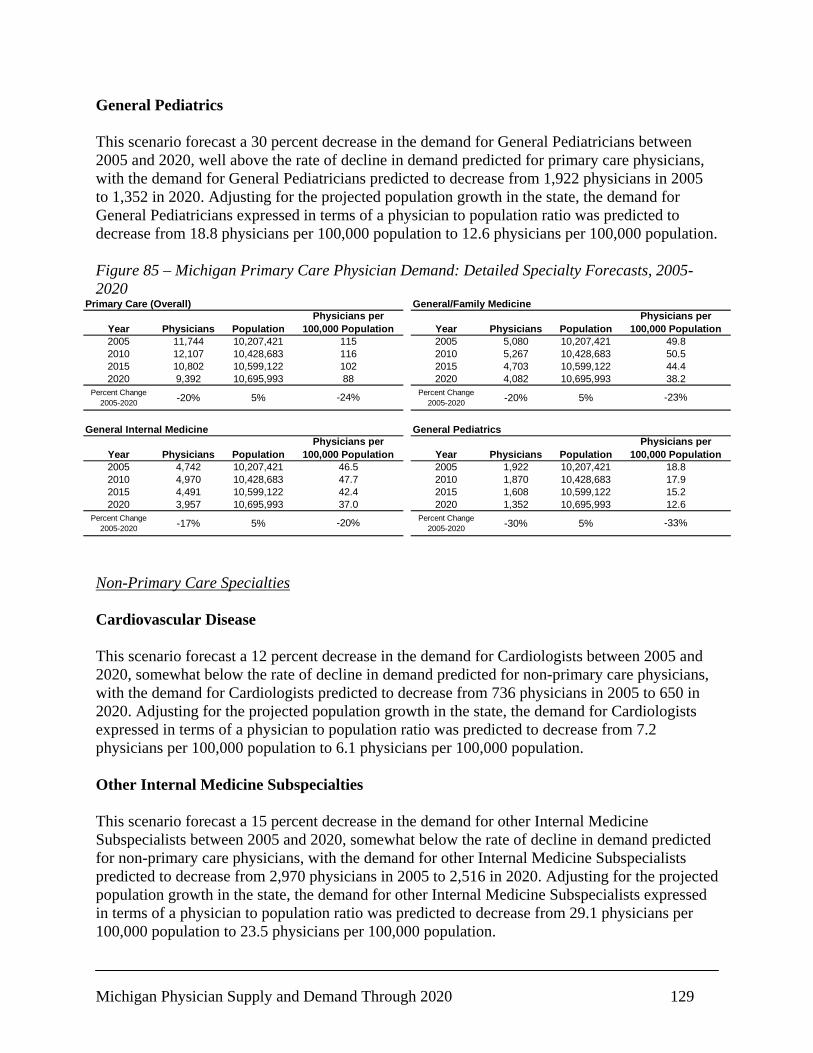
Michigan Physician Supply and Demand Through 2020 129
General Pediatrics This scenario forecast a 30 percent decrease in the demand for General Pediatricians between 2005 and 2020, well above the rate of decline in demand predicted for primary care physicians, with the demand for General Pediatricians predicted to decrease from 1,922 physicians in 2005 to 1,352 in 2020. Adjusting for the projected population growth in the state, the demand for General Pediatricians expressed in terms of a physician to population ratio was predicted to decrease from 18.8 physicians per 100,000 population to 12.6 physicians per 100,000 population. Figure 85 – Michigan Primary Care Physician Demand: Detailed Specialty Forecasts, 2005-2020
Primary Care (Overall)
Year Physicians Population2005 11,744 10,207,4212010 12,107 10,428,6832015 10,802 10,599,1222020 9,392 10,695,993
Percent Change 2005-2020 -20% 5%
88
-24%
Physicians per 100,000 Population
115116102
General/Family Medicine
Year Physicians Population2005 5,080 10,207,4212010 5,267 10,428,6832015 4,703 10,599,1222020 4,082 10,695,993
Percent Change 2005-2020 -20% 5% -23%
44.438.2
Physicians per 100,000 Population
49.850.5
General Internal Medicine
Year Physicians Population2005 4,742 10,207,4212010 4,970 10,428,6832015 4,491 10,599,1222020 3,957 10,695,993
Percent Change 2005-2020 -17% 5%
46.547.7
Physicians per 100,000 Population
-20%
42.437.0
General Pediatrics
Year Physicians Population2005 1,922 10,207,4212010 1,870 10,428,6832015 1,608 10,599,1222020 1,352 10,695,993
Percent Change 2005-2020 -30% 5%
Physicians per 100,000 Population
18.817.9
-33%
15.212.6
Non-Primary Care Specialties Cardiovascular Disease This scenario forecast a 12 percent decrease in the demand for Cardiologists between 2005 and 2020, somewhat below the rate of decline in demand predicted for non-primary care physicians, with the demand for Cardiologists predicted to decrease from 736 physicians in 2005 to 650 in 2020. Adjusting for the projected population growth in the state, the demand for Cardiologists expressed in terms of a physician to population ratio was predicted to decrease from 7.2 physicians per 100,000 population to 6.1 physicians per 100,000 population. Other Internal Medicine Subspecialties This scenario forecast a 15 percent decrease in the demand for other Internal Medicine Subspecialists between 2005 and 2020, somewhat below the rate of decline in demand predicted for non-primary care physicians, with the demand for other Internal Medicine Subspecialists predicted to decrease from 2,970 physicians in 2005 to 2,516 in 2020. Adjusting for the projected population growth in the state, the demand for other Internal Medicine Subspecialists expressed in terms of a physician to population ratio was predicted to decrease from 29.1 physicians per 100,000 population to 23.5 physicians per 100,000 population.
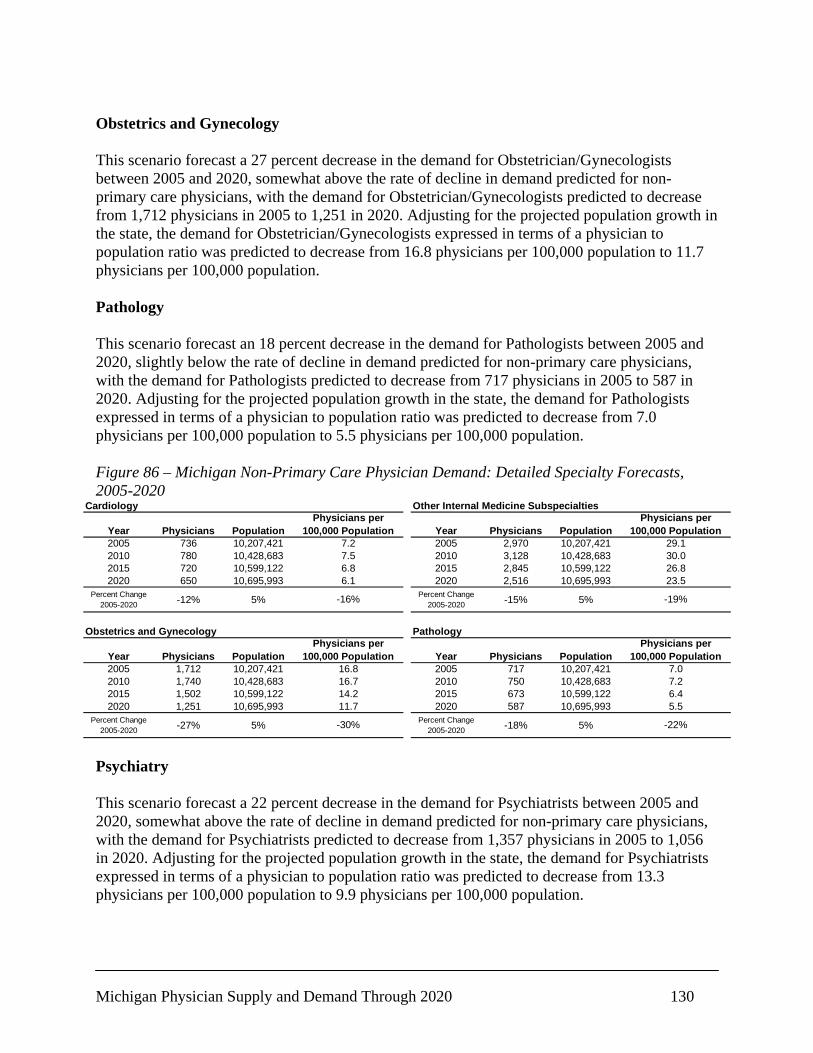
Michigan Physician Supply and Demand Through 2020 130
Obstetrics and Gynecology This scenario forecast a 27 percent decrease in the demand for Obstetrician/Gynecologists between 2005 and 2020, somewhat above the rate of decline in demand predicted for non-primary care physicians, with the demand for Obstetrician/Gynecologists predicted to decrease from 1,712 physicians in 2005 to 1,251 in 2020. Adjusting for the projected population growth in the state, the demand for Obstetrician/Gynecologists expressed in terms of a physician to population ratio was predicted to decrease from 16.8 physicians per 100,000 population to 11.7 physicians per 100,000 population. Pathology This scenario forecast an 18 percent decrease in the demand for Pathologists between 2005 and 2020, slightly below the rate of decline in demand predicted for non-primary care physicians, with the demand for Pathologists predicted to decrease from 717 physicians in 2005 to 587 in 2020. Adjusting for the projected population growth in the state, the demand for Pathologists expressed in terms of a physician to population ratio was predicted to decrease from 7.0 physicians per 100,000 population to 5.5 physicians per 100,000 population. Figure 86 – Michigan Non-Primary Care Physician Demand: Detailed Specialty Forecasts, 2005-2020
Cardiology
Year Physicians Population2005 736 10,207,4212010 780 10,428,6832015 720 10,599,1222020 650 10,695,993
Percent Change 2005-2020 -12% 5%
6.1
-16%
Physicians per 100,000 Population
7.27.56.8
Other Internal Medicine Subspecialties
Year Physicians Population2005 2,970 10,207,4212010 3,128 10,428,6832015 2,845 10,599,1222020 2,516 10,695,993
Percent Change 2005-2020 -15% 5%
Physicians per 100,000 Population
-19%
26.823.5
29.130.0
Obstetrics and Gynecology
Year Physicians Population2005 1,712 10,207,4212010 1,740 10,428,6832015 1,502 10,599,1222020 1,251 10,695,993
Percent Change 2005-2020 -27% 5%
11.7
-30%
Physicians per 100,000 Population
16.816.714.2
Pathology
Year Physicians Population2005 717 10,207,4212010 750 10,428,6832015 673 10,599,1222020 587 10,695,993
Percent Change 2005-2020 -18% 5%
Physicians per 100,000 Population
7.07.2
-22%
6.45.5
Psychiatry This scenario forecast a 22 percent decrease in the demand for Psychiatrists between 2005 and 2020, somewhat above the rate of decline in demand predicted for non-primary care physicians, with the demand for Psychiatrists predicted to decrease from 1,357 physicians in 2005 to 1,056 in 2020. Adjusting for the projected population growth in the state, the demand for Psychiatrists expressed in terms of a physician to population ratio was predicted to decrease from 13.3 physicians per 100,000 population to 9.9 physicians per 100,000 population.

Michigan Physician Supply and Demand Through 2020 131
Anesthesiology This scenario forecast a 17 percent decrease in the demand for Anesthesiologists between 2005 and 2020, somewhat below the rate of decline in demand predicted for non-primary care physicians, with the demand for Anesthesiologists predicted to decrease from 1,292 physicians in 2005 to 1,075 in 2020. Adjusting for the projected population growth in the state, the demand for Anesthesiologists expressed in terms of a physician to population ratio was predicted to decrease from 12.7 physicians per 100,000 population to 10.1 physicians per 100,000 population. Radiology This scenario forecast a 17 percent decrease in the demand for Radiologists between 2005 and 2020, somewhat below the rate of decline in demand predicted for non-primary care physicians, with the demand for Radiologists predicted to decrease from 1,375 physicians in 2005 to 1,140 in 2020. Adjusting for the projected population growth in the state, the demand for Radiologists expressed in terms of a physician to population ratio was predicted to decrease from 13.5 physicians per 100,000 population to 10.7 physicians per 100,000 population. Emergency Medicine This scenario forecast a 24 percent decrease in the demand for Emergency Medicine physicians between 2005 and 2020, somewhat above the rate of decline in demand predicted for non-primary care physicians, with the demand for Emergency Medicine physicians predicted to decrease from 1,655 physicians in 2005 to 1,264 in 2020. Adjusting for the projected population growth in the state, the demand for Emergency Medicine physicians expressed in terms of a physician to population ratio was predicted to decrease from 16.2 physicians per 100,000 population to 11.8 physicians per 100,000 population. Figure 87 – Michigan Non-Primary Care Physician Demand: Detailed Specialty Forecasts, 2005-2020
Psychiatry
Year Physicians Population2005 1,357 10,207,4212010 1,403 10,428,6832015 1,237 10,599,1222020 1,056 10,695,993
Percent Change 2005-2020 -22% 5%
Physicians per 100,000 Population
13.313.411.79.9
-26%
Anesthesiology
Year Physicians Population2005 1,292 10,207,4212010 1,346 10,428,6832015 1,217 10,599,1222020 1,075 10,695,993
Percent Change 2005-2020 -17% 5% -21%
11.510.1
Physicians per 100,000 Population
12.712.9
Radiology
Year Physicians Population2005 1,375 10,207,4212010 1,431 10,428,6832015 1,291 10,599,1222020 1,140 10,695,993
Percent Change 2005-2020 -17% 5%
13.513.7
Physicians per 100,000 Population
-21%
12.210.7
Emergency Medicine
Year Physicians Population2005 1,655 10,207,4212010 1,691 10,428,6832015 1,484 10,599,1222020 1,264 10,695,993
Percent Change 2005-2020 -24% 5%
Physicians per 100,000 Population
-27%
14.011.8
16.216.2
Michigan Physician Supply and Demand Through 2020 132
General Surgery This scenario forecast a 17 percent decrease in the demand for General Surgeons between 2005 and 2020, slightly below the rate of decline in demand predicted for non-primary care physicians, with the demand for General Surgeons predicted to decrease from 1,648 physicians in 2005 to 1,373 in 2020. Adjusting for the projected population growth in the state, the demand for General Surgeons expressed in terms of a physician to population ratio was predicted to decrease from 16.1 physicians per 100,000 population to 12.8 physicians per 100,000 population. Ophthalmology This scenario forecast a 15 percent decrease in the demand for Ophthalmologists between 2005 and 2020, somewhat below the rate of decline in demand predicted for non-primary care physicians, with the demand for Ophthalmologists predicted to decrease from 668 physicians in 2005 to 570 in 2020. Adjusting for the projected population growth in the state, the demand for Ophthalmologists expressed in terms of a physician to population ratio was predicted to decrease from 6.5 physicians per 100,000 population to 5.3 physicians per 100,000 population. Otolaryngology This scenario forecast a 21 percent decrease in the demand for Otolaryngologists between 2005 and 2020, slightly above the rate of decline in demand predicted for non-primary care physicians, with the demand for Otolaryngologists predicted to decrease from 317 physicians in 2005 to 251 in 2020. Adjusting for the projected population growth in the state, the demand for Otolaryngologists expressed in terms of a physician to population ratio was predicted to decrease from 3.1 physicians per 100,000 population to 2.3 physicians per 100,000 population. Orthopedic Surgery This scenario forecast an 18 percent decrease in the demand for Orthopedic Surgeons between 2005 and 2020, slightly below the rate of decline in demand predicted for non-primary care physicians, with the demand for Orthopedic Surgeons predicted to decrease from 844 physicians in 2005 to 695 in 2020. Adjusting for the projected population growth in the state, the demand for Orthopedic Surgeons expressed in terms of a physician to population ratio was predicted to decrease from 8.3 physicians per 100,000 population to 6.5 physicians per 100,000 population.

Michigan Physician Supply and Demand Through 2020 133
Figure 88 – Michigan Non-Primary Care Physician Demand: Detailed Specialty Forecasts, 2005-2020
General Surgery
Year Physicians Population2005 1,648 10,207,4212010 1,726 10,428,6832015 1,562 10,599,1222020 1,373 10,695,993
Percent Change 2005-2020 -17% 5%
12.8
-20%
Physicians per 100,000 Population
16.116.614.7
Ophthalmology
Year Physicians Population2005 668 10,207,4212010 701 10,428,6832015 639 10,599,1222020 570 10,695,993
Percent Change 2005-2020 -15% 5%
Physicians per 100,000 Population
-19%
6.05.3
6.56.7
Otolaryngology
Year Physicians Population2005 317 10,207,4212010 327 10,428,6832015 290 10,599,1222020 251 10,695,993
Percent Change 2005-2020 -21% 5%
2.3
-24%
Physicians per 100,000 Population
3.13.12.7
Orthopedic Surgery
Year Physicians Population2005 844 10,207,4212010 878 10,428,6832015 791 10,599,1222020 695 10,695,993
Percent Change 2005-2020 -18% 5%
Physicians per 100,000 Population
8.38.4
-21%
7.56.5
Figure 89 – Michigan Non-Primary Care Physician Demand: Detailed Specialty Forecasts, 2005-2020
Urology
Year Physicians Population2005 375 10,207,4212010 394 10,428,6832015 361 10,599,1222020 323 10,695,993
Percent Change 2005-2020 -14% 5%
3.0
-18%
Physicians per 100,000 Population
3.73.83.4
Other Surgical Subspecialties
Year Physicians Population2005 568 10,207,4212010 598 10,428,6832015 544 10,599,1222020 480 10,695,993
Percent Change 2005-2020 -15% 5% -19%
5.14.5
Physicians per 100,000 Population
5.65.7
Urology This scenario forecast a 14 percent decrease in the demand for Urologists between 2005 and 2020, well below the rate of decline in demand predicted for non-primary care physicians, with the demand for Urologists predicted to decrease from 375 physicians in 2005 to 323 in 2020. Adjusting for the projected population growth in the state, the demand for Urologists expressed in terms of a physician to population ratio was predicted to decrease from 3.7 physicians per 100,000 population to 3.0 physicians per 100,000 population. Other Surgical Specialties This scenario forecast a 15 percent decrease in the demand for other Surgical Specialists between 2005 and 2020, somewhat below the rate of decline in demand predicted for non-primary care physicians, with the demand for other Surgical Subspecialists predicted to decrease from 568 physicians in 2005 to 480 in 2020. Adjusting for the projected population growth in the state, the demand for other Surgical Subspecialists expressed in terms of a physician to population ratio was predicted to decrease from 5.6 physicians per 100,000 population to 4.5 physicians per 100,000 population.
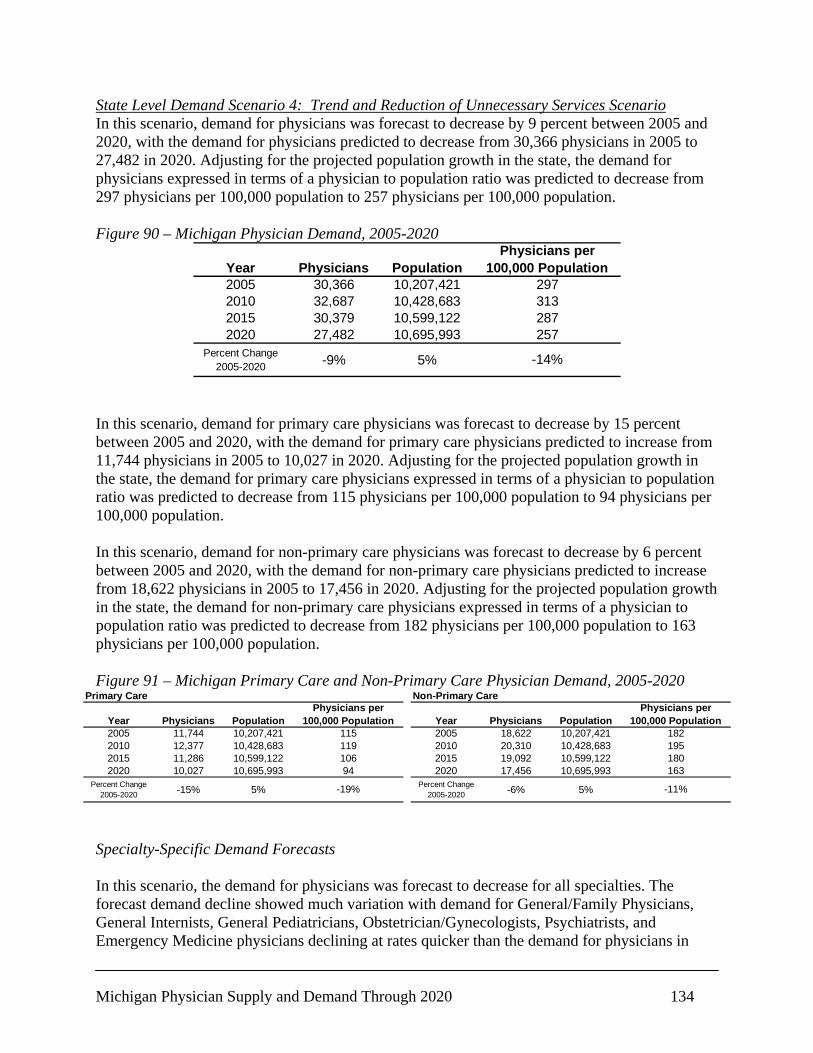
Michigan Physician Supply and Demand Through 2020 134
State Level Demand Scenario 4: Trend and Reduction of Unnecessary Services Scenario In this scenario, demand for physicians was forecast to decrease by 9 percent between 2005 and 2020, with the demand for physicians predicted to decrease from 30,366 physicians in 2005 to 27,482 in 2020. Adjusting for the projected population growth in the state, the demand for physicians expressed in terms of a physician to population ratio was predicted to decrease from 297 physicians per 100,000 population to 257 physicians per 100,000 population. Figure 90 – Michigan Physician Demand, 2005-2020
Year Physicians Population2005 30,366 10,207,4212010 32,687 10,428,6832015 30,379 10,599,1222020 27,482 10,695,993
Percent Change 2005-2020 -9% 5%
257
-14%
Physicians per 100,000 Population
297313287
In this scenario, demand for primary care physicians was forecast to decrease by 15 percent between 2005 and 2020, with the demand for primary care physicians predicted to increase from 11,744 physicians in 2005 to 10,027 in 2020. Adjusting for the projected population growth in the state, the demand for primary care physicians expressed in terms of a physician to population ratio was predicted to decrease from 115 physicians per 100,000 population to 94 physicians per 100,000 population. In this scenario, demand for non-primary care physicians was forecast to decrease by 6 percent between 2005 and 2020, with the demand for non-primary care physicians predicted to increase from 18,622 physicians in 2005 to 17,456 in 2020. Adjusting for the projected population growth in the state, the demand for non-primary care physicians expressed in terms of a physician to population ratio was predicted to decrease from 182 physicians per 100,000 population to 163 physicians per 100,000 population. Figure 91 – Michigan Primary Care and Non-Primary Care Physician Demand, 2005-2020
Primary Care
Year Physicians Population2005 11,744 10,207,4212010 12,377 10,428,6832015 11,286 10,599,1222020 10,027 10,695,993
Percent Change 2005-2020 -15% 5%
94
-19%
Physicians per 100,000 Population
115119106
Non-Primary Care
Year Physicians Population2005 18,622 10,207,4212010 20,310 10,428,6832015 19,092 10,599,1222020 17,456 10,695,993
Percent Change 2005-2020 -6% 5%
Physicians per 100,000 Population
-11%
180163
182195
Specialty-Specific Demand Forecasts In this scenario, the demand for physicians was forecast to decrease for all specialties. The forecast demand decline showed much variation with demand for General/Family Physicians, General Internists, General Pediatricians, Obstetrician/Gynecologists, Psychiatrists, and Emergency Medicine physicians declining at rates quicker than the demand for physicians in
Michigan Physician Supply and Demand Through 2020 135
general; and demand for Cardiologists, other Internal Medicine Subspecialists, Pathologists, Anesthesiologists, Radiologists, General Surgeons, Ophthalmologists, Orthopedic Surgeons, Otolaryngologists, Urologists, and other Surgical Specialists declining at rates slower than the demand for physicians in general. Primary Care Specialties General/Family Medicine This scenario forecast a 14 percent decrease in the demand for General/Family Physicians between 2005 and 2020, about the same rate of decline in demand predicted for primary care physicians, with the demand for General/Family Physicians predicted to decrease from 5,080 physicians in 2005 to 4,358 in 2020. Adjusting for the projected population growth in the state, the demand for General/Family Physicians expressed in terms of a physician to population ratio was predicted to decrease from 49.8 physicians per 100,000 population to 40.7 physicians per 100,000 population. General Internal Medicine This scenario forecast an 11 percent decrease in the demand for General Internists between 2005 and 2020, somewhat below the rate of decline in demand predicted for primary care physicians, with the demand for General Internists predicted to decrease from 4,742 physicians in 2005 to 4,225 in 2020. Adjusting for the projected population growth in the state, the demand for General Internists expressed in terms of a physician to population ratio was predicted to decrease from 46.5 physicians per 100,000 population to 39.5 physicians per 100,000 population. General Pediatrics This scenario forecast a 25 percent decrease in the demand for General Pediatricians between 2005 and 2020, well above the rate of decline in demand predicted for primary care physicians, with the demand for General Pediatricians predicted to decrease from 1,922 physicians in 2005 to 1,444 in 2020. Adjusting for the projected population growth in the state, the demand for General Pediatricians expressed in terms of a physician to population ratio was predicted to decrease from 18.8 physicians per 100,000 population to 13.5 physicians per 100,000 population.
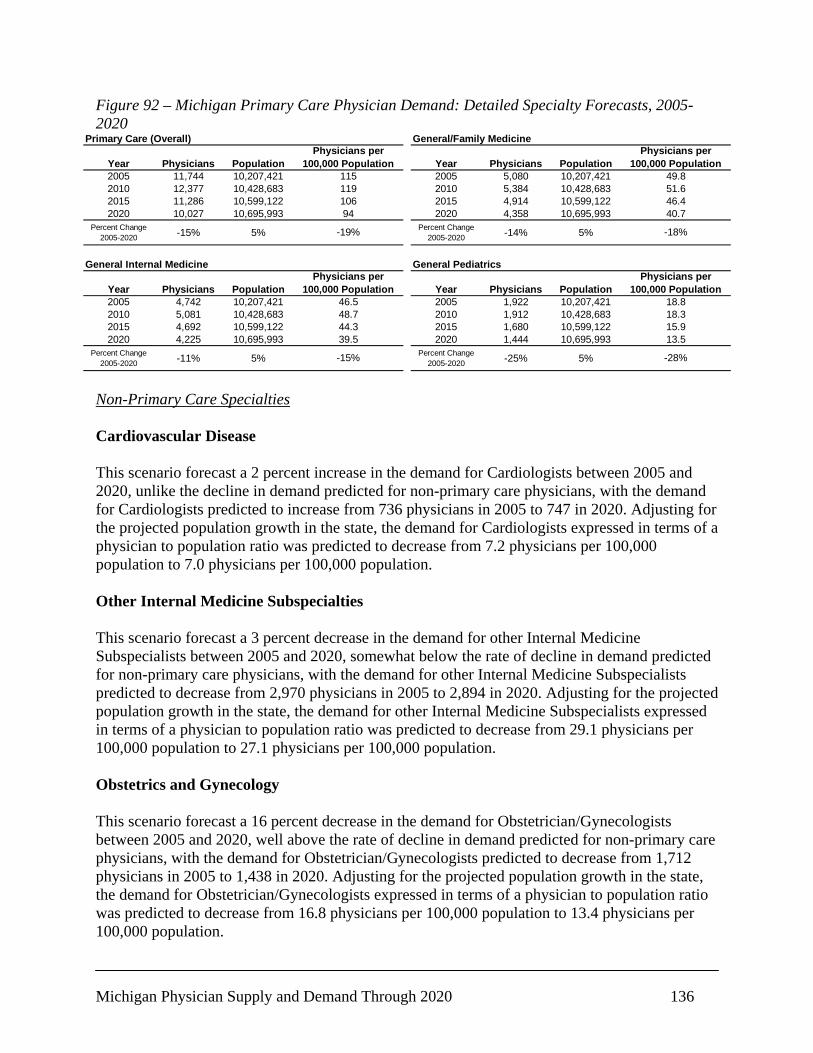
Michigan Physician Supply and Demand Through 2020 136
Figure 92 – Michigan Primary Care Physician Demand: Detailed Specialty Forecasts, 2005-2020
Primary Care (Overall)
Year Physicians Population2005 11,744 10,207,4212010 12,377 10,428,6832015 11,286 10,599,1222020 10,027 10,695,993
Percent Change 2005-2020 -15% 5%
94
-19%
Physicians per 100,000 Population
115119106
General/Family Medicine
Year Physicians Population2005 5,080 10,207,4212010 5,384 10,428,6832015 4,914 10,599,1222020 4,358 10,695,993
Percent Change 2005-2020 -14% 5% -18%
46.440.7
Physicians per 100,000 Population
49.851.6
General Internal Medicine
Year Physicians Population2005 4,742 10,207,4212010 5,081 10,428,6832015 4,692 10,599,1222020 4,225 10,695,993
Percent Change 2005-2020 -11% 5%
46.548.7
Physicians per 100,000 Population
-15%
44.339.5
General Pediatrics
Year Physicians Population2005 1,922 10,207,4212010 1,912 10,428,6832015 1,680 10,599,1222020 1,444 10,695,993
Percent Change 2005-2020 -25% 5%
Physicians per 100,000 Population
18.818.3
-28%
15.913.5
Non-Primary Care Specialties Cardiovascular Disease This scenario forecast a 2 percent increase in the demand for Cardiologists between 2005 and 2020, unlike the decline in demand predicted for non-primary care physicians, with the demand for Cardiologists predicted to increase from 736 physicians in 2005 to 747 in 2020. Adjusting for the projected population growth in the state, the demand for Cardiologists expressed in terms of a physician to population ratio was predicted to decrease from 7.2 physicians per 100,000 population to 7.0 physicians per 100,000 population. Other Internal Medicine Subspecialties This scenario forecast a 3 percent decrease in the demand for other Internal Medicine Subspecialists between 2005 and 2020, somewhat below the rate of decline in demand predicted for non-primary care physicians, with the demand for other Internal Medicine Subspecialists predicted to decrease from 2,970 physicians in 2005 to 2,894 in 2020. Adjusting for the projected population growth in the state, the demand for other Internal Medicine Subspecialists expressed in terms of a physician to population ratio was predicted to decrease from 29.1 physicians per 100,000 population to 27.1 physicians per 100,000 population. Obstetrics and Gynecology This scenario forecast a 16 percent decrease in the demand for Obstetrician/Gynecologists between 2005 and 2020, well above the rate of decline in demand predicted for non-primary care physicians, with the demand for Obstetrician/Gynecologists predicted to decrease from 1,712 physicians in 2005 to 1,438 in 2020. Adjusting for the projected population growth in the state, the demand for Obstetrician/Gynecologists expressed in terms of a physician to population ratio was predicted to decrease from 16.8 physicians per 100,000 population to 13.4 physicians per 100,000 population.
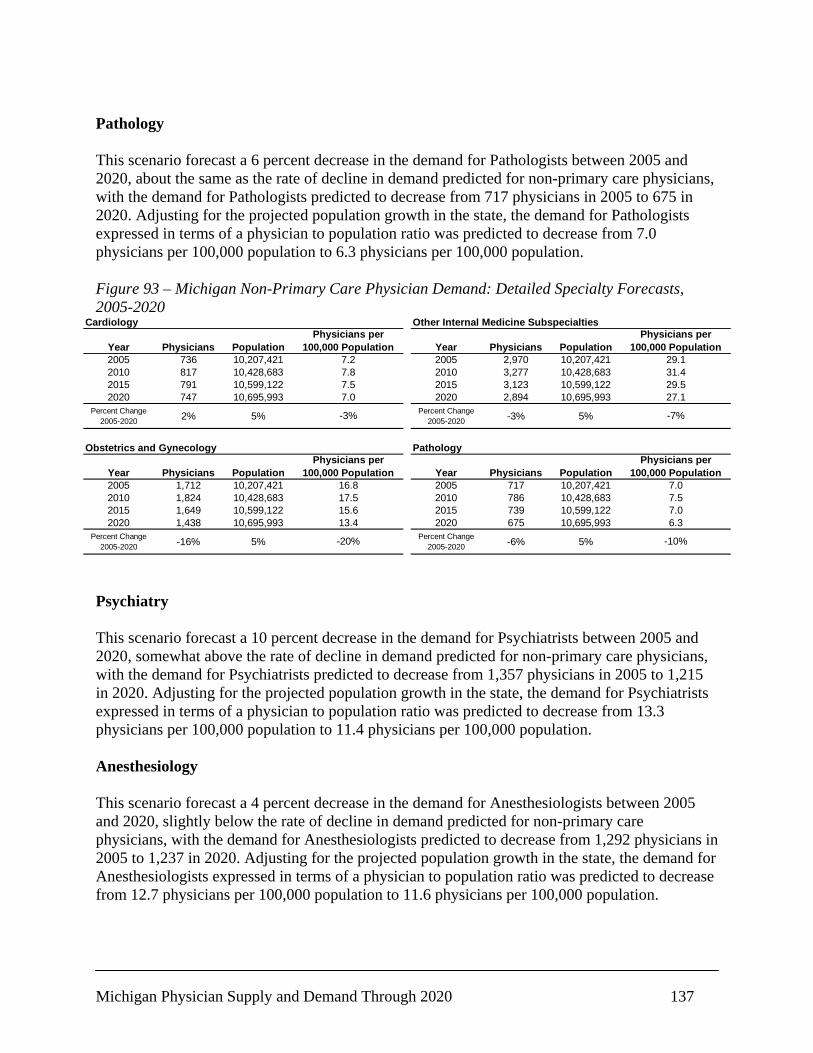
Michigan Physician Supply and Demand Through 2020 137
Pathology This scenario forecast a 6 percent decrease in the demand for Pathologists between 2005 and 2020, about the same as the rate of decline in demand predicted for non-primary care physicians, with the demand for Pathologists predicted to decrease from 717 physicians in 2005 to 675 in 2020. Adjusting for the projected population growth in the state, the demand for Pathologists expressed in terms of a physician to population ratio was predicted to decrease from 7.0 physicians per 100,000 population to 6.3 physicians per 100,000 population. Figure 93 – Michigan Non-Primary Care Physician Demand: Detailed Specialty Forecasts, 2005-2020
Cardiology
Year Physicians Population2005 736 10,207,4212010 817 10,428,6832015 791 10,599,1222020 747 10,695,993
Percent Change 2005-2020 2% 5%
7.0
-3%
Physicians per 100,000 Population
7.27.87.5
Other Internal Medicine Subspecialties
Year Physicians Population2005 2,970 10,207,4212010 3,277 10,428,6832015 3,123 10,599,1222020 2,894 10,695,993
Percent Change 2005-2020 -3% 5%
Physicians per 100,000 Population
-7%
29.527.1
29.131.4
Obstetrics and Gynecology
Year Physicians Population2005 1,712 10,207,4212010 1,824 10,428,6832015 1,649 10,599,1222020 1,438 10,695,993
Percent Change 2005-2020 -16% 5%
13.4
-20%
Physicians per 100,000 Population
16.817.515.6
Pathology
Year Physicians Population2005 717 10,207,4212010 786 10,428,6832015 739 10,599,1222020 675 10,695,993
Percent Change 2005-2020 -6% 5%
Physicians per 100,000 Population
7.07.5
-10%
7.06.3
Psychiatry This scenario forecast a 10 percent decrease in the demand for Psychiatrists between 2005 and 2020, somewhat above the rate of decline in demand predicted for non-primary care physicians, with the demand for Psychiatrists predicted to decrease from 1,357 physicians in 2005 to 1,215 in 2020. Adjusting for the projected population growth in the state, the demand for Psychiatrists expressed in terms of a physician to population ratio was predicted to decrease from 13.3 physicians per 100,000 population to 11.4 physicians per 100,000 population. Anesthesiology This scenario forecast a 4 percent decrease in the demand for Anesthesiologists between 2005 and 2020, slightly below the rate of decline in demand predicted for non-primary care physicians, with the demand for Anesthesiologists predicted to decrease from 1,292 physicians in 2005 to 1,237 in 2020. Adjusting for the projected population growth in the state, the demand for Anesthesiologists expressed in terms of a physician to population ratio was predicted to decrease from 12.7 physicians per 100,000 population to 11.6 physicians per 100,000 population.
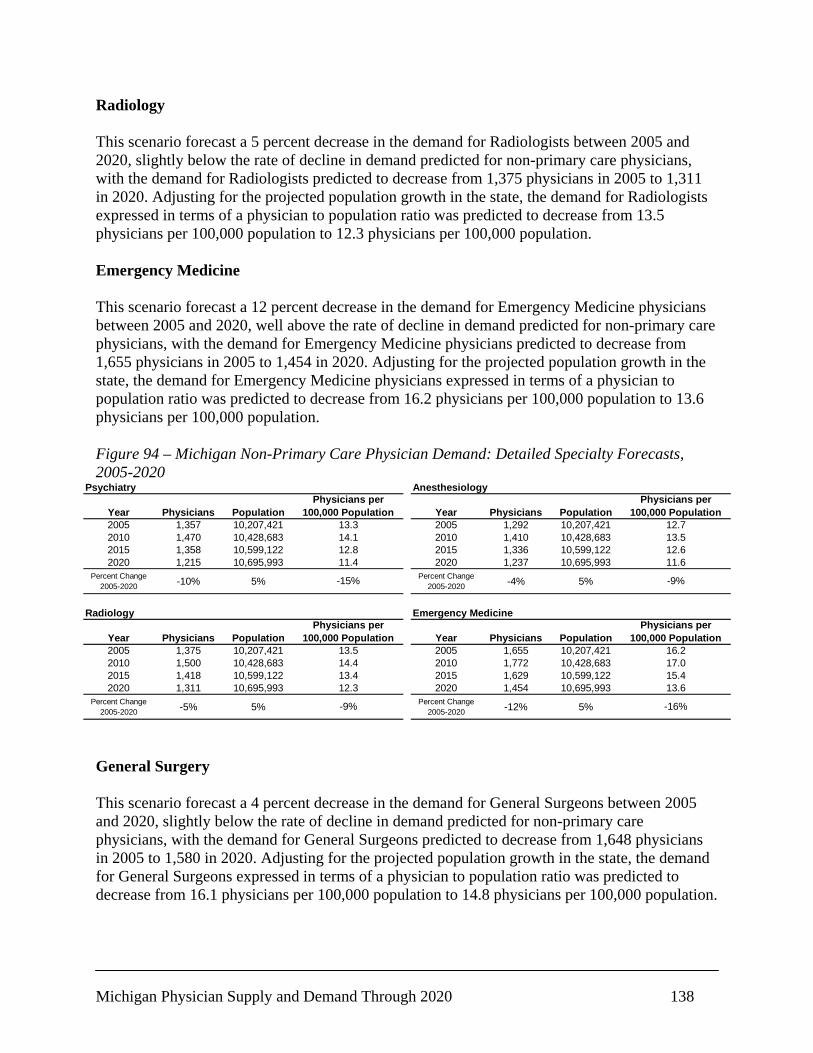
Michigan Physician Supply and Demand Through 2020 138
Radiology This scenario forecast a 5 percent decrease in the demand for Radiologists between 2005 and 2020, slightly below the rate of decline in demand predicted for non-primary care physicians, with the demand for Radiologists predicted to decrease from 1,375 physicians in 2005 to 1,311 in 2020. Adjusting for the projected population growth in the state, the demand for Radiologists expressed in terms of a physician to population ratio was predicted to decrease from 13.5 physicians per 100,000 population to 12.3 physicians per 100,000 population. Emergency Medicine This scenario forecast a 12 percent decrease in the demand for Emergency Medicine physicians between 2005 and 2020, well above the rate of decline in demand predicted for non-primary care physicians, with the demand for Emergency Medicine physicians predicted to decrease from 1,655 physicians in 2005 to 1,454 in 2020. Adjusting for the projected population growth in the state, the demand for Emergency Medicine physicians expressed in terms of a physician to population ratio was predicted to decrease from 16.2 physicians per 100,000 population to 13.6 physicians per 100,000 population. Figure 94 – Michigan Non-Primary Care Physician Demand: Detailed Specialty Forecasts, 2005-2020
Psychiatry
Year Physicians Population2005 1,357 10,207,4212010 1,470 10,428,6832015 1,358 10,599,1222020 1,215 10,695,993
Percent Change 2005-2020 -10% 5%
11.4
-15%
Physicians per 100,000 Population
13.314.112.8
Anesthesiology
Year Physicians Population2005 1,292 10,207,4212010 1,410 10,428,6832015 1,336 10,599,1222020 1,237 10,695,993
Percent Change 2005-2020 -4% 5% -9%
12.611.6
Physicians per 100,000 Population
12.713.5
Radiology
Year Physicians Population2005 1,375 10,207,4212010 1,500 10,428,6832015 1,418 10,599,1222020 1,311 10,695,993
Percent Change 2005-2020 -5% 5%
13.514.4
Physicians per 100,000 Population
-9%
13.412.3
Emergency Medicine
Year Physicians Population2005 1,655 10,207,4212010 1,772 10,428,6832015 1,629 10,599,1222020 1,454 10,695,993
Percent Change 2005-2020 -12% 5%
Physicians per 100,000 Population
16.217.0
-16%
15.413.6
General Surgery This scenario forecast a 4 percent decrease in the demand for General Surgeons between 2005 and 2020, slightly below the rate of decline in demand predicted for non-primary care physicians, with the demand for General Surgeons predicted to decrease from 1,648 physicians in 2005 to 1,580 in 2020. Adjusting for the projected population growth in the state, the demand for General Surgeons expressed in terms of a physician to population ratio was predicted to decrease from 16.1 physicians per 100,000 population to 14.8 physicians per 100,000 population.
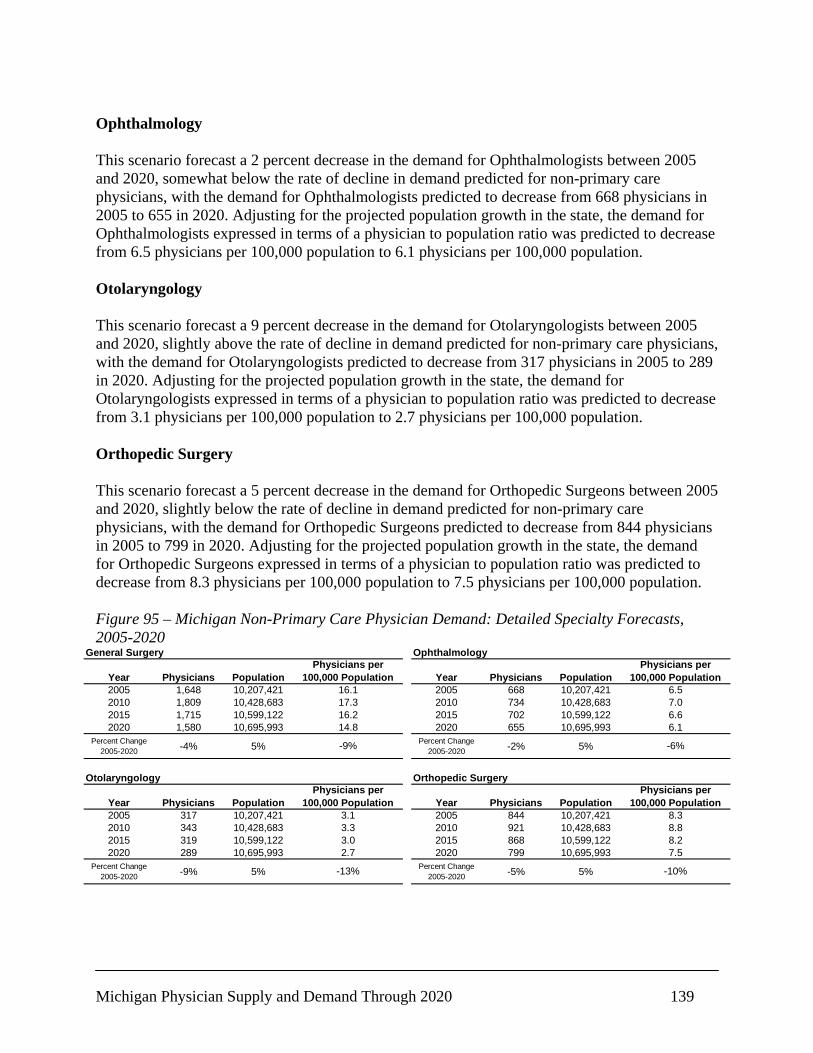
Michigan Physician Supply and Demand Through 2020 139
Ophthalmology This scenario forecast a 2 percent decrease in the demand for Ophthalmologists between 2005 and 2020, somewhat below the rate of decline in demand predicted for non-primary care physicians, with the demand for Ophthalmologists predicted to decrease from 668 physicians in 2005 to 655 in 2020. Adjusting for the projected population growth in the state, the demand for Ophthalmologists expressed in terms of a physician to population ratio was predicted to decrease from 6.5 physicians per 100,000 population to 6.1 physicians per 100,000 population. Otolaryngology This scenario forecast a 9 percent decrease in the demand for Otolaryngologists between 2005 and 2020, slightly above the rate of decline in demand predicted for non-primary care physicians, with the demand for Otolaryngologists predicted to decrease from 317 physicians in 2005 to 289 in 2020. Adjusting for the projected population growth in the state, the demand for Otolaryngologists expressed in terms of a physician to population ratio was predicted to decrease from 3.1 physicians per 100,000 population to 2.7 physicians per 100,000 population. Orthopedic Surgery This scenario forecast a 5 percent decrease in the demand for Orthopedic Surgeons between 2005 and 2020, slightly below the rate of decline in demand predicted for non-primary care physicians, with the demand for Orthopedic Surgeons predicted to decrease from 844 physicians in 2005 to 799 in 2020. Adjusting for the projected population growth in the state, the demand for Orthopedic Surgeons expressed in terms of a physician to population ratio was predicted to decrease from 8.3 physicians per 100,000 population to 7.5 physicians per 100,000 population. Figure 95 – Michigan Non-Primary Care Physician Demand: Detailed Specialty Forecasts, 2005-2020
General Surgery
Year Physicians Population2005 1,648 10,207,4212010 1,809 10,428,6832015 1,715 10,599,1222020 1,580 10,695,993
Percent Change 2005-2020 -4% 5%
14.8
-9%
Physicians per 100,000 Population
16.117.316.2
Ophthalmology
Year Physicians Population2005 668 10,207,4212010 734 10,428,6832015 702 10,599,1222020 655 10,695,993
Percent Change 2005-2020 -2% 5%
Physicians per 100,000 Population
-6%
6.66.1
6.57.0
Otolaryngology
Year Physicians Population2005 317 10,207,4212010 343 10,428,6832015 319 10,599,1222020 289 10,695,993
Percent Change 2005-2020 -9% 5%
2.7
-13%
Physicians per 100,000 Population
3.13.33.0
Orthopedic Surgery
Year Physicians Population2005 844 10,207,4212010 921 10,428,6832015 868 10,599,1222020 799 10,695,993
Percent Change 2005-2020 -5% 5%
Physicians per 100,000 Population
8.38.8
-10%
8.27.5

Michigan Physician Supply and Demand Through 2020 140
Urology This scenario forecast a 1 percent decrease in the demand for Urologists between 2005 and 2020, somewhat below the rate of decline in demand predicted for non-primary care physicians, with the demand for Urologists predicted to decrease from 375 physicians in 2005 to 371 in 2020. Adjusting for the projected population growth in the state, the demand for Urologists expressed in terms of a physician to population ratio was predicted to decrease slightly from 3.7 physicians per 100,000 population to 3.5 physicians per 100,000 population. Other Surgical Specialties This scenario forecast a 3 percent decrease in the demand for other Surgical Specialists between 2005 and 2020, slightly below the rate of decline in demand predicted for non-primary care physicians, with the demand for other Surgical Subspecialists predicted to decrease from 568 physicians in 2005 to 552 in 2020. Adjusting for the projected population growth in the state, the demand for other Surgical Subspecialists expressed in terms of a physician to population ratio was predicted to decrease from 5.6 physicians per 100,000 population to 5.2 physicians per 100,000 population. Figure 96 – Michigan Non-Primary Care Physician Demand: Detailed Specialty Forecasts, 2005-2020
Urology
Year Physicians Population2005 375 10,207,4212010 413 10,428,6832015 397 10,599,1222020 371 10,695,993
Percent Change 2005-2020 -1% 5%
3.5
-5%
Physicians per 100,000 Population
3.74.03.7
Other Surgical Subspecialties
Year Physicians Population2005 568 10,207,4212010 627 10,428,6832015 597 10,599,1222020 552 10,695,993
Percent Change 2005-2020 -3% 5% -7%
5.65.2
Physicians per 100,000 Population
5.66.0
Full Insurance Environment The demand forecasts in each scenario of the full insurance environment were very similar to those of the constant insurance environment. In fact, all of the predicted relative changes between 2005 and 2020 were the same within scenarios. For example, while the growth in non-primary care demand in the trend scenario of the constant insurance environment was 29 percent (p. 88, Figure 77), the growth in the same specialty group in the full insurance environment was also 29 percent (p. 110, Figure 105). As noted in the description of the full insurance environment, this environment increases the demand for physicians initially, and then allows the scenarios to determine the trajectory of demand thereafter.
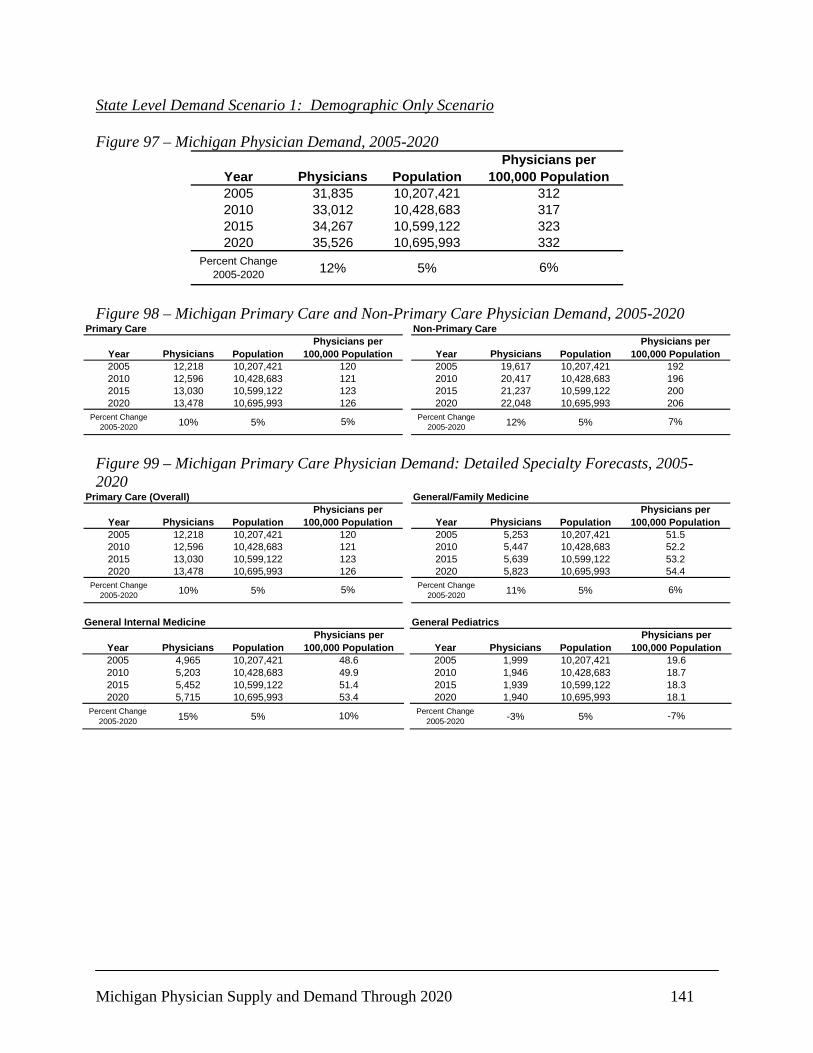
Michigan Physician Supply and Demand Through 2020 141
State Level Demand Scenario 1: Demographic Only Scenario Figure 97 – Michigan Physician Demand, 2005-2020
Year Physicians Population2005 31,835 10,207,4212010 33,012 10,428,6832015 34,267 10,599,1222020 35,526 10,695,993
Percent Change 2005-2020 12% 5% 6%
Physicians per 100,000 Population
312317323332
Figure 98 – Michigan Primary Care and Non-Primary Care Physician Demand, 2005-2020
Primary Care
Year Physicians Population2005 12,218 10,207,4212010 12,596 10,428,6832015 13,030 10,599,1222020 13,478 10,695,993
Percent Change 2005-2020 10% 5%
126
5%
Physicians per 100,000 Population
120121123
Non-Primary Care
Year Physicians Population2005 19,617 10,207,4212010 20,417 10,428,6832015 21,237 10,599,1222020 22,048 10,695,993
Percent Change 2005-2020 12% 5%
Physicians per 100,000 Population
7%
200206
192196
Figure 99 – Michigan Primary Care Physician Demand: Detailed Specialty Forecasts, 2005-2020
Primary Care (Overall)
Year Physicians Population2005 12,218 10,207,4212010 12,596 10,428,6832015 13,030 10,599,1222020 13,478 10,695,993
Percent Change 2005-2020 10% 5% 5%
Physicians per 100,000 Population
120121123126
General/Family Medicine
Year Physicians Population2005 5,253 10,207,4212010 5,447 10,428,6832015 5,639 10,599,1222020 5,823 10,695,993
Percent Change 2005-2020 11% 5% 6%
53.254.4
Physicians per 100,000 Population
51.552.2
General Internal Medicine
Year Physicians Population2005 4,965 10,207,4212010 5,203 10,428,6832015 5,452 10,599,1222020 5,715 10,695,993
Percent Change 2005-2020 15% 5%
48.649.9
Physicians per 100,000 Population
10%
51.453.4
General Pediatrics
Year Physicians Population2005 1,999 10,207,4212010 1,946 10,428,6832015 1,939 10,599,1222020 1,940 10,695,993
Percent Change 2005-2020 -3% 5%
Physicians per 100,000 Population
19.618.7
-7%
18.318.1

Michigan Physician Supply and Demand Through 2020 142
Figure 100 – Michigan Non-Primary Care Physician Demand: Detailed Specialty Forecasts, 2005-2020
Cardiology
Year Physicians Population2005 765 10,207,4212010 811 10,428,6832015 868 10,599,1222020 932 10,695,993
Percent Change 2005-2020 22% 5%
8.7
16%
Physicians per 100,000 Population
7.57.88.2
Other Internal Medicine Subspecialties
Year Physicians Population2005 3,122 10,207,4212010 3,288 10,428,6832015 3,468 10,599,1222020 3,648 10,695,993
Percent Change 2005-2020 17% 5%
Physicians per 100,000 Population
12%
32.734.1
30.631.5
Obstetrics and Gynecology
Year Physicians Population2005 1,869 10,207,4212010 1,900 10,428,6832015 1,902 10,599,1222020 1,884 10,695,993
Percent Change 2005-2020 1% 5% -4%
18.318.217.917.6
Physicians per 100,000 Population
Pathology
Year Physicians Population2005 759 10,207,4212010 794 10,428,6832015 827 10,599,1222020 857 10,695,993
Percent Change 2005-2020 13% 5%
Physicians per 100,000 Population
7.47.6
8%
7.88.0
Figure 101 – Michigan Non-Primary Care Physician Demand: Detailed Specialty Forecasts, 2005-2020
Psychiatry
Year Physicians Population2005 1,360 10,207,4212010 1,406 10,428,6832015 1,438 10,599,1222020 1,460 10,695,993
Percent Change 2005-2020 7% 5% 2%
Physicians per 100,000 Population
13.313.513.613.7
Anesthesiology
Year Physicians Population2005 1,360 10,207,4212010 1,417 10,428,6832015 1,485 10,599,1222020 1,561 10,695,993
Percent Change 2005-2020 15% 5% 10%
14.014.6
Physicians per 100,000 Population
13.313.6
Radiology
Year Physicians Population2005 1,455 10,207,4212010 1,514 10,428,6832015 1,584 10,599,1222020 1,663 10,695,993
Percent Change 2005-2020 14% 5%
14.314.5
Physicians per 100,000 Population
9%
14.915.6
Emergency Medicine
Year Physicians Population2005 1,713 10,207,4212010 1,750 10,428,6832015 1,781 10,599,1222020 1,804 10,695,993
Percent Change 2005-2020 5% 5%
Physicians per 100,000 Population
16.816.8
1%
16.816.9
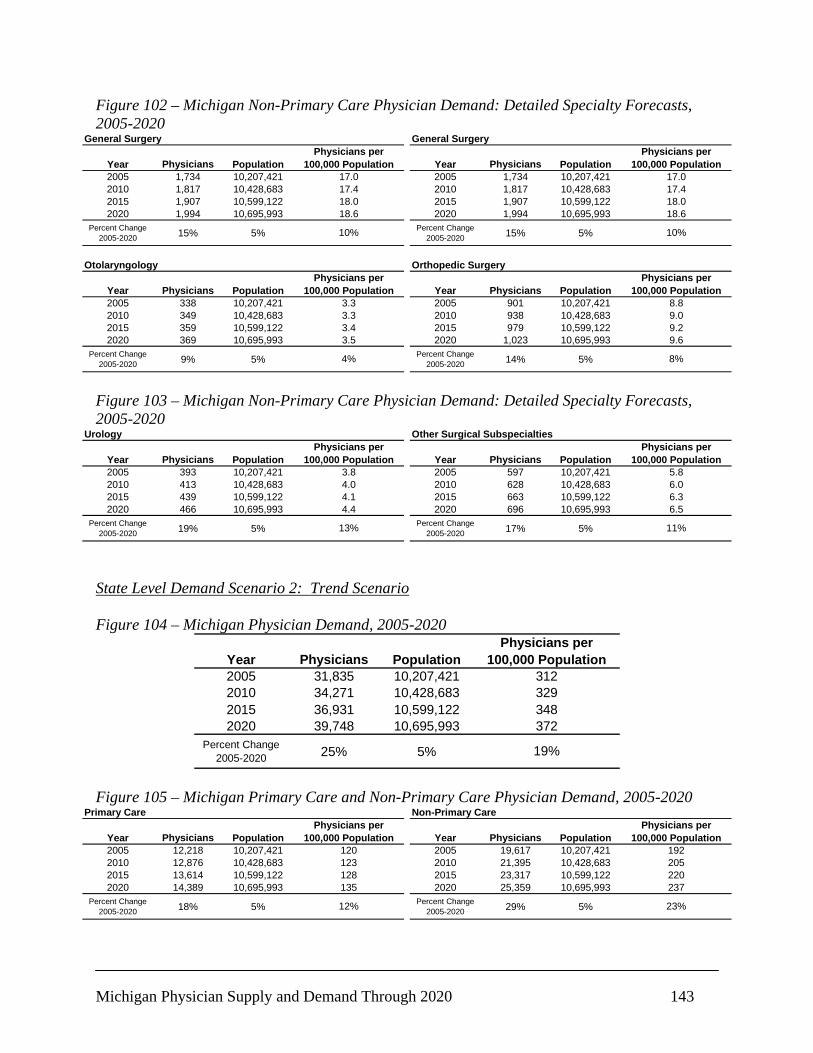
Michigan Physician Supply and Demand Through 2020 143
Figure 102 – Michigan Non-Primary Care Physician Demand: Detailed Specialty Forecasts, 2005-2020
General Surgery
Year Physicians Population2005 1,734 10,207,4212010 1,817 10,428,6832015 1,907 10,599,1222020 1,994 10,695,993
Percent Change 2005-2020 15% 5%
18.6
10%
Physicians per 100,000 Population
17.017.418.0
General Surgery
Year Physicians Population2005 1,734 10,207,4212010 1,817 10,428,6832015 1,907 10,599,1222020 1,994 10,695,993
Percent Change 2005-2020 15% 5%
18.6
10%
Physicians per 100,000 Population
17.017.418.0
Otolaryngology
Year Physicians Population2005 338 10,207,4212010 349 10,428,6832015 359 10,599,1222020 369 10,695,993
Percent Change 2005-2020 9% 5% 4%
3.33.33.43.5
Physicians per 100,000 Population
Orthopedic Surgery
Year Physicians Population2005 901 10,207,4212010 938 10,428,6832015 979 10,599,1222020 1,023 10,695,993
Percent Change 2005-2020 14% 5%
Physicians per 100,000 Population
8.89.0
8%
9.29.6
Figure 103 – Michigan Non-Primary Care Physician Demand: Detailed Specialty Forecasts, 2005-2020
Urology
Year Physicians Population2005 393 10,207,4212010 413 10,428,6832015 439 10,599,1222020 466 10,695,993
Percent Change 2005-2020 19% 5% 13%
Physicians per 100,000 Population
3.84.04.14.4
Other Surgical Subspecialties
Year Physicians Population2005 597 10,207,4212010 628 10,428,6832015 663 10,599,1222020 696 10,695,993
Percent Change 2005-2020 17% 5% 11%
6.36.5
Physicians per 100,000 Population
5.86.0
State Level Demand Scenario 2: Trend Scenario Figure 104 – Michigan Physician Demand, 2005-2020
Year Physicians Population2005 31,835 10,207,4212010 34,271 10,428,6832015 36,931 10,599,1222020 39,748 10,695,993
Percent Change 2005-2020 25% 5%
372
19%
Physicians per 100,000 Population
312329348
Figure 105 – Michigan Primary Care and Non-Primary Care Physician Demand, 2005-2020
Primary Care
Year Physicians Population2005 12,218 10,207,4212010 12,876 10,428,6832015 13,614 10,599,1222020 14,389 10,695,993
Percent Change 2005-2020 18% 5%
135
12%
Physicians per 100,000 Population
120123128
Non-Primary Care
Year Physicians Population2005 19,617 10,207,4212010 21,395 10,428,6832015 23,317 10,599,1222020 25,359 10,695,993
Percent Change 2005-2020 29% 5%
192205
Physicians per 100,000 Population
23%
220237
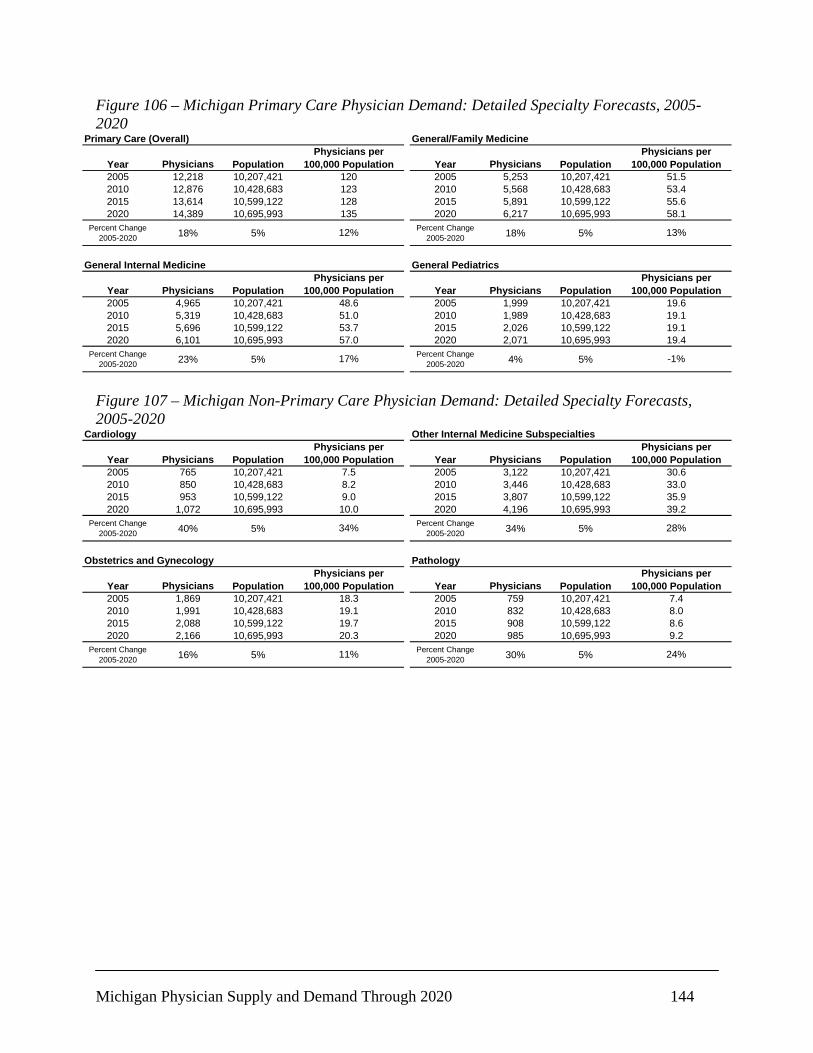
Michigan Physician Supply and Demand Through 2020 144
Figure 106 – Michigan Primary Care Physician Demand: Detailed Specialty Forecasts, 2005-2020
Primary Care (Overall)
Year Physicians Population2005 12,218 10,207,4212010 12,876 10,428,6832015 13,614 10,599,1222020 14,389 10,695,993
Percent Change 2005-2020 18% 5%
135
12%
Physicians per 100,000 Population
120123128
General/Family Medicine
Year Physicians Population2005 5,253 10,207,4212010 5,568 10,428,6832015 5,891 10,599,1222020 6,217 10,695,993
Percent Change 2005-2020 18% 5% 13%
55.658.1
Physicians per 100,000 Population
51.553.4
General Internal Medicine
Year Physicians Population2005 4,965 10,207,4212010 5,319 10,428,6832015 5,696 10,599,1222020 6,101 10,695,993
Percent Change 2005-2020 23% 5% 17%
53.757.0
48.651.0
Physicians per 100,000 Population
General Pediatrics
Year Physicians Population2005 1,999 10,207,4212010 1,989 10,428,6832015 2,026 10,599,1222020 2,071 10,695,993
Percent Change 2005-2020 4% 5% -1%
19.119.4
Physicians per 100,000 Population
19.619.1
Figure 107 – Michigan Non-Primary Care Physician Demand: Detailed Specialty Forecasts, 2005-2020
Cardiology
Year Physicians Population2005 765 10,207,4212010 850 10,428,6832015 953 10,599,1222020 1,072 10,695,993
Percent Change 2005-2020 40% 5%
10.0
34%
Physicians per 100,000 Population
7.58.29.0
Other Internal Medicine Subspecialties
Year Physicians Population2005 3,122 10,207,4212010 3,446 10,428,6832015 3,807 10,599,1222020 4,196 10,695,993
Percent Change 2005-2020 34% 5%
35.939.2
30.633.0
Physicians per 100,000 Population
28%
Obstetrics and Gynecology
Year Physicians Population2005 1,869 10,207,4212010 1,991 10,428,6832015 2,088 10,599,1222020 2,166 10,695,993
Percent Change 2005-2020 16% 5%
18.319.119.720.3
11%
Physicians per 100,000 Population
Pathology
Year Physicians Population2005 759 10,207,4212010 832 10,428,6832015 908 10,599,1222020 985 10,695,993
Percent Change 2005-2020 30% 5%
Physicians per 100,000 Population
7.48.0
24%
8.69.2
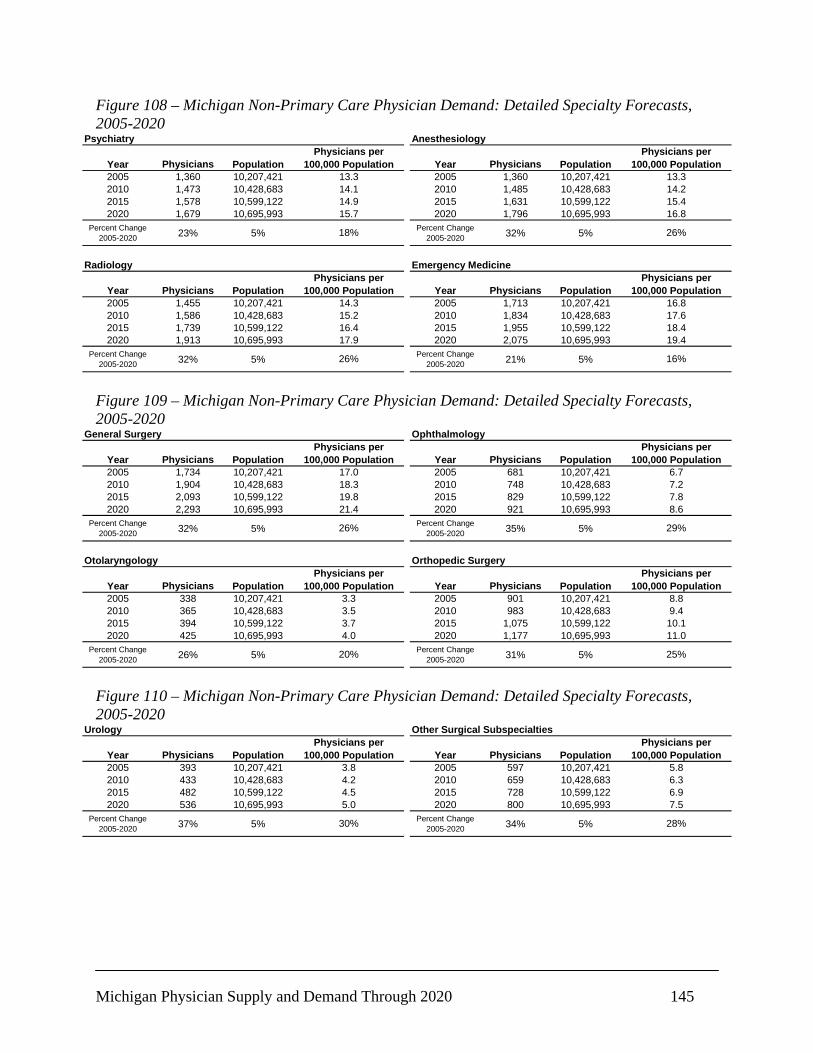
Michigan Physician Supply and Demand Through 2020 145
Figure 108 – Michigan Non-Primary Care Physician Demand: Detailed Specialty Forecasts, 2005-2020
Psychiatry
Year Physicians Population2005 1,360 10,207,4212010 1,473 10,428,6832015 1,578 10,599,1222020 1,679 10,695,993
Percent Change 2005-2020 23% 5%
15.7
18%
Physicians per 100,000 Population
13.314.114.9
Anesthesiology
Year Physicians Population2005 1,360 10,207,4212010 1,485 10,428,6832015 1,631 10,599,1222020 1,796 10,695,993
Percent Change 2005-2020 32% 5% 26%
15.416.8
Physicians per 100,000 Population
13.314.2
Radiology
Year Physicians Population2005 1,455 10,207,4212010 1,586 10,428,6832015 1,739 10,599,1222020 1,913 10,695,993
Percent Change 2005-2020 32% 5% 26%
16.417.9
14.315.2
Physicians per 100,000 Population
Emergency Medicine
Year Physicians Population2005 1,713 10,207,4212010 1,834 10,428,6832015 1,955 10,599,1222020 2,075 10,695,993
Percent Change 2005-2020 21% 5% 16%
18.419.4
Physicians per 100,000 Population
16.817.6
Figure 109 – Michigan Non-Primary Care Physician Demand: Detailed Specialty Forecasts, 2005-2020
General Surgery
Year Physicians Population2005 1,734 10,207,4212010 1,904 10,428,6832015 2,093 10,599,1222020 2,293 10,695,993
Percent Change 2005-2020 32% 5%
21.4
26%
Physicians per 100,000 Population
17.018.319.8
Ophthalmology
Year Physicians Population2005 681 10,207,4212010 748 10,428,6832015 829 10,599,1222020 921 10,695,993
Percent Change 2005-2020 35% 5%
7.88.6
6.77.2
Physicians per 100,000 Population
29%
Otolaryngology
Year Physicians Population2005 338 10,207,4212010 365 10,428,6832015 394 10,599,1222020 425 10,695,993
Percent Change 2005-2020 26% 5%
3.33.53.74.0
20%
Physicians per 100,000 Population
Orthopedic Surgery
Year Physicians Population2005 901 10,207,4212010 983 10,428,6832015 1,075 10,599,1222020 1,177 10,695,993
Percent Change 2005-2020 31% 5%
Physicians per 100,000 Population
8.89.4
25%
10.111.0
Figure 110 – Michigan Non-Primary Care Physician Demand: Detailed Specialty Forecasts, 2005-2020
Urology
Year Physicians Population2005 393 10,207,4212010 433 10,428,6832015 482 10,599,1222020 536 10,695,993
Percent Change 2005-2020 37% 5%
5.0
30%
Physicians per 100,000 Population
3.84.24.5
Other Surgical Subspecialties
Year Physicians Population2005 597 10,207,4212010 659 10,428,6832015 728 10,599,1222020 800 10,695,993
Percent Change 2005-2020 34% 5% 28%
6.97.5
Physicians per 100,000 Population
5.86.3
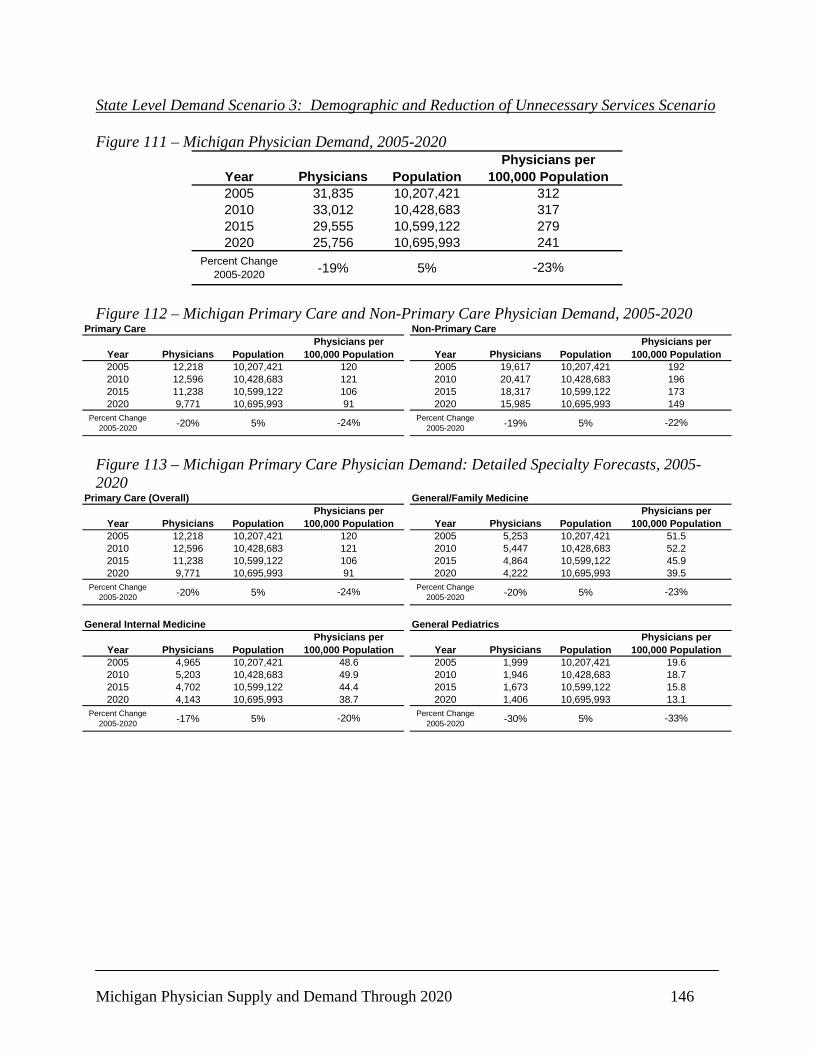
Michigan Physician Supply and Demand Through 2020 146
State Level Demand Scenario 3: Demographic and Reduction of Unnecessary Services Scenario Figure 111 – Michigan Physician Demand, 2005-2020
Year Physicians Population2005 31,835 10,207,4212010 33,012 10,428,6832015 29,555 10,599,1222020 25,756 10,695,993
Percent Change 2005-2020 -19% 5%
241
-23%
Physicians per 100,000 Population
312317279
Figure 112 – Michigan Primary Care and Non-Primary Care Physician Demand, 2005-2020
Primary Care
Year Physicians Population2005 12,218 10,207,4212010 12,596 10,428,6832015 11,238 10,599,1222020 9,771 10,695,993
Percent Change 2005-2020 -20% 5%
91
-24%
Physicians per 100,000 Population
120121106
Non-Primary Care
Year Physicians Population2005 19,617 10,207,4212010 20,417 10,428,6832015 18,317 10,599,1222020 15,985 10,695,993
Percent Change 2005-2020 -19% 5%
192196
Physicians per 100,000 Population
-22%
173149
Figure 113 – Michigan Primary Care Physician Demand: Detailed Specialty Forecasts, 2005-2020
Primary Care (Overall)
Year Physicians Population2005 12,218 10,207,4212010 12,596 10,428,6832015 11,238 10,599,1222020 9,771 10,695,993
Percent Change 2005-2020 -20% 5%
91
-24%
Physicians per 100,000 Population
120121106
General/Family Medicine
Year Physicians Population2005 5,253 10,207,4212010 5,447 10,428,6832015 4,864 10,599,1222020 4,222 10,695,993
Percent Change 2005-2020 -20% 5% -23%
45.939.5
Physicians per 100,000 Population
51.552.2
General Internal Medicine
Year Physicians Population2005 4,965 10,207,4212010 5,203 10,428,6832015 4,702 10,599,1222020 4,143 10,695,993
Percent Change 2005-2020 -17% 5% -20%
44.438.7
48.649.9
Physicians per 100,000 Population
General Pediatrics
Year Physicians Population2005 1,999 10,207,4212010 1,946 10,428,6832015 1,673 10,599,1222020 1,406 10,695,993
Percent Change 2005-2020 -30% 5% -33%
15.813.1
Physicians per 100,000 Population
19.618.7
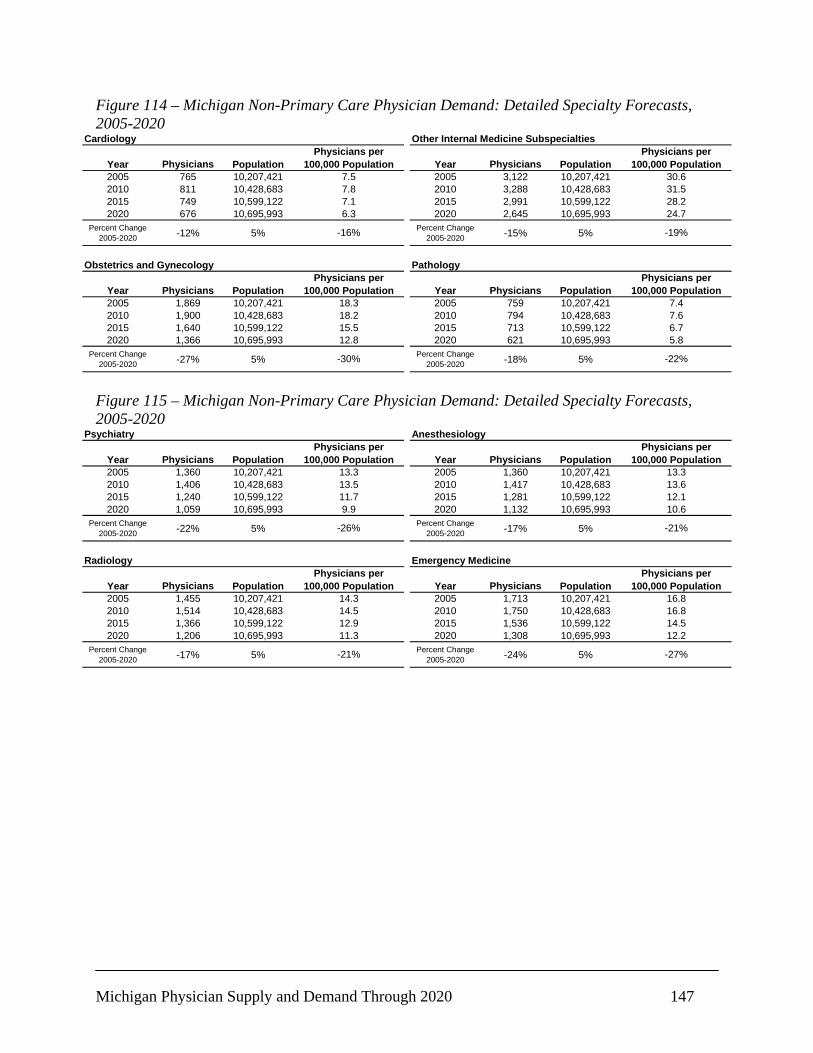
Michigan Physician Supply and Demand Through 2020 147
Figure 114 – Michigan Non-Primary Care Physician Demand: Detailed Specialty Forecasts, 2005-2020
Cardiology
Year Physicians Population2005 765 10,207,4212010 811 10,428,6832015 749 10,599,1222020 676 10,695,993
Percent Change 2005-2020 -12% 5%
6.3
-16%
Physicians per 100,000 Population
7.57.87.1
Other Internal Medicine Subspecialties
Year Physicians Population2005 3,122 10,207,4212010 3,288 10,428,6832015 2,991 10,599,1222020 2,645 10,695,993
Percent Change 2005-2020 -15% 5%
28.224.7
30.631.5
Physicians per 100,000 Population
-19%
Obstetrics and Gynecology
Year Physicians Population2005 1,869 10,207,4212010 1,900 10,428,6832015 1,640 10,599,1222020 1,366 10,695,993
Percent Change 2005-2020 -27% 5%
18.318.215.512.8
-30%
Physicians per 100,000 Population
Pathology
Year Physicians Population2005 759 10,207,4212010 794 10,428,6832015 713 10,599,1222020 621 10,695,993
Percent Change 2005-2020 -18% 5%
Physicians per 100,000 Population
7.47.6
-22%
6.75.8
Figure 115 – Michigan Non-Primary Care Physician Demand: Detailed Specialty Forecasts, 2005-2020
Psychiatry
Year Physicians Population2005 1,360 10,207,4212010 1,406 10,428,6832015 1,240 10,599,1222020 1,059 10,695,993
Percent Change 2005-2020 -22% 5%
9.9
-26%
Physicians per 100,000 Population
13.313.511.7
Anesthesiology
Year Physicians Population2005 1,360 10,207,4212010 1,417 10,428,6832015 1,281 10,599,1222020 1,132 10,695,993
Percent Change 2005-2020 -17% 5% -21%
12.110.6
Physicians per 100,000 Population
13.313.6
Radiology
Year Physicians Population2005 1,455 10,207,4212010 1,514 10,428,6832015 1,366 10,599,1222020 1,206 10,695,993
Percent Change 2005-2020 -17% 5% -21%
12.911.3
14.314.5
Physicians per 100,000 Population
Emergency Medicine
Year Physicians Population2005 1,713 10,207,4212010 1,750 10,428,6832015 1,536 10,599,1222020 1,308 10,695,993
Percent Change 2005-2020 -24% 5% -27%
14.512.2
Physicians per 100,000 Population
16.816.8
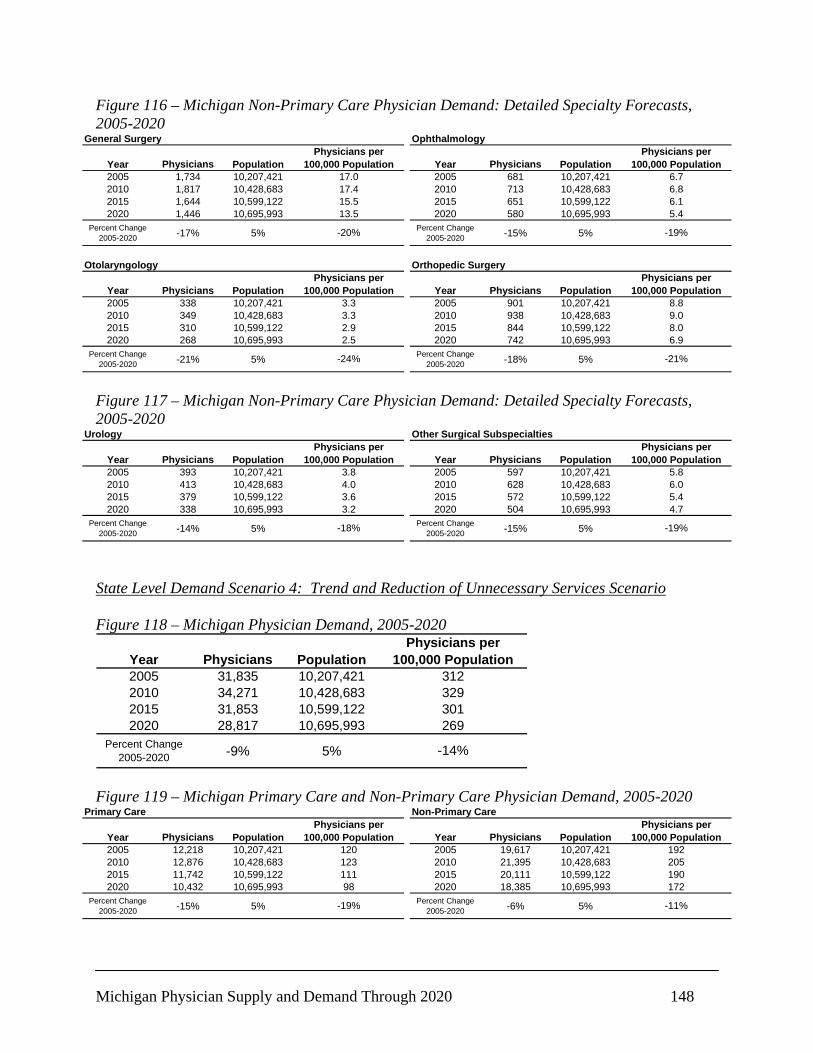
Michigan Physician Supply and Demand Through 2020 148
Figure 116 – Michigan Non-Primary Care Physician Demand: Detailed Specialty Forecasts, 2005-2020
General Surgery
Year Physicians Population2005 1,734 10,207,4212010 1,817 10,428,6832015 1,644 10,599,1222020 1,446 10,695,993
Percent Change 2005-2020 -17% 5%
13.5
-20%
Physicians per 100,000 Population
17.017.415.5
Ophthalmology
Year Physicians Population2005 681 10,207,4212010 713 10,428,6832015 651 10,599,1222020 580 10,695,993
Percent Change 2005-2020 -15% 5%
6.15.4
6.76.8
Physicians per 100,000 Population
-19%
Otolaryngology
Year Physicians Population2005 338 10,207,4212010 349 10,428,6832015 310 10,599,1222020 268 10,695,993
Percent Change 2005-2020 -21% 5%
3.33.32.92.5
-24%
Physicians per 100,000 Population
Orthopedic Surgery
Year Physicians Population2005 901 10,207,4212010 938 10,428,6832015 844 10,599,1222020 742 10,695,993
Percent Change 2005-2020 -18% 5%
Physicians per 100,000 Population
8.89.0
-21%
8.06.9
Figure 117 – Michigan Non-Primary Care Physician Demand: Detailed Specialty Forecasts, 2005-2020
Urology
Year Physicians Population2005 393 10,207,4212010 413 10,428,6832015 379 10,599,1222020 338 10,695,993
Percent Change 2005-2020 -14% 5%
3.2
-18%
Physicians per 100,000 Population
3.84.03.6
Other Surgical Subspecialties
Year Physicians Population2005 597 10,207,4212010 628 10,428,6832015 572 10,599,1222020 504 10,695,993
Percent Change 2005-2020 -15% 5% -19%
5.44.7
Physicians per 100,000 Population
5.86.0
State Level Demand Scenario 4: Trend and Reduction of Unnecessary Services Scenario Figure 118 – Michigan Physician Demand, 2005-2020
Year Physicians Population2005 31,835 10,207,4212010 34,271 10,428,6832015 31,853 10,599,1222020 28,817 10,695,993
Percent Change 2005-2020 -9% 5%
269
-14%
Physicians per 100,000 Population
312329301
Figure 119 – Michigan Primary Care and Non-Primary Care Physician Demand, 2005-2020
Primary Care
Year Physicians Population2005 12,218 10,207,4212010 12,876 10,428,6832015 11,742 10,599,1222020 10,432 10,695,993
Percent Change 2005-2020 -15% 5%
98
-19%
Physicians per 100,000 Population
120123111
Non-Primary Care
Year Physicians Population2005 19,617 10,207,4212010 21,395 10,428,6832015 20,111 10,599,1222020 18,385 10,695,993
Percent Change 2005-2020 -6% 5%
Physicians per 100,000 Population
-11%
190172
192205

Michigan Physician Supply and Demand Through 2020 149
Figure 120 – Michigan Primary Care Physician Demand: Detailed Specialty Forecasts, 2005-2020
Primary Care (Overall)
Year Physicians Population2005 12,218 10,207,4212010 12,876 10,428,6832015 11,742 10,599,1222020 10,432 10,695,993
Percent Change 2005-2020 -15% 5%
98
-19%
Physicians per 100,000 Population
120123111
General/Family Medicine
Year Physicians Population2005 5,253 10,207,4212010 5,568 10,428,6832015 5,081 10,599,1222020 4,507 10,695,993
Percent Change 2005-2020 -14% 5% -18%
47.942.1
Physicians per 100,000 Population
51.553.4
General Internal Medicine
Year Physicians Population2005 4,965 10,207,4212010 5,319 10,428,6832015 4,913 10,599,1222020 4,423 10,695,993
Percent Change 2005-2020 -11% 5%
48.651.0
Physicians per 100,000 Population
-15%
46.441.4
General Pediatrics
Year Physicians Population2005 1,999 10,207,4212010 1,989 10,428,6832015 1,748 10,599,1222020 1,502 10,695,993
Percent Change 2005-2020 -25% 5%
Physicians per 100,000 Population
19.619.1
-28%
16.514.0
Figure 121 – Michigan Non-Primary Care Physician Demand: Detailed Specialty Forecasts, 2005-2020
Cardiology
Year Physicians Population2005 765 10,207,4212010 850 10,428,6832015 822 10,599,1222020 777 10,695,993
Percent Change 2005-2020 2% 5%
7.3
-3%
Physicians per 100,000 Population
7.58.27.8
Other Internal Medicine Subspecialties
Year Physicians Population2005 3,122 10,207,4212010 3,446 10,428,6832015 3,284 10,599,1222020 3,042 10,695,993
Percent Change 2005-2020 -3% 5%
Physicians per 100,000 Population
-7%
31.028.4
30.633.0
Obstetrics and Gynecology
Year Physicians Population2005 1,869 10,207,4212010 1,991 10,428,6832015 1,801 10,599,1222020 1,571 10,695,993
Percent Change 2005-2020 -16% 5%
14.7
-20%
Physicians per 100,000 Population
18.319.117.0
Pathology
Year Physicians Population2005 759 10,207,4212010 832 10,428,6832015 783 10,599,1222020 714 10,695,993
Percent Change 2005-2020 -6% 5%
Physicians per 100,000 Population
7.48.0
-10%
7.46.7
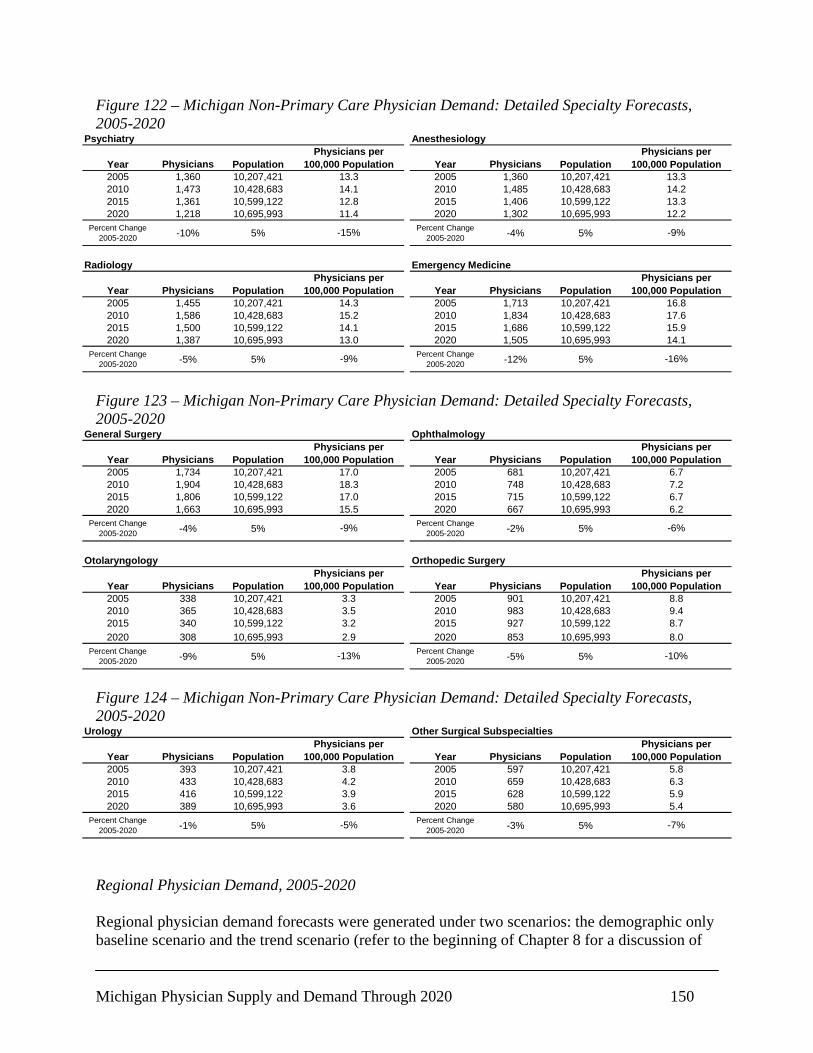
Michigan Physician Supply and Demand Through 2020 150
Figure 122 – Michigan Non-Primary Care Physician Demand: Detailed Specialty Forecasts, 2005-2020
Psychiatry
Year Physicians Population2005 1,360 10,207,4212010 1,473 10,428,6832015 1,361 10,599,1222020 1,218 10,695,993
Percent Change 2005-2020 -10% 5%
11.4
-15%
Physicians per 100,000 Population
13.314.112.8
Anesthesiology
Year Physicians Population2005 1,360 10,207,4212010 1,485 10,428,6832015 1,406 10,599,1222020 1,302 10,695,993
Percent Change 2005-2020 -4% 5% -9%
13.312.2
Physicians per 100,000 Population
13.314.2
Radiology
Year Physicians Population2005 1,455 10,207,4212010 1,586 10,428,6832015 1,500 10,599,1222020 1,387 10,695,993
Percent Change 2005-2020 -5% 5%
14.315.2
Physicians per 100,000 Population
-9%
14.113.0
Emergency Medicine
Year Physicians Population2005 1,713 10,207,4212010 1,834 10,428,6832015 1,686 10,599,1222020 1,505 10,695,993
Percent Change 2005-2020 -12% 5%
Physicians per 100,000 Population
16.817.6
-16%
15.914.1
Figure 123 – Michigan Non-Primary Care Physician Demand: Detailed Specialty Forecasts, 2005-2020
General Surgery
Year Physicians Population2005 1,734 10,207,4212010 1,904 10,428,6832015 1,806 10,599,1222020 1,663 10,695,993
Percent Change 2005-2020 -4% 5%
15.5
-9%
Physicians per 100,000 Population
17.018.317.0
Ophthalmology
Year Physicians Population2005 681 10,207,4212010 748 10,428,6832015 715 10,599,1222020 667 10,695,993
Percent Change 2005-2020 -2% 5%
Physicians per 100,000 Population
-6%
6.76.2
6.77.2
Otolaryngology
Year Physicians Population2005 338 10,207,4212010 365 10,428,6832015 340 10,599,1222020 308 10,695,993
Percent Change 2005-2020 -9% 5%
2.9
-13%
Physicians per 100,000 Population
3.33.53.2
Orthopedic Surgery
Year Physicians Population2005 901 10,207,4212010 983 10,428,6832015 927 10,599,1222020 853 10,695,993
Percent Change 2005-2020 -5% 5%
Physicians per 100,000 Population
8.89.4
-10%
8.78.0
Figure 124 – Michigan Non-Primary Care Physician Demand: Detailed Specialty Forecasts, 2005-2020
Urology
Year Physicians Population2005 393 10,207,4212010 433 10,428,6832015 416 10,599,1222020 389 10,695,993
Percent Change 2005-2020 -1% 5%
3.6
-5%
Physicians per 100,000 Population
3.84.23.9
Other Surgical Subspecialties
Year Physicians Population2005 597 10,207,4212010 659 10,428,6832015 628 10,599,1222020 580 10,695,993
Percent Change 2005-2020 -3% 5% -7%
5.95.4
Physicians per 100,000 Population
5.86.3
Regional Physician Demand, 2005-2020 Regional physician demand forecasts were generated under two scenarios: the demographic only baseline scenario and the trend scenario (refer to the beginning of Chapter 8 for a discussion of
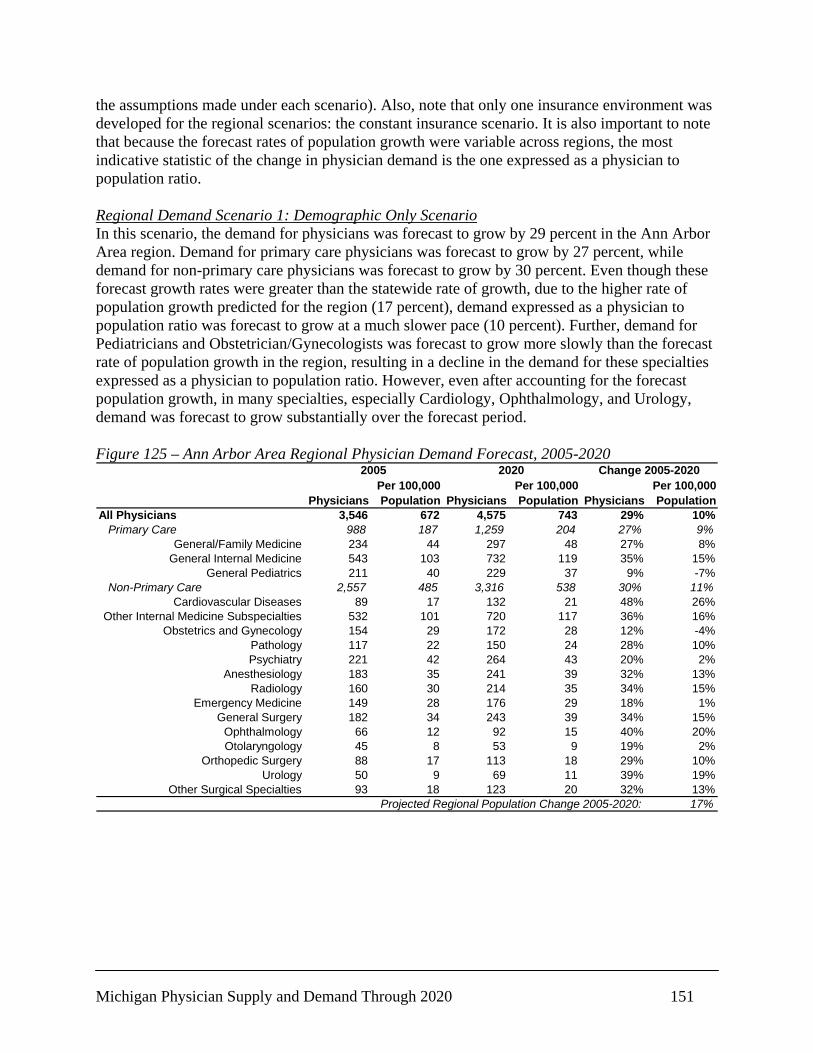
Michigan Physician Supply and Demand Through 2020 151
the assumptions made under each scenario). Also, note that only one insurance environment was developed for the regional scenarios: the constant insurance scenario. It is also important to note that because the forecast rates of population growth were variable across regions, the most indicative statistic of the change in physician demand is the one expressed as a physician to population ratio. Regional Demand Scenario 1: Demographic Only Scenario In this scenario, the demand for physicians was forecast to grow by 29 percent in the Ann Arbor Area region. Demand for primary care physicians was forecast to grow by 27 percent, while demand for non-primary care physicians was forecast to grow by 30 percent. Even though these forecast growth rates were greater than the statewide rate of growth, due to the higher rate of population growth predicted for the region (17 percent), demand expressed as a physician to population ratio was forecast to grow at a much slower pace (10 percent). Further, demand for Pediatricians and Obstetrician/Gynecologists was forecast to grow more slowly than the forecast rate of population growth in the region, resulting in a decline in the demand for these specialties expressed as a physician to population ratio. However, even after accounting for the forecast population growth, in many specialties, especially Cardiology, Ophthalmology, and Urology, demand was forecast to grow substantially over the forecast period. Figure 125 – Ann Arbor Area Regional Physician Demand Forecast, 2005-2020
PhysiciansPer 100,000 Population Physicians
Per 100,000 Population Physicians
Per 100,000 Population
All Physicians 3,546 672 4,575 743 29% 10%Primary Care 988 187 1,259 204 27% 9%
General/Family Medicine 234 44 297 48 27% 8%General Internal Medicine 543 103 732 119 35% 15%
General Pediatrics 211 40 229 37 9% -7%Non-Primary Care 2,557 485 3,316 538 30% 11%
Cardiovascular Diseases 89 17 132 21 48% 26%Other Internal Medicine Subspecialties 532 101 720 117 36% 16%
Obstetrics and Gynecology 154 29 172 28 12% -4%Pathology 117 22 150 24 28% 10%Psychiatry 221 42 264 43 20% 2%
Anesthesiology 183 35 241 39 32% 13%Radiology 160 30 214 35 34% 15%
Emergency Medicine 149 28 176 29 18% 1%General Surgery 182 34 243 39 34% 15%
Ophthalmology 66 12 92 15 40% 20%Otolaryngology 45 8 53 9 19% 2%
Orthopedic Surgery 88 17 113 18 29% 10%Urology 50 9 69 11 39% 19%
Other Surgical Specialties 93 18 123 20 32% 13%17%Projected Regional Population Change 2005-2020:
Change 2005-202020202005

Michigan Physician Supply and Demand Through 2020 152
Figure 126 – Detroit Area Regional Physician Demand Forecast, 2005-2020
PhysiciansPer 100,000 Population Physicians
Per 100,000 Population Physicians
Per 100,000 Population
All Physicians 14,632 342 15,527 357 6% 4%Primary Care 5,518 129 5,834 134 6% 4%
General/Family Medicine 1,934 45 2,061 47 7% 5%General Internal Medicine 2,579 60 2,832 65 10% 8%
General Pediatrics 1,006 24 941 22 -6% -8%Non-Primary Care 9,114 213 9,693 223 6% 5%
Cardiovascular Diseases 369 9 420 10 14% 12%Other Internal Medicine Subspecialties 1,489 35 1,629 37 9% 8%
Obstetrics and Gynecology 886 21 869 20 -2% -3%Pathology 374 9 398 9 6% 5%Psychiatry 657 15 672 15 2% 1%
Anesthesiology 574 13 618 14 8% 6%Radiology 686 16 741 17 8% 6%
Emergency Medicine 750 18 760 17 1% 0%General Surgery 802 19 874 20 9% 7%
Ophthalmology 348 8 386 9 11% 9%Otolaryngology 141 3 146 3 4% 2%
Orthopedic Surgery 358 8 383 9 7% 5%Urology 181 4 202 5 12% 10%
Other Surgical Specialties 266 6 290 7 9% 7%2%Projected Regional Population Change 2005-2020:
Change 2005-202020202005
In this scenario, the demand for physicians was forecast to grow by 6 percent in the Detroit Area region. Demand for primary care physicians was forecast to grow by 6 percent, and demand for non-primary care physicians was forecast to grow by 6 percent as well. Even though these forecast growth rates were lower than the statewide rate of growth, due to the low rate of population growth predicted for the region (2 percent), demand expressed as a physician to population ratio was forecast to grow at a similar pace (4 percent). Further, demand for Pediatricians and Obstetrician/Gynecologists was forecast to decline during the forecast period in the region. In this scenario, the demand for physicians was forecast to grow by 16 percent in the East Central region. Demand for primary care physicians was forecast to grow by 17 percent, while demand for non-primary care physicians was forecast to grow by 15 percent. Even though these forecast growth rates were greater than the statewide rate of growth, due to the rate of population growth predicted for the region (9 percent), demand expressed as a physician to population ratio was forecast to grow at a similar pace (6 percent). Demand for Pediatricians and Otolaryngologists was forecast to decline during the forecast period in the region. Further, demand for these two specialties, as well as Obstetrician/Gynecologists, was forecast to grow more slowly than the forecast rate of population growth in the region, resulting in a decline in the demand for these specialties expressed as a physician to population ratio.
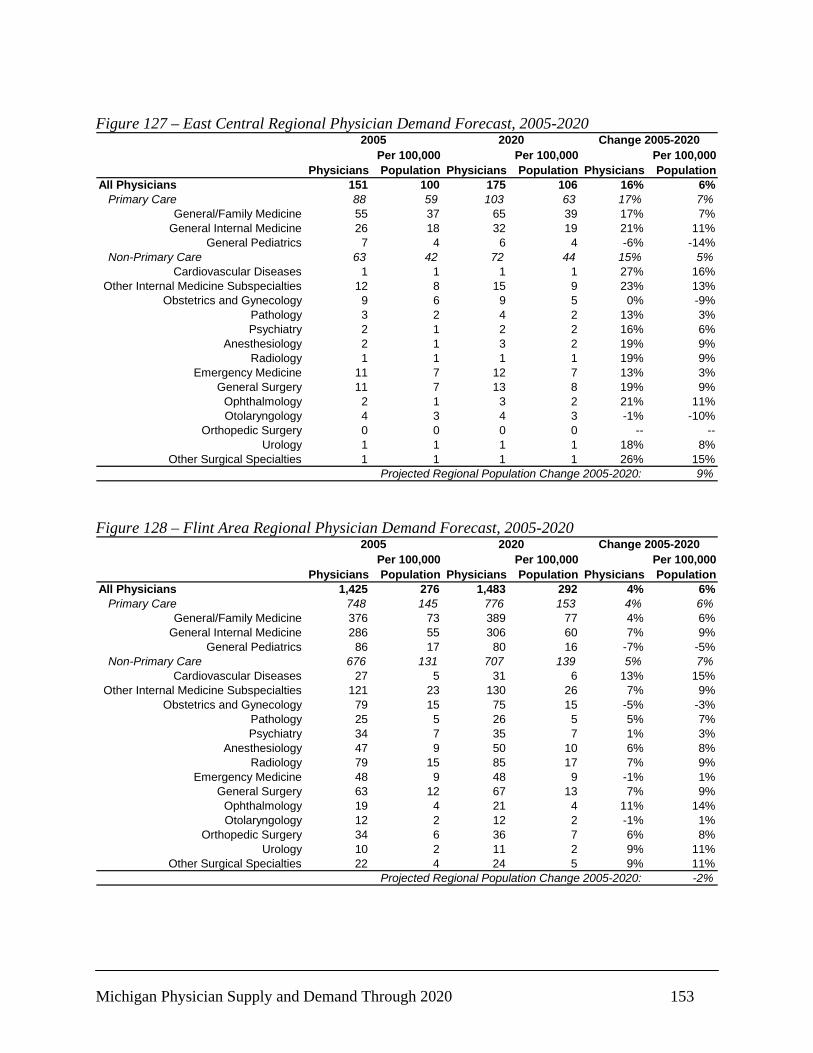
Michigan Physician Supply and Demand Through 2020 153
Figure 127 – East Central Regional Physician Demand Forecast, 2005-2020
PhysiciansPer 100,000 Population Physicians
Per 100,000 Population Physicians
Per 100,000 Population
All Physicians 151 100 175 106 16% 6%Primary Care 88 59 103 63 17% 7%
General/Family Medicine 55 37 65 39 17% 7%General Internal Medicine 26 18 32 19 21% 11%
General Pediatrics 7 4 6 4 -6% -14%Non-Primary Care 63 42 72 44 15% 5%
Cardiovascular Diseases 1 1 1 1 27% 16%Other Internal Medicine Subspecialties 12 8 15 9 23% 13%
Obstetrics and Gynecology 9 6 9 5 0% -9%Pathology 3 2 4 2 13% 3%Psychiatry 2 1 2 2 16% 6%
Anesthesiology 2 1 3 2 19% 9%Radiology 1 1 1 1 19% 9%
Emergency Medicine 11 7 12 7 13% 3%General Surgery 11 7 13 8 19% 9%
Ophthalmology 2 1 3 2 21% 11%Otolaryngology 4 3 4 3 -1% -10%
Orthopedic Surgery 0 0 0 0 -- --Urology 1 1 1 1 18% 8%
Other Surgical Specialties 1 1 1 1 26% 15%9%Projected Regional Population Change 2005-2020:
Change 2005-202020202005
Figure 128 – Flint Area Regional Physician Demand Forecast, 2005-2020
PhysiciansPer 100,000 Population Physicians
Per 100,000 Population Physicians
Per 100,000 Population
All Physicians 1,425 276 1,483 292 4% 6%Primary Care 748 145 776 153 4% 6%
General/Family Medicine 376 73 389 77 4% 6%General Internal Medicine 286 55 306 60 7% 9%
General Pediatrics 86 17 80 16 -7% -5%Non-Primary Care 676 131 707 139 5% 7%
Cardiovascular Diseases 27 5 31 6 13% 15%Other Internal Medicine Subspecialties 121 23 130 26 7% 9%
Obstetrics and Gynecology 79 15 75 15 -5% -3%Pathology 25 5 26 5 5% 7%Psychiatry 34 7 35 7 1% 3%
Anesthesiology 47 9 50 10 6% 8%Radiology 79 15 85 17 7% 9%
Emergency Medicine 48 9 48 9 -1% 1%General Surgery 63 12 67 13 7% 9%
Ophthalmology 19 4 21 4 11% 14%Otolaryngology 12 2 12 2 -1% 1%
Orthopedic Surgery 34 6 36 7 6% 8%Urology 10 2 11 2 9% 11%
Other Surgical Specialties 22 4 24 5 9% 11%-2%Projected Regional Population Change 2005-2020:
Change 2005-202020202005
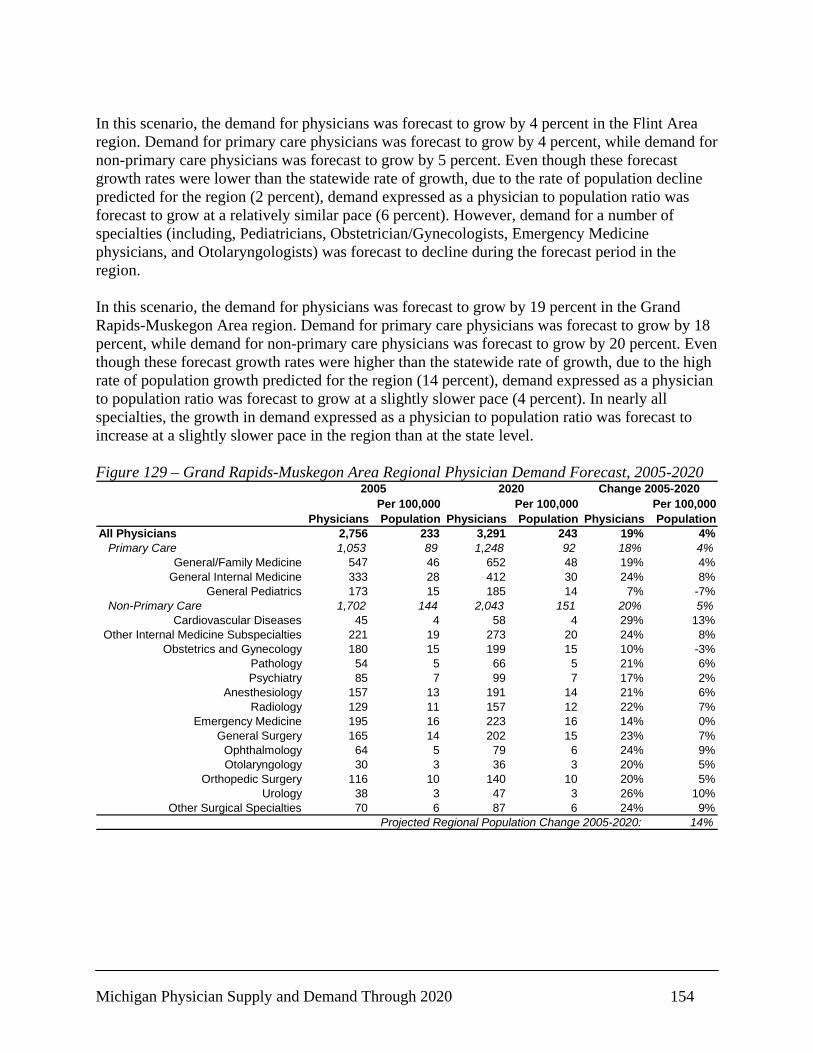
Michigan Physician Supply and Demand Through 2020 154
In this scenario, the demand for physicians was forecast to grow by 4 percent in the Flint Area region. Demand for primary care physicians was forecast to grow by 4 percent, while demand for non-primary care physicians was forecast to grow by 5 percent. Even though these forecast growth rates were lower than the statewide rate of growth, due to the rate of population decline predicted for the region (2 percent), demand expressed as a physician to population ratio was forecast to grow at a relatively similar pace (6 percent). However, demand for a number of specialties (including, Pediatricians, Obstetrician/Gynecologists, Emergency Medicine physicians, and Otolaryngologists) was forecast to decline during the forecast period in the region. In this scenario, the demand for physicians was forecast to grow by 19 percent in the Grand Rapids-Muskegon Area region. Demand for primary care physicians was forecast to grow by 18 percent, while demand for non-primary care physicians was forecast to grow by 20 percent. Even though these forecast growth rates were higher than the statewide rate of growth, due to the high rate of population growth predicted for the region (14 percent), demand expressed as a physician to population ratio was forecast to grow at a slightly slower pace (4 percent). In nearly all specialties, the growth in demand expressed as a physician to population ratio was forecast to increase at a slightly slower pace in the region than at the state level. Figure 129 – Grand Rapids-Muskegon Area Regional Physician Demand Forecast, 2005-2020
PhysiciansPer 100,000 Population Physicians
Per 100,000 Population Physicians
Per 100,000 Population
All Physicians 2,756 233 3,291 243 19% 4%Primary Care 1,053 89 1,248 92 18% 4%
General/Family Medicine 547 46 652 48 19% 4%General Internal Medicine 333 28 412 30 24% 8%
General Pediatrics 173 15 185 14 7% -7%Non-Primary Care 1,702 144 2,043 151 20% 5%
Cardiovascular Diseases 45 4 58 4 29% 13%Other Internal Medicine Subspecialties 221 19 273 20 24% 8%
Obstetrics and Gynecology 180 15 199 15 10% -3%Pathology 54 5 66 5 21% 6%Psychiatry 85 7 99 7 17% 2%
Anesthesiology 157 13 191 14 21% 6%Radiology 129 11 157 12 22% 7%
Emergency Medicine 195 16 223 16 14% 0%General Surgery 165 14 202 15 23% 7%
Ophthalmology 64 5 79 6 24% 9%Otolaryngology 30 3 36 3 20% 5%
Orthopedic Surgery 116 10 140 10 20% 5%Urology 38 3 47 3 26% 10%
Other Surgical Specialties 70 6 87 6 24% 9%14%Projected Regional Population Change 2005-2020:
Change 2005-202020202005
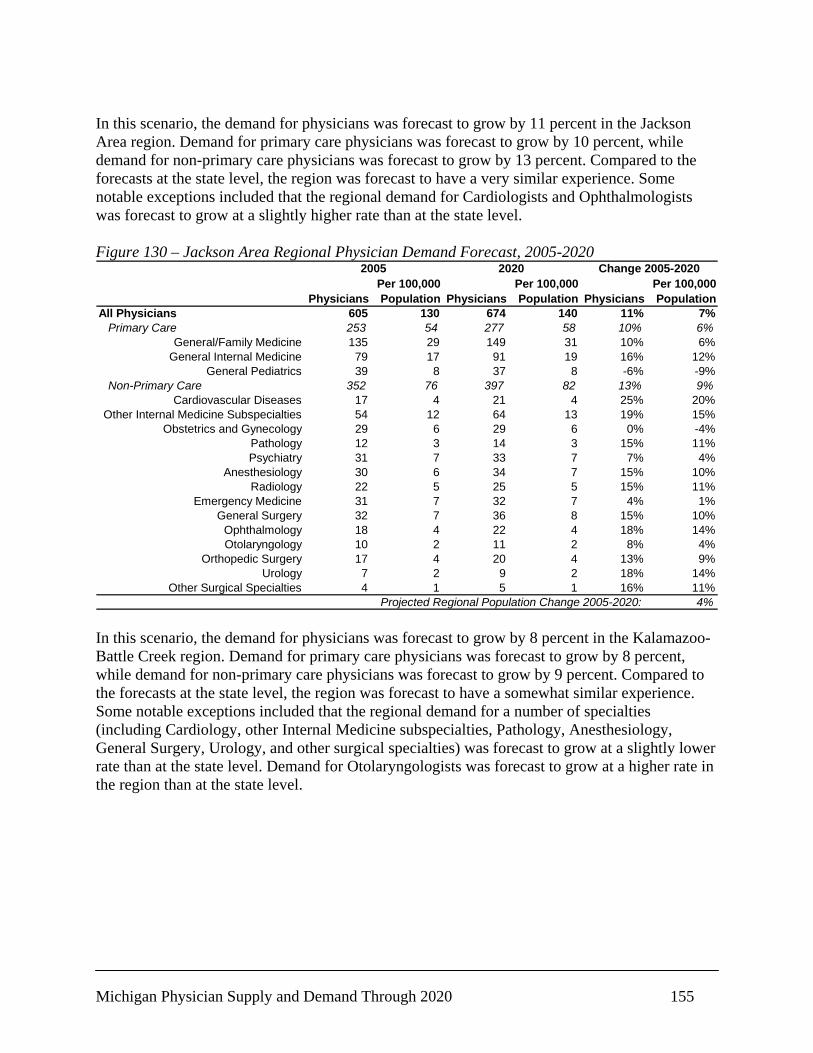
Michigan Physician Supply and Demand Through 2020 155
In this scenario, the demand for physicians was forecast to grow by 11 percent in the Jackson Area region. Demand for primary care physicians was forecast to grow by 10 percent, while demand for non-primary care physicians was forecast to grow by 13 percent. Compared to the forecasts at the state level, the region was forecast to have a very similar experience. Some notable exceptions included that the regional demand for Cardiologists and Ophthalmologists was forecast to grow at a slightly higher rate than at the state level. Figure 130 – Jackson Area Regional Physician Demand Forecast, 2005-2020
PhysiciansPer 100,000 Population Physicians
Per 100,000 Population Physicians
Per 100,000 Population
All Physicians 605 130 674 140 11% 7%Primary Care 253 54 277 58 10% 6%
General/Family Medicine 135 29 149 31 10% 6%General Internal Medicine 79 17 91 19 16% 12%
General Pediatrics 39 8 37 8 -6% -9%Non-Primary Care 352 76 397 82 13% 9%
Cardiovascular Diseases 17 4 21 4 25% 20%Other Internal Medicine Subspecialties 54 12 64 13 19% 15%
Obstetrics and Gynecology 29 6 29 6 0% -4%Pathology 12 3 14 3 15% 11%Psychiatry 31 7 33 7 7% 4%
Anesthesiology 30 6 34 7 15% 10%Radiology 22 5 25 5 15% 11%
Emergency Medicine 31 7 32 7 4% 1%General Surgery 32 7 36 8 15% 10%
Ophthalmology 18 4 22 4 18% 14%Otolaryngology 10 2 11 2 8% 4%
Orthopedic Surgery 17 4 20 4 13% 9%Urology 7 2 9 2 18% 14%
Other Surgical Specialties 4 1 5 1 16% 11%4%Projected Regional Population Change 2005-2020:
Change 2005-202020202005
In this scenario, the demand for physicians was forecast to grow by 8 percent in the Kalamazoo-Battle Creek region. Demand for primary care physicians was forecast to grow by 8 percent, while demand for non-primary care physicians was forecast to grow by 9 percent. Compared to the forecasts at the state level, the region was forecast to have a somewhat similar experience. Some notable exceptions included that the regional demand for a number of specialties (including Cardiology, other Internal Medicine subspecialties, Pathology, Anesthesiology, General Surgery, Urology, and other surgical specialties) was forecast to grow at a slightly lower rate than at the state level. Demand for Otolaryngologists was forecast to grow at a higher rate in the region than at the state level.
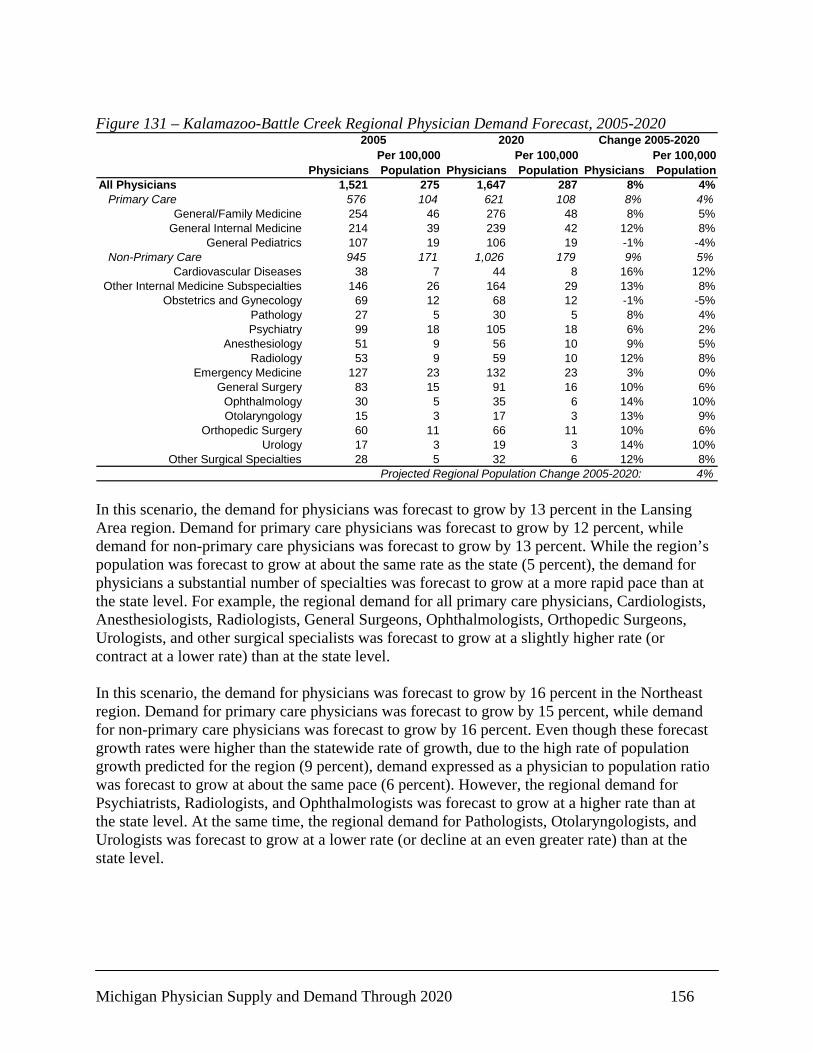
Michigan Physician Supply and Demand Through 2020 156
Figure 131 – Kalamazoo-Battle Creek Regional Physician Demand Forecast, 2005-2020
PhysiciansPer 100,000 Population Physicians
Per 100,000 Population Physicians
Per 100,000 Population
All Physicians 1,521 275 1,647 287 8% 4%Primary Care 576 104 621 108 8% 4%
General/Family Medicine 254 46 276 48 8% 5%General Internal Medicine 214 39 239 42 12% 8%
General Pediatrics 107 19 106 19 -1% -4%Non-Primary Care 945 171 1,026 179 9% 5%
Cardiovascular Diseases 38 7 44 8 16% 12%Other Internal Medicine Subspecialties 146 26 164 29 13% 8%
Obstetrics and Gynecology 69 12 68 12 -1% -5%Pathology 27 5 30 5 8% 4%Psychiatry 99 18 105 18 6% 2%
Anesthesiology 51 9 56 10 9% 5%Radiology 53 9 59 10 12% 8%
Emergency Medicine 127 23 132 23 3% 0%General Surgery 83 15 91 16 10% 6%
Ophthalmology 30 5 35 6 14% 10%Otolaryngology 15 3 17 3 13% 9%
Orthopedic Surgery 60 11 66 11 10% 6%Urology 17 3 19 3 14% 10%
Other Surgical Specialties 28 5 32 6 12% 8%4%Projected Regional Population Change 2005-2020:
Change 2005-202020202005
In this scenario, the demand for physicians was forecast to grow by 13 percent in the Lansing Area region. Demand for primary care physicians was forecast to grow by 12 percent, while demand for non-primary care physicians was forecast to grow by 13 percent. While the region’s population was forecast to grow at about the same rate as the state (5 percent), the demand for physicians a substantial number of specialties was forecast to grow at a more rapid pace than at the state level. For example, the regional demand for all primary care physicians, Cardiologists, Anesthesiologists, Radiologists, General Surgeons, Ophthalmologists, Orthopedic Surgeons, Urologists, and other surgical specialists was forecast to grow at a slightly higher rate (or contract at a lower rate) than at the state level. In this scenario, the demand for physicians was forecast to grow by 16 percent in the Northeast region. Demand for primary care physicians was forecast to grow by 15 percent, while demand for non-primary care physicians was forecast to grow by 16 percent. Even though these forecast growth rates were higher than the statewide rate of growth, due to the high rate of population growth predicted for the region (9 percent), demand expressed as a physician to population ratio was forecast to grow at about the same pace (6 percent). However, the regional demand for Psychiatrists, Radiologists, and Ophthalmologists was forecast to grow at a higher rate than at the state level. At the same time, the regional demand for Pathologists, Otolaryngologists, and Urologists was forecast to grow at a lower rate (or decline at an even greater rate) than at the state level.
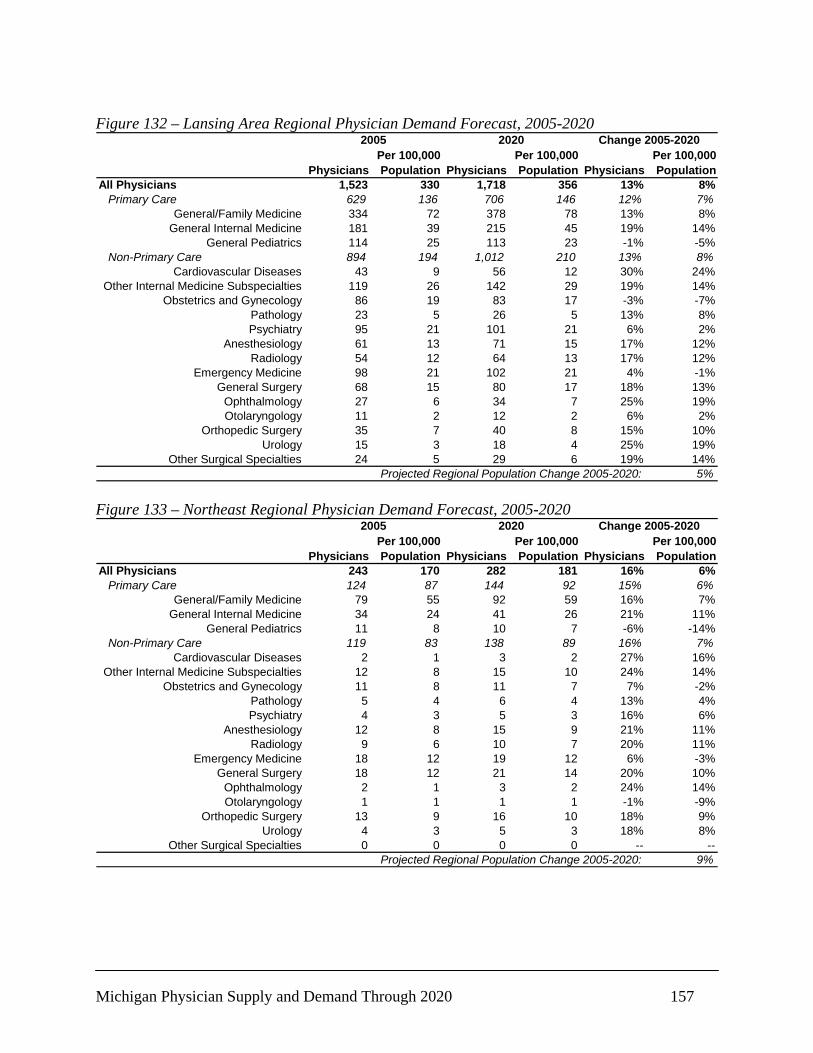
Michigan Physician Supply and Demand Through 2020 157
Figure 132 – Lansing Area Regional Physician Demand Forecast, 2005-2020
PhysiciansPer 100,000 Population Physicians
Per 100,000 Population Physicians
Per 100,000 Population
All Physicians 1,523 330 1,718 356 13% 8%Primary Care 629 136 706 146 12% 7%
General/Family Medicine 334 72 378 78 13% 8%General Internal Medicine 181 39 215 45 19% 14%
General Pediatrics 114 25 113 23 -1% -5%Non-Primary Care 894 194 1,012 210 13% 8%
Cardiovascular Diseases 43 9 56 12 30% 24%Other Internal Medicine Subspecialties 119 26 142 29 19% 14%
Obstetrics and Gynecology 86 19 83 17 -3% -7%Pathology 23 5 26 5 13% 8%Psychiatry 95 21 101 21 6% 2%
Anesthesiology 61 13 71 15 17% 12%Radiology 54 12 64 13 17% 12%
Emergency Medicine 98 21 102 21 4% -1%General Surgery 68 15 80 17 18% 13%
Ophthalmology 27 6 34 7 25% 19%Otolaryngology 11 2 12 2 6% 2%
Orthopedic Surgery 35 7 40 8 15% 10%Urology 15 3 18 4 25% 19%
Other Surgical Specialties 24 5 29 6 19% 14%5%Projected Regional Population Change 2005-2020:
Change 2005-202020202005
Figure 133 – Northeast Regional Physician Demand Forecast, 2005-2020
PhysiciansPer 100,000 Population Physicians
Per 100,000 Population Physicians
Per 100,000 Population
All Physicians 243 170 282 181 16% 6%Primary Care 124 87 144 92 15% 6%
General/Family Medicine 79 55 92 59 16% 7%General Internal Medicine 34 24 41 26 21% 11%
General Pediatrics 11 8 10 7 -6% -14%Non-Primary Care 119 83 138 89 16% 7%
Cardiovascular Diseases 2 1 3 2 27% 16%Other Internal Medicine Subspecialties 12 8 15 10 24% 14%
Obstetrics and Gynecology 11 8 11 7 7% -2%Pathology 5 4 6 4 13% 4%Psychiatry 4 3 5 3 16% 6%
Anesthesiology 12 8 15 9 21% 11%Radiology 9 6 10 7 20% 11%
Emergency Medicine 18 12 19 12 6% -3%General Surgery 18 12 21 14 20% 10%
Ophthalmology 2 1 3 2 24% 14%Otolaryngology 1 1 1 1 -1% -9%
Orthopedic Surgery 13 9 16 10 18% 9%Urology 4 3 5 3 18% 8%
Other Surgical Specialties 0 0 0 0 -- --9%Projected Regional Population Change 2005-2020:
Change 2005-202020202005

Michigan Physician Supply and Demand Through 2020 158
In this scenario, the demand for physicians was forecast to grow by 29 percent in the Northwest region. Demand for primary care physicians was forecast to grow by 27 percent, while demand for non-primary care physicians was forecast to grow by 30 percent. Even though these forecast growth rates were greater than the statewide rate of growth, due to the higher rate of population growth predicted for the region (17 percent), demand expressed as a physician to population ratio was forecast to grow at a much slower pace (10 percent). Further, demand for Pediatricians and Obstetrician/Gynecologists was forecast to grow more slowly than the forecast rate of population growth in the region, resulting in a decline in the demand for these specialties expressed as a physician to population ratio. However, even after accounting for the forecast population growth, in many specialties, especially Cardiology, other Internal Medicine Subspecialties, Pathology, Orthopedic Surgery, and Otolaryngology, demand was forecast to grow substantially over the forecast period at rates higher than forecast at the state level. Figure 134 – Northwest Regional Physician Demand Forecast, 2005-2020
PhysiciansPer 100,000 Population Physicians
Per 100,000 Population Physicians
Per 100,000 Population
All Physicians 853 286 1,099 314 29% 10%Primary Care 341 114 433 124 27% 8%
General/Family Medicine 204 68 261 75 28% 9%General Internal Medicine 103 35 139 40 35% 15%
General Pediatrics 33 11 33 10 -1% -15%Non-Primary Care 512 172 666 190 30% 11%
Cardiovascular Diseases 23 8 32 9 41% 20%Other Internal Medicine Subspecialties 56 19 77 22 38% 17%
Obstetrics and Gynecology 41 14 46 13 12% -5%Pathology 21 7 29 8 37% 17%Psychiatry 36 12 44 12 22% 4%
Anesthesiology 49 17 64 18 31% 12%Radiology 37 12 50 14 35% 15%
Emergency Medicine 50 17 59 17 18% 1%General Surgery 47 16 63 18 34% 14%
Ophthalmology 25 8 34 10 36% 16%Otolaryngology 10 3 14 4 38% 18%
Orthopedic Surgery 33 11 45 13 35% 15%Urology 11 4 15 4 31% 12%
Other Surgical Specialties 19 6 26 7 35% 15%17%Projected Regional Population Change 2005-2020:
Change 2005-202020202005
In this scenario, the demand for physicians was forecast to grow by 10 percent in the Saginaw-Thumb region. Demand for primary care physicians was forecast to grow by 9 percent, while demand for non-primary care physicians was forecast to grow by 10 percent. Even though these forecast growth rates were slightly lower than the statewide rate of growth, due to the lower rate of population growth predicted for the region (1 percent), demand expressed as a physician to population ratio was forecast to grow at a faster pace (9 percent) than at the state level. Further, after accounting for the forecast population growth, in a number of specialties, especially General Internal Medicine, Cardiology, Radiology, Ophthalmology, Orthopedic Surgery, and Urology, and other surgical specialties, demand was forecast to grow at rates higher than forecast at the state level.

Michigan Physician Supply and Demand Through 2020 159
Figure 135 – Saginaw-Thumb Regional Physician Demand Forecast, 2005-2020
PhysiciansPer 100,000 Population Physicians
Per 100,000 Population Physicians
Per 100,000 Population
All Physicians 1,534 242 1,687 264 10% 9%Primary Care 654 103 715 112 9% 8%
General/Family Medicine 412 65 450 70 9% 8%General Internal Medicine 183 29 211 33 15% 14%
General Pediatrics 60 9 53 8 -10% -11%Non-Primary Care 880 139 972 152 10% 9%
Cardiovascular Diseases 44 7 54 8 22% 21%Other Internal Medicine Subspecialties 98 15 113 18 16% 14%
Obstetrics and Gynecology 78 12 75 12 -4% -5%Pathology 24 4 27 4 10% 9%Psychiatry 48 8 50 8 4% 3%
Anesthesiology 70 11 79 12 13% 12%Radiology 79 12 91 14 15% 13%
Emergency Medicine 107 17 107 17 1% 0%General Surgery 82 13 93 14 14% 12%
Ophthalmology 36 6 44 7 20% 19%Otolaryngology 20 3 21 3 5% 4%
Orthopedic Surgery 49 8 55 9 13% 12%Urology 23 4 27 4 17% 16%
Other Surgical Specialties 24 4 28 4 17% 16%1%Projected Regional Population Change 2005-2020:
Change 2005-202020202005
In this scenario, the demand for physicians was forecast to grow by 5 percent in the Southwest Michigan region. Demand for primary care physicians was forecast to grow by 5 percent, while demand for non-primary care physicians was forecast to grow by 6 percent. After accounting for the projected population change in the region (1 percent decline), the region was forecast to experience a similar rate of demand growth relative to the state as a whole. This was especially the case in the forecasts of primary care demand. Some notable exceptions included that the regional demand for several specialties (including Cardiology, Otolaryngology, and Urology) was forecast to grow at a lower rate than at the state level. In this scenario, the demand for physicians was forecast to grow by 8 percent in the Upper Peninsula region. Demand for primary care physicians was forecast to grow by 6 percent, while demand for non-primary care physicians was forecast to grow by 10 percent. After accounting for the projected population change in the region (1 percent decline), the region was forecast to experience a greater rate of demand growth relative to the state as a whole. Regional demand for General Internists, Cardiologists, other Internal Medicine Subspecialists, Pathologists, Anesthesiologists, Radiologists, General Surgeons, Ophthalmologists, Otolaryngologists, Orthopedic Surgeons, Urologists, and other surgical specialists was forecast to grow at rates exceeding those at the state level. Demand for Pediatricians and Obstetricians/Gynecologists was forecast to decline at rates exceeding those at the state level as well.
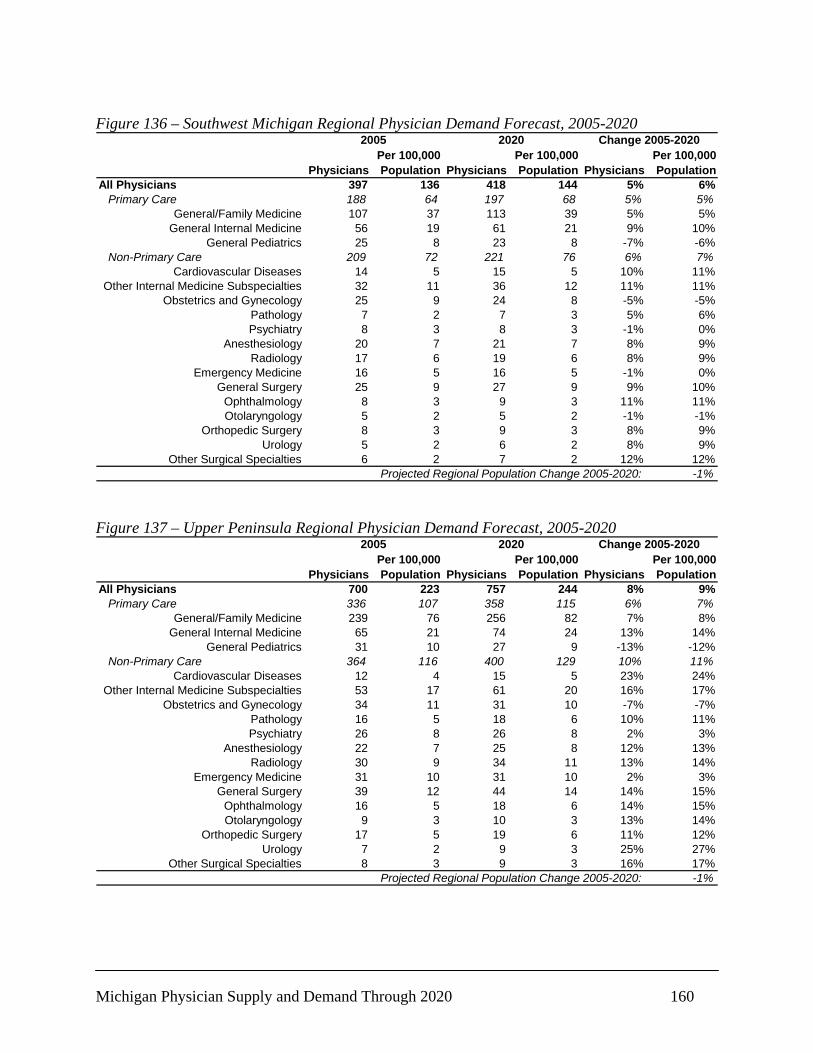
Michigan Physician Supply and Demand Through 2020 160
Figure 136 – Southwest Michigan Regional Physician Demand Forecast, 2005-2020
PhysiciansPer 100,000 Population Physicians
Per 100,000 Population Physicians
Per 100,000 Population
All Physicians 397 136 418 144 5% 6%Primary Care 188 64 197 68 5% 5%
General/Family Medicine 107 37 113 39 5% 5%General Internal Medicine 56 19 61 21 9% 10%
General Pediatrics 25 8 23 8 -7% -6%Non-Primary Care 209 72 221 76 6% 7%
Cardiovascular Diseases 14 5 15 5 10% 11%Other Internal Medicine Subspecialties 32 11 36 12 11% 11%
Obstetrics and Gynecology 25 9 24 8 -5% -5%Pathology 7 2 7 3 5% 6%Psychiatry 8 3 8 3 -1% 0%
Anesthesiology 20 7 21 7 8% 9%Radiology 17 6 19 6 8% 9%
Emergency Medicine 16 5 16 5 -1% 0%General Surgery 25 9 27 9 9% 10%
Ophthalmology 8 3 9 3 11% 11%Otolaryngology 5 2 5 2 -1% -1%
Orthopedic Surgery 8 3 9 3 8% 9%Urology 5 2 6 2 8% 9%
Other Surgical Specialties 6 2 7 2 12% 12%-1%Projected Regional Population Change 2005-2020:
Change 2005-202020202005
Figure 137 – Upper Peninsula Regional Physician Demand Forecast, 2005-2020
PhysiciansPer 100,000 Population Physicians
Per 100,000 Population Physicians
Per 100,000 Population
All Physicians 700 223 757 244 8% 9%Primary Care 336 107 358 115 6% 7%
General/Family Medicine 239 76 256 82 7% 8%General Internal Medicine 65 21 74 24 13% 14%
General Pediatrics 31 10 27 9 -13% -12%Non-Primary Care 364 116 400 129 10% 11%
Cardiovascular Diseases 12 4 15 5 23% 24%Other Internal Medicine Subspecialties 53 17 61 20 16% 17%
Obstetrics and Gynecology 34 11 31 10 -7% -7%Pathology 16 5 18 6 10% 11%Psychiatry 26 8 26 8 2% 3%
Anesthesiology 22 7 25 8 12% 13%Radiology 30 9 34 11 13% 14%
Emergency Medicine 31 10 31 10 2% 3%General Surgery 39 12 44 14 14% 15%
Ophthalmology 16 5 18 6 14% 15%Otolaryngology 9 3 10 3 13% 14%
Orthopedic Surgery 17 5 19 6 11% 12%Urology 7 2 9 3 25% 27%
Other Surgical Specialties 8 3 9 3 16% 17%-1%Projected Regional Population Change 2005-2020:
Change 2005-202020202005
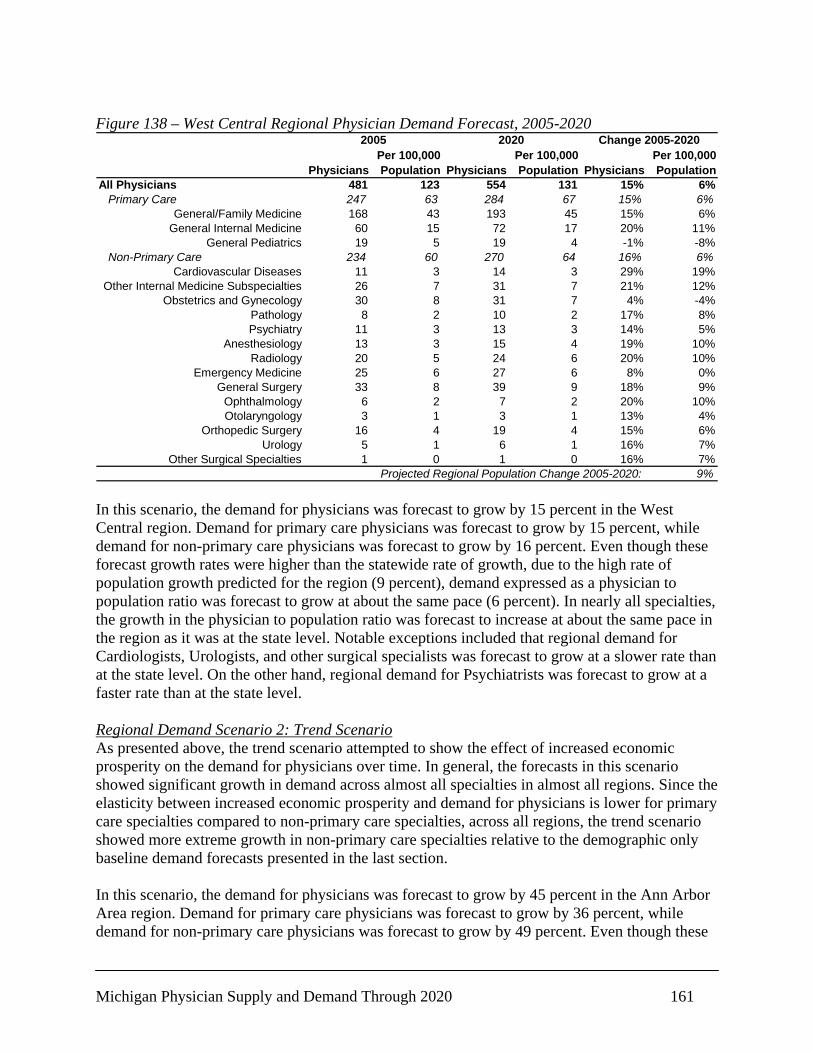
Michigan Physician Supply and Demand Through 2020 161
Figure 138 – West Central Regional Physician Demand Forecast, 2005-2020
PhysiciansPer 100,000 Population Physicians
Per 100,000 Population Physicians
Per 100,000 Population
All Physicians 481 123 554 131 15% 6%Primary Care 247 63 284 67 15% 6%
General/Family Medicine 168 43 193 45 15% 6%General Internal Medicine 60 15 72 17 20% 11%
General Pediatrics 19 5 19 4 -1% -8%Non-Primary Care 234 60 270 64 16% 6%
Cardiovascular Diseases 11 3 14 3 29% 19%Other Internal Medicine Subspecialties 26 7 31 7 21% 12%
Obstetrics and Gynecology 30 8 31 7 4% -4%Pathology 8 2 10 2 17% 8%Psychiatry 11 3 13 3 14% 5%
Anesthesiology 13 3 15 4 19% 10%Radiology 20 5 24 6 20% 10%
Emergency Medicine 25 6 27 6 8% 0%General Surgery 33 8 39 9 18% 9%
Ophthalmology 6 2 7 2 20% 10%Otolaryngology 3 1 3 1 13% 4%
Orthopedic Surgery 16 4 19 4 15% 6%Urology 5 1 6 1 16% 7%
Other Surgical Specialties 1 0 1 0 16% 7%9%Projected Regional Population Change 2005-2020:
Change 2005-202020202005
In this scenario, the demand for physicians was forecast to grow by 15 percent in the West Central region. Demand for primary care physicians was forecast to grow by 15 percent, while demand for non-primary care physicians was forecast to grow by 16 percent. Even though these forecast growth rates were higher than the statewide rate of growth, due to the high rate of population growth predicted for the region (9 percent), demand expressed as a physician to population ratio was forecast to grow at about the same pace (6 percent). In nearly all specialties, the growth in the physician to population ratio was forecast to increase at about the same pace in the region as it was at the state level. Notable exceptions included that regional demand for Cardiologists, Urologists, and other surgical specialists was forecast to grow at a slower rate than at the state level. On the other hand, regional demand for Psychiatrists was forecast to grow at a faster rate than at the state level. Regional Demand Scenario 2: Trend Scenario As presented above, the trend scenario attempted to show the effect of increased economic prosperity on the demand for physicians over time. In general, the forecasts in this scenario showed significant growth in demand across almost all specialties in almost all regions. Since the elasticity between increased economic prosperity and demand for physicians is lower for primary care specialties compared to non-primary care specialties, across all regions, the trend scenario showed more extreme growth in non-primary care specialties relative to the demographic only baseline demand forecasts presented in the last section. In this scenario, the demand for physicians was forecast to grow by 45 percent in the Ann Arbor Area region. Demand for primary care physicians was forecast to grow by 36 percent, while demand for non-primary care physicians was forecast to grow by 49 percent. Even though these

Michigan Physician Supply and Demand Through 2020 162
forecast growth rates were greater than the statewide rate of growth, due to the higher rate of population growth predicted for the region (17 percent), demand expressed as a physician to population ratio was forecast to grow at a slower pace (25 percent). Further, in all specialties except Obstetrics and Gynecology and Otolaryngology regional demand was forecast to grow more quickly than the forecast rate of growth for the state as a whole. In particular, demand for Cardiologists, Ophthalmologists, and Urologists, demand was forecast to grow substantially (in excess of 35 percent) over the forecast period. Figure 139 – Ann Arbor Area Regional Physician Demand Forecast, 2005-2020
PhysiciansPer 100,000 Population Physicians
Per 100,000 Population Physicians
Per 100,000 Population
All Physicians 3,546 672 5,158 837 45% 25%Primary Care 988 187 1,344 218 36% 16%
General/Family Medicine 234 44 317 51 35% 16%General Internal Medicine 543 103 782 127 44% 23%
General Pediatrics 211 40 245 40 16% 0%Non-Primary Care 2,557 485 3,814 619 49% 28%
Cardiovascular Diseases 89 17 152 25 70% 45%Other Internal Medicine Subspecialties 532 101 829 135 56% 33%
Obstetrics and Gynecology 154 29 198 32 29% 10%Pathology 117 22 173 28 48% 26%Psychiatry 221 42 304 49 38% 18%
Anesthesiology 183 35 278 45 52% 30%Radiology 160 30 246 40 54% 32%
Emergency Medicine 149 28 202 33 36% 16%General Surgery 182 34 280 45 54% 32%
Ophthalmology 66 12 106 17 61% 38%Otolaryngology 45 8 61 10 36% 17%
Orthopedic Surgery 88 17 130 21 48% 27%Urology 50 9 80 13 60% 37%
Other Surgical Specialties 93 18 141 23 51% 30%17%Projected Regional Population Change 2005-2020:
Change 2005-202020202005

Michigan Physician Supply and Demand Through 2020 163
Figure 140 – Detroit Area Regional Physician Demand Forecast, 2005-2020
PhysiciansPer 100,000 Population Physicians
Per 100,000 Population Physicians
Per 100,000 Population
All Physicians 14,632 342 17,377 400 19% 17%Primary Care 5,518 129 6,228 143 13% 11%
General/Family Medicine 1,934 45 2,200 51 14% 12%General Internal Medicine 2,579 60 3,023 70 17% 15%
General Pediatrics 1,006 24 1,005 23 0% -2%Non-Primary Care 9,114 213 11,149 257 22% 20%
Cardiovascular Diseases 369 9 483 11 31% 29%Other Internal Medicine Subspecialties 1,489 35 1,874 43 26% 24%
Obstetrics and Gynecology 886 21 1,000 23 13% 11%Pathology 374 9 457 11 22% 21%Psychiatry 657 15 773 18 18% 16%
Anesthesiology 574 13 711 16 24% 22%Radiology 686 16 852 20 24% 22%
Emergency Medicine 750 18 874 20 17% 15%General Surgery 802 19 1,005 23 25% 23%
Ophthalmology 348 8 443 10 27% 25%Otolaryngology 141 3 168 4 19% 17%
Orthopedic Surgery 358 8 440 10 23% 21%Urology 181 4 232 5 29% 27%
Other Surgical Specialties 266 6 333 8 25% 23%2%Projected Regional Population Change 2005-2020:
Change 2005-202020202005
Figure 141 – East Central Regional Physician Demand Forecast, 2005-2020
PhysiciansPer 100,000 Population Physicians
Per 100,000 Population Physicians
Per 100,000 Population
All Physicians 151 100 193 117 28% 17%Primary Care 88 59 110 67 25% 14%
General/Family Medicine 55 37 69 42 25% 14%General Internal Medicine 26 18 34 21 29% 18%
General Pediatrics 7 4 7 4 1% -8%Non-Primary Care 63 42 83 50 32% 21%
Cardiovascular Diseases 1 1 2 1 46% 33%Other Internal Medicine Subspecialties 12 8 17 10 42% 30%
Obstetrics and Gynecology 9 6 10 6 15% 5%Pathology 3 2 4 2 30% 19%Psychiatry 2 1 3 2 33% 22%
Anesthesiology 2 1 3 2 37% 25%Radiology 1 1 1 1 37% 25%
Emergency Medicine 11 7 14 8 30% 18%General Surgery 11 7 15 9 37% 25%
Ophthalmology 2 1 3 2 39% 27%Otolaryngology 4 3 5 3 14% 4%
Orthopedic Surgery 0 0 0 0 -- --Urology 1 1 1 1 36% 24%
Other Surgical Specialties 1 1 2 1 45% 32%9%Projected Regional Population Change 2005-2020:
Change 2005-202020202005
In this scenario, the demand for physicians was forecast to grow by 19 percent in the Detroit Area region. Demand for primary care physicians was forecast to grow by 13 percent, while demand for non-primary care physicians was forecast to grow by 22 percent. Because these
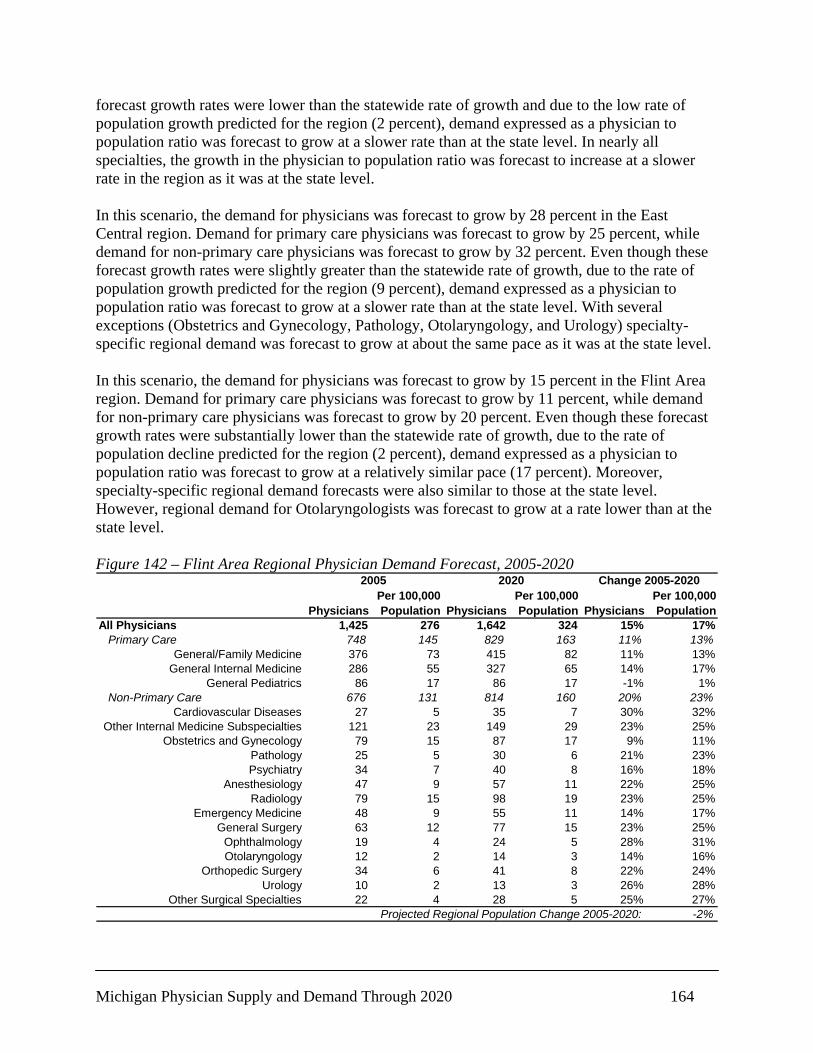
Michigan Physician Supply and Demand Through 2020 164
forecast growth rates were lower than the statewide rate of growth and due to the low rate of population growth predicted for the region (2 percent), demand expressed as a physician to population ratio was forecast to grow at a slower rate than at the state level. In nearly all specialties, the growth in the physician to population ratio was forecast to increase at a slower rate in the region as it was at the state level. In this scenario, the demand for physicians was forecast to grow by 28 percent in the East Central region. Demand for primary care physicians was forecast to grow by 25 percent, while demand for non-primary care physicians was forecast to grow by 32 percent. Even though these forecast growth rates were slightly greater than the statewide rate of growth, due to the rate of population growth predicted for the region (9 percent), demand expressed as a physician to population ratio was forecast to grow at a slower rate than at the state level. With several exceptions (Obstetrics and Gynecology, Pathology, Otolaryngology, and Urology) specialty-specific regional demand was forecast to grow at about the same pace as it was at the state level. In this scenario, the demand for physicians was forecast to grow by 15 percent in the Flint Area region. Demand for primary care physicians was forecast to grow by 11 percent, while demand for non-primary care physicians was forecast to grow by 20 percent. Even though these forecast growth rates were substantially lower than the statewide rate of growth, due to the rate of population decline predicted for the region (2 percent), demand expressed as a physician to population ratio was forecast to grow at a relatively similar pace (17 percent). Moreover, specialty-specific regional demand forecasts were also similar to those at the state level. However, regional demand for Otolaryngologists was forecast to grow at a rate lower than at the state level. Figure 142 – Flint Area Regional Physician Demand Forecast, 2005-2020
PhysiciansPer 100,000 Population Physicians
Per 100,000 Population Physicians
Per 100,000 Population
All Physicians 1,425 276 1,642 324 15% 17%Primary Care 748 145 829 163 11% 13%
General/Family Medicine 376 73 415 82 11% 13%General Internal Medicine 286 55 327 65 14% 17%
General Pediatrics 86 17 86 17 -1% 1%Non-Primary Care 676 131 814 160 20% 23%
Cardiovascular Diseases 27 5 35 7 30% 32%Other Internal Medicine Subspecialties 121 23 149 29 23% 25%
Obstetrics and Gynecology 79 15 87 17 9% 11%Pathology 25 5 30 6 21% 23%Psychiatry 34 7 40 8 16% 18%
Anesthesiology 47 9 57 11 22% 25%Radiology 79 15 98 19 23% 25%
Emergency Medicine 48 9 55 11 14% 17%General Surgery 63 12 77 15 23% 25%
Ophthalmology 19 4 24 5 28% 31%Otolaryngology 12 2 14 3 14% 16%
Orthopedic Surgery 34 6 41 8 22% 24%Urology 10 2 13 3 26% 28%
Other Surgical Specialties 22 4 28 5 25% 27%-2%Projected Regional Population Change 2005-2020:
Change 2005-202020202005
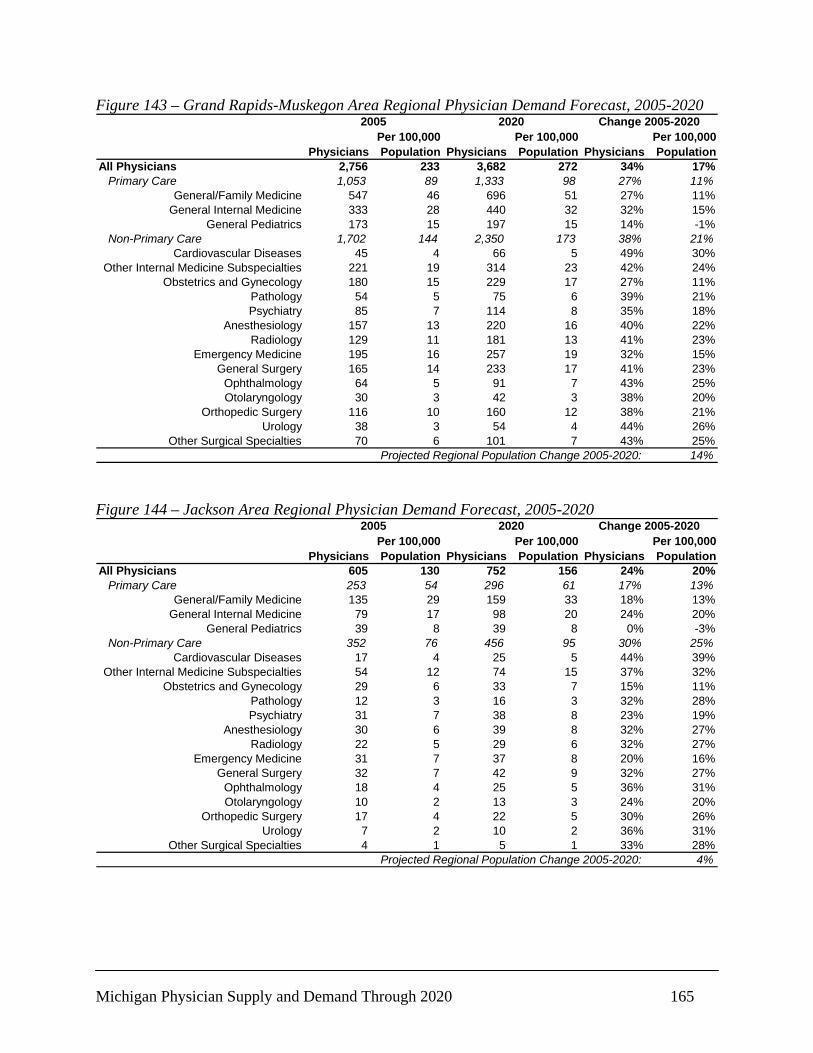
Michigan Physician Supply and Demand Through 2020 165
Figure 143 – Grand Rapids-Muskegon Area Regional Physician Demand Forecast, 2005-2020
PhysiciansPer 100,000 Population Physicians
Per 100,000 Population Physicians
Per 100,000 Population
All Physicians 2,756 233 3,682 272 34% 17%Primary Care 1,053 89 1,333 98 27% 11%
General/Family Medicine 547 46 696 51 27% 11%General Internal Medicine 333 28 440 32 32% 15%
General Pediatrics 173 15 197 15 14% -1%Non-Primary Care 1,702 144 2,350 173 38% 21%
Cardiovascular Diseases 45 4 66 5 49% 30%Other Internal Medicine Subspecialties 221 19 314 23 42% 24%
Obstetrics and Gynecology 180 15 229 17 27% 11%Pathology 54 5 75 6 39% 21%Psychiatry 85 7 114 8 35% 18%
Anesthesiology 157 13 220 16 40% 22%Radiology 129 11 181 13 41% 23%
Emergency Medicine 195 16 257 19 32% 15%General Surgery 165 14 233 17 41% 23%
Ophthalmology 64 5 91 7 43% 25%Otolaryngology 30 3 42 3 38% 20%
Orthopedic Surgery 116 10 160 12 38% 21%Urology 38 3 54 4 44% 26%
Other Surgical Specialties 70 6 101 7 43% 25%14%Projected Regional Population Change 2005-2020:
Change 2005-202020202005
Figure 144 – Jackson Area Regional Physician Demand Forecast, 2005-2020
PhysiciansPer 100,000 Population Physicians
Per 100,000 Population Physicians
Per 100,000 Population
All Physicians 605 130 752 156 24% 20%Primary Care 253 54 296 61 17% 13%
General/Family Medicine 135 29 159 33 18% 13%General Internal Medicine 79 17 98 20 24% 20%
General Pediatrics 39 8 39 8 0% -3%Non-Primary Care 352 76 456 95 30% 25%
Cardiovascular Diseases 17 4 25 5 44% 39%Other Internal Medicine Subspecialties 54 12 74 15 37% 32%
Obstetrics and Gynecology 29 6 33 7 15% 11%Pathology 12 3 16 3 32% 28%Psychiatry 31 7 38 8 23% 19%
Anesthesiology 30 6 39 8 32% 27%Radiology 22 5 29 6 32% 27%
Emergency Medicine 31 7 37 8 20% 16%General Surgery 32 7 42 9 32% 27%
Ophthalmology 18 4 25 5 36% 31%Otolaryngology 10 2 13 3 24% 20%
Orthopedic Surgery 17 4 22 5 30% 26%Urology 7 2 10 2 36% 31%
Other Surgical Specialties 4 1 5 1 33% 28%4%Projected Regional Population Change 2005-2020:
Change 2005-202020202005
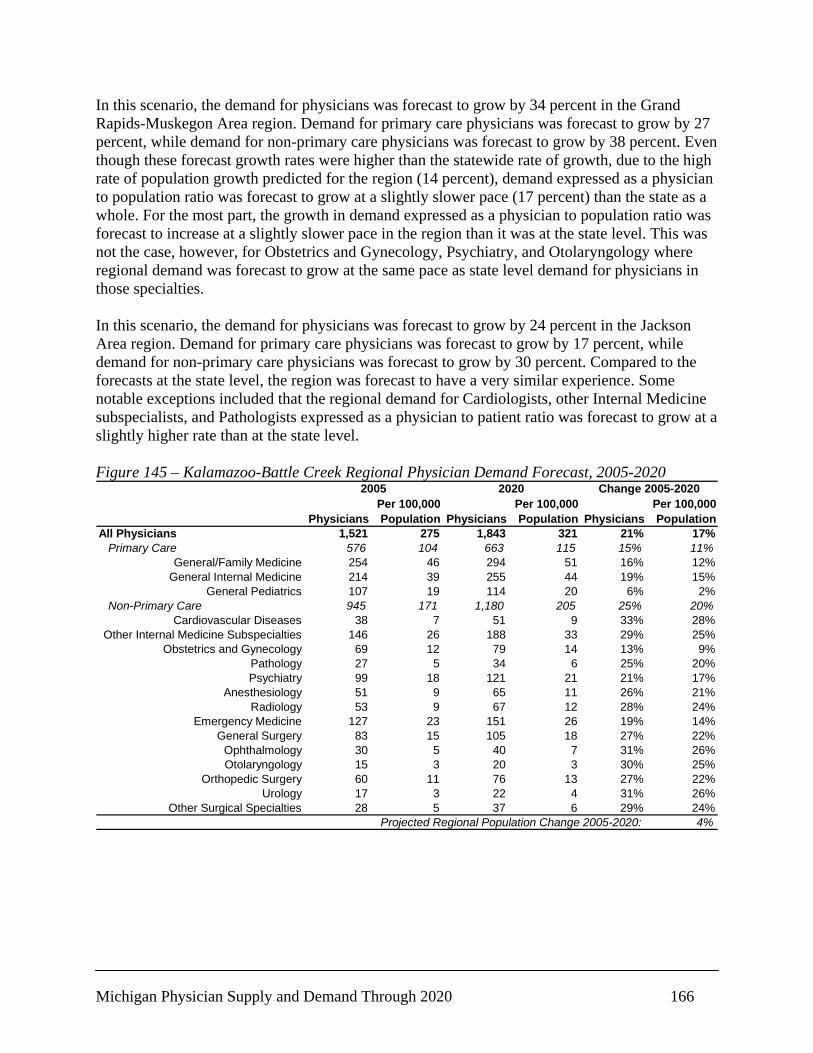
Michigan Physician Supply and Demand Through 2020 166
In this scenario, the demand for physicians was forecast to grow by 34 percent in the Grand Rapids-Muskegon Area region. Demand for primary care physicians was forecast to grow by 27 percent, while demand for non-primary care physicians was forecast to grow by 38 percent. Even though these forecast growth rates were higher than the statewide rate of growth, due to the high rate of population growth predicted for the region (14 percent), demand expressed as a physician to population ratio was forecast to grow at a slightly slower pace (17 percent) than the state as a whole. For the most part, the growth in demand expressed as a physician to population ratio was forecast to increase at a slightly slower pace in the region than it was at the state level. This was not the case, however, for Obstetrics and Gynecology, Psychiatry, and Otolaryngology where regional demand was forecast to grow at the same pace as state level demand for physicians in those specialties. In this scenario, the demand for physicians was forecast to grow by 24 percent in the Jackson Area region. Demand for primary care physicians was forecast to grow by 17 percent, while demand for non-primary care physicians was forecast to grow by 30 percent. Compared to the forecasts at the state level, the region was forecast to have a very similar experience. Some notable exceptions included that the regional demand for Cardiologists, other Internal Medicine subspecialists, and Pathologists expressed as a physician to patient ratio was forecast to grow at a slightly higher rate than at the state level. Figure 145 – Kalamazoo-Battle Creek Regional Physician Demand Forecast, 2005-2020
PhysiciansPer 100,000 Population Physicians
Per 100,000 Population Physicians
Per 100,000 Population
All Physicians 1,521 275 1,843 321 21% 17%Primary Care 576 104 663 115 15% 11%
General/Family Medicine 254 46 294 51 16% 12%General Internal Medicine 214 39 255 44 19% 15%
General Pediatrics 107 19 114 20 6% 2%Non-Primary Care 945 171 1,180 205 25% 20%
Cardiovascular Diseases 38 7 51 9 33% 28%Other Internal Medicine Subspecialties 146 26 188 33 29% 25%
Obstetrics and Gynecology 69 12 79 14 13% 9%Pathology 27 5 34 6 25% 20%Psychiatry 99 18 121 21 21% 17%
Anesthesiology 51 9 65 11 26% 21%Radiology 53 9 67 12 28% 24%
Emergency Medicine 127 23 151 26 19% 14%General Surgery 83 15 105 18 27% 22%
Ophthalmology 30 5 40 7 31% 26%Otolaryngology 15 3 20 3 30% 25%
Orthopedic Surgery 60 11 76 13 27% 22%Urology 17 3 22 4 31% 26%
Other Surgical Specialties 28 5 37 6 29% 24%4%Projected Regional Population Change 2005-2020:
Change 2005-202020202005
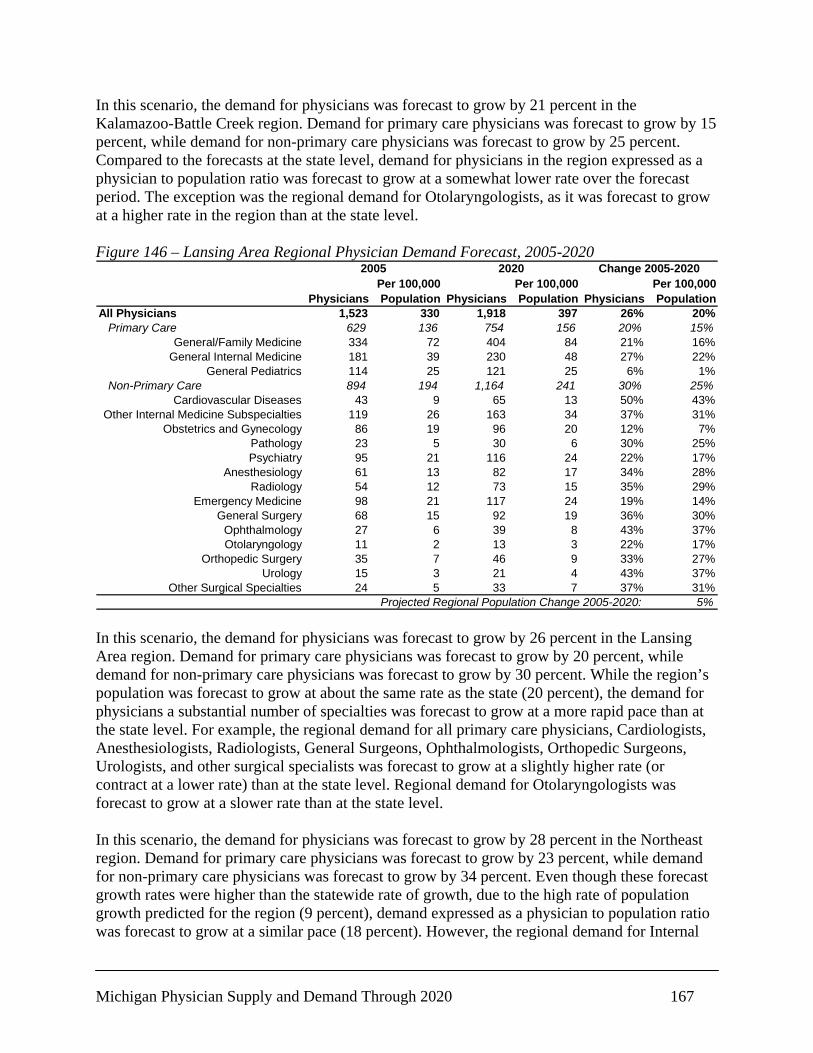
Michigan Physician Supply and Demand Through 2020 167
In this scenario, the demand for physicians was forecast to grow by 21 percent in the Kalamazoo-Battle Creek region. Demand for primary care physicians was forecast to grow by 15 percent, while demand for non-primary care physicians was forecast to grow by 25 percent. Compared to the forecasts at the state level, demand for physicians in the region expressed as a physician to population ratio was forecast to grow at a somewhat lower rate over the forecast period. The exception was the regional demand for Otolaryngologists, as it was forecast to grow at a higher rate in the region than at the state level. Figure 146 – Lansing Area Regional Physician Demand Forecast, 2005-2020
PhysiciansPer 100,000 Population Physicians
Per 100,000 Population Physicians
Per 100,000 Population
All Physicians 1,523 330 1,918 397 26% 20%Primary Care 629 136 754 156 20% 15%
General/Family Medicine 334 72 404 84 21% 16%General Internal Medicine 181 39 230 48 27% 22%
General Pediatrics 114 25 121 25 6% 1%Non-Primary Care 894 194 1,164 241 30% 25%
Cardiovascular Diseases 43 9 65 13 50% 43%Other Internal Medicine Subspecialties 119 26 163 34 37% 31%
Obstetrics and Gynecology 86 19 96 20 12% 7%Pathology 23 5 30 6 30% 25%Psychiatry 95 21 116 24 22% 17%
Anesthesiology 61 13 82 17 34% 28%Radiology 54 12 73 15 35% 29%
Emergency Medicine 98 21 117 24 19% 14%General Surgery 68 15 92 19 36% 30%
Ophthalmology 27 6 39 8 43% 37%Otolaryngology 11 2 13 3 22% 17%
Orthopedic Surgery 35 7 46 9 33% 27%Urology 15 3 21 4 43% 37%
Other Surgical Specialties 24 5 33 7 37% 31%5%Projected Regional Population Change 2005-2020:
Change 2005-202020202005
In this scenario, the demand for physicians was forecast to grow by 26 percent in the Lansing Area region. Demand for primary care physicians was forecast to grow by 20 percent, while demand for non-primary care physicians was forecast to grow by 30 percent. While the region’s population was forecast to grow at about the same rate as the state (20 percent), the demand for physicians a substantial number of specialties was forecast to grow at a more rapid pace than at the state level. For example, the regional demand for all primary care physicians, Cardiologists, Anesthesiologists, Radiologists, General Surgeons, Ophthalmologists, Orthopedic Surgeons, Urologists, and other surgical specialists was forecast to grow at a slightly higher rate (or contract at a lower rate) than at the state level. Regional demand for Otolaryngologists was forecast to grow at a slower rate than at the state level. In this scenario, the demand for physicians was forecast to grow by 28 percent in the Northeast region. Demand for primary care physicians was forecast to grow by 23 percent, while demand for non-primary care physicians was forecast to grow by 34 percent. Even though these forecast growth rates were higher than the statewide rate of growth, due to the high rate of population growth predicted for the region (9 percent), demand expressed as a physician to population ratio was forecast to grow at a similar pace (18 percent). However, the regional demand for Internal
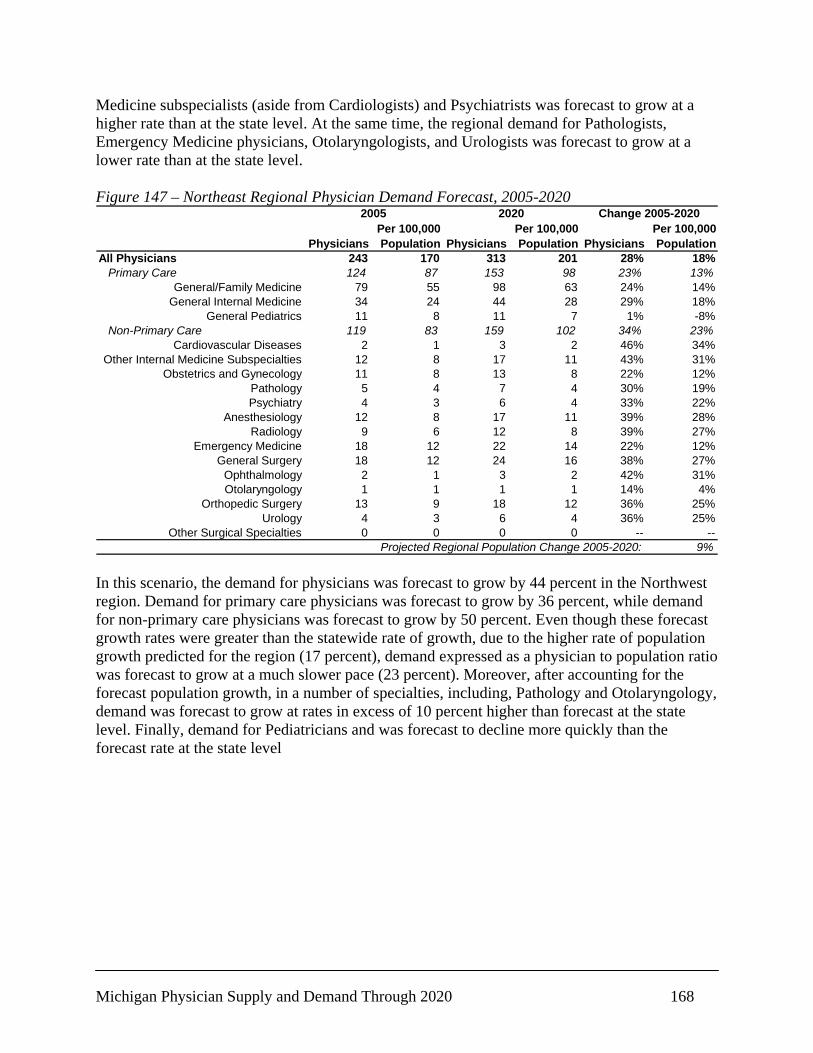
Michigan Physician Supply and Demand Through 2020 168
Medicine subspecialists (aside from Cardiologists) and Psychiatrists was forecast to grow at a higher rate than at the state level. At the same time, the regional demand for Pathologists, Emergency Medicine physicians, Otolaryngologists, and Urologists was forecast to grow at a lower rate than at the state level. Figure 147 – Northeast Regional Physician Demand Forecast, 2005-2020
PhysiciansPer 100,000 Population Physicians
Per 100,000 Population Physicians
Per 100,000 Population
All Physicians 243 170 313 201 28% 18%Primary Care 124 87 153 98 23% 13%
General/Family Medicine 79 55 98 63 24% 14%General Internal Medicine 34 24 44 28 29% 18%
General Pediatrics 11 8 11 7 1% -8%Non-Primary Care 119 83 159 102 34% 23%
Cardiovascular Diseases 2 1 3 2 46% 34%Other Internal Medicine Subspecialties 12 8 17 11 43% 31%
Obstetrics and Gynecology 11 8 13 8 22% 12%Pathology 5 4 7 4 30% 19%Psychiatry 4 3 6 4 33% 22%
Anesthesiology 12 8 17 11 39% 28%Radiology 9 6 12 8 39% 27%
Emergency Medicine 18 12 22 14 22% 12%General Surgery 18 12 24 16 38% 27%
Ophthalmology 2 1 3 2 42% 31%Otolaryngology 1 1 1 1 14% 4%
Orthopedic Surgery 13 9 18 12 36% 25%Urology 4 3 6 4 36% 25%
Other Surgical Specialties 0 0 0 0 -- --9%Projected Regional Population Change 2005-2020:
Change 2005-202020202005
In this scenario, the demand for physicians was forecast to grow by 44 percent in the Northwest region. Demand for primary care physicians was forecast to grow by 36 percent, while demand for non-primary care physicians was forecast to grow by 50 percent. Even though these forecast growth rates were greater than the statewide rate of growth, due to the higher rate of population growth predicted for the region (17 percent), demand expressed as a physician to population ratio was forecast to grow at a much slower pace (23 percent). Moreover, after accounting for the forecast population growth, in a number of specialties, including, Pathology and Otolaryngology, demand was forecast to grow at rates in excess of 10 percent higher than forecast at the state level. Finally, demand for Pediatricians and was forecast to decline more quickly than the forecast rate at the state level
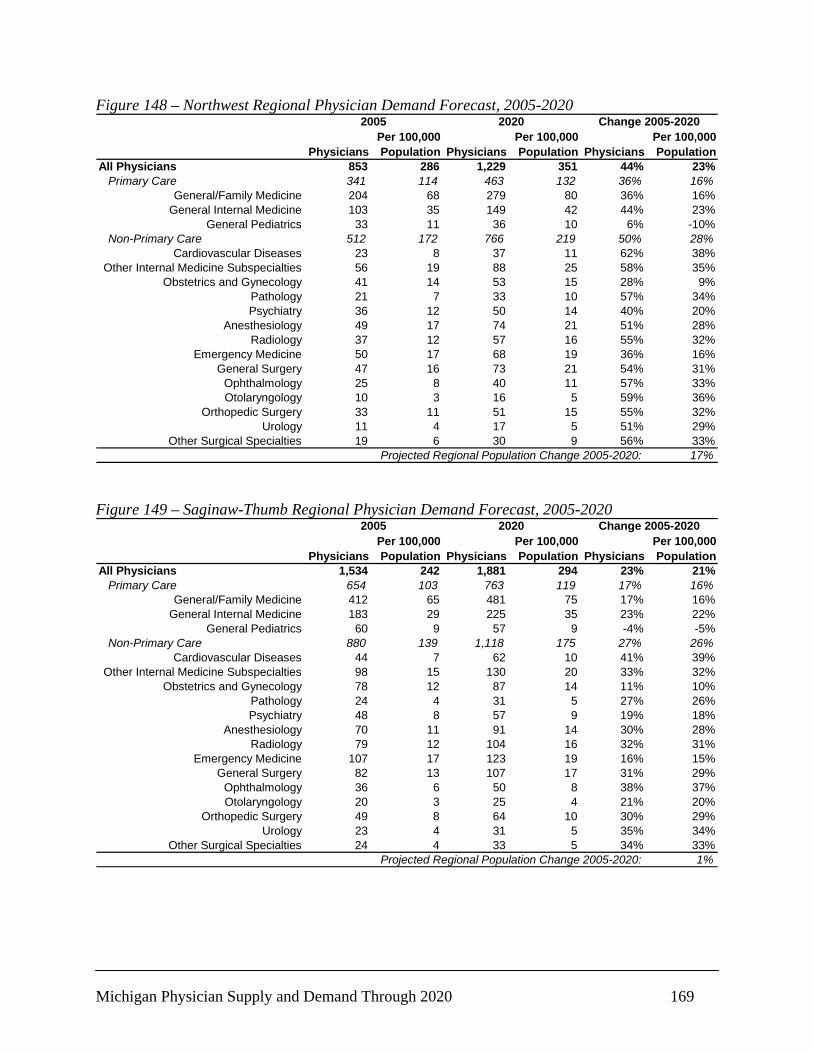
Michigan Physician Supply and Demand Through 2020 169
Figure 148 – Northwest Regional Physician Demand Forecast, 2005-2020
PhysiciansPer 100,000 Population Physicians
Per 100,000 Population Physicians
Per 100,000 Population
All Physicians 853 286 1,229 351 44% 23%Primary Care 341 114 463 132 36% 16%
General/Family Medicine 204 68 279 80 36% 16%General Internal Medicine 103 35 149 42 44% 23%
General Pediatrics 33 11 36 10 6% -10%Non-Primary Care 512 172 766 219 50% 28%
Cardiovascular Diseases 23 8 37 11 62% 38%Other Internal Medicine Subspecialties 56 19 88 25 58% 35%
Obstetrics and Gynecology 41 14 53 15 28% 9%Pathology 21 7 33 10 57% 34%Psychiatry 36 12 50 14 40% 20%
Anesthesiology 49 17 74 21 51% 28%Radiology 37 12 57 16 55% 32%
Emergency Medicine 50 17 68 19 36% 16%General Surgery 47 16 73 21 54% 31%
Ophthalmology 25 8 40 11 57% 33%Otolaryngology 10 3 16 5 59% 36%
Orthopedic Surgery 33 11 51 15 55% 32%Urology 11 4 17 5 51% 29%
Other Surgical Specialties 19 6 30 9 56% 33%17%Projected Regional Population Change 2005-2020:
Change 2005-202020202005
Figure 149 – Saginaw-Thumb Regional Physician Demand Forecast, 2005-2020
PhysiciansPer 100,000 Population Physicians
Per 100,000 Population Physicians
Per 100,000 Population
All Physicians 1,534 242 1,881 294 23% 21%Primary Care 654 103 763 119 17% 16%
General/Family Medicine 412 65 481 75 17% 16%General Internal Medicine 183 29 225 35 23% 22%
General Pediatrics 60 9 57 9 -4% -5%Non-Primary Care 880 139 1,118 175 27% 26%
Cardiovascular Diseases 44 7 62 10 41% 39%Other Internal Medicine Subspecialties 98 15 130 20 33% 32%
Obstetrics and Gynecology 78 12 87 14 11% 10%Pathology 24 4 31 5 27% 26%Psychiatry 48 8 57 9 19% 18%
Anesthesiology 70 11 91 14 30% 28%Radiology 79 12 104 16 32% 31%
Emergency Medicine 107 17 123 19 16% 15%General Surgery 82 13 107 17 31% 29%
Ophthalmology 36 6 50 8 38% 37%Otolaryngology 20 3 25 4 21% 20%
Orthopedic Surgery 49 8 64 10 30% 29%Urology 23 4 31 5 35% 34%
Other Surgical Specialties 24 4 33 5 34% 33%1%Projected Regional Population Change 2005-2020:
Change 2005-202020202005

Michigan Physician Supply and Demand Through 2020 170
In this scenario, the demand for physicians was forecast to grow by 23 percent in the Saginaw-Thumb region. Demand for primary care physicians was forecast to grow by 17 percent, while demand for non-primary care physicians was forecast to grow by 27 percent. Even though these forecast growth rates were slightly lower than the statewide rate of growth, due to the lower rate of population growth predicted for the region (1 percent), demand expressed as a physician to population ratio was forecast to grow at a slightly faster pace (21 percent) than at the state level. Further, after accounting for the forecast population growth, in a number of specialties, including, Family Medicine, General Internal Medicine, Cardiology, Radiology, Ophthalmology, Orthopedic Surgery, and Urology, and other surgical specialties, demand was forecast to grow at rates higher than forecast at the state level. In this scenario, the demand for physicians was forecast to grow by 17 percent in the Southwest Michigan region. Demand for primary care physicians was forecast to grow by 12 percent, while demand for non-primary care physicians was forecast to grow by 22 percent. After accounting for the projected population change in the region (1 percent decline), the region was forecast to experience a similar rate of demand growth relative to the state as a whole. This was especially the case in the forecasts of primary care demand. Some notable exceptions included that the regional demand for several specialties (including Cardiology, Psychiatry, Otolaryngology, and Urology) was forecast to grow at a lower rate than at the state level. Figure 150 – Southwest Michigan Regional Physician Demand Forecast, 2005-2020
PhysiciansPer 100,000 Population Physicians
Per 100,000 Population Physicians
Per 100,000 Population
All Physicians 397 136 465 160 17% 18%Primary Care 188 64 210 72 12% 12%
General/Family Medicine 107 37 120 41 12% 13%General Internal Medicine 56 19 65 23 16% 17%
General Pediatrics 25 8 25 8 -1% 0%Non-Primary Care 209 72 254 88 22% 23%
Cardiovascular Diseases 14 5 18 6 26% 27%Other Internal Medicine Subspecialties 32 11 41 14 27% 28%
Obstetrics and Gynecology 25 9 28 10 9% 10%Pathology 7 2 8 3 21% 22%Psychiatry 8 3 9 3 14% 15%
Anesthesiology 20 7 24 8 24% 25%Radiology 17 6 22 7 25% 26%
Emergency Medicine 16 5 18 6 14% 15%General Surgery 25 9 31 11 25% 26%
Ophthalmology 8 3 10 3 27% 28%Otolaryngology 5 2 6 2 14% 14%
Orthopedic Surgery 8 3 10 4 24% 25%Urology 5 2 6 2 25% 25%
Other Surgical Specialties 6 2 8 3 29% 29%-1%Projected Regional Population Change 2005-2020:
Change 2005-202020202005

Michigan Physician Supply and Demand Through 2020 171
In this scenario, the demand for physicians was forecast to grow by 20 percent in the Upper Peninsula region. Demand for primary care physicians was forecast to grow by 14 percent, while demand for non-primary care physicians was forecast to grow by 26 percent. After accounting for the projected population change in the region (1 percent decline), the region was forecast to experience a greater rate of demand growth relative to the state as a whole. Regional demand for General Internists, Cardiologists, other Internal Medicine Subspecialists, Pathologists, Anesthesiologists, Radiologists, General Surgeons, Otolaryngologists, Orthopedic Surgeons, Urologists, and other surgical specialists was forecast to grow at rates exceeding those at the state level. Demand for Pediatricians was forecast to decline at rates exceeding those at the state level as well. Figure 151 – Upper Peninsula Regional Physician Demand Forecast, 2005-2020
PhysiciansPer 100,000 Population Physicians
Per 100,000 Population Physicians
Per 100,000 Population
All Physicians 700 223 841 271 20% 21%Primary Care 336 107 382 123 14% 15%
General/Family Medicine 239 76 274 88 14% 15%General Internal Medicine 65 21 79 25 21% 22%
General Pediatrics 31 10 29 9 -7% -6%Non-Primary Care 364 116 460 148 26% 27%
Cardiovascular Diseases 12 4 17 5 41% 43%Other Internal Medicine Subspecialties 53 17 70 22 33% 34%
Obstetrics and Gynecology 34 11 36 12 6% 7%Pathology 16 5 20 7 27% 28%Psychiatry 26 8 30 10 17% 19%
Anesthesiology 22 7 28 9 29% 30%Radiology 30 9 39 12 29% 31%
Emergency Medicine 31 10 36 12 17% 18%General Surgery 39 12 51 16 31% 33%
Ophthalmology 16 5 21 7 31% 32%Otolaryngology 9 3 12 4 30% 31%
Orthopedic Surgery 17 5 22 7 27% 29%Urology 7 2 10 3 44% 46%
Other Surgical Specialties 8 3 11 3 34% 35%-1%Projected Regional Population Change 2005-2020:
Change 2005-202020202005
In this scenario, the demand for physicians was forecast to grow by 28 percent in the West Central region. Demand for primary care physicians was forecast to grow by 23 percent, while demand for non-primary care physicians was forecast to grow by 33 percent. Even though these forecast growth rates were higher than the statewide rate of growth, due to the high rate of population growth predicted for the region (9 percent), demand expressed as a physician to population ratio was forecast to grow at a similar pace. In nearly all specialties, the growth in the physician to population ratio was forecast to increase at about the same pace in the region as it was at the state level. Notable exceptions included that regional demand for Cardiologists, Urologists, and other surgical specialists was forecast to grow at a slower rate than at the state level. On the other hand, regional demand for Psychiatrists was forecast to grow at a faster rate than at the state level.
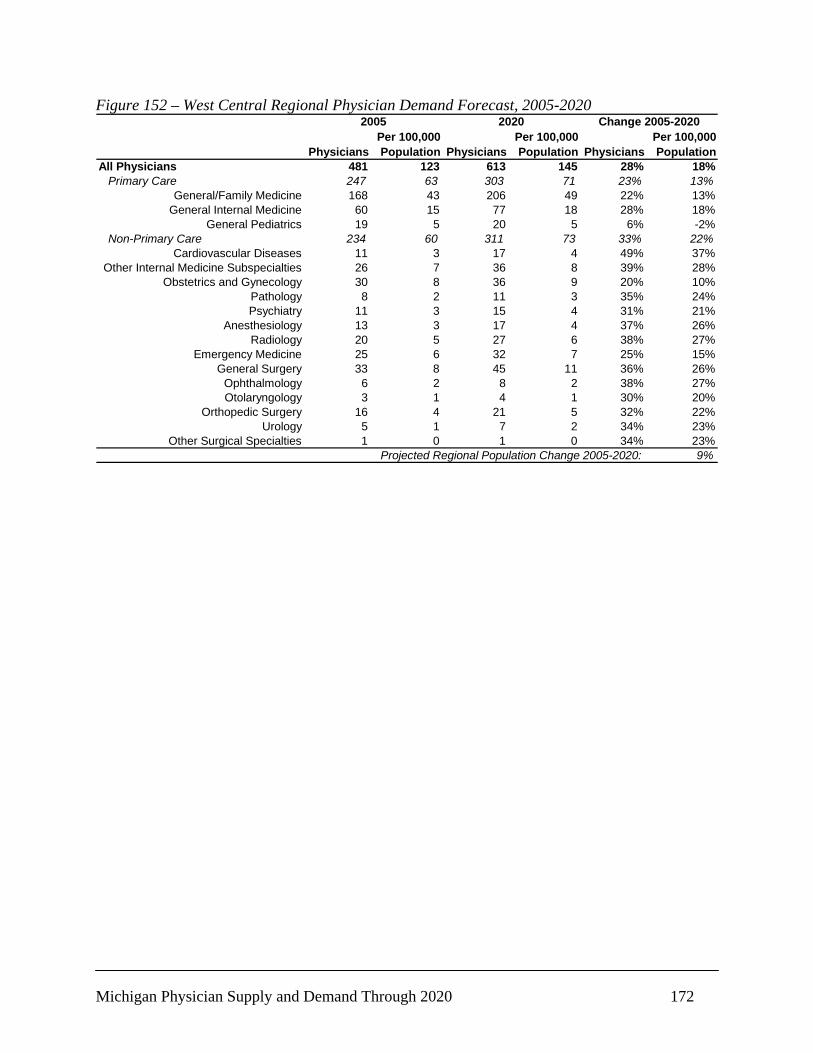
Michigan Physician Supply and Demand Through 2020 172
Figure 152 – West Central Regional Physician Demand Forecast, 2005-2020
PhysiciansPer 100,000 Population Physicians
Per 100,000 Population Physicians
Per 100,000 Population
All Physicians 481 123 613 145 28% 18%Primary Care 247 63 303 71 23% 13%
General/Family Medicine 168 43 206 49 22% 13%General Internal Medicine 60 15 77 18 28% 18%
General Pediatrics 19 5 20 5 6% -2%Non-Primary Care 234 60 311 73 33% 22%
Cardiovascular Diseases 11 3 17 4 49% 37%Other Internal Medicine Subspecialties 26 7 36 8 39% 28%
Obstetrics and Gynecology 30 8 36 9 20% 10%Pathology 8 2 11 3 35% 24%Psychiatry 11 3 15 4 31% 21%
Anesthesiology 13 3 17 4 37% 26%Radiology 20 5 27 6 38% 27%
Emergency Medicine 25 6 32 7 25% 15%General Surgery 33 8 45 11 36% 26%
Ophthalmology 6 2 8 2 38% 27%Otolaryngology 3 1 4 1 30% 20%
Orthopedic Surgery 16 4 21 5 32% 22%Urology 5 1 7 2 34% 23%
Other Surgical Specialties 1 0 1 0 34% 23%9%Projected Regional Population Change 2005-2020:
Change 2005-202020202005

Michigan Physician Supply and Demand Through 2020 173
Chapter 9: Relationship between Physician Supply and Demand in Michigan 2020 In order to clearly indicate the relationship between the projected physician supply and demand in Michigan in 2020, in this section, the results of the supply and demand projections are compared in a side-by-side fashion. For each of the four supply scenarios, the projected state-level shortage or surplus of physicians is presented in the aggregate and by specialty for each demand scenario and under both insurance environments.9 State Level Supply Scenario 1: Baseline In the aggregate, physician demand was projected to grow at a faster pace than the baseline physician supply forecast in two demand scenarios and projected to grow at a slower pace than the baseline physician supply forecast in the other scenarios. Under the constant insurance environment, in the Demographic Only Scenario forecast, demand growth outpaced supply growth by 425 physicians by 2020. Expressed as a percentage of the number of physicians required to meet the demand for their services, the shortage predicted in the Demographic Only Scenario amounted to 1 percent in 2020. In the Trend Scenario, demand growth outpaced supply growth by 4,444 physicians by 2020. Expressed as a percentage of the number of physicians required to meet the demand for their services, the shortage predicted in the Trend Scenario amounted to 12 percent in 2020. In the Reduction of Unnecessary Services scenarios, while the supply of physicians was forecast to grow by 10 percent, demand was forecast to decline by 19 percent (Demographic) and 9 percent (Trend) by 2020. Expressed as a percentage of the number of physicians required to meet the demand for their services, the surplus predicted in the Reduction of Unnecessary Services scenarios amounted to 36 percent (Demographic) and 22 percent (Trend) in 2020. Figure 153 – Projected Difference Between Physician Supply and Demand in Michigan in 2020
Projected Difference in
2020
Projected Difference as a Percent of Demand in
2020
Projected Difference in
2020
Projected Difference as a Percent of Demand in
2020
Projected Difference in
2020
Projected Difference as a Percent of Demand in
2020
Projected Difference in
2020
Projected Difference as a Percent of Demand in
2020Constant Insurance Environment
All Physicians -425 -1% -4,444 -12% 8,894 36% 5,980 22%
Full Insurance EnvironmentAll Physicians -2,064 -6% -6,286 -16% 7,706 30% 4,645 16%
Demographic Only Scenario Trend Scenario
Reduction of Unnecessary Services and
Demographic Scenario
Reduction of Unnecessary Services and Trend
Scenario
9 In the full insurance environment, shortages forecast in the Demographic Only and Trend Scenarios were greater than in the constant insurance environment, while surpluses forecast in the Reduction of Unnecessary Services Scenarios were smaller than in the constant insurance environment. For the purposes of keeping this document manageable, only the constant insurance environment is interpreted in detail.

Michigan Physician Supply and Demand Through 2020 174
Primary Care in Aggregate In the aggregate, primary care physician demand was projected to grow at a faster pace than the baseline primary care physician supply forecast in two demand scenarios and projected to grow at a slower pace than the baseline primary care physician supply forecast in the other scenarios. Under the constant insurance environment, in the Demographic Only Scenario forecast, demand growth outpaced supply growth by 65 physicians by 2020. Expressed as a percentage of the number of physicians required to meet the demand for their services, the shortage predicted in the Demographic Only Scenario amounted to about 1 percent in 2020. In the Trend Scenario, demand growth outpaced supply growth by 941 physicians by 2020. Expressed as a percentage of the number of physicians required to meet the demand for their services, the shortage predicted in the Trend Scenario amounted to 7 percent in 2020. In the Reduction of Unnecessary Services scenarios, while the supply of physicians was forecast to grow by 10 percent, demand was forecast to decline by20 percent (Demographic) and 15 percent (Trend) by 2020. Expressed as a percentage of the number of physicians required to meet the demand for their services, the surplus predicted in the Reduction of Unnecessary Services scenarios amounted to 37 percent (Demographic) and 29 percent (Trend) in 2020. Non-Primary Care in Aggregate In the aggregate, non-primary care physician demand was projected to grow at a faster pace than the baseline non-primary care physician supply forecast in two demand scenarios and projected to grow at a slower pace than the baseline non-primary care physician supply forecast in the other scenarios. Under the constant insurance environment, in the Demographic Only Scenario forecast, demand growth outpaced supply growth by 360 physicians by 2020. Expressed as a percentage of the number of physicians required to meet the demand for their services, the shortage predicted in the Demographic Only Scenario amounted to about 2 percent in 2020. In the Trend Scenario, demand growth outpaced supply growth by 3,503 physicians by 2020. Expressed as a percentage of the number of physicians required to meet the demand for their services, the shortage predicted in the Trend Scenario amounted to 15 percent in 2020. In the Reduction of Unnecessary Services scenarios, while the supply of physicians was forecast to grow by 10 percent, demand was forecast to decline by 18 percent (Demographic) and 6 percent (Trend) by 2020. Expressed as a percentage of the number of physicians required to meet the demand for their services, the surplus predicted in the Reduction of Unnecessary Services scenarios amounted to 36 percent (Demographic) and 18 percent (Trend) in 2020.
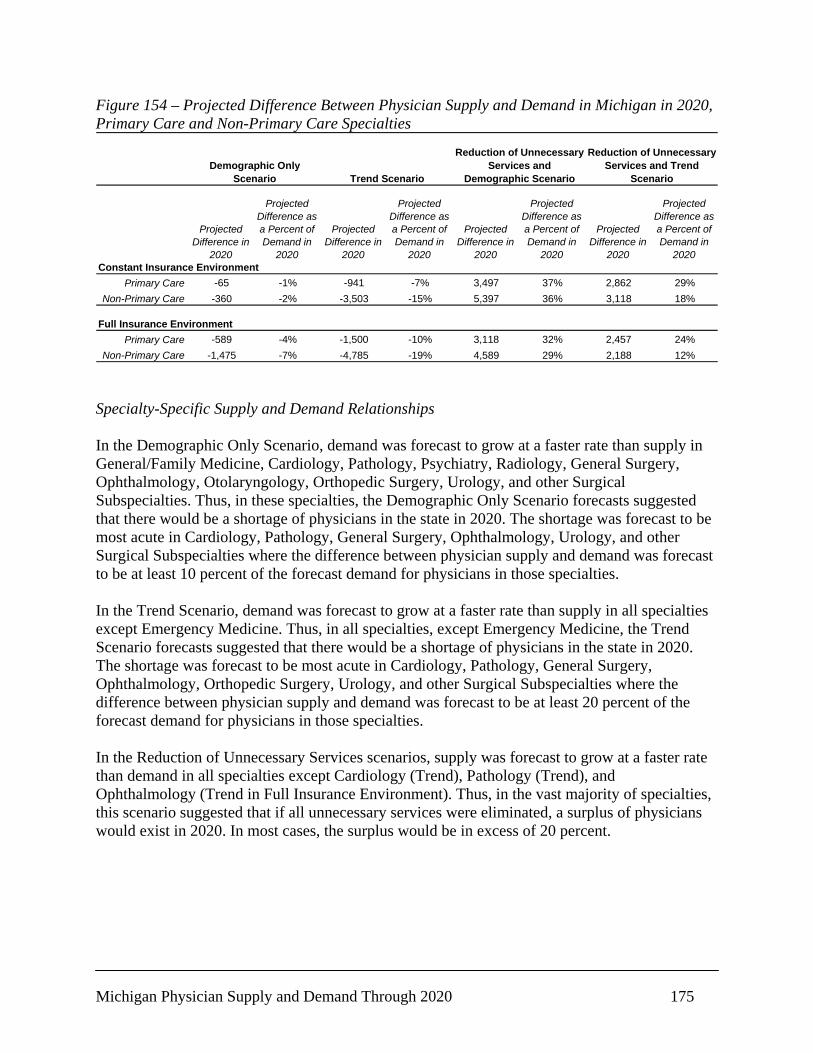
Michigan Physician Supply and Demand Through 2020 175
Figure 154 – Projected Difference Between Physician Supply and Demand in Michigan in 2020, Primary Care and Non-Primary Care Specialties
Projected Difference in
2020
Projected Difference as a Percent of Demand in
2020
Projected Difference in
2020
Projected Difference as a Percent of Demand in
2020
Projected Difference in
2020
Projected Difference as a Percent of Demand in
2020
Projected Difference in
2020
Projected Difference as a Percent of Demand in
2020Constant Insurance Environment
Primary Care -65 -1% -941 -7% 3,497 37% 2,862 29%Non-Primary Care -360 -2% -3,503 -15% 5,397 36% 3,118 18%
Full Insurance EnvironmentPrimary Care -589 -4% -1,500 -10% 3,118 32% 2,457 24%
Non-Primary Care -1,475 -7% -4,785 -19% 4,589 29% 2,188 12%
Demographic Only Scenario Trend Scenario
Reduction of Unnecessary Services and
Demographic Scenario
Reduction of Unnecessary Services and Trend
Scenario
Specialty-Specific Supply and Demand Relationships In the Demographic Only Scenario, demand was forecast to grow at a faster rate than supply in General/Family Medicine, Cardiology, Pathology, Psychiatry, Radiology, General Surgery, Ophthalmology, Otolaryngology, Orthopedic Surgery, Urology, and other Surgical Subspecialties. Thus, in these specialties, the Demographic Only Scenario forecasts suggested that there would be a shortage of physicians in the state in 2020. The shortage was forecast to be most acute in Cardiology, Pathology, General Surgery, Ophthalmology, Urology, and other Surgical Subspecialties where the difference between physician supply and demand was forecast to be at least 10 percent of the forecast demand for physicians in those specialties. In the Trend Scenario, demand was forecast to grow at a faster rate than supply in all specialties except Emergency Medicine. Thus, in all specialties, except Emergency Medicine, the Trend Scenario forecasts suggested that there would be a shortage of physicians in the state in 2020. The shortage was forecast to be most acute in Cardiology, Pathology, General Surgery, Ophthalmology, Orthopedic Surgery, Urology, and other Surgical Subspecialties where the difference between physician supply and demand was forecast to be at least 20 percent of the forecast demand for physicians in those specialties. In the Reduction of Unnecessary Services scenarios, supply was forecast to grow at a faster rate than demand in all specialties except Cardiology (Trend), Pathology (Trend), and Ophthalmology (Trend in Full Insurance Environment). Thus, in the vast majority of specialties, this scenario suggested that if all unnecessary services were eliminated, a surplus of physicians would exist in 2020. In most cases, the surplus would be in excess of 20 percent.
Michigan Physician Supply and Demand Through 2020 176
Primary Care Specialties General/Family Medicine General/Family physician demand was projected to grow at a faster pace than the baseline physician supply forecast in two demand scenarios and projected to grow at a slower pace than the baseline physician supply forecast in the other scenarios. In the Demographic Only Scenario forecast, demand growth outpaced supply growth by 211 physicians by 2020. Expressed as a percentage of the number of physicians required to meet the demand for their services, the shortage predicted in the Demographic Only Scenario amounted to 4 percent in 2020. In the Trend Scenario, demand growth outpaced supply growth by 592 physicians by 2020. Expressed as a percentage of the number of physicians required to meet the demand for their services, the shortage predicted in the Trend Scenario amounted to 10 percent in 2020. In the Reduction of Unnecessary Services scenarios, while the supply of physicians was forecast to grow by 7 percent, demand was forecast to decline by 20 percent (Demographic) and 14 percent (Trend) by 2020. Expressed as a percentage of the number of physicians required to meet the demand for their services, the surplus predicted in the Reduction of Unnecessary Services scenarios amounted to 33 percent (Demographic) and 24 percent (Trend) in 2020. General Internal Medicine In the Demographic Only Scenario forecast, supply growth outpaced demand growth by 67 physicians by 2020. Expressed as a percentage of the number of physicians required to meet the demand for their services, the surplus predicted in the Demographic Only Scenario amounted to 1 percent in 2020. In the Trend Scenario, demand growth outpaced supply growth by 302 physicians by 2020. Expressed as a percentage of the number of physicians required to meet the demand for their services, the shortage predicted in the Trend Scenario amounted to 5 percent in 2020. In the Reduction of Unnecessary Services scenarios, while the supply of physicians was forecast to grow by 17 percent, demand was forecast to decline by 17 percent (Demographic) and 11 percent (Trend) by 2020. Expressed as a percentage of the number of physicians required to meet the demand for their services, the surplus predicted in the Reduction of Unnecessary Services scenarios amounted to 40 percent (Demographic) and 31 percent (Trend) in 2020. General Pediatrics In the Demographic Only Scenario forecast, supply growth outpaced demand growth by 79 physicians by 2020. Expressed as a percentage of the number of physicians required to meet the demand for their services, the surplus predicted in the Demographic Only Scenario amounted to 4 percent in 2020.
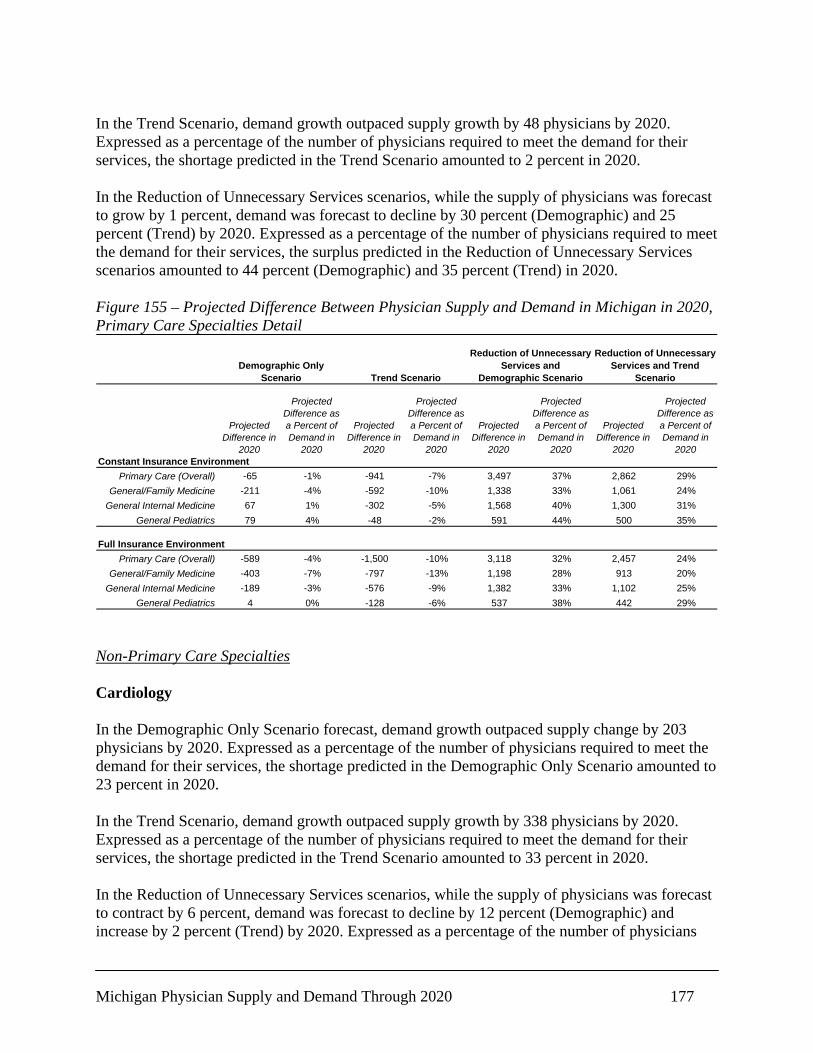
Michigan Physician Supply and Demand Through 2020 177
In the Trend Scenario, demand growth outpaced supply growth by 48 physicians by 2020. Expressed as a percentage of the number of physicians required to meet the demand for their services, the shortage predicted in the Trend Scenario amounted to 2 percent in 2020. In the Reduction of Unnecessary Services scenarios, while the supply of physicians was forecast to grow by 1 percent, demand was forecast to decline by 30 percent (Demographic) and 25 percent (Trend) by 2020. Expressed as a percentage of the number of physicians required to meet the demand for their services, the surplus predicted in the Reduction of Unnecessary Services scenarios amounted to 44 percent (Demographic) and 35 percent (Trend) in 2020. Figure 155 – Projected Difference Between Physician Supply and Demand in Michigan in 2020, Primary Care Specialties Detail
Projected Difference in
2020
Projected Difference as a Percent of Demand in
2020
Projected Difference in
2020
Projected Difference as a Percent of Demand in
2020
Projected Difference in
2020
Projected Difference as a Percent of Demand in
2020
Projected Difference in
2020
Projected Difference as a Percent of Demand in
2020Constant Insurance Environment
Primary Care (Overall) -65 -1% -941 -7% 3,497 37% 2,862 29%General/Family Medicine -211 -4% -592 -10% 1,338 33% 1,061 24%
General Internal Medicine 67 1% -302 -5% 1,568 40% 1,300 31%General Pediatrics 79 4% -48 -2% 591 44% 500 35%
Full Insurance EnvironmentPrimary Care (Overall) -589 -4% -1,500 -10% 3,118 32% 2,457 24%
General/Family Medicine -403 -7% -797 -13% 1,198 28% 913 20%General Internal Medicine -189 -3% -576 -9% 1,382 33% 1,102 25%
General Pediatrics 4 0% -128 -6% 537 38% 442 29%
Demographic Only Scenario Trend Scenario
Reduction of Unnecessary Services and
Demographic Scenario
Reduction of Unnecessary Services and Trend
Scenario
Non-Primary Care Specialties Cardiology In the Demographic Only Scenario forecast, demand growth outpaced supply change by 203 physicians by 2020. Expressed as a percentage of the number of physicians required to meet the demand for their services, the shortage predicted in the Demographic Only Scenario amounted to 23 percent in 2020. In the Trend Scenario, demand growth outpaced supply growth by 338 physicians by 2020. Expressed as a percentage of the number of physicians required to meet the demand for their services, the shortage predicted in the Trend Scenario amounted to 33 percent in 2020. In the Reduction of Unnecessary Services scenarios, while the supply of physicians was forecast to contract by 6 percent, demand was forecast to decline by 12 percent (Demographic) and increase by 2 percent (Trend) by 2020. Expressed as a percentage of the number of physicians
Michigan Physician Supply and Demand Through 2020 178
required to meet the demand for their services, the predicted difference between supply and demand for Cardiologists in the Reduction of Unnecessary Services scenarios ranged from a 7 percent surplus (Demographic) to a 7 percent shortage (Trend) in 2020. Other Internal Medicine Subspecialties In the Demographic Only Scenario forecast, supply growth outpaced demand growth by 79 physicians by 2020. Expressed as a percentage of the number of physicians required to meet the demand for their services, the surplus predicted in the Demographic Only Scenario amounted to 2 percent in 2020. In the Trend Scenario, demand growth outpaced supply growth by 442 physicians by 2020. Expressed as a percentage of the number of physicians required to meet the demand for their services, the shortage predicted in the Trend Scenario amounted to 11 percent in 2020. In the Reduction of Unnecessary Services scenarios, while the supply of physicians was forecast to grow by 20 percent, demand was forecast to decline by 15 percent (Demographic) and 3 percent (Trend) by 2020. Expressed as a percentage of the number of physicians required to meet the demand for their services, the surplus predicted in the Reduction of Unnecessary Services scenarios amounted to 41 percent (Demographic) and 23 percent (Trend) in 2020. Obstetrics and Gynecology In the Demographic Only Scenario forecast, supply growth outpaced demand growth by 8 percent, or 134 physicians by 2020. Expressed as a percentage of the number of physicians required to meet the demand for their services, the surplus predicted in the Demographic Only Scenario amounted to 8 percent in 2020. In the Trend Scenario, demand growth outpaced supply growth by 125 physicians by 2020. Expressed as a percentage of the number of physicians required to meet the demand for their services, the shortage predicted in the Trend Scenario amounted to 6 percent in 2020. In the Reduction of Unnecessary Services scenarios, while the supply of physicians was forecast to grow by 9 percent, demand was forecast to decline by 27 percent (Demographic) and 16 percent (Trend) by 2020. Expressed as a percentage of the number of physicians required to meet the demand for their services, the surplus predicted in the Reduction of Unnecessary Services scenarios amounted to 49 percent (Demographic) and 29 percent (Trend) in 2020. Pathology In the Demographic Only Scenario forecast, demand growth outpaced supply change by 133 physicians by 2020. Expressed as a percentage of the number of physicians required to meet the demand for their services, the shortage predicted in the Demographic Only Scenario amounted to 16 percent in 2020.

Michigan Physician Supply and Demand Through 2020 179
In the Trend Scenario, demand growth outpaced supply growth by 255 physicians by 2020. Expressed as a percentage of the number of physicians required to meet the demand for their services, the shortage predicted in the Trend Scenario amounted to 27 percent in 2020. In the Reduction of Unnecessary Services scenarios, while the supply of physicians was forecast to contract by 6 percent, demand was forecast to decline by 18 percent (Demographic) and 6 percent (Trend) by 2020. Expressed as a percentage of the number of physicians required to meet the demand for their services, the surplus predicted in the Reduction of Unnecessary Services scenarios amounted to 15 percent (Demographic) in 2020. Figure 156 – Projected Difference Between Physician Supply and Demand in Michigan in 2020, Cardiology, Other Internal Medicine Subspecialties, Obstetrics and Gynecology, and Pathology
Projected Difference in
2020
Projected Difference as a Percent of Demand in
2020
Projected Difference in
2020
Projected Difference as a Percent of Demand in
2020
Projected Difference in
2020
Projected Difference as a Percent of Demand in
2020
Projected Difference in
2020
Projected Difference as a Percent of Demand in
2020Constant Insurance Environment
Cardiology -203 -23% -338 -33% 43 7% -54 -7%Other Internal Medicine Subspecialties 79 2% -442 -11% 1,033 41% 655 23%
Obstetrics and Gynecology 134 8% -125 -6% 609 49% 421 29%Pathology -133 -16% -255 -27% 89 15% 1 0%
Full Insurance EnvironmentCardiology -239 -26% -379 -35% 17 3% -84 -11%
Other Internal Medicine Subspecialties -99 -3% -647 -15% 904 34% 507 17%Obstetrics and Gynecology -24 -1% -307 -14% 494 36% 289 18%
Pathology -181 -21% -309 -31% 55 9% -38 -5%
Demographic Only Scenario Trend Scenario
Reduction of Unnecessary Services and
Demographic Scenario
Reduction of Unnecessary Services and Trend
Scenario
Psychiatry In the Demographic Only Scenario forecast, demand growth outpaced supply growth by 95 physicians by 2020. Expressed as a percentage of the number of physicians required to meet the demand for their services, the shortage predicted in the Demographic Only Scenario amounted to 7 percent in 2020. In the Trend Scenario, demand growth outpaced supply growth by 313 physicians by 2020. Expressed as a percentage of the number of physicians required to meet the demand for their services, the shortage predicted in the Trend Scenario amounted to 19 percent in 2020. In the Reduction of Unnecessary Services scenarios, while the supply of physicians was not forecast to change, demand was forecast to decline by 22 percent (Demographic) and 10 percent (Trend) by 2020. Expressed as a percentage of the number of physicians required to meet the demand for their services, the surplus predicted in the Reduction of Unnecessary Services scenarios amounted to 29 percent (Demographic) and 12 percent (Trend) in 2020.

Michigan Physician Supply and Demand Through 2020 180
Anesthesiology In the Demographic Only Scenario forecast, supply growth outpaced demand growth by 23 physicians by 2020. Expressed as a percentage of the number of physicians required to meet the demand for their services, the surplus predicted in the Demographic Only Scenario amounted to 2 percent in 2020. In the Trend Scenario, demand growth outpaced supply growth by 200 physicians by 2020. Expressed as a percentage of the number of physicians required to meet the demand for their services, the shortage predicted in the Trend Scenario amounted to 12 percent in 2020. In the Reduction of Unnecessary Services scenarios, while the supply of physicians was forecast to grow by 17 percent, demand was forecast to decline by 17 percent (Demographic) and 4 percent (Trend) by 2020. Expressed as a percentage of the number of physicians required to meet the demand for their services, the surplus predicted in the Reduction of Unnecessary Services scenarios amounted to 40 percent (Demographic) and 22 percent (Trend) in 2020. Radiology In the Demographic Only Scenario forecast, demand growth outpaced supply growth by 61 physicians by 2020. Expressed as a percentage of the number of physicians required to meet the demand for their services, the shortage predicted in the Demographic Only Scenario amounted to 4 percent in 2020. In the Trend Scenario, demand growth outpaced supply growth by 298 physicians by 2020. Expressed as a percentage of the number of physicians required to meet the demand for their services, the shortage predicted in the Trend Scenario amounted to 16 percent in 2020. In the Reduction of Unnecessary Services scenarios, while the supply of physicians was forecast to grow by 10 percent, demand was forecast to decline by 17 percent (Demographic) and 5 percent (Trend) by 2020. Expressed as a percentage of the number of physicians required to meet the demand for their services, the surplus predicted in the Reduction of Unnecessary Services scenarios amounted to 33 percent (Demographic) and 15 percent (Trend) in 2020. Emergency Medicine In the Demographic Only Scenario forecast, supply growth outpaced demand growth by 432 physicians by 2020. Expressed as a percentage of the number of physicians required to meet the demand for their services, the surplus predicted in the Demographic Only Scenario amounted to 25 percent in 2020. In the Trend Scenario, supply growth outpaced demand growth by 170 physicians by 2020. Expressed as a percentage of the number of physicians required to meet the demand for their services, the surplus predicted in the Trend Scenario amounted to 8 percent in 2020.

Michigan Physician Supply and Demand Through 2020 181
In the Reduction of Unnecessary Services scenarios, while the supply of physicians was forecast to grow by 31 percent, demand was forecast to decline by 24 percent (Demographic) and 12 percent (Trend) by 2020. Expressed as a percentage of the number of physicians required to meet the demand for their services, the surplus predicted in the Reduction of Unnecessary Services scenarios amounted to 72 percent (Demographic) and 50 percent (Trend) in 2020. Figure 157 – Projected Difference Between Physician Supply and Demand in Michigan in 2020, Psychiatry, Anesthesiology, Radiology, and Emergency Medicine
Projected Difference in
2020
Projected Difference as a Percent of Demand in
2020
Projected Difference in
2020
Projected Difference as a Percent of Demand in
2020
Projected Difference in
2020
Projected Difference as a Percent of Demand in
2020
Projected Difference in
2020
Projected Difference as a Percent of Demand in
2020Constant Insurance Environment
Psychiatry -95 -7% -313 -19% 306 29% 147 12%Anesthesiology 23 2% -200 -12% 431 40% 270 22%
Radiology -61 -4% -298 -16% 371 33% 200 15%Emergency Medicine 432 25% 170 8% 911 72% 721 50%
Full Insurance EnvironmentPsychiatry -98 -7% -318 -19% 303 29% 144 12%
Anesthesiology -55 -4% -290 -16% 374 33% 204 16%Radiology -152 -9% -402 -21% 305 25% 124 9%
Emergency Medicine 370 21% 100 5% 867 66% 670 45%
Demographic Only Scenario Trend Scenario
Reduction of Unnecessary Services and
Demographic Scenario
Reduction of Unnecessary Services and Trend
Scenario
General Surgery In the Demographic Only Scenario forecast, demand growth outpaced supply growth by 200 physicians by 2020. Expressed as a percentage of the number of physicians required to meet the demand for their services, the shortage predicted in the Demographic Only Scenario amounted to 11 percent in 2020. In the Trend Scenario, demand growth outpaced supply growth by 484 physicians by 2020. Expressed as a percentage of the number of physicians required to meet the demand for their services, the shortage predicted in the Trend Scenario amounted to 22 percent in 2020. In the Reduction of Unnecessary Services scenarios, while the supply of physicians was forecast to grow by 3 percent, demand was forecast to decline by 17 percent (Demographic) and 4 percent (Trend) by 2020. Expressed as a percentage of the number of physicians required to meet the demand for their services, the surplus predicted in the Reduction of Unnecessary Services scenarios amounted to 23 percent (Demographic) and 7 percent (Trend) in 2020. Ophthalmology In the Demographic Only Scenario forecast, demand growth outpaced supply change by 123 physicians by 2020. Expressed as a percentage of the number of physicians required to meet the demand for their services, the shortage predicted in the Demographic Only Scenario amounted to 16 percent in 2020.
Michigan Physician Supply and Demand Through 2020 182
In the Trend Scenario, demand growth outpaced supply growth by 241 physicians by 2020. Expressed as a percentage of the number of physicians required to meet the demand for their services, the shortage predicted in the Trend Scenario amounted to 27 percent in 2020. In the Reduction of Unnecessary Services scenarios, while the supply of physicians was forecast to contract by 1 percent, demand was forecast to decline by 15 percent (Demographic) and 2 percent (Trend) by 2020. Expressed as a percentage of the number of physicians required to meet the demand for their services, the surplus predicted in the Reduction of Unnecessary Services scenarios amounted to 16 percent (Demographic) and 1 percent (Trend) in 2020. Otolaryngology In the Demographic Only Scenario forecast, demand growth outpaced supply growth by 19 physicians by 2020. Expressed as a percentage of the number of physicians required to meet the demand for their services, the shortage predicted in the Demographic Only Scenario amounted to 5 percent in 2020. In the Trend Scenario, demand growth outpaced supply growth by 71 physicians by 2020. Expressed as a percentage of the number of physicians required to meet the demand for their services, the shortage predicted in the Trend Scenario amounted to 18 percent in 2020. In the Reduction of Unnecessary Services scenarios, while the supply of physicians was forecast to grow by 3 percent, demand was forecast to decline by 21 percent (Demographic) and 9 percent (Trend) by 2020. Expressed as a percentage of the number of physicians required to meet the demand for their services, the surplus predicted in the Reduction of Unnecessary Services scenarios amounted to 30 percent (Demographic) and 13 percent (Trend) in 2020. Orthopedic Surgery In the Demographic Only Scenario forecast, demand growth outpaced supply growth by 86 physicians by 2020. Expressed as a percentage of the number of physicians required to meet the demand for their services, the shortage predicted in the Demographic Only Scenario amounted to 9 percent in 2020. In the Trend Scenario, demand growth outpaced supply growth by 230 physicians by 2020. Expressed as a percentage of the number of physicians required to meet the demand for their services, the shortage predicted in the Trend Scenario amounted to 21 percent in 2020. In the Reduction of Unnecessary Services scenarios, while the supply of physicians was forecast to grow by 3 percent, demand was forecast to decline by 18 percent (Demographic) and 5 percent (Trend) by 2020. Expressed as a percentage of the number of physicians required to meet the demand for their services, the surplus predicted in the Reduction of Unnecessary Services scenarios amounted to 26 percent (Demographic) and 9 percent (Trend) in 2020.

Michigan Physician Supply and Demand Through 2020 183
Figure 158 – Projected Difference Between Physician Supply and Demand in Michigan in 2020, General Surgery, Ophthalmology, Otolaryngology, and Orthopedic Surgery
Projected Difference in
2020
Projected Difference as a Percent of Demand in
2020
Projected Difference in
2020
Projected Difference as a Percent of Demand in
2020
Projected Difference in
2020
Projected Difference as a Percent of Demand in
2020
Projected Difference in
2020
Projected Difference as a Percent of Demand in
2020Constant Insurance Environment
General Surgery -200 -11% -484 -22% 321 23% 115 7%Ophthalmology -123 -16% -241 -27% 93 16% 7 1%Otolaryngology -19 -5% -71 -18% 76 30% 39 13%
Orthopedic Surgery -86 -9% -230 -21% 178 26% 73 9%
Full Insurance EnvironmentGeneral Surgery -299 -15% -599 -26% 249 17% 32 2%
Ophthalmology -138 -17% -258 -28% 82 14% -5 -1%Otolaryngology -42 -11% -97 -23% 60 22% 20 6%
Orthopedic Surgery -151 -15% -304 -26% 131 18% 19 2%
Demographic Only Scenario Trend Scenario
Reduction of Unnecessary Services and
Demographic Scenario
Reduction of Unnecessary Services and Trend
Scenario
Urology In the Demographic Only Scenario forecast, demand growth outpaced supply growth by 52 physicians by 2020. Expressed as a percentage of the number of physicians required to meet the demand for their services, the shortage predicted in the Demographic Only Scenario amounted to 12 percent in 2020. In the Trend Scenario, demand growth outpaced supply growth by 118 physicians by 2020. Expressed as a percentage of the number of physicians required to meet the demand for their services, the shortage predicted in the Trend Scenario amounted to 23 percent in 2020. In the Reduction of Unnecessary Services scenarios, while the supply of physicians was forecast to grow by 5 percent, demand was forecast to decline by 14 percent (Demographic) and 1 percent (Trend) by 2020. Expressed as a percentage of the number of physicians required to meet the demand for their services, the surplus predicted in the Reduction of Unnecessary Services scenarios amounted to 22 percent (Demographic) and 6 percent (Trend) in 2020. Other Surgical Subspecialties In the Demographic Only Scenario forecast, demand growth outpaced supply growth by 77 physicians by 2020. Expressed as a percentage of the number of physicians required to meet the demand for their services, the shortage predicted in the Demographic Only Scenario amounted to 12 percent in 2020. In the Trend Scenario, demand growth outpaced supply growth by 176 physicians by 2020. Expressed as a percentage of the number of physicians required to meet the demand for their services, the shortage predicted in the Trend Scenario amounted to 23 percent in 2020.
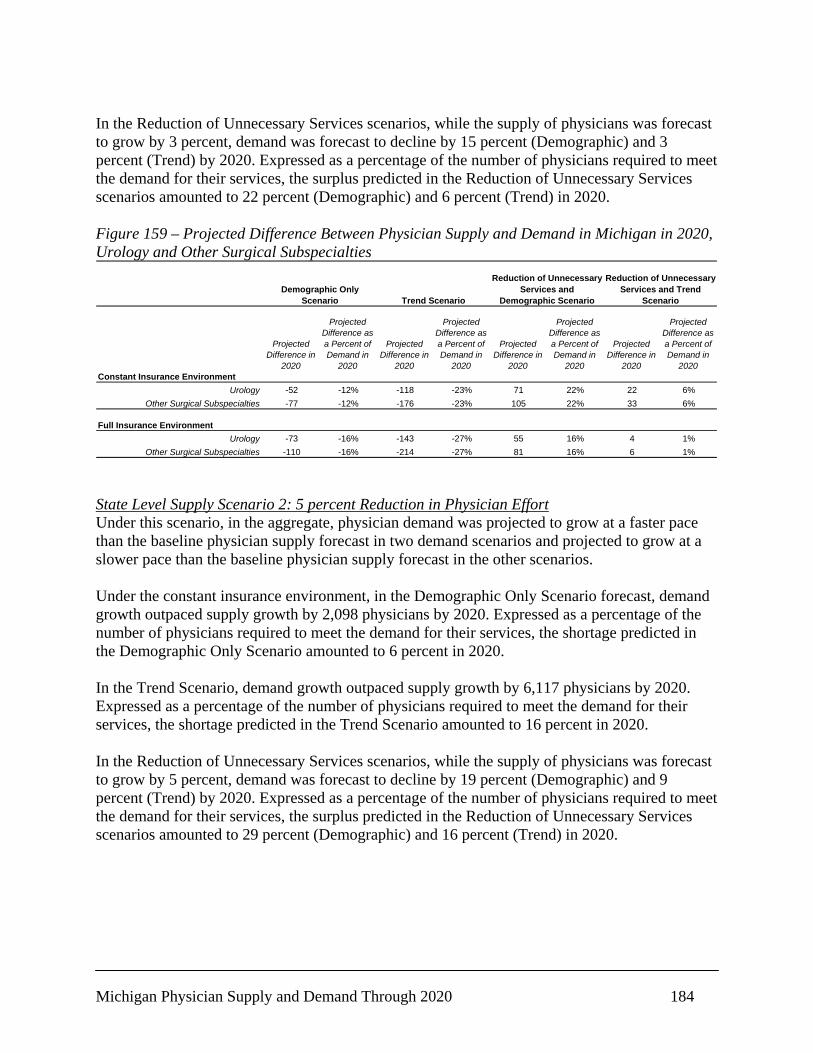
Michigan Physician Supply and Demand Through 2020 184
In the Reduction of Unnecessary Services scenarios, while the supply of physicians was forecast to grow by 3 percent, demand was forecast to decline by 15 percent (Demographic) and 3 percent (Trend) by 2020. Expressed as a percentage of the number of physicians required to meet the demand for their services, the surplus predicted in the Reduction of Unnecessary Services scenarios amounted to 22 percent (Demographic) and 6 percent (Trend) in 2020. Figure 159 – Projected Difference Between Physician Supply and Demand in Michigan in 2020, Urology and Other Surgical Subspecialties
Projected Difference in
2020
Projected Difference as a Percent of Demand in
2020
Projected Difference in
2020
Projected Difference as a Percent of Demand in
2020
Projected Difference in
2020
Projected Difference as a Percent of Demand in
2020
Projected Difference in
2020
Projected Difference as a Percent of Demand in
2020Constant Insurance Environment
Urology -52 -12% -118 -23% 71 22% 22 6%Other Surgical Subspecialties -77 -12% -176 -23% 105 22% 33 6%
Full Insurance EnvironmentUrology -73 -16% -143 -27% 55 16% 4 1%
Other Surgical Subspecialties -110 -16% -214 -27% 81 16% 6 1%
Demographic Only Scenario Trend Scenario
Reduction of Unnecessary Services and
Demographic Scenario
Reduction of Unnecessary Services and Trend
Scenario
State Level Supply Scenario 2: 5 percent Reduction in Physician Effort Under this scenario, in the aggregate, physician demand was projected to grow at a faster pace than the baseline physician supply forecast in two demand scenarios and projected to grow at a slower pace than the baseline physician supply forecast in the other scenarios. Under the constant insurance environment, in the Demographic Only Scenario forecast, demand growth outpaced supply growth by 2,098 physicians by 2020. Expressed as a percentage of the number of physicians required to meet the demand for their services, the shortage predicted in the Demographic Only Scenario amounted to 6 percent in 2020. In the Trend Scenario, demand growth outpaced supply growth by 6,117 physicians by 2020. Expressed as a percentage of the number of physicians required to meet the demand for their services, the shortage predicted in the Trend Scenario amounted to 16 percent in 2020. In the Reduction of Unnecessary Services scenarios, while the supply of physicians was forecast to grow by 5 percent, demand was forecast to decline by 19 percent (Demographic) and 9 percent (Trend) by 2020. Expressed as a percentage of the number of physicians required to meet the demand for their services, the surplus predicted in the Reduction of Unnecessary Services scenarios amounted to 29 percent (Demographic) and 16 percent (Trend) in 2020.

Michigan Physician Supply and Demand Through 2020 185
Figure 160 – Projected Difference Between Physician Supply and Demand in Michigan in 2020
Projected Difference in
2020
Projected Difference as a Percent of Demand in
2020
Projected Difference in
2020
Projected Difference as a Percent of Demand in
2020
Projected Difference in
2020
Projected Difference as a Percent of Demand in
2020
Projected Difference in
2020
Projected Difference as a Percent of Demand in
2020Constant Insurance Environment
All Physicians -2,098 -6% -6,117 -16% 7,221 29% 4,307 16%
Full Insurance EnvironmentAll Physicians -3,737 -11% -7,959 -20% 6,033 23% 2,972 10%
Demographic Only Scenario Trend Scenario
Reduction of Unnecessary Services and
Demographic Scenario
Reduction of Unnecessary Services and Trend
Scenario
Primary Care in Aggregate In the aggregate, primary care physician demand was projected to grow at a faster pace than the baseline primary care physician supply forecast in two demand scenarios and projected to grow at a slower pace than the baseline primary care physician supply forecast in the other scenarios. Under the constant insurance environment, in the Demographic Only Scenario forecast, demand growth outpaced supply growth by 710 physicians by 2020. Expressed as a percentage of the number of physicians required to meet the demand for their services, the shortage predicted in the Demographic Only Scenario amounted to 5 percent in 2020. In the Trend Scenario, demand growth outpaced supply growth by 1,586 physicians by 2020. Expressed as a percentage of the number of physicians required to meet the demand for their services, the shortage predicted in the Trend Scenario amounted to 11 percent in 2020. In the Reduction of Unnecessary Services scenarios, while the supply of physicians was forecast to grow by 4 percent, demand was forecast to decline by 20 percent (Demographic) and 15 percent (Trend) by 2020. Expressed as a percentage of the number of physicians required to meet the demand for their services, the surplus predicted in the Reduction of Unnecessary Services scenarios amounted to 30 percent (Demographic) and 22 percent (Trend) in 2020. Non-Primary Care in Aggregate In the aggregate, non-primary care physician demand was projected to grow at a faster pace than the baseline non-primary care physician supply forecast in two demand scenarios and projected to grow at a slower pace than the baseline non-primary care physician supply forecast in the other scenarios.
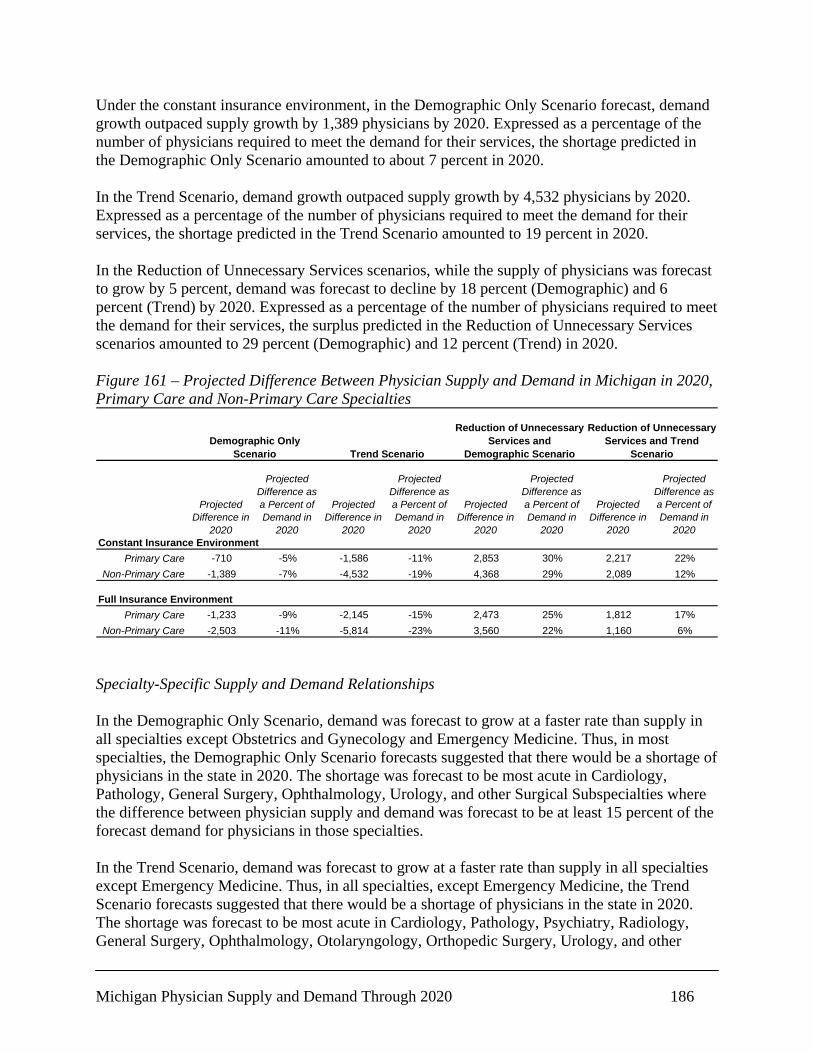
Michigan Physician Supply and Demand Through 2020 186
Under the constant insurance environment, in the Demographic Only Scenario forecast, demand growth outpaced supply growth by 1,389 physicians by 2020. Expressed as a percentage of the number of physicians required to meet the demand for their services, the shortage predicted in the Demographic Only Scenario amounted to about 7 percent in 2020. In the Trend Scenario, demand growth outpaced supply growth by 4,532 physicians by 2020. Expressed as a percentage of the number of physicians required to meet the demand for their services, the shortage predicted in the Trend Scenario amounted to 19 percent in 2020. In the Reduction of Unnecessary Services scenarios, while the supply of physicians was forecast to grow by 5 percent, demand was forecast to decline by 18 percent (Demographic) and 6 percent (Trend) by 2020. Expressed as a percentage of the number of physicians required to meet the demand for their services, the surplus predicted in the Reduction of Unnecessary Services scenarios amounted to 29 percent (Demographic) and 12 percent (Trend) in 2020. Figure 161 – Projected Difference Between Physician Supply and Demand in Michigan in 2020, Primary Care and Non-Primary Care Specialties
Projected Difference in
2020
Projected Difference as a Percent of Demand in
2020
Projected Difference in
2020
Projected Difference as a Percent of Demand in
2020
Projected Difference in
2020
Projected Difference as a Percent of Demand in
2020
Projected Difference in
2020
Projected Difference as a Percent of Demand in
2020Constant Insurance Environment
Primary Care -710 -5% -1,586 -11% 2,853 30% 2,217 22%Non-Primary Care -1,389 -7% -4,532 -19% 4,368 29% 2,089 12%
Full Insurance EnvironmentPrimary Care -1,233 -9% -2,145 -15% 2,473 25% 1,812 17%
Non-Primary Care -2,503 -11% -5,814 -23% 3,560 22% 1,160 6%
Demographic Only Scenario Trend Scenario
Reduction of Unnecessary Services and
Demographic Scenario
Reduction of Unnecessary Services and Trend
Scenario
Specialty-Specific Supply and Demand Relationships In the Demographic Only Scenario, demand was forecast to grow at a faster rate than supply in all specialties except Obstetrics and Gynecology and Emergency Medicine. Thus, in most specialties, the Demographic Only Scenario forecasts suggested that there would be a shortage of physicians in the state in 2020. The shortage was forecast to be most acute in Cardiology, Pathology, General Surgery, Ophthalmology, Urology, and other Surgical Subspecialties where the difference between physician supply and demand was forecast to be at least 15 percent of the forecast demand for physicians in those specialties. In the Trend Scenario, demand was forecast to grow at a faster rate than supply in all specialties except Emergency Medicine. Thus, in all specialties, except Emergency Medicine, the Trend Scenario forecasts suggested that there would be a shortage of physicians in the state in 2020. The shortage was forecast to be most acute in Cardiology, Pathology, Psychiatry, Radiology, General Surgery, Ophthalmology, Otolaryngology, Orthopedic Surgery, Urology, and other

Michigan Physician Supply and Demand Through 2020 187
Surgical Subspecialties where the difference between physician supply and demand was forecast to be at least 20 percent of the forecast demand for physicians in those specialties. In the Reduction of Unnecessary Services scenarios, supply was forecast to grow at a faster rate than demand in all specialties except Cardiology (Demographic and Trend), Pathology (Trend), and Ophthalmology (Trend). Thus, in the vast majority of specialties, this scenario suggested that if all unnecessary services were eliminated, a surplus of physicians would exist in 2020. In most cases, the surplus would be in excess of 10 percent. Primary Care Specialties General/Family Medicine General/Family physician demand was projected to grow at a faster pace than the baseline physician supply forecast in two demand scenarios and projected to grow at a slower pace than the baseline physician supply forecast in the other scenarios. In the Demographic Only Scenario forecast, demand growth outpaced supply growth by 482 physicians by 2020. Expressed as a percentage of the number of physicians required to meet the demand for their services, the shortage predicted in the Demographic Only Scenario amounted to 9 percent in 2020. In the Trend Scenario, demand growth outpaced supply growth by 863 physicians by 2020. Expressed as a percentage of the number of physicians required to meet the demand for their services, the shortage predicted in the Trend Scenario amounted to 14 percent in 2020. In the Reduction of Unnecessary Services scenarios, while the supply of physicians was forecast to grow by 1 percent, demand was forecast to decline by 20 percent (Demographic) and 14 percent (Trend) by 2020. Expressed as a percentage of the number of physicians required to meet the demand for their services, the surplus predicted in the Reduction of Unnecessary Services scenarios amounted to 26 percent (Demographic) and 18 percent (Trend) in 2020. General Internal Medicine In the Demographic Only Scenario forecast, demand growth outpaced supply growth by 209 physicians by 2020. Expressed as a percentage of the number of physicians required to meet the demand for their services, the shortage predicted in the Demographic Only Scenario amounted to 4 percent in 2020. In the Trend Scenario, demand growth outpaced supply growth by 578 physicians by 2020. Expressed as a percentage of the number of physicians required to meet the demand for their services, the shortage predicted in the Trend Scenario amounted to 10 percent in 2020. In the Reduction of Unnecessary Services scenarios, while the supply of physicians was forecast to grow by 11 percent, demand was forecast to decline by 17 percent (Demographic) and 11 percent (Trend) by 2020. Expressed as a percentage of the number of physicians required to meet
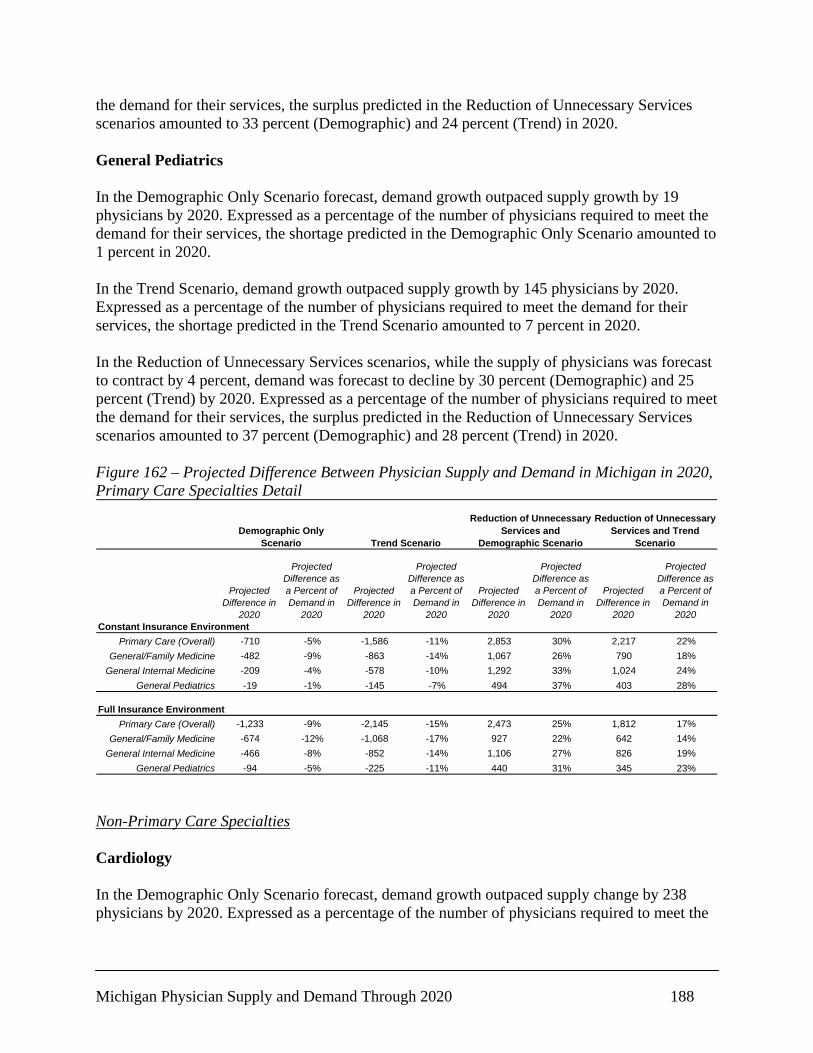
Michigan Physician Supply and Demand Through 2020 188
the demand for their services, the surplus predicted in the Reduction of Unnecessary Services scenarios amounted to 33 percent (Demographic) and 24 percent (Trend) in 2020. General Pediatrics In the Demographic Only Scenario forecast, demand growth outpaced supply growth by 19 physicians by 2020. Expressed as a percentage of the number of physicians required to meet the demand for their services, the shortage predicted in the Demographic Only Scenario amounted to 1 percent in 2020. In the Trend Scenario, demand growth outpaced supply growth by 145 physicians by 2020. Expressed as a percentage of the number of physicians required to meet the demand for their services, the shortage predicted in the Trend Scenario amounted to 7 percent in 2020. In the Reduction of Unnecessary Services scenarios, while the supply of physicians was forecast to contract by 4 percent, demand was forecast to decline by 30 percent (Demographic) and 25 percent (Trend) by 2020. Expressed as a percentage of the number of physicians required to meet the demand for their services, the surplus predicted in the Reduction of Unnecessary Services scenarios amounted to 37 percent (Demographic) and 28 percent (Trend) in 2020. Figure 162 – Projected Difference Between Physician Supply and Demand in Michigan in 2020, Primary Care Specialties Detail
Projected Difference in
2020
Projected Difference as a Percent of Demand in
2020
Projected Difference in
2020
Projected Difference as a Percent of Demand in
2020
Projected Difference in
2020
Projected Difference as a Percent of Demand in
2020
Projected Difference in
2020
Projected Difference as a Percent of Demand in
2020Constant Insurance Environment
Primary Care (Overall) -710 -5% -1,586 -11% 2,853 30% 2,217 22%General/Family Medicine -482 -9% -863 -14% 1,067 26% 790 18%
General Internal Medicine -209 -4% -578 -10% 1,292 33% 1,024 24%General Pediatrics -19 -1% -145 -7% 494 37% 403 28%
Full Insurance EnvironmentPrimary Care (Overall) -1,233 -9% -2,145 -15% 2,473 25% 1,812 17%
General/Family Medicine -674 -12% -1,068 -17% 927 22% 642 14%General Internal Medicine -466 -8% -852 -14% 1,106 27% 826 19%
General Pediatrics -94 -5% -225 -11% 440 31% 345 23%
Demographic Only Scenario Trend Scenario
Reduction of Unnecessary Services and
Demographic Scenario
Reduction of Unnecessary Services and Trend
Scenario
Non-Primary Care Specialties Cardiology In the Demographic Only Scenario forecast, demand growth outpaced supply change by 238 physicians by 2020. Expressed as a percentage of the number of physicians required to meet the
Michigan Physician Supply and Demand Through 2020 189
demand for their services, the shortage predicted in the Demographic Only Scenario amounted to 27 percent in 2020. In the Trend Scenario, demand growth outpaced supply growth by 372 physicians by 2020. Expressed as a percentage of the number of physicians required to meet the demand for their services, the shortage predicted in the Trend Scenario amounted to 36 percent in 2020. In the Reduction of Unnecessary Services scenarios, while the supply of physicians was forecast to contract by 10 percent, demand was forecast to decline by 12 percent (Demographic) and increase by 2 percent (Trend) by 2020. Expressed as a percentage of the number of physicians required to meet the demand for their services, the predicted difference between supply and demand for Cardiologists in the Reduction of Unnecessary Services scenarios ranged from a 1 percent surplus (Demographic) to a 12 percent shortage (Trend) in 2020. Other Internal Medicine Subspecialties In the Demographic Only Scenario forecast, supply growth outpaced demand growth by 99 physicians by 2020. Expressed as a percentage of the number of physicians required to meet the demand for their services, the surplus predicted in the Demographic Only Scenario amounted to 3 percent in 2020. In the Trend Scenario, demand growth outpaced supply growth by 620 physicians by 2020. Expressed as a percentage of the number of physicians required to meet the demand for their services, the shortage predicted in the Trend Scenario amounted to 16 percent in 2020. In the Reduction of Unnecessary Services scenarios, while the supply of physicians was forecast to grow by 14 percent, demand was forecast to decline by 15 percent (Demographic) and 3 percent (Trend) by 2020. Expressed as a percentage of the number of physicians required to meet the demand for their services, the surplus predicted in the Reduction of Unnecessary Services scenarios amounted to 34 percent (Demographic) and 17 percent (Trend) in 2020. Obstetrics and Gynecology In the Demographic Only Scenario forecast, supply growth outpaced demand growth by 41 physicians by 2020. Expressed as a percentage of the number of physicians required to meet the demand for their services, the surplus predicted in the Demographic Only Scenario amounted to 2 percent in 2020. In the Trend Scenario, demand growth outpaced supply growth by 218 physicians by 2020. Expressed as a percentage of the number of physicians required to meet the demand for their services, the shortage predicted in the Trend Scenario amounted to 11 percent in 2020. In the Reduction of Unnecessary Services scenarios, while the supply of physicians was forecast to grow by 3 percent, demand was forecast to decline by 27 percent (Demographic) and 16 percent (Trend) by 2020. Expressed as a percentage of the number of physicians required to meet
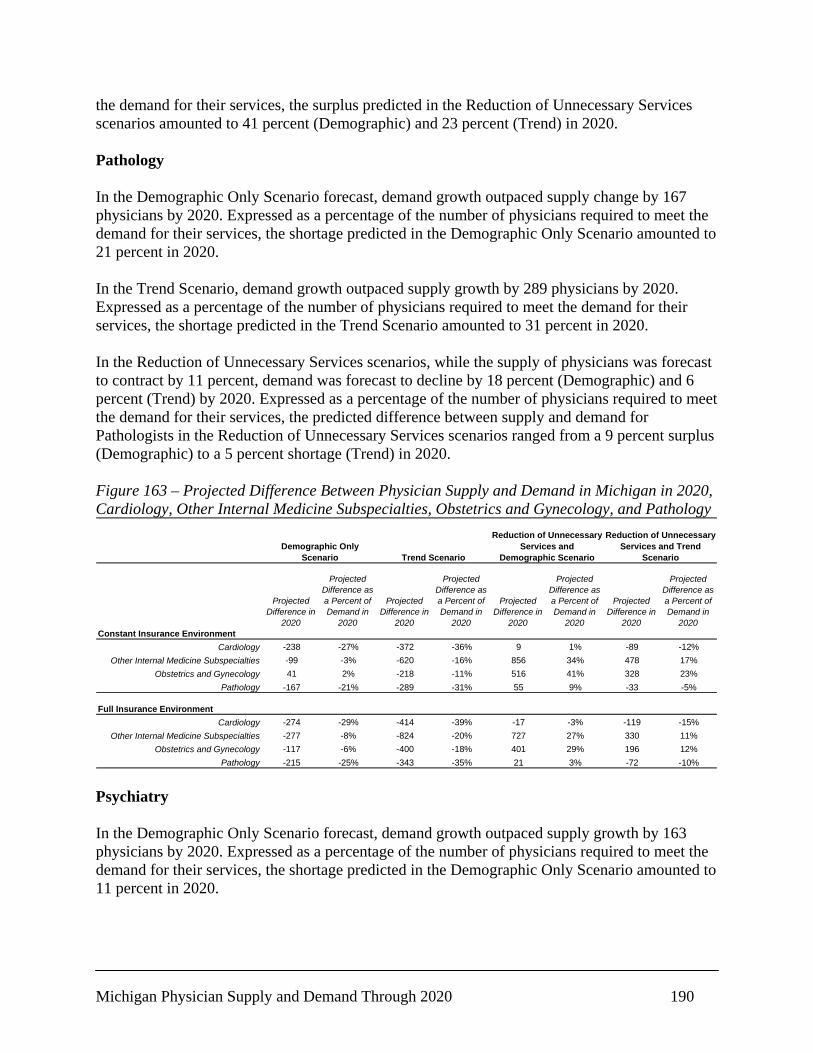
Michigan Physician Supply and Demand Through 2020 190
the demand for their services, the surplus predicted in the Reduction of Unnecessary Services scenarios amounted to 41 percent (Demographic) and 23 percent (Trend) in 2020. Pathology In the Demographic Only Scenario forecast, demand growth outpaced supply change by 167 physicians by 2020. Expressed as a percentage of the number of physicians required to meet the demand for their services, the shortage predicted in the Demographic Only Scenario amounted to 21 percent in 2020. In the Trend Scenario, demand growth outpaced supply growth by 289 physicians by 2020. Expressed as a percentage of the number of physicians required to meet the demand for their services, the shortage predicted in the Trend Scenario amounted to 31 percent in 2020. In the Reduction of Unnecessary Services scenarios, while the supply of physicians was forecast to contract by 11 percent, demand was forecast to decline by 18 percent (Demographic) and 6 percent (Trend) by 2020. Expressed as a percentage of the number of physicians required to meet the demand for their services, the predicted difference between supply and demand for Pathologists in the Reduction of Unnecessary Services scenarios ranged from a 9 percent surplus (Demographic) to a 5 percent shortage (Trend) in 2020. Figure 163 – Projected Difference Between Physician Supply and Demand in Michigan in 2020, Cardiology, Other Internal Medicine Subspecialties, Obstetrics and Gynecology, and Pathology
Projected Difference in
2020
Projected Difference as a Percent of Demand in
2020
Projected Difference in
2020
Projected Difference as a Percent of Demand in
2020
Projected Difference in
2020
Projected Difference as a Percent of Demand in
2020
Projected Difference in
2020
Projected Difference as a Percent of Demand in
2020Constant Insurance Environment
Cardiology -238 -27% -372 -36% 9 1% -89 -12%Other Internal Medicine Subspecialties -99 -3% -620 -16% 856 34% 478 17%
Obstetrics and Gynecology 41 2% -218 -11% 516 41% 328 23%Pathology -167 -21% -289 -31% 55 9% -33 -5%
Full Insurance EnvironmentCardiology -274 -29% -414 -39% -17 -3% -119 -15%
Other Internal Medicine Subspecialties -277 -8% -824 -20% 727 27% 330 11%Obstetrics and Gynecology -117 -6% -400 -18% 401 29% 196 12%
Pathology -215 -25% -343 -35% 21 3% -72 -10%
Demographic Only Scenario Trend Scenario
Reduction of Unnecessary Services and
Demographic Scenario
Reduction of Unnecessary Services and Trend
Scenario
Psychiatry In the Demographic Only Scenario forecast, demand growth outpaced supply growth by 163 physicians by 2020. Expressed as a percentage of the number of physicians required to meet the demand for their services, the shortage predicted in the Demographic Only Scenario amounted to 11 percent in 2020.

Michigan Physician Supply and Demand Through 2020 191
In the Trend Scenario, demand growth outpaced supply growth by 382 physicians by 2020. Expressed as a percentage of the number of physicians required to meet the demand for their services, the shortage predicted in the Trend Scenario amounted to 23 percent in 2020. In the Reduction of Unnecessary Services scenarios, while the supply of physicians was forecast to contract by 5 percent, demand was forecast to decline by 22 percent (Demographic) and 10 percent (Trend) by 2020. Expressed as a percentage of the number of physicians required to meet the demand for their services, the surplus predicted in the Reduction of Unnecessary Services scenarios amounted to 23 percent (Demographic) and 7 percent (Trend) in 2020. Anesthesiology In the Demographic Only Scenario forecast, supply growth outpaced demand growth by 52 physicians by 2020. Expressed as a percentage of the number of physicians required to meet the demand for their services, the surplus predicted in the Demographic Only Scenario amounted to 4 percent in 2020. In the Trend Scenario, demand growth outpaced supply growth by 275 physicians by 2020. Expressed as a percentage of the number of physicians required to meet the demand for their services, the shortage predicted in the Trend Scenario amounted to 16 percent in 2020. In the Reduction of Unnecessary Services scenarios, while the supply of physicians was forecast to grow by 11 percent, demand was forecast to decline by 17 percent (Demographic) and 4 percent (Trend) by 2020. Expressed as a percentage of the number of physicians required to meet the demand for their services, the surplus predicted in the Reduction of Unnecessary Services scenarios amounted to 33 percent (Demographic) and 16 percent (Trend) in 2020. Radiology In the Demographic Only Scenario forecast, demand growth outpaced supply growth by 137 physicians by 2020. Expressed as a percentage of the number of physicians required to meet the demand for their services, the shortage predicted in the Demographic Only Scenario amounted to 9 percent in 2020. In the Trend Scenario, demand growth outpaced supply growth by 373 physicians by 2020. Expressed as a percentage of the number of physicians required to meet the demand for their services, the shortage predicted in the Trend Scenario amounted to 21 percent in 2020. In the Reduction of Unnecessary Services scenarios, while the supply of physicians was forecast to grow by 4 percent, demand was forecast to decline by 17 percent (Demographic) and 5 percent (Trend) by 2020. Expressed as a percentage of the number of physicians required to meet the demand for their services, the surplus predicted in the Reduction of Unnecessary Services scenarios amounted to 26 percent (Demographic) and 9 percent (Trend) in 2020.

Michigan Physician Supply and Demand Through 2020 192
Emergency Medicine In the Demographic Only Scenario forecast, supply growth outpaced demand growth by 323 physicians by 2020. Expressed as a percentage of the number of physicians required to meet the demand for their services, the surplus predicted in the Demographic Only Scenario amounted to 19 percent in 2020. In the Trend Scenario, supply growth outpaced demand growth by 61 physicians by 2020. Expressed as a percentage of the number of physicians required to meet the demand for their services, the surplus predicted in the Trend Scenario amounted to 3 percent in 2020. In the Reduction of Unnecessary Services scenarios, while the supply of physicians was forecast to grow by 25 percent, demand was forecast to decline by 24 percent (Demographic) and 12 percent (Trend) by 2020. Expressed as a percentage of the number of physicians required to meet the demand for their services, the surplus predicted in the Reduction of Unnecessary Services scenarios amounted to 63 percent (Demographic) and 42 percent (Trend) in 2020. Figure 164 – Projected Difference Between Physician Supply and Demand in Michigan in 2020, Psychiatry, Anesthesiology, Radiology, and Emergency Medicine
Projected Difference in
2020
Projected Difference as a Percent of Demand in
2020
Projected Difference in
2020
Projected Difference as a Percent of Demand in
2020
Projected Difference in
2020
Projected Difference as a Percent of Demand in
2020
Projected Difference in
2020
Projected Difference as a Percent of Demand in
2020Constant Insurance Environment
Psychiatry -163 -11% -382 -23% 238 23% 79 7%Anesthesiology -52 -4% -275 -16% 356 33% 194 16%
Radiology -137 -9% -373 -21% 296 26% 124 9%Emergency Medicine 323 19% 61 3% 802 63% 613 42%
Full Insurance EnvironmentPsychiatry -166 -11% -386 -23% 235 22% 76 6%
Anesthesiology -130 -8% -365 -20% 299 26% 129 10%Radiology -228 -14% -477 -25% 230 19% 49 4%
Emergency Medicine 262 15% -9 0% 758 58% 562 37%
Demographic Only Scenario Trend Scenario
Reduction of Unnecessary Services and
Demographic Scenario
Reduction of Unnecessary Services and Trend
Scenario
General Surgery In the Demographic Only Scenario forecast, demand growth outpaced supply growth by 284 physicians by 2020. Expressed as a percentage of the number of physicians required to meet the demand for their services, the shortage predicted in the Demographic Only Scenario amounted to 15 percent in 2020. In the Trend Scenario, demand growth outpaced supply growth by 569 physicians by 2020. Expressed as a percentage of the number of physicians required to meet the demand for their services, the shortage predicted in the Trend Scenario amounted to 26 percent in 2020. In the Reduction of Unnecessary Services scenarios, while the supply of physicians was forecast to contract by 2 percent, demand was forecast to decline by 17 percent (Demographic) and 4

Michigan Physician Supply and Demand Through 2020 193
percent (Trend) by 2020. Expressed as a percentage of the number of physicians required to meet the demand for their services, the surplus predicted in the Reduction of Unnecessary Services scenarios amounted to 17 percent (Demographic) and 2 percent (Trend) in 2020. Ophthalmology In the Demographic Only Scenario forecast, demand growth outpaced supply change by 157 physicians by 2020. Expressed as a percentage of the number of physicians required to meet the demand for their services, the shortage predicted in the Demographic Only Scenario amounted to 20 percent in 2020. In the Trend Scenario, demand growth outpaced supply growth by 275 physicians by 2020. Expressed as a percentage of the number of physicians required to meet the demand for their services, the shortage predicted in the Trend Scenario amounted to 30 percent in 2020. In the Reduction of Unnecessary Services scenarios, while the supply of physicians was forecast to contract by 6 percent, demand was forecast to decline by 15 percent (Demographic) and 2 percent (Trend) by 2020. Expressed as a percentage of the number of physicians required to meet the demand for their services, the predicted difference between supply and demand for Pathologists in the Reduction of Unnecessary Services scenarios ranged from a 10 percent surplus (Demographic) to a 4 percent shortage (Trend) in 2020. Otolaryngology In the Demographic Only Scenario forecast, demand growth outpaced supply growth by 35 physicians by 2020. Expressed as a percentage of the number of physicians required to meet the demand for their services, the shortage predicted in the Demographic Only Scenario amounted to 10 percent in 2020. In the Trend Scenario, demand growth outpaced supply growth by 87 physicians by 2020. Expressed as a percentage of the number of physicians required to meet the demand for their services, the shortage predicted in the Trend Scenario amounted to 22 percent in 2020. In the Reduction of Unnecessary Services scenarios, while the supply of physicians was forecast to contract by 2 percent, demand was forecast to decline by 21 percent (Demographic) and 9 percent (Trend) by 2020. Expressed as a percentage of the number of physicians required to meet the demand for their services, the surplus predicted in the Reduction of Unnecessary Services scenarios amounted to 24 percent (Demographic) and 8 percent (Trend) in 2020. Orthopedic Surgery In the Demographic Only Scenario forecast, demand growth outpaced supply growth by 130 physicians by 2020. Expressed as a percentage of the number of physicians required to meet the demand for their services, the shortage predicted in the Demographic Only Scenario amounted to 14 percent in 2020.
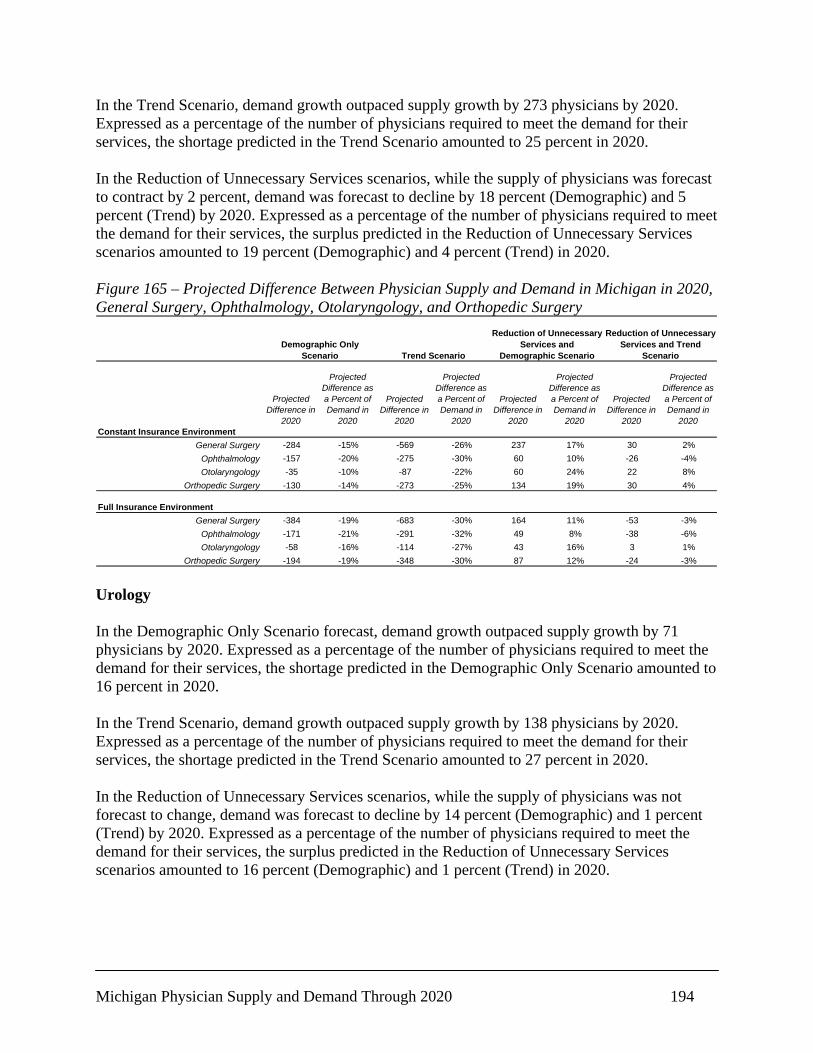
Michigan Physician Supply and Demand Through 2020 194
In the Trend Scenario, demand growth outpaced supply growth by 273 physicians by 2020. Expressed as a percentage of the number of physicians required to meet the demand for their services, the shortage predicted in the Trend Scenario amounted to 25 percent in 2020. In the Reduction of Unnecessary Services scenarios, while the supply of physicians was forecast to contract by 2 percent, demand was forecast to decline by 18 percent (Demographic) and 5 percent (Trend) by 2020. Expressed as a percentage of the number of physicians required to meet the demand for their services, the surplus predicted in the Reduction of Unnecessary Services scenarios amounted to 19 percent (Demographic) and 4 percent (Trend) in 2020. Figure 165 – Projected Difference Between Physician Supply and Demand in Michigan in 2020, General Surgery, Ophthalmology, Otolaryngology, and Orthopedic Surgery
Projected Difference in
2020
Projected Difference as a Percent of Demand in
2020
Projected Difference in
2020
Projected Difference as a Percent of Demand in
2020
Projected Difference in
2020
Projected Difference as a Percent of Demand in
2020
Projected Difference in
2020
Projected Difference as a Percent of Demand in
2020Constant Insurance Environment
General Surgery -284 -15% -569 -26% 237 17% 30 2%Ophthalmology -157 -20% -275 -30% 60 10% -26 -4%Otolaryngology -35 -10% -87 -22% 60 24% 22 8%
Orthopedic Surgery -130 -14% -273 -25% 134 19% 30 4%
Full Insurance EnvironmentGeneral Surgery -384 -19% -683 -30% 164 11% -53 -3%
Ophthalmology -171 -21% -291 -32% 49 8% -38 -6%Otolaryngology -58 -16% -114 -27% 43 16% 3 1%
Orthopedic Surgery -194 -19% -348 -30% 87 12% -24 -3%
Demographic Only Scenario Trend Scenario
Reduction of Unnecessary Services and
Demographic Scenario
Reduction of Unnecessary Services and Trend
Scenario
Urology In the Demographic Only Scenario forecast, demand growth outpaced supply growth by 71 physicians by 2020. Expressed as a percentage of the number of physicians required to meet the demand for their services, the shortage predicted in the Demographic Only Scenario amounted to 16 percent in 2020. In the Trend Scenario, demand growth outpaced supply growth by 138 physicians by 2020. Expressed as a percentage of the number of physicians required to meet the demand for their services, the shortage predicted in the Trend Scenario amounted to 27 percent in 2020. In the Reduction of Unnecessary Services scenarios, while the supply of physicians was not forecast to change, demand was forecast to decline by 14 percent (Demographic) and 1 percent (Trend) by 2020. Expressed as a percentage of the number of physicians required to meet the demand for their services, the surplus predicted in the Reduction of Unnecessary Services scenarios amounted to 16 percent (Demographic) and 1 percent (Trend) in 2020.
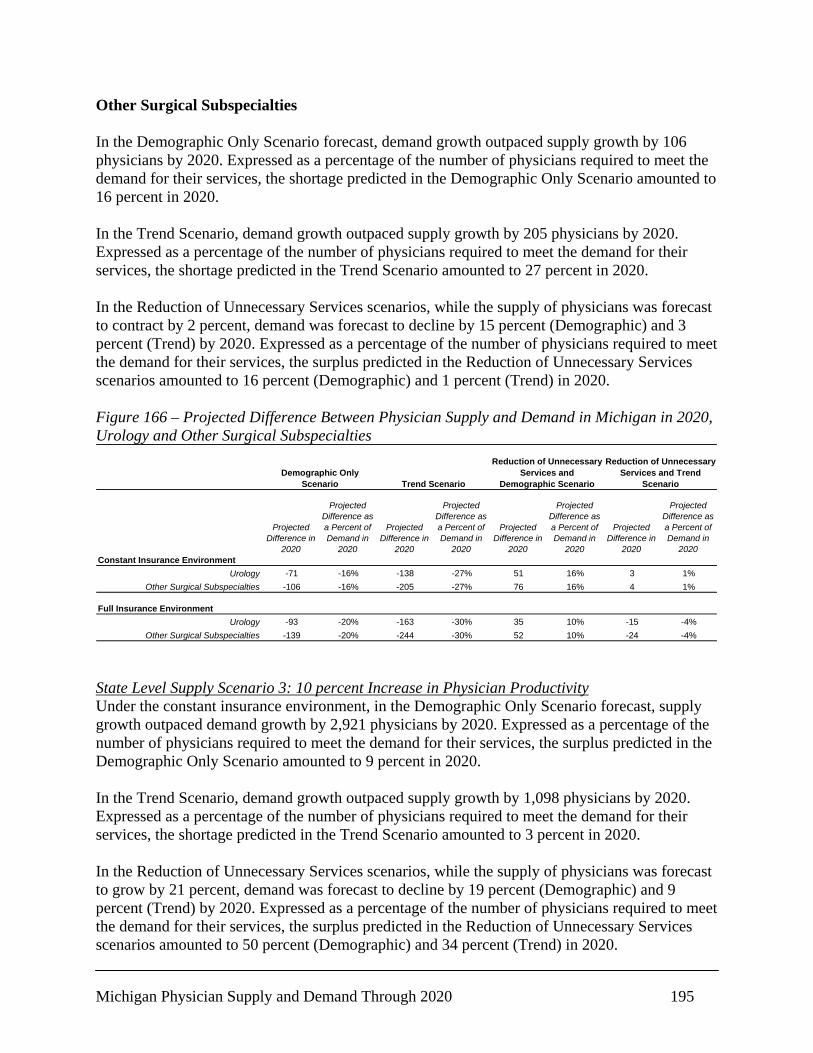
Michigan Physician Supply and Demand Through 2020 195
Other Surgical Subspecialties In the Demographic Only Scenario forecast, demand growth outpaced supply growth by 106 physicians by 2020. Expressed as a percentage of the number of physicians required to meet the demand for their services, the shortage predicted in the Demographic Only Scenario amounted to 16 percent in 2020. In the Trend Scenario, demand growth outpaced supply growth by 205 physicians by 2020. Expressed as a percentage of the number of physicians required to meet the demand for their services, the shortage predicted in the Trend Scenario amounted to 27 percent in 2020. In the Reduction of Unnecessary Services scenarios, while the supply of physicians was forecast to contract by 2 percent, demand was forecast to decline by 15 percent (Demographic) and 3 percent (Trend) by 2020. Expressed as a percentage of the number of physicians required to meet the demand for their services, the surplus predicted in the Reduction of Unnecessary Services scenarios amounted to 16 percent (Demographic) and 1 percent (Trend) in 2020. Figure 166 – Projected Difference Between Physician Supply and Demand in Michigan in 2020, Urology and Other Surgical Subspecialties
Projected Difference in
2020
Projected Difference as a Percent of Demand in
2020
Projected Difference in
2020
Projected Difference as a Percent of Demand in
2020
Projected Difference in
2020
Projected Difference as a Percent of Demand in
2020
Projected Difference in
2020
Projected Difference as a Percent of Demand in
2020Constant Insurance Environment
Urology -71 -16% -138 -27% 51 16% 3 1%Other Surgical Subspecialties -106 -16% -205 -27% 76 16% 4 1%
Full Insurance EnvironmentUrology -93 -20% -163 -30% 35 10% -15 -4%
Other Surgical Subspecialties -139 -20% -244 -30% 52 10% -24 -4%
Demographic Only Scenario Trend Scenario
Reduction of Unnecessary Services and
Demographic Scenario
Reduction of Unnecessary Services and Trend
Scenario
State Level Supply Scenario 3: 10 percent Increase in Physician Productivity Under the constant insurance environment, in the Demographic Only Scenario forecast, supply growth outpaced demand growth by 2,921 physicians by 2020. Expressed as a percentage of the number of physicians required to meet the demand for their services, the surplus predicted in the Demographic Only Scenario amounted to 9 percent in 2020. In the Trend Scenario, demand growth outpaced supply growth by 1,098 physicians by 2020. Expressed as a percentage of the number of physicians required to meet the demand for their services, the shortage predicted in the Trend Scenario amounted to 3 percent in 2020. In the Reduction of Unnecessary Services scenarios, while the supply of physicians was forecast to grow by 21 percent, demand was forecast to decline by 19 percent (Demographic) and 9 percent (Trend) by 2020. Expressed as a percentage of the number of physicians required to meet the demand for their services, the surplus predicted in the Reduction of Unnecessary Services scenarios amounted to 50 percent (Demographic) and 34 percent (Trend) in 2020.
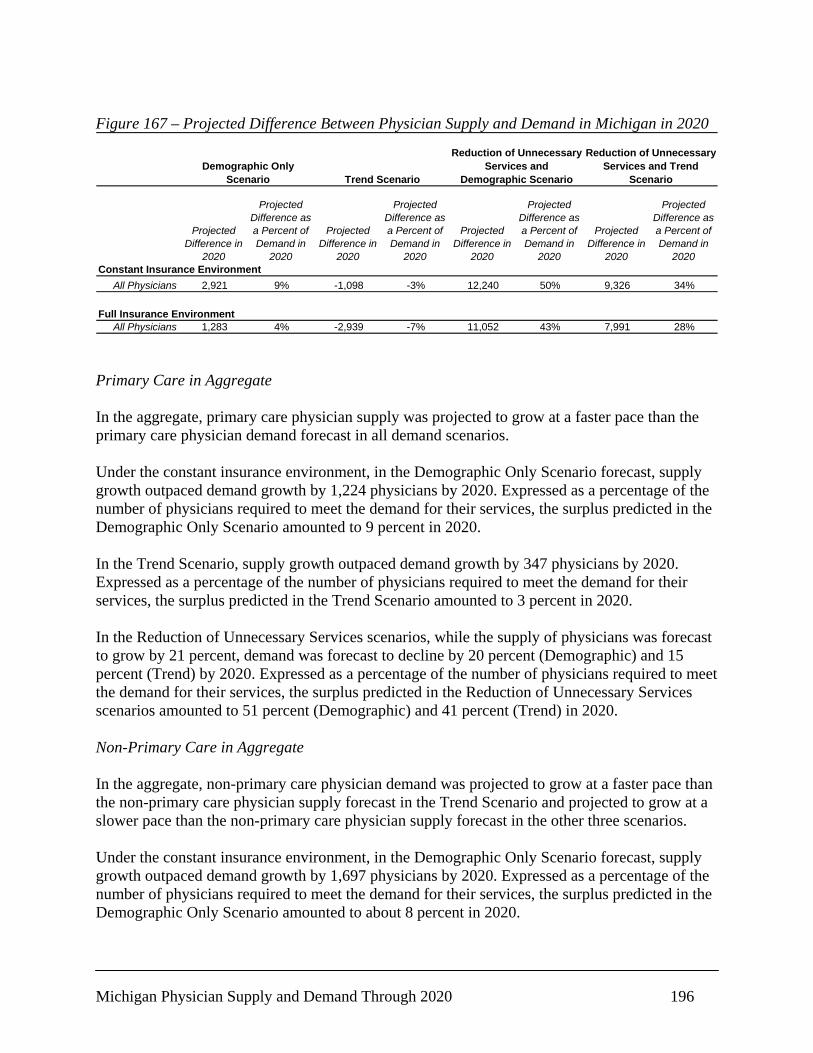
Michigan Physician Supply and Demand Through 2020 196
Figure 167 – Projected Difference Between Physician Supply and Demand in Michigan in 2020
Projected Difference in
2020
Projected Difference as a Percent of Demand in
2020
Projected Difference in
2020
Projected Difference as a Percent of Demand in
2020
Projected Difference in
2020
Projected Difference as a Percent of Demand in
2020
Projected Difference in
2020
Projected Difference as a Percent of Demand in
2020Constant Insurance Environment
All Physicians 2,921 9% -1,098 -3% 12,240 50% 9,326 34%
Full Insurance EnvironmentAll Physicians 1,283 4% -2,939 -7% 11,052 43% 7,991 28%
Demographic Only Scenario Trend Scenario
Reduction of Unnecessary Services and
Demographic Scenario
Reduction of Unnecessary Services and Trend
Scenario
Primary Care in Aggregate In the aggregate, primary care physician supply was projected to grow at a faster pace than the primary care physician demand forecast in all demand scenarios. Under the constant insurance environment, in the Demographic Only Scenario forecast, supply growth outpaced demand growth by 1,224 physicians by 2020. Expressed as a percentage of the number of physicians required to meet the demand for their services, the surplus predicted in the Demographic Only Scenario amounted to 9 percent in 2020. In the Trend Scenario, supply growth outpaced demand growth by 347 physicians by 2020. Expressed as a percentage of the number of physicians required to meet the demand for their services, the surplus predicted in the Trend Scenario amounted to 3 percent in 2020. In the Reduction of Unnecessary Services scenarios, while the supply of physicians was forecast to grow by 21 percent, demand was forecast to decline by 20 percent (Demographic) and 15 percent (Trend) by 2020. Expressed as a percentage of the number of physicians required to meet the demand for their services, the surplus predicted in the Reduction of Unnecessary Services scenarios amounted to 51 percent (Demographic) and 41 percent (Trend) in 2020. Non-Primary Care in Aggregate In the aggregate, non-primary care physician demand was projected to grow at a faster pace than the non-primary care physician supply forecast in the Trend Scenario and projected to grow at a slower pace than the non-primary care physician supply forecast in the other three scenarios. Under the constant insurance environment, in the Demographic Only Scenario forecast, supply growth outpaced demand growth by 1,697 physicians by 2020. Expressed as a percentage of the number of physicians required to meet the demand for their services, the surplus predicted in the Demographic Only Scenario amounted to about 8 percent in 2020.

Michigan Physician Supply and Demand Through 2020 197
In the Trend Scenario, demand growth outpaced supply growth by 1,446 physicians by 2020. Expressed as a percentage of the number of physicians required to meet the demand for their services, the shortage predicted in the Trend Scenario amounted to 6 percent in 2020. In the Reduction of Unnecessary Services scenarios, while the supply of physicians was forecast to grow by 22 percent, demand was forecast to decline by 18 percent (Demographic) and 6 percent (Trend) by 2020. Expressed as a percentage of the number of physicians required to meet the demand for their services, the surplus predicted in the Reduction of Unnecessary Services scenarios amounted to 49 percent (Demographic) and 30 percent (Trend) in 2020. Figure 168 – Projected Difference Between Physician Supply and Demand in Michigan in 2020, Primary Care and Non-Primary Care Specialties
Projected Difference in
2020
Projected Difference as a Percent of Demand in
2020
Projected Difference in
2020
Projected Difference as a Percent of Demand in
2020
Projected Difference in
2020
Projected Difference as a Percent of Demand in
2020
Projected Difference in
2020
Projected Difference as a Percent of Demand in
2020Constant Insurance Environment
Primary Care 1,224 9% 347 3% 4,786 51% 4,151 41%Non-Primary Care 1,697 8% -1,446 -6% 7,454 49% 5,176 30%
Full Insurance EnvironmentPrimary Care 700 5% -211 -1% 4,406 45% 3,746 36%
Non-Primary Care 583 3% -2,728 -11% 6,646 42% 4,246 23%
Demographic Only Scenario Trend Scenario
Reduction of Unnecessary Services and
Demographic Scenario
Reduction of Unnecessary Services and Trend
Scenario
Specialty-Specific Supply and Demand Relationships In the Demographic Only Scenario, demand was forecast to grow at a faster rate than supply in Cardiology, General Surgery, Ophthalmology, Urology, and other Surgical Specialties. Thus, in most specialties, the Demographic Only Scenario forecasts suggested that there would be a surplus of physicians in the state in 2020. The surplus was forecast to be most significant in General Pediatrics, Obstetrics and Gynecology, and Emergency Medicine where the forecast surplus was at least 15 percent of the forecast demand for physicians in those specialties. In the Trend Scenario, demand was forecast to grow at a faster rate than supply in General/Family Medicine, Cardiology, Pathology, Psychiatry, Anesthesiology, Radiology, General Surgery, Ophthalmology, Otolaryngology, Orthopedic Surgery, Urology, and other Surgery Subspecialties. Thus, in those specialties, the Trend Scenario forecasts suggested that there would be a shortage of physicians in the state in 2020. The shortage was forecast to be most acute in Cardiology and Pathology where the difference between physician supply and demand was forecast to be at least 20 percent of the forecast demand for physicians in those specialties. In the Reduction of Unnecessary Services scenarios, supply was forecast to grow at a faster rate than demand in all specialties except Cardiology (Trend in Full Insurance Environment). Thus,

Michigan Physician Supply and Demand Through 2020 198
in the vast majority of specialties, this scenario suggested that if all unnecessary services were eliminated, a surplus of physicians would exist in 2020. In many cases, the surplus would be in excess of 30 percent. Primary Care Specialties General/Family Medicine In the Demographic Only Scenario forecast, supply growth outpaced demand growth by 331 physicians by 2020. Expressed as a percentage of the number of physicians required to meet the demand for their services, the surplus predicted in the Demographic Only Scenario amounted to 6 percent in 2020. In the Trend Scenario, demand growth outpaced supply growth by 50 physicians by 2020. Expressed as a percentage of the number of physicians required to meet the demand for their services, the shortage predicted in the Trend Scenario amounted to 1 percent in 2020. In the Reduction of Unnecessary Services scenarios, while the supply of physicians was forecast to grow by 17 percent, demand was forecast to decline by 20 percent (Demographic) and 14 percent (Trend) by 2020. Expressed as a percentage of the number of physicians required to meet the demand for their services, the surplus predicted in the Reduction of Unnecessary Services scenarios amounted to 46 percent (Demographic) and 37 percent (Trend) in 2020. General Internal Medicine In the Demographic Only Scenario forecast, supply growth outpaced demand growth by 620 physicians by 2020. Expressed as a percentage of the number of physicians required to meet the demand for their services, the surplus predicted in the Demographic Only Scenario amounted to 11 percent in 2020. In the Trend Scenario, supply growth outpaced demand growth by 250 physicians by 2020. Expressed as a percentage of the number of physicians required to meet the demand for their services, the surplus predicted in the Trend Scenario amounted to 4 percent in 2020. In the Reduction of Unnecessary Services scenarios, while the supply of physicians was forecast to grow by 28 percent, demand was forecast to decline by 17 percent (Demographic) and 11 percent (Trend) by 2020. Expressed as a percentage of the number of physicians required to meet the demand for their services, the surplus predicted in the Reduction of Unnecessary Services scenarios amounted to 54 percent (Demographic) and 44 percent (Trend) in 2020. General Pediatrics In the Demographic Only Scenario forecast, supply growth outpaced demand growth by 273 physicians by 2020. Expressed as a percentage of the number of physicians required to meet the demand for their services, the surplus predicted in the Demographic Only Scenario amounted to 15 percent in 2020.
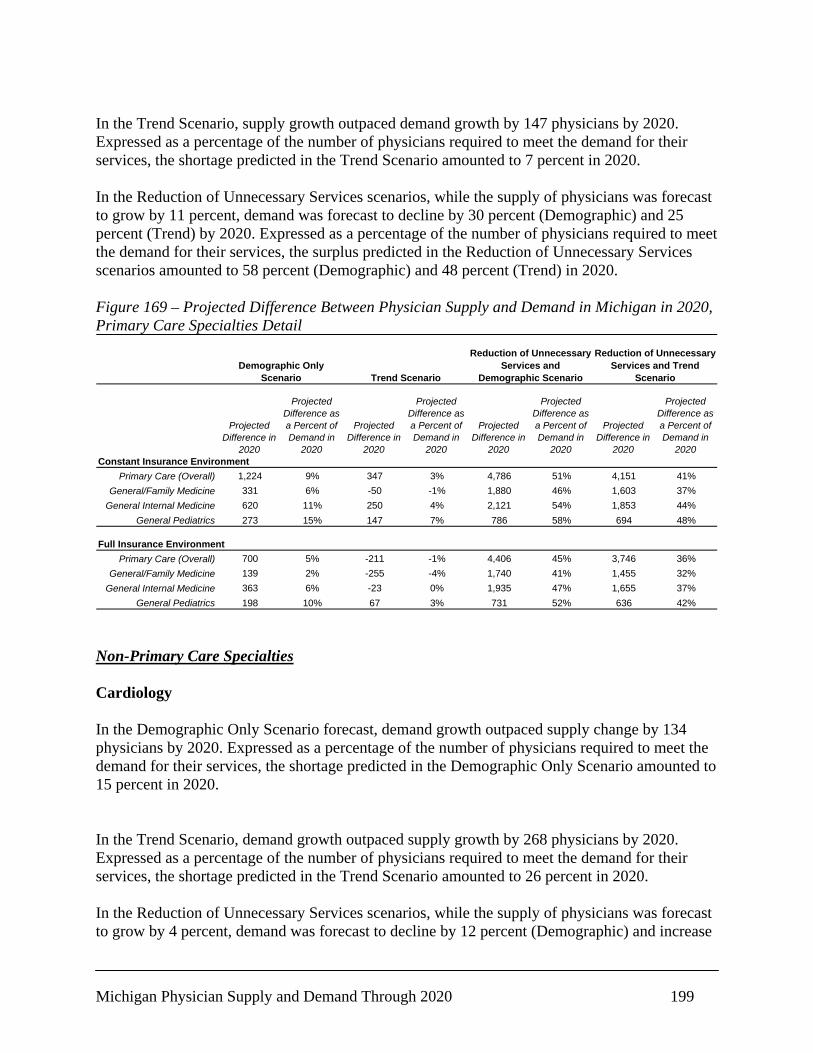
Michigan Physician Supply and Demand Through 2020 199
In the Trend Scenario, supply growth outpaced demand growth by 147 physicians by 2020. Expressed as a percentage of the number of physicians required to meet the demand for their services, the shortage predicted in the Trend Scenario amounted to 7 percent in 2020. In the Reduction of Unnecessary Services scenarios, while the supply of physicians was forecast to grow by 11 percent, demand was forecast to decline by 30 percent (Demographic) and 25 percent (Trend) by 2020. Expressed as a percentage of the number of physicians required to meet the demand for their services, the surplus predicted in the Reduction of Unnecessary Services scenarios amounted to 58 percent (Demographic) and 48 percent (Trend) in 2020. Figure 169 – Projected Difference Between Physician Supply and Demand in Michigan in 2020, Primary Care Specialties Detail
Projected Difference in
2020
Projected Difference as a Percent of Demand in
2020
Projected Difference in
2020
Projected Difference as a Percent of Demand in
2020
Projected Difference in
2020
Projected Difference as a Percent of Demand in
2020
Projected Difference in
2020
Projected Difference as a Percent of Demand in
2020Constant Insurance Environment
Primary Care (Overall) 1,224 9% 347 3% 4,786 51% 4,151 41%General/Family Medicine 331 6% -50 -1% 1,880 46% 1,603 37%
General Internal Medicine 620 11% 250 4% 2,121 54% 1,853 44%General Pediatrics 273 15% 147 7% 786 58% 694 48%
Full Insurance EnvironmentPrimary Care (Overall) 700 5% -211 -1% 4,406 45% 3,746 36%
General/Family Medicine 139 2% -255 -4% 1,740 41% 1,455 32%General Internal Medicine 363 6% -23 0% 1,935 47% 1,655 37%
General Pediatrics 198 10% 67 3% 731 52% 636 42%
Demographic Only Scenario Trend Scenario
Reduction of Unnecessary Services and
Demographic Scenario
Reduction of Unnecessary Services and Trend
Scenario
Non-Primary Care Specialties Cardiology In the Demographic Only Scenario forecast, demand growth outpaced supply change by 134 physicians by 2020. Expressed as a percentage of the number of physicians required to meet the demand for their services, the shortage predicted in the Demographic Only Scenario amounted to 15 percent in 2020. In the Trend Scenario, demand growth outpaced supply growth by 268 physicians by 2020. Expressed as a percentage of the number of physicians required to meet the demand for their services, the shortage predicted in the Trend Scenario amounted to 26 percent in 2020. In the Reduction of Unnecessary Services scenarios, while the supply of physicians was forecast to grow by 4 percent, demand was forecast to decline by 12 percent (Demographic) and increase
Michigan Physician Supply and Demand Through 2020 200
by 2 percent (Trend) by 2020. Expressed as a percentage of the number of physicians required to meet the demand for their services, the surplus predicted in the Reduction of Unnecessary Services scenarios amounted to 17 percent (Demographic) and 2 percent (Trend) in 2020. Other Internal Medicine Subspecialties In the Demographic Only Scenario forecast, supply growth outpaced demand growth by 434 physicians by 2020. Expressed as a percentage of the number of physicians required to meet the demand for their services, the surplus predicted in the Demographic Only Scenario amounted to 13 percent in 2020. In the Trend Scenario, demand growth outpaced supply growth by 87 physicians by 2020. Expressed as a percentage of the number of physicians required to meet the demand for their services, the shortage predicted in the Trend Scenario amounted to 2 percent in 2020. In the Reduction of Unnecessary Services scenarios, while the supply of physicians was forecast to grow by 31 percent, demand was forecast to decline by 15 percent (Demographic) and 3 percent (Trend) by 2020. Expressed as a percentage of the number of physicians required to meet the demand for their services, the surplus predicted in the Reduction of Unnecessary Services scenarios amounted to 55 percent (Demographic) and 35 percent (Trend) in 2020. Obstetrics and Gynecology In the Demographic Only Scenario forecast, supply growth outpaced demand growth by 320 physicians by 2020. Expressed as a percentage of the number of physicians required to meet the demand for their services, the surplus predicted in the Demographic Only Scenario amounted to 19 percent in 2020. In the Trend Scenario, supply growth outpaced demand growth by 61 physicians by 2020. Expressed as a percentage of the number of physicians required to meet the demand for their services, the surplus predicted in the Trend Scenario amounted to 3 percent in 2020. In the Reduction of Unnecessary Services scenarios, while the supply of physicians was forecast to grow by 19 percent, demand was forecast to decline by 27 percent (Demographic) and 16 percent (Trend) by 2020. Expressed as a percentage of the number of physicians required to meet the demand for their services, the surplus predicted in the Reduction of Unnecessary Services scenarios amounted to 64 percent (Demographic) and 42 percent (Trend) in 2020. Pathology In the Demographic Only Scenario forecast, demand growth outpaced supply change by 66 physicians by 2020. Expressed as a percentage of the number of physicians required to meet the demand for their services, the shortage predicted in the Demographic Only Scenario amounted to 8 percent in 2020.
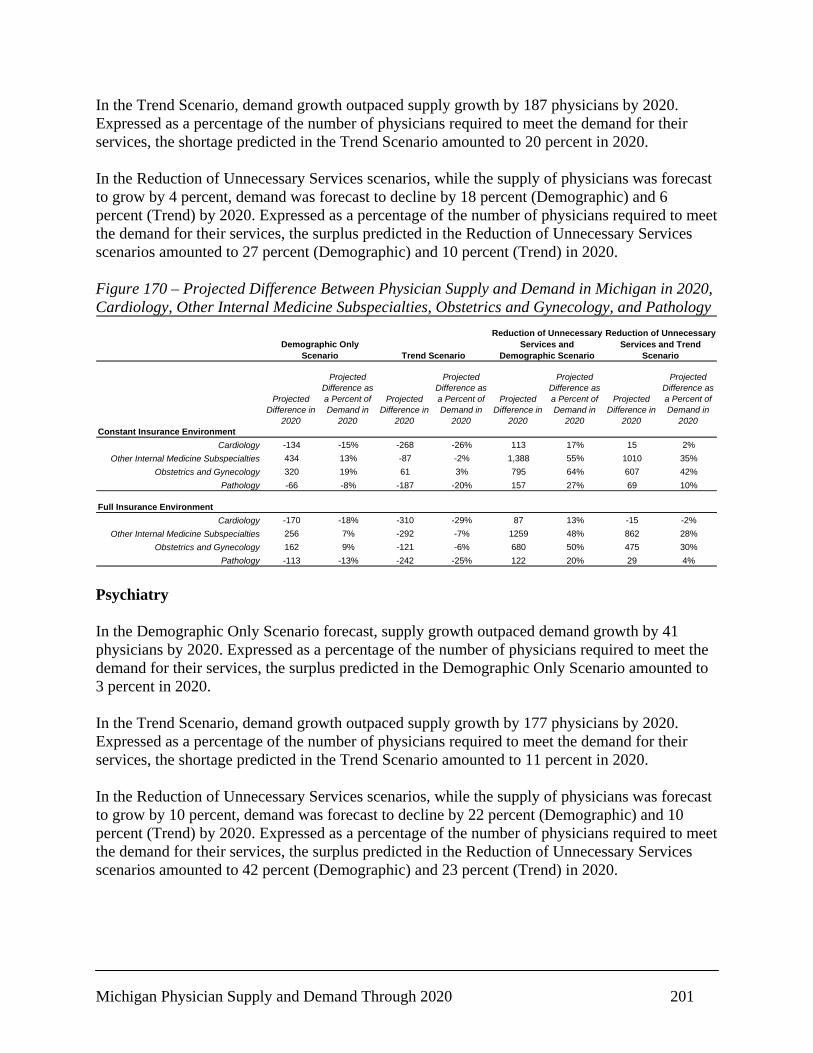
Michigan Physician Supply and Demand Through 2020 201
In the Trend Scenario, demand growth outpaced supply growth by 187 physicians by 2020. Expressed as a percentage of the number of physicians required to meet the demand for their services, the shortage predicted in the Trend Scenario amounted to 20 percent in 2020. In the Reduction of Unnecessary Services scenarios, while the supply of physicians was forecast to grow by 4 percent, demand was forecast to decline by 18 percent (Demographic) and 6 percent (Trend) by 2020. Expressed as a percentage of the number of physicians required to meet the demand for their services, the surplus predicted in the Reduction of Unnecessary Services scenarios amounted to 27 percent (Demographic) and 10 percent (Trend) in 2020. Figure 170 – Projected Difference Between Physician Supply and Demand in Michigan in 2020, Cardiology, Other Internal Medicine Subspecialties, Obstetrics and Gynecology, and Pathology
Projected Difference in
2020
Projected Difference as a Percent of Demand in
2020
Projected Difference in
2020
Projected Difference as a Percent of Demand in
2020
Projected Difference in
2020
Projected Difference as a Percent of Demand in
2020
Projected Difference in
2020
Projected Difference as a Percent of Demand in
2020Constant Insurance Environment
Cardiology -134 -15% -268 -26% 113 17% 15 2%Other Internal Medicine Subspecialties 434 13% -87 -2% 1,388 55% 1010 35%
Obstetrics and Gynecology 320 19% 61 3% 795 64% 607 42%Pathology -66 -8% -187 -20% 157 27% 69 10%
Full Insurance EnvironmentCardiology -170 -18% -310 -29% 87 13% -15 -2%
Other Internal Medicine Subspecialties 256 7% -292 -7% 1259 48% 862 28%Obstetrics and Gynecology 162 9% -121 -6% 680 50% 475 30%
Pathology -113 -13% -242 -25% 122 20% 29 4%
Demographic Only Scenario Trend Scenario
Reduction of Unnecessary Services and
Demographic Scenario
Reduction of Unnecessary Services and Trend
Scenario
Psychiatry In the Demographic Only Scenario forecast, supply growth outpaced demand growth by 41 physicians by 2020. Expressed as a percentage of the number of physicians required to meet the demand for their services, the surplus predicted in the Demographic Only Scenario amounted to 3 percent in 2020. In the Trend Scenario, demand growth outpaced supply growth by 177 physicians by 2020. Expressed as a percentage of the number of physicians required to meet the demand for their services, the shortage predicted in the Trend Scenario amounted to 11 percent in 2020. In the Reduction of Unnecessary Services scenarios, while the supply of physicians was forecast to grow by 10 percent, demand was forecast to decline by 22 percent (Demographic) and 10 percent (Trend) by 2020. Expressed as a percentage of the number of physicians required to meet the demand for their services, the surplus predicted in the Reduction of Unnecessary Services scenarios amounted to 42 percent (Demographic) and 23 percent (Trend) in 2020.

Michigan Physician Supply and Demand Through 2020 202
Anesthesiology In the Demographic Only Scenario forecast, supply growth outpaced demand growth by 174 physicians by 2020. Expressed as a percentage of the number of physicians required to meet the demand for their services, the surplus predicted in the Demographic Only Scenario amounted to 12 percent in 2020. In the Trend Scenario, demand growth outpaced supply growth by 49 physicians by 2020. Expressed as a percentage of the number of physicians required to meet the demand for their services, the shortage predicted in the Trend Scenario amounted to 3 percent in 2020. In the Reduction of Unnecessary Services scenarios, while the supply of physicians was forecast to grow by 28 percent, demand was forecast to decline by 17 percent (Demographic) and 4 percent (Trend) by 2020. Expressed as a percentage of the number of physicians required to meet the demand for their services, the surplus predicted in the Reduction of Unnecessary Services scenarios amounted to 54 percent (Demographic) and 34 percent (Trend) in 2020. Radiology In the Demographic Only Scenario forecast, supply growth outpaced demand growth by 90 physicians by 2020. Expressed as a percentage of the number of physicians required to meet the demand for their services, the surplus predicted in the Demographic Only Scenario amounted to 6 percent in 2020. In the Trend Scenario, demand growth outpaced supply growth by 146 physicians by 2020. Expressed as a percentage of the number of physicians required to meet the demand for their services, the shortage predicted in the Trend Scenario amounted to 8 percent in 2020. In the Reduction of Unnecessary Services scenarios, while the supply of physicians was forecast to grow by 21 percent, demand was forecast to decline by 17 percent (Demographic) and 5 percent (Trend) by 2020. Expressed as a percentage of the number of physicians required to meet the demand for their services, the surplus predicted in the Reduction of Unnecessary Services scenarios amounted to 46 percent (Demographic) and 27 percent (Trend) in 2020. Emergency Medicine In the Demographic Only Scenario forecast, supply growth outpaced demand growth by 649 physicians by 2020. Expressed as a percentage of the number of physicians required to meet the demand for their services, the surplus predicted in the Demographic Only Scenario amounted to 37 percent in 2020. In the Trend Scenario, supply growth outpaced demand growth by 388 physicians by 2020. Expressed as a percentage of the number of physicians required to meet the demand for their services, the surplus predicted in the Trend Scenario amounted to 19 percent in 2020.

Michigan Physician Supply and Demand Through 2020 203
In the Reduction of Unnecessary Services scenarios, while the supply of physicians was forecast to grow by 45 percent, demand was forecast to decline by 24 percent (Demographic) and 12 percent (Trend) by 2020. Expressed as a percentage of the number of physicians required to meet the demand for their services, the surplus predicted in the Reduction of Unnecessary Services scenarios amounted to 83 percent (Demographic) and 59 percent (Trend) in 2020. Figure 171 – Projected Difference Between Physician Supply and Demand in Michigan in 2020, Psychiatry, Anesthesiology, Radiology, and Emergency Medicine
Projected Difference in
2020
Projected Difference as a Percent of Demand in
2020
Projected Difference in
2020
Projected Difference as a Percent of Demand in
2020
Projected Difference in
2020
Projected Difference as a Percent of Demand in
2020
Projected Difference in
2020
Projected Difference as a Percent of Demand in
2020Constant Insurance Environment
Psychiatry 41 3% -177 -11% 442 42% 283 23%Anesthesiology 174 12% -49 -3% 582 54% 420 34%
Radiology 90 6% -146 -8% 522 46% 351 27%Emergency Medicine 649 37% 388 19% 1,129 89% 939 65%
Full Insurance EnvironmentPsychiatry 38 3% -181 -11% 439 42% 280 23%
Anesthesiology 95 6% -139 -8% 525 46% 355 27%Radiology -1 0% -251 -13% 457 38% 275 20%
Emergency Medicine 588 33% 317 15% 1,084 83% 888 59%
Demographic Only Scenario Trend Scenario
Reduction of Unnecessary Services and
Demographic Scenario
Reduction of Unnecessary Services and Trend
Scenario
General Surgery In the Demographic Only Scenario forecast, demand growth outpaced supply growth by 30 physicians by 2020. Expressed as a percentage of the number of physicians required to meet the demand for their services, the shortage predicted in the Demographic Only Scenario amounted to 2 percent in 2020. In the Trend Scenario, demand growth outpaced supply growth by 315 physicians by 2020. Expressed as a percentage of the number of physicians required to meet the demand for their services, the shortage predicted in the Trend Scenario amounted to 14 percent in 2020. In the Reduction of Unnecessary Services scenarios, while the supply of physicians was forecast to grow by 13 percent, demand was forecast to decline by 17 percent (Demographic) and 4 percent (Trend) by 2020. Expressed as a percentage of the number of physicians required to meet the demand for their services, the surplus predicted in the Reduction of Unnecessary Services scenarios amounted to 36 percent (Demographic) and 18 percent (Trend) in 2020. Ophthalmology In the Demographic Only Scenario forecast, demand growth outpaced supply change by 57 physicians by 2020. Expressed as a percentage of the number of physicians required to meet the demand for their services, the shortage predicted in the Demographic Only Scenario amounted to 7 percent in 2020.
Michigan Physician Supply and Demand Through 2020 204
In the Trend Scenario, demand growth outpaced supply growth by 175 physicians by 2020. Expressed as a percentage of the number of physicians required to meet the demand for their services, the shortage predicted in the Trend Scenario amounted to 19 percent in 2020. In the Reduction of Unnecessary Services scenarios, while the supply of physicians was forecast to grow by 9 percent, demand was forecast to decline by 15 percent (Demographic) and 2 percent (Trend) by 2020. Expressed as a percentage of the number of physicians required to meet the demand for their services, the surplus predicted in the Reduction of Unnecessary Services scenarios amounted to 28 percent (Demographic) and 11 percent (Trend) in 2020. Otolaryngology In the Demographic Only Scenario forecast, supply growth outpaced demand growth by 14 physicians by 2020. Expressed as a percentage of the number of physicians required to meet the demand for their services, the surplus predicted in the Demographic Only Scenario amounted to 4 percent in 2020. In the Trend Scenario, demand growth outpaced supply growth by 38 physicians by 2020. Expressed as a percentage of the number of physicians required to meet the demand for their services, the shortage predicted in the Trend Scenario amounted to 10 percent in 2020. In the Reduction of Unnecessary Services scenarios, while the supply of physicians was forecast to grow by 14 percent, demand was forecast to decline by 21 percent (Demographic) and 9 percent (Trend) by 2020. Expressed as a percentage of the number of physicians required to meet the demand for their services, the surplus predicted in the Reduction of Unnecessary Services scenarios amounted to 43 percent (Demographic) and 25 percent (Trend) in 2020. Orthopedic Surgery In the Demographic Only Scenario forecast, supply growth outpaced demand growth by 1 physician by 2020. Thus, the supply and demand for Orthopedic Surgeons was forecast to be in balanced in 2020. In the Trend Scenario, demand growth outpaced supply growth by 143 physicians by 2020. Expressed as a percentage of the number of physicians required to meet the demand for their services, the shortage predicted in the Trend Scenario amounted to 13 percent in 2020. In the Reduction of Unnecessary Services scenarios, while the supply of physicians was forecast to grow by 14 percent, demand was forecast to decline by 18 percent (Demographic) and 5 percent (Trend) by 2020. Expressed as a percentage of the number of physicians required to meet the demand for their services, the surplus predicted in the Reduction of Unnecessary Services scenarios amounted to 38 percent (Demographic) and 20 percent (Trend) in 2020.

Michigan Physician Supply and Demand Through 2020 205
Figure 172 – Projected Difference Between Physician Supply and Demand in Michigan in 2020, General Surgery, Ophthalmology, Otolaryngology, and Orthopedic Surgery
Projected Difference in
2020
Projected Difference as a Percent of Demand in
2020
Projected Difference in
2020
Projected Difference as a Percent of Demand in
2020
Projected Difference in
2020
Projected Difference as a Percent of Demand in
2020
Projected Difference in
2020
Projected Difference as a Percent of Demand in
2020Constant Insurance Environment
General Surgery -30 -2% -315 -14% 491 36% 284 18%Ophthalmology -57 -7% -175 -19% 159 28% 73 11%Otolaryngology 14 4% -38 -10% 109 43% 71 25%
Orthopedic Surgery 1 0% -143 -13% 265 38% 161 20%
Full Insurance EnvironmentGeneral Surgery -130 -7% -429 -19% 419 29% 201 12%
Ophthalmology -72 -9% -192 -21% 148 26% 61 9%Otolaryngology -9 -2% -64 -15% 93 35% 52 17%
Orthopedic Surgery -63 -6% -217 -18% 218 29% 107 12%
Demographic Only Scenario Trend Scenario
Reduction of Unnecessary Services and
Demographic Scenario
Reduction of Unnecessary Services and Trend
Scenario
Urology In the Demographic Only Scenario forecast, demand growth outpaced supply growth by 12 physicians by 2020. Expressed as a percentage of the number of physicians required to meet the demand for their services, the shortage predicted in the Demographic Only Scenario amounted to 3 percent in 2020. In the Trend Scenario, demand growth outpaced supply growth by 79 physicians by 2020. Expressed as a percentage of the number of physicians required to meet the demand for their services, the shortage predicted in the Trend Scenario amounted to 15 percent in 2020. In the Reduction of Unnecessary Services scenarios, while the supply of physicians was forecast to grow by 15 percent, demand was forecast to decline by 14 percent (Demographic) and 1 percent (Trend) by 2020. Expressed as a percentage of the number of physicians required to meet the demand for their services, the surplus predicted in the Reduction of Unnecessary Services scenarios amounted to 34 percent (Demographic) and 17 percent (Trend) in 2020. Other Surgical Subspecialties In the Demographic Only Scenario forecast, demand growth outpaced supply growth by 18 physicians by 2020. Expressed as a percentage of the number of physicians required to meet the demand for their services, the shortage predicted in the Demographic Only Scenario amounted to 3 percent in 2020. In the Trend Scenario, demand growth outpaced supply growth by 118 physicians by 2020. Expressed as a percentage of the number of physicians required to meet the demand for their services, the shortage predicted in the Trend Scenario amounted to 15 percent in 2020. In the Reduction of Unnecessary Services scenarios, while the supply of physicians was forecast to grow by 13 percent, demand was forecast to decline by 15 percent (Demographic) and 3
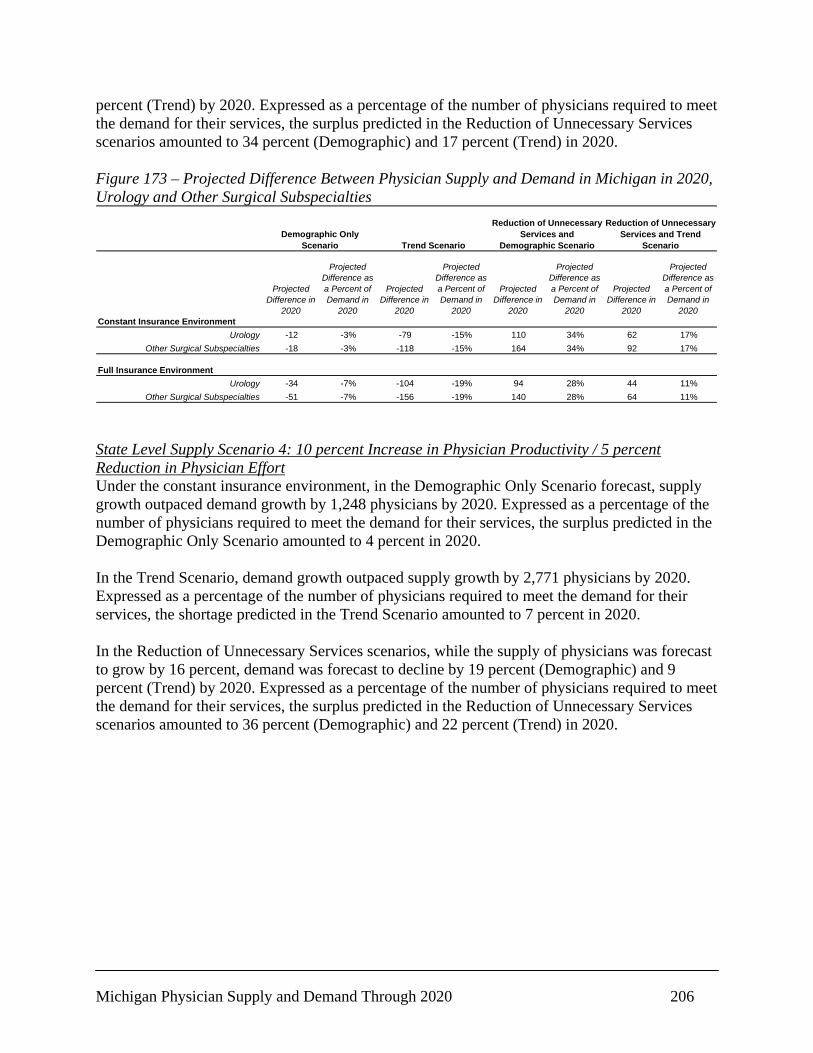
Michigan Physician Supply and Demand Through 2020 206
percent (Trend) by 2020. Expressed as a percentage of the number of physicians required to meet the demand for their services, the surplus predicted in the Reduction of Unnecessary Services scenarios amounted to 34 percent (Demographic) and 17 percent (Trend) in 2020. Figure 173 – Projected Difference Between Physician Supply and Demand in Michigan in 2020, Urology and Other Surgical Subspecialties
Projected Difference in
2020
Projected Difference as a Percent of Demand in
2020
Projected Difference in
2020
Projected Difference as a Percent of Demand in
2020
Projected Difference in
2020
Projected Difference as a Percent of Demand in
2020
Projected Difference in
2020
Projected Difference as a Percent of Demand in
2020Constant Insurance Environment
Urology -12 -3% -79 -15% 110 34% 62 17%Other Surgical Subspecialties -18 -3% -118 -15% 164 34% 92 17%
Full Insurance EnvironmentUrology -34 -7% -104 -19% 94 28% 44 11%
Other Surgical Subspecialties -51 -7% -156 -19% 140 28% 64 11%
Demographic Only Scenario Trend Scenario
Reduction of Unnecessary Services and
Demographic Scenario
Reduction of Unnecessary Services and Trend
Scenario
State Level Supply Scenario 4: 10 percent Increase in Physician Productivity / 5 percent Reduction in Physician Effort Under the constant insurance environment, in the Demographic Only Scenario forecast, supply growth outpaced demand growth by 1,248 physicians by 2020. Expressed as a percentage of the number of physicians required to meet the demand for their services, the surplus predicted in the Demographic Only Scenario amounted to 4 percent in 2020. In the Trend Scenario, demand growth outpaced supply growth by 2,771 physicians by 2020. Expressed as a percentage of the number of physicians required to meet the demand for their services, the shortage predicted in the Trend Scenario amounted to 7 percent in 2020. In the Reduction of Unnecessary Services scenarios, while the supply of physicians was forecast to grow by 16 percent, demand was forecast to decline by 19 percent (Demographic) and 9 percent (Trend) by 2020. Expressed as a percentage of the number of physicians required to meet the demand for their services, the surplus predicted in the Reduction of Unnecessary Services scenarios amounted to 36 percent (Demographic) and 22 percent (Trend) in 2020.

Michigan Physician Supply and Demand Through 2020 207
Figure 174 – Projected Difference Between Physician Supply and Demand in Michigan in 2020
Projected Difference in
2020
Projected Difference as a Percent of Demand in
2020
Projected Difference in
2020
Projected Difference as a Percent of Demand in
2020
Projected Difference in
2020
Projected Difference as a Percent of Demand in
2020
Projected Difference in
2020
Projected Difference as a Percent of Demand in
2020Constant Insurance Environment
All Physicians 1,248 4% -2,771 -7% 10,567 43% 7,653 28%
Full Insurance EnvironmentAll Physicians -390 -1% -4,612 -12% 9,379 36% 6,318 22%
Demographic Only Scenario Trend Scenario
Reduction of Unnecessary Services and
Demographic Scenario
Reduction of Unnecessary Services and Trend
Scenario
Primary Care in Aggregate In the aggregate, primary care physician supply was projected to grow at a faster pace than the primary care physician demand forecast in all demand scenarios, except the Trend Scenario. Under the constant insurance environment, in the Demographic Only Scenario forecast, supply growth outpaced demand growth by 579 physicians by 2020. Expressed as a percentage of the number of physicians required to meet the demand for their services, the surplus predicted in the Demographic Only Scenario amounted to 4 percent in 2020. In the Trend Scenario, demand growth outpaced supply growth by 297 physicians by 2020. Expressed as a percentage of the number of physicians required to meet the demand for their services, the shortage predicted in the Trend Scenario amounted to 2 percent in 2020. In the Reduction of Unnecessary Services scenarios, while the supply of physicians was forecast to grow by 15 percent, demand was forecast to decline by 20 percent (Demographic) and 15 percent (Trend) by 2020. Expressed as a percentage of the number of physicians required to meet the demand for their services, the surplus predicted in the Reduction of Unnecessary Services scenarios amounted to 44 percent (Demographic) and 35 percent (Trend) in 2020. Non-Primary Care in Aggregate In the aggregate, non-primary care physician demand was projected to grow at a faster pace than the non-primary care physician supply forecast in the Demographic and Trend Scenarios and projected to grow at a slower pace than the non-primary care physician supply forecast in the other scenarios. Under the constant insurance environment, in the Demographic Only Scenario forecast, demand growth outpaced supply growth by 669 physicians by 2020. Expressed as a percentage of the number of physicians required to meet the demand for their services, the shortage predicted in the Demographic Only Scenario amounted to about 3 percent in 2020.
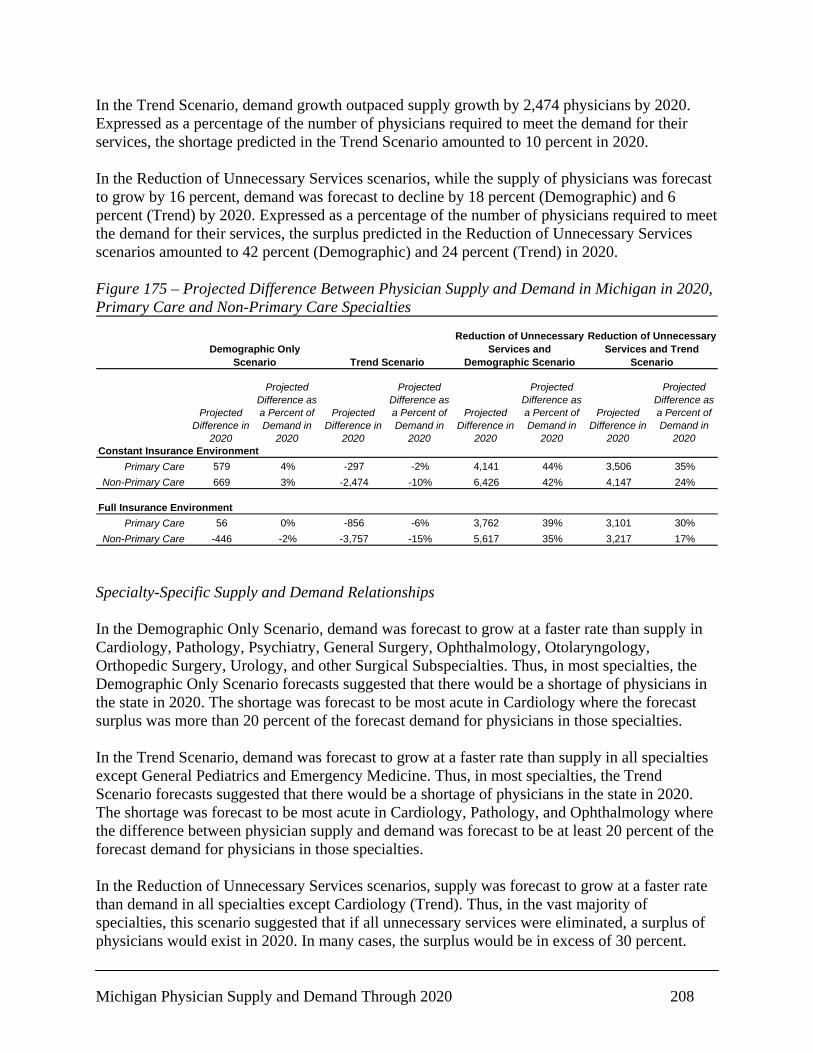
Michigan Physician Supply and Demand Through 2020 208
In the Trend Scenario, demand growth outpaced supply growth by 2,474 physicians by 2020. Expressed as a percentage of the number of physicians required to meet the demand for their services, the shortage predicted in the Trend Scenario amounted to 10 percent in 2020. In the Reduction of Unnecessary Services scenarios, while the supply of physicians was forecast to grow by 16 percent, demand was forecast to decline by 18 percent (Demographic) and 6 percent (Trend) by 2020. Expressed as a percentage of the number of physicians required to meet the demand for their services, the surplus predicted in the Reduction of Unnecessary Services scenarios amounted to 42 percent (Demographic) and 24 percent (Trend) in 2020. Figure 175 – Projected Difference Between Physician Supply and Demand in Michigan in 2020, Primary Care and Non-Primary Care Specialties
Projected Difference in
2020
Projected Difference as a Percent of Demand in
2020
Projected Difference in
2020
Projected Difference as a Percent of Demand in
2020
Projected Difference in
2020
Projected Difference as a Percent of Demand in
2020
Projected Difference in
2020
Projected Difference as a Percent of Demand in
2020Constant Insurance Environment
Primary Care 579 4% -297 -2% 4,141 44% 3,506 35%Non-Primary Care 669 3% -2,474 -10% 6,426 42% 4,147 24%
Full Insurance EnvironmentPrimary Care 56 0% -856 -6% 3,762 39% 3,101 30%
Non-Primary Care -446 -2% -3,757 -15% 5,617 35% 3,217 17%
Demographic Only Scenario Trend Scenario
Reduction of Unnecessary Services and
Demographic Scenario
Reduction of Unnecessary Services and Trend
Scenario
Specialty-Specific Supply and Demand Relationships In the Demographic Only Scenario, demand was forecast to grow at a faster rate than supply in Cardiology, Pathology, Psychiatry, General Surgery, Ophthalmology, Otolaryngology, Orthopedic Surgery, Urology, and other Surgical Subspecialties. Thus, in most specialties, the Demographic Only Scenario forecasts suggested that there would be a shortage of physicians in the state in 2020. The shortage was forecast to be most acute in Cardiology where the forecast surplus was more than 20 percent of the forecast demand for physicians in those specialties. In the Trend Scenario, demand was forecast to grow at a faster rate than supply in all specialties except General Pediatrics and Emergency Medicine. Thus, in most specialties, the Trend Scenario forecasts suggested that there would be a shortage of physicians in the state in 2020. The shortage was forecast to be most acute in Cardiology, Pathology, and Ophthalmology where the difference between physician supply and demand was forecast to be at least 20 percent of the forecast demand for physicians in those specialties. In the Reduction of Unnecessary Services scenarios, supply was forecast to grow at a faster rate than demand in all specialties except Cardiology (Trend). Thus, in the vast majority of specialties, this scenario suggested that if all unnecessary services were eliminated, a surplus of physicians would exist in 2020. In many cases, the surplus would be in excess of 30 percent.
Michigan Physician Supply and Demand Through 2020 209
Primary Care Specialties General/Family Medicine In the Demographic Only Scenario forecast, supply growth outpaced demand growth by 60 physicians by 2020. Expressed as a percentage of the number of physicians required to meet the demand for their services, the surplus predicted in the Demographic Only Scenario amounted to 1 percent in 2020. In the Trend Scenario, demand growth outpaced supply growth by 321 physicians by 2020. Expressed as a percentage of the number of physicians required to meet the demand for their services, the shortage predicted in the Trend Scenario amounted to 5 percent in 2020. In the Reduction of Unnecessary Services scenarios, while the supply of physicians was forecast to grow by 12 percent, demand was forecast to decline by 20 percent (Demographic) and 14 percent (Trend) by 2020. Expressed as a percentage of the number of physicians required to meet the demand for their services, the surplus predicted in the Reduction of Unnecessary Services scenarios amounted to 39 percent (Demographic) and 31 percent (Trend) in 2020. General Internal Medicine In the Demographic Only Scenario forecast, supply growth outpaced demand growth by 343 physicians by 2020. Expressed as a percentage of the number of physicians required to meet the demand for their services, the surplus predicted in the Demographic Only Scenario amounted to 6 percent in 2020. In the Trend Scenario, supply growth outpaced demand growth by 26 physicians by 2020. Expressed as a percentage of the number of physicians required to meet the demand for their services, the surplus predicted in the Trend Scenario amounted to less than 1 percent in 2020. In the Reduction of Unnecessary Services scenarios, while the supply of physicians was forecast to grow by 22 percent, demand was forecast to decline by 17 percent (Demographic) and 11 percent (Trend) by 2020. Expressed as a percentage of the number of physicians required to meet the demand for their services, the surplus predicted in the Reduction of Unnecessary Services scenarios amounted to 47 percent (Demographic) and 37 percent (Trend) in 2020. General Pediatrics In the Demographic Only Scenario forecast, supply growth outpaced demand growth by 176 physicians by 2020. Expressed as a percentage of the number of physicians required to meet the demand for their services, the surplus predicted in the Demographic Only Scenario amounted to 9 percent in 2020.

Michigan Physician Supply and Demand Through 2020 210
In the Trend Scenario, supply growth outpaced demand growth by 50 physicians by 2020. Expressed as a percentage of the number of physicians required to meet the demand for their services, the shortage predicted in the Trend Scenario amounted to 2 percent in 2020. In the Reduction of Unnecessary Services scenarios, while the supply of physicians was forecast to grow by 6 percent, demand was forecast to decline by 30 percent (Demographic) and 25 percent (Trend) by 2020. Expressed as a percentage of the number of physicians required to meet the demand for their services, the surplus predicted in the Reduction of Unnecessary Services scenarios amounted to 51 percent (Demographic) and 41 percent (Trend) in 2020. Figure 176 – Projected Difference Between Physician Supply and Demand in Michigan in 2020, Primary Care Specialties Detail
Projected Difference in
2020
Projected Difference as a Percent of Demand in
2020
Projected Difference in
2020
Projected Difference as a Percent of Demand in
2020
Projected Difference in
2020
Projected Difference as a Percent of Demand in
2020
Projected Difference in
2020
Projected Difference as a Percent of Demand in
2020Constant Insurance Environment
Primary Care (Overall) 579 4% -297 -2% 4,141 44% 3,506 35%General/Family Medicine 60 1% -321 -5% 1,609 39% 1,332 31%
General Internal Medicine 343 6% -26 0% 1,844 47% 1,577 37%General Pediatrics 176 9% 50 2% 689 51% 597 41%
Full Insurance EnvironmentPrimary Care (Overall) 56 0% -856 -6% 3,762 39% 3,101 30%
General/Family Medicine -132 -2% -526 -8% 1,469 35% 1,184 26%General Internal Medicine 87 2% -299 -5% 1,659 40% 1,378 31%
General Pediatrics 101 5% -30 -1% 634 45% 539 36%
Demographic Only Scenario Trend Scenario
Reduction of Unnecessary Services and
Demographic Scenario
Reduction of Unnecessary Services and Trend
Scenario
Non-Primary Care Specialties Cardiology In the Demographic Only Scenario forecast, demand growth outpaced supply change by 168 physicians by 2020. Expressed as a percentage of the number of physicians required to meet the demand for their services, the shortage predicted in the Demographic Only Scenario amounted to 19 percent in 2020. In the Trend Scenario, demand growth outpaced supply growth by 303 physicians by 2020. Expressed as a percentage of the number of physicians required to meet the demand for their services, the shortage predicted in the Trend Scenario amounted to 29 percent in 2020. In the Reduction of Unnecessary Services scenarios, while the supply of physicians was forecast to contract by 1 percent, demand was forecast to decline by 12 percent (Demographic) and increase by 2 percent (Trend) by 2020. Expressed as a percentage of the number of physicians required to meet the demand for their services, the predicted difference between supply and
Michigan Physician Supply and Demand Through 2020 211
demand for Cardiologists in the Reduction of Unnecessary Services scenarios ranged from a 12 percent surplus (Demographic) to a 3 percent shortage (Trend) in 2020. Other Internal Medicine Subspecialties In the Demographic Only Scenario forecast, supply growth outpaced demand growth by 256 physicians by 2020. Expressed as a percentage of the number of physicians required to meet the demand for their services, the surplus predicted in the Demographic Only Scenario amounted to 7 percent in 2020. In the Trend Scenario, demand growth outpaced supply growth by 265 physicians by 2020. Expressed as a percentage of the number of physicians required to meet the demand for their services, the shortage predicted in the Trend Scenario amounted to 7 percent in 2020. In the Reduction of Unnecessary Services scenarios, while the supply of physicians was forecast to grow by 25 percent, demand was forecast to decline by 15 percent (Demographic) and 3 percent (Trend) by 2020. Expressed as a percentage of the number of physicians required to meet the demand for their services, the surplus predicted in the Reduction of Unnecessary Services scenarios amounted to 48 percent (Demographic) and 29 percent (Trend) in 2020. Obstetrics and Gynecology In the Demographic Only Scenario forecast, supply growth outpaced demand growth by 227 physicians by 2020. Expressed as a percentage of the number of physicians required to meet the demand for their services, the surplus predicted in the Demographic Only Scenario amounted to 13 percent in 2020. In the Trend Scenario, demand growth outpaced supply growth by 32 physicians by 2020. Expressed as a percentage of the number of physicians required to meet the demand for their services, the shortage predicted in the Trend Scenario amounted to 2 percent in 2020. In the Reduction of Unnecessary Services scenarios, while the supply of physicians was forecast to grow by 14 percent, demand was forecast to decline by 27 percent (Demographic) and 16 percent (Trend) by 2020. Expressed as a percentage of the number of physicians required to meet the demand for their services, the surplus predicted in the Reduction of Unnecessary Services scenarios amounted to 56 percent (Demographic) and 36 percent (Trend) in 2020. Pathology In the Demographic Only Scenario forecast, demand growth outpaced supply change by 100 physicians by 2020. Expressed as a percentage of the number of physicians required to meet the demand for their services, the shortage predicted in the Demographic Only Scenario amounted to 12 percent in 2020.

Michigan Physician Supply and Demand Through 2020 212
In the Trend Scenario, demand growth outpaced supply growth by 221 physicians by 2020. Expressed as a percentage of the number of physicians required to meet the demand for their services, the shortage predicted in the Trend Scenario amounted to 24 percent in 2020. In the Reduction of Unnecessary Services scenarios, while the supply of physicians was forecast to contract by 1 percent, demand was forecast to decline by 18 percent (Demographic) and 6 percent (Trend) by 2020. Expressed as a percentage of the number of physicians required to meet the demand for their services, the surplus predicted in the Reduction of Unnecessary Services scenarios amounted to 21 percent (Demographic) and 5 percent (Trend) in 2020. Figure 177 – Projected Difference Between Physician Supply and Demand in Michigan in 2020, Cardiology, Other Internal Medicine Subspecialties, Obstetrics and Gynecology, and Pathology
Projected Difference in
2020
Projected Difference as a Percent of Demand in
2020
Projected Difference in
2020
Projected Difference as a Percent of Demand in
2020
Projected Difference in
2020
Projected Difference as a Percent of Demand in
2020
Projected Difference in
2020
Projected Difference as a Percent of Demand in
2020Constant Insurance Environment
Cardiology -168 -19% -303 -29% 78 12% -19 -3%Other Internal Medicine Subspecialties 256 7% -265 -7% 1,211 48% 833 29%
Obstetrics and Gynecology 227 13% -32 -2% 702 56% 514 36%Pathology -100 -12% -221 -24% 123 21% 35 5%
Full Insurance EnvironmentCardiology -204 -22% -344 -32% 52 8% -49 -6%
Other Internal Medicine Subspecialties 78 2% -469 -11% 1082 41% 684 22%Obstetrics and Gynecology 69 4% -214 -10% 587 43% 382 24%
Pathology -147 -17% -276 -28% 89 14% -5 -1%
Demographic Only Scenario Trend Scenario
Reduction of Unnecessary Services and
Demographic Scenario
Reduction of Unnecessary Services and Trend
Scenario
Psychiatry In the Demographic Only Scenario forecast, supply growth outpaced demand growth by 27 physicians by 2020. Expressed as a percentage of the number of physicians required to meet the demand for their services, the surplus predicted in the Demographic Only Scenario amounted to 2 percent in 2020. In the Trend Scenario, demand growth outpaced supply growth by 245 physicians by 2020. Expressed as a percentage of the number of physicians required to meet the demand for their services, the shortage predicted in the Trend Scenario amounted to 15 percent in 2020. In the Reduction of Unnecessary Services scenarios, while the supply of physicians was forecast to grow by 5 percent, demand was forecast to decline by 22 percent (Demographic) and 10 percent (Trend) by 2020. Expressed as a percentage of the number of physicians required to meet the demand for their services, the surplus predicted in the Reduction of Unnecessary Services scenarios amounted to 35 percent (Demographic) and 18 percent (Trend) in 2020.
Michigan Physician Supply and Demand Through 2020 213
Anesthesiology In the Demographic Only Scenario forecast, supply growth outpaced demand growth by 98 physicians by 2020. Expressed as a percentage of the number of physicians required to meet the demand for their services, the surplus predicted in the Demographic Only Scenario amounted to 7 percent in 2020. In the Trend Scenario, demand growth outpaced supply growth by 124 physicians by 2020. Expressed as a percentage of the number of physicians required to meet the demand for their services, the shortage predicted in the Trend Scenario amounted to 7 percent in 2020. In the Reduction of Unnecessary Services scenarios, while the supply of physicians was forecast to grow by 22 percent, demand was forecast to decline by 17 percent (Demographic) and 4 percent (Trend) by 2020. Expressed as a percentage of the number of physicians required to meet the demand for their services, the surplus predicted in the Reduction of Unnecessary Services scenarios amounted to 47 percent (Demographic) and 28 percent (Trend) in 2020. Radiology In the Demographic Only Scenario forecast, supply growth outpaced demand growth by 14 physicians by 2020. Expressed as a percentage of the number of physicians required to meet the demand for their services, the surplus predicted in the Demographic Only Scenario amounted to 1 percent in 2020. In the Trend Scenario, demand growth outpaced supply growth by 222 physicians by 2020. Expressed as a percentage of the number of physicians required to meet the demand for their services, the shortage predicted in the Trend Scenario amounted to 12 percent in 2020. In the Reduction of Unnecessary Services scenarios, while the supply of physicians was forecast to grow by 15 percent, demand was forecast to decline by 17 percent (Demographic) and 5 percent (Trend) by 2020. Expressed as a percentage of the number of physicians required to meet the demand for their services, the surplus predicted in the Reduction of Unnecessary Services scenarios amounted to 39 percent (Demographic) and 21 percent (Trend) in 2020. Emergency Medicine In the Demographic Only Scenario forecast, supply growth outpaced demand growth by 541 physicians by 2020. Expressed as a percentage of the number of physicians required to meet the demand for their services, the surplus predicted in the Demographic Only Scenario amounted to 31 percent in 2020. In the Trend Scenario, supply growth outpaced demand growth by 279 physicians by 2020. Expressed as a percentage of the number of physicians required to meet the demand for their services, the surplus predicted in the Trend Scenario amounted to 14 percent in 2020.

Michigan Physician Supply and Demand Through 2020 214
In the Reduction of Unnecessary Services scenarios, while the supply of physicians was forecast to grow by 38 percent, demand was forecast to decline by 24 percent (Demographic) and 12 percent (Trend) by 2020. Expressed as a percentage of the number of physicians required to meet the demand for their services, the surplus predicted in the Reduction of Unnecessary Services scenarios amounted to 81 percent (Demographic) and 57 percent (Trend) in 2020. Figure 178 – Projected Difference Between Physician Supply and Demand in Michigan in 2020, Psychiatry, Anesthesiology, Radiology, and Emergency Medicine
Projected Difference in
2020
Projected Difference as a Percent of Demand in
2020
Projected Difference in
2020
Projected Difference as a Percent of Demand in
2020
Projected Difference in
2020
Projected Difference as a Percent of Demand in
2020
Projected Difference in
2020
Projected Difference as a Percent of Demand in
2020Constant Insurance Environment
Psychiatry -27 -2% -245 -15% 374 35% 215 18%Anesthesiology 98 7% -124 -7% 506 47% 345 28%
Radiology 14 1% -222 -12% 447 39% 275 21%Emergency Medicine 541 31% 279 14% 1,020 81% 830 57%
Full Insurance EnvironmentPsychiatry -30 -2% -250 -15% 371 35% 212 17%
Anesthesiology 20 1% -214 -12% 450 40% 280 21%Radiology -76 -5% -326 -17% 381 32% 200 14%
Emergency Medicine 479 27% 208 10% 975 75% 779 52%
Demographic Only Scenario Trend Scenario
Reduction of Unnecessary Services and
Demographic Scenario
Reduction of Unnecessary Services and Trend
Scenario
General Surgery In the Demographic Only Scenario forecast, demand growth outpaced supply growth by 115 physicians by 2020. Expressed as a percentage of the number of physicians required to meet the demand for their services, the shortage predicted in the Demographic Only Scenario amounted to 6 percent in 2020. In the Trend Scenario, demand growth outpaced supply growth by 399 physicians by 2020. Expressed as a percentage of the number of physicians required to meet the demand for their services, the shortage predicted in the Trend Scenario amounted to 18 percent in 2020. In the Reduction of Unnecessary Services scenarios, while the supply of physicians was forecast to grow by 8 percent, demand was forecast to decline by 17 percent (Demographic) and 4 percent (Trend) by 2020. Expressed as a percentage of the number of physicians required to meet the demand for their services, the surplus predicted in the Reduction of Unnecessary Services scenarios amounted to 30 percent (Demographic) and 13 percent (Trend) in 2020. Ophthalmology In the Demographic Only Scenario forecast, demand growth outpaced supply change by 90 physicians by 2020. Expressed as a percentage of the number of physicians required to meet the demand for their services, the shortage predicted in the Demographic Only Scenario amounted to 11 percent in 2020.
Michigan Physician Supply and Demand Through 2020 215
In the Trend Scenario, demand growth outpaced supply growth by 208 physicians by 2020. Expressed as a percentage of the number of physicians required to meet the demand for their services, the shortage predicted in the Trend Scenario amounted to 23 percent in 2020. In the Reduction of Unnecessary Services scenarios, while the supply of physicians was forecast to grow by 4 percent, demand was forecast to decline by 15 percent (Demographic) and 2 percent (Trend) by 2020. Expressed as a percentage of the number of physicians required to meet the demand for their services, the surplus predicted in the Reduction of Unnecessary Services scenarios amounted to 22 percent (Demographic) and 6 percent (Trend) in 2020. Otolaryngology In the Demographic Only Scenario forecast, demand growth outpaced supply growth by 2 physicians by 2020. Expressed as a percentage of the number of physicians required to meet the demand for their services, the shortage predicted in the Demographic Only Scenario amounted to 1 percent in 2020. In the Trend Scenario, demand growth outpaced supply growth by 55 physicians by 2020. Expressed as a percentage of the number of physicians required to meet the demand for their services, the shortage predicted in the Trend Scenario amounted to 14 percent in 2020. In the Reduction of Unnecessary Services scenarios, while the supply of physicians was forecast to grow by 8 percent, demand was forecast to decline by 21 percent (Demographic) and 9 percent (Trend) by 2020. Expressed as a percentage of the number of physicians required to meet the demand for their services, the surplus predicted in the Reduction of Unnecessary Services scenarios amounted to 37 percent (Demographic) and 19 percent (Trend) in 2020. Orthopedic Surgery In the Demographic Only Scenario forecast, supply growth outpaced demand growth by 42 physicians by 2020. Expressed as a percentage of the number of physicians required to meet the demand for their services, the shortage predicted in the Trend Scenario amounted to 4 percent in 2020. In the Trend Scenario, demand growth outpaced supply growth by 186 physicians by 2020. Expressed as a percentage of the number of physicians required to meet the demand for their services, the shortage predicted in the Trend Scenario amounted to 17 percent in 2020. In the Reduction of Unnecessary Services scenarios, while the supply of physicians was forecast to grow by 8 percent, demand was forecast to decline by 18 percent (Demographic) and 5 percent (Trend) by 2020. Expressed as a percentage of the number of physicians required to meet the demand for their services, the surplus predicted in the Reduction of Unnecessary Services scenarios amounted to 32 percent (Demographic) and 15 percent (Trend) in 2020.
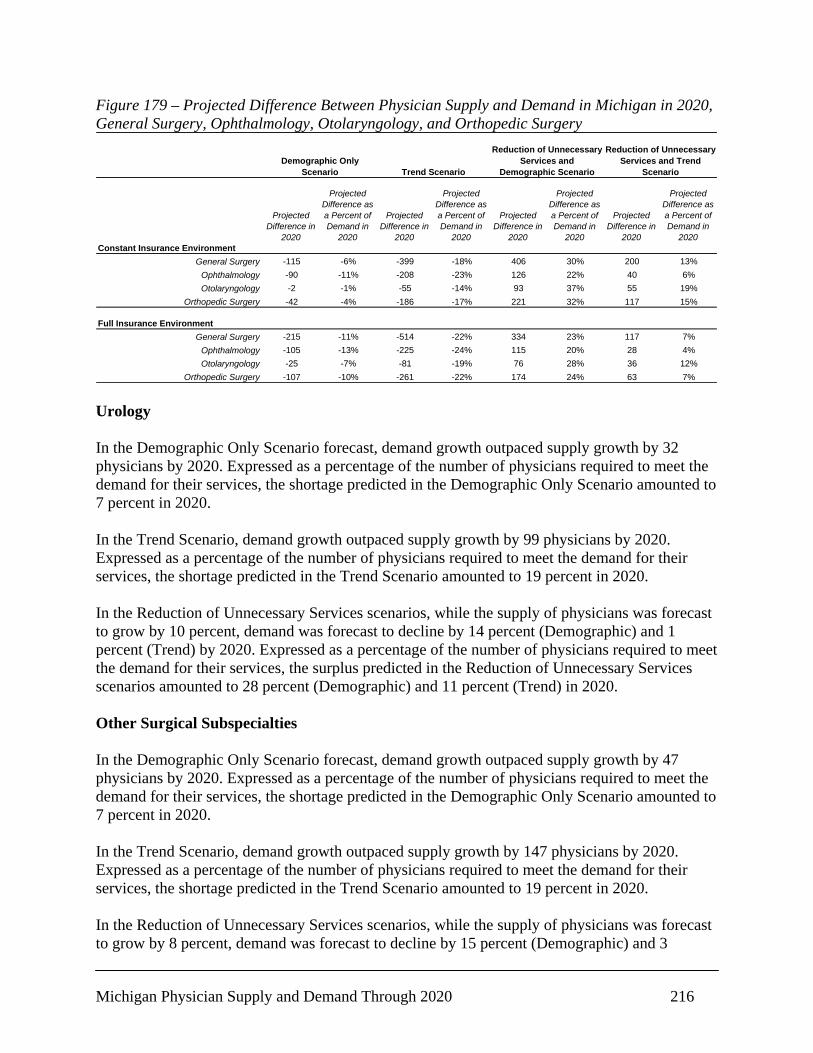
Michigan Physician Supply and Demand Through 2020 216
Figure 179 – Projected Difference Between Physician Supply and Demand in Michigan in 2020, General Surgery, Ophthalmology, Otolaryngology, and Orthopedic Surgery
Projected Difference in
2020
Projected Difference as a Percent of Demand in
2020
Projected Difference in
2020
Projected Difference as a Percent of Demand in
2020
Projected Difference in
2020
Projected Difference as a Percent of Demand in
2020
Projected Difference in
2020
Projected Difference as a Percent of Demand in
2020Constant Insurance Environment
General Surgery -115 -6% -399 -18% 406 30% 200 13%Ophthalmology -90 -11% -208 -23% 126 22% 40 6%Otolaryngology -2 -1% -55 -14% 93 37% 55 19%
Orthopedic Surgery -42 -4% -186 -17% 221 32% 117 15%
Full Insurance EnvironmentGeneral Surgery -215 -11% -514 -22% 334 23% 117 7%
Ophthalmology -105 -13% -225 -24% 115 20% 28 4%Otolaryngology -25 -7% -81 -19% 76 28% 36 12%
Orthopedic Surgery -107 -10% -261 -22% 174 24% 63 7%
Demographic Only Scenario Trend Scenario
Reduction of Unnecessary Services and
Demographic Scenario
Reduction of Unnecessary Services and Trend
Scenario
Urology In the Demographic Only Scenario forecast, demand growth outpaced supply growth by 32 physicians by 2020. Expressed as a percentage of the number of physicians required to meet the demand for their services, the shortage predicted in the Demographic Only Scenario amounted to 7 percent in 2020. In the Trend Scenario, demand growth outpaced supply growth by 99 physicians by 2020. Expressed as a percentage of the number of physicians required to meet the demand for their services, the shortage predicted in the Trend Scenario amounted to 19 percent in 2020. In the Reduction of Unnecessary Services scenarios, while the supply of physicians was forecast to grow by 10 percent, demand was forecast to decline by 14 percent (Demographic) and 1 percent (Trend) by 2020. Expressed as a percentage of the number of physicians required to meet the demand for their services, the surplus predicted in the Reduction of Unnecessary Services scenarios amounted to 28 percent (Demographic) and 11 percent (Trend) in 2020. Other Surgical Subspecialties In the Demographic Only Scenario forecast, demand growth outpaced supply growth by 47 physicians by 2020. Expressed as a percentage of the number of physicians required to meet the demand for their services, the shortage predicted in the Demographic Only Scenario amounted to 7 percent in 2020. In the Trend Scenario, demand growth outpaced supply growth by 147 physicians by 2020. Expressed as a percentage of the number of physicians required to meet the demand for their services, the shortage predicted in the Trend Scenario amounted to 19 percent in 2020. In the Reduction of Unnecessary Services scenarios, while the supply of physicians was forecast to grow by 8 percent, demand was forecast to decline by 15 percent (Demographic) and 3

Michigan Physician Supply and Demand Through 2020 217
percent (Trend) by 2020. Expressed as a percentage of the number of physicians required to meet the demand for their services, the surplus predicted in the Reduction of Unnecessary Services scenarios amounted to 28 percent (Demographic) and 11 percent (Trend) in 2020. Figure 180 – Projected Difference Between Physician Supply and Demand in Michigan in 2020, Urology and Other Surgical Subspecialties
Projected Difference in
2020
Projected Difference as a Percent of Demand in
2020
Projected Difference in
2020
Projected Difference as a Percent of Demand in
2020
Projected Difference in
2020
Projected Difference as a Percent of Demand in
2020
Projected Difference in
2020
Projected Difference as a Percent of Demand in
2020Constant Insurance Environment
Urology -32 -7% -99 -19% 90 28% 42 11%Other Surgical Subspecialties -47 -7% -147 -19% 135 28% 63 11%
Full Insurance EnvironmentUrology -53 -11% -123 -23% 75 22% 24 6%
Other Surgical Subspecialties -81 -12% -185 -23% 111 22% 35 6%
Demographic Only Scenario Trend Scenario
Reduction of Unnecessary Services and
Demographic Scenario
Reduction of Unnecessary Services and Trend
Scenario
Relationship between Physician Supply and Demand in Michigan Through 2020: Regional Analysis As with the state-level supply and demand summaries, in order to clearly indicate the relationship between the projected regional physician supply and demand in Michigan in 2020, the results of the supply and demand projections are compared in a side-by-side fashion. For each of the two regional supply scenarios, the projected regional shortage or surplus of physicians is presented by specialty in both regional demand scenarios. Regional Supply Scenario 1: Baseline Supply Non-Responsive to Demand In this supply scenario, it was assumed that physicians would continue to locate their practices as they had in 2005 rather than responding to changes in regional demand. In most regions, demand was forecast to grow more quickly than supply, yielding shortages of physicians in 2020. There were some exceptions, especially in the Demographic Only demand scenario. In the Demographic Only scenario, the demand for physicians was forecast to outpace supply by 651 physicians in the Ann Arbor Area region. Demand for primary care physicians was forecast to grow by 163 more physicians than the supply, while demand for non-primary care physicians was forecast to grow by 488 more physicians than the supply. The specialties forecast to experience the greatest shortages expressed as a percentage of demand were Cardiology, Pathology, and Ophthalmology, with shortages projected to exceed 25 percent. In the Trend scenario, the demand for physicians was forecast to outpace supply by 1,234 physicians in the region. Demand for primary care physicians was forecast to grow by 248 more physicians than the supply, while demand for non-primary care physicians was forecast to grow by 986 more physicians than the supply. The specialties forecast to experience the greatest shortages expressed as a percentage of demand were Cardiology, Pathology, General Surgery,
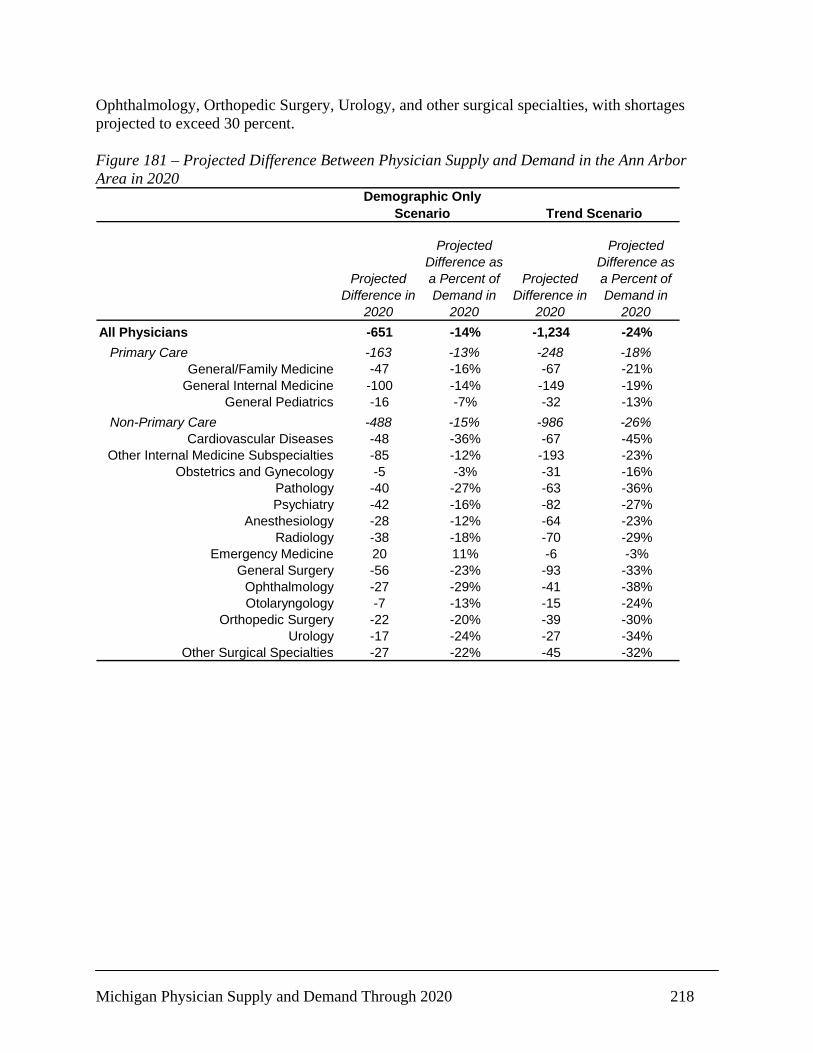
Michigan Physician Supply and Demand Through 2020 218
Ophthalmology, Orthopedic Surgery, Urology, and other surgical specialties, with shortages projected to exceed 30 percent. Figure 181 – Projected Difference Between Physician Supply and Demand in the Ann Arbor Area in 2020
Projected Difference in
2020
Projected Difference as a Percent of Demand in
2020
Projected Difference in
2020
Projected Difference as a Percent of Demand in
2020All Physicians -651 -14% -1,234 -24%
Primary Care -163 -13% -248 -18%General/Family Medicine -47 -16% -67 -21%
General Internal Medicine -100 -14% -149 -19%General Pediatrics -16 -7% -32 -13%
Non-Primary Care -488 -15% -986 -26%Cardiovascular Diseases -48 -36% -67 -45%
Other Internal Medicine Subspecialties -85 -12% -193 -23%Obstetrics and Gynecology -5 -3% -31 -16%
Pathology -40 -27% -63 -36%Psychiatry -42 -16% -82 -27%
Anesthesiology -28 -12% -64 -23%Radiology -38 -18% -70 -29%
Emergency Medicine 20 11% -6 -3%General Surgery -56 -23% -93 -33%
Ophthalmology -27 -29% -41 -38%Otolaryngology -7 -13% -15 -24%
Orthopedic Surgery -22 -20% -39 -30%Urology -17 -24% -27 -34%
Other Surgical Specialties -27 -22% -45 -32%
Demographic Only Scenario Trend Scenario
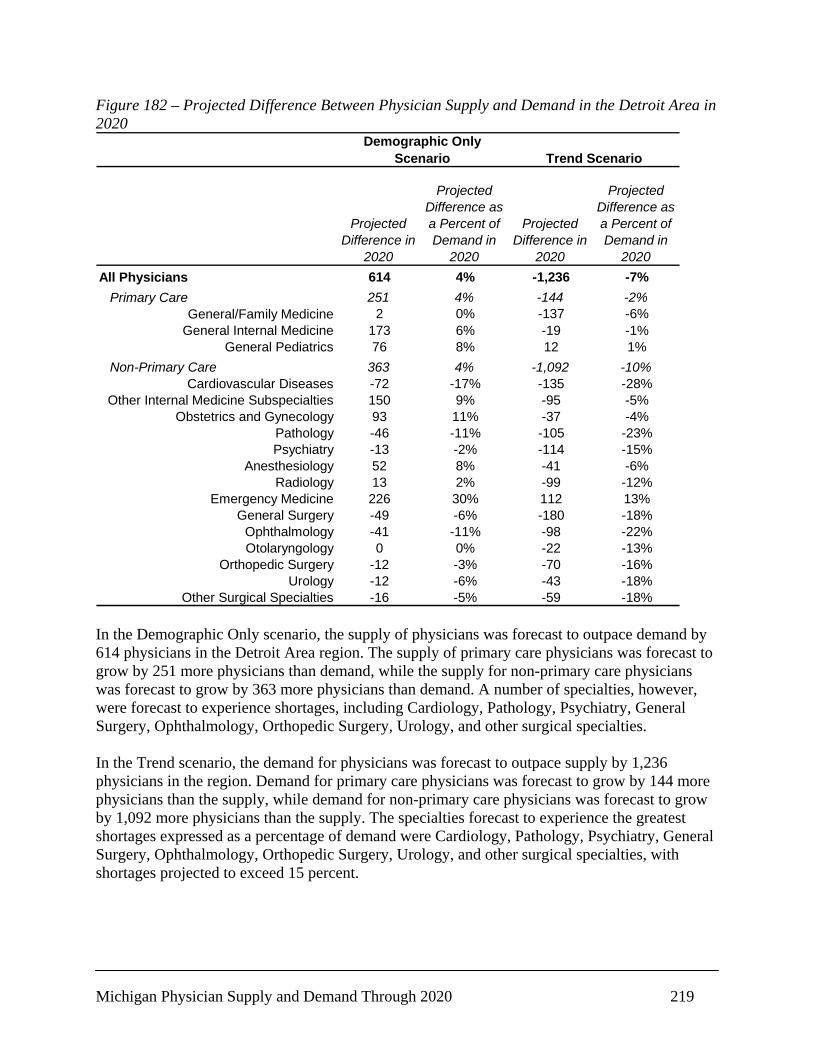
Michigan Physician Supply and Demand Through 2020 219
Figure 182 – Projected Difference Between Physician Supply and Demand in the Detroit Area in 2020
Projected Difference in
2020
Projected Difference as a Percent of Demand in
2020
Projected Difference in
2020
Projected Difference as a Percent of Demand in
2020All Physicians 614 4% -1,236 -7%
Primary Care 251 4% -144 -2%General/Family Medicine 2 0% -137 -6%
General Internal Medicine 173 6% -19 -1%General Pediatrics 76 8% 12 1%
Non-Primary Care 363 4% -1,092 -10%Cardiovascular Diseases -72 -17% -135 -28%
Other Internal Medicine Subspecialties 150 9% -95 -5%Obstetrics and Gynecology 93 11% -37 -4%
Pathology -46 -11% -105 -23%Psychiatry -13 -2% -114 -15%
Anesthesiology 52 8% -41 -6%Radiology 13 2% -99 -12%
Emergency Medicine 226 30% 112 13%General Surgery -49 -6% -180 -18%
Ophthalmology -41 -11% -98 -22%Otolaryngology 0 0% -22 -13%
Orthopedic Surgery -12 -3% -70 -16%Urology -12 -6% -43 -18%
Other Surgical Specialties -16 -5% -59 -18%
Demographic Only Scenario Trend Scenario
In the Demographic Only scenario, the supply of physicians was forecast to outpace demand by 614 physicians in the Detroit Area region. The supply of primary care physicians was forecast to grow by 251 more physicians than demand, while the supply for non-primary care physicians was forecast to grow by 363 more physicians than demand. A number of specialties, however, were forecast to experience shortages, including Cardiology, Pathology, Psychiatry, General Surgery, Ophthalmology, Orthopedic Surgery, Urology, and other surgical specialties. In the Trend scenario, the demand for physicians was forecast to outpace supply by 1,236 physicians in the region. Demand for primary care physicians was forecast to grow by 144 more physicians than the supply, while demand for non-primary care physicians was forecast to grow by 1,092 more physicians than the supply. The specialties forecast to experience the greatest shortages expressed as a percentage of demand were Cardiology, Pathology, Psychiatry, General Surgery, Ophthalmology, Orthopedic Surgery, Urology, and other surgical specialties, with shortages projected to exceed 15 percent.
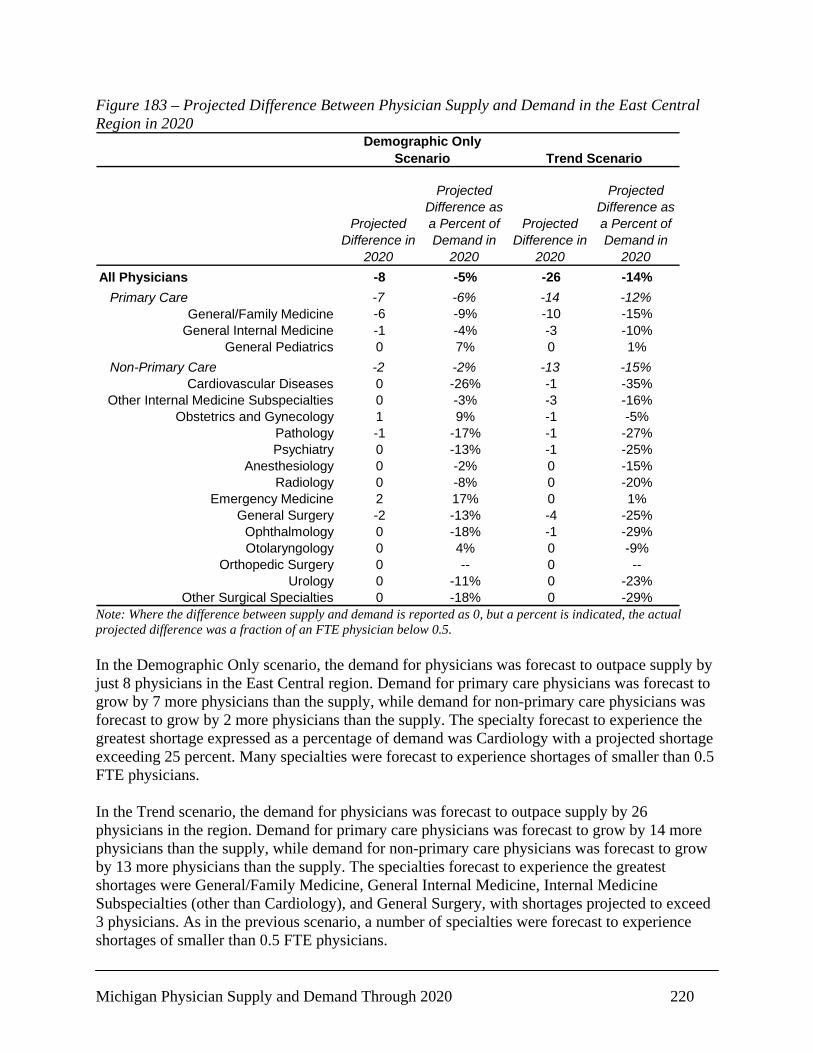
Michigan Physician Supply and Demand Through 2020 220
Figure 183 – Projected Difference Between Physician Supply and Demand in the East Central Region in 2020
Projected Difference in
2020
Projected Difference as a Percent of Demand in
2020
Projected Difference in
2020
Projected Difference as a Percent of Demand in
2020All Physicians -8 -5% -26 -14%
Primary Care -7 -6% -14 -12%General/Family Medicine -6 -9% -10 -15%
General Internal Medicine -1 -4% -3 -10%General Pediatrics 0 7% 0 1%
Non-Primary Care -2 -2% -13 -15%Cardiovascular Diseases 0 -26% -1 -35%
Other Internal Medicine Subspecialties 0 -3% -3 -16%Obstetrics and Gynecology 1 9% -1 -5%
Pathology -1 -17% -1 -27%Psychiatry 0 -13% -1 -25%
Anesthesiology 0 -2% 0 -15%Radiology 0 -8% 0 -20%
Emergency Medicine 2 17% 0 1%General Surgery -2 -13% -4 -25%
Ophthalmology 0 -18% -1 -29%Otolaryngology 0 4% 0 -9%
Orthopedic Surgery 0 -- 0 --Urology 0 -11% 0 -23%
Other Surgical Specialties 0 -18% 0 -29%
Demographic Only Scenario Trend Scenario
Note: Where the difference between supply and demand is reported as 0, but a percent is indicated, the actual projected difference was a fraction of an FTE physician below 0.5. In the Demographic Only scenario, the demand for physicians was forecast to outpace supply by just 8 physicians in the East Central region. Demand for primary care physicians was forecast to grow by 7 more physicians than the supply, while demand for non-primary care physicians was forecast to grow by 2 more physicians than the supply. The specialty forecast to experience the greatest shortage expressed as a percentage of demand was Cardiology with a projected shortage exceeding 25 percent. Many specialties were forecast to experience shortages of smaller than 0.5 FTE physicians. In the Trend scenario, the demand for physicians was forecast to outpace supply by 26 physicians in the region. Demand for primary care physicians was forecast to grow by 14 more physicians than the supply, while demand for non-primary care physicians was forecast to grow by 13 more physicians than the supply. The specialties forecast to experience the greatest shortages were General/Family Medicine, General Internal Medicine, Internal Medicine Subspecialties (other than Cardiology), and General Surgery, with shortages projected to exceed 3 physicians. As in the previous scenario, a number of specialties were forecast to experience shortages of smaller than 0.5 FTE physicians.
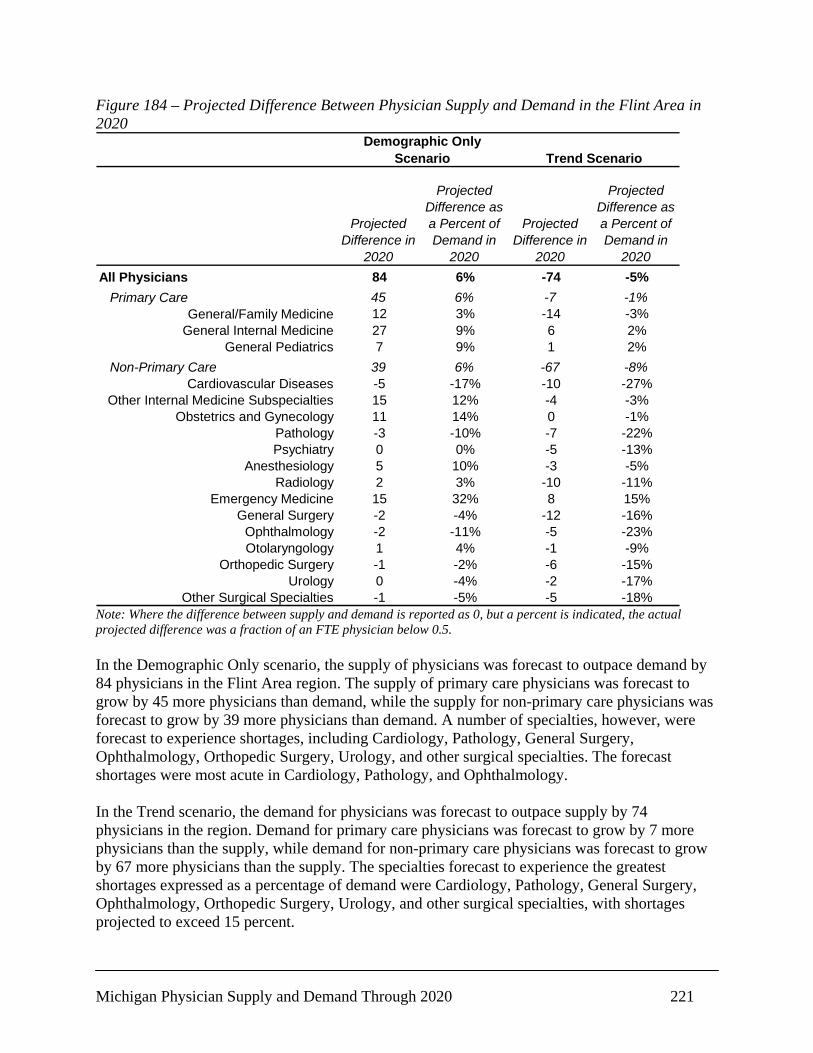
Michigan Physician Supply and Demand Through 2020 221
Figure 184 – Projected Difference Between Physician Supply and Demand in the Flint Area in 2020
Projected Difference in
2020
Projected Difference as a Percent of Demand in
2020
Projected Difference in
2020
Projected Difference as a Percent of Demand in
2020All Physicians 84 6% -74 -5%
Primary Care 45 6% -7 -1%General/Family Medicine 12 3% -14 -3%
General Internal Medicine 27 9% 6 2%General Pediatrics 7 9% 1 2%
Non-Primary Care 39 6% -67 -8%Cardiovascular Diseases -5 -17% -10 -27%
Other Internal Medicine Subspecialties 15 12% -4 -3%Obstetrics and Gynecology 11 14% 0 -1%
Pathology -3 -10% -7 -22%Psychiatry 0 0% -5 -13%
Anesthesiology 5 10% -3 -5%Radiology 2 3% -10 -11%
Emergency Medicine 15 32% 8 15%General Surgery -2 -4% -12 -16%
Ophthalmology -2 -11% -5 -23%Otolaryngology 1 4% -1 -9%
Orthopedic Surgery -1 -2% -6 -15%Urology 0 -4% -2 -17%
Other Surgical Specialties -1 -5% -5 -18%
Demographic Only Scenario Trend Scenario
Note: Where the difference between supply and demand is reported as 0, but a percent is indicated, the actual projected difference was a fraction of an FTE physician below 0.5. In the Demographic Only scenario, the supply of physicians was forecast to outpace demand by 84 physicians in the Flint Area region. The supply of primary care physicians was forecast to grow by 45 more physicians than demand, while the supply for non-primary care physicians was forecast to grow by 39 more physicians than demand. A number of specialties, however, were forecast to experience shortages, including Cardiology, Pathology, General Surgery, Ophthalmology, Orthopedic Surgery, Urology, and other surgical specialties. The forecast shortages were most acute in Cardiology, Pathology, and Ophthalmology. In the Trend scenario, the demand for physicians was forecast to outpace supply by 74 physicians in the region. Demand for primary care physicians was forecast to grow by 7 more physicians than the supply, while demand for non-primary care physicians was forecast to grow by 67 more physicians than the supply. The specialties forecast to experience the greatest shortages expressed as a percentage of demand were Cardiology, Pathology, General Surgery, Ophthalmology, Orthopedic Surgery, Urology, and other surgical specialties, with shortages projected to exceed 15 percent.

Michigan Physician Supply and Demand Through 2020 222
Figure 185 – Projected Difference Between Physician Supply and Demand in the Grand Rapids-Muskegon Region in 2020
Projected Difference in
2020
Projected Difference as a Percent of Demand in
2020
Projected Difference in
2020
Projected Difference as a Percent of Demand in
2020All Physicians -255 -8% -646 -18%
Primary Care -101 -8% -186 -14%General/Family Medicine -68 -10% -112 -16%
General Internal Medicine -23 -6% -51 -12%General Pediatrics -9 -5% -22 -11%
Non-Primary Care -154 -8% -460 -20%Cardiovascular Diseases -16 -27% -24 -37%
Other Internal Medicine Subspecialties -9 -3% -50 -16%Obstetrics and Gynecology -3 -2% -33 -15%
Pathology -14 -22% -24 -32%Psychiatry -14 -14% -29 -25%
Anesthesiology -8 -4% -36 -16%Radiology -16 -10% -40 -22%
Emergency Medicine 33 15% 0 0%General Surgery -33 -16% -63 -27%
Ophthalmology -16 -20% -28 -31%Otolaryngology -5 -14% -11 -25%
Orthopedic Surgery -20 -14% -41 -25%Urology -8 -16% -15 -27%
Other Surgical Specialties -15 -17% -28 -28%
Demographic Only Scenario Trend Scenario
In the Demographic Only scenario, the demand for physicians was forecast to outpace supply by 255 physicians in the Grand Rapids-Muskegon region. Demand for primary care physicians was forecast to grow by 101 more physicians than the supply, while demand for non-primary care physicians was forecast to grow by 154 more physicians than the supply. The specialties forecast to experience the greatest shortages expressed as a percentage of demand were Cardiology, Pathology, and Ophthalmology, with shortages projected to exceed 20 percent. In the Trend scenario, the demand for physicians was forecast to outpace supply by 646 physicians in the region. Demand for primary care physicians was forecast to grow by 186 more physicians than the supply, while demand for non-primary care physicians was forecast to grow by 460 more physicians than the supply. The specialties forecast to experience the greatest shortages expressed as a percentage of demand were Cardiology, Pathology, Psychiatry, General Surgery, Ophthalmology, Otolaryngology, Orthopedic Surgery, Urology, and other surgical specialties, with shortages projected to exceed 25 percent.
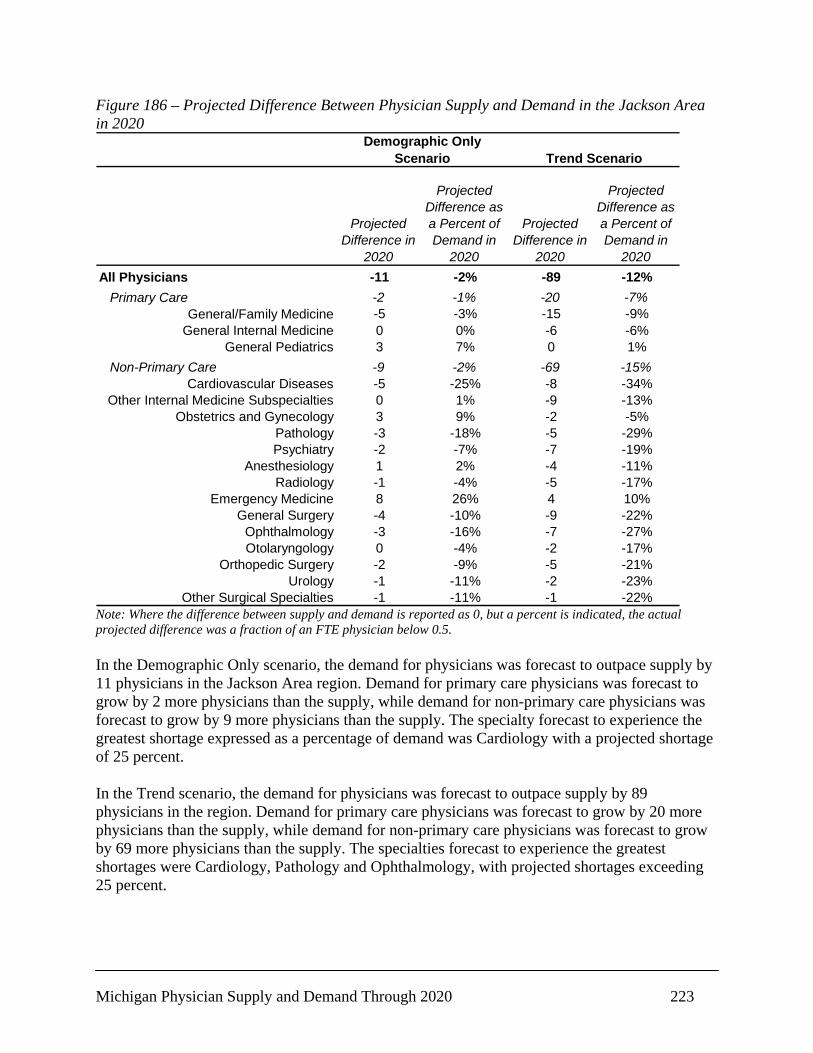
Michigan Physician Supply and Demand Through 2020 223
Figure 186 – Projected Difference Between Physician Supply and Demand in the Jackson Area in 2020
Projected Difference in
2020
Projected Difference as a Percent of Demand in
2020
Projected Difference in
2020
Projected Difference as a Percent of Demand in
2020All Physicians -11 -2% -89 -12%
Primary Care -2 -1% -20 -7%General/Family Medicine -5 -3% -15 -9%
General Internal Medicine 0 0% -6 -6%General Pediatrics 3 7% 0 1%
Non-Primary Care -9 -2% -69 -15%Cardiovascular Diseases -5 -25% -8 -34%
Other Internal Medicine Subspecialties 0 1% -9 -13%Obstetrics and Gynecology 3 9% -2 -5%
Pathology -3 -18% -5 -29%Psychiatry -2 -7% -7 -19%
Anesthesiology 1 2% -4 -11%Radiology -1 -4% -5 -17%
Emergency Medicine 8 26% 4 10%General Surgery -4 -10% -9 -22%
Ophthalmology -3 -16% -7 -27%Otolaryngology 0 -4% -2 -17%
Orthopedic Surgery -2 -9% -5 -21%Urology -1 -11% -2 -23%
Other Surgical Specialties -1 -11% -1 -22%
Demographic Only Scenario Trend Scenario
Note: Where the difference between supply and demand is reported as 0, but a percent is indicated, the actual projected difference was a fraction of an FTE physician below 0.5. In the Demographic Only scenario, the demand for physicians was forecast to outpace supply by 11 physicians in the Jackson Area region. Demand for primary care physicians was forecast to grow by 2 more physicians than the supply, while demand for non-primary care physicians was forecast to grow by 9 more physicians than the supply. The specialty forecast to experience the greatest shortage expressed as a percentage of demand was Cardiology with a projected shortage of 25 percent. In the Trend scenario, the demand for physicians was forecast to outpace supply by 89 physicians in the region. Demand for primary care physicians was forecast to grow by 20 more physicians than the supply, while demand for non-primary care physicians was forecast to grow by 69 more physicians than the supply. The specialties forecast to experience the greatest shortages were Cardiology, Pathology and Ophthalmology, with projected shortages exceeding 25 percent.
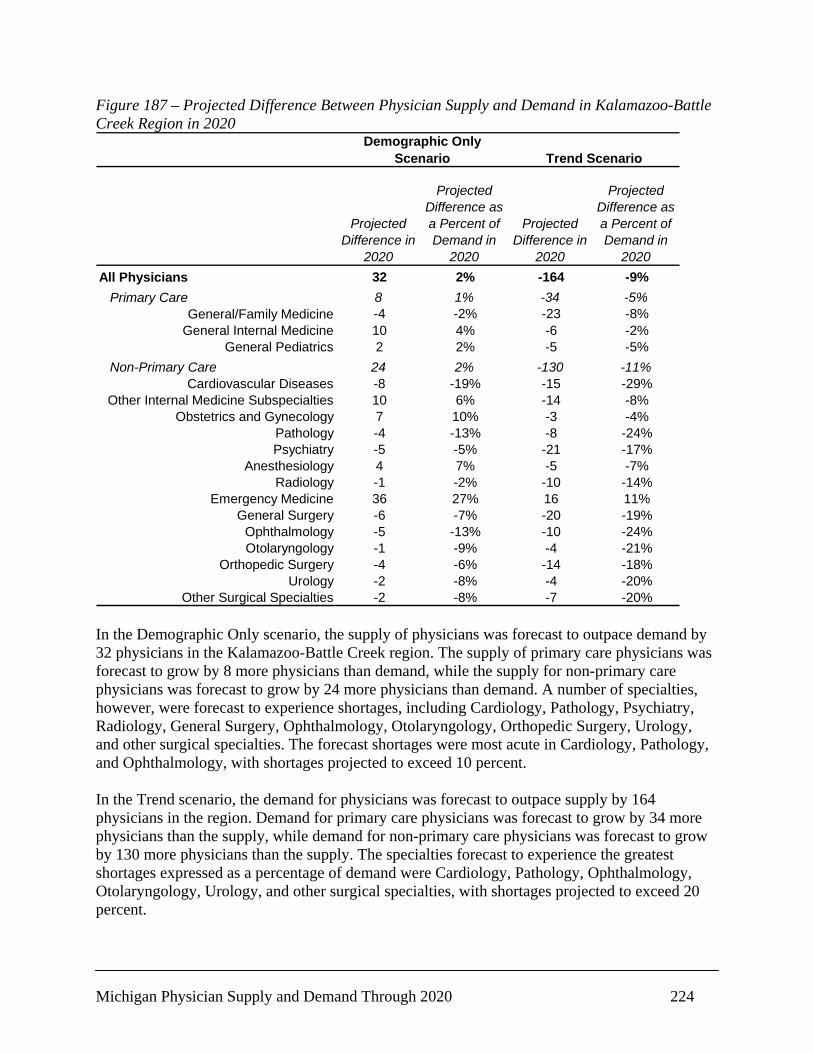
Michigan Physician Supply and Demand Through 2020 224
Figure 187 – Projected Difference Between Physician Supply and Demand in Kalamazoo-Battle Creek Region in 2020
Projected Difference in
2020
Projected Difference as a Percent of Demand in
2020
Projected Difference in
2020
Projected Difference as a Percent of Demand in
2020All Physicians 32 2% -164 -9%
Primary Care 8 1% -34 -5%General/Family Medicine -4 -2% -23 -8%
General Internal Medicine 10 4% -6 -2%General Pediatrics 2 2% -5 -5%
Non-Primary Care 24 2% -130 -11%Cardiovascular Diseases -8 -19% -15 -29%
Other Internal Medicine Subspecialties 10 6% -14 -8%Obstetrics and Gynecology 7 10% -3 -4%
Pathology -4 -13% -8 -24%Psychiatry -5 -5% -21 -17%
Anesthesiology 4 7% -5 -7%Radiology -1 -2% -10 -14%
Emergency Medicine 36 27% 16 11%General Surgery -6 -7% -20 -19%
Ophthalmology -5 -13% -10 -24%Otolaryngology -1 -9% -4 -21%
Orthopedic Surgery -4 -6% -14 -18%Urology -2 -8% -4 -20%
Other Surgical Specialties -2 -8% -7 -20%
Demographic Only Scenario Trend Scenario
In the Demographic Only scenario, the supply of physicians was forecast to outpace demand by 32 physicians in the Kalamazoo-Battle Creek region. The supply of primary care physicians was forecast to grow by 8 more physicians than demand, while the supply for non-primary care physicians was forecast to grow by 24 more physicians than demand. A number of specialties, however, were forecast to experience shortages, including Cardiology, Pathology, Psychiatry, Radiology, General Surgery, Ophthalmology, Otolaryngology, Orthopedic Surgery, Urology, and other surgical specialties. The forecast shortages were most acute in Cardiology, Pathology, and Ophthalmology, with shortages projected to exceed 10 percent. In the Trend scenario, the demand for physicians was forecast to outpace supply by 164 physicians in the region. Demand for primary care physicians was forecast to grow by 34 more physicians than the supply, while demand for non-primary care physicians was forecast to grow by 130 more physicians than the supply. The specialties forecast to experience the greatest shortages expressed as a percentage of demand were Cardiology, Pathology, Ophthalmology, Otolaryngology, Urology, and other surgical specialties, with shortages projected to exceed 20 percent.

Michigan Physician Supply and Demand Through 2020 225
Figure 188 – Projected Difference Between Physician Supply and Demand in the Lansing Area in 2020
Projected Difference in
2020
Projected Difference as a Percent of Demand in
2020
Projected Difference in
2020
Projected Difference as a Percent of Demand in
2020All Physicians -46 -3% -246 -13%
Primary Care -24 -3% -72 -10%General/Family Medicine -21 -6% -47 -12%
General Internal Medicine -5 -2% -19 -8%General Pediatrics 2 2% -6 -5%
Non-Primary Care -22 -2% -174 -15%Cardiovascular Diseases -15 -28% -24 -37%
Other Internal Medicine Subspecialties 1 0% -21 -13%Obstetrics and Gynecology 10 12% -3 -3%
Pathology -4 -17% -8 -28%Psychiatry -6 -6% -21 -18%
Anesthesiology 0 0% -11 -13%Radiology -4 -6% -14 -18%
Emergency Medicine 27 27% 12 10%General Surgery -10 -13% -23 -24%
Ophthalmology -7 -20% -12 -31%Otolaryngology 0 -3% -2 -16%
Orthopedic Surgery -4 -10% -10 -22%Urology -3 -16% -6 -27%
Other Surgical Specialties -4 -13% -8 -25%
Demographic Only Scenario Trend Scenario
Note: Where the difference between supply and demand is reported as 0, but a percent is indicated, the actual projected difference was a fraction of an FTE physician below 0.5. In the Demographic Only scenario, the demand for physicians was forecast to outpace supply by 46 physicians in the Lansing Area region. Demand for primary care physicians was forecast to grow by 24 more physicians than the supply, while demand for non-primary care physicians was forecast to grow by 22 more physicians than the supply. The specialties forecast to experience the greatest shortage expressed as a percentage of demand was Cardiology and Ophthalmology, with shortages projected to exceed 20 percent. In the Trend scenario, the demand for physicians was forecast to outpace supply by 246 physicians in the region. Demand for primary care physicians was forecast to grow by 72 more physicians than the supply, while demand for non-primary care physicians was forecast to grow by 174 more physicians than the supply. The specialties forecast to experience the greatest shortages were Cardiology, Pathology, Ophthalmology, Urology and other surgical specialties, with projected shortages exceeding 25 percent.

Michigan Physician Supply and Demand Through 2020 226
Figure 189 – Projected Difference Between Physician Supply and Demand in the Northeast Region in 2020
Projected Difference in
2020
Projected Difference as a Percent of Demand in
2020
Projected Difference in
2020
Projected Difference as a Percent of Demand in
2020All Physicians -14 -5% -45 -14%
Primary Care -8 -6% -18 -12%General/Family Medicine -7 -8% -14 -14%
General Internal Medicine -1 -4% -4 -10%General Pediatrics 1 7% 0 1%
Non-Primary Care -6 -4% -27 -17%Cardiovascular Diseases -1 -26% -1 -35%
Other Internal Medicine Subspecialties -1 -4% -3 -17%Obstetrics and Gynecology 0 2% -1 -11%
Pathology -1 -17% -2 -27%Psychiatry -1 -13% -1 -25%
Anesthesiology -1 -3% -3 -16%Radiology -1 -9% -2 -21%
Emergency Medicine 5 24% 2 8%General Surgery -3 -14% -6 -25%
Ophthalmology -1 -20% -1 -30%Otolaryngology 0 4% 0 -9%
Orthopedic Surgery -2 -13% -4 -24%Urology -1 -11% -1 -23%
Other Surgical Specialties 0 -- 0 --
Demographic Only Scenario Trend Scenario
In the Demographic Only scenario, the demand for physicians was forecast to outpace supply by 14 physicians in the Northeast region. Demand for primary care physicians was forecast to grow by 8 more physicians than the supply, while demand for non-primary care physicians was forecast to grow by 6 more physicians than the supply. The specialties forecast to experience the greatest shortage expressed as a percentage of demand was Cardiology and Ophthalmology, with shortages projected to exceed 20 percent. However, with the exception of General/Family Medicine, the shortages seldom were forecast to exceed 1 FTE physician. In the Trend scenario, the demand for physicians was forecast to outpace supply by 45 physicians in the region. Demand for primary care physicians was forecast to grow by 18 more physicians than the supply, while demand for non-primary care physicians was forecast to grow by 24 more physicians than the supply. The specialties forecast to experience the greatest shortages were General/Family Medicine and General Surgery, with shortages projected to exceed 5 FTE physicians.
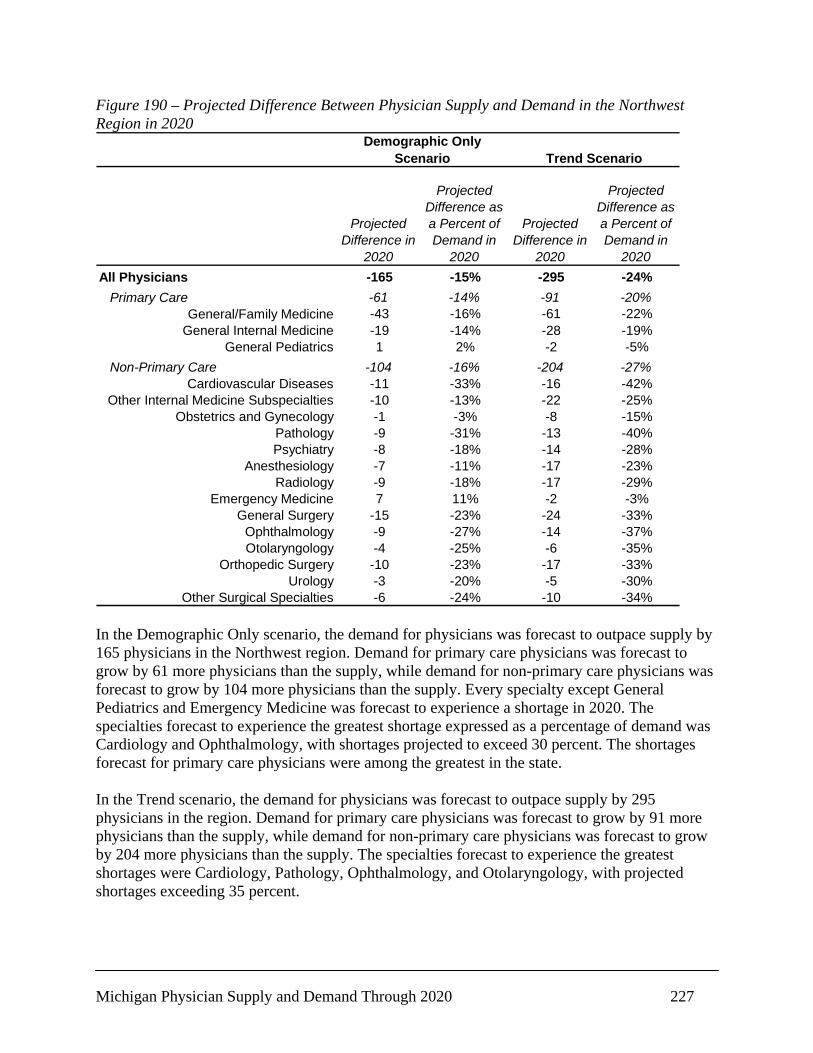
Michigan Physician Supply and Demand Through 2020 227
Figure 190 – Projected Difference Between Physician Supply and Demand in the Northwest Region in 2020
Projected Difference in
2020
Projected Difference as a Percent of Demand in
2020
Projected Difference in
2020
Projected Difference as a Percent of Demand in
2020All Physicians -165 -15% -295 -24%
Primary Care -61 -14% -91 -20%General/Family Medicine -43 -16% -61 -22%
General Internal Medicine -19 -14% -28 -19%General Pediatrics 1 2% -2 -5%
Non-Primary Care -104 -16% -204 -27%Cardiovascular Diseases -11 -33% -16 -42%
Other Internal Medicine Subspecialties -10 -13% -22 -25%Obstetrics and Gynecology -1 -3% -8 -15%
Pathology -9 -31% -13 -40%Psychiatry -8 -18% -14 -28%
Anesthesiology -7 -11% -17 -23%Radiology -9 -18% -17 -29%
Emergency Medicine 7 11% -2 -3%General Surgery -15 -23% -24 -33%
Ophthalmology -9 -27% -14 -37%Otolaryngology -4 -25% -6 -35%
Orthopedic Surgery -10 -23% -17 -33%Urology -3 -20% -5 -30%
Other Surgical Specialties -6 -24% -10 -34%
Demographic Only Scenario Trend Scenario
In the Demographic Only scenario, the demand for physicians was forecast to outpace supply by 165 physicians in the Northwest region. Demand for primary care physicians was forecast to grow by 61 more physicians than the supply, while demand for non-primary care physicians was forecast to grow by 104 more physicians than the supply. Every specialty except General Pediatrics and Emergency Medicine was forecast to experience a shortage in 2020. The specialties forecast to experience the greatest shortage expressed as a percentage of demand was Cardiology and Ophthalmology, with shortages projected to exceed 30 percent. The shortages forecast for primary care physicians were among the greatest in the state. In the Trend scenario, the demand for physicians was forecast to outpace supply by 295 physicians in the region. Demand for primary care physicians was forecast to grow by 91 more physicians than the supply, while demand for non-primary care physicians was forecast to grow by 204 more physicians than the supply. The specialties forecast to experience the greatest shortages were Cardiology, Pathology, Ophthalmology, and Otolaryngology, with projected shortages exceeding 35 percent.

Michigan Physician Supply and Demand Through 2020 228
Figure 191 – Projected Difference Between Physician Supply and Demand in Saginaw-Thumb Region in 2020
Projected Difference in
2020
Projected Difference as a Percent of Demand in
2020
Projected Difference in
2020
Projected Difference as a Percent of Demand in
2020All Physicians 0 0% -194 -10%
Primary Care -2 0% -50 -7%General/Family Medicine -11 -2% -41 -9%
General Internal Medicine 2 1% -12 -5%General Pediatrics 7 13% 3 6%
Non-Primary Care 2 0% -144 -13%Cardiovascular Diseases -12 -23% -20 -33%
Other Internal Medicine Subspecialties 4 3% -13 -10%Obstetrics and Gynecology 10 13% -2 -2%
Pathology -4 -15% -8 -26%Psychiatry -2 -3% -9 -16%
Anesthesiology 3 4% -9 -10%Radiology -4 -4% -17 -17%
Emergency Medicine 33 31% 17 14%General Surgery -9 -9% -23 -21%
Ophthalmology -8 -18% -14 -28%Otolaryngology 0 -2% -4 -15%
Orthopedic Surgery -5 -9% -13 -21%Urology -3 -10% -7 -22%
Other Surgical Specialties -3 -12% -8 -23%
Demographic Only Scenario Trend Scenario
Note: Where the difference between supply and demand is reported as 0, but a percent is indicated, the actual projected difference was a fraction of an FTE physician below 0.5. In the Demographic Only scenario, the supply of physicians was forecast to grow about the same as demand in the Saginaw-Thumb region. The demand for primary care physicians was forecast to grow by 2 more physicians than supply, while the supply for non-primary care physicians was forecast to grow by 2 more physicians than demand. A number of specialties, however, were forecast to experience shortages, including Cardiology, Pathology, Psychiatry, Radiology, General Surgery, Ophthalmology, Otolaryngology, Orthopedic Surgery, Urology, and other surgical specialties. The forecast shortages were most acute in Cardiology, Pathology, and Ophthalmology, with shortages projected to exceed 15 percent. In the Trend scenario, the demand for physicians was forecast to outpace supply by 194 physicians in the region. Demand for primary care physicians was forecast to grow by 50 more physicians than the supply, while demand for non-primary care physicians was forecast to grow by 144 more physicians than the supply. The specialties forecast to experience the greatest shortages expressed as a percentage of demand were Cardiology, Pathology, General Surgery, Ophthalmology, Otolaryngology, Urology, and other surgical specialties, with shortages projected to exceed 20 percent.

Michigan Physician Supply and Demand Through 2020 229
Figure 192 – Projected Difference Between Physician Supply and Demand in Southwest Michigan in 2020
Projected Difference in
2020
Projected Difference as a Percent of Demand in
2020
Projected Difference in
2020
Projected Difference as a Percent of Demand in
2020All Physicians 16 4% -30 -7%
Primary Care 8 4% -5 -2%General/Family Medicine 2 2% -6 -5%
General Internal Medicine 4 7% 0 0%General Pediatrics 2 9% 0 2%
Non-Primary Care 8 4% -25 -10%Cardiovascular Diseases -2 -14% -4 -26%
Other Internal Medicine Subspecialties 3 8% -3 -6%Obstetrics and Gynecology 4 15% 0 0%
Pathology -1 -11% -2 -22%Psychiatry 0 1% -1 -12%
Anesthesiology 2 8% -1 -6%Radiology 0 1% -3 -12%
Emergency Medicine 5 32% 3 15%General Surgery -2 -6% -6 -18%
Ophthalmology -1 -10% -2 -22%Otolaryngology 0 4% -1 -9%
Orthopedic Surgery 0 -4% -2 -17%Urology 0 -3% -1 -16%
Other Surgical Specialties -1 -8% -2 -20%
Demographic Only Scenario Trend Scenario
Note: Where the difference between supply and demand is reported as 0, but a percent is indicated, the actual projected difference was a fraction of an FTE physician below 0.5. In the Demographic Only scenario, the supply of physicians was forecast to outpace demand by 16 physicians in the Southwest Michigan region. The supply of primary care physicians was forecast to grow by 8 more physicians than demand, and the supply of non-primary care physicians was forecast to grow by 8 more physicians than demand. However, a number of specialties were forecast to experience shortages including, Cardiology, Pathology, and Ophthalmology. Moreover, in a number of specialties, the differences between supply and demand were not forecast to reach 1 FTE physician. In the Trend scenario, the demand for physicians was forecast to outpace supply by 30 physicians in the region. Demand for primary care physicians was forecast to grow by 5 more physicians than the supply, while demand for non-primary care physicians was forecast to grow by 25 more physicians than the supply. The specialties forecast to experience the greatest shortages were General/Family Medicine and General Surgery, with shortages projected to exceed 5 FTE physicians.
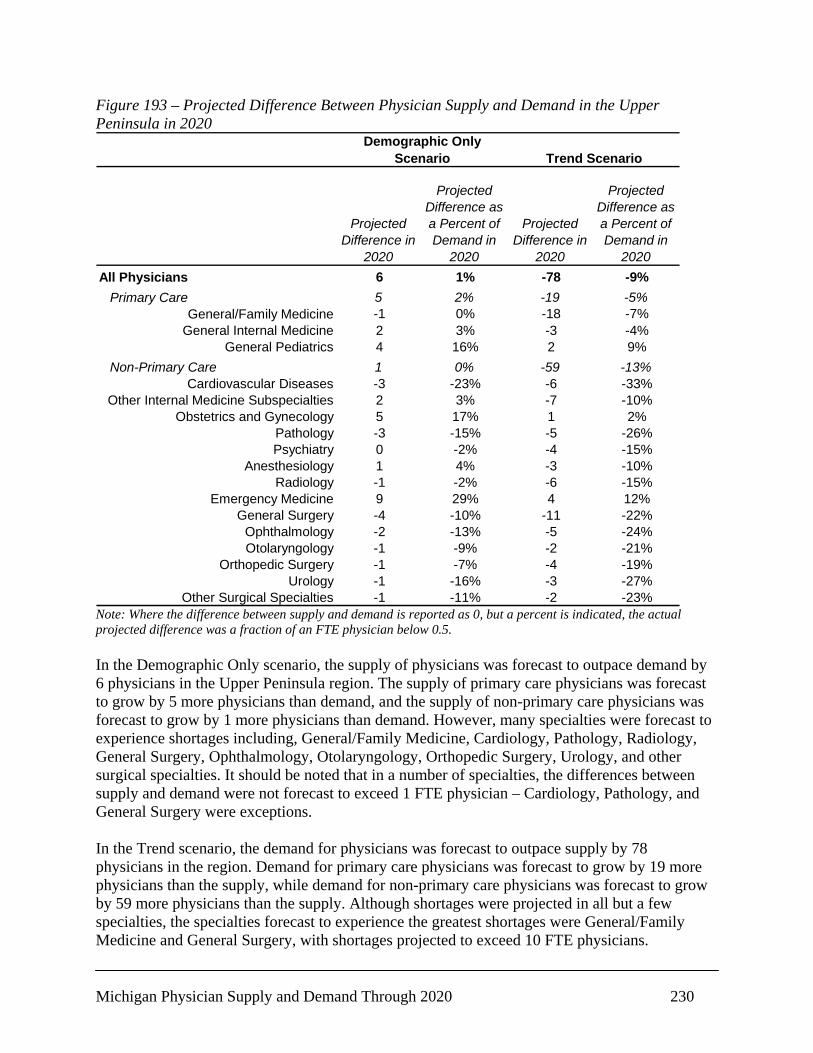
Michigan Physician Supply and Demand Through 2020 230
Figure 193 – Projected Difference Between Physician Supply and Demand in the Upper Peninsula in 2020
Projected Difference in
2020
Projected Difference as a Percent of Demand in
2020
Projected Difference in
2020
Projected Difference as a Percent of Demand in
2020All Physicians 6 1% -78 -9%
Primary Care 5 2% -19 -5%General/Family Medicine -1 0% -18 -7%
General Internal Medicine 2 3% -3 -4%General Pediatrics 4 16% 2 9%
Non-Primary Care 1 0% -59 -13%Cardiovascular Diseases -3 -23% -6 -33%
Other Internal Medicine Subspecialties 2 3% -7 -10%Obstetrics and Gynecology 5 17% 1 2%
Pathology -3 -15% -5 -26%Psychiatry 0 -2% -4 -15%
Anesthesiology 1 4% -3 -10%Radiology -1 -2% -6 -15%
Emergency Medicine 9 29% 4 12%General Surgery -4 -10% -11 -22%
Ophthalmology -2 -13% -5 -24%Otolaryngology -1 -9% -2 -21%
Orthopedic Surgery -1 -7% -4 -19%Urology -1 -16% -3 -27%
Other Surgical Specialties -1 -11% -2 -23%
Demographic Only Scenario Trend Scenario
Note: Where the difference between supply and demand is reported as 0, but a percent is indicated, the actual projected difference was a fraction of an FTE physician below 0.5. In the Demographic Only scenario, the supply of physicians was forecast to outpace demand by 6 physicians in the Upper Peninsula region. The supply of primary care physicians was forecast to grow by 5 more physicians than demand, and the supply of non-primary care physicians was forecast to grow by 1 more physicians than demand. However, many specialties were forecast to experience shortages including, General/Family Medicine, Cardiology, Pathology, Radiology, General Surgery, Ophthalmology, Otolaryngology, Orthopedic Surgery, Urology, and other surgical specialties. It should be noted that in a number of specialties, the differences between supply and demand were not forecast to exceed 1 FTE physician – Cardiology, Pathology, and General Surgery were exceptions. In the Trend scenario, the demand for physicians was forecast to outpace supply by 78 physicians in the region. Demand for primary care physicians was forecast to grow by 19 more physicians than the supply, while demand for non-primary care physicians was forecast to grow by 59 more physicians than the supply. Although shortages were projected in all but a few specialties, the specialties forecast to experience the greatest shortages were General/Family Medicine and General Surgery, with shortages projected to exceed 10 FTE physicians.

Michigan Physician Supply and Demand Through 2020 231
Figure 194 – Projected Difference Between Physician Supply and Demand in the West Central Region in 2020
Projected Difference in
2020
Projected Difference as a Percent of Demand in
2020
Projected Difference in
2020
Projected Difference as a Percent of Demand in
2020All Physicians -28 -5% -88 -14%
Primary Care -15 -5% -35 -11%General/Family Medicine -13 -7% -27 -13%
General Internal Medicine -2 -3% -7 -9%General Pediatrics 0 2% -1 -5%
Non-Primary Care -13 -5% -53 -17%Cardiovascular Diseases -4 -27% -6 -37%
Other Internal Medicine Subspecialties 0 -1% -5 -14%Obstetrics and Gynecology 1 5% -3 -9%
Pathology -2 -20% -3 -30%Psychiatry -2 -12% -4 -24%
Anesthesiology 0 -2% -3 -15%Radiology -2 -8% -5 -20%
Emergency Medicine 6 21% 2 5%General Surgery -5 -13% -11 -25%
Ophthalmology -1 -17% -2 -28%Otolaryngology 0 -9% -1 -21%
Orthopedic Surgery -2 -10% -5 -22%Urology -1 -10% -2 -22%
Other Surgical Specialties 0 -11% 0 -23%
Demographic Only Scenario Trend Scenario
Note: Where the difference between supply and demand is reported as 0, but a percent is indicated, the actual projected difference was a fraction of an FTE physician below 0.5. In the Demographic Only scenario, the demand for physicians was forecast to outpace supply by 28 physicians in the West Central region. Demand for primary care physicians was forecast to grow by 15 more physicians than the supply, while demand for non-primary care physicians was forecast to grow by 13 more physicians than the supply. The specialties forecast to experience the greatest shortage expressed as a percentage of demand was Cardiology and Pathology, with shortages projected to exceed 20 percent. However, with the exception of General/Family Medicine, Cardiology, and General Surgery, the shortages seldom were forecast to exceed 2 FTE physicians. In the Trend scenario, the demand for physicians was forecast to outpace supply by 88 physicians in the region. Demand for primary care physicians was forecast to grow by 35 more physicians than the supply, while demand for non-primary care physicians was forecast to grow by 53 more physicians than the supply. The specialties forecast to experience the greatest shortages were General/Family Medicine and General Surgery, with shortages projected to exceed 10 FTE physicians.
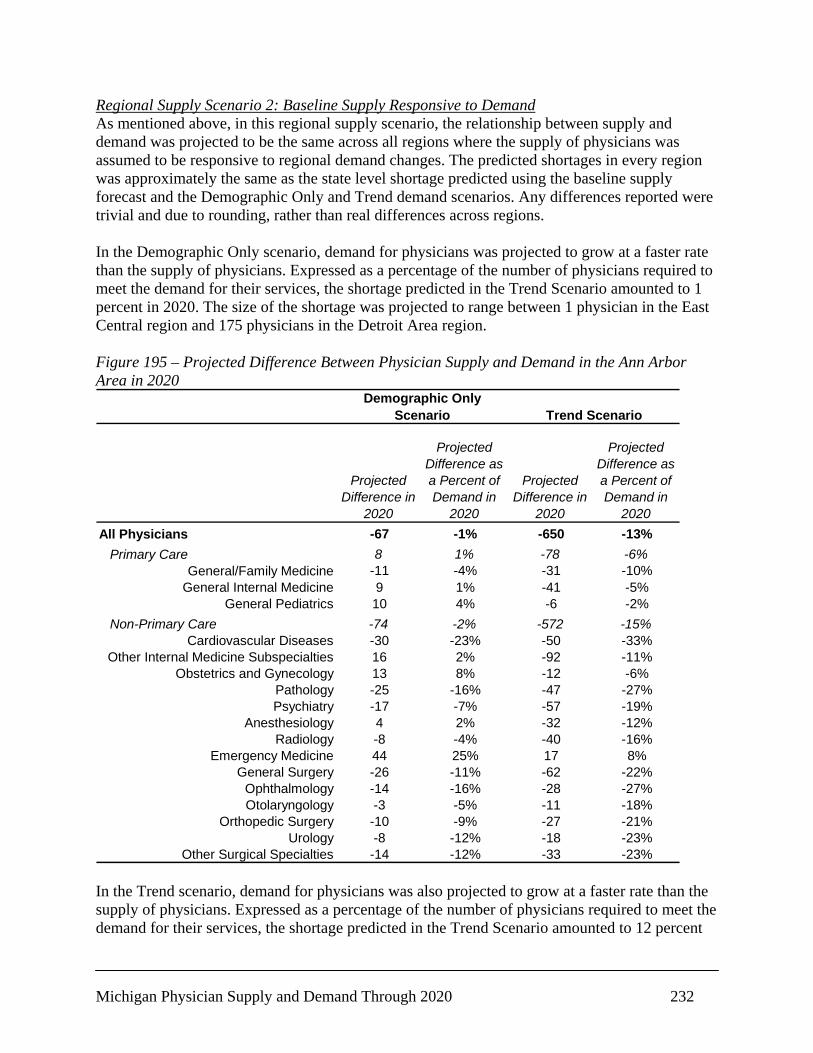
Michigan Physician Supply and Demand Through 2020 232
Regional Supply Scenario 2: Baseline Supply Responsive to Demand As mentioned above, in this regional supply scenario, the relationship between supply and demand was projected to be the same across all regions where the supply of physicians was assumed to be responsive to regional demand changes. The predicted shortages in every region was approximately the same as the state level shortage predicted using the baseline supply forecast and the Demographic Only and Trend demand scenarios. Any differences reported were trivial and due to rounding, rather than real differences across regions. In the Demographic Only scenario, demand for physicians was projected to grow at a faster rate than the supply of physicians. Expressed as a percentage of the number of physicians required to meet the demand for their services, the shortage predicted in the Trend Scenario amounted to 1 percent in 2020. The size of the shortage was projected to range between 1 physician in the East Central region and 175 physicians in the Detroit Area region. Figure 195 – Projected Difference Between Physician Supply and Demand in the Ann Arbor Area in 2020
Projected Difference in
2020
Projected Difference as a Percent of Demand in
2020
Projected Difference in
2020
Projected Difference as a Percent of Demand in
2020All Physicians -67 -1% -650 -13%
Primary Care 8 1% -78 -6%General/Family Medicine -11 -4% -31 -10%
General Internal Medicine 9 1% -41 -5%General Pediatrics 10 4% -6 -2%
Non-Primary Care -74 -2% -572 -15%Cardiovascular Diseases -30 -23% -50 -33%
Other Internal Medicine Subspecialties 16 2% -92 -11%Obstetrics and Gynecology 13 8% -12 -6%
Pathology -25 -16% -47 -27%Psychiatry -17 -7% -57 -19%
Anesthesiology 4 2% -32 -12%Radiology -8 -4% -40 -16%
Emergency Medicine 44 25% 17 8%General Surgery -26 -11% -62 -22%
Ophthalmology -14 -16% -28 -27%Otolaryngology -3 -5% -11 -18%
Orthopedic Surgery -10 -9% -27 -21%Urology -8 -12% -18 -23%
Other Surgical Specialties -14 -12% -33 -23%
Demographic Only Scenario Trend Scenario
In the Trend scenario, demand for physicians was also projected to grow at a faster rate than the supply of physicians. Expressed as a percentage of the number of physicians required to meet the demand for their services, the shortage predicted in the Trend Scenario amounted to 12 percent

Michigan Physician Supply and Demand Through 2020 233
in 2020. The size of the shortage was projected to range between 19 physician in the East Central region and 2,025 physicians in the Detroit Area region. In terms of specialty-specific forecasts, the relationship between supply and demand at the regional level once again was equivalent to the relationship at the state level. Figure 196 – Projected Difference Between Physician Supply and Demand in the Detroit Area in 2020
Projected Difference in
2020
Projected Difference as a Percent of Demand in
2020
Projected Difference in
2020
Projected Difference as a Percent of Demand in
2020All Physicians -175 -1% -2,025 -12%
Primary Care -3 0% -397 -6%General/Family Medicine -77 -4% -217 -10%
General Internal Medicine 35 1% -157 -5%General Pediatrics 40 4% -24 -2%
Non-Primary Care -173 -2% -1,628 -15%Cardiovascular Diseases -95 -23% -158 -33%
Other Internal Medicine Subspecialties 37 2% -208 -11%Obstetrics and Gynecology 68 8% -63 -6%
Pathology -66 -16% -125 -27%Psychiatry -44 -7% -145 -19%
Anesthesiology 10 2% -83 -12%Radiology -29 -4% -140 -16%
Emergency Medicine 188 25% 74 8%General Surgery -92 -11% -223 -22%
Ophthalmology -61 -16% -118 -27%Otolaryngology -8 -5% -30 -18%
Orthopedic Surgery -34 -9% -92 -21%Urology -23 -12% -54 -23%
Other Surgical Specialties -34 -12% -77 -23%
Demographic Only Scenario Trend Scenario
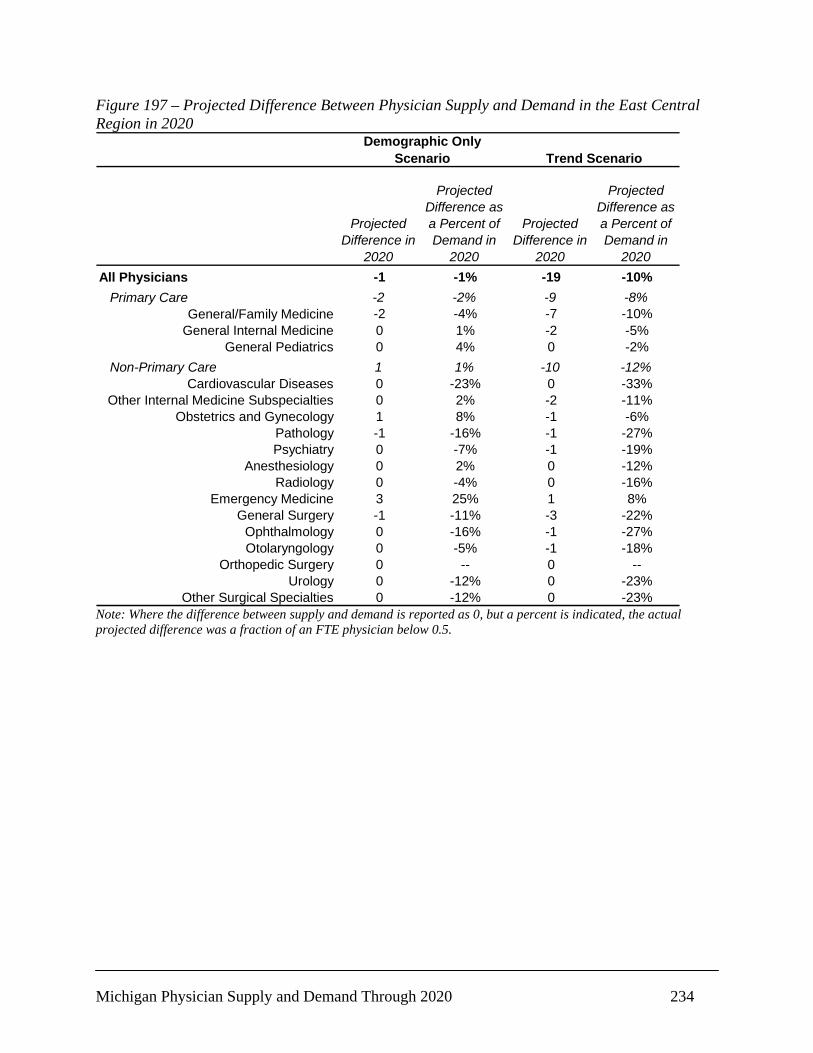
Michigan Physician Supply and Demand Through 2020 234
Figure 197 – Projected Difference Between Physician Supply and Demand in the East Central Region in 2020
Projected Difference in
2020
Projected Difference as a Percent of Demand in
2020
Projected Difference in
2020
Projected Difference as a Percent of Demand in
2020All Physicians -1 -1% -19 -10%
Primary Care -2 -2% -9 -8%General/Family Medicine -2 -4% -7 -10%
General Internal Medicine 0 1% -2 -5%General Pediatrics 0 4% 0 -2%
Non-Primary Care 1 1% -10 -12%Cardiovascular Diseases 0 -23% 0 -33%
Other Internal Medicine Subspecialties 0 2% -2 -11%Obstetrics and Gynecology 1 8% -1 -6%
Pathology -1 -16% -1 -27%Psychiatry 0 -7% -1 -19%
Anesthesiology 0 2% 0 -12%Radiology 0 -4% 0 -16%
Emergency Medicine 3 25% 1 8%General Surgery -1 -11% -3 -22%
Ophthalmology 0 -16% -1 -27%Otolaryngology 0 -5% -1 -18%
Orthopedic Surgery 0 -- 0 --Urology 0 -12% 0 -23%
Other Surgical Specialties 0 -12% 0 -23%
Demographic Only Scenario Trend Scenario
Note: Where the difference between supply and demand is reported as 0, but a percent is indicated, the actual projected difference was a fraction of an FTE physician below 0.5.
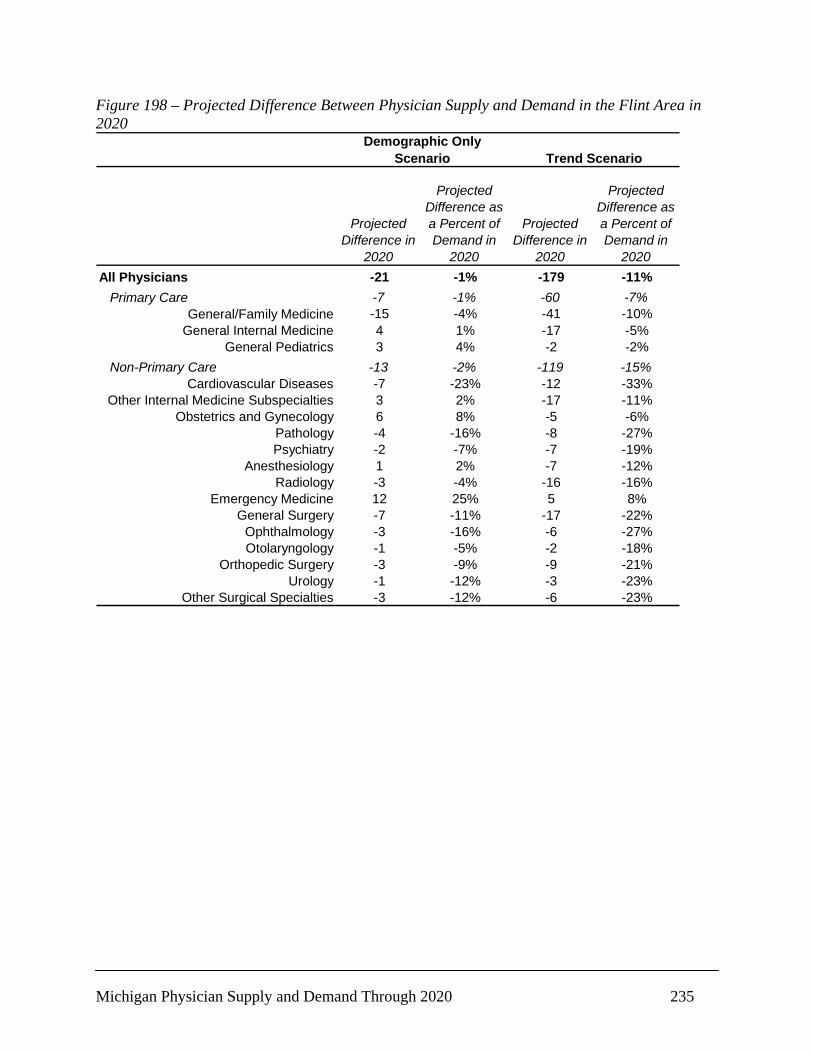
Michigan Physician Supply and Demand Through 2020 235
Figure 198 – Projected Difference Between Physician Supply and Demand in the Flint Area in 2020
Projected Difference in
2020
Projected Difference as a Percent of Demand in
2020
Projected Difference in
2020
Projected Difference as a Percent of Demand in
2020All Physicians -21 -1% -179 -11%
Primary Care -7 -1% -60 -7%General/Family Medicine -15 -4% -41 -10%
General Internal Medicine 4 1% -17 -5%General Pediatrics 3 4% -2 -2%
Non-Primary Care -13 -2% -119 -15%Cardiovascular Diseases -7 -23% -12 -33%
Other Internal Medicine Subspecialties 3 2% -17 -11%Obstetrics and Gynecology 6 8% -5 -6%
Pathology -4 -16% -8 -27%Psychiatry -2 -7% -7 -19%
Anesthesiology 1 2% -7 -12%Radiology -3 -4% -16 -16%
Emergency Medicine 12 25% 5 8%General Surgery -7 -11% -17 -22%
Ophthalmology -3 -16% -6 -27%Otolaryngology -1 -5% -2 -18%
Orthopedic Surgery -3 -9% -9 -21%Urology -1 -12% -3 -23%
Other Surgical Specialties -3 -12% -6 -23%
Demographic Only Scenario Trend Scenario

Michigan Physician Supply and Demand Through 2020 236
Figure 199 – Projected Difference Between Physician Supply and Demand in the Grand Rapids-Muskegon Region in 2020
Projected Difference in
2020
Projected Difference as a Percent of Demand in
2020
Projected Difference in
2020
Projected Difference as a Percent of Demand in
2020All Physicians -31 -1% -422 -11%
Primary Care -12 -1% -96 -7%General/Family Medicine -24 -4% -68 -10%
General Internal Medicine 5 1% -23 -5%General Pediatrics 8 4% -5 -2%
Non-Primary Care -19 -1% -326 -14%Cardiovascular Diseases -13 -23% -22 -33%
Other Internal Medicine Subspecialties 6 2% -35 -11%Obstetrics and Gynecology 16 8% -14 -6%
Pathology -11 -16% -21 -27%Psychiatry -6 -7% -21 -19%
Anesthesiology 3 2% -26 -12%Radiology -6 -4% -30 -16%
Emergency Medicine 55 25% 22 8%General Surgery -21 -11% -52 -22%
Ophthalmology -12 -16% -24 -27%Otolaryngology -2 -5% -7 -18%
Orthopedic Surgery -13 -9% -33 -21%Urology -5 -12% -13 -23%
Other Surgical Specialties -10 -12% -23 -23%
Demographic Only Scenario Trend Scenario

Michigan Physician Supply and Demand Through 2020 237
Figure 200 – Projected Difference Between Physician Supply and Demand in the Jackson Area in 2020
Projected Difference in
2020
Projected Difference as a Percent of Demand in
2020
Projected Difference in
2020
Projected Difference as a Percent of Demand in
2020All Physicians -12 -2% -90 -12%
Primary Care -3 -1% -22 -7%General/Family Medicine -6 -4% -16 -10%
General Internal Medicine 1 1% -5 -5%General Pediatrics 2 4% -1 -2%
Non-Primary Care -9 -2% -68 -15%Cardiovascular Diseases -5 -23% -8 -33%
Other Internal Medicine Subspecialties 1 2% -8 -11%Obstetrics and Gynecology 2 8% -2 -6%
Pathology -2 -16% -4 -27%Psychiatry -2 -7% -7 -19%
Anesthesiology 1 2% -5 -12%Radiology -1 -4% -5 -16%
Emergency Medicine 8 25% 3 8%General Surgery -4 -11% -9 -22%
Ophthalmology -3 -16% -7 -27%Otolaryngology -1 -5% -2 -18%
Orthopedic Surgery -2 -9% -5 -21%Urology -1 -12% -2 -23%
Other Surgical Specialties -1 -12% -1 -23%
Demographic Only Scenario Trend Scenario
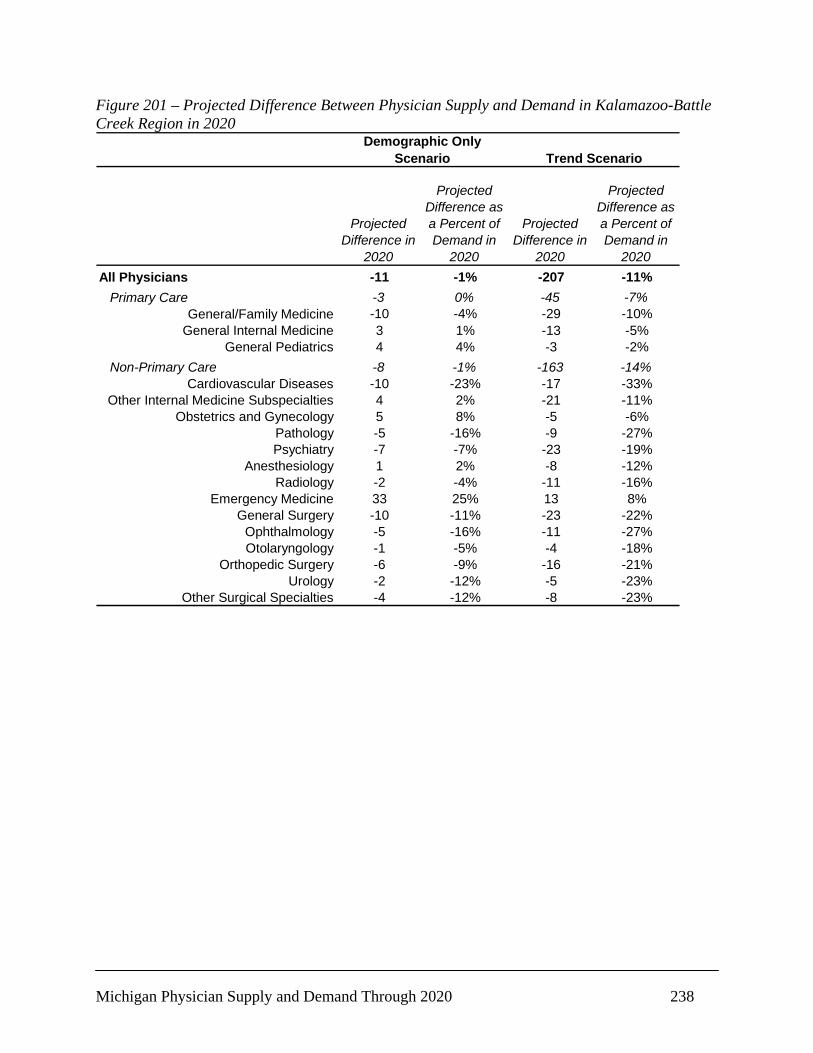
Michigan Physician Supply and Demand Through 2020 238
Figure 201 – Projected Difference Between Physician Supply and Demand in Kalamazoo-Battle Creek Region in 2020
Projected Difference in
2020
Projected Difference as a Percent of Demand in
2020
Projected Difference in
2020
Projected Difference as a Percent of Demand in
2020All Physicians -11 -1% -207 -11%
Primary Care -3 0% -45 -7%General/Family Medicine -10 -4% -29 -10%
General Internal Medicine 3 1% -13 -5%General Pediatrics 4 4% -3 -2%
Non-Primary Care -8 -1% -163 -14%Cardiovascular Diseases -10 -23% -17 -33%
Other Internal Medicine Subspecialties 4 2% -21 -11%Obstetrics and Gynecology 5 8% -5 -6%
Pathology -5 -16% -9 -27%Psychiatry -7 -7% -23 -19%
Anesthesiology 1 2% -8 -12%Radiology -2 -4% -11 -16%
Emergency Medicine 33 25% 13 8%General Surgery -10 -11% -23 -22%
Ophthalmology -5 -16% -11 -27%Otolaryngology -1 -5% -4 -18%
Orthopedic Surgery -6 -9% -16 -21%Urology -2 -12% -5 -23%
Other Surgical Specialties -4 -12% -8 -23%
Demographic Only Scenario Trend Scenario
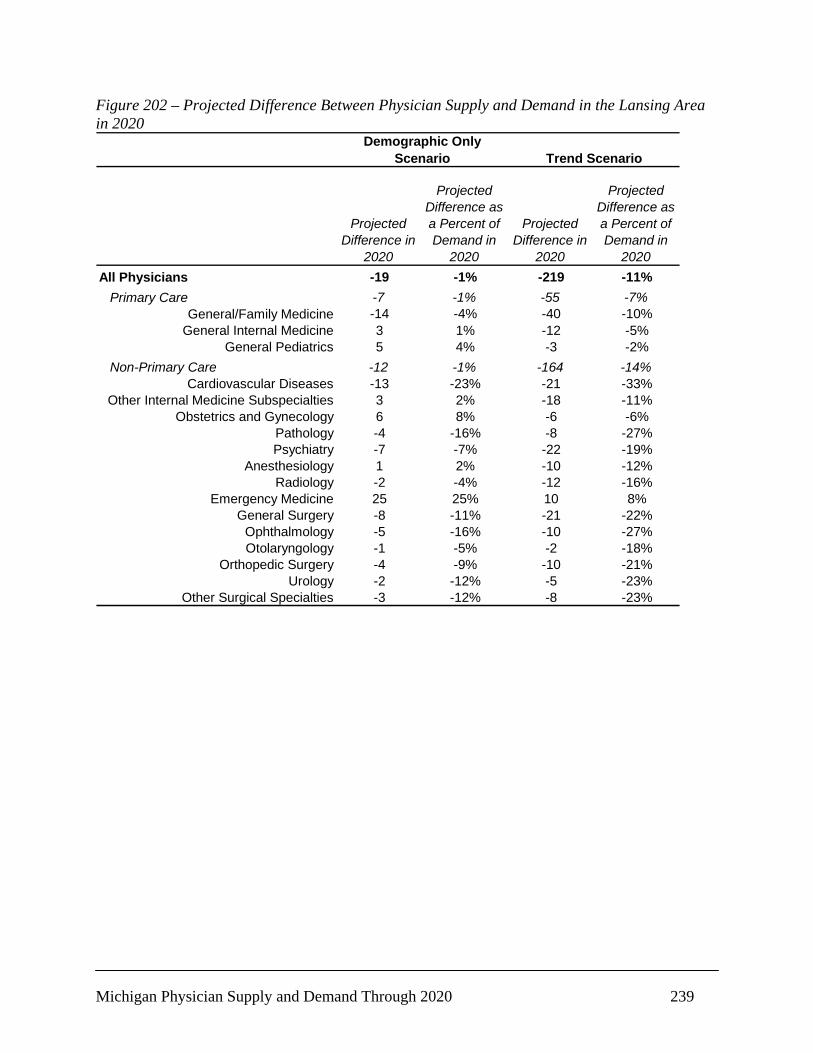
Michigan Physician Supply and Demand Through 2020 239
Figure 202 – Projected Difference Between Physician Supply and Demand in the Lansing Area in 2020
Projected Difference in
2020
Projected Difference as a Percent of Demand in
2020
Projected Difference in
2020
Projected Difference as a Percent of Demand in
2020All Physicians -19 -1% -219 -11%
Primary Care -7 -1% -55 -7%General/Family Medicine -14 -4% -40 -10%
General Internal Medicine 3 1% -12 -5%General Pediatrics 5 4% -3 -2%
Non-Primary Care -12 -1% -164 -14%Cardiovascular Diseases -13 -23% -21 -33%
Other Internal Medicine Subspecialties 3 2% -18 -11%Obstetrics and Gynecology 6 8% -6 -6%
Pathology -4 -16% -8 -27%Psychiatry -7 -7% -22 -19%
Anesthesiology 1 2% -10 -12%Radiology -2 -4% -12 -16%
Emergency Medicine 25 25% 10 8%General Surgery -8 -11% -21 -22%
Ophthalmology -5 -16% -10 -27%Otolaryngology -1 -5% -2 -18%
Orthopedic Surgery -4 -9% -10 -21%Urology -2 -12% -5 -23%
Other Surgical Specialties -3 -12% -8 -23%
Demographic Only Scenario Trend Scenario

Michigan Physician Supply and Demand Through 2020 240
Figure 203 – Projected Difference Between Physician Supply and Demand in the Northeast Region in 2020
Projected Difference in
2020
Projected Difference as a Percent of Demand in
2020
Projected Difference in
2020
Projected Difference as a Percent of Demand in
2020All Physicians -3 -1% -34 -11%
Primary Care -3 -2% -12 -8%General/Family Medicine -3 -4% -10 -10%
General Internal Medicine 1 1% -2 -5%General Pediatrics 0 4% 0 -2%
Non-Primary Care -1 -1% -22 -14%Cardiovascular Diseases -1 -23% -1 -33%
Other Internal Medicine Subspecialties 0 2% -2 -11%Obstetrics and Gynecology 1 8% -1 -6%
Pathology -1 -16% -2 -27%Psychiatry 0 -7% -1 -19%
Anesthesiology 0 2% -2 -12%Radiology 0 -4% -2 -16%
Emergency Medicine 5 25% 2 8%General Surgery -2 -11% -5 -22%
Ophthalmology 0 -16% -1 -27%Otolaryngology 0 -5% 0 -18%
Orthopedic Surgery -1 -9% -4 -21%Urology -1 -12% -1 -23%
Other Surgical Specialties 0 -- 0 --
Demographic Only Scenario Trend Scenario
Note: Where the difference between supply and demand is reported as 0, but a percent is indicated, the actual projected difference was a fraction of an FTE physician below 0.5.

Michigan Physician Supply and Demand Through 2020 241
Figure 204 – Projected Difference Between Physician Supply and Demand in the Northwest Region in 2020
Projected Difference in
2020
Projected Difference as a Percent of Demand in
2020
Projected Difference in
2020
Projected Difference as a Percent of Demand in
2020All Physicians -24 -2% -153 -12%
Primary Care -7 -2% -36 -8%General/Family Medicine -10 -4% -27 -10%
General Internal Medicine 2 1% -8 -5%General Pediatrics 1 4% -1 -2%
Non-Primary Care -17 -3% -117 -15%Cardiovascular Diseases -7 -23% -12 -33%
Other Internal Medicine Subspecialties 2 2% -10 -11%Obstetrics and Gynecology 4 8% -3 -6%
Pathology -5 -16% -9 -27%Psychiatry -3 -7% -9 -19%
Anesthesiology 1 2% -9 -12%Radiology -2 -4% -9 -16%
Emergency Medicine 15 25% 6 8%General Surgery -7 -11% -16 -22%
Ophthalmology -5 -16% -11 -27%Otolaryngology -1 -5% -3 -18%
Orthopedic Surgery -4 -9% -11 -21%Urology -2 -12% -4 -23%
Other Surgical Specialties -3 -12% -7 -23%
Demographic Only Scenario Trend Scenario
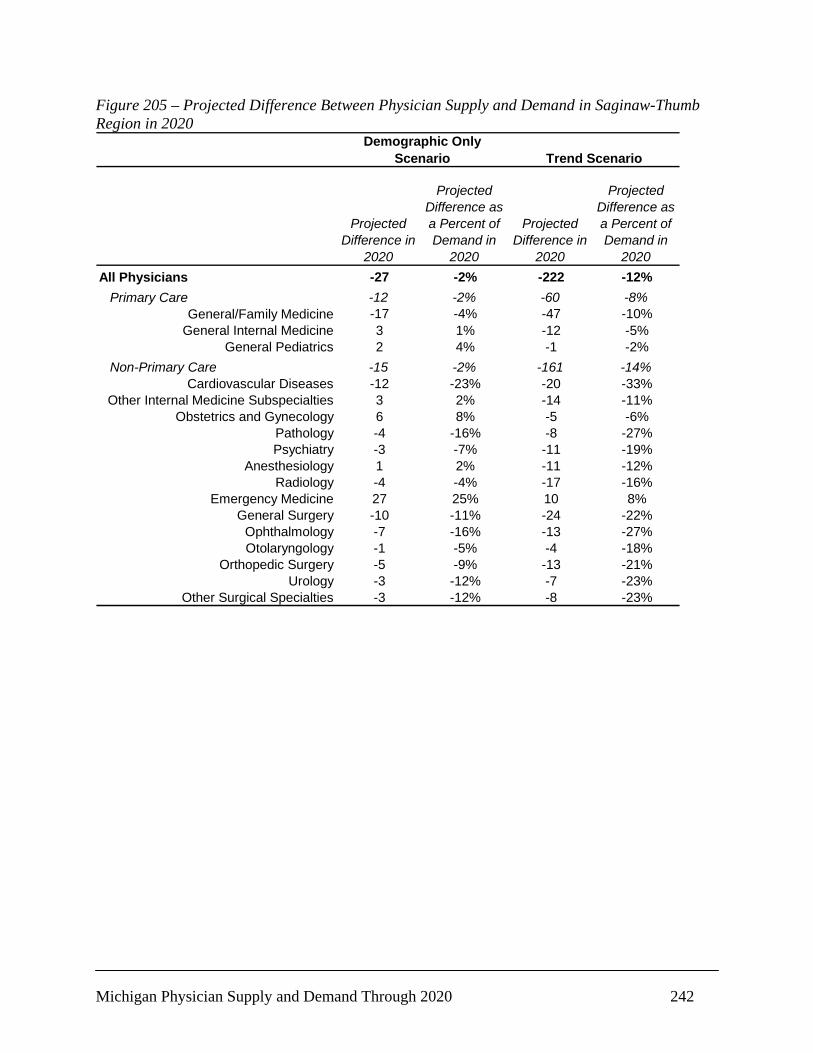
Michigan Physician Supply and Demand Through 2020 242
Figure 205 – Projected Difference Between Physician Supply and Demand in Saginaw-Thumb Region in 2020
Projected Difference in
2020
Projected Difference as a Percent of Demand in
2020
Projected Difference in
2020
Projected Difference as a Percent of Demand in
2020All Physicians -27 -2% -222 -12%
Primary Care -12 -2% -60 -8%General/Family Medicine -17 -4% -47 -10%
General Internal Medicine 3 1% -12 -5%General Pediatrics 2 4% -1 -2%
Non-Primary Care -15 -2% -161 -14%Cardiovascular Diseases -12 -23% -20 -33%
Other Internal Medicine Subspecialties 3 2% -14 -11%Obstetrics and Gynecology 6 8% -5 -6%
Pathology -4 -16% -8 -27%Psychiatry -3 -7% -11 -19%
Anesthesiology 1 2% -11 -12%Radiology -4 -4% -17 -16%
Emergency Medicine 27 25% 10 8%General Surgery -10 -11% -24 -22%
Ophthalmology -7 -16% -13 -27%Otolaryngology -1 -5% -4 -18%
Orthopedic Surgery -5 -9% -13 -21%Urology -3 -12% -7 -23%
Other Surgical Specialties -3 -12% -8 -23%
Demographic Only Scenario Trend Scenario

Michigan Physician Supply and Demand Through 2020 243
Figure 206 – Projected Difference Between Physician Supply and Demand in Southwest Michigan in 2020
Projected Difference in
2020
Projected Difference as a Percent of Demand in
2020
Projected Difference in
2020
Projected Difference as a Percent of Demand in
2020All Physicians -8 -2% -55 -12%
Primary Care -2 -1% -16 -8%General/Family Medicine -4 -4% -12 -10%
General Internal Medicine 1 1% -3 -5%General Pediatrics 1 4% -1 -2%
Non-Primary Care -6 -3% -39 -15%Cardiovascular Diseases -3 -23% -6 -33%
Other Internal Medicine Subspecialties 1 2% -5 -11%Obstetrics and Gynecology 2 8% -2 -6%
Pathology -1 -16% -2 -27%Psychiatry -1 -7% -2 -19%
Anesthesiology 0 2% -3 -12%Radiology -1 -4% -4 -16%
Emergency Medicine 4 25% 2 8%General Surgery -3 -11% -7 -22%
Ophthalmology -1 -16% -3 -27%Otolaryngology 0 -5% -1 -18%
Orthopedic Surgery -1 -9% -2 -21%Urology -1 -12% -1 -23%
Other Surgical Specialties -1 -12% -2 -23%
Demographic Only Scenario Trend Scenario
Note: Where the difference between supply and demand is reported as 0, but a percent is indicated, the actual projected difference was a fraction of an FTE physician below 0.5.

Michigan Physician Supply and Demand Through 2020 244
Figure 207 – Projected Difference Between Physician Supply and Demand in the Upper Peninsula in 2020
Projected Difference in
2020
Projected Difference as a Percent of Demand in
2020
Projected Difference in
2020
Projected Difference as a Percent of Demand in
2020All Physicians -16 -2% -101 -12%
Primary Care -8 -2% -32 -8%General/Family Medicine -10 -4% -27 -10%
General Internal Medicine 1 1% -4 -5%General Pediatrics 1 4% -1 -2%
Non-Primary Care -9 -2% -69 -15%Cardiovascular Diseases -3 -23% -6 -33%
Other Internal Medicine Subspecialties 1 2% -8 -11%Obstetrics and Gynecology 2 8% -2 -6%
Pathology -3 -16% -6 -27%Psychiatry -2 -7% -6 -19%
Anesthesiology 0 2% -3 -12%Radiology -1 -4% -6 -16%
Emergency Medicine 8 25% 3 8%General Surgery -5 -11% -11 -22%
Ophthalmology -3 -16% -6 -27%Otolaryngology -1 -5% -2 -18%
Orthopedic Surgery -2 -9% -5 -21%Urology -1 -12% -2 -23%
Other Surgical Specialties -1 -12% -3 -23%
Demographic Only Scenario Trend Scenario
Note: Where the difference between supply and demand is reported as 0, but a percent is indicated, the actual projected difference was a fraction of an FTE physician below 0.5.

Michigan Physician Supply and Demand Through 2020 245
Figure 208 – Projected Difference Between Physician Supply and Demand in the West Central Region in 2020
Note: Where the difference between supply and demand is reported as 0, but a percent is indicated, the actual projected difference was a fraction of an FTE physician below 0.5.
Projected Difference in
2020
Projected Difference as a Percent of Demand in
2020
Projected Difference in
2020
Projected Difference as a Percent of Demand in
2020All Physicians -10 -2% -69 -11%
Primary Care -6 -2% -25 -8%General/Family Medicine -7 -4% -20 -10%
General Internal Medicine 1 1% -4 -5%General Pediatrics 1 4% 0 -2%
Non-Primary Care -4 -2% -45 -14%Cardiovascular Diseases -3 -23% -5 -33%
Other Internal Medicine Subspecialties 1 2% -4 -11%Obstetrics and Gynecology 2 8% -2 -6%
Pathology -2 -16% -3 -27%Psychiatry -1 -7% -3 -19%
Anesthesiology 0 2% -2 -12%Radiology -1 -4% -4 -16%
Emergency Medicine 7 25% 3 8%General Surgery -4 -11% -10 -22%
Ophthalmology -1 -16% -2 -27%Otolaryngology 0 -5% -1 -18%
Orthopedic Surgery -2 -9% -4 -21%Urology -1 -12% -2 -23%
Other Surgical Specialties 0 -12% 0 -23%
Demographic Only Scenario Trend Scenario

Michigan Physician Supply and Demand Through 2020 246
Chapter 10: Limitations The findings presented in this summary are subject to a number of limitations that should be considered prior to developing policy based upon them. In general, as with all forecasting endeavors, the forecasts of physician supply and demand presented here were constructed on a foundation of assumptions. These assumptions are associated with the factors that determine physician supply and demand (e.g., number of new entrants into the Michigan physician workforce; age-, gender-, location-, insurance status-specific physician utilization rates; estimated elasticities of physician demand to economic growth/decline; and so forth). To the extent these assumptions fail to hold over the forecast period, the accuracy of the forecasts will suffer. However, the assumptions made were based upon historical data and, where available, Michigan-specific data. Moreover, the construction of multiple scenarios that allow for variation in some of the key assumptions of the forecasting models mitigates the risk of inaccuracy due to ill-chosen assumptions. Another way to treat the forecasts in this report is to think of them as illustrative of what the future might hold under a specific set of conditions. For example, in one of the demand scenarios developed for this report, it was assumed that all of the unnecessary services provided by physicians would be eliminated by 2020. How likely is it that the health care system will change enough for this assumption to be true? It is not likely at all. However, the scenarios developed with this assumption do illustrate the effect on demand for physicians in such an environment. Thus, one could use this information to know what the effect might be should one-fifth or one-quarter of these services are eliminated. The same could be said for any of the assumptions made in these forecasts. The findings presented here also do not take into account the potential feedback effects resulting from the predicted national physician shortage or the predicted physician shortage in Michigan. For example, the predicted shortage of Cardiologists nationally may influence young physicians to select Cardiology as a practice specialty at a higher rate than the forecast models assume. Moreover, in response to a widespread shortage of physicians, current practitioners may delay retirement. Further, if demand for physicians were to decrease as sharply as the scenarios in which unnecessary services were eliminated, it is likely that supply would respond by growing at a slower same rate than forecast, reducing the imbalances suggested by the models. There is a nearly infinite list of other potential feedback effects in response to physician shortages that could affect supply and demand in the future. Similarly, the findings presented in this summary do not take into account any policy changes that might be wrought as a result of the publication of the findings. While national policies around the physician workforce do not appear to have been affected by the COGME’s Sixteenth Report as yet, state level initiatives have begun to respond to the predicted shortage of physicians. With a shortage looming, it is likely that competition for physicians among states will increase. In the way states now compete feverishly for new businesses and their accompanying jobs, it will not be surprising if states act similarly with regard to physicians. The nature of this competition is likely to have ramifications for the relationship between physician supply and demand that cannot be accounted for in the current forecasting models.
Michigan Physician Supply and Demand Through 2020 247
References American Medical Association. Physician Distribution and Medical Licensure in the U.S., 1975.
Chicago: American Medical Association. 1976. American Medical Association. Physician Characteristics and Distribution in the U.S. 1984
Edition. Chicago, IL: AMA Press. 1984 American Medical Association. Physician Characteristics and Distribution in the U.S. 2006
Edition. Chicago, IL. AMA Press. 2006 Anderson GF, UE Reinhardt, PS Hussey, and V Petrosyan. “It’s the Prices, Stupid: Why the
United States is So Different from Other Countries,” Health Affairs 22, May/June (2003): 89-105.
Angus DC, MA Kelly, RJ Schmitz, A White, and J Popovich. “Caring for the Critically Ill
Patient. Current and Projected Workforce Requirements for Care of the Critically Ill and Patients with Pulmonary Disease: Can We Meet the Requirements of an Aging Population?” Journal of the American Medical Association 284, 21 (2000): 2762-2070.
Association of American Medical Colleges. AAMC Data Book: Statistical Information Related
to Medical Schools and Teaching Hospitals. Washington: Association of American Medical Colleges. 2001, Tables A1 and B1.
Australian Medical Workforce Advisory Committee/Australian Institute of Health and Welfare.
Female Participation in the Australian Medical Workforce. Sydney, Australia: Australian Medical Workforce Advisory Committee. 1996.
Australian Medical Workforce Advisory Committee/Australian Institute of Health and Welfare.
Medical Workforce Supply and Demand In Australia-A Discussion Paper. Sydney, Australia: Australian Medical Workforce Advisory Committee. 1998.
Barer M. “New Opportunities for Old Mistakes,” Health Affairs 21, January/February (2002):
169-171. Bland KI and G Issacs. “Contemporary Trends in Student Selection of Medical Specialties: The
Potential Impact on General Surgery,” Archives of Surgery 137, 9 (2002): 1078-1079. Blumenthal D. “Doctors in a Wired World: Can Professionalism Survive Technology?”
Milbank Quarterly 80, 3 (2002): 525-546. Bobula JD. “Work Patterns, Practice Characteristics and Incomes of Male and Female
Physicians,” Journal of Medical Education 55, 10 (1980): 826-833. Bond JT, E Galinsky, and JE Swanberg. National Study of the Changing Workforce. New York,
NY: Families and Work Institute. 1998.
Michigan Physician Supply and Demand Through 2020 248
Consensus Statement on Physician Workforce. AAMC Advisory no. 97-9. Washington: AAMC.
1997. Cooper RA. “Seeking A Balanced Physician for the Twenty-first Century,” Journal of the
American Medical Association 272, 9 (1994): 680-687. Cooper RA. “Conceptual Framework,” in Evaluation of Specialty Workforce Methodologies.
Council on Graduate Medical Education Resource Paper. Rockville, MD: COGME/Health Resources and Services Administration. 2000a.
Cooper Ra. “Forecasting the Physician Workforce,” pp. 87-96 in Papers and Proceedings of the
Eleventh Federal Forecasters Conference. Washington: U.S. Department of Education. 2000b.
Cooper RA. “There’s a Shortage of Specialists: Is Anyone Listening?” Academic Medicine 77,
8 (2002): 761-766 Cooper RA, TE Getzen, HJ McKee, P Laud. “Economic and Demographic Trends Signal an
Impending Physician Shortage,” Health Affairs 21, 1 (2002): 140-154. Cooper RA, TE Getzen, and P Laud. “Economic Expansion Is a Major Determinant of Physician
Supply and Utilization,” Health Services Research 38, 2 (2003): 675-696. Corrigan J. Presentation at “Searching for the Next Magic Bullet: Examining New Approaches”
session at the AcademyHealth Annual Research Meeting, Nashville, TN. 28 June 2003. Council on Graduate Medical Education. Third Report: Improving Access to Health Care
Through Physician Workforce Reform. Rockville, MD: COGME/Health Resources and Services Administration. 1992.
Council on Graduate Medical Education. Fourth Report: Recommendations to Improve Access
to Health Care Through Physician Workforce Reform. Rockville, MD: COGME/Health Resources and Services Administration. 1994.
Council on Graduate Medical Education. Sixth Report: Managed Health Care: Implications for
the Physician Workforce and Medical Education. Rockville, MD: COGME/Health Resources and Services Administration. 1995a.
Council on Graduate Medical Education. Seventh Report: Physician Workforce Funding
Recommendations for Department of Health and Human Services Programs. Rockville, MD: COGME/Health Resources and Services Administration. 1995b.
Council on Graduate Medical Education. Eighth Report: Patient Care Physician Supply and
Requirements: Testing COGME Recommendations. Rockville, MD: COGME/Health Resources and Services Administration. 1996.

Michigan Physician Supply and Demand Through 2020 249
Council on Graduate Medical Education. Eleventh Report: International Medical Graduates,
The Physician Workforce and GME Payment Reform. Rockville, MD: COGME/Health Resources and Services Administration. 1998.
Council on Graduate Medical Education. Fourteenth Report: COGME Physician Workforce
Policies: Recent Developments and Remaining Challenges in Meeting National Goals. Rockville, MD: COGME/Health Resources and Services Administration. 1999.
Council on Graduate Medical Education. Sixteenth Report: Physician Workforce Policy
Guidelines for the United States, 2000-2020. Rockville, MD: COGME/Health Resources and Services Administration. 2005.
DeNavas-Walt C, BD Proctor, and CH Lee. Income, Poverty, and Health Insurance Coverage in
the United States: 2004. U.S. Census Bureau, Current Population Reports, P60-229. Washington: U.S. Government Printing Office. 2005.
Dorsey ER, D Jarjoura, and GW Rutecki. “Influence of Controllable Lifestyle on Recent Trends
in Specialty Choice by U.S. Medical Students,” Journal of the American Medical Association 290, 9 (2003): 1173-1178.
Etzoni DA, JH Liu, MA Maggard, and CY Ko. “The Aging Population and Its Impact on the
Surgery Workforce,” Annals of Surgery 238, 2 (2003): 170-177. Fisher ES, DE Wennberg, TA Stukel, DJ Gottlieb, FL Lucas, and EL Pinder. “The Implications
of Regional Variations in Medicare Spending. Part 1: The Content, Quality, and Accessibility of Care,” Annals of Internal Medicine 138, 4 (2003a): 273-287.
Fisher ES, DE Wennberg, TA Stukel, DJ Gottlieb, FL Lucas, and EL Pinder. “The Implications
of Regional Variations in Medicare Spending. Part 2: Health Outcomes and Satisfaction with Care,” Annals of Internal Medicine 138, 4 (2003b): 288-298.
Fleming KC, JM Evans, and DS Chutka. “Caregiver and Clinician Shortages in an Aging
Nation,” Mayo Clinic Proceedings 78, 8 (2003): 1026-1040. Foot DK, RP Lewis, TA Pearson, and GA Beller. “Demographics of Cardiology, 1950-2050.”
Journal of the American College of Cardiology 35, 4 (2000): 1067-1081. Forte GJ and DP Armstrong. Physician Supply and Distribution in Michigan, 2004. Rensselaer,
NY: Center for Health Workforce Studies: 2006 Forte GJ and ES Salsberg. “Women in Medicine in New York State: Preliminary Findings from
the 1997-2000 New York State Physician Licensure Re-Registration Survey,” News of New York 54, 9 (1999): 7, 13.
Michigan Physician Supply and Demand Through 2020 250
Forte GJ, ES Salsberg, P Wing, M Beaulieu, and V Myers. The Allergy and Immunology Physician Workforce 2000. Rensselaer, NY: Center for Health Workforce Studies. 2000.
Gamliel S, RM Politzer, ML Rivo, F Mullan, “Managed Care on the March: Will Physicians
Meet the Challenge?” Health Affairs 14, 2 (1995): 131-142 Gelfand DV, YD Podnos, SE Wilson, J Cooke, and RA Williams. “Choosing General Surgery:
Insights into Career Choices of Current Medical Students,” Archives of Surgery 137, 9 (2002): 941-945.
Goldsmith J, D Blumenthal, and W Rishel. “Federal Health Information Policy: A Case of
Arrested Development,” Health Affairs 22, July/August (2003): 44-55. Goodman DC, ES Fisher, TA Bubolz, JE Mohr, JF Poage, and JE Wennberg. “Benchmarking
the U.S. Physician Workforce. An Alternative to Needs-Based or Demand-Based Planning,” Journal of the American Medical Association 276, 22 (1997): 1811-1817.
Goodman DC, TA Stukel, C Chang, and JE Wennberg. “End-Of-Life Care At Academic
Medical Centers: Implications for Future Workforce Requirements,” Health Affairs 25, 2 (2006): 521-531.
Graduate Medical Education National Advisory Committee, Report of the Graduate Medical
Education National Advisory Committee to the Secretary, Department of Health and Human Services. Washington: U.S. Department of Health and Human Services. 1981.
Grumbach K. “Fighting Hand To Hand Over Physician Workforce Policy,” Health Affairs 21, 5
(2002a): 13-27. Grumbach K. “The Ramifications of Specialty-Dominated Medicine,” Health Affairs 21, 1
(2002b): 155-157. Gutner T. “A Balancing Act for Gen X Women,” Business Week, 21 January 2002: 82. Hart LG, E Wagner, S Pirzada, AF Nelson, and RA Rosenblatt. “Physician Staffing Ratios in
Staff-Model HMOs: A Cautionary Tale,” Health Affairs 16, January/February (1997): 55-70.
Hauser R. Fertility Tables for Birth Cohorts by Color: United States 1901-1973. Rockville, MD:
National Center for Health Statistics. 1976. Hay JW. “Physician’s Specialty Choice and Specialty Income,” in Econometrics of Health Care,
G Duru and JHP Paelink, eds. Netherlands: Kluwer Academic Publishers. 1991. Hurley JE. “Physician’s Choice of Specialty, Location and Mode,” Journal of Human Resources
26, 1 (1991): 47-71.

Michigan Physician Supply and Demand Through 2020 251
Kim WJ, N Enzer, D Bechtold, BA Brooks, P Joshi, C King, C Robinowitz, D Stubbe, E Szigethy, and P Tanguay. Meeting the Mental Health Needs of Children and Adolescents: Addressing the Problems of Access to Care. Report of the Task force on Work Force Needs. Washington, DC: American Academy of Childhood and Adolescent Psychology. 2001.
Kletke PR, WD Marder, and AB Silberger. “The Growing Proportion of Female Physicians:
Implications for U.S. Physician Supply,” American Journal of Public Health 80, 3 (1990): 300-304.
Knickman JR, KA Hunt, EK Snell, LM Alecxih, and DL Kennell. “Wealth Patterns Among
Elderly Americans: Implications for Health Care Affordability,” Health Affairs 22, May/June (2003): 168-174.
Lang J. “It’s Time Over Money for this Generation,” Journal of Commerce 1 (2000): 7. Martin SC, RM Arnold, and RM. Parker. “Gender and Medical Socialization,” Journal of
Health and Social Behavior 29, December (1988): 333-343. Masys DR. “Effects of Current and Future Information Technologies on the Health Care
Workforce,” Health Affairs 21, September/October (2002): 33-41. Miller RD and WL Lanier. “The Shortage of Anesthesiologists: An Unwelcome Lesson for
Other Medical Specialties,” Mayo Clinic Proceedings 76, 10 (2001): 969-970. Neilson EG, W Suki, M Leonard, et al. American Society of Nephrology Ad Hoc Committee on
Reform of Graduate Medical Education. 2001. Newton DA and MS Grayson. “Trends in Career Choice by U.S. Medical School Graduates,”
Journal of the American Medical Association 290, 9 (2003): 1179-1182. Nicholson S. “Physician Specialty Choice Under Uncertainty,” Journal of Labor Economics 20,
4 (2002): 816-847. Organ CH. “The Generation Gap in Modern Surgery,” Archives of Surgery 137, 3 (2002): 250-
252. Pew Health Professions Commission. Critical Challenges: Revitalizing the Health Professions
for the Twenty-first Century. San Francisco: University of California, San Francisco, Center for the Health Professions. 1995.
Provonost PJ, DC Angus, T Dorman, KA Robinson, TT Dremsizov, and TL Young. “Physician
Staffing Patterns and Clinical Outcomes in Critically Ill Patients: A Systematic Review,” Journal of the American Medical Association 288, 17 (2002): 2151-2162.
Michigan Physician Supply and Demand Through 2020 252
Public Policy Associates, Inc. The Future Supply and Demand for Physicians in Michigan. Lansing, MI: PPA, Inc. 2005.
Puccio K, GJ Forte, M Beaulieu, M Ayers, and ES Salsberg. Specialty Choices Among Second
Year Pediatric and Internal Medicine Residents. Rensselaer, NY: Center for Health Workforce Studies. 2002.
Roehrig C and S Eisenstein. “Vector Research, Inc. Report to the American Academy of
Neurology Workforce Task Force Study.” Chapter 3 in Neurology in the Next Two Decades: Report of the Workforce Task Force of the American Academy of Neurology. American Academy of Neurology. 1999.
Salsberg ES and GJ Forte. “Trends in the Physician Workforce, 1980-2000,” Health Affairs 21,
September/October (2002): 165-173. Schubert A, G Eckhout, T Cooperider, and A Kuhel. “Evidence of a Current and Lasting
National Anesthesia Personnel Shortfall: Scope and Implications,” Mayo Clinic Proceedings 76, 10 (2001): 995-1010.
Schubert A, G Eckhout, and K Tremper. “An Updated View of National Anesthesia Personnel
Shortfall,” Anesthesia & Analgesia 96, 1 (2003): 207-214. Schwartz RW, RK Jarecky, WE Strodel, JV Haley, B Young, and WO Griffen. “Controllable
Lifestyle: A New Factor in Career Choice by Medical Students,” Academic Medicine 64, 10 (1989): 606-609.
Schwartz RW, JV Haley, C Williams, RK Jarecky, WE Strodel, B Young, and WO Griffen.
“The Controllable Lifestyle Factor and Students’ Attitudes About Specialty Selection,” Academic Medicine 65, 3 (1990): 207-210.
Sullivan P and L Buske. “Results from CMA’s Huge 1998 Physician Survey Point to a
Dispirited Profession,” Canadian Medical Association Journal 159, 5 (1998): 525-528. Suneja T, ED Smith, GJ Chen, KJ Zipperstein, AB Fleischer, and SR Feldman. “Waiting Times
to See a Dermatologist Are Perceived as Too Long by Dermatologists: Implications for the Dermatology Workforce,” Archives of Dermatology 137, 10 (2001): 1303-1307.
Sunshine JH. Overview and Analysis of Information Regarding the Shortage. Chicago, IL: American College of Radiology. 2001.
Weiner JP. “Forecasting the Effects of Health Reform on U.S. Physician Workforce
Requirement. Evidence from HMO Staffing Patterns,” Journal of the American Medical Association 272, 3 (1994): 222-230.

Michigan Physician Supply and Demand Through 2020 253
Weiner JP. Assessing Current and Future U.S. Physician Requirements Based on HMO Staffing Rates: A Synthesis of New Sources of Data and Forecasts for the years 2000 and 2020. Washington, DC: U.S. Department of Health & Human Services, Bureau of Health Professions. HRSA 94-576(P). 1995.
Weiner JP. “A Shortage of Physicians or a Surplus of Assumptions?” Health Affairs 21,1 (2002):
160-162. Weiner JP. “Prepaid Group Practice Staffing And U.S. Physician Supply: Lessons For
Workforce Policy.” Health Affairs Web Exclusive. February 4, 2004. Wennberg JE, DC Goodman, RF Nease, and RB Keller, “Finding Equilibrium in U.S. Physician
Supply,” Health Affairs 12, 2 (1993): 89-103. Woods and Poole Economics, Inc. 2005 State Profile: Michigan. Washington: Woods and Poole
Economics, Inc. 2005.
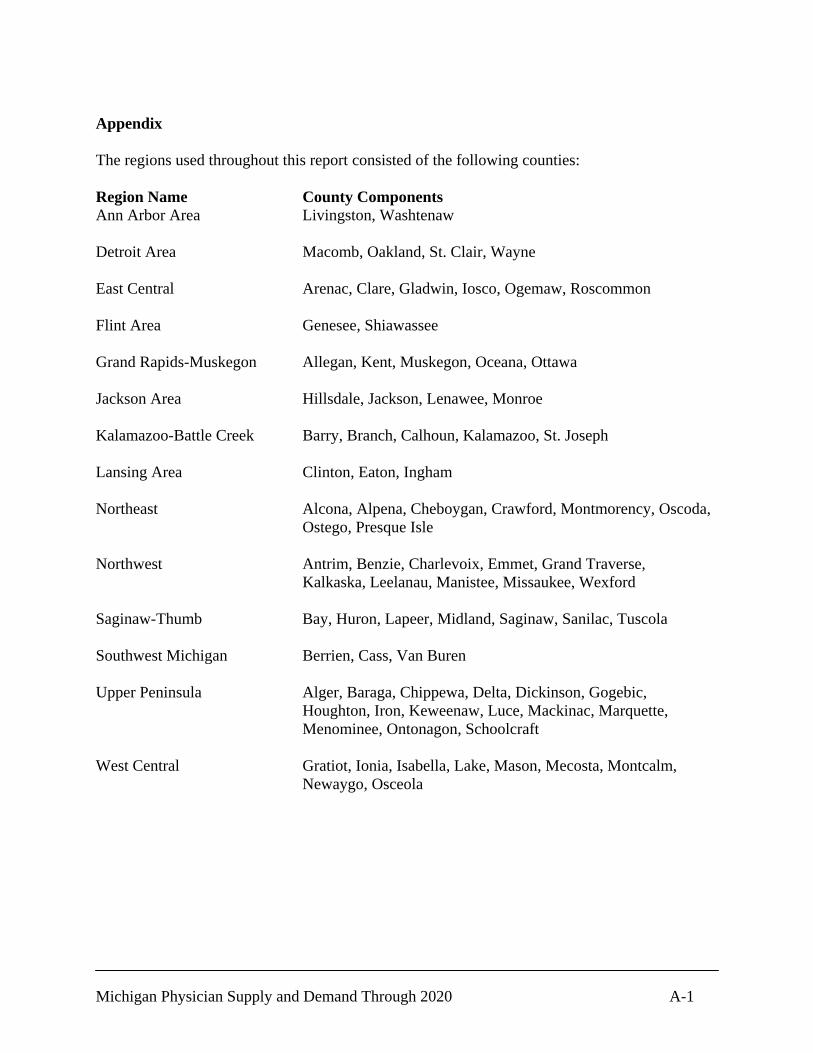
Michigan Physician Supply and Demand Through 2020 A-1
Appendix The regions used throughout this report consisted of the following counties: Region Name County Components Ann Arbor Area Livingston, Washtenaw
Detroit Area Macomb, Oakland, St. Clair, Wayne
East Central Arenac, Clare, Gladwin, Iosco, Ogemaw, Roscommon
Flint Area Genesee, Shiawassee
Grand Rapids-Muskegon Allegan, Kent, Muskegon, Oceana, Ottawa
Jackson Area Hillsdale, Jackson, Lenawee, Monroe
Kalamazoo-Battle Creek Barry, Branch, Calhoun, Kalamazoo, St. Joseph
Lansing Area Clinton, Eaton, Ingham
Northeast Alcona, Alpena, Cheboygan, Crawford, Montmorency, Oscoda,
Ostego, Presque Isle
Northwest Antrim, Benzie, Charlevoix, Emmet, Grand Traverse, Kalkaska, Leelanau, Manistee, Missaukee, Wexford
Saginaw-Thumb Bay, Huron, Lapeer, Midland, Saginaw, Sanilac, Tuscola
Southwest Michigan Berrien, Cass, Van Buren
Upper Peninsula Alger, Baraga, Chippewa, Delta, Dickinson, Gogebic, Houghton, Iron, Keweenaw, Luce, Mackinac, Marquette, Menominee, Ontonagon, Schoolcraft
West Central Gratiot, Ionia, Isabella, Lake, Mason, Mecosta, Montcalm, Newaygo, Osceola
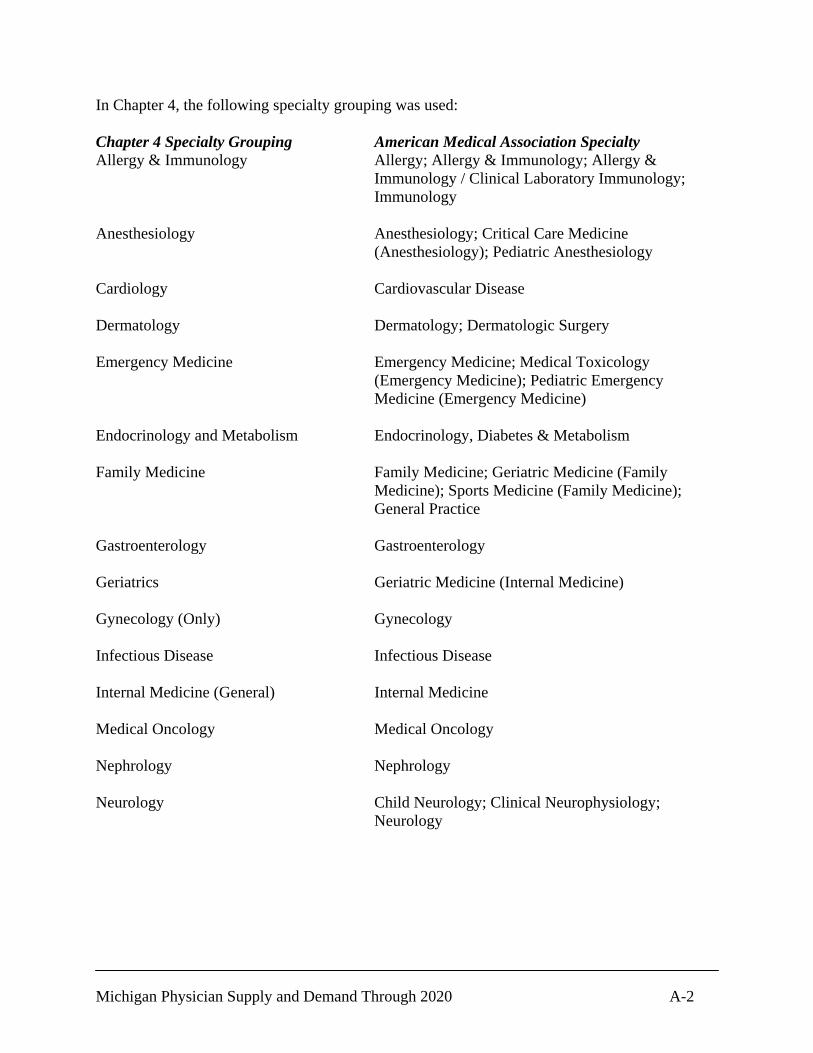
Michigan Physician Supply and Demand Through 2020 A-2
In Chapter 4, the following specialty grouping was used: Chapter 4 Specialty Grouping American Medical Association Specialty Allergy & Immunology Allergy; Allergy & Immunology; Allergy &
Immunology / Clinical Laboratory Immunology; Immunology
Anesthesiology Anesthesiology; Critical Care Medicine
(Anesthesiology); Pediatric Anesthesiology Cardiology Cardiovascular Disease Dermatology Dermatology; Dermatologic Surgery Emergency Medicine Emergency Medicine; Medical Toxicology
(Emergency Medicine); Pediatric Emergency Medicine (Emergency Medicine)
Endocrinology and Metabolism Endocrinology, Diabetes & Metabolism Family Medicine Family Medicine; Geriatric Medicine (Family
Medicine); Sports Medicine (Family Medicine); General Practice
Gastroenterology Gastroenterology Geriatrics Geriatric Medicine (Internal Medicine) Gynecology (Only) Gynecology Infectious Disease Infectious Disease Internal Medicine (General) Internal Medicine Medical Oncology Medical Oncology Nephrology Nephrology Neurology Child Neurology; Clinical Neurophysiology;
Neurology
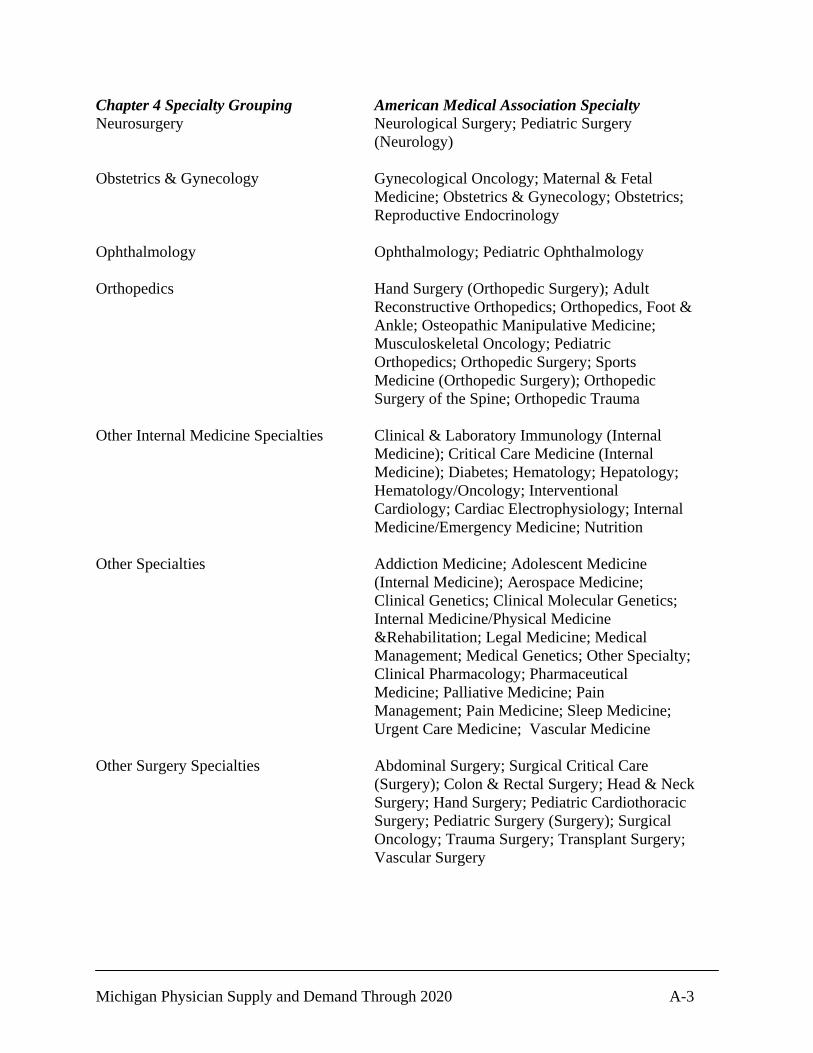
Michigan Physician Supply and Demand Through 2020 A-3
Chapter 4 Specialty Grouping American Medical Association Specialty Neurosurgery Neurological Surgery; Pediatric Surgery
(Neurology) Obstetrics & Gynecology Gynecological Oncology; Maternal & Fetal
Medicine; Obstetrics & Gynecology; Obstetrics; Reproductive Endocrinology
Ophthalmology Ophthalmology; Pediatric Ophthalmology Orthopedics Hand Surgery (Orthopedic Surgery); Adult
Reconstructive Orthopedics; Orthopedics, Foot & Ankle; Osteopathic Manipulative Medicine; Musculoskeletal Oncology; Pediatric Orthopedics; Orthopedic Surgery; Sports Medicine (Orthopedic Surgery); Orthopedic Surgery of the Spine; Orthopedic Trauma
Other Internal Medicine Specialties Clinical & Laboratory Immunology (Internal
Medicine); Critical Care Medicine (Internal Medicine); Diabetes; Hematology; Hepatology; Hematology/Oncology; Interventional Cardiology; Cardiac Electrophysiology; Internal Medicine/Emergency Medicine; Nutrition
Other Specialties Addiction Medicine; Adolescent Medicine
(Internal Medicine); Aerospace Medicine; Clinical Genetics; Clinical Molecular Genetics; Internal Medicine/Physical Medicine &Rehabilitation; Legal Medicine; Medical Management; Medical Genetics; Other Specialty; Clinical Pharmacology; Pharmaceutical Medicine; Palliative Medicine; Pain Management; Pain Medicine; Sleep Medicine; Urgent Care Medicine; Vascular Medicine
Other Surgery Specialties Abdominal Surgery; Surgical Critical Care
(Surgery); Colon & Rectal Surgery; Head & Neck Surgery; Hand Surgery; Pediatric Cardiothoracic Surgery; Pediatric Surgery (Surgery); Surgical Oncology; Trauma Surgery; Transplant Surgery; Vascular Surgery
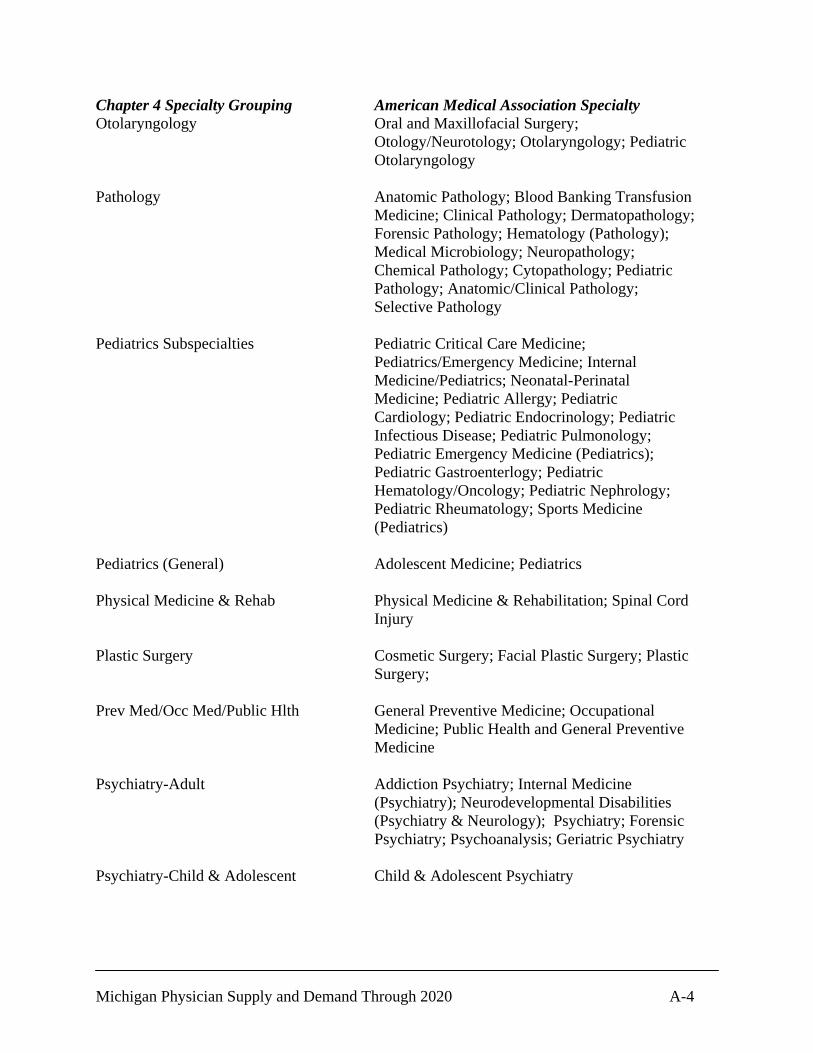
Michigan Physician Supply and Demand Through 2020 A-4
Chapter 4 Specialty Grouping American Medical Association Specialty Otolaryngology Oral and Maxillofacial Surgery;
Otology/Neurotology; Otolaryngology; Pediatric Otolaryngology
Pathology Anatomic Pathology; Blood Banking Transfusion
Medicine; Clinical Pathology; Dermatopathology; Forensic Pathology; Hematology (Pathology); Medical Microbiology; Neuropathology; Chemical Pathology; Cytopathology; Pediatric Pathology; Anatomic/Clinical Pathology; Selective Pathology
Pediatrics Subspecialties Pediatric Critical Care Medicine;
Pediatrics/Emergency Medicine; Internal Medicine/Pediatrics; Neonatal-Perinatal Medicine; Pediatric Allergy; Pediatric Cardiology; Pediatric Endocrinology; Pediatric Infectious Disease; Pediatric Pulmonology; Pediatric Emergency Medicine (Pediatrics); Pediatric Gastroenterlogy; Pediatric Hematology/Oncology; Pediatric Nephrology; Pediatric Rheumatology; Sports Medicine (Pediatrics)
Pediatrics (General) Adolescent Medicine; Pediatrics Physical Medicine & Rehab Physical Medicine & Rehabilitation; Spinal Cord
Injury Plastic Surgery Cosmetic Surgery; Facial Plastic Surgery; Plastic
Surgery; Prev Med/Occ Med/Public Hlth General Preventive Medicine; Occupational
Medicine; Public Health and General Preventive Medicine
Psychiatry-Adult Addiction Psychiatry; Internal Medicine
(Psychiatry); Neurodevelopmental Disabilities (Psychiatry & Neurology); Psychiatry; Forensic Psychiatry; Psychoanalysis; Geriatric Psychiatry
Psychiatry-Child & Adolescent Child & Adolescent Psychiatry

Michigan Physician Supply and Demand Through 2020 A-5
Chapter 4 Specialty Grouping American Medical Association Specialty Pulmonary Disease Pulmonary Critical Care Medicine; Pulmonary
Disease Radiology Abdominal Radiology; Diagnostic Radiology;
Musculoskeletal Radiology; Nuclear Medicine; Nuclear Radiology; Pediatric Radiology; Radiology; Neuroradiology; Radiation Oncology; Vascular & Interventional Radiology
Rheumatology Rheumatology Surgery (General) General Surgery Thoracic Surgery Thoracic Surgery Urology Urology; Pediatric Urology
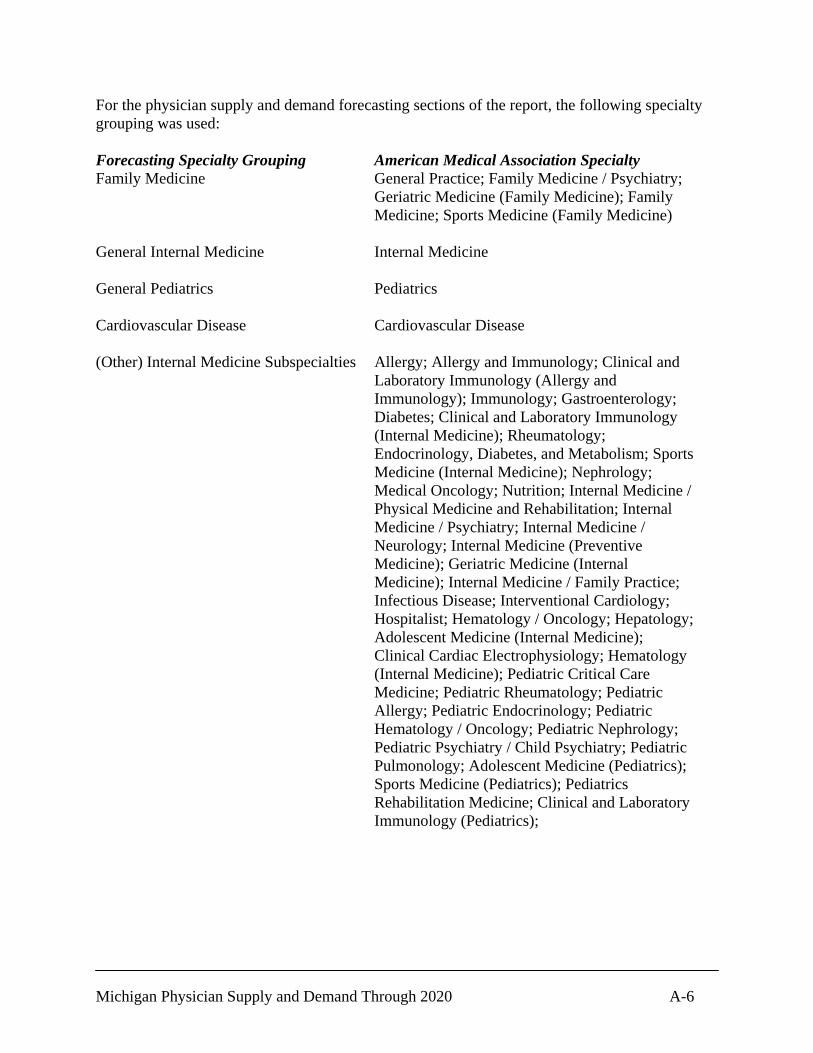
Michigan Physician Supply and Demand Through 2020 A-6
For the physician supply and demand forecasting sections of the report, the following specialty grouping was used: Forecasting Specialty Grouping American Medical Association Specialty Family Medicine General Practice; Family Medicine / Psychiatry;
Geriatric Medicine (Family Medicine); Family Medicine; Sports Medicine (Family Medicine)
General Internal Medicine Internal Medicine General Pediatrics Pediatrics Cardiovascular Disease Cardiovascular Disease (Other) Internal Medicine Subspecialties Allergy; Allergy and Immunology; Clinical and
Laboratory Immunology (Allergy and Immunology); Immunology; Gastroenterology; Diabetes; Clinical and Laboratory Immunology (Internal Medicine); Rheumatology; Endocrinology, Diabetes, and Metabolism; Sports Medicine (Internal Medicine); Nephrology; Medical Oncology; Nutrition; Internal Medicine / Physical Medicine and Rehabilitation; Internal Medicine / Psychiatry; Internal Medicine / Neurology; Internal Medicine (Preventive Medicine); Geriatric Medicine (Internal Medicine); Internal Medicine / Family Practice; Infectious Disease; Interventional Cardiology; Hospitalist; Hematology / Oncology; Hepatology; Adolescent Medicine (Internal Medicine); Clinical Cardiac Electrophysiology; Hematology (Internal Medicine); Pediatric Critical Care Medicine; Pediatric Rheumatology; Pediatric Allergy; Pediatric Endocrinology; Pediatric Hematology / Oncology; Pediatric Nephrology; Pediatric Psychiatry / Child Psychiatry; Pediatric Pulmonology; Adolescent Medicine (Pediatrics); Sports Medicine (Pediatrics); Pediatrics Rehabilitation Medicine; Clinical and Laboratory Immunology (Pediatrics);
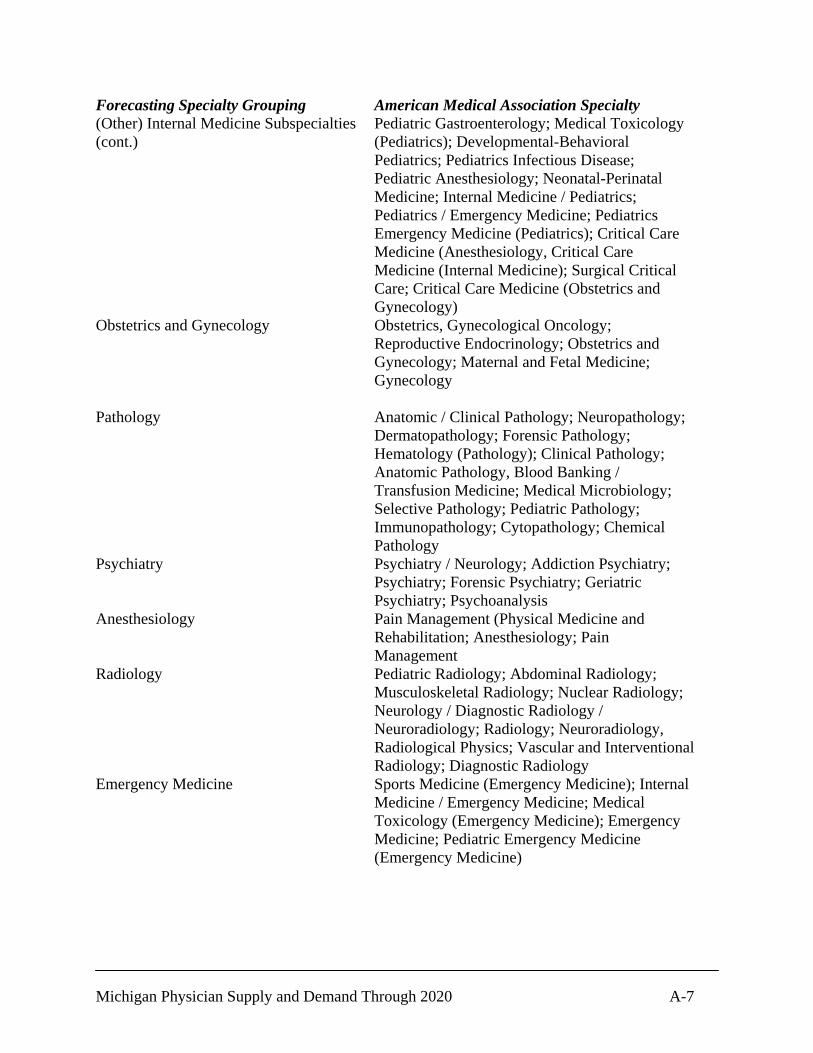
Michigan Physician Supply and Demand Through 2020 A-7
Forecasting Specialty Grouping American Medical Association Specialty (Other) Internal Medicine Subspecialties (cont.)
Pediatric Gastroenterology; Medical Toxicology (Pediatrics); Developmental-Behavioral Pediatrics; Pediatrics Infectious Disease; Pediatric Anesthesiology; Neonatal-Perinatal Medicine; Internal Medicine / Pediatrics; Pediatrics / Emergency Medicine; Pediatrics Emergency Medicine (Pediatrics); Critical Care Medicine (Anesthesiology, Critical Care Medicine (Internal Medicine); Surgical Critical Care; Critical Care Medicine (Obstetrics and Gynecology)
Obstetrics and Gynecology Obstetrics, Gynecological Oncology; Reproductive Endocrinology; Obstetrics and Gynecology; Maternal and Fetal Medicine; Gynecology
Pathology Anatomic / Clinical Pathology; Neuropathology;
Dermatopathology; Forensic Pathology; Hematology (Pathology); Clinical Pathology; Anatomic Pathology, Blood Banking / Transfusion Medicine; Medical Microbiology; Selective Pathology; Pediatric Pathology; Immunopathology; Cytopathology; Chemical Pathology
Psychiatry Psychiatry / Neurology; Addiction Psychiatry; Psychiatry; Forensic Psychiatry; Geriatric Psychiatry; Psychoanalysis
Anesthesiology Pain Management (Physical Medicine and Rehabilitation; Anesthesiology; Pain Management
Radiology Pediatric Radiology; Abdominal Radiology; Musculoskeletal Radiology; Nuclear Radiology; Neurology / Diagnostic Radiology / Neuroradiology; Radiology; Neuroradiology, Radiological Physics; Vascular and Interventional Radiology; Diagnostic Radiology
Emergency Medicine Sports Medicine (Emergency Medicine); Internal Medicine / Emergency Medicine; Medical Toxicology (Emergency Medicine); Emergency Medicine; Pediatric Emergency Medicine (Emergency Medicine)
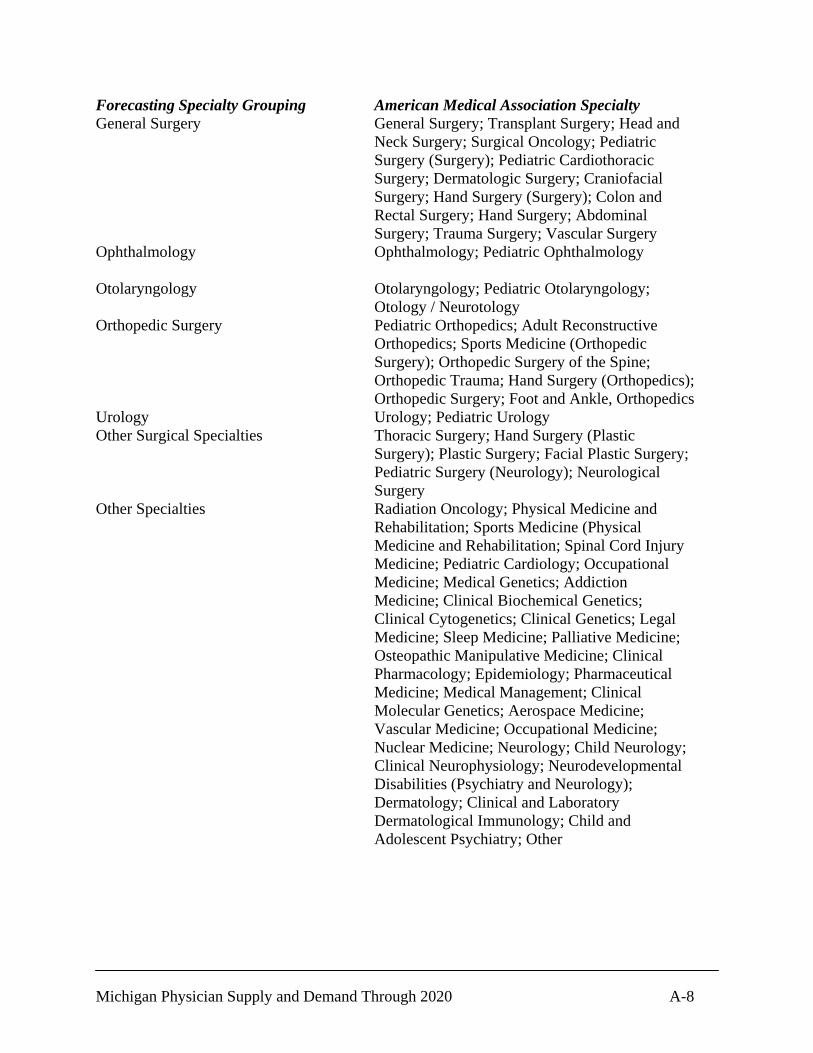
Michigan Physician Supply and Demand Through 2020 A-8
Forecasting Specialty Grouping American Medical Association Specialty General Surgery General Surgery; Transplant Surgery; Head and
Neck Surgery; Surgical Oncology; Pediatric Surgery (Surgery); Pediatric Cardiothoracic Surgery; Dermatologic Surgery; Craniofacial Surgery; Hand Surgery (Surgery); Colon and Rectal Surgery; Hand Surgery; Abdominal Surgery; Trauma Surgery; Vascular Surgery
Ophthalmology Ophthalmology; Pediatric Ophthalmology Otolaryngology Otolaryngology; Pediatric Otolaryngology;
Otology / Neurotology Orthopedic Surgery Pediatric Orthopedics; Adult Reconstructive
Orthopedics; Sports Medicine (Orthopedic Surgery); Orthopedic Surgery of the Spine; Orthopedic Trauma; Hand Surgery (Orthopedics); Orthopedic Surgery; Foot and Ankle, Orthopedics
Urology Urology; Pediatric Urology Other Surgical Specialties Thoracic Surgery; Hand Surgery (Plastic
Surgery); Plastic Surgery; Facial Plastic Surgery; Pediatric Surgery (Neurology); Neurological Surgery
Other Specialties Radiation Oncology; Physical Medicine and Rehabilitation; Sports Medicine (Physical Medicine and Rehabilitation; Spinal Cord Injury Medicine; Pediatric Cardiology; Occupational Medicine; Medical Genetics; Addiction Medicine; Clinical Biochemical Genetics; Clinical Cytogenetics; Clinical Genetics; Legal Medicine; Sleep Medicine; Palliative Medicine; Osteopathic Manipulative Medicine; Clinical Pharmacology; Epidemiology; Pharmaceutical Medicine; Medical Management; Clinical Molecular Genetics; Aerospace Medicine; Vascular Medicine; Occupational Medicine; Nuclear Medicine; Neurology; Child Neurology; Clinical Neurophysiology; Neurodevelopmental Disabilities (Psychiatry and Neurology); Dermatology; Clinical and Laboratory Dermatological Immunology; Child and Adolescent Psychiatry; Other

