the effects of prolonged fasting on glucose metabolism and
TRANSCRIPT

Diplomarbeit
The effects of prolonged fasting on glucose metabolism
and hormonal regulation in people with type 1 diabetes
eingereicht von
Hakan Yildirim
zur Erlangung des akademischen Grades
Doktor der gesamten Heilkunde
(Dr. med. univ.)
an der
Medizinischen Universität Graz
ausgeführt an der
Universitätsklinik für Innere Medizin
Klinische Abteilung für Endokrinologie und Diabetologie
unter der Anleitung von
Prof. Dr. Othmar Moser
und
Dr.scient.med. Norbert Tripolt, BSc MSc
Graz, am 28.06.2021

i
Eidesstattliche Erklärung
Ich erkläre ehrenwörtlich, dass ich die vorliegende Arbeit selbstständig und ohne fremde
Hilfe verfasst habe, andere als die angegebenen Quellen nicht verwendet habe und die den
benutzten Quellen wörtlich oder inhaltlich entnommenen Stellen als solche kenntlich
gemacht habe.
Graz, am 28.06.2021 Hakan Yildirim eh.

ii
Danksagungen
Zuallererst möchte ich mich sowohl bei meinen Diplomarbeitsbetreuern als auch den
Mitarbeiterinnen/Mitarbeitern des Klinischen Studienzentrums der Medizinischen
Universität Graz, als auch den Teilnehmerinnen/Teilnehmern der Studie bedanken, mit
deren Hilfe die zugrundeliegende Studie durchgeführt wurde. Insbesondere Prof. Dr.
Othmar Moser war mir wissenschaftlich als auch menschlich eine große Hilfe und verstand
es mein Interesse für die wissenschaftliche Arbeit zu wecken.
Mein Dank gilt außerdem den Personen in meinem privaten und persönlichen Umfeld; in
den fordernden Zeiten während des Medizinstudiums und der Erstellung meiner
Diplomarbeit hat mich besonders meine Verlobte, Büsra Öylü, unterstützt und motiviert.
Vieles habe ich ihrem guten Zuspruch und ihren Ratschlägen zu verdanken.
Nicht zuletzt bin ich meiner lieben Familie und hier insbesondere meinen Eltern, Ayhan
und Sema Yildirim, dankbar. Sie waren es, die mich schulisch, akademisch und
menschlich gefördert haben.
iii
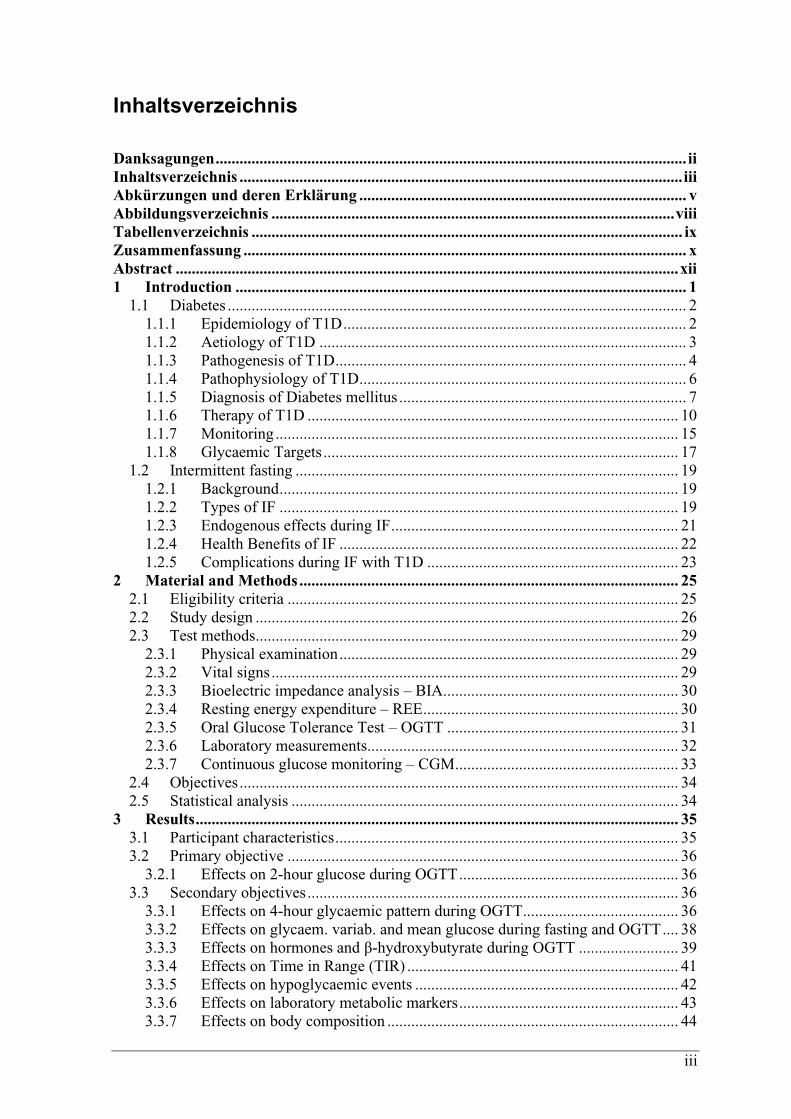
Inhaltsverzeichnis
Danksagungen ...................................................................................................................... ii Inhaltsverzeichnis ............................................................................................................... iii
Abkürzungen und deren Erklärung .................................................................................. v Abbildungsverzeichnis ..................................................................................................... viii Tabellenverzeichnis ............................................................................................................ ix Zusammenfassung ............................................................................................................... x Abstract .............................................................................................................................. xii
1 Introduction ................................................................................................................. 1 1.1 Diabetes ................................................................................................................... 2
1.1.1 Epidemiology of T1D ...................................................................................... 2 1.1.2 Aetiology of T1D ............................................................................................ 3 1.1.3 Pathogenesis of T1D ........................................................................................ 4 1.1.4 Pathophysiology of T1D .................................................................................. 6 1.1.5 Diagnosis of Diabetes mellitus ........................................................................ 7 1.1.6 Therapy of T1D ............................................................................................. 10
1.1.7 Monitoring ..................................................................................................... 15
1.1.8 Glycaemic Targets ......................................................................................... 17 1.2 Intermittent fasting ................................................................................................ 19
1.2.1 Background .................................................................................................... 19
1.2.2 Types of IF .................................................................................................... 19 1.2.3 Endogenous effects during IF ........................................................................ 21
1.2.4 Health Benefits of IF ..................................................................................... 22 1.2.5 Complications during IF with T1D ............................................................... 23
2 Material and Methods ............................................................................................... 25 2.1 Eligibility criteria .................................................................................................. 25
2.2 Study design .......................................................................................................... 26 2.3 Test methods.......................................................................................................... 29
2.3.1 Physical examination ..................................................................................... 29
2.3.2 Vital signs ...................................................................................................... 29 2.3.3 Bioelectric impedance analysis – BIA........................................................... 30
2.3.4 Resting energy expenditure – REE ................................................................ 30 2.3.5 Oral Glucose Tolerance Test – OGTT .......................................................... 31
2.3.6 Laboratory measurements.............................................................................. 32
2.3.7 Continuous glucose monitoring – CGM ........................................................ 33
2.4 Objectives .............................................................................................................. 34 2.5 Statistical analysis ................................................................................................. 34
3 Results ......................................................................................................................... 35 3.1 Participant characteristics ...................................................................................... 35 3.2 Primary objective .................................................................................................. 36
3.2.1 Effects on 2-hour glucose during OGTT ....................................................... 36 3.3 Secondary objectives ............................................................................................. 36
3.3.1 Effects on 4-hour glycaemic pattern during OGTT....................................... 36 3.3.2 Effects on glycaem. variab. and mean glucose during fasting and OGTT .... 38 3.3.3 Effects on hormones and β-hydroxybutyrate during OGTT ......................... 39
3.3.4 Effects on Time in Range (TIR) .................................................................... 41 3.3.5 Effects on hypoglycaemic events .................................................................. 42
3.3.6 Effects on laboratory metabolic markers ....................................................... 43 3.3.7 Effects on body composition ......................................................................... 44

iv
3.3.8 Effects on REE and metabolisation of macromolecules ............................... 46 3.3.9 Comparison of daytime and nighttime .......................................................... 47
3.3.10 Relevance of Total Daily Basal Dose (TDBD) ............................................. 50 3.3.11 Pre-OGTT bolus insulin dose ........................................................................ 51
4 Discussion ................................................................................................................... 52 4.1 Plasma glucose courses after breaking prolonged fasting ..................................... 52 4.2 Role of endocrine hormones.................................................................................. 53
4.3 Glycaemia during the fasting period ..................................................................... 53 4.4 Risk for hypoglycaemia during and after prolonged fasting ................................. 54 4.5 Impact on metabolism of specific macromolecules .............................................. 55 4.6 Intermittent fasting and weight loss ...................................................................... 56 4.7 Laboratory differences after prolonged fasting ..................................................... 56
4.8 Circadian variation in glycaemia & nocturnal hypoglycaemia ............................. 57 4.9 Relevance of TDBD in hypoglycaemia................................................................. 57 4.10 Selective reductions of basal insulin rates in CSII ................................................ 58
4.11 Amount of bolus insulin when breaking the fast ................................................... 58 4.12 Limitations of this study ........................................................................................ 59
5 Conclusion .................................................................................................................. 60 Literaturverzeichnis .......................................................................................................... 61
Anhang ................................................................................................................................ 75
v
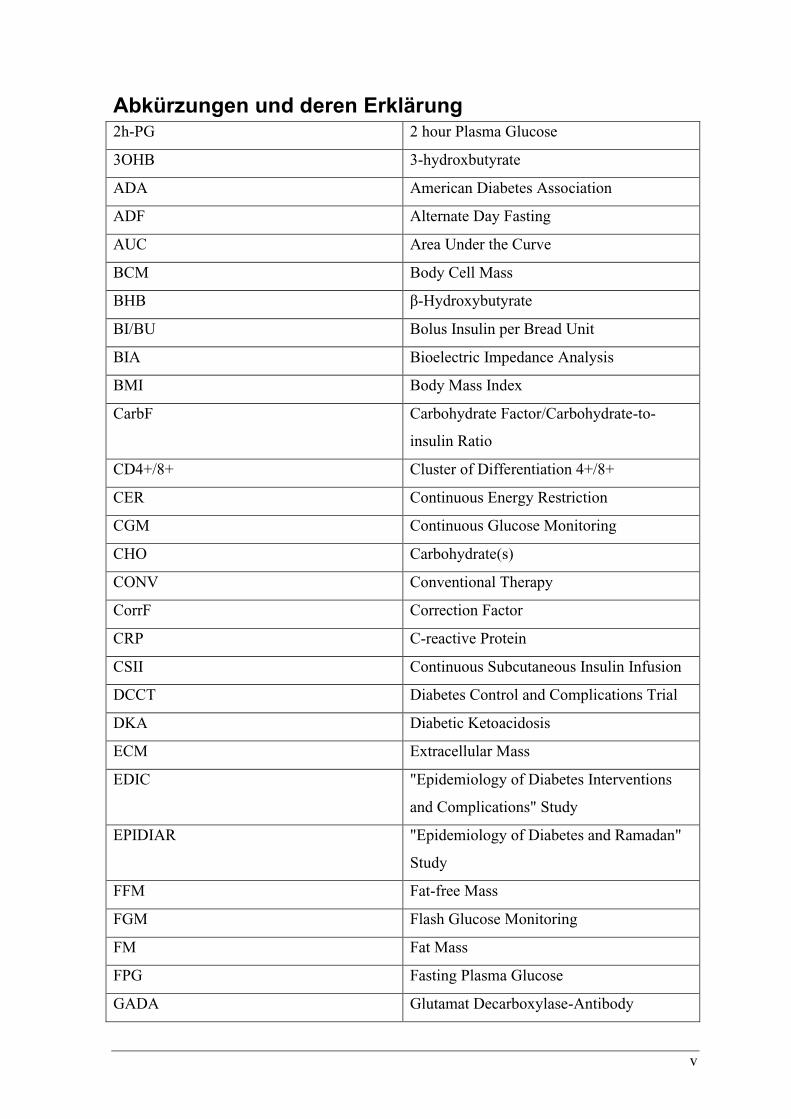
Abkürzungen und deren Erklärung 2h-PG 2 hour Plasma Glucose
3OHB 3-hydroxbutyrate
ADA American Diabetes Association
ADF Alternate Day Fasting
AUC Area Under the Curve
BCM Body Cell Mass
BHB β-Hydroxybutyrate
BI/BU Bolus Insulin per Bread Unit
BIA Bioelectric Impedance Analysis
BMI Body Mass Index
CarbF Carbohydrate Factor/Carbohydrate-to-
insulin Ratio
CD4+/8+ Cluster of Differentiation 4+/8+
CER Continuous Energy Restriction
CGM Continuous Glucose Monitoring
CHO Carbohydrate(s)
CONV Conventional Therapy
CorrF Correction Factor
CRP C-reactive Protein
CSII Continuous Subcutaneous Insulin Infusion
DCCT Diabetes Control and Complications Trial
DKA Diabetic Ketoacidosis
ECM Extracellular Mass
EDIC "Epidemiology of Diabetes Interventions
and Complications" Study
EPIDIAR "Epidemiology of Diabetes and Ramadan"
Study
FFM Fat-free Mass
FGM Flash Glucose Monitoring
FM Fat Mass
FPG Fasting Plasma Glucose
GADA Glutamat Decarboxylase-Antibody

vi
glyc. var. Glycaemic Variability
HDL High-Density Lipoprotein
HIV Human Immunodeficiency Virus
HLA Human Leukocyte Antigen
HOMA-IR Homeostatic Model Assessment of Insulin
Resistance
IA-2A Islet Antigen-2-Antibody
IAA Insulin Autoantibody
iCGM intermittently-scanned Continuous Glucose
Monitoring
IDDM Insulin-dependent Diabetes Mellitus
IDF International Diabetes Federation
IF Intermittent Fasting
IGF-1 Insulinlike Growth Factor-1
IL-6 Interleukin-6
INT Intensified Therapy
IPAQ International Physical Activity
Questionnaire
IQR Interquartile Range
ISPAD International Society for Paediatric and
Adolescent Diabetes
IU International Unit(s)
LADA Latent Autoimmune Diabetes in Adults
LDL Low-Density Lipoprotein
MDI Multiple Daily Injections
NHS National Health Service
NPH Neutral Protamine Hagedorn
OGTT Oral Glucose Tolerance Test
PG Plasma Glucose
RCPG Rate of Change of Plasma Glucose Levels
REE Resting Energy Expenditure
RMR Resting Metabolic Rate
RQ Respiratory Quotient
vii
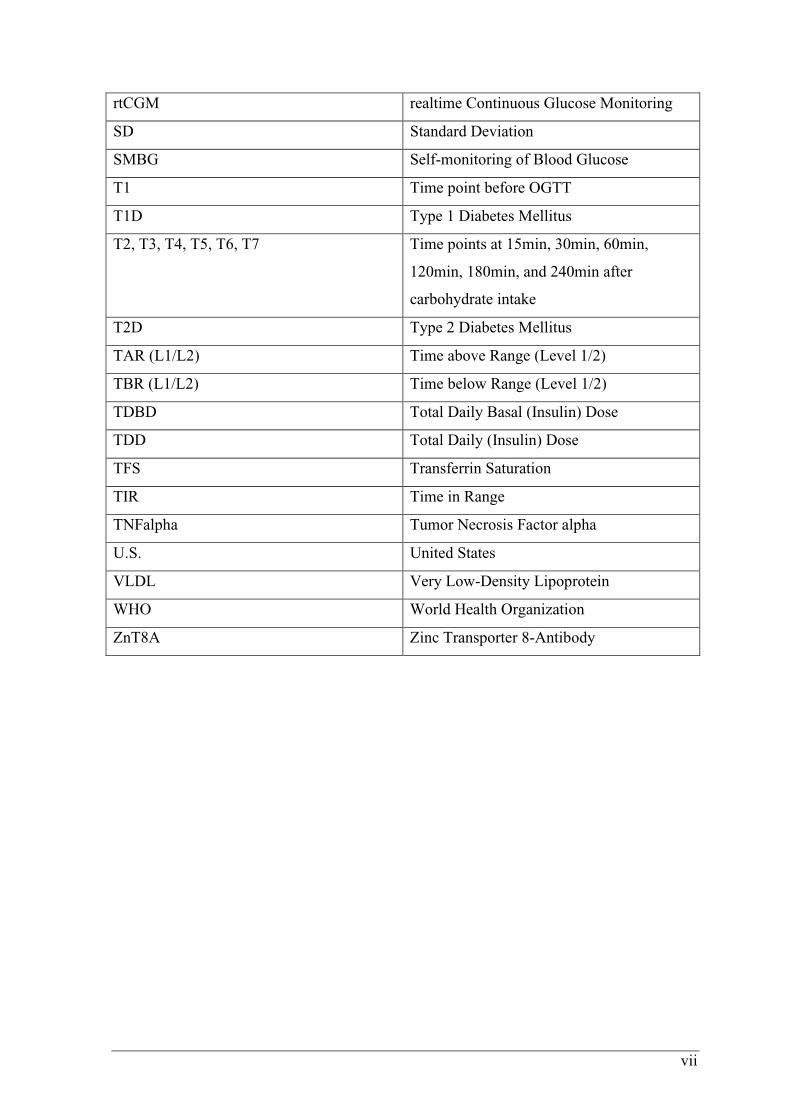
rtCGM realtime Continuous Glucose Monitoring
SD Standard Deviation
SMBG Self-monitoring of Blood Glucose
T1 Time point before OGTT
T1D Type 1 Diabetes Mellitus
T2, T3, T4, T5, T6, T7 Time points at 15min, 30min, 60min,
120min, 180min, and 240min after
carbohydrate intake
T2D Type 2 Diabetes Mellitus
TAR (L1/L2) Time above Range (Level 1/2)
TBR (L1/L2) Time below Range (Level 1/2)
TDBD Total Daily Basal (Insulin) Dose
TDD Total Daily (Insulin) Dose
TFS Transferrin Saturation
TIR Time in Range
TNFalpha Tumor Necrosis Factor alpha
U.S. United States
VLDL Very Low-Density Lipoprotein
WHO World Health Organization
ZnT8A Zinc Transporter 8-Antibody
viii
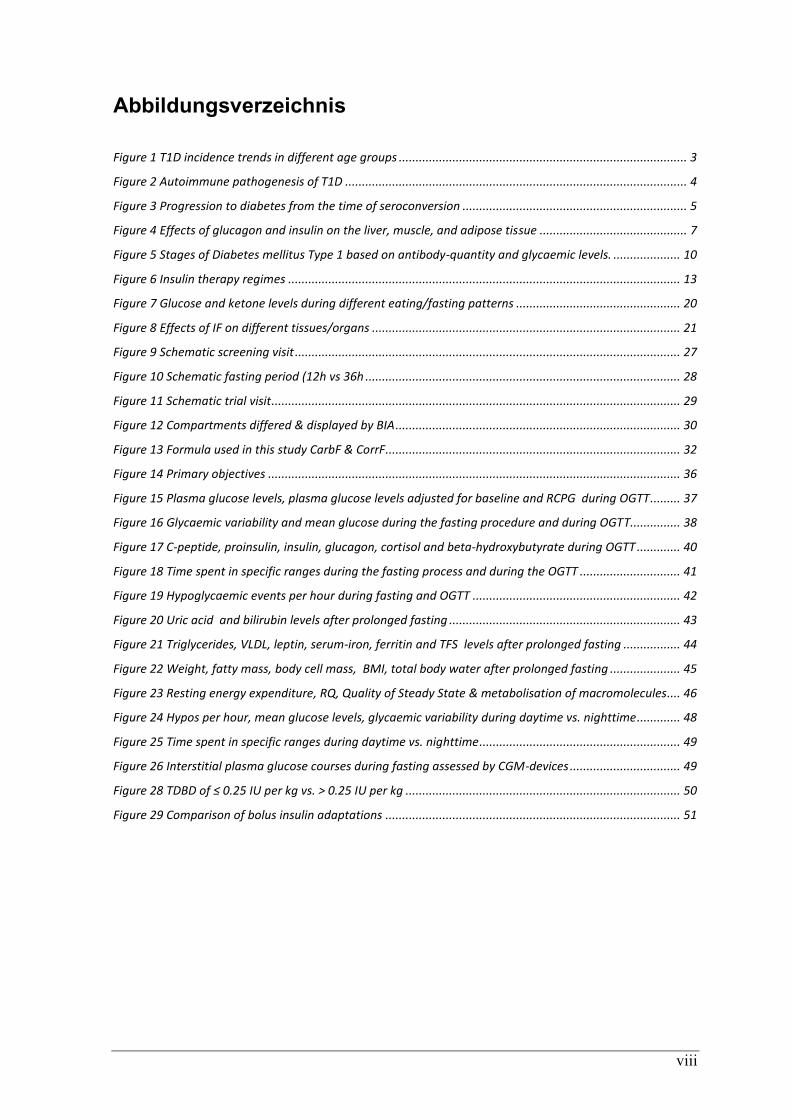
Abbildungsverzeichnis
Figure 1 T1D incidence trends in different age groups ...................................................................................... 3
Figure 2 Autoimmune pathogenesis of T1D ...................................................................................................... 4
Figure 3 Progression to diabetes from the time of seroconversion ................................................................... 5
Figure 4 Effects of glucagon and insulin on the liver, muscle, and adipose tissue ............................................ 7
Figure 5 Stages of Diabetes mellitus Type 1 based on antibody-quantity and glycaemic levels. .................... 10
Figure 6 Insulin therapy regimes ..................................................................................................................... 13
Figure 7 Glucose and ketone levels during different eating/fasting patterns ................................................. 20
Figure 8 Effects of IF on different tissues/organs ............................................................................................ 21
Figure 9 Schematic screening visit ................................................................................................................... 27
Figure 10 Schematic fasting period (12h vs 36h .............................................................................................. 28
Figure 11 Schematic trial visit .......................................................................................................................... 29
Figure 12 Compartments differed & displayed by BIA ..................................................................................... 30
Figure 13 Formula used in this study CarbF & CorrF........................................................................................ 32
Figure 14 Primary objectives ........................................................................................................................... 36
Figure 15 Plasma glucose levels, plasma glucose levels adjusted for baseline and RCPG during OGTT ......... 37
Figure 16 Glycaemic variability and mean glucose during the fasting procedure and during OGTT............... 38
Figure 17 C-peptide, proinsulin, insulin, glucagon, cortisol and beta-hydroxybutyrate during OGTT ............. 40
Figure 18 Time spent in specific ranges during the fasting process and during the OGTT .............................. 41
Figure 19 Hypoglycaemic events per hour during fasting and OGTT .............................................................. 42
Figure 20 Uric acid and bilirubin levels after prolonged fasting ..................................................................... 43
Figure 21 Triglycerides, VLDL, leptin, serum-iron, ferritin and TFS levels after prolonged fasting ................. 44
Figure 22 Weight, fatty mass, body cell mass, BMI, total body water after prolonged fasting ..................... 45
Figure 23 Resting energy expenditure, RQ, Quality of Steady State & metabolisation of macromolecules .... 46
Figure 24 Hypos per hour, mean glucose levels, glycaemic variability during daytime vs. nighttime ............. 48
Figure 25 Time spent in specific ranges during daytime vs. nighttime ............................................................ 49
Figure 26 Interstitial plasma glucose courses during fasting assessed by CGM-devices ................................. 49
Figure 28 TDBD of ≤ 0.25 IU per kg vs. > 0.25 IU per kg .................................................................................. 50
Figure 29 Comparison of bolus insulin adaptations ........................................................................................ 51
ix
Tabellenverzeichnis
Table 1 Diagnostic reference points for T1D ..................................................................................................... 9
Table 2 Types of insulin.................................................................................................................................... 11
Table 3 Estimated average glucose ................................................................................................................ 17
Table 4 Glycemic ranges and targets for CGM-measured values in non-pregnant adults .............................. 18
Table 5 Overview of different intermittent fasting strategies ......................................................................... 19
Table 6 Participant characteristics .................................................................................................................. 35
Table 7 Types of insulin therapy in this study and number of subjects using each therapy form ................... 35
Table 8 Effects on 2-hour glucose during OGTT; primary objectives ............................................................... 36
Table 9 Plasma glucose levels, plasma glucose levels adjusted for baseline and RCPG during OGTT ............. 37
Table 10 Glycaemic variability and mean interstitial glucose levels................................................................ 38
Table 11 C-peptide, proinsulin, insulin, glucagon, cortisol and beta-hydroxybutyrate during OGTT .............. 39
Table 13 Time spent in specific ranges during the fasting process and during the OGTT ............................... 41
Table 14 Hypoglycaemic events standardized per hour during fasting and OGTT .......................................... 42
Table 15 Laboratory metabolic markers.......................................................................................................... 43
Table 16 Body composition at both trial visits before OGTT ........................................................................... 45
Table 17 Spirometry-parameters at both trial visits before OGTT .................................................................. 46
Table 18 Hypos per hour, mean glucose levels, glycaemic variability & TIR during daytime vs. nighttime .... 48
Table 19 p-values of comparisons of Table 18................................................................................................. 48
Table 20 Hypoglycaemic events stratified for TDBD of ≤ 0.25 IU per kg vs. > 0.25 IU per kg .......................... 50
Table 21 Comparison of bolus insulin adaptations .......................................................................................... 51

x
Zusammenfassung Hintergrund: Obwohl bekannt ist, dass Fasten einen positiven Einfluss auf verschiedene
Stoffwechselparameter hat, mangelt es an Informationen über die Auswirkungen von
längerem intermittierendem Fasten auf Personen mit Diabetes mellitus Typ 1 (T1D).
Besonders der Glukosemetabolismus und die hormonelle Regulation nach dem
Fastenbrechen bedürfen gesonderter Aufmerksamkeit, da dies einen kritischen Zeitpunkt in
Bezug auf Dysglykämie darstellt. Daher haben wir die erste Kohlenhydrataufnahme nach
gewöhnlichem nächtlichem Fasten und nach verlängertem Fasten bei Menschen mit T1D
verglichen.
Methoden: In dieser monozentrischen, offenen und Cross-over kontrollierten Studie
wurden Erwachsene mit T1D und folgenden Eigenschaften inkludiert: negatives C-Peptid,
mehrfache tägliche Injektionen (MDI) oder kontinuierliche subkutane Insulininfusion
(CSII), HbA1c <9,5%, T1D Diagnose vor >12 Monaten, stabile Insulintherapie und
Verwendung eines kontinuierlichen Glukoseüberwachungssystems (CGM). Die
Teilnehmer*innen fasteten zunächst 12 Stunden und dann 36 Stunden lang, bevor nach
jedem Fasten ein oraler Glukosetoleranztest (OGTT) mit 75g Kohlenhydraten durchgeführt
wurde. Bei beiden Malen wurde die gleiche Menge Bolusinsulin verabreicht. Blutproben
wurden vor der Kohlenhydrataufnahme und 15min, 30min, 60min, 120min und 240min
danach entnommen. Gemessen wurden Plasmaglukose, C-Peptid, Glukagon, Cortisol und
exogen verabreichtes Insulin. Zusätzliche Laboruntersuchungen, eine Ruhe-Spirometrie
und eine bioelektrische Impedanzanalyse wurden ebenfalls durchgeführt. Die Daten
wurden mittels gepaarten t-Tests und Mixed-Model-Regression verglichen (p ≤ 0,05).
Ergebnisse: Zwanzig Personen mit T1D (7 Frauen) mit einem mittleren Alter von 35±11
Jahren (Arithmetisches Mittel ± Standardabweichung), einem Body-Mass-Index (BMI)
von 24,8±2,8 kg/m2, einem HbA1c-Wert von 7,1±0,6%, einer Diabetesdauer von 20±11
Jahren und einer täglichen Gesamtdosis (TDD) von 40±14 IE Insulin nahmen an dieser
Studie teil. Elf Teilnehmer*innen verwendeten eine MDI-Therapie, während 9
Teilnehmer*innen mit CSII behandelt wurden. Primär waren der mittlere
Plasmaglukosewert nach 120 Minuten des OGTTs (308 ± 91 mg/dL vs. 313 ± 71 mg/dL; p
= 0,73) und die „Area under the Curve“ der Plasmaglukosespiegel während der ersten 120
Minuten des OGTT (31823 ± 8557 vs. 29957 ± 5826; p = 0,21) nach 12h und 36h Fasten

xi
vergleichbar. Sekundär waren die Plasmaglukoseverläufe (p = 0,68) und die entsprechende
Änderungsrate (p = 0,44) beim 12-stündigen und 36-stündigen Fasten ähnlich. Im
Vergleich zum Ausgangswert zeigte sich das Körpergewicht nach verlängertem Fasten
signifikant niedriger (76,7 ± 13,5 kg vs. 75,4 ± 13,4 kg; p = 0,0002). Während des
verlängerten Fastens hatten Teilnehmer*innen mit einer täglichen Gesamtbasaldosis
(TDBD) von über 0,25 IE Insulin pro kg Körpergewicht signifikant mehr Hypoglykämien
als die Vergleichsgruppe mit ≤ 0.25 IE/kg KG (1.3 ± 0.9 vs. 2.5 ± 0.9 Hypoglykämien; p =
0.009).
Schlussfolgerung: Einmaliges verlängertes Fasten führte bei den teilnehmenden Personen
mit T1D zur gewünschten Gewichtsabnahme. Plasmaglukoseverläufe und (Dys-)Glykämie
nach der ersten hohen Kohlenhydrataufnahme zeigten keine statistischen Unterschiede
nach 36-stündigem Fasten im Vergleich zu 12-stündigem Fasten. Daher sind Anpassungen
der Bolusinsulin-Dosis nach längerem Fasten nicht zwingend erforderlich. Vielmehr sollte
bei Menschen mit T1D die tägliche Gesamtbasaldosis evaluiert werden, bevor sie
verlängert Fasten.
xii
Abstract Background: Although fasting has been shown to improve several metabolic parameters,
there is little information about the effects of prolonged intermittent fasting on individuals
with type 1 diabetes mellitus (T1D). Especially glucose metabolism and hormonal
regulation after breaking the prolonged fast need particular attention as this presents a
critical moment. Therefore, we compared the first carbohydrate intake after overnight
fasting and after prolonged fasting in people with T1D.
Methods: In this monocentric, open-label and cross-over controlled trial, adults with T1D,
negative C-peptide, treated with multiple daily injections (MDI) or continuous
subcutaneous insulin infusion (CSII), HbA1c <9.5%, diagnosis >12 months ago, stable
insulin therapy, and using a form of continuous glucose monitoring system (CGM) were
included. Participants first fasted for 12 hours and then for 36 hours before undergoing an
75gr oral glucose tolerance Test (OGTT) after every fast. Same amount of bolus insulin
was administered at both trial visits. Blood samples were taken before carbohydrate intake
and 15min, 30min, 60min, 120min and 240min afterwards. Plasma glucose, C-peptide,
glucagon, cortisol, and exogenous insulin levels were measured. Additional laboratory
measurements, resting spirometry and bioelectric impedance analysis were also performed.
Data were compared via paired t-tests and mixed-model regressions (p ≤ 0.05).
Results: Twenty individuals with T1D (7 females) with a mean ± SD age of 35±11 years,
body mass index (BMI) 24.8±2.8 kg/m2, HbA1c 7.1±0.6% (54±7 mmol/mol), diabetes
duration of 20±11 years, and total daily dose (TDD) of 40±14 IU insulin finished the trial.
Eleven participants used MDI therapy, while 9 participants were treated with CSII.
Primarily, mean glucose at the 120th minute of OGTT (308 ± 91 mg/dL vs. 313 ± 71
mg/dL; p = 0.73), and area under the curve of plasma glucose levels during the first 120
minutes of OGTT (31823 ± 8557 vs. 29957 ± 5826; p = 0.21) were comparable after 12h
and 36h fasting. Secondarily, plasma glucose courses (p = 0.68) and corresponding rate of
change (p = 0.44) were also similar in both trial arms. Compared to baseline, bodyweight
was significantly lower after prolonged fasting (76.7 ± 13.5 kg vs. 75.4 ± 13.4 kg; p =
0.0002). During prolonged fasting, participants with a total daily basal dose (TDBD)
greater than 0.25 IU insulin per kg body weight had significantly more hypoglycaemic
events than the comparison group with ≤ 0.25 IU/kg (1.3 ± 0.9 vs. 2.5 ± 0.9 events; p =
0.009).
xiii
Conclusion: Single prolonged fasting led to desired weight loss in people with T1D
participating in this study. Plasma glucose courses and (dys-)glycaemia after the first high
carbohydrate intake presented no statistical differences after 36h fasting compared to 12h
fasting. Therefore, adjustments in bolus insulin application are not needed after prolonged
fasting. Instead, TDBD should be evaluated before people with T1D start prolonged fasting
periods.

1
1 Introduction
Diabetes mellitus is a heterogeneous group of metabolic disorders resulting in chronic
hyperglycaemia. Literally, “diabetes mellitus” means “honey-sweet flow” which is
describing the glycosuria and the polyuria diabetics have induced by hyperglycaemia.
These disorders are mainly classified by aetiology forming different entities: over 90% of
the individuals with diabetes have type 2 diabetes (T2D), while about 5% have type 1
diabetes (T1D). (1–3)
While research is investigating the pathophysiology of diabetes and current technology
improves glucose management, people with diabetes still see themselves confronted with
daily life problems, such as nutrition, glucose monitoring, physical activity/exercise, blood
glucose fluctuations and worries about acute or chronic complications (4). All these factors
are even more predominant when individuals with diabetes tend to fast. Given the fact, that
fasting has beneficial effects on various metabolic and health-related markers, one might
assume that especially people with T1D could profit from caloric restriction. On the other
hand, T1D presents a high potency for dysglycaemia during fasting periods. Some
researchers, therefore, consider people with T1D in a very high-risk group and recommend
health-care providers to prevent prolonged fasting (5). However, the International Society
for Paediatric and Adolescent Diabetes (ISPAD) published a guideline for fasting during
Ramadan, which supports children and adolescents with T1D during the fasting period (6).
Similarly, The Lancet published commentaries rethinking strict hypoglycaemia risk
classification in this population (7). Nevertheless, both state that further research is
required in this field.
Especially during Ramadan, the holy month where Muslims practice intermittent daily
fasting for one month, the fasting capability of people with diabetes is often researched.
Most of these studies analyse the compliance of the individuals, the capability to fast, the
glycaemic complications and/or the benefits of pre-Ramadan diabetes education. However,
none of these focuses on the effects of fasting on glucose metabolism and hormonal
regulation in people with T1D during the fast and after first high-caloric intake. Facing the
fact, that glycogen storages are depleted during prolonged fasting, we hypothesize that
insulin sensitivity might increase. Eventually, this could result in hypoglycaemia when
breaking the fast, if bolus insulin dose is not reduced adequately. Therefore, the aim of this
study was to gain more knowledge about the glycaemic and hormonal processes in people
with T1D during and after a prolonged fast by performing an Oral Glucose Tolerance Test.

2
1.1 Diabetes
1.1.1 Epidemiology of T1D
1.1.1.1 Global and regional prevalence and incidence
Several studies in the past affirmed an increase of incidence and prevalence of diabetes in
general (8,9). However, because of the fact, that about 90% of people with diabetes have
T2D and only about 5% have T1D, it is important to differ between these types (1,10).
Otherwise the observed data will be more representative about T2D, which has different
aetiology, therapy and outcomes than T1D.
In 2019, the International Diabetes Federation published the ninth edition of the Diabetes
Atlas presenting the global and regional development on this topic. It is estimated that T1D
is prevalent in 1.1 million of globally 2.58 billion children and adolescents up to 19 years.
About 27% of them live in Europe (including Russia) and 20% of them in North America
(including the Caribbean). (9)
Incidence rates from the same age group are rising about 3% annually. Currently 128.900
children and adolescents are diagnosed with T1D worldwide and every year. Among all the
regions analysed Europe has the highest incidence rates of T1D with 31.100 new cases per
year. In terms of incidence, especially northern countries like Sweden, Finland and
Norway are in the top five worldwide. (9,11,12)
Unfortunately, individuals with T1D older than 19 years are not mentioned in IDF’s
Diabetes Atlas. For this purpose, Bullard et al. performed an interview survey in 2016 to
estimate the prevalence by type in U.S. adults. T1D had an estimated prevalence of 0.55%
resulting in 1.3 million U.S. adults ≥ 18 years (10). Back then the 8th edition of the IDF
Diabetes Atlas stated that 169.860 U.S. children and adolescents up to 19 years had T1D
(13). This comparison shows the big gap of missing prevalence of T1D in most of the
presented epidemiologic data.
1.1.1.2 Austria
Due to a lack of a national diabetes register, the prevalence of T1D in Austria can only be
estimated by using the IDF Diabetes Atlas and the Austrian diabetes incidence register.
Between 1989 and 2017 a total of 4356 (94.2%) children < 15years got diagnosed with
T1D, while only 83 (1.8%) got diagnosed with T2D and 185 (4%) had different specific
types of diabetes. This is an example of the predominance of T1D in young ages. (14,15)
Until 2017 the incidence rates of T1D increased annually about 4% except in the group of
0 to 4-year-old children, where the incidence rates even decreased from 2007 onwards.
3
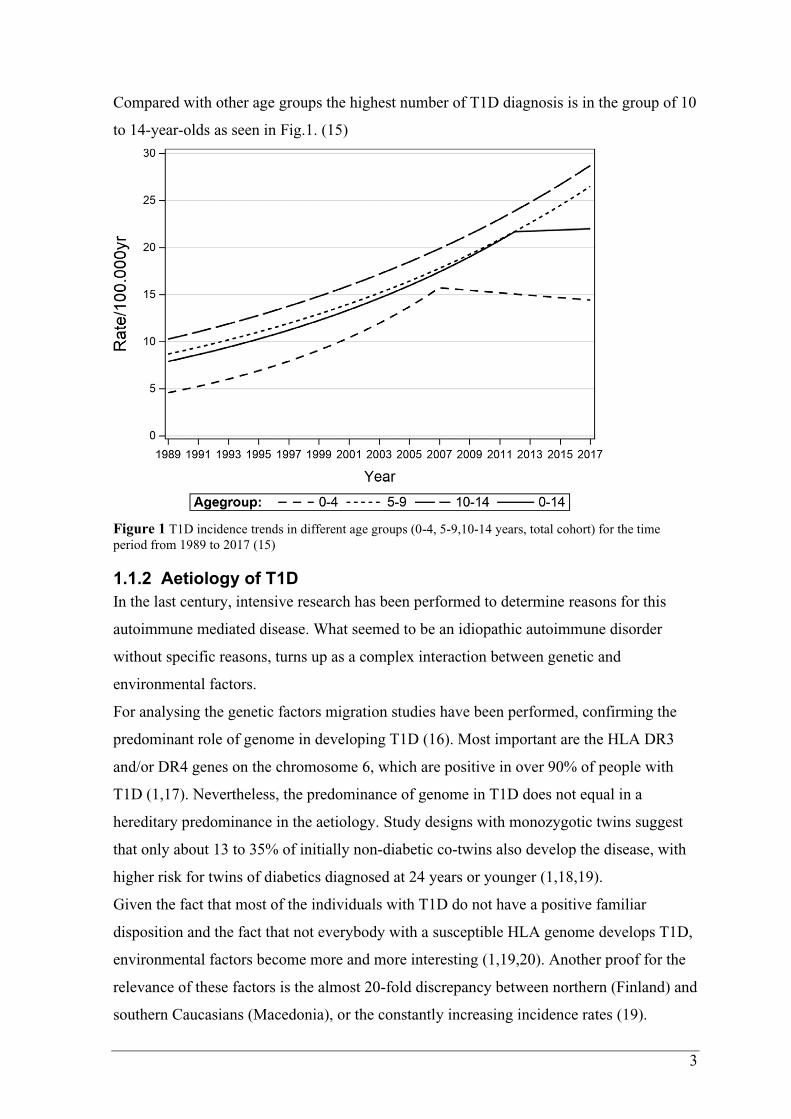
Compared with other age groups the highest number of T1D diagnosis is in the group of 10
to 14-year-olds as seen in Fig.1. (15)
Figure 1 T1D incidence trends in different age groups (0-4, 5-9,10-14 years, total cohort) for the time
period from 1989 to 2017 (15)
1.1.2 Aetiology of T1D
In the last century, intensive research has been performed to determine reasons for this
autoimmune mediated disease. What seemed to be an idiopathic autoimmune disorder
without specific reasons, turns up as a complex interaction between genetic and
environmental factors.
For analysing the genetic factors migration studies have been performed, confirming the
predominant role of genome in developing T1D (16). Most important are the HLA DR3
and/or DR4 genes on the chromosome 6, which are positive in over 90% of people with
T1D (1,17). Nevertheless, the predominance of genome in T1D does not equal in a
hereditary predominance in the aetiology. Study designs with monozygotic twins suggest
that only about 13 to 35% of initially non-diabetic co-twins also develop the disease, with
higher risk for twins of diabetics diagnosed at 24 years or younger (1,18,19).
Given the fact that most of the individuals with T1D do not have a positive familiar
disposition and the fact that not everybody with a susceptible HLA genome develops T1D,
environmental factors become more and more interesting (1,19,20). Another proof for the
relevance of these factors is the almost 20-fold discrepancy between northern (Finland) and
southern Caucasians (Macedonia), or the constantly increasing incidence rates (19).

4
Dietary factors (such as Vitamin D, bovine milk in the first year of life, gluten), gut
microbiome, viral infections and other environmental factors are discussed and researched
to trigger mechanisms in the pathogenesis of T1D (2,17,19). In summary T1D is a result of
a complex interplay of genetic, environmental/epigenetic, immunological and idiopathic
factors.
1.1.3 Pathogenesis of T1D
Some of the most important hormones are produced in the pancreatic cells: Those are
glucagon, which is produced in the alpha-cells, and insulin, which is produced in the beta-
cells, and somatostatin, which is produced in the delta-cells of the pancreas. In the case of
T1D, the beta cells become victim to an autoimmune inflammation resulting in an insulitis.
If 80% of the beta cells are destroyed, the plasma glucose is pathologically rising. (1)
This inflammation is mainly
caused by autoreactive CD8+
T-lymphocytes emigrating
into the pancreatic islets,
where they lyse beta cells. It
is assumed that the
autoreactivity is initiated by
antigen-presenting cells
presenting beta-cell antigens
to CD4+ T-lymphocytes. In
the next step, B-lymphocytes
are also activated and start
producing autoantibodies.
These antibodies can be
detected in the peripheral
blood, being a biomarker of
the autoimmune process of
T1D. (17)
Ultimately both the adaptive (T- and B-lymphocytes) and the innate (macrophages,
neutrophil granulocytes, and natural killer cells) immune system maintain the
Figure 2 Autoimmune pathogenesis of T1D (17)
5
inflammation. While all of these inflammatory processes are aggravated, the regulatory T-
lymphocytes and their protective function seem to be defect. (17)
For quantifying the autoimmune inflammation, the antibodies in the circulating blood
against specific beta-cell antigens are measured. These antigens (with the corresponding
autoantibody) are insulin (IAA), islet-antigen 2 (IA-2A), zinc-transporter 8 (ZnT8A),
glutamate decarboxylase (GADA). Over 90% of people with T1D are seropositive to one
or more of these antibodies. Especially GADA and IA-2A are used as biomarkers for
progression. (1,2,17)
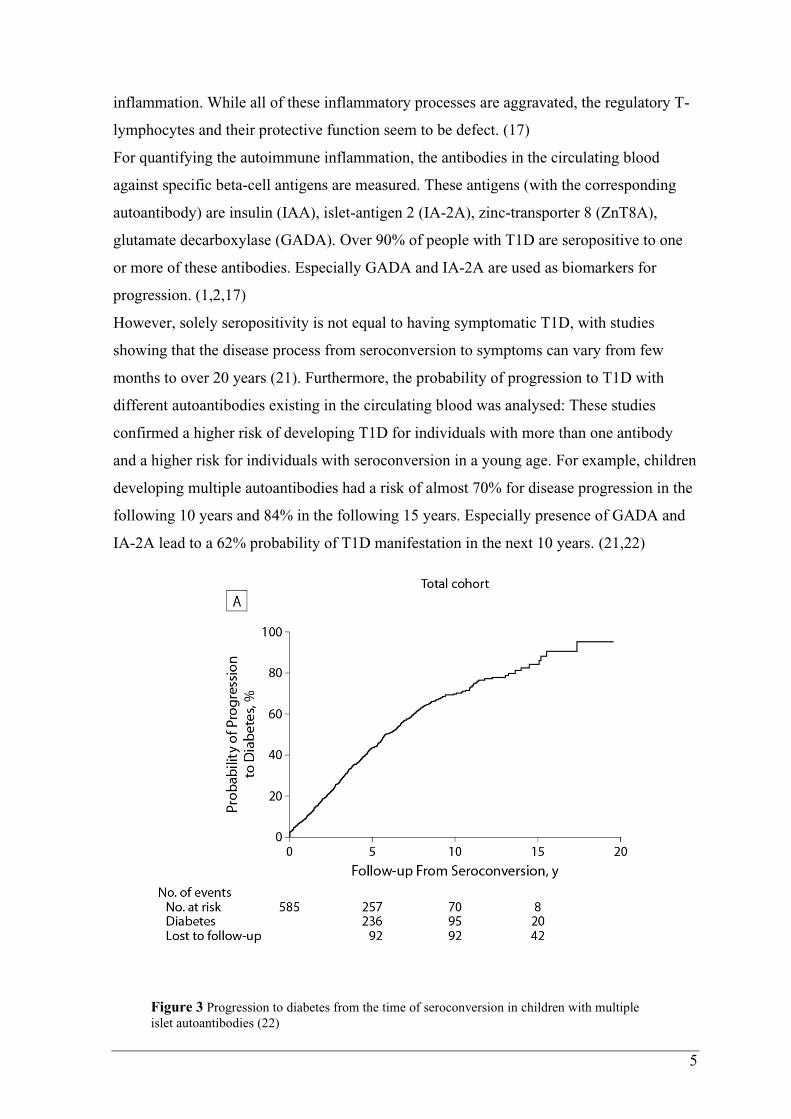
However, solely seropositivity is not equal to having symptomatic T1D, with studies
showing that the disease process from seroconversion to symptoms can vary from few
months to over 20 years (21). Furthermore, the probability of progression to T1D with
different autoantibodies existing in the circulating blood was analysed: These studies
confirmed a higher risk of developing T1D for individuals with more than one antibody
and a higher risk for individuals with seroconversion in a young age. For example, children
developing multiple autoantibodies had a risk of almost 70% for disease progression in the
following 10 years and 84% in the following 15 years. Especially presence of GADA and
IA-2A lead to a 62% probability of T1D manifestation in the next 10 years. (21,22)
Figure 3 Progression to diabetes from the time of seroconversion in children with multiple
islet autoantibodies (22)

6
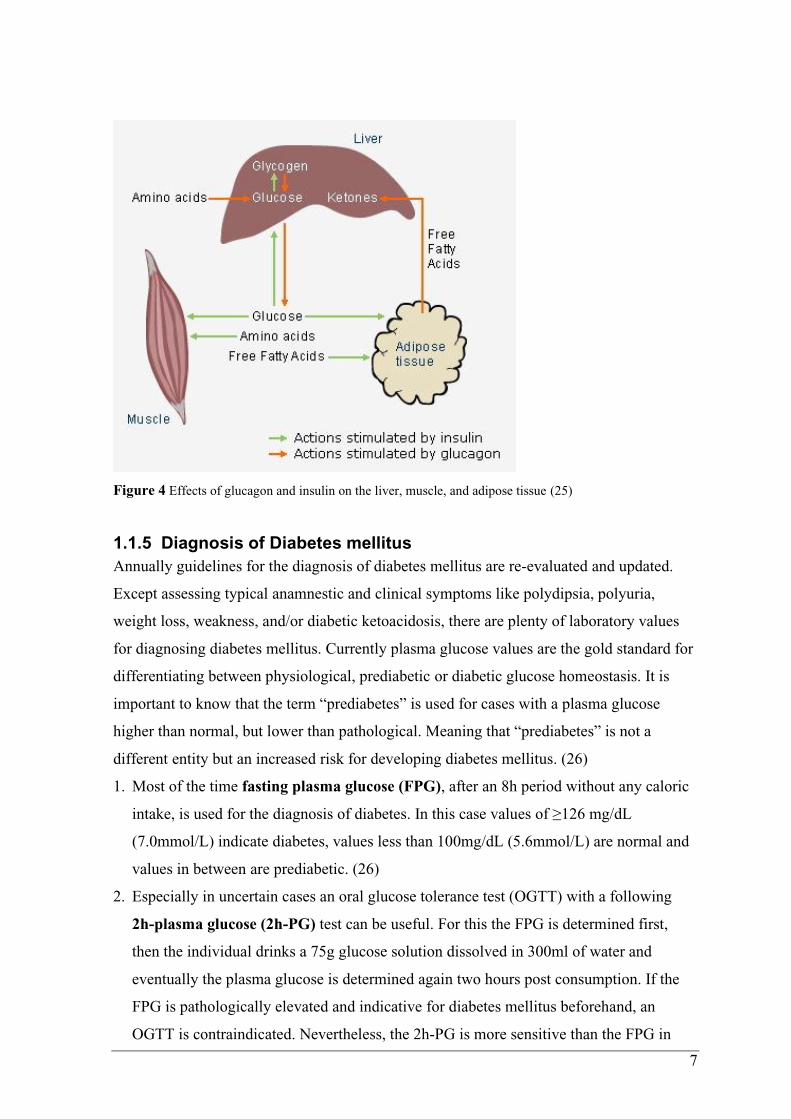
1.1.4 Pathophysiology of T1D
To understand the pathological processes in T1D and insulin deficiency, the metabolic
functions of insulin are important to know. In general, insulin is an anabolic hormone
produced in the beta-cells of the pancreas, while the catabolic antagonist glucagon is
produced in the alpha-cells. Besides of glucagon also catecholamines and cortisol have
catabolic effects on the glucose metabolism. In healthy people, these hormones are in
balance maintaining a normoglycemic level. However, in T1D there is a lack of insulin,
which not only acts anabolic, but also inhibits the catabolic glucagon.
For maintaining glycaemic balance, insulin acts on different receptors, mainly in liver,
muscle cells, and adipose tissue. In the liver, insulin increases glycogen-synthesis out of
glucose and simultaneously decreases hepatic glycogenolysis and gluconeogenesis; this
results in increased glucose-storage and decreased glucose production in the liver. In
muscular and adipose tissue, insulin stimulates the uptake of glucose for intracellular
metabolism and storage to reduce the plasma glucose levels. In the case of insulin
deficiency, these mechanisms lack regulation. As a result, hepatic gluconeogenesis and
glycogenolysis continuously produce glucose, while peripheral utilization is reduced due to
missing intracellular uptake. This imbalance leads to hyperglycaemic plasma glucose
levels. If the plasma glucose levels exceed ~180mg/dL the kidneys are unable to hold back
the glucose and hence glucosuria begins. Since glucose is hyperosmolar also electrolytes
and water are drained out. Eventually, individuals with uncontrolled insulin-dependent
diabetes mellitus (IDDM) present a hyperglycaemic, exsiccated, thirsty and physically
weak condition. Another side effect of the osmolar fluctuations are decreased refractivity
of the ocular lens, which results in impaired eyesight. Another highly relevant metabolic
function of insulin is the inhibition of lipolysis and inducing storage of free fatty acids in
adipose tissue. In case of insulin deficiency, the non-inhibited lipolysis continuously
produces free fatty acids circulating in the blood. If insulin is missing, these free fatty acids
are metabolized in the liver into acidic ketone bodies resulting in diabetic ketoacidosis
(DKA). Exsiccated because of the glucosuria, physically weak because of lacking
intracellular transport, and hyperventilating because of acidic blood pH, uncontrolled
IDDM can result in a ketoacidotic coma. (23,24)
7
Figure 4 Effects of glucagon and insulin on the liver, muscle, and adipose tissue (25)
1.1.5 Diagnosis of Diabetes mellitus
Annually guidelines for the diagnosis of diabetes mellitus are re-evaluated and updated.
Except assessing typical anamnestic and clinical symptoms like polydipsia, polyuria,
weight loss, weakness, and/or diabetic ketoacidosis, there are plenty of laboratory values
for diagnosing diabetes mellitus. Currently plasma glucose values are the gold standard for
differentiating between physiological, prediabetic or diabetic glucose homeostasis. It is
important to know that the term “prediabetes” is used for cases with a plasma glucose
higher than normal, but lower than pathological. Meaning that “prediabetes” is not a
different entity but an increased risk for developing diabetes mellitus. (26)
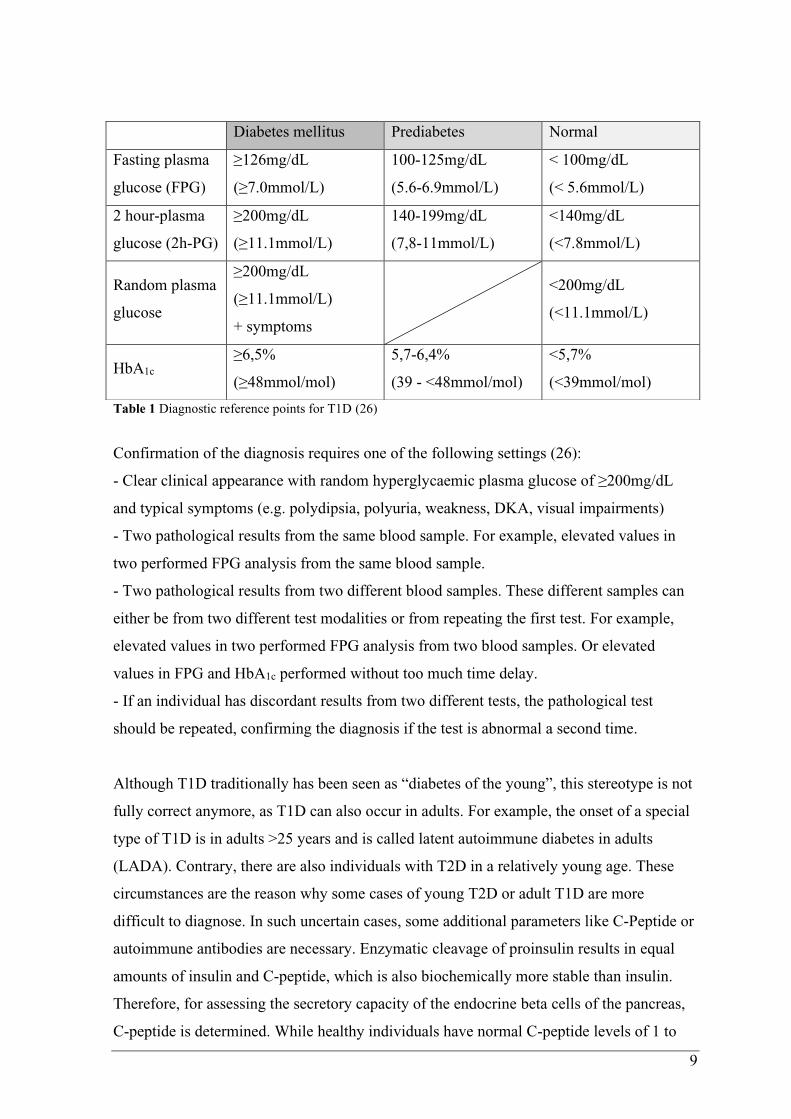
1. Most of the time fasting plasma glucose (FPG), after an 8h period without any caloric
intake, is used for the diagnosis of diabetes. In this case values of ≥126 mg/dL
(7.0mmol/L) indicate diabetes, values less than 100mg/dL (5.6mmol/L) are normal and
values in between are prediabetic. (26)
2. Especially in uncertain cases an oral glucose tolerance test (OGTT) with a following
2h-plasma glucose (2h-PG) test can be useful. For this the FPG is determined first,
then the individual drinks a 75g glucose solution dissolved in 300ml of water and
eventually the plasma glucose is determined again two hours post consumption. If the
FPG is pathologically elevated and indicative for diabetes mellitus beforehand, an
OGTT is contraindicated. Nevertheless, the 2h-PG is more sensitive than the FPG in
8
diagnosing diabetes mellitus. The diagnostic criteria for diabetes during a 2h-PG are
values of ≥200mg/dL (11.1mmol/L), while values less than 140mg/dL (7.8mmol/L) are
normal and values in between are prediabetic. (26)
3. Similarly to this, any random plasma glucose ≥200mg/dL in a clearly clinically
symptomatic individual speaks for diabetes mellitus. (1,24,26)
4. Alternatively, HbA1c levels can be measured to detect a diabetic/hyperglycaemic
condition. This glycosylated variant of haemoglobin is a product of non-enzymatic
attachment of glucose molecules to erythrocytic haemoglobin if the plasma glucose
levels are high. Because of the irreversibility of this process and an erythrocyte-lifespan
of 110 to 120 days, the HbA1c level gives an insight of the mean plasma glucose levels
of the last two or three months. Therefore, this parameter is often used to (re-)evaluate
the efficacy of the antidiabetic treatment or the individual’s compliance. Elevated
HbA1c levels of ≥6.5% (48mmol/mol) are indicative of diabetes mellitus, while levels
<5.7% (39mmol/mol) are physiological and levels in between are prediabetic. Although
HbA1c has several advantages like greater convenience, no requirement of fasting and
less day-to-day fluctuations, it is not the gold standard for the diagnosis of diabetes
mellitus. The reason for this might be the lower sensitivity in detecting diabetes and
prediabetes compared to FPG and 2h-PG (27). Another reason might be the fact, that
the HbA1c value only represents the mean plasma glucose levels in the last two to three
months. Alternating occurrences of high and low blood glucose are equalized and
masked by each other in this parameter. For example, an individual with constant hyper-
and hypoglycaemia might have a normal HbA1c value, despite having a metabolic
disorder. Other limiting factors of this parameter are interferences due to haemoglobin
variants, haemoglobinopathies (e.g. sickle cell disease), haemolysis, kidney failure,
pregnancy, HIV, chronic alcohol abuse and other reasons. (1,24,26–28)
9
Table 1 Diagnostic reference points for T1D (26)
Confirmation of the diagnosis requires one of the following settings (26):
- Clear clinical appearance with random hyperglycaemic plasma glucose of ≥200mg/dL
and typical symptoms (e.g. polydipsia, polyuria, weakness, DKA, visual impairments)
- Two pathological results from the same blood sample. For example, elevated values in
two performed FPG analysis from the same blood sample.
- Two pathological results from two different blood samples. These different samples can
either be from two different test modalities or from repeating the first test. For example,
elevated values in two performed FPG analysis from two blood samples. Or elevated
values in FPG and HbA1c performed without too much time delay.
- If an individual has discordant results from two different tests, the pathological test
should be repeated, confirming the diagnosis if the test is abnormal a second time.
Although T1D traditionally has been seen as “diabetes of the young”, this stereotype is not
fully correct anymore, as T1D can also occur in adults. For example, the onset of a special
type of T1D is in adults >25 years and is called latent autoimmune diabetes in adults
(LADA). Contrary, there are also individuals with T2D in a relatively young age. These
circumstances are the reason why some cases of young T2D or adult T1D are more
difficult to diagnose. In such uncertain cases, some additional parameters like C-Peptide or
autoimmune antibodies are necessary. Enzymatic cleavage of proinsulin results in equal
amounts of insulin and C-peptide, which is also biochemically more stable than insulin.
Therefore, for assessing the secretory capacity of the endocrine beta cells of the pancreas,
C-peptide is determined. While healthy individuals have normal C-peptide levels of 1 to
Diabetes mellitus Prediabetes Normal
Fasting plasma
glucose (FPG)
≥126mg/dL
(≥7.0mmol/L)
100-125mg/dL
(5.6-6.9mmol/L)
< 100mg/dL
(< 5.6mmol/L)
2 hour-plasma
glucose (2h-PG)
≥200mg/dL
(≥11.1mmol/L)
140-199mg/dL
(7,8-11mmol/L)
<140mg/dL
(<7.8mmol/L)
Random plasma
glucose
≥200mg/dL
(≥11.1mmol/L)
+ symptoms
<200mg/dL
(<11.1mmol/L)
HbA1c ≥6,5%
(≥48mmol/mol)
5,7-6,4%
(39 - <48mmol/mol)
<5,7%
(<39mmol/mol)

10
2ng/mL pre-prandial and levels of 1,5 to 3ng/mL postprandial, individuals with T1D have
decreased C-Peptide levels and individuals with T2D on the other hand have increased C-
peptide levels. Although this screening tool might be very helpful in differentiating T1D
and T2D, additional diagnostic steps should be considered. (24,29)
For example, seropositivity to autoimmune antibodies like insulin auto-antibody (IAA),
islet-antigen 2-antibody (IA-2A), zinc-transporter 8-antibody (ZnT8A), glutamate
decarboxylase-antibody (GADA) can be determined. Due to antibody analysis T1D
nowadays can be divided into different stages of disease progression based on antibody-
quantity and plasma glucose (see Figure 5). It is possible to have seropositivity without
dysregulated plasma glucose levels. This means that analysis of autoantibodies are useful
in differentiating the type of diabetes mellitus but should always be interpreted with the
underlying clinical context to diagnose clinical T1D. (1,2,17,24,29)
Figure 5 Stages of Diabetes mellitus Type 1 based on antibody-quantity and glycaemic levels (17)
Immune activation with beginning beta-cell destruction; following immune response with antibody production before
first stage; Stage 1 of T1D beginning with onset of ≥ 2 diabetes associated autoantibodies while having normoglycaemia;
Stage 2 defined as having ≥ 2 autoantibodies with prediabetic plasma glucose levels; Stage 3 representing the clinical
diagnosis with diabetic plasma glucose levels; Stage 4 in individuals with longstanding T1D.
1.1.6 Therapy of T1D
Daily insulin need
Due to the progressive loss of beta cell function and, as a result, missing insulin secretion
people with T1D have an inevitable need for exogenous insulin administration. For this
purpose, knowledge of the physiological pancreatic excretion is important. On average the
daily need for insulin is about 0.4 to 1.0 IU/kg/day with a higher need during puberty,
inflammatory processes, trauma or pregnancy (30). This total daily dose is usually split in
50-60% basal need and 40-50% prandial/bolus need (1,31). While the meal-independent
basal insulin supresses hepatic gluconeogenesis and other metabolic background-
11
processes, prandial insulin regulates plasma glucose levels during/after meal-intake to
avoid pathologically high plasma glucose peaks. Another relevant factor of insulin therapy
is circadian variability of insulin sensitivity with midday hours being the most sensitive,
morning hours the least sensitive, and in the evening in between. Therefore, the proportion
of total daily bolus insulin dose is 3:1:2. Also the more plasma glucose levels increase
(>270mg/dL), the more insulin sensitivity is decreased (31). (1,2,31)
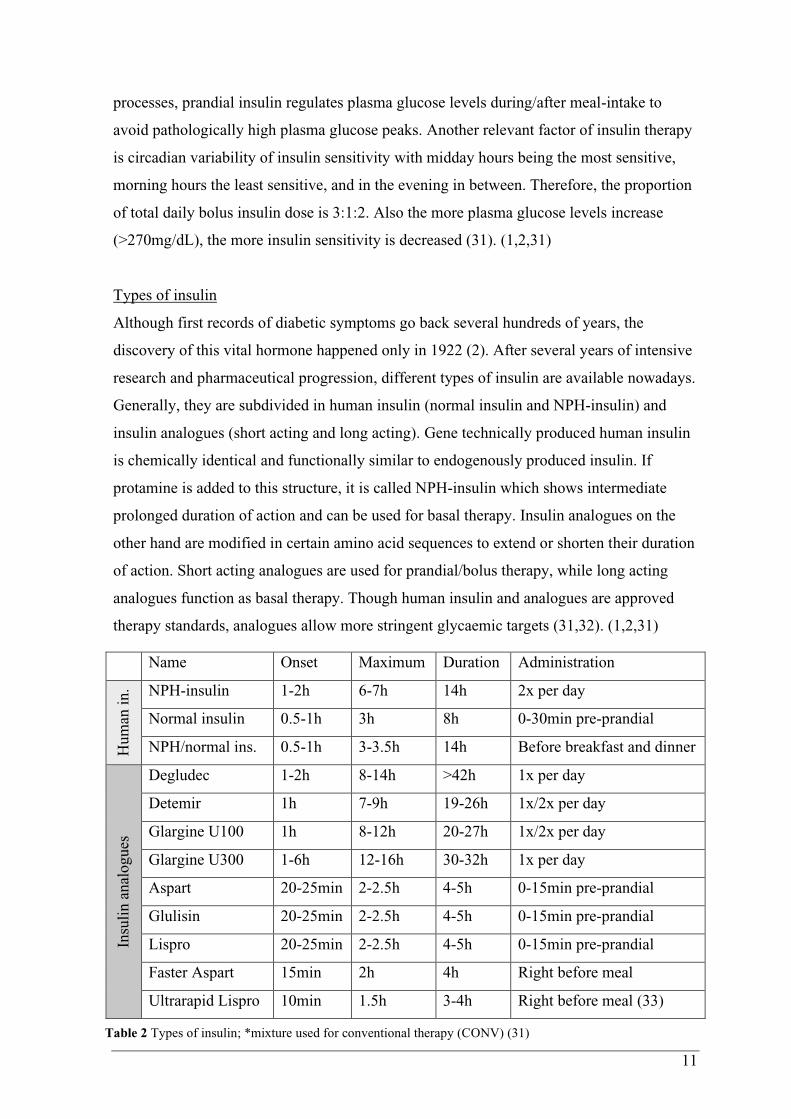
Types of insulin
Although first records of diabetic symptoms go back several hundreds of years, the
discovery of this vital hormone happened only in 1922 (2). After several years of intensive
research and pharmaceutical progression, different types of insulin are available nowadays.
Generally, they are subdivided in human insulin (normal insulin and NPH-insulin) and
insulin analogues (short acting and long acting). Gene technically produced human insulin
is chemically identical and functionally similar to endogenously produced insulin. If
protamine is added to this structure, it is called NPH-insulin which shows intermediate
prolonged duration of action and can be used for basal therapy. Insulin analogues on the
other hand are modified in certain amino acid sequences to extend or shorten their duration
of action. Short acting analogues are used for prandial/bolus therapy, while long acting
analogues function as basal therapy. Though human insulin and analogues are approved
therapy standards, analogues allow more stringent glycaemic targets (31,32). (1,2,31)
Table 2 Types of insulin; *mixture used for conventional therapy (CONV) (31)
Name Onset Maximum Duration Administration
Hum
an i
n. NPH-insulin 1-2h 6-7h 14h 2x per day
Normal insulin 0.5-1h 3h 8h 0-30min pre-prandial
NPH/normal ins. 0.5-1h 3-3.5h 14h Before breakfast and dinner
Insu
lin a
nal
ogues
Degludec 1-2h 8-14h >42h 1x per day
Detemir 1h 7-9h 19-26h 1x/2x per day
Glargine U100 1h 8-12h 20-27h 1x/2x per day
Glargine U300 1-6h 12-16h 30-32h 1x per day
Aspart 20-25min 2-2.5h 4-5h 0-15min pre-prandial
Glulisin 20-25min 2-2.5h 4-5h 0-15min pre-prandial
Lispro 20-25min 2-2.5h 4-5h 0-15min pre-prandial
Faster Aspart 15min 2h 4h Right before meal
Ultrarapid Lispro 10min 1.5h 3-4h Right before meal (33)

12
Conventional and Intensive therapy regime
In the past, when only human insulin was available, conventional therapy (CONV) was the
gold standard for people with IDDM. For this, insulin mixtures with normal insulin and
intermediate NPH-insulin were used and served as basal as well as bolus therapy. CONV is
therefore defined by two daily injections of insulin mixtures (normal insulin and NPH-
insulin), in which about 2/3 of the daily dose are injected before breakfast and the rest
before dinner (1). (1,2,31)
Nowadays, the modified pharmacodynamic characteristics of insulin analogues allow
better adjusted therapy in the form of intensified therapy (INT). This therapy regime is
defined by either self-applied multiple daily injections (MDI) or pump-regulated
continuous subcutaneous insulin infusions (CSII). In the case of MDI meal-independent
daily depots of basal insulin (NPH or long acting analogues) and meal-dependent
injections of bolus insulin (normal insulin or short acting analogues) are applied. Basal
therapy is administered either once a day or twice a day depending on duration of action of
the basal insulin that is used. For example, NPH-insulin and Insulin detemir must be
administered at least twice a day, while Insulin glargine or degludec require one injection
per day. For prandial/bolus injections normal insulin or short acting analogues equivalent
to consumed carbohydrates are used. In contrast to MDI which requires multiple self-
administered insulin pen-injections of basal and bolus insulin, CSII uses external insulin
pumps continuously infusing small amounts of short acting insulin analogues or normal
insulin. This short acting analogue or normal insulin then serves as basal & bolus therapy:
Shortly before meal intake individuals with CSII set their needed amount of bolus insulin
and the pump delivers this amount via subcutaneous tube. The amount of basal therapy,
which is infused throughout the day, is pre-set and can be varied for every hour. This is
from importance because the circadian rhythm of insulin is not homogenous, but rather has
a peak in the early morning hours, called dawn-phenomenon. Individuals having
hyperglycaemic problems in these hours can set higher amounts per hour for
counterregulation (CAVE: differential diagnosis Somogyi-effect). Therefore, CSII allows
more precise imitation of physiological insulin secretion patterns. (1,2,30,31)

13
Figure 6 Insulin therapy regimes (34)
Recommendations
While conventional therapy (CONV) prescribes the dose of injected insulin and size of the
consumed meal, intensified therapy (INT) allows flexible meal times & flexible meal
portions with according injecting doses. On the other hand, INT requires education and
compliance/adherence of the patient for correctly calculating and dosing of the bolus
insulin needed. Therefore, the German Diabetes Society and the American Diabetes
Association emphasize use of INT as standard therapy regime in IDDM as long as the
individual manages and tolerates the regimen (30,31). These recommendations mostly rely
on the Diabetes Control and Complications-Trial (DCCT), in which significantly lower
HbA1c levels were reached with INT compared to CONV (median HbA1c 7% vs 9%)
(35,36). The following EDIC study proved, that a certain period of INT (average of 6.5
years in the DCCT) reduced long-term cardiovascular and microvascular complications for
up to 18 years afterwards (35). However, there was a threefold in hypoglycaemic events
with INT (35,36); but it should be noted that, at the time of the DCCT no insulin analogues
were available, which show less hypoglycaemic events than normal insulin nowadays
(30,37). To sum up: If the individuals are educated about the procedures and compliant,
INT favourably using insulin analogues is the standard of medical care in T1D therapy.

14
INT can be performed as CSII or MDI, which have been compared too, showing that CSII
has significant advantages in glycaemic control especially in individuals with high baseline
HbA1c levels (38–40).
Although these recommendations implicate that INT is superior to CONV in reaching
glycaemic targets, it should be taken into account that “the central precept in the
management of type 1 diabetes is that some form of insulin be given in a planned regimen
tailored to the individual patient to keep them safe, out of diabetic ketoacidosis, and avoid
significant hypoglycaemia, with every effort made to reach the patient’s glycaemic targets”
(30). Meaning that a correctly performed conventional therapy is probably superior to an
incorrectly performed intensive therapy, if the individual is not capable of the complexity
of INT.
Educational and psychosocial interventions
No matter how thorough the pharmacological concept has been adjusted from the medical
staff, the diabetic individual is the one administering the insulin. Therefore, intensive
education in diabetes self-management is one of the key factors for a successful therapy.
This should occur early after diagnosis of T1D and in certain intervals afterwards.
Educational topics are for example correct use of devices and insulin, identifying and
reacting to acute complications (hypoglycaemia, diabetic ketoacidosis), knowing about
long-term complications (diabetic retinopathy, polyneuropathy, nephropathy,
macroangiopathy) and preventing these, correct self-monitoring of blood glucose, and
more (41). Eventually the aim is an educated individual with the ability of informed
decision making and increased quality of life. Several studies verified the beneficial effects
of diabetes self-management education on HbA1c and impaired awareness of
hypoglycaemia (42–44). Therefore therapy guidelines emphasize relevance of these
interventions as a cost-effective basis in diabetes healthcare (31,45).
With T1D being a chronic disease limiting everyday life, diabetic individuals and/or
relatives sometimes see themselves confronted with a heavy burden. This can result in
psychosocial issues, if not addressed early enough. Individuals with T1D are more likely to
experience anxiety, depression, behavioural problems and eating disorders (about 3% vs.
7%) than equivalent compared individuals (46,47). This is why psychosocial care is
recommended in individuals with T1D (and their relatives) (31,45).
15
Nutrition
Given the fact that insulin deficiency leads to unbalanced glucose metabolism, it is logical
that carbohydrate (CHO) intake must be strictly monitored. Calculating the amount of
CHO in a meal (1 bread unit = 12g of CHO (45) OR 1 carbohydrate unit = 10g CHO (1))
and applying appropriate doses of prandial insulin is elementary for achieving glycaemic
control. Therefore, education about correct calculation/estimation of CHO intake and
insulin administration must be done. In addition, the hypoglycaemic effects of alcohol
intake or exercise should be addressed to prevent (nocturnal) hypoglycaemia. Apart from
that, no additional dietary restrictions are recommended for individuals with T1D other
than usual dietary recommendations for people without T1D. (1,31,45)
1.1.7 Monitoring
Correct monitoring of glucose levels is elementary for adequate insulin administration. For
this, various alternatives of blood or interstitial glucose measurement are available
nowadays. In the following paragraphs only some of them, which have been used during
the study, are described.
First introduced in the 1970s and by far the most used way of measurement is self-
monitoring of blood glucose (SMBG) using capillary blood. Therefore, a lancet or lancing
device, glucose test strips and a glucose meter, measuring and showing the result, are
needed. After washing the hands and inserting a test strip into the appropriate meter, a
finger is pricked with a lancet or lancing device. A small drop of blood is obtained onto the
test strip and the capillary blood glucose level is measured by the device. The American
Diabetes Association recommends SMBG use for patients in intensive insulin therapy
regime (MDI or CSII) as much as 6 to 10 times daily for efficient monitoring (48). For
example, prior to meals, physical exercise, sleeping or critical tasks like driving a car, and
when suspecting hypoglycaemia until normoglycaemia occurs. In individuals with T1D a
higher frequency of SMBG is even correlated with significantly lower HbA1c levels
(49,50). (48,51)
In 1999 another breakthrough in glucose monitoring took place, when the first continuous
glucose monitoring (CGM) device got approved. These devices are continuously
measuring glucose levels in the interstitial fluid which is representative of the plasma
glucose levels in a certain range. Since 1999 different variants of the devices and
additional features developed. Most of the time minimally invasive subcutaneous needle-
type CGM systems are used, where a catheter is inserted in the subcutaneous adipose tissue
to analyse the glucose levels in the interstitial fluid. One relevant weakness of interstitial
16
measurement is the fact that glycaemic changes occur after an average time delay of 8 to
10 minutes compared to plasma glucose measurement (52,53). Therefore, interstitial
glucose analysis is quite reliable during stable glycaemic stages, but lacks accuracy and
reliability during stages of rapid change of glucose levels (53,54). This physiological effect
is important to know when interpreting data collected by CGM devices especially in acute
hyper- or hypoglycaemic events. In such cases, use of SMBG is recommended until
euglycaemia is reached. From the different CGM-systems mainly real-time CGM (rtCGM)
and flash glucose monitoring (FGM) are used. Both systems are continuously measuring
the glucose levels in the interstitial fluid using a catheter placed in the subcutis, which is
connected to an external sensor. This sensor must be changed every 1 to 2 weeks. While
rtCGM regularly transmits and saves the measured data to a reader, FGM only displays
data when the sensor is actively scanned with the reader. If the FGM sensor is not scanned
for 8 hours or longer, data gets overwritten. Use of CGM devices have many useful
advantages in daily life for individuals with T1D.
- For example, no significant difference between only CGM-use and use of a CGM-
SMBG-combination has been found (55). Therefore, finger pricks are not necessary except
for calibration of the rtCGM devices.
- Another advantage of CGM is that the reader is able to display a trend whether the
glucose levels are rising or falling according to previously measured data. Contrary to
SMBG which only displays a punctual value, CGM allows better determination if more
carbohydrate intake or more insulin administration is needed.
- Also, CGM devices analyse the time spent in certain glycaemic ranges and the glycemic
variability of the individual. Information about time spent in hypoglycaemia, euglycaemia
and hyperglycaemia are helpful for monitoring and adjustment of therapy. Decisions are
made more precisely than with HbA1c values alone, which only represent average glucose
levels in the past time. E.g. an individual with high percentage of time in hypoglycaemia
could present with false-low or false-normal HbA1c levels, although intervention in therapy
regime is needed. (56)
- Besides, rtCGM devices have a major advantage in terms of preventing hypoglycaemia
(and hyperglycaemia). Because the transmitter is in constant communication with the
reader the user is notified if the glucose levels drop (or rise) below (or above) a certain
threshold.
All these factors lead to improved glycaemic control in individuals with T1D using CGM
systems. As well rtCGM (57,58) as FGM (59,60) have been shown to reduce time spent in
17
hypoglycaemia and still lower HbA1c levels compared to capillary blood glucose
measurements. Therefore, the German Diabetes Society and the American Diabetes
Association recommend use of CGM monitoring for improving quality of life and reaching
glycaemic targets if used properly. (31,48)
1.1.8 Glycaemic Targets
The DCCT clearly proved the correlation between better glycaemic control, represented by
lower HbA1c levels, and significant (50-76%) reduction of long-term complications (36).
Therefore, to minimize the risks for long-term complications and to evaluate the
effectiveness of a therapy regime certain glycaemic targets are defined. There are different
variables for different monitoring options. While individuals performing SMBG solely rely
on quarterly measured HbA1c levels and self-measured glucose diaries, individuals using
CGM receive additional information about their glycaemic status.
Referring to the American Diabetes Association (ADA) an HbA1c level of <7% is
recommended for non-pregnant adults. If achievable without significant hypoglycaemic
adverse effects, even HbA1c levels of <6.5% are recommended. Further reduction than
6.5%, on the other hand, may be associated with hypoglycaemic events outweighing the
potential benefit. In individual cases (limited life expectancy, severe hypoglycaemia,
severe micro-/macrovascular complications, fully extended therapy regime) less stringent
HbA1c levels of 8% can be adequate. (61)
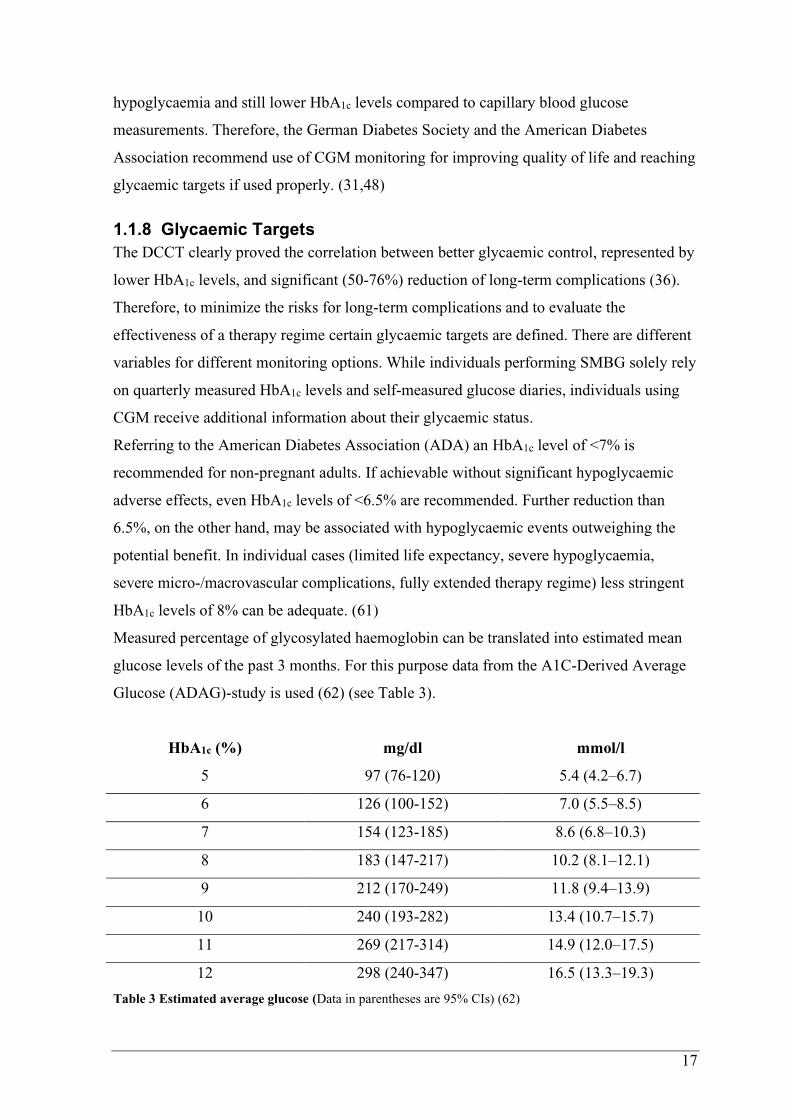
Measured percentage of glycosylated haemoglobin can be translated into estimated mean
glucose levels of the past 3 months. For this purpose data from the A1C-Derived Average
Glucose (ADAG)-study is used (62) (see Table 3).
HbA1c (%) mg/dl mmol/l
5 97 (76-120) 5.4 (4.2–6.7)
6 126 (100-152) 7.0 (5.5–8.5)
7 154 (123-185) 8.6 (6.8–10.3)
8 183 (147-217) 10.2 (8.1–12.1)
9 212 (170-249) 11.8 (9.4–13.9)
10 240 (193-282) 13.4 (10.7–15.7)
11 269 (217-314) 14.9 (12.0–17.5)
12 298 (240-347) 16.5 (13.3–19.3)
Table 3 Estimated average glucose (Data in parentheses are 95% CIs) (62)

18
Yet HbA1c levels lack major information about glycaemic conditions of individuals with
diabetes mellitus. For example, time in range (TIR), glycaemic variability and
hypoglycaemic/hyperglycaemic events (especially while sleeping) are not described. CGM
devices provide these variables and allow healthcare-providers more precise evaluation of
the therapy regime and glycaemic condition.
An international consensus defined CGM-based glycaemic ranges according to
normoglycaemia, mild/severe hypoglycaemia and mild/severe hyperglycaemia. Also,
certain glycaemic targets for different diabetes populations (non-pregnant adults,
older/high risk individuals, pregnancy with T1D, pregnancy with T2D) are specified in this
consensus. For non-pregnant adults a TIR of more than 70% is recommended, TAR
should be less than 30% in total (<25% level 1, <5% level 2), TBR is handled more
stringent and must not exceed 5% in total (<4% level 1, <1% level 2) (63). A TIR of 70%
matches to HbA1c levels of approximately 7%, and every 10% increase of TIR results in a
0.6-0.8% decrease in glycosylated haemoglobin (64,65).
Glycaemic range Interstitial glucose level
(mg/dL)
Glycaemic target
(time spent/day)
Time above range (TAR) level 2 >250 <5% 1h 12min
Time above range (TAR) level 1 181–250 <25% 6h
Time in range (TIR) 70–180 >70% 16h 48min
Time below range (TBR) level 1 54–69 <4% 58min
Time below range (TBR) level 2 <54 <1% 14min
Table 4 Glycemic ranges and targets for CGM-measured values in non-pregnant adults (63)
Another relevant variable provided by CGM devices, that cannot be assessed by HbA1c, is
the glycemic variability of measured data. This represents fluctuations in blood glucose
levels and should not exceed 36% (61,63).
19
1.2 Intermittent fasting
1.2.1 Background
In modern day societies three meals per day (breakfast, lunch, and dinner) are usual,
sometimes snacks in between are consumed too. Exaggerated forms of this eating pattern
lead to continuously elevated insulin levels with inhibition of lipolysis, resulting in insulin
resistance and obesity. These metabolic dysregulations are not surprising considering that
the human body is not designed for overconsumption. In fact, by using energy depots in
the liver and adipose tissue (see Figure 4) mammals and human beings can withstand
prolonged times of food deprivation with intermittent periods of nutrition. Intermittent
fasting (IF) simulates this and is defined as ”eating patterns in which individuals go
extended time periods (e.g., 16–48 h) with little or no energy intake, with intervening
periods of normal food intake, on a recurring basis” (66). Generally this results in
euglycemic blood glucose levels, metabolisation of hepatic glycogen and reduction of
adipose tissue generating ketones (66,67).
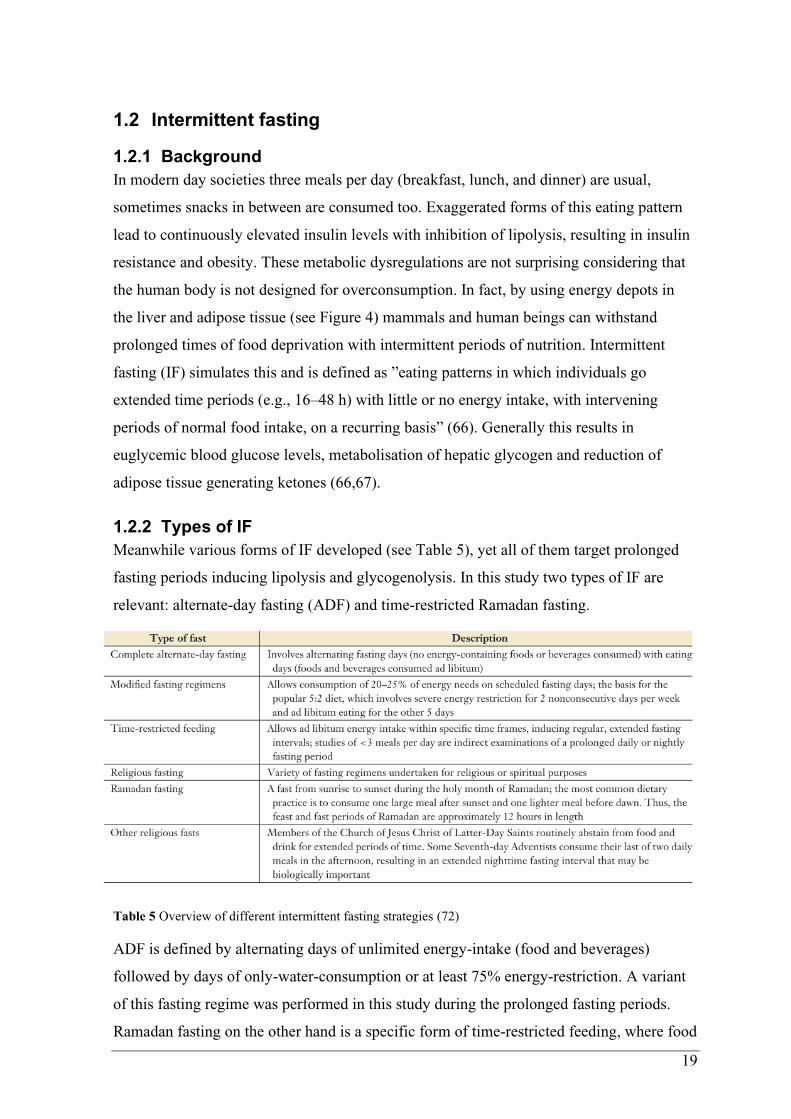
1.2.2 Types of IF
Meanwhile various forms of IF developed (see Table 5), yet all of them target prolonged
fasting periods inducing lipolysis and glycogenolysis. In this study two types of IF are
relevant: alternate-day fasting (ADF) and time-restricted Ramadan fasting.
ADF is defined by alternating days of unlimited energy-intake (food and beverages)
followed by days of only-water-consumption or at least 75% energy-restriction. A variant
of this fasting regime was performed in this study during the prolonged fasting periods.
Ramadan fasting on the other hand is a specific form of time-restricted feeding, where food
Table 5 Overview of different intermittent fasting strategies (72)

20
and beverages (water included) are prohibited from sunrise to sunset. This time span may
vary from 11 to 22 hours depending on the geographic location. Although Ramadan fasting
was not performed during this study, most of the research on T1D and fasting are
associated with Ramadan studies. Both, ADF and Ramadan fasting, are associated with
significant weight loss and improvement in metabolic parameters, such as fasting insulin,
LDL, HDL, total cholesterol and triglycerides (68–70). Additionally, Ramadan fasting has
been shown to reduce HbA1c levels by 0.6% in people with T2D (71). (72)
Figure 7 Glucose and ketone levels during different eating/fasting patterns (66)
The timeline shows two consecutive days with red arrows representing meals/snacks
A: typical eating pattern with breakfast, lunch, dinner and a late snack; after every meal, glucose levels rise and
normalize again; glycogen stores are not depleted, therefore ketone levels stay low
B: example of an alternate-day fast with low glucose levels during the fasting day; ketone bodies continuously
arise following a decrease in ketone levels and an increase in glucose levels after breaking the fast on the
following day
C: time restricted feeding (e.g. Ramadan fasting) where in the last 6-8h of the 18h fasting period ketone levels
rise; after breaking the fast ketone bodies return to baseline while glucose levels rise and remain high for several
hours due to consecutive meals
21
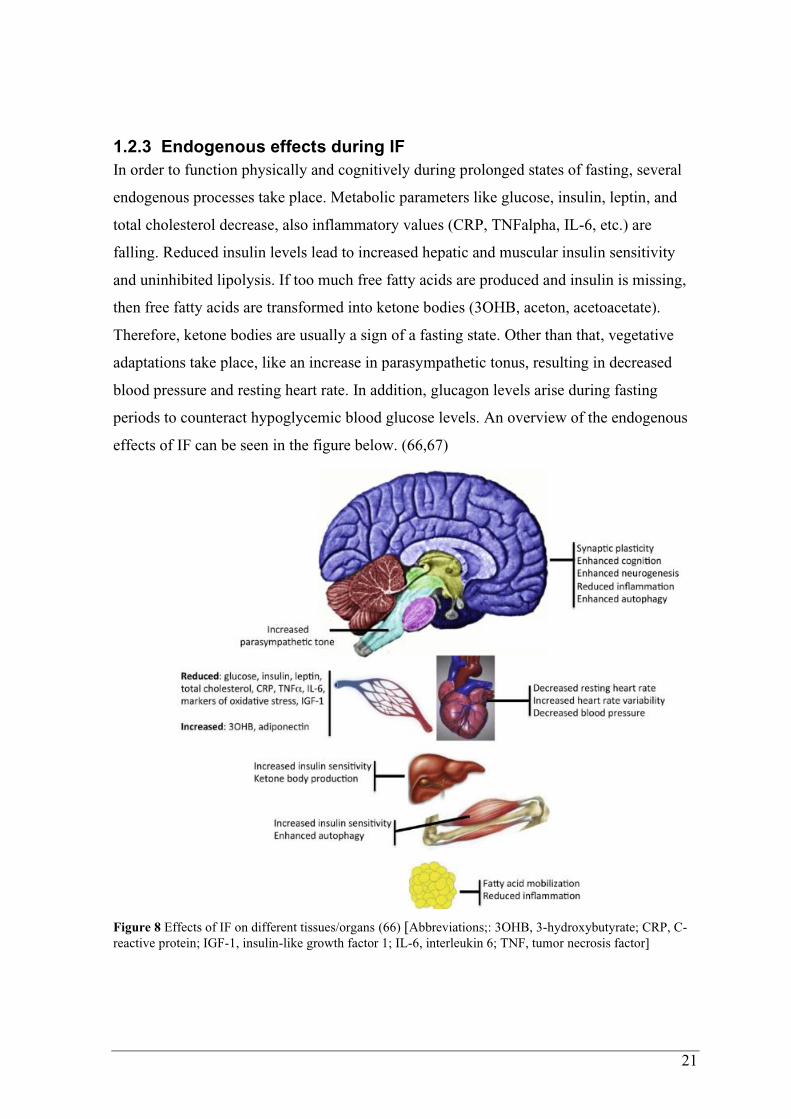
1.2.3 Endogenous effects during IF
In order to function physically and cognitively during prolonged states of fasting, several
endogenous processes take place. Metabolic parameters like glucose, insulin, leptin, and
total cholesterol decrease, also inflammatory values (CRP, TNFalpha, IL-6, etc.) are
falling. Reduced insulin levels lead to increased hepatic and muscular insulin sensitivity
and uninhibited lipolysis. If too much free fatty acids are produced and insulin is missing,
then free fatty acids are transformed into ketone bodies (3OHB, aceton, acetoacetate).
Therefore, ketone bodies are usually a sign of a fasting state. Other than that, vegetative
adaptations take place, like an increase in parasympathetic tonus, resulting in decreased
blood pressure and resting heart rate. In addition, glucagon levels arise during fasting
periods to counteract hypoglycemic blood glucose levels. An overview of the endogenous
effects of IF can be seen in the figure below. (66,67)
Figure 8 Effects of IF on different tissues/organs (66) [Abbreviations;: 3OHB, 3-hydroxybutyrate; CRP, C-
reactive protein; IGF-1, insulin-like growth factor 1; IL-6, interleukin 6; TNF, tumor necrosis factor]

22
1.2.4 Health Benefits of IF
As a result of above-mentioned endogenous effects, IF provides various health benefits
apart from weight loss.
a) Circadian rhythm is elementary for timing physiological processes at the perfect time.
Generally, the central endogenous clock (suprachiasmatic nucleus) is synchronized by
light and darkness to a 24-hour circadian rhythm. Peripheral clocks in liver, skeletal
muscle cells and adipose tissue on the other hand also react to feeding signals.
Therefore, consuming meals during usual resting periods can disturb the circadian
rhythm resulting in poor sleep quality and metabolic dysregulations. (72,73)
For example, circadian disturbances where the usual 24h-cycle has been extended to 28
hours, can lead to significant insulin resistance after just 3 cycles (74). Contrary, the
odds of elevated HbA1c levels decrease by every nocturnal 3-hour fasting duration (75).
b) Apparently, weight loss is the most relevant health benefit resulting from calorie
restriction, because obesity increases the risk for cardiovascular diseases, certain
cancers, diabetes and diabetes-related complications (76). As mentioned above (see
chapter 1.2.2) ADF and Ramadan fasting are associated with significant weight loss.
Reviews of different IF-regimes quantified weight loss in ADF to be up to 7% and
reduction of body fat up to 5kg in eight weeks (77). Apart from that, IF/intermittent
energy restriction has been compared with continuous energy restriction (CER);
showing that both diet regimes result in equivalent and comparable weight loss (78,79).
If possible, the weight should not be lost at the expense of the fat-free mass (FFM),
which is representing the muscle mass in a certain way. According to studies analysing
this aspect, loss of FFM seems comparable between IF and CER (80,81). More
important for preserving lean mass is a high protein consumption. For example, ad
libitum protein and fat intake during IF, showed significantly lower loss of FFM than
CER or regular IF (80).
c) Oxidative stress and inflammatory markers, such as CRP, TNF-alpha and IL-6, also
decrease during ADF und Ramadan fasting (67,82,83). This may lead to a reduction of
autoimmune processes, atherosclerosis and tissue damage.
d) Glucose metabolism also reacts to fasting, which can be measured in altered
parameters. Due to food deprivation, fasting glucose levels significantly decrease after
IF (84). Reduced glucose levels in turn lead to significantly reduced fasting insulin
levels (68). Ultimately these metabolic benefits result in lower HOMA-IR levels, which

23
means less insulin resistance and increased insulin sensitivity (67,84). Studies also state
that CER and IF provide comparable beneficial effects on glucose metabolism. (85)
1.2.5 Complications during IF with T1D
As described previously, several endogenous and metabolic processes for maintaining
physical and cognitive function take place during fasting periods. Therefore, IF poses a
problem especially for people with T1D, who are already suffering from dysfunctional
glucose metabolism. Most relevant complications during IF might be hypoglycaemia and
diabetic ketoacidosis.
- Hypoglycaemia: Although T1D is characterized by absolute insulin deficiency and
therefore hyperglycaemic metabolic state, various reasons can lead to hypoglycaemia.
Normally, if the plasma glucose falls below a mean threshold of 80mg/dL, insulin
secretion decreases. However, individuals with established T1D rely on exogenously
administered insulin and therefore insulin-autoregulation is lost. If plasma glucose
levels further decrease (below ~65-70mg/dL) glucagon and epinephrine are secreted to
counteract hypoglycaemia. These thresholds tend to decrease and react later in people
with tightly controlled glycaemic levels or in people with recurrent hypoglycaemic
events. Therefore, glucagon response to hypoglycaemia is also inefficient in people with
T1D (86), and epinephrine action seems to act delayed (87). Inefficiency of these three
counterregulators leads to increased risk of hypoglycaemia, despite of absolute insulin
deficiency in T1D. Nevertheless, overdosed insulin administration or lack of insulin
reduction are the main reasons for hypoglycaemia during fasting periods. (88)
Despite significant increase in severe hypoglycaemia, the EPIDIAR study showed that
more than 40% of Muslims with T1D fasted for at least 15 days during Ramadan (89).
This reflects the will to fast in people with T1D regardless of adverse events. However,
performing pre-Ramadan education lead to less hypoglycaemic events (90), underlining
the importance of awareness to complications during IF and counteracting them.
- Diabetic ketoacidosis: While there is usually no need for bolus insulin doses during
fasting periods, basal insulin must be administered; otherwise diabetic ketoacidosis
(DKA) could be the consequence. Due to insulin deficiency glucose utilization in
peripheral tissue is impaired, while excess in counterregulatory hormones
(glucagon:insulin ratio↑) results in rising blood glucose levels. Furthermore, insulin
deficiency leads to uninhibited lipolysis producing free fatty acids, which are

24
metabolised to acidic ketone bodies. Eventually DKA presents with hyperglycaemia,
ketonaemia (>3mmol/L) and metabolic acidosis. (91)
Although cases of DKA are described during Ramadan fasting, the incidence of such
complications does not increase significantly during this fasting regime. It is
hypothesized that the fasting period of approximately 12 hours is not long enough to
result in significant ketonaemia. In fact, excessive cuts in basal insulin administration
seem to be the main reason for DKA during Ramadan. (92,93)
25
2 Material and Methods
This was a prospective clinical trial assessing the effects of prolonged fasting on glucose
metabolism in adults with T1D. It was performed at the Clinical Research Center
(Billrothgasse) of the Medical University of Graz. The local ethics committee of the
Medical University of Graz (Austria) approved the study protocol (30-238 ex 17/18),
which was registered at the German Clinical Trials Register (DRKS00016148; DRKS.de).
The study was conducted in conformity with the declaration of Helsinki and Good Clinical
Practice. Before any trial related activities, potential participants were informed about the
study protocol and participants gave their written informed consent.
2.1 Eligibility criteria
a) Inclusion criteria
• Age above 18 years
• C-peptide negative defined as < 0.3nmol/L
• Treatment with multiple daily injections or continuous subcutaneous insulin infusion
• HbA1c < 9.5%
• Diagnosed with type 1 diabetes > 12 months before
• Stable insulin therapy (assessed by the study physician)
• Use of a continuous glucose monitoring system (CGM)
o favorably FreeStyle Libre 1 by Abbott, USA
b) Exclusion criteria
• History of cardiovascular disease
• Acute or chronic inflammatory disorder
• Heavy drinking (> 15 alcoholic drinks/week)
• Dietary restrictions (e.g. vegetarianism and vegan)
• Known malignancy
• Diabetic ketoacidosis within the last 12 months
• Severe hypoglycaemia requiring external assistance within the last 12 months
• Pregnancy, breast-feeding or trying to become pregnant
• Chronic diseases that could interfere with results/outcome
• Therapy with antidepressants within past 6 months
• Therapy with glucocorticoids
26
c) Measurement Day Exclusion Criteria:
• Basal insulin dose was not injected
• ≥ 3 hypoglycaemic events (<70mg/dL) during the fasting
• Non-prandially induced hyperglycaemia ≥250mg/dL during the fasting
• Performing physical exercise during the fasting
• Last bolus insulin dose was injected later than official start of fasting
• Consuming food or snacks during fasting
• Consuming caloric drinks during fasting
• Consuming caffeine during fasting
• CGM-sensor expires during OGTT
• CGM-sensor was changed <24h before or during fasting period
d) Withdrawal / Drop out of subjects
Subjects had the right to withdraw from the study at any time without prejudice or
compromise to future care.
On the other hand, the investigator may discontinue or withdraw the subjects under the
following circumstances:
• Significant protocol deviation
• Significant non-compliance with study procedures
• An adverse event that requires discontinuation of the study medication
• Consent withdrawn
• Lost to follow up
• Any other situation that may make it unsafe for the subject to continue in the trial
2.2 Study design
This study was designed as a prospective single-center, non-randomized, open-label, cross-
over controlled trial. In total, the study consisted of three visits: a screening visit, visit 1
after a 12h fasting period and visit 2 after a 36h fasting period.
Screening Visit:
During the recruitment process, participants from earlier clinical trials and patients from
the Outpatient Clinic for Diabetes of the Medical University of Graz have been called and
asked to participate in this study. A screening visit was arranged, and the informed consent
was sent via email beforehand, so that participants had enough time to go through. At the
beginning of the screening visit the study procedures were explained in detail and
participants had the opportunity to ask questions. After signing the informed consent
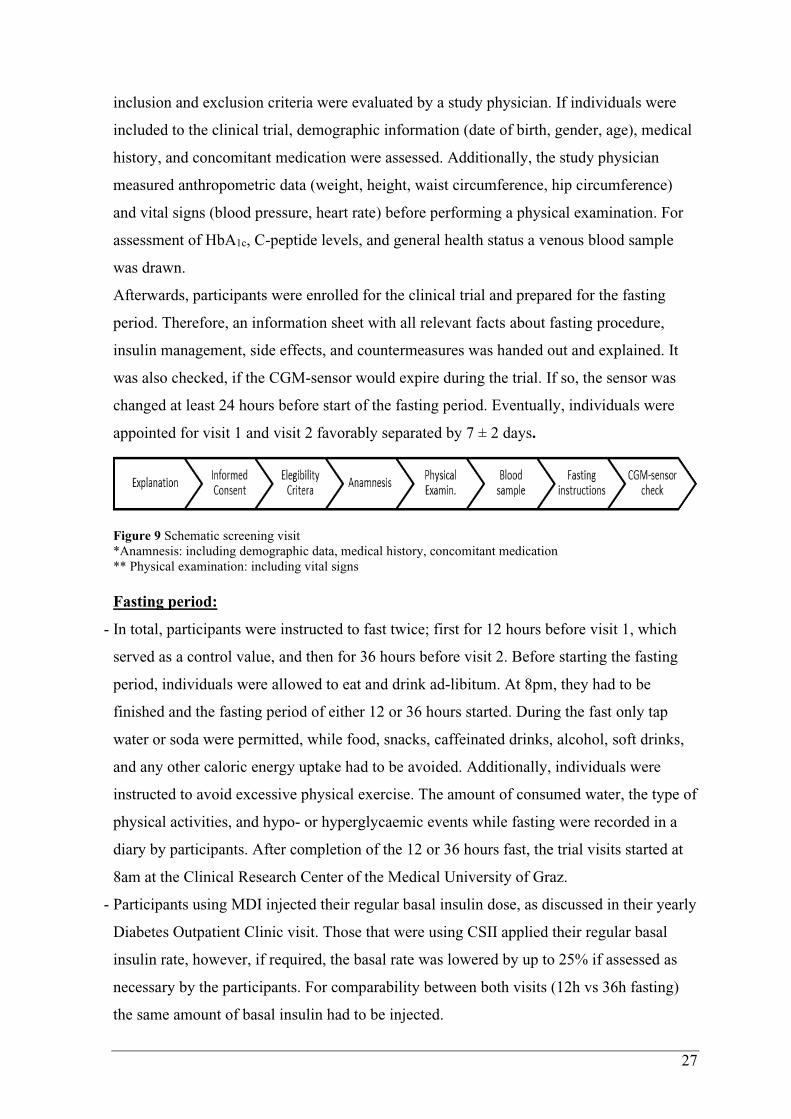
27
inclusion and exclusion criteria were evaluated by a study physician. If individuals were
included to the clinical trial, demographic information (date of birth, gender, age), medical
history, and concomitant medication were assessed. Additionally, the study physician
measured anthropometric data (weight, height, waist circumference, hip circumference)
and vital signs (blood pressure, heart rate) before performing a physical examination. For
assessment of HbA1c, C-peptide levels, and general health status a venous blood sample
was drawn.
Afterwards, participants were enrolled for the clinical trial and prepared for the fasting
period. Therefore, an information sheet with all relevant facts about fasting procedure,
insulin management, side effects, and countermeasures was handed out and explained. It
was also checked, if the CGM-sensor would expire during the trial. If so, the sensor was
changed at least 24 hours before start of the fasting period. Eventually, individuals were
appointed for visit 1 and visit 2 favorably separated by 7 ± 2 days.
Figure 9 Schematic screening visit
*Anamnesis: including demographic data, medical history, concomitant medication
** Physical examination: including vital signs
Fasting period:
- In total, participants were instructed to fast twice; first for 12 hours before visit 1, which
served as a control value, and then for 36 hours before visit 2. Before starting the fasting
period, individuals were allowed to eat and drink ad-libitum. At 8pm, they had to be
finished and the fasting period of either 12 or 36 hours started. During the fast only tap
water or soda were permitted, while food, snacks, caffeinated drinks, alcohol, soft drinks,
and any other caloric energy uptake had to be avoided. Additionally, individuals were
instructed to avoid excessive physical exercise. The amount of consumed water, the type of
physical activities, and hypo- or hyperglycaemic events while fasting were recorded in a
diary by participants. After completion of the 12 or 36 hours fast, the trial visits started at
8am at the Clinical Research Center of the Medical University of Graz.
- Participants using MDI injected their regular basal insulin dose, as discussed in their yearly
Diabetes Outpatient Clinic visit. Those that were using CSII applied their regular basal
insulin rate, however, if required, the basal rate was lowered by up to 25% if assessed as
necessary by the participants. For comparability between both visits (12h vs 36h fasting)
the same amount of basal insulin had to be injected.

28
- In cases of hypoglycaemia (<70 mg/dL) during the fasting period, 15 grams of
carbohydrates were consumed, and blood glucose was measured after 15 minutes to ensure
euglycemic blood glucose concentration (70 to 180 mg/dL). If euglycaemia was reached,
the fast was continued. If blood glucose concentration was still hypoglycaemic, this
procedure was repeated. In cases of ≥3 episodes of hypoglycaemia, the fast was stopped
and the anticipated visit was cancelled, so that basal insulin therapy could be re-evaluated
and reduced. Thereafter the participant started again with visit 1, regardless of the
participant’s progress before.
- In cases of hyperglycaemia (>250 mg/dL) participants were instructed to call the study
leader before taking countermeasures. After consultation bolus insulin should be injected
according to individual correction factor.
Figure 10 Schematic fasting period (12h vs 36h)
1) 12 hour fasting period with regular basal insulin administration in the evening; last meal with bolus insulin
injection before 8pm; after that no caloric energy uptake, no excessive physical activities, but ad libitum
water consumption; 12 hours later, at 8am, visit 1 starts
2) 36 hour fasting period with regular basal insulin administration in the first and second evening; last meal
with bolus injection before 8pm (first evening); after that no caloric energy uptake, no excessive physical
activities, but ad libitum water consumption; 36 hours later, at 8am, visit 2 starts

29
Trial visits:
After each fasting period, participants attended the trial visit at the Clinical Research
Center, where the above-mentioned measurement day eligibility criteria were assessed at
first. In order to evaluate possible ketonuria a urine sample was obtained. Then the
participants were weighed and a bioelectric impedance analysis (BIA, see chapter 2.4.3)
was performed. After 30 minutes of resting, the resting energy expenditure (REE, see
chapter 2.4.4) was measured for further metabolic analysis. When these analyses were
finished, a peripheral venous access was established, and a fasting blood sample was
drawn. Afterwards the oral glucose tolerance test (OGTT, see chapter 2.4.5) started.
During the OGTT the international physical activity questionnaire (IPAQ) was filled out.
Study assistants collected the diaries, which contained record of water consumption,
physical activities, and hypo-/hyperglycaemic events during the fast. Eventually, the
OGTT was terminated after 4 hours and individuals were checked for well-being and
euglycaemia. If so, the CGM-sensor data was downloaded, and the trial visit ended.
Figure 11 Schematic trial visit
2.3 Test methods
2.3.1 Physical examination
Physical examination was performed by the study physician at the screening visit, and
included examination of general appearance, head, ears, eyes, nose, throat, neck,
cardiovascular system, respiratory system, gastrointestinal system, skin, thyroid gland,
musculoskeletal system, central and peripheral nervous system.
2.3.2 Vital signs
Vital signs were assessed during the screening visit and in case of discomfort of the
participants during a trial visit. Therefore, blood pressure was measured in a sitting
position, with legs uncrossed, the back and arms supported. Subjects were sitting for at
least five minutes before the blood pressure measurement was taken and did not talk during
the procedure. Heart frequency as beats per minute was recorded after resting for five
minutes in a sitting position.

30
2.3.3 Bioelectric impedance analysis – BIA
Bioelectric impedance analysis (BIA) is an easy, fast, and non-invasive method of
measuring body composition. The phase-sensitive measurement method uses the different
conductivity of the individual compartments (see Fig. 12) to determine body composition.
In general, body composition is
divided in fat mass (FM) and fat-free
mass (FFM). FM contains visceral and
subcutaneous fat, while FFM is further
subdivided in body cell mass (BCM)
and extracellular mass (ECM). BCM
represents all living and metabolic
active cells of the body (muscle, organ,
immune and blood cells) including the
water inside these cells, also called
intracellular water. ECM, on the other
hand, represents all non-living and
therefore metabolically inactive cells
like bone tissue and blood plasma.
Extracellular water is also part of the
ECM. (94)
In this study the BIACORPUS RX 4004M (Medical Health Care GmbH, GER) performed
these measurements. For this purpose, two electrodes each (total of 8 electrodes) were
attached to the hands and feet of the person to be examined. The measurement process was
started by the push of a button; the instrument then automatically measured all segments
successively. After about 20 seconds, the measurement was complete and the data was
transferred to the analysis systems manually or via USB interface. Segmental measurement
data was used for the statistical evaluation of the impact of prolonged fasting on body
composition.
2.3.4 Resting energy expenditure – REE
Resting energy expenditure (REE), also called resting metabolic rate (RMR), represents
the quantity of energy, that is used for maintaining body functions like vegetative organ
functions, ionic cell-gradients and body temperature during a resting phase. Normally REE
is between 25-40 kcal/kg/day (95). Commonly indirect calorimetry is used to determine
Figure 12
Compartments differed & displayed by BIA (94)

31
REE. This method is a non-invasive way to determine different metabolic parameters with
the help of gas exchange variables like oxygen consumption (VO2) and carbon dioxide
production (VCO2). Additionally, indirect calorimetry is able to calculate the respiratory
quotient (RQ), which estimates the amount and type of substrate oxidized by the organism.
Normally RQ ranges from 0.7 to 1, with 1 representing carbohydrate utilization, 0.7 mainly
fat oxidation and values in between representing a mixed diet. During starvation and
ketosis a decrease in VCO2 and RQ is anticipated. (95,96)
In this study the METAMAX® 3B (CORTEX Biophysik GmbH, GER) performed the
indirect calorimetry. Before starting the measurement, subjects had to rest for at least 30-
minutes after at least 8 hours of sleep and after at least 3 hours of fasting (in this case 12
and 36 hours). In this time, a two-point calibration procedure was conducted according to
the manufacturer’s guidelines. Afterwards, a breath mask was placed tightly over the
subject’s mouth and nose. Oxygen consumption and carbon dioxide production were
measured via a bidirectional digital turbine flow meter, REE was calculated by the Weir
formula (97) and RQ was calculated too. During the indirect calorimetry, participants were
fully awake, lied down quietly, were completely relaxed and were breathing normally. The
measurements took place for at least 30 minutes and were performed in standard neutral
hospital room temperature.
2.3.5 Oral Glucose Tolerance Test – OGTT
An OGTT is used to analyse glucose utilization over a certain time period after a
carbohydrate intake. After an initial rise in blood glucose concentration physiological
insulin secretion starts and blood glucose levels decrease. In individuals with impaired
glucose tolerance and diabetes mellitus, this decrease is delayed due to insufficient or
missing insulin response.
Before starting with the OGTT, a peripheral venous access was established and a pre-meal
blood sample was drained (-5min, T1). Then the participants drank 75 grams of glucose
(Glucoral 75 citron, Germania Pharmazeutika, AUT) dissolved in 300ml of water and
injected a bolus insulin dose (0min) based on their calculated carbohydrate-to-insulin ratio
(see Figure 12, CarbF). For comparability between both OGTTs (12h vs 36h fasting), the
same amount of bolus insulin had to be injected. During the OGTT, further blood samples
were obtained at six different time points: 15 min (T2), 30 min (T3), 60 min (T4), 120 min
(T5), 180 min (T6) and 240 min (T7) after drinking the carbohydrate drink. In order to
prevent blood clotting in the cannula, it was occasionally flushed with sterile saline. The
first drops of blood at each blood draw were disposed to avoid saline admixture.
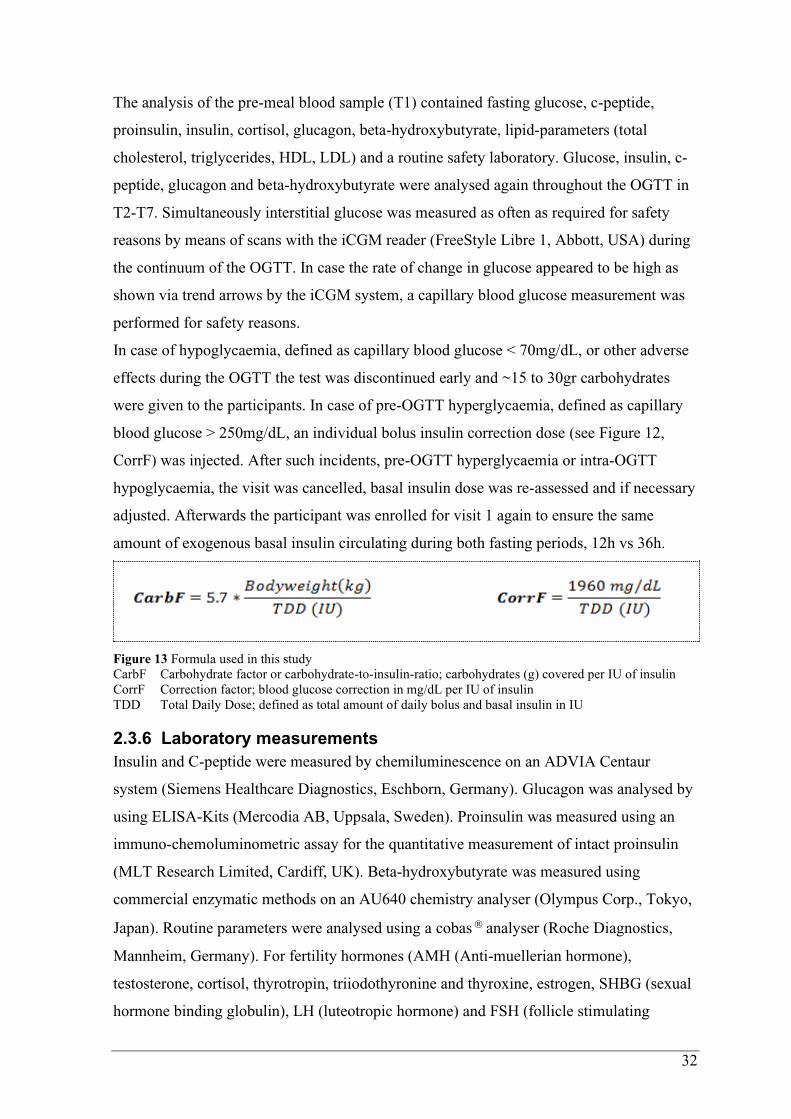
32
The analysis of the pre-meal blood sample (T1) contained fasting glucose, c-peptide,
proinsulin, insulin, cortisol, glucagon, beta-hydroxybutyrate, lipid-parameters (total
cholesterol, triglycerides, HDL, LDL) and a routine safety laboratory. Glucose, insulin, c-
peptide, glucagon and beta-hydroxybutyrate were analysed again throughout the OGTT in
T2-T7. Simultaneously interstitial glucose was measured as often as required for safety
reasons by means of scans with the iCGM reader (FreeStyle Libre 1, Abbott, USA) during
the continuum of the OGTT. In case the rate of change in glucose appeared to be high as
shown via trend arrows by the iCGM system, a capillary blood glucose measurement was
performed for safety reasons.
In case of hypoglycaemia, defined as capillary blood glucose < 70mg/dL, or other adverse
effects during the OGTT the test was discontinued early and ~15 to 30gr carbohydrates
were given to the participants. In case of pre-OGTT hyperglycaemia, defined as capillary
blood glucose > 250mg/dL, an individual bolus insulin correction dose (see Figure 12,
CorrF) was injected. After such incidents, pre-OGTT hyperglycaemia or intra-OGTT
hypoglycaemia, the visit was cancelled, basal insulin dose was re-assessed and if necessary
adjusted. Afterwards the participant was enrolled for visit 1 again to ensure the same
amount of exogenous basal insulin circulating during both fasting periods, 12h vs 36h.
Figure 13 Formula used in this study
CarbF Carbohydrate factor or carbohydrate-to-insulin-ratio; carbohydrates (g) covered per IU of insulin
CorrF Correction factor; blood glucose correction in mg/dL per IU of insulin
TDD Total Daily Dose; defined as total amount of daily bolus and basal insulin in IU
2.3.6 Laboratory measurements
Insulin and C-peptide were measured by chemiluminescence on an ADVIA Centaur
system (Siemens Healthcare Diagnostics, Eschborn, Germany). Glucagon was analysed by
using ELISA-Kits (Mercodia AB, Uppsala, Sweden). Proinsulin was measured using an
immuno-chemoluminometric assay for the quantitative measurement of intact proinsulin
(MLT Research Limited, Cardiff, UK). Beta-hydroxybutyrate was measured using
commercial enzymatic methods on an AU640 chemistry analyser (Olympus Corp., Tokyo,
Japan). Routine parameters were analysed using a cobas analyser (Roche Diagnostics,
Mannheim, Germany). For fertility hormones (AMH (Anti-muellerian hormone),
testosterone, cortisol, thyrotropin, triiodothyronine and thyroxine, estrogen, SHBG (sexual
hormone binding globulin), LH (luteotropic hormone) and FSH (follicle stimulating
33
hormone) automated analysers were used: AMH by Beckmann-Coulter, Krefeld, Germany;
testosterone, cortisol, thyreotropin, thyroxine and triiodothyronine by Siemens ADVIA
Centaur, Eschborn, Germany; estrogen, LH and FSH by Triturus, Biomedical Diagnostics,
Antwerp, Belgium, 25(OH)vitamin D by iSYS, IDS, Boldon, U.K.) respectively. Samples
for appetite hormones (Leptin and others) were centrifugated and stored at -80°C until
analysis.
All laboratory results were reviewed by the study physician, whether they were normal,
abnormal but not clinically significant, or abnormal and clinically significant. In the latter
case, the eligibility of the subject was reviewed.
2.3.7 Continuous glucose monitoring – CGM
Minimally invasive CGM devices monitored interstitial glucose levels during this study.
While participants with CSII used their usual CGM device with established continuous
insulin therapy, MDI patients were equipped with the FreeStyle Libre (Abbott, USA) as a
standard. This system eliminates the need for routine finger pricks, reading glucose levels
through a sensor that was worn on the back of the upper arm for up to 7-14 days. The
sensor measures glucose every minute in interstitial fluid through a small (5mm long,
0.4mm wide) filament that is inserted just under the skin and held in place with a small
adhesive pad. In addition, no finger prick calibration was needed.
After completion of both OGTTs CGM data was downloaded and interstitial glucose levels
during the fasting periods and during the OGTTs were analysed. If the participants did not
scan the sensor for 8 hours or longer, measured values were overwritten by the device and
no data was available from this time period.

34
2.4 Objectives
The aim of this study was to gain more knowledge about the glycaemic and hormonal
processes in individuals with T1D during and after a prolonged fast by performing an
OGTT. Besides, impact of prolonged fasting on anthropometric and metabolic parameters
was analysed too.
a) Primary objectives
- Effects on 2-hour glucose in an OGTT after 12 and 36 hours of fasting
o Mean plasma glucose at the fifth time point (=120 min)
o AUC of plasma glucose levels of the first 120 minutes of OGTT
b) Secondary objectives
- Effects on glycaemic pattern during OGTT
- Effects on hormones and β-hydroxybutyrate
- Effects on body composition
- Effects on resting energy expenditure
- Effects on additional parameters of interest during the fasting and during the OGTT
o e.g. time below/in/above range, hypoglycaemic episodes, daytime and
nighttime fluctuations, impact of TDBD, …
2.5 Statistical analysis
All data were assessed for normal distribution by means of Shapiro-Wilk normality testing.
Interstitial glucose levels during the fasting period were stratified for time below range
level 2 (<54 mg/dL), time below range level 1 (54─70 mg/dL), time in range (70─180
mg/dL), time above range level 1 (181─250 mg/dL) and time above range level 2 (>250
mg/dL). Singular post-fasting measurements and area under the curve (AUC; trapezoidal
rule) in comparison of overnight vs. prolonged fasting were assessed by means of paired t-
test or Mann-Whitney U test. Variables that were investigated over the course of the
OGTT were compared between overnight vs. prolonged fasting via two-way ANOVA or
mixed-model regressions (p ≤ 0.05). Additionally, courses of certain variables were
compared after adjustment for baseline, which was defined as difference to the pre-OGTT
value (0min). Multiple comparisons at specific time points of the OGTT (T1 to T7) were
performed via post-hoc statistical analysis. For the sample size estimation, we assumed a
difference in the 2h-glucose during the OGTT of 20 ± 25 mg/dL (1.1 ± 1.4 mmol/L)
between 12 hrs and 36 hrs fasting. Based on a paired t-test (two-sided, alpha 5%, power
90%), at least 19 participants were required to demonstrate the assumed difference.

35
3 Results
3.1 Participant characteristics
At the beginning 22 individuals with T1D were eligible for this study, of which one
participant was excluded during the study and one participant was not able to complete the
second trial visit until the deadline. In total 20 participants with the following mean ± SD
characteristics (see Table 6) completed the trial.
Table 6 Participant characteristics presented with mean ± standard deviation
As well individuals using MDI therapy as individuals using CSII therapy were included in
this study. The specific insulin analogue and the number of subjects using it as their
standard therapy regime are listed below (see Table 7).
MDI
Bolus therapy
Insulin Aspart (Novo Nordisk, DEN) 6 subj.
Insulin Lispro (Eli Lilly, USA) 4 subj.
Faster Insulin Aspart (Novo Nordisk, DEN) 1 subj.
Basal therapy Insulin Degludec (Novo Nordisk, DEN) 5 subj.
Insulin Detemir (Novo Nordisk, DEN) 6 subj.
CSII bolus & basal therapy Insulin Lispro (Eli Lilly, USA) 2 subj.
Insulin Aspart (Novo Nordisk, DEN) 7 subj.
Table 7 Types of insulin therapy in this study and number of subjects using each therapy form
Age 35 ± 11 years
Sex 7 females 13 males
Therapy form 11 MDI 9 CSII
Height 1.75 ± 0.1m
Weight 76.6 ± 13.5 kg
Body mass index (BMI) 24.8 ± 2.8 kg/m2
HbA1c 54 ± 7 mmol/mol
7.1 ± 0.6 %
Diabetes duration 20 ± 11 years
Total daily dose (TDD) 40 ± 14 IU
Total daily basal dose (TDBD) 21.1 ± 5.3 IU
TDBD/kg/day 0.28 ± 0.07 IU/kg/day

36
3.2 Primary objective
3.2.1 Effects on 2-hour glucose during OGTT
Mean 120min plasma glucose levels were similar in both trial arms (p = 0.73). Comparison
of AUC during the first two hours of OGTT also showed no significant difference after
prolonged fasting (p = 0.21). Mean and standard deviation of primary outcomes are
detailed in Table 8 and illustrated in Figure 14.
Figure 14 Comparison of 12h fasting vs. 36h fasting for mean plasma glucose at the 120th minute (left graph)
and for AUC during the first 120 minutes of the OGTT (right graph)
3.3 Secondary objectives
3.3.1 Effects on 4-hour glycaemic pattern during OGTT
In both trial arms plasma glucose levels increased significantly over the course of the
OGTT (p < 0.0001). Overall, overnight fasting as well as prolonged fasting, presented
similar plasma glucose courses (p = 0.68). When plasma glucose levels were adjusted for
baseline, significant difference was found from the 120th minute on, while overall adjusted
plasma glucose levels were not significantly different in comparison of both trial arms (p =
0.14). Rate of change of plasma glucose levels during the OGTT was similar after 12 hours
12h fasting 36h fasting p
Mean plasma glucose
(at T5 = 120min)
308 ± 91 mg/dL 313 ± 71 mg/dL 0.73
AUC
(T1;T5 = 0;120min)
31823 ± 8557 29957 ± 5826 0.21
Table 8 Effects on 2-hour glucose during OGTT; comparison of 12h fasting vs. 36h fasting
Parameters shown with mean ± SD and p-values

37
and after 36 hours of fasting (p = 0.44). Multiple comparisons of rate of change presented
significant difference at the fifth and sixth time point. Besides, rate of change was observed
to be negative after two and a half hours into the OGTT, indicating decreasing plasma
glucose levels after this time point. Details about multiple comparisons at specific time
points can be seen in Table 9, while Figure 15 shows the course of plasma glucose levels
during the OGTT.
T1 T2 T3 T4 T5 T6 T7 Overall
PG *0.044 *0.042 *0.03 0.19 0.73 0.08 0.28 0.68
Adj. PG >0.99 0.92 0.40 0.66 *0.03 *0.002 *0.005 0.14
RCPG >0.99 0.54 0.36 0.16 *0.013 *0.025 0.47 0.44
Table 9 Comparison of 12h fasting vs. 36h fasting; p-values for the course of plasma glucose levels (PG), for
plasma glucose levels adjusted for baseline (Adj. PG) and for rate of change of plasma glucose levels
(RCPG) during OGTT; comparison at specific time points T1 (0min), T2 (15min), T3 (30min), T4 (60min),
T5 (120min), T6 (180min) and T7 (240min) during OGTT and overall over the course of the OGTT;
* indicates significant difference between fasting groups
Figure 15 Comparison of 12h fasting vs. 36h fasting for plasma glucose levels (A), for plasma glucose levels
adjusted for baseline (B) and for RCPG (rate of change of plasma glucose levels) (C) during OGTT;
means ± SD are pictured; * indicates significant difference between fasting groups

38
3.3.2 Effects on glycaemic variability and mean glucose during fasting and OGTT
Interstitial glucose levels assessed by the CGM-devices gave detailed information about
glycaemia during the fasting procedure as well as during the OGTT. Glycaemic variability
was higher during the prolonged fast, though without significant difference (p = 0.065).
Afterwards, over the course of the OGTT, glycaemic variability was similar (p = 0.41).
Mean interstitial glucose levels were numerically lower during the prolonged fast (p =
0.44) and similar during the OGTT afterwards (p = 0.84). Mean ± standard deviation of
glycaemic markers are detailed in Table 10 and illustrated in Figure 16.
12h fasting 36h fasting p
Glycaemic var. fasting 25 ± 10 % 31 ± 9 % 0.07
Glycaemic var. OGTT 27 ± 12 % 29 ± 9 % 0.41
Mean glucose fasting 138 ± 35 mg/dL 130 ± 17 mg/dL 0.44
Mean glucose OGTT 257 ± 69 mg/dL 255 ± 53 mg/dL 0.84
Table 10 Comparison of 12h fasting vs. 36h fasting for glycaemic variability and mean interstitial glucose
levels; parameters are presented with mean ± SD and p-values
Figure 16 Comparison of 12h fasting vs. 36h fasting for glycaemic variability (A, B) and mean glucose (C,
D) during the fasting procedure and during the OGTT
means ± SD are pictured

39
3.3.3 Effects on hormones and β-hydroxybutyrate during OGTT
In addition, endocrine hormones regulating and interacting with glucose metabolism were
analysed over the course of the OGTT. Proinsulin (p = 0.95) and C-peptide levels (p =
0.70) acted similar in comparison of overnight to prolonged fasting, although C-peptide
levels were non-significantly higher after the prolonged fast. Plasma levels of exogenously
administered insulin (p = 0.80) were also similar in both trial arms. After an initial steep
increase during the first 60 minutes of the OGTT, insulin concentration began to decline
slowly until the end of the test. Glucagon levels were significantly higher in the first 120
minutes after carbohydrate intake and aligned afterwards. Overall, glucagon levels were
numerically higher after the prolonged fast, but not significantly different (p = 0.18).
Overall cortisol levels also presented no significant difference after 36 hours of fasting (p =
0.51). Comparison of proinsulin (p = 0.60), C-peptide (p = 0.54), insulin (p = 0.98),
glucagon (p = 0.63) and cortisol courses (p = 0.77) were also similar when adjusted for
baseline.
However, β-hydroxybutyrate levels during the OGTT showed significantly higher
concentrations after the prolonged fast (p = 0.012); especially in the first 120 minutes.
Afterwards 36h-concentrations align with lower overnight fasting-concentrations.
Significant difference was also observed after adjustment for baseline levels of β-
hydroxybutyrate (p = 0.012).
Details about multiple comparisons at specific time points can be seen in Table 11, while
Figure 17 shows the course of hormones and β-hydroxybutyrate during the OGTT.
T1 T2 T3 T4 T5 T6 T7 Overall
C-peptide 0.88 0.53 0.31 0.32 0.97 0.33 0.11 0.70
Proinsulin 0.49 0.57 0.22 0.77 0.97 0.77 0.66 0.95
Insulin 0.36 0.59 0.51 0.47 0.33 0.41 0.97 0.80
Glucagon 0.35 *0.045 *0.018 *0.01 *0.044 0.98 0.83 0.18
Cortisol 0.18 *0.019 *0.022 0.48 0.45 0.34 0.42 0.51
BHB *0.002 *0.001 *0.001 *0.003 *0.008 0.13 0.14 *0.012
Table 11 Comparison of 12h fasting vs. 36h fasting; p-values for the course of C-peptide, proinsulin, insulin,
glucagon, cortisol and β-hydroxybutyrate (BHB) during OGTT without adjustment for baseline; comparison
at specific time points T1 (0min), T2 (15min), T3 (30min), T4 (60min), T5 (120min), T6 (180min) and T7
(240min) during OGTT and overall over the course of the OGTT
* indicates significant difference between fasting groups
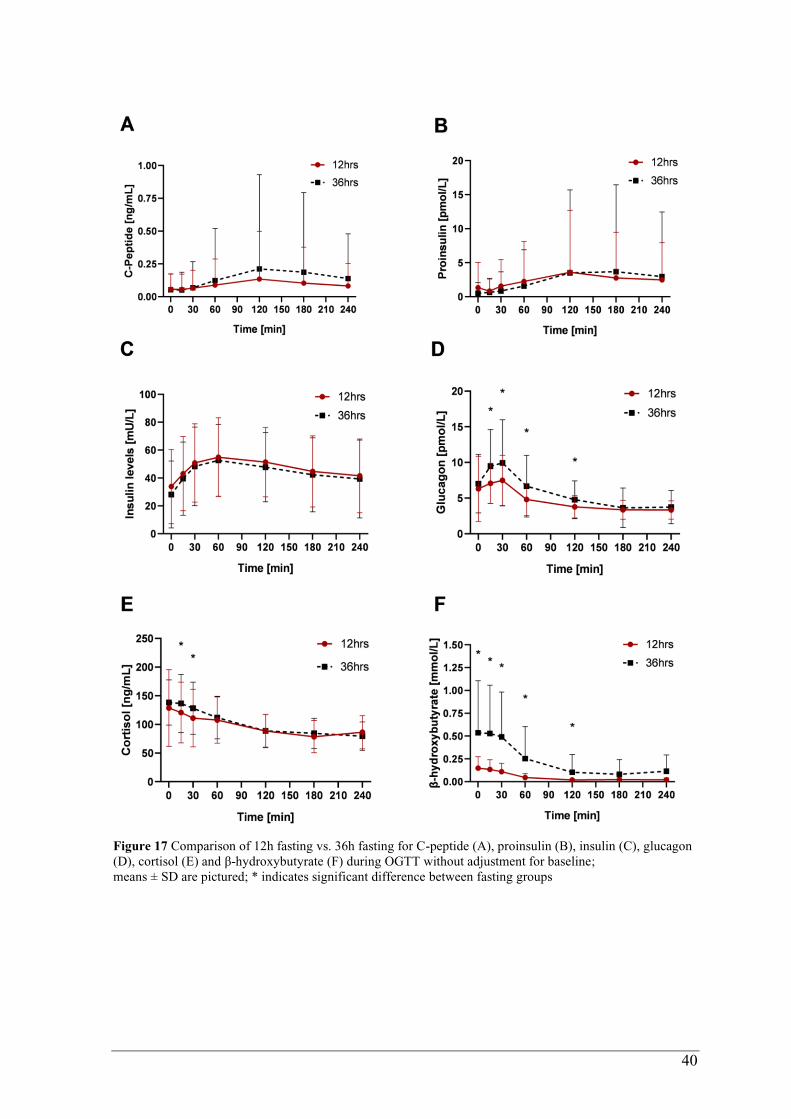
40
Figure 17 Comparison of 12h fasting vs. 36h fasting for C-peptide (A), proinsulin (B), insulin (C), glucagon
(D), cortisol (E) and β-hydroxybutyrate (F) during OGTT without adjustment for baseline;
means ± SD are pictured; * indicates significant difference between fasting groups

41
3.3.4 Effects on Time in Range (TIR)
During the fasting process and the OGTT interstitial glucose levels were continuously
measured by CGM-sensors which participants were equipped with. This data provided
calculation of time spent in certain glycaemic ranges. During the overnight fast and the
prolonged fast, times spent in hyperglycaemia, normoglycaemia and hypoglycaemia were
similar overall (p = 0.10). Also, over the course of the OGTT both trial arms presented no
significant difference (p = 0.60) in matters of time above, in or below range. Afterwards
multiple comparisons for each specific range were performed; during fasting as well as
during OGTT no significant differences were observed in specific glycaemic ranges.
Details about multiple comparisons can be seen in Table 13, while Figure 18 illustrates
times spent in specific ranges.
TAR L2 TAR L1 TIR TBR L1 TBR L2 Overall
Fasting 0.99 0.93 0.77 0.98 0.99 0.10
OGTT >0.99 0.90 >0.99 0.96 0.99 0.60
Table 12 Comparison of 12h fasting vs. 36h fasting; p-values for time spent in specific ranges during the
fasting process and during the OGTT;
TAR = time above range (L1 = level 1 = 181 – 250mg/dL; L2 = level 2 = above 250mg/dL)
TIR = time in range (70 – 180mg/dL)
TBR = time below range (L1= level 1 = 54 – 69mg/dL; L2 = level 2 = below 54mg/dL)
Figure 18 Comparison of 12h fasting vs. 36h fasting for time spent in specific ranges during the fasting
process (left graph) and during the OGTT (right graph)
TAR = time above range (L1 = level 1 = 181 -250mg/dL; L2 = level 2 = above 250mg/dL)
TIR = time in range (70 – 180mg/dL)
TBR = time below range (L1= level 1 = 54 -69mg/dL; L2 = level 2 = below 54mg/dL)
means ± SD are pictured
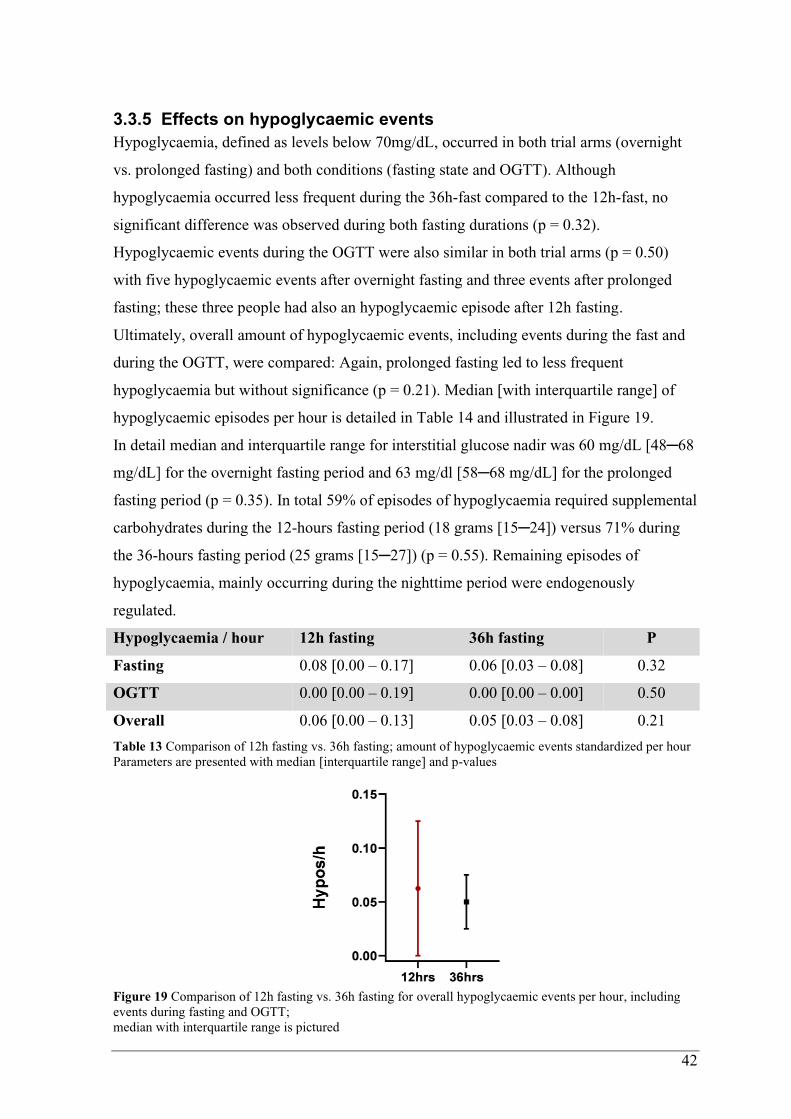
42
3.3.5 Effects on hypoglycaemic events
Hypoglycaemia, defined as levels below 70mg/dL, occurred in both trial arms (overnight
vs. prolonged fasting) and both conditions (fasting state and OGTT). Although
hypoglycaemia occurred less frequent during the 36h-fast compared to the 12h-fast, no
significant difference was observed during both fasting durations (p = 0.32).
Hypoglycaemic events during the OGTT were also similar in both trial arms (p = 0.50)
with five hypoglycaemic events after overnight fasting and three events after prolonged
fasting; these three people had also an hypoglycaemic episode after 12h fasting.
Ultimately, overall amount of hypoglycaemic events, including events during the fast and
during the OGTT, were compared: Again, prolonged fasting led to less frequent
hypoglycaemia but without significance (p = 0.21). Median [with interquartile range] of
hypoglycaemic episodes per hour is detailed in Table 14 and illustrated in Figure 19.
In detail median and interquartile range for interstitial glucose nadir was 60 mg/dL [48─68
mg/dL] for the overnight fasting period and 63 mg/dl [58─68 mg/dL] for the prolonged
fasting period (p = 0.35). In total 59% of episodes of hypoglycaemia required supplemental
carbohydrates during the 12-hours fasting period (18 grams [15─24]) versus 71% during
the 36-hours fasting period (25 grams [15─27]) (p = 0.55). Remaining episodes of
hypoglycaemia, mainly occurring during the nighttime period were endogenously
regulated.
Hypoglycaemia / hour 12h fasting 36h fasting P
Fasting 0.08 [0.00 – 0.17] 0.06 [0.03 – 0.08] 0.32
OGTT 0.00 [0.00 – 0.19] 0.00 [0.00 – 0.00] 0.50
Overall 0.06 [0.00 – 0.13] 0.05 [0.03 – 0.08] 0.21
Table 13 Comparison of 12h fasting vs. 36h fasting; amount of hypoglycaemic events standardized per hour
Parameters are presented with median [interquartile range] and p-values
Figure 19 Comparison of 12h fasting vs. 36h fasting for overall hypoglycaemic events per hour, including
events during fasting and OGTT;
median with interquartile range is pictured
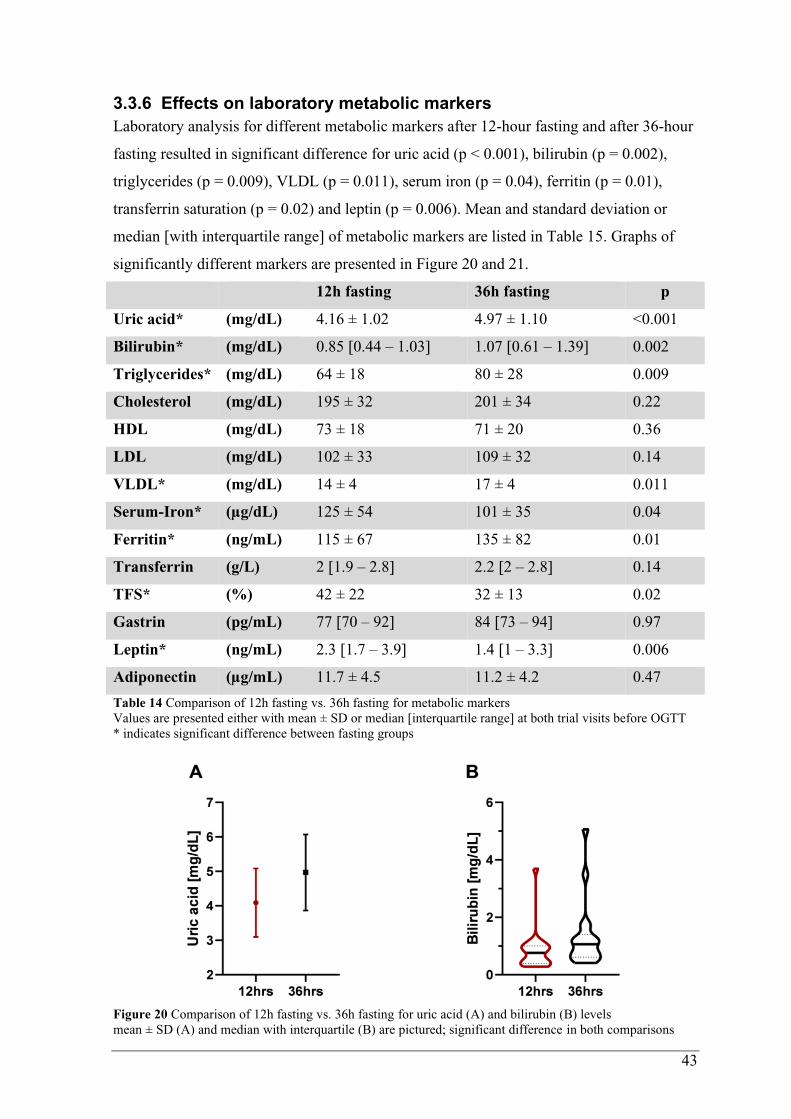
43
3.3.6 Effects on laboratory metabolic markers
Laboratory analysis for different metabolic markers after 12-hour fasting and after 36-hour
fasting resulted in significant difference for uric acid (p < 0.001), bilirubin (p = 0.002),
triglycerides (p = 0.009), VLDL (p = 0.011), serum iron (p = 0.04), ferritin (p = 0.01),
transferrin saturation (p = 0.02) and leptin (p = 0.006). Mean and standard deviation or
median [with interquartile range] of metabolic markers are listed in Table 15. Graphs of
significantly different markers are presented in Figure 20 and 21.
12h fasting 36h fasting p
Uric acid* (mg/dL) 4.16 ± 1.02 4.97 ± 1.10 <0.001
Bilirubin* (mg/dL) 0.85 [0.44 – 1.03] 1.07 [0.61 – 1.39] 0.002
Triglycerides* (mg/dL) 64 ± 18 80 ± 28 0.009
Cholesterol (mg/dL) 195 ± 32 201 ± 34 0.22
HDL (mg/dL) 73 ± 18 71 ± 20 0.36
LDL (mg/dL) 102 ± 33 109 ± 32 0.14
VLDL* (mg/dL) 14 ± 4 17 ± 4 0.011
Serum-Iron* (µg/dL) 125 ± 54 101 ± 35 0.04
Ferritin* (ng/mL) 115 ± 67 135 ± 82 0.01
Transferrin (g/L) 2 [1.9 – 2.8] 2.2 [2 – 2.8] 0.14
TFS* (%) 42 ± 22 32 ± 13 0.02
Gastrin (pg/mL) 77 [70 – 92] 84 [73 – 94] 0.97
Leptin* (ng/mL) 2.3 [1.7 – 3.9] 1.4 [1 – 3.3] 0.006
Adiponectin (µg/mL) 11.7 ± 4.5 11.2 ± 4.2 0.47
Table 14 Comparison of 12h fasting vs. 36h fasting for metabolic markers
Values are presented either with mean ± SD or median [interquartile range] at both trial visits before OGTT
* indicates significant difference between fasting groups
Figure 20 Comparison of 12h fasting vs. 36h fasting for uric acid (A) and bilirubin (B) levels
mean ± SD (A) and median with interquartile (B) are pictured; significant difference in both comparisons

44
Figure 21 Comparison of 12h fasting vs. 36h fasting for triglycerides (A), very-low density lipoproteins (B),
leptin (C), serum-iron (D), ferritin (E) and transferrin saturation (F) levels.
mean ± SD (A,B, D, E, F) and median with interquartile (C) are pictured;
significant difference in all comparisons
3.3.7 Effects on body composition
Bodyweight was significantly lower after prolonged fasting when compared to overnight
fasting (p = 0.0002) resulting in a significantly lower BMI (p = 0.0001). Body cell mass (p
= 0.73) and fatty mass (p = 0.26) were not significantly different after the prolonged fast,
although fatty mass was reduced. Total body water (p = 0.46) was also similar at both trial
visits with similar water consumption per hour (p = 0.27) during the fasting periods. Mean
values with standard deviation are seen in Table 16 below and graphs illustrating
differences are presented in Figure 22.

45
Table 15 Comparison of 12h fasting vs. 36h fasting for body composition
BIA-parameters are presented with mean ± SD at both trial visits before OGTT
* indicates significant difference between fasting groups
Figure 22 Comparison of 12h fasting vs. 36h fasting for weight (A), fatty mass (B), body cell mass (C),
BMI (D), total body water (E) and water consumption per hour (F);
means ± SD are pictured; * indicates significant difference between fasting groups in particular comparison
12h fasting 36h fasting p
Bodyweight* 76.7 ± 13.5 kg 75.4 ± 13.4 kg 0.0002
BMI* 24.6 ± 2.8 kg/m2 24.2 ± 2.9 kg/m2 0.0001
Body cell mass 29.9 ± 6.9 kg 30.3 ± 7,7 kg 0.73
Fatty mass 20 ± 5.6 kg 18.4 ± 6.8 kg 0.26
Total body water 40.2 ± 8.4 liters 39.7 ± 8.9 liters 0.46
Water consumption 67.2 ± 38.7 ml/h 78.83 ± 24.65 ml/h 0.27

46
3.3.8 Effects on REE and metabolisation of macromolecules
REE (p = 0.92) and protein metabolism (p = 0.64) were similar after prolonged fasting.
Metabolisation of carbohydrates decreased significantly (p = 0.007), while fat oxidation
increased remarkably (p < 0.001) resulting in a lower RQ (p < 0.001). Quality of steady
state, which was used for calculation, showed no significant difference between both trial
visits/measurements (p = 0.30). Mean and standard deviation of spirometry parameters are
detailed in Table 17 and illustrated in Figure 23.
12h fasting 36h fasting p
REE 2191 ± 357 kcal/d 2186 ± 349 kcal/d 0.92
Protein oxidation 25 ± 4 g/d 25 ± 4 g/d 0.63
Carbohydrate oxidation* 305 ± 98 g/d 215 ± 63 g/d 0.007
Fat oxidation* 90 ± 40 g/d 130 ± 35 g/d < 0.001
RQ* 0.87 ± 0.05 0.82 ± 0.03 < 0.001
Quality of Steady State 62.8 ± 25.7 % 70 ± 23.5 % 0.30
Table 16 Comparison of 12h fasting vs. 36h fasting during spirometry
Spirometry-parameters are presented with mean ± SD at both trial visits before OGTT; *indicates signif. diff.
Figure 23 Comparison of 12h fasting vs. 36h fasting for REE (A), RQ (B), Quality of Steady State (C) and
metabolisation of macromolecules (D-F); means ± SD are pictured; * indicates significant difference
47
3.3.9 Comparison of daytime and nighttime
Additionally, some parameters, like hypoglycaemic events per hour, mean glucose,
glycaemic variability and time in range, were separated for daytime and nighttime
comparison. Daytime was defined as an 18-hour time period from 6am to 12am, while
nighttime lasted for 6 hours from 12am to 6am.
- During the day (p = 0.14) as well as during the night (p = 0.22) overnight fasting had
numerically more frequent hypoglycaemic events per hour than prolonged fasting, but this
difference was not significant. Similarly, hypoglycaemia occurred more often during the
day than in the night within both trial arms; again without significant difference (12hrs: p =
0.31 and 36hrs: p = 0.47).
- Participants had similar mean interstitial glucose levels in overnight compared to
prolonged fasting during the day (p = 0.56) and during the first night (p = 0.99). However,
the second night in prolonged fasting was associated with significantly lower mean
interstitial glucose levels compared to the night of 12-hours fasting (p = 0.05) and first
night of 36-hours fasting (p = 0.021). Direct comparison of day- to nighttime mean glucose
within the trial arms showed similar values during overnight (p = 0.90) and prolonged
fasting (p = 0.22).
- Other than that, prolonged fasting led to numerically higher glycaemic variability during
the day (p = 0.11) and significantly higher glycaemic variability during the night (p =
0.012) when compared to overnight fasting. Besides, nighttime glycaemic variability was
significantly lower than daytime values in each trial arm (12hrs: p = 0.04; 36hrs: p = 0.04).
- Time spent in normoglycaemia was numerically but not significantly higher in prolonged
fasting with daytime values (p = 0.14) and nighttime values (p = 0.72) being similar to
overnight fasting values. In both trial arms time in normoglycemic range was slightly
higher in the night than during the day (12hrs: p = 0.32; 36hrs: = p = 0.48). Details about
mean ± standard deviation or median [with interquartile range] of each parameter can be
seen in Table 18, while p-values of each comparison are presented in Table 19. Graphs of
each comparison are illustrated in Figure 24 and Figure 25.
Graphs illustrating mean interstitial glucose courses during both fasting periods can be
seen in Figure 26.
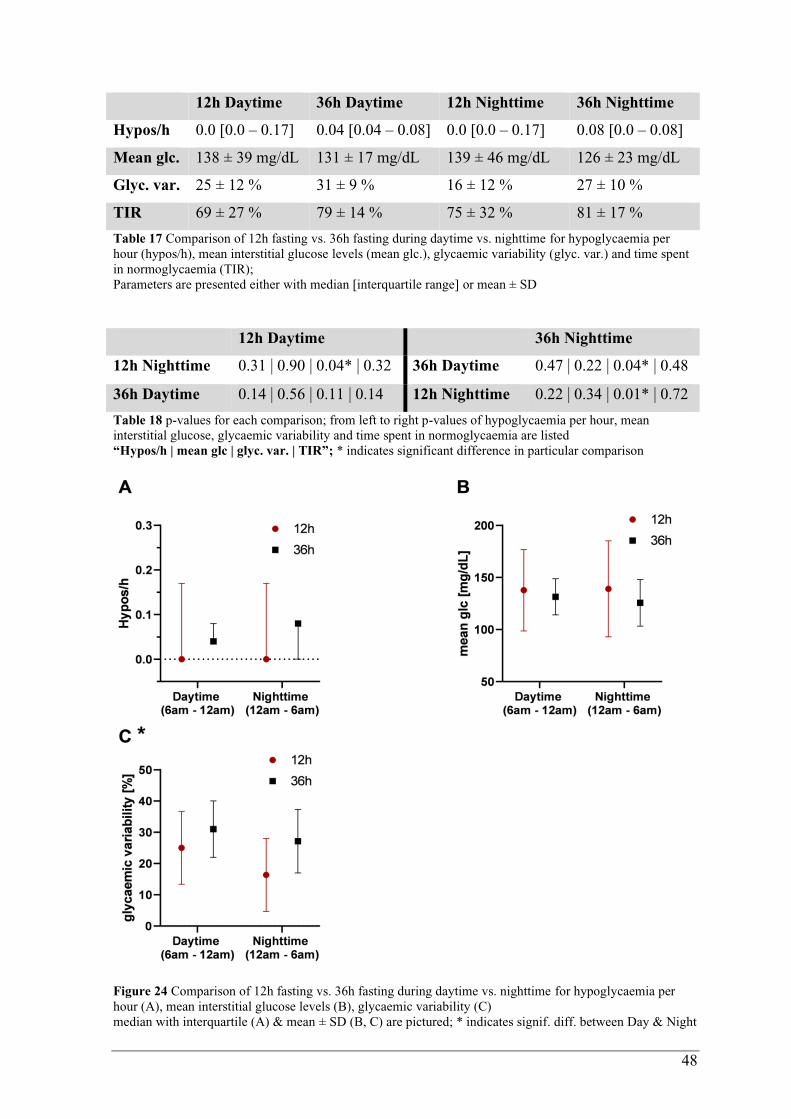
48
12h Daytime 36h Daytime 12h Nighttime 36h Nighttime
Hypos/h 0.0 [0.0 – 0.17] 0.04 [0.04 – 0.08] 0.0 [0.0 – 0.17] 0.08 [0.0 – 0.08]
Mean glc. 138 ± 39 mg/dL 131 ± 17 mg/dL 139 ± 46 mg/dL 126 ± 23 mg/dL
Glyc. var. 25 ± 12 % 31 ± 9 % 16 ± 12 % 27 ± 10 %
TIR 69 ± 27 % 79 ± 14 % 75 ± 32 % 81 ± 17 %
Table 17 Comparison of 12h fasting vs. 36h fasting during daytime vs. nighttime for hypoglycaemia per
hour (hypos/h), mean interstitial glucose levels (mean glc.), glycaemic variability (glyc. var.) and time spent
in normoglycaemia (TIR);
Parameters are presented either with median [interquartile range] or mean ± SD
12h Daytime 36h Nighttime
12h Nighttime 0.31 | 0.90 | 0.04* | 0.32 36h Daytime 0.47 | 0.22 | 0.04* | 0.48
36h Daytime 0.14 | 0.56 | 0.11 | 0.14 12h Nighttime 0.22 | 0.34 | 0.01* | 0.72
Table 18 p-values for each comparison; from left to right p-values of hypoglycaemia per hour, mean
interstitial glucose, glycaemic variability and time spent in normoglycaemia are listed
“Hypos/h | mean glc | glyc. var. | TIR”; * indicates significant difference in particular comparison
Figure 24 Comparison of 12h fasting vs. 36h fasting during daytime vs. nighttime for hypoglycaemia per
hour (A), mean interstitial glucose levels (B), glycaemic variability (C)
median with interquartile (A) & mean ± SD (B, C) are pictured; * indicates signif. diff. between Day & Night

49
Figure 25 Comparison of 12h fasting vs. 36h fasting during daytime vs. nighttime for time spent in
normoglycaemia (A) and time spent in specific ranges (B)
TAR = time above range (L1 = level 1 = 181 -250mg/dL; L2 = level 2 = above 250mg/dL)
TIR = time in range (70 – 180mg/dL)
TBR = time below range (L1= level 1 = 54 -69mg/dL; L2 = level 2 = below 54mg/dL)
means ± SD are pictured
Figure 26 Interstitial plasma glucose courses during fasting
values assessed during 12h and 36h fasting assessed by CGM-devices; colored area presents SD, while the
line presents mean values at every time point; graph begins at 7pm (1h before starting the fast)
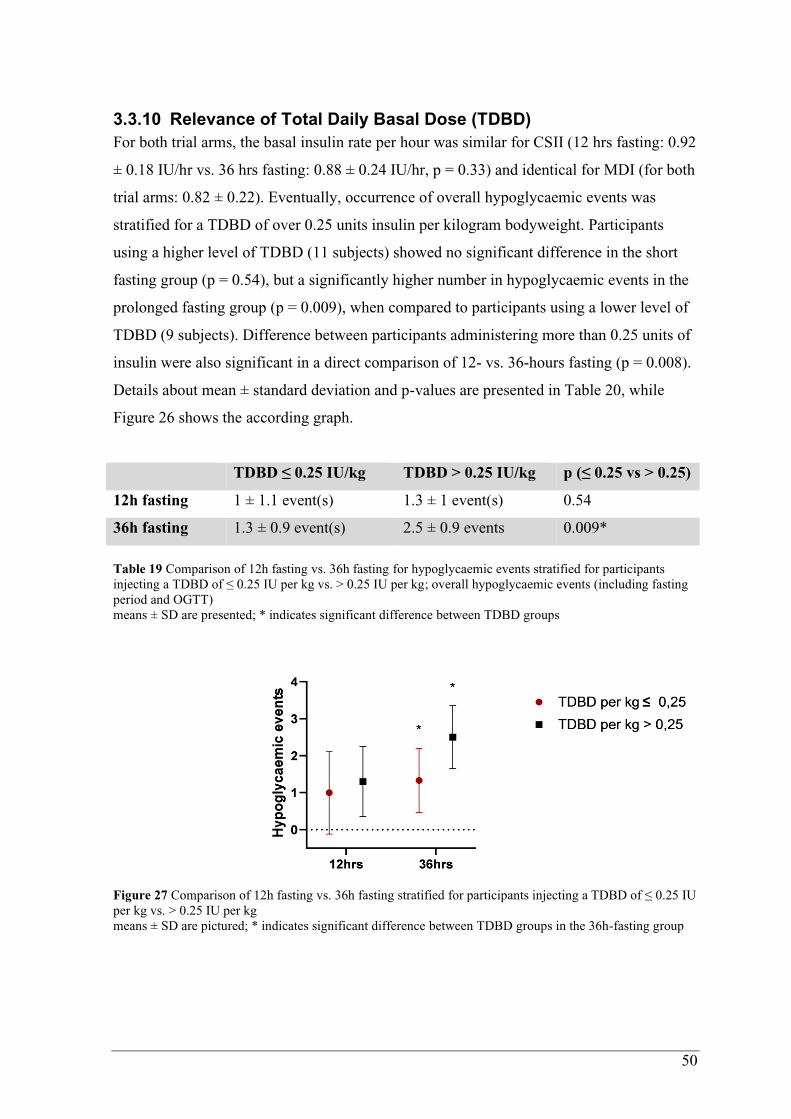
50
3.3.10 Relevance of Total Daily Basal Dose (TDBD)
For both trial arms, the basal insulin rate per hour was similar for CSII (12 hrs fasting: 0.92
± 0.18 IU/hr vs. 36 hrs fasting: 0.88 ± 0.24 IU/hr, p = 0.33) and identical for MDI (for both
trial arms: 0.82 ± 0.22). Eventually, occurrence of overall hypoglycaemic events was
stratified for a TDBD of over 0.25 units insulin per kilogram bodyweight. Participants
using a higher level of TDBD (11 subjects) showed no significant difference in the short
fasting group (p = 0.54), but a significantly higher number in hypoglycaemic events in the
prolonged fasting group (p = 0.009), when compared to participants using a lower level of
TDBD (9 subjects). Difference between participants administering more than 0.25 units of
insulin were also significant in a direct comparison of 12- vs. 36-hours fasting (p = 0.008).
Details about mean ± standard deviation and p-values are presented in Table 20, while
Figure 26 shows the according graph.
TDBD ≤ 0.25 IU/kg TDBD > 0.25 IU/kg p (≤ 0.25 vs > 0.25)
12h fasting 1 ± 1.1 event(s) 1.3 ± 1 event(s) 0.54
36h fasting 1.3 ± 0.9 event(s) 2.5 ± 0.9 events 0.009*
Table 19 Comparison of 12h fasting vs. 36h fasting for hypoglycaemic events stratified for participants
injecting a TDBD of ≤ 0.25 IU per kg vs. > 0.25 IU per kg; overall hypoglycaemic events (including fasting
period and OGTT)
means ± SD are presented; * indicates significant difference between TDBD groups
Figure 27 Comparison of 12h fasting vs. 36h fasting stratified for participants injecting a TDBD of ≤ 0.25 IU
per kg vs. > 0.25 IU per kg
means ± SD are pictured; * indicates significant difference between TDBD groups in the 36h-fasting group
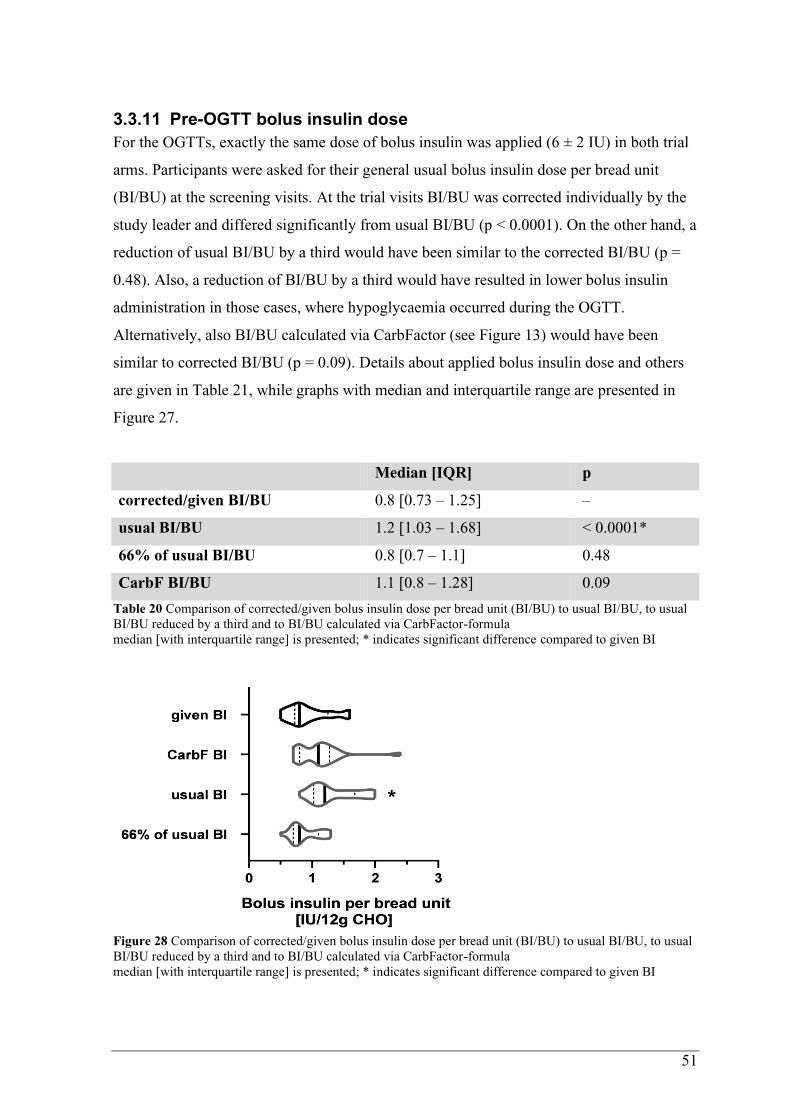
51
3.3.11 Pre-OGTT bolus insulin dose
For the OGTTs, exactly the same dose of bolus insulin was applied (6 ± 2 IU) in both trial
arms. Participants were asked for their general usual bolus insulin dose per bread unit
(BI/BU) at the screening visits. At the trial visits BI/BU was corrected individually by the
study leader and differed significantly from usual BI/BU (p < 0.0001). On the other hand, a
reduction of usual BI/BU by a third would have been similar to the corrected BI/BU (p =
0.48). Also, a reduction of BI/BU by a third would have resulted in lower bolus insulin
administration in those cases, where hypoglycaemia occurred during the OGTT.
Alternatively, also BI/BU calculated via CarbFactor (see Figure 13) would have been
similar to corrected BI/BU (p = 0.09). Details about applied bolus insulin dose and others
are given in Table 21, while graphs with median and interquartile range are presented in
Figure 27.
Median [IQR] p
corrected/given BI/BU 0.8 [0.73 – 1.25] –
usual BI/BU 1.2 [1.03 – 1.68] < 0.0001*
66% of usual BI/BU 0.8 [0.7 – 1.1] 0.48
CarbF BI/BU 1.1 [0.8 – 1.28] 0.09
Table 20 Comparison of corrected/given bolus insulin dose per bread unit (BI/BU) to usual BI/BU, to usual
BI/BU reduced by a third and to BI/BU calculated via CarbFactor-formula
median [with interquartile range] is presented; * indicates significant difference compared to given BI
Figure 28 Comparison of corrected/given bolus insulin dose per bread unit (BI/BU) to usual BI/BU, to usual
BI/BU reduced by a third and to BI/BU calculated via CarbFactor-formula
median [with interquartile range] is presented; * indicates significant difference compared to given BI

52
4 Discussion According to the WHO, incidence rates of obesity have tripled since 1975 and high BMI is
classified as a major risk factor for cardiovascular, metabolic, musculoskeletal, and even
neoplastic diseases (76). Additionally, during follow-up of DCCT-participants in the EDIC
study, excessive weight gain was associated with insulin resistance and atherosclerosis
(98). Contrary to widespread belief, prevalence of obesity and overweight in the population
with T1D is equivalent to prevalence in general population (99). Therefore, maintaining
healthy bodyweight is also of great importance in people with T1D. For this, mostly
physical activity and balanced diet are recommended. Nevertheless, in recent years,
alternative strategies with the aim of weight loss without continuous caloric restriction
have been established in form of intermittent fasting.
To the best of our knowledge, this is the first study to investigate the glycaemic and
hormonal processes in people with T1D during and after a prolonged fast by performing an
Oral Glucose Tolerance Test. Although some Ramadan-studies addressed the problem of
fasting with T1D, none of these assessed glucose metabolism after breaking the fast.
Therefore, this study provides important information for health care providers and affected
individuals when people with T1D plan to fast for a prolonged period.
4.1 Plasma glucose courses after breaking prolonged fasting
In our primary objectives, no significant differences were found between overnight and
prolonged fasting; mean and area under the curve of plasma glucose levels during OGTT
were similar in both trial visits. Likewise, additional analyses of the glycaemic pattern
(Tab. 9 and Fig. 15) during OGTT presented similar plasma glucose courses overall.
However, when adjusted for baseline prolonged fasting was associated with higher blood
sugar from the second hour on; mean difference between 12h and 36h fasting was even
46mg/dl three hours after carbohydrate intake (see Figure 15 → B). In both trial arms,
negative RCPG values indicate similarly decreasing plasma glucose levels shortly after the
120th minute of OGTT, most likely due to maximum pharmacodynamic of administered
bolus insulin. Additionally, mean glucose, glycaemic variability, and time spent in specific
ranges were comparable during the OGTT after a 12h and 36h fast.
In sum, glycaemic pattern were similar in both trial arms without any safety relevant
difference. In our initial hypothesis, we assumed that glycogen storages might deplete, and
insulin sensitivity might increase in individuals with T1D, who fast for 36 hours.
Eventually, this would lead to hypoglycaemia after the first high caloric intake if bolus
53
insulin dose was same as after overnight fasting. Results of this study, however, proved
that plasma glucose courses and parameters are similar in prolonged fasting and usual
overnight fasting, although same amount of bolus insulin was administered at the first high
carbohydrate intake.
4.2 Role of endocrine hormones
Endocrine hormones during OGTT were also analysed to detect probable reasons, why
both trial arms had similar glycaemic excursions. Interestingly, C-peptide levels were non-
significantly higher in the 36h fasting group reflecting minimal endogenous insulin
production. Nonetheless, C-peptide levels were clearly below physical postprandial C-
peptide levels (29) and produced amount of endogenous insulin was negligible, with
insulin levels being similar in both trial arms. Every participant received their individual
bolus insulin dose at both trial visits, also pharmacodynamic and pharmacokinetic of
exogenously administered bolus insulin was similar in both trial visits (see Fig. 17 → C).
Therefore, alternations in insulin sensitivity and insulin bioavailability would have resulted
in different plasma glucose courses during the OGTT, which was not the case. Cortisol
levels were also similar in 36h and 12h fasting. As expected, cortisol levels decreased
continuously during the 4-hour duration of the OGTT, most probably due to circadian
rhythm (100). Interestingly, instead of decreasing glucagon values we observed an increase
in glucagon secretion right after the carbohydrate-intake. According to Hare et al. this
inappropriate glucagon response is seen in T1D after oral administration of carbohydrates,
but not after intravenous infusion, suggesting paradoxical gastrointestinal pathways
inducing glucagon secretion in T1D (101). Although, overall glucagon courses were
similar in both trial arms, glucagon levels in the prolonged fasting group were significantly
higher in the first two hours after carbohydrate intake during the OGTT. Therefore, we
assume that prolonged fasting triggers inappropriate glucagon secretion after oral
carbohydrate-intake. This also might be the answer, why adjusted plasma glucose levels
were higher in the 36h fasting group.
4.3 Glycaemia during the fasting period
Using data from the CGM devices, we also had an insight about certain glycaemic
parameters during the fasting period, such as mean glucose, glycaemic variability, and time
in specific ranges. Neither one of these parameters presented significant differences
between overnight and prolonged fasting. As expected, mean glucose was numerically
lower during the 36h fast, mostly due to the low glucose levels at the second half of
54
fasting. Similar decreases in fasting glucose levels in intermittent fasting were described by
Cho et al. (84). Nevertheless, in both trial arms mean glucose was within normoglycemic
range with values slightly below 140mg/dL equivalent to a HbA1c of 6.5%.
Glycaemic variability increased noticeably but not significantly from mean 26% (12h) to
31% (36h), although glucose courses seemed similarly homogenous in both fasting periods
(see Fig. 26). Elevated glycaemic variability reflects high interquartile range within the fast
and should not be underestimated since it is a predictor for hypoglycaemia (102,103).
According to Monnier et al., the threshold for stable glycaemic variability is defined as
≤36% (104). Therefore, variability in glucose courses during prolonged fasting are stable,
though numerically elevated compared to overnight fasting.
In both trial arms, time spent in normoglycemic range was above 70% as recommended by
the American Diabetes Association (63); 73% in 12h fasting and 80% in 36h fasting.
Percentages of time spent above glycaemic range as well as time spent below glycaemic
range decreased numerically during prolonged fasting in favour of time spent in range (see
Fig. 18). This is from relevance since previous studies have demonstrated that every 10%
increase in time in range results in a 0.6 to 0.8% decrease in HbA1c (64,65). Although non-
significant, this improvement in euglycaemia without further dysglycaemia is exemplary
for the feasibility and benefits of prolonged fasting with T1D.
4.4 Risk for hypoglycaemia during and after prolonged fasting
One of the most relevant questions answered with this study is if incidence of
hypoglycaemia increases during prolonged fasting and after the first high energy intake.
OGTTs were discontinued five times after 12h fasting and three times after 36h fasting.
Neither during the fast nor during the following OGTT, prolonged fasting led to significant
differences compared to overnight fasting. Detailed analysis presented even lower
hypoglycaemia rates per hour in the 36h fasting group (see Tab. 14 and Fig. 19). For
comparison: overall hypoglycaemia per hour, including the fast and the OGTT, was 0.06 in
12h fasting and 0.05 in 36h fasting. This translates into one hypoglycaemic event every
16.6 hours in overnight fasting, while prolonged fasting leads to one hypoglycaemic event
every 20 hours. On the other hand, hypoglycaemia occurring during the 12h fast required
numerically less supplemental carbohydrates than the 36h fast: In numbers, 59% of 12h
fasts needed a mean of 18gr versus 71% of 36h fasts needing a mean of 25gr of
carbohydrates. In summary, prolonged fasting leads to less frequent hypoglycaemia, but
the hypoglycaemic events that do occur are more likely to require (a higher amount of)
carbohydrates. These findings are contrary to recommendations of some previous studies,
55
where people with T1D are classified as a very high-risk group for prolonged fasting due
to a higher incidence of hypoglycaemia (5,93).
The question arises, why T1D is believed to trigger hypoglycaemia in prolonged fasting,
while incidence for hypoglycaemia even had a numerical decrease in our study: As known,
T1D is characterized by lack of endogenous insulin production, while catabolic hormones
do function. Therefore, when people with T1D pause insulin administration at all,
hyperglycaemia would be the more anticipated dysglycaemic excursion. During a fasting
period, bolus insulin is redundant, while individual basal insulin is needed to prevent
hyperglycaemic ketoacidosis. Without physical exercise and without bolus insulin
administration, hypoglycaemia in our prolonged fast is more likely to result from excessive
concentrations of basal insulin (see chapter 4.9) or possibly increased sensitivity to first
administration of bolus insulin. First, basal insulin dose was the same in MDI treated
participants and similar in CSII treated participants in both trial arms; therefore, this was
not the reason for decreasing hypoglycaemia incidence in 36h fasting. Second, according
to similar glucose courses during the OGTTs, an increased sensitivity to insulin after
prolonged fasting is not the case. This is in line with observations of Salgin et al., who
described reductions – rather than an increase – of insulin sensitivity in a 24h fast in
healthy adults (105). Ultimately, a decrease in insulin sensitivity and the absence of bolus
insulin might be reasons why prolonged fasting had numerically more time spent in
normoglycaemia and numerically less hypoglycaemic events per hour.
4.5 Impact on metabolism of specific macromolecules
Spirometry presented similar REE in both trial arms with protein metabolism being
unchanged. However, as expected, 36 hours of fasting lead to a significant decrease in
carbohydrate metabolism, while fat oxidation rose significantly from mean 90g/d to
129g/d. This effect is called “metabolic switch” and represents the main goal of
intermittent fasting: depleting glycogen storages to induce fat oxidation, while maintaining
muscle mass (106). These findings are in line with our laboratory results, where we
observed significantly higher β-hydroxybutyrate-levels after the prolonged fast (see Fig. 17
→ F) proving the shift to lipolysis. After breaking the fast, ketone levels subsequently
decreased similarly to Fig. 7 (66). Maximum ketone level was 0.5 mmol/l after the 36h
fast, which still represents normal ketone levels according to the classification of diabetic
ketoacidosis from the British NHS (107). To sum up, prolonged fasting in people with T1D
led to controlled fat oxidation without pathologically high levels of β-hydroxybutyrate if
basal insulin was maintained.

56
4.6 Intermittent fasting and weight loss
Participants in our study had 1.3kg less mean bodyweight after the 36h fast, which
represents a significant weight loss. Of course, the question arises, which compartments
diminished during the prolonged fast. As described above, the goal of intermittent fasting
is to lose weight in form of fat without losing muscle mass. We observed a numerical but
not-significant decrease in fatty mass from 20kg to 18.4kg. Meanwhile body cell mass –
representing muscle mass in a certain way – had no decrease at all. These results are in line
with previous findings, where intermittent day fasting significantly reduced fatty mass
(80,84), while fat free mass was preserved (81,108). However, like Heilbronn et al. (68),
we recommend adding a small meal to the fast during prolonged fasting periods, to prevent
reduction in muscle mass if intermittent fasting is performed on a regular basis.
Additionally, to avoid any bias, we instructed our participants to drink similar amounts of
water in both fasting states. We observed comparable water consumption per hour as well
as comparable total body water in both trial arms. Therefore, our findings indicate that
weight loss is neither due to dehydration nor due to loss in muscle, mass rather decreases
in fatty mass. If people with T1D desire improvements in body composition, prolonged
fasting is a proven way to reduce bodyweight while maintaining lean mass.
4.7 Laboratory differences after prolonged fasting
Laboratory differences were mainly based on the metabolic shift from carbohydrate
metabolism to fat oxidation: The higher requirement for lipids by peripheral tissue is
reflected in significant increases of triglycerides and VLDL, as well as numerical increase
of LDL in the serum. HDL, on the other hand, presented no difference. Common
description of LDL as “bad cholesterol” and HDL as “good cholesterol” is not appropriate
in this setting. Since LDL transports cholesterol from the liver to the peripheral tissue and
HDL acts the opposite direction, an increase of LDL is needed and usual in fat metabolism
(109).
Additionally, fat metabolism led to a decrease in uric acid excretion by the kidney in the
presence of elevated ketones; ultimately resulting in higher uric acid levels after the 36h
fast. Other than that, leptin, which is proportional to fat mass and inversely regulates
sensation of hunger (110), decreased significantly after prolonged fasting. This decrease of
leptin is in line with reduced fatty mass and increased appetite.
Hyperbilirubinemia, as it was observed previously (111), was also present in this study,
probably resulting from reduced hepatic bilirubin clearance (112). In terms of iron
metabolism, serum-iron and ferritin were higher after the 36h fast. Similar results were
57
described in previous studies after ≥12 hours of fasting (113).
To sum up, changes in laboratory parameters were either results of lipid metabolism or
previously observed reactions to prolonged food deprivation.
4.8 Circadian variation in glycaemia & nocturnal hypoglycaemia
Comparison of daytime, defined as 6am to midnight, and nighttime, defined as midnight to
6am, led to additional information about glycaemic parameters. For example, nocturnal
occurrence of hypoglycaemia needed to be answered, since more than half of severe
hypoglycaemia were recorded during the sleep in the Diabetes Control and Complications
Trial (114). In our study, however, nocturnal hypoglycaemia was not significantly
increased by prolonged fasting (nor by overnight fasting). Besides, time in normoglycemic
range and mean glucose values were comparable during daytime and nighttime in both trial
arms. Only glycaemic variability presented diurnal variation with significantly lower
values during the nighttime in both, 12h and 36h fasting (see Table 18, Fig.24 → C).
Rodbard et al. observed that elevated glycaemic variability is directly proportional to risk
for hypoglycaemia (103). Therefore, the nocturnal improvement in glycaemic variability
lowers risk for hypoglycaemic events. Monnier et al. defined a glycaemic variability of
≤36% as stable glycaemia (104). According to these thresholds, participants of this study
had stable glycaemia during the day as well as during the night.
These findings indicate that prolonged fasting can be performed without any specific
precautions during the night if glucose levels were stable during the day. Even further, it
seems that nighttime fasting periods are less likely to result in dysglycaemia. This fact
might be relevant and comforting for health care providers and people with T1D if they are
afraid of nocturnal hypoglycaemia during prolonged/intermittent fasting.
4.9 Relevance of TDBD in hypoglycaemia
As discussed above (see chapter 4.4.), we assume that hypoglycaemia in fasting type 1
diabetics is mainly triggered by exogenously administered insulin. In this study, individual
basal insulin dose was administered as usual during the fasting process, while bolus insulin
was not needed. As a further consequence, we hypothesized that TDBD was the main
trigger factor for hypoglycaemia in this setting. For this, we stratified TDBD for kilograms
of bodyweight and set a limit at 0.25 IU/kg similar to a previous study by Strich et al.,
where the limit was set at 0.2 IU/kg (115). As described by Strich et al., participants who
were treated with higher amounts of basal insulin had significantly more hypoglycaemic
events in prolonged fasting (during the fast and the OGTT). Mean amount of

58
hypoglycaemia was almost twofold in subjects administering a TDBD of >0.25 IU/kg
bodyweight. Interestingly, this significant difference was not observed in the overnight
fasting group, where high and low TDBD led to similar amounts of hypoglycaemic events.
Eventually, this means that high levels of TDBD, which might be tolerated and masked in
overnight fasting, can lead to hypoglycaemia in prolonged fasting. This result is highly
relevant for people with T1D treated with a TDBD of >0.25 IU/kg; because they might be
misled in thinking that they can perform prolonged fasting without adverse effects after
having performed an unproblematic overnight fast. Therefore, TDBD should certainly be
assessed before individuals with T1D attend intermittent fasting.
Given the fact, that a single prolonged fast unmasked too high TDBD in some of our
participants, the widespread and generalized belief of 50 to 60% basal need and 40 to 50%
prandial/bolus need (31) should be reconsidered. This is underlined by studies, where
lower amounts of TDBD (about 30% of TDD) are sufficient to maintain normoglycaemic
HbA1c (116,117). In fact, a custom-tailored basal insulin calculation respecting influences,
like physical activity and stress, would be more appropriate.
4.10 Selective reductions of basal insulin rates in CSII
While high amounts of TDBD result in hypoglycaemia during prolonged fasting, a certain
threshold of basal insulin is needed since excessive cuts in basal insulin can lead to
diabetic ketoacidosis (92,93). Although, a lowering of up to 25% was allowed for
individuals using CSII, only a reduction of approximately 4% was sufficient to prevent
hypoglycaemia. These results are contrary to previous recommendations emphasizing an
initial cut of basal insulin rates of 10% to an extent of as much as 90% towards the end of
the fasting day (118). Similarly, Aldasouqi et al. recommend 10% to 30% less basal insulin
rates for fasting periods in people with diabetes (119). However, our findings suggest that
selective reduction of up to 10% is sufficient to prevent hypoglycaemia, and at the same
time this reduction is not to excessive since ketone levels were physiological in our study.
4.11 Amount of bolus insulin when breaking the fast
Since we anticipated elevated insulin sensitivity in people with T1D breaking a prolonged
fast, we reduced the bolus insulin dose for safety reasons. Contrary to our assumption
glucose excursions were the same in OGTTs of both trial arms, suggesting that insulin
sensitivity is similar after a 36h fast compared to an overnight 12h fast. Inappropriately
elevated glucagon secretion (see Fig. 17 → D) after carbohydrate intake even seems to
play a protective role against hypoglycaemia in people with T1D (101). Given these facts,
59
there is no inevitable need for reduction of bolus insulin dose at the first meal intake.
Indeed, evaluation and reduction of TDBD seems to be more important than lowering
bolus insulin in preventing hypoglycaemia.
Nevertheless, if people with type 1 diabetes attend prolonged fasting for the first time, we
would still recommend adequate reduction of first bolus insulin dose for safety aspects. For
this purpose, ratio of usually applied bolus insulin doses per day and usually applied bread
units per day (usual BI/BU) should be reduced by a third. In our study, this resulted in a
median of 0.8 IU of applied bolus insulin per bread unit, which is similar to the corrected
bolus insulin by our health professionals. After performing a prolonged fast without
adverse effects, usual bolus insulin doses can be applied when breaking future fasts.
4.12 Limitations of this study
We are aware that our study has certain limitations: For example, our sample size of 20
participants – although cross-over styled – is not large enough to extrapolate on the general
population with T1D. In addition, a single 36h fasting period might not provide enough
certainty to anticipate safety and efficacy of prolonged fasting in people with T1D. We do
also admit that individuals participating in this study are rather well controlled type 1
diabetics, which is why these results cannot be simply adapted to every individual with
T1D. Nevertheless, observed results present relevant information as a proof of concept for
further research on prolonged fasting in this study population.
Besides, we did not randomize study participants to the sequence of overnight and
prolonged fasting. For safety purposes, 12h fasting was always followed by 36h fasting a
few days later. This way, if hypoglycaemia occurred during overnight fasting, we were
able to adapt insulin therapy before participants attended prolonged fasting. Another
limitation of this study might be the fact that participants using CSII were allowed to
reduce basal insulin rates to a certain amount, while participants with an MDI regime did
not have this option. Nevertheless, basal insulin rate per hour was only lowered about 4%
and was similar during both trial arms in CSII participants; therefore, this aspect had no
significant impact on observed results. Other than that, status of menstrual cycle in female
participants was not assessed, which might have an impact on certain results.
60
5 Conclusion
In conclusion, weight loss while maintaining lean muscle mass is achievable for people
with type 1 diabetes by practicing prolonged intermittent fasting. When they break their
prolonged fast, plasma glucose courses show no statistical difference compared to
overnight fasting. Also, incidence for hypoglycaemic events after the first meal of 36h
fasting were similar; most probably due to paradox prandial glucagon response or
decreased insulin sensitivity. Therefore, reductions of usual bolus insulin dose with the
first carbohydrate intake after the prolonged fast are not necessarily required. Total daily
basal dose, however, should be evaluated before since TDBD >0.25 IU/kg bodyweight was
associated with higher amounts of hypoglycaemic events. On the other hand, there is no
need for excessive cuts in basal insulin dosage over 10 to 20% so that diabetic ketoacidosis
can be prevented.
Considering the results of this study and recommendations of other authors, prolonged
fasting can be safely performed in people with type 1 diabetes as long as they are informed
and educated about special aspects of prolonged fasting.
61
Literaturverzeichnis 1. Herold G. Innere Medizin. In 2020. p. 722–50.
2. Gallwitz B, Müller-Wieland D, Usadel K-H, Mehnert H. Diabetologie in Klinik und
Praxis. 2011. 62–72, 192–211, 229–237, 331–353, 609–616 p.
3. Ahmed AM. History of diabetes mellitus. Vol. 23, Saudi Medical Journal. 2002. p.
373–8.
4. Alvarado-Martel D, Velasco R, Sánchez-Hernández RM, Carrillo A, Nóvoa FJ,
Wägner AM. Quality of life and type 1 diabetes: A study assessing patients’
perceptions and self-management needs. Patient Prefer Adherence [Internet]. 2015
Sep 14 [cited 2020 Jul 27];9:1315–23. Available from:
/pmc/articles/PMC4576890/?report=abstract
5. Hassanein MM. Diabetes and Ramadan: How to Achieve a Safer Fast for Muslims
with Diabetes. Br J Diabetes Vasc Dis [Internet]. 2010 Sep 27 [cited 2020 Jul
26];10(5):246–50. Available from:
http://journals.sagepub.com/doi/10.1177/1474651410380150
6. Deeb A, Elbarbary N, Smart CE, Beshyah SA, Habeb A, Kalra S, et al. ISPAD
Clinical Practice Consensus Guidelines: Fasting during Ramadan by young people
with diabetes. Pediatr Diabetes [Internet]. 2020 Feb 28 [cited 2020 Apr 15];21(1):5–
17. Available from: https://onlinelibrary.wiley.com/doi/abs/10.1111/pedi.12920
7. Hussain S, Choudhary P, Hopkins D. Type 1 diabetes and fasting in Ramadan: time
to rethink classification of risk? [Internet]. Vol. 8, The Lancet Diabetes and
Endocrinology. Lancet Publishing Group; 2020 [cited 2021 Mar 28]. p. 656–8.
Available from: http://www.thelancet.com/article/S2213858720302199/fulltext
8. Hamman RF, Bell RA, Dabelea D, D’Agostino RB, Dolan L, Imperatore G, et al.
The SEARCH for diabetes in youth study: Rationale, findings, and future directions
[Internet]. Vol. 37, Diabetes Care. American Diabetes Association Inc.; 2014 [cited
2020 Jul 28]. p. 3336–44. Available from:
http://care.diabetesjournals.org/lookup/suppl/doi:10.2337/dc14-0574/-/DC1.
9. Williams R, Colagiuri S, Chan J, Gregg E, Ke C, Lim L-L, et al. IDF Atlas 9th
Edition 2019. 2019. 46–48, 66–67 p.
10. Bullard KM, Cowie CC, Lessem SE, Saydah SH, Menke A, Geiss LS, et al.
Prevalence of Diagnosed Diabetes in Adults by Diabetes Type — United States,
2016. MMWR Morb Mortal Wkly Rep [Internet]. 2018 Mar 30 [cited 2020 Jul
28];67(12):359–61. Available from:
62
https://www.ncbi.nlm.nih.gov/pmc/articles/PMC5877361/
11. Tuomilehto J, Ogle GD, Lund-Blix NA, Stene LC. Update on Worldwide Trends in
Occurrence of Childhood Type 1 Diabetes in 2020. Pediatr Endocrinol Rev
[Internet]. 2020 Mar 1 [cited 2020 Jul 28];17(Suppl 1):198–209. Available from:
https://pubmed.ncbi.nlm.nih.gov/32208564/
12. Patterson CC, Karuranga S, Salpea P, Saeedi P, Dahlquist G, Soltesz G, et al.
Worldwide estimates of incidence, prevalence and mortality of type 1 diabetes in
children and adolescents: Results from the International Diabetes Federation
Diabetes Atlas, 9th edition. Diabetes Res Clin Pract. 2019 Nov 1;157:107842.
13. Huang Y. IDF Diabetes Atlas 8th Edition. 2017.
14. Maahs DM, West NA, Lawrence JM, Mayer-Davis EJ. Epidemiology of type 1
diabetes [Internet]. Vol. 39, Endocrinology and Metabolism Clinics of North
America. NIH Public Access; 2010 [cited 2020 Jul 29]. p. 481–97. Available from:
/pmc/articles/PMC2925303/?report=abstract
15. Rami-Merhar B, Hofer SE, Fröhlich-Reiterer E, Waldhoer T, Fritsch M. Time trends
in incidence of diabetes mellitus in Austrian children and adolescents <15 years
(1989-2017). Pediatr Diabetes [Internet]. 2020 Aug 1 [cited 2020 Jul 25];21(5):720–
6. Available from: https://onlinelibrary.wiley.com/doi/abs/10.1111/pedi.13038
16. Ehehalt S, Popovic P, Muntoni S, Muntoni S, Willasch A, Hub R, et al. Incidence of
diabetes mellitus among children of Italian migrants substantiates the role of genetic
factors in the pathogenesis of type 1 diabetes. Eur J Pediatr [Internet]. 2009 May
[cited 2020 Jul 30];168(5):613–7. Available from:
https://pubmed.ncbi.nlm.nih.gov/18777043/
17. DiMeglio LA, Evans-Molina C, Oram RA. Type 1 diabetes [Internet]. Vol. 391, The
Lancet. Lancet Publishing Group; 2018 [cited 2020 Jul 24]. p. 2449–62. Available
from: https://pubmed.ncbi.nlm.nih.gov/29916386/
18. Redondo MJ, Yu L, Hawa M, Mackenzie T, Pyke DA, Eisenbarth GS, et al.
Heterogeneity of Type I diabetes: Analysis of monozygotic twins in Great Britain
and the United States. Diabetologia [Internet]. 2001 [cited 2020 Jul 30];44(3):354–
62. Available from: https://pubmed.ncbi.nlm.nih.gov/11317668/
19. Knip M, Simell O. Environmental triggers of type 1 diabetes. Cold Spring Harb
Perspect Biol [Internet]. 2011 Oct [cited 2020 Jul 30];3(10):1–15. Available from:
/pmc/articles/PMC3385937/?report=abstract
20. Rewers M, Hyöty H, Lernmark Å, Hagopian W, She JX, Schatz D, et al. The

63
Environmental Determinants of Diabetes in the Young (TEDDY) Study: 2018
Update [Internet]. Vol. 18, Current Diabetes Reports. Springer; 2018 [cited 2020 Jul
30]. p. 136. Available from: http://link.springer.com/10.1007/s11892-018-1113-2
21. Knip M, Korhonen S, Kulmala P, Veijola R, Reunanen A, Raitakari OT, et al.
Prediction of type 1 diabetes in the general population. Diabetes Care.
2010;33(6):1206–12.
22. Ziegler AG, Rewers M, Simell O, Simell T, Lempainen J, Steck A, et al.
Seroconversion to multiple islet autoantibodies and risk of progression to diabetes in
children. JAMA - J Am Med Assoc [Internet]. 2013 Jun 19 [cited 2020 Aug
22];309(23):2473–9. Available from:
http://jama.jamanetwork.com/article.aspx?doi=10.1001/jama.2013.6285
23. Ozougwu, Obimba KC, Unakalamba. Journal of Physiology and Pathophysiology
The pathogenesis and pathophysiology of type 1 and type 2 diabetes mellitus. 2013
[cited 2020 Aug 13];4(4):46–57. Available from:
http://www.academicjournals.org/JPAP
24. Hien P, Böhm B, Claudi-Böhm S, Krämer C, Kohlhas K. Diabetes-Handbuch. In:
Diabetes-Handbuch [Internet]. Berlin, Heidelberg: Springer Berlin Heidelberg; 2013
[cited 2020 Aug 16]. p. 21–6, 31–4. Available from:
http://link.springer.com/10.1007/978-3-642-34944-7_4
25. Dean L, McEntyre J. The Genetic Landscape of Diabetes [Internet]. Bethesda (MD):
National Center for Biotechnology Information (US); 2004. Figure 1, Action of
glucagon and insulin on the liver, muscle, and adipose tissue. Available from:
https://www.ncbi. 2004 Jul 7;
26. American Diabetes Association (ADA). 2. Classification and Diagnosis of Diabetes:
Standards of Medical Care in Diabetes-2020 [Internet]. Vol. 43, Diabetes care.
NLM (Medline); 2020 [cited 2020 Jul 23]. p. S14–31. Available from:
https://pubmed.ncbi.nlm.nih.gov/31862745/
27. Meijnikman AS, De Block CEM, Dirinck E, Verrijken A, Mertens I, Corthouts B, et
al. Not performing an OGTT results in significant underdiagnosis of (pre)diabetes in
a high risk adult Caucasian population. In: International Journal of Obesity
[Internet]. Nature Publishing Group; 2017 [cited 2020 Sep 27]. p. 1615–20.
Available from: https://pubmed.ncbi.nlm.nih.gov/28720876/
28. Neu A, Kellerer M. Praxisempfehlung der Deutschen Diabetes Gesellschaft.
2019;112–3.

64
29. Leighton E, Sainsbury CA, Jones GC. A Practical Review of C-Peptide Testing in
Diabetes [Internet]. Vol. 8, Diabetes Therapy. Springer Healthcare; 2017 [cited 2020
Sep 3]. p. 475–87. Available from: /pmc/articles/PMC5446389/?report=abstract
30. American Diabetes Association (ADA). 9. Pharmacologic Approaches to Glycemic
Treatment: Standards of Medical Care in Diabetes-2020 [Internet]. Vol. 43,
Diabetes care. NLM (Medline); 2020 [cited 2020 Jul 23]. p. S98–110. Available
from: https://pubmed.ncbi.nlm.nih.gov/31862752/
31. Diabetes Gesellschaft D. S3-Leitlinie Therapie des Typ-1-Diabetes, 2. Auflage
[Internet]. 2018. Available from: www.awmf.org/leitlinien/detail/ll/057-013.html
32. Fullerton B, Siebenhofer A, Jeitler K, Horvath K, Semlitsch T, Berghold A, et al.
Short-acting insulin analogues versus regular human insulin for adults with type 1
diabetes mellitus [Internet]. Vol. 2016, Cochrane Database of Systematic Reviews.
John Wiley and Sons Ltd; 2016 [cited 2020 Sep 12]. Available from:
https://pubmed.ncbi.nlm.nih.gov/27362975/
33. Shiramoto M, Nasu R, Oura T, Imori M, Ohwaki K. Ultra-Rapid Lispro results in
accelerated insulin lispro absorption and faster early insulin action in comparison
with Humalog® in Japanese patients with type 1 diabetes. J Diabetes Investig
[Internet]. 2020 May 1 [cited 2021 May 30];11(3):672–80. Available from:
/pmc/articles/PMC7232298/
34. Insulin, Hypoglycemic, and Antihypoglycemic Drugs - Pharmacology - An
Illustrated Review [Internet]. [cited 2020 Sep 22]. Available from:
https://doctorlib.info/pharmacology/illustrated/21.html
35. Nathan DM. The diabetes control and complications trial/epidemiology of diabetes
interventions and complications study at 30 years: Overview. Diabetes Care
[Internet]. 2014 Jan [cited 2020 Sep 11];37(1):9–16. Available from:
/pmc/articles/PMC3867999/?report=abstract
36. The Effect of Intensive Treatment of Diabetes on the Development and Progression
of Long-Term Complications in Insulin-Dependent Diabetes Mellitus. N Engl J Med
[Internet]. 1993 Sep 30 [cited 2020 Oct 22];329(14):977–86. Available from:
http://www.nejm.org/doi/abs/10.1056/NEJM199309303291401
37. Melo KFS, Bahia LR, Pasinato B, Porfirio GJM, Martimbianco AL, Riera R, et al.
Short-acting insulin analogues versus regular human insulin on postprandial glucose
and hypoglycemia in type 1 diabetes mellitus: a systematic review and meta-
analysis. Diabetol Metab Syndr [Internet]. 2019 Dec 3 [cited 2020 Sep 17];11(1):2.

65
Available from: https://dmsjournal.biomedcentral.com/articles/10.1186/s13098-018-
0397-3
38. Bergenstal RM, Tamborlane W V., Ahmann A, Buse JB, Dailey G, Davis SN, et al.
Sensor-augmented pump therapy for A1C reduction (STAR 3) study: Results from
the 6-month continuation phase. Diabetes Care [Internet]. 2011 Nov [cited 2020 Sep
22];34(11):2403–5. Available from: https://pubmed.ncbi.nlm.nih.gov/21933908/
39. Retnakaran R, Hochman J, DeVries JH, Hanaire-Broutin H, Heine RJ, Melki V, et
al. Continuous subcutaneous insulin infusion versus multiple daily injections: The
impact of baseline A1c. Diabetes Care [Internet]. 2004 Nov 1 [cited 2020 Sep
22];27(11):2590–6. Available from:
https://care.diabetesjournals.org/content/27/11/2590
40. Yeh HC, Brown TT, Maruthur N, Ranasinghe P, Berger Z, Suh YD, et al.
Comparative effectiveness and safety of methods of insulin delivery and glucose
monitoring for diabetes mellitus: A systematic review and meta-analysis [Internet].
Vol. 157, Annals of Internal Medicine. American College of Physicians; 2012 [cited
2020 Sep 22]. p. 336–47. Available from:
https://pubmed.ncbi.nlm.nih.gov/22777524/
41. Haas L, Maryniuk M, Beck J, Cox CE, Duker P, Edwards L, et al. Professional
practice committee for the 2014 clinical practice recommendations. Diabetes Care
[Internet]. 2014 Jan [cited 2020 Sep 23];37(SUPPL.1):S144. Available from:
https://www.ncbi.nlm.nih.gov/pmc/articles/PMC4181074/
42. Yeoh E, Choudhary P, Nwokolo M, Ayis S, Amiel SA. Interventions that restore
awareness of hypoglycemia in adults with type 1 diabetes: A systematic review and
meta-analysis [Internet]. Vol. 38, Diabetes Care. American Diabetes Association
Inc.; 2015 [cited 2020 Sep 23]. p. 1592–609. Available from:
https://pubmed.ncbi.nlm.nih.gov/26207053/
43. Hermanns N, Kulzer B, Ehrmann D, Bergis-Jurgan N, Haak T. The effect of a
diabetes education programme (PRIMAS) for people with type 1 diabetes: Results
of a randomized trial. Diabetes Res Clin Pract [Internet]. 2013 Dec [cited 2020 Sep
23];102(3):149–57. Available from: https://pubmed.ncbi.nlm.nih.gov/24210673/
44. Hampson SE, Skinner TC, Hart J, Storey L, Gage H, Foxcroft D, et al. Effects of
educational and psychosocial interventions for adolescents with diabetes mellitus: A
systematic review [Internet]. Vol. 5, Health Technology Assessment. National Co-
ordinating Centre for HTA; 2001 [cited 2020 Sep 23]. Available from:

66
https://pubmed.ncbi.nlm.nih.gov/11319990/
45. Ziegler R, Neu A. Diabetes in childhood and adolescence - A guideline-based
approach to diagnosis, treatment, and follow-up. Dtsch Arztebl Int [Internet]. 2018
Mar 2 [cited 2020 Aug 22];115(9):146–56. Available from:
/pmc/articles/PMC5876549/?report=abstract
46. Young V, Eiser C, Johnson B, Brierley S, Epton T, Elliott J, et al. Eating problems
in adolescents with Type1 diabetes: A systematic review with meta-analysis
[Internet]. Vol. 30, Diabetic Medicine. Diabet Med; 2013 [cited 2020 Sep 24]. p.
189–98. Available from: https://pubmed.ncbi.nlm.nih.gov/22913589/
47. Reynolds KA, Helgeson VS. Children with diabetes compared to peers: Depressed?
Distressed? A meta-analytic review. Ann Behav Med [Internet]. 2011 Aug [cited
2020 Sep 23];42(1):29–41. Available from:
https://pubmed.ncbi.nlm.nih.gov/21445720/
48. American Diabetes Association (ADA). 7. Diabetes Technology: Standards of
Medical Care in Diabetes-2020 [Internet]. Vol. 43, Diabetes care. NLM (Medline);
2020 [cited 2020 Jul 23]. p. S77–88. Available from:
https://pubmed.ncbi.nlm.nih.gov/31862750/
49. Miller KM, Beck RW, Bergenstal RM, Goland RS, Haller MJ, McGill JB, et al.
Evidence of a strong association between frequency of self-monitoringof blood
glucose and hemoglobin A1c levels in T1D exchange clinic registry participants.
Diabetes Care [Internet]. 2013 [cited 2020 Sep 28];36(7):2009–14. Available from:
https://pubmed.ncbi.nlm.nih.gov/23378621/
50. Ziegler R, Heidtmann B, Hilgard D, Hofer S, Rosenbauer J, Holl R. Frequency of
SMBG correlates with HbA1c and acute complications in children and adolescents
with type 1 diabetes. Pediatr Diabetes [Internet]. 2011 Feb [cited 2020 Sep
28];12(1):11–7. Available from: https://pubmed.ncbi.nlm.nih.gov/20337978/
51. Hirsch I, Battelino T, Peters A, Chamberlain J, Aleppo G, Bergenstal R, et al.
Introduction: History of Glucose Monitoring. In: Role of Continuous Glucose
Monitoring in Diabetes Treatment [Internet]. American Diabetes Association; 2018
[cited 2020 Sep 28]. p. 1–1. Available from:
https://www.ncbi.nlm.nih.gov/books/NBK538968/
52. Cengiz E, Tamborlane W V. A tale of two compartments: Interstitial versus blood
glucose monitoring. Diabetes Technol Ther [Internet]. 2009 Jun 2 [cited 2020 Oct
1];11(SUPPL.1):S-11-S-16. Available from:

67
http://www.liebertpub.com/doi/10.1089/dia.2009.0002
53. Basu A, Dube S, Veettil S, Slama M, Kudva YC, Peyser T, et al. Time lag of
glucose from intravascular to interstitial compartment in type 1 Diabetes. J Diabetes
Sci Technol [Internet]. 2015 Jan 1 [cited 2020 Oct 1];9(1):63–8. Available from:
http://journals.sagepub.com/doi/10.1177/1932296814554797
54. Moser O, Tripolt N, Pferschy P, Obermayer A, Kojzar H, Mueller A, et al.
Performance of the Intermittently Scanned Continuous Glucose Monitoring
(isCGM) System during a High Oral Glucose Challenge in Adults with Type 1
Diabetes-A Prospective Secondary Outcome Analysis. Biosensors [Internet]. 2021
Jan 15 [cited 2021 Feb 25];11(1). Available from:
https://pubmed.ncbi.nlm.nih.gov/33467765/
55. Aleppo G, Ruedy KJ, Riddlesworth TD, Kruger DF, Peters AL, Hirsch I, et al.
REPLACE-BG: A randomized trial comparing continuous glucose monitoring with
and without routine blood glucose monitoring in adults with well-controlled type 1
diabetes. Diabetes Care [Internet]. 2017 Apr 1 [cited 2020 Oct 3];40(4):538–45.
Available from: https://pubmed.ncbi.nlm.nih.gov/28209654/
56. Ahmadi SS, Westman K, Pivodic A, F.ólafsdóttir A, Dahlqvist S, Hirsch IB, et al.
The association between HbA1c and time in hypoglycemia during cgm and self-
monitoring of blood glucose in people with type 1 diabetes and multiple daily
insulin injections: A randomized clinical trial (GOLD-4). Diabetes Care [Internet].
2020 Sep 1 [cited 2020 Oct 3];43(9):2017–24. Available from:
https://care.diabetesjournals.org/content/43/9/2017
57. Battelino T, Phillip M, Bratina N, Nimri R, Oskarsson P, Bolinder J. Effect of
continuous glucose monitoring on hypoglycemia in type 1 diabetes. Diabetes Care
[Internet]. 2011 Apr [cited 2020 Oct 3];34(4):795–800. Available from:
https://pubmed.ncbi.nlm.nih.gov/21335621/
58. Beck RW, Riddlesworth T, Ruedy K, Ahmann A, Bergenstal R, Haller S, et al.
Effect of continuous glucose monitoring on glycemic control in adults with type 1
diabetes using insulin injections the diamond randomized clinical trial. In: JAMA -
Journal of the American Medical Association [Internet]. American Medical
Association; 2017 [cited 2020 Oct 3]. p. 371–8. Available from:
https://jamanetwork.com/
59. Paris I, Henry C, Pirard F, Gérard A-C, Colin IM. The new FreeStyle libre flash
glucose monitoring system improves the glycaemic control in a cohort of people

68
with type 1 diabetes followed in real-life conditions over a period of one year.
Endocrinol Diabetes Metab [Internet]. 2018 Jul [cited 2020 Oct 3];1(3):e00023.
Available from: https://pubmed.ncbi.nlm.nih.gov/30815557/
60. Bolinder J, Antuna R, Geelhoed-Duijvestijn P, Kröger J, Weitgasser R. Novel
glucose-sensing technology and hypoglycaemia in type 1 diabetes: a multicentre,
non-masked, randomised controlled trial. Lancet [Internet]. 2016 Nov 5 [cited 2020
Oct 3];388(10057):2254–63. Available from:
http://www.thelancet.com/article/S0140673616315355/fulltext
61. American Diabetes Association (ADA). 6. Glycemic Targets: Standards of Medical
Care in Diabetes-2020 [Internet]. Vol. 43, Diabetes care. NLM (Medline); 2020
[cited 2020 Jul 23]. p. S66–76. Available from:
https://pubmed.ncbi.nlm.nih.gov/31862749/
62. Nathan DM, Kuenen J, Borg R, Zheng H, Schoenfeld D, Heine RJ. Translating the
A1C assay into estimated average glucose values. Diabetes Care [Internet]. 2008
Aug 1 [cited 2020 Oct 22];31(8):1473–8. Available from:
http://care.diabetesjournals.org/cgi/doi/10.2337/dc08-0545
63. Battelino T, Danne T, Bergenstal RM, Amiel SA, Beck R, Biester T, et al. Clinical
targets for continuous glucose monitoring data interpretation: Recommendations
from the international consensus on time in range. Diabetes Care [Internet]. 2019
Aug 1 [cited 2020 Oct 22];42(8):1593–603. Available from:
http://care.diabetesjournals.org/lookup/doi/10.2337/dci19-0028
64. Beck RW, Bergenstal RM, Cheng P, Kollman C, Carlson AL, Johnson ML, et al.
The Relationships Between Time in Range, Hyperglycemia Metrics, and HbA1c. J
Diabetes Sci Technol [Internet]. 2019 Jul 1 [cited 2020 Oct 22];13(4):614–26.
Available from: https://pubmed.ncbi.nlm.nih.gov/30636519/
65. Vigersky RA, McMahon C. The Relationship of Hemoglobin A1C to Time-in-
Range in Patients with Diabetes. Diabetes Technol Ther [Internet]. 2019 Feb 1
[cited 2020 Oct 22];21(2):81–5. Available from:
https://pubmed.ncbi.nlm.nih.gov/30575414/
66. Mattson MP, Longo VD, Harvie M. Impact of intermittent fasting on health and
disease processes [Internet]. Vol. 39, Ageing Research Reviews. Elsevier Ireland
Ltd; 2017 [cited 2020 Oct 26]. p. 46–58. Available from:
https://linkinghub.elsevier.com/retrieve/pii/S1568163716302513
67. Johnson JB, Summer W, Cutler RG, Martin B, Hyun DH, Dixit VD, et al. Alternate

69
day calorie restriction improves clinical findings and reduces markers of oxidative
stress and inflammation in overweight adults with moderate asthma. Free Radic Biol
Med [Internet]. 2007 Mar 1 [cited 2020 Nov 1];42(5):665–74. Available from:
/pmc/articles/PMC1859864/?report=abstract
68. Heilbronn LK, Smith SR, Martin CK, Anton SD, Ravussin E. Alternate-day fasting
in nonobese subjects: Effects on body weight, body composition, and energy
metabolism. Am J Clin Nutr [Internet]. 2005 [cited 2020 Nov 1];81(1):69–73.
Available from: https://pubmed.ncbi.nlm.nih.gov/15640462/
69. Sadeghirad B, Motaghipisheh S, Kolahdooz F, Zahedi MJ, Haghdoost AA. Islamic
fasting and weight loss: A systematic review and meta-analysis. Public Health Nutr.
2014;17(2):396–406.
70. Kul S, Savaş E, Öztürk ZA, Karadağ G. Does Ramadan Fasting Alter Body Weight
and Blood Lipids and Fasting Blood Glucose in a Healthy Population? A Meta-
analysis. J Relig Health. 2014;53(3):929–42.
71. Yeoh E, Yeoh EC. MRCP (UK), MRCPS (Glasgow), Win Nie Loh, 3 Master of
Nutritian and Dietetics (Aust). Mbbs. 2015;44(6):202–6.
72. Patterson RE, Sears DD. Metabolic Effects of Intermittent Fasting. 2017; Available
from: https://doi.org/10.1146/annurev-nutr-071816-
73. Challet E. Circadian clocks, food intake, and metabolism [Internet]. 1st ed. Vol.
119, Progress in Molecular Biology and Translational Science. Elsevier Inc.; 2013.
105–135 p. Available from: http://dx.doi.org/10.1016/B978-0-12-396971-2.00005-1
74. Scheer FAJL, Hilton MF, Mantzoros CS, Shea SA. Adverse metabolic and
cardiovascular consequences of circadian misalignment. Proc Natl Acad Sci U S A.
2009;106(11):4453–8.
75. Marinac CR, Natarajan L, Sears DD, Gallo LC, Hartman SJ, Arredondo E, et al.
Prolonged nightly fasting and breast cancer risk: Findings from NHANES (2009-
2010). Cancer Epidemiol Biomarkers Prev. 2015;24(5):783–9.
76. Obesity and overweight [Internet]. [cited 2020 Nov 8]. Available from:
https://www.who.int/news-room/fact-sheets/detail/obesity-and-overweight
77. Tinsley GM, La Bounty PM. Effects of intermittent fasting on body composition
and clinical health markers in humans. Nutr Rev. 2015 Oct 1;73(10):661–74.
78. Harvie MN, Pegington M, Mattson MP, Frystyk J, Dillon B, Evans G, et al. The
effects of intermittent or continuous energy restriction on weight loss and metabolic
disease risk markers: A randomized trial in young overweight women. Int J Obes
70
[Internet]. 2011 May [cited 2020 Nov 8];35(5):714–27. Available from:
https://pubmed.ncbi.nlm.nih.gov/20921964/
79. Varady KA, Bhutani S, Klempel MC, Kroeger CM. Comparison of effects of diet
versus exercise weight loss regimens on LDL and HDL particle size in obese adults.
Lipids Health Dis [Internet]. 2011 [cited 2020 Nov 8];10:119. Available from:
/pmc/articles/PMC3150311/?report=abstract
80. Harvie M, Wright C, Pegington M, McMullan D, Mitchell E, Martin B, et al. The
effect of intermittent energy and carbohydrate restriction v. daily energy restriction
on weight loss and metabolic disease risk markers in overweight women. Br J Nutr
[Internet]. 2013 Oct 28 [cited 2020 Nov 8];110(8):1534–47. Available from:
/pmc/articles/PMC5857384/?report=abstract
81. Varady KA. Intermittent versus daily calorie restriction: Which diet regimen is more
effective for weight loss? Obes Rev [Internet]. 2011 Jul [cited 2020 Nov 9];12(7).
Available from: https://pubmed.ncbi.nlm.nih.gov/21410865/
82. Faris MAIE, Kacimi S, Al-Kurd RA, Fararjeh MA, Bustanji YK, Mohammad MK,
et al. Intermittent fasting during Ramadan attenuates proinflammatory cytokines and
immune cells in healthy subjects. Nutr Res [Internet]. 2012 Dec [cited 2020 Nov
9];32(12):947–55. Available from: https://pubmed.ncbi.nlm.nih.gov/23244540/
83. Aksungar FB, Topkaya AE, Akyildiz M. Interleukin-6, C-reactive protein and
biochemical parameters during prolonged intermittent fasting. Ann Nutr Metab
[Internet]. 2007 Apr [cited 2020 Nov 9];51(1):88–95. Available from:
https://pubmed.ncbi.nlm.nih.gov/17374948/
84. Cho Y, Hong N, Kim K, Cho S, Lee M, Lee Y, et al. The Effectiveness of
Intermittent Fasting to Reduce Body Mass Index and Glucose Metabolism: A
Systematic Review and Meta-Analysis. J Clin Med [Internet]. 2019 Oct 9 [cited
2020 Nov 10];8(10):1645. Available from:
/pmc/articles/PMC6832593/?report=abstract
85. Barnosky AR, Hoddy KK, Unterman TG, Varady KA. Intermittent fasting vs daily
calorie restriction for type 2 diabetes prevention: A review of human findings
[Internet]. Vol. 164, Translational Research. Mosby Inc.; 2014 [cited 2020 Nov 10].
p. 302–11. Available from:
https://linkinghub.elsevier.com/retrieve/pii/S193152441400200X
86. Gerich JE, Langlois M, Noacco C, Karam JH, Forsham PH. Lack of glucagon
response to hypoglycemia in diabetes: Evidence for an intrinsic pancreatic alpha cell

71
defect. Science (80- ) [Internet]. 1973 Oct 12 [cited 2020 Nov 14];182(4108):171–3.
Available from:
https://www.sciencemag.org/lookup/doi/10.1126/science.182.4108.171
87. Amiel SA, Sherwin RS, Simonson DC, Tamborlane W V. Effect of intensive insulin
therapy on glycemic thresholds for counterregulatory hormone release. Diabetes
[Internet]. 1988 Jul 1 [cited 2020 Nov 17];37(7):901–7. Available from:
http://diabetes.diabetesjournals.org/cgi/doi/10.2337/diab.37.7.901
88. Cryer PE, Davis SN, Shamoon H. Hypoglycemia in diabetes [Internet]. Vol. 26,
Diabetes Care. American Diabetes Association; 2003 [cited 2020 Nov 14]. p. 1902–
12. Available from: https://care.diabetesjournals.org/content/26/6/1902
89. Salti I, Bénard E, Detournay B, Bianchi-Biscay M, Le Brigand C, Voinet C, et al. A
population-based study of diabetes and its characteristics during the fasting month
of ramadan in 13 countries: Results of the epidemiology of diabetes and ramadan
1422/2001 (EPIDIAR) study. Diabetes Care [Internet]. 2004 Oct 1 [cited 2020 Jul
26];27(10):2306–11. Available from: http://www.aventislebanon.com.
90. Eid YM, Sahmoud SI, Abdelsalam MM, Eichorst B. Empowerment-based diabetes
self-management education to maintain glycemic targets during ramadan fasting in
people with diabetes who are on conventional insulin: A feasibility study. Diabetes
Spectr [Internet]. 2017 Dec 1 [cited 2020 Nov 14];30(1):36–42. Available from:
https://pubmed.ncbi.nlm.nih.gov/28270713/
91. Nyenwe EA, Kitabchi AE. The evolution of diabetic ketoacidosis: An update of its
etiology, pathogenesis and management [Internet]. Vol. 65, Metabolism: Clinical
and Experimental. W.B. Saunders; 2016 [cited 2020 Nov 15]. p. 507–21. Available
from: https://linkinghub.elsevier.com/retrieve/pii/S0026049515003728
92. Beshyah SA, Chowdhury TA, Ghouri N, Lakhdar AA. Risk of diabetic ketoacidosis
during Ramadan fasting: A critical reappraisal. Diabetes Res Clin Pract [Internet].
2019 May 1 [cited 2020 Nov 15];151:290–8. Available from:
https://linkinghub.elsevier.com/retrieve/pii/S0168822719300610
93. Al-Arouj M, Assaad-Khalil S, Buse J, Fahdil I, Fahmy M, Hafez S, et al.
Recommendations for management of diabetes during Ramadan: Update 2010
[Internet]. Vol. 33, Diabetes Care. American Diabetes Association; 2010 [cited 2020
Nov 15]. p. 1895–902. Available from: http://creativecommons.
94. BIODYNAMICS : Body Model [Internet]. [cited 2020 Dec 17]. Available from:
https://www.biodyncorp.com/product/450/body_model_450.html
72
95. Mtaweh H, Tuira L, Floh AA, Parshuram CS. Indirect calorimetry: History,
technology, and application [Internet]. Vol. 6, Frontiers in Pediatrics. Frontiers
Media S.A.; 2018 [cited 2020 Dec 22]. p. 257. Available from:
/pmc/articles/PMC6157446/?report=abstract
96. Lessan N, Ali T. Energy metabolism and intermittent fasting: The ramadan
perspective [Internet]. Vol. 11, Nutrients. MDPI AG; 2019 [cited 2020 Dec 17].
Available from: /pmc/articles/PMC6566767/?report=abstract
97. Weir JB d. V. New methods for calculating metabolic rate with special reference to
protein metabolism. J Physiol [Internet]. 1949 Aug 1 [cited 2020 Dec 17];109(1–
2):1–9. Available from: https://www.ncbi.nlm.nih.gov/pmc/articles/PMC1392602/
98. Purnell JQ, John EH, Cleary PA, Nathan DM, Lachin JM, Zinman B, et al. The
effect of excess weight gain with intensive diabetes mellitus treatment on
cardiovascular disease risk factors and atherosclerosis in type 1 diabetes mellitus:
Results from the Diabetes Control and Complications Trial/Epidemiology of
Diabetes Interventions and Complications Study (DCCT/EDIC) study. Circulation
[Internet]. 2013 Jan 15 [cited 2021 Feb 28];127(2):180–7. Available from:
https://pubmed.ncbi.nlm.nih.gov/23212717/
99. Fellinger P, Fuchs D, Wolf P, Heinze G, Luger A, Krebs M, et al. Overweight and
obesity in type 1 diabetes equal those of the general population. Wien Klin
Wochenschr [Internet]. 2019 Feb 1 [cited 2021 Feb 28];131(3–4):55–60. Available
from: https://pubmed.ncbi.nlm.nih.gov/30617710/
100. Weitzman ED, Fukushima D, Nogeire C, Roffwarg H, Gallagher TF, Hellman L.
Twenty-four hour pattern of the episodic secretion of cortisol in normal subjects. J
Clin Endocrinol Metab [Internet]. 1971 Jul [cited 2021 Mar 21];33(1):14–22.
Available from: https://academic.oup.com/jcem/article-lookup/doi/10.1210/jcem-
33-1-14
101. Hare KJ, Vilsbøll T, Holst JJ, Knop FK. Inappropriate glucagon response after oral
compared with isoglycemic intravenous glucose administration in patients with type
1 diabetes. Am J Physiol - Endocrinol Metab [Internet]. 2010 Apr [cited 2021 Mar
7];298(4). Available from: https://pubmed.ncbi.nlm.nih.gov/20103744/
102. Weinstock RS, DuBose SN, Bergenstal RM, Chaytor NS, Peterson C, Olson BA, et
al. Risk factors associated with severe hypoglycemia in older adults with type 1
diabetes. Diabetes Care [Internet]. 2016 Apr 1 [cited 2021 Mar 22];39(4):603–10.
Available from: https://pubmed.ncbi.nlm.nih.gov/26681721/
73
103. Rodbard D. Hypo- and hyperglycemia in relation to the mean, standard deviation,
coefficient of variation, and nature of the glucose distribution. Diabetes Technol
Ther [Internet]. 2012 Oct 1 [cited 2021 Mar 16];14(10):868–76. Available from:
https://pubmed.ncbi.nlm.nih.gov/22953755/
104. Monnier L, Colette C, Wojtusciszyn A, Dejager S, Renard E, Molinari N, et al.
Toward defining the threshold between low and high glucose variability in diabetes.
Diabetes Care [Internet]. 2017 Jul 1 [cited 2021 Mar 16];40(7):832–8. Available
from: https://pubmed.ncbi.nlm.nih.gov/28039172/
105. Salgin B, Marcovecchio ML, Humphreys SM, Hill N, Chassin LJ, Lunn DJ, et al.
Effects of prolonged fasting and sustained lipolysis on insulin secretion and insulin
sensitivity in normal subjects. Am J Physiol - Endocrinol Metab [Internet]. 2009
Mar [cited 2021 Mar 22];296(3). Available from:
https://pubmed.ncbi.nlm.nih.gov/19106250/
106. Anton SD, Moehl K, Donahoo WT, Marosi K, Lee SA, Mainous AG, et al. Flipping
the Metabolic Switch: Understanding and Applying the Health Benefits of Fasting.
Vol. 26, Obesity. Blackwell Publishing Inc.; 2018. p. 254–68.
107. Diabetic ketoacidosis - NHS - NHS [Internet]. [cited 2021 Mar 14]. Available from:
https://www.nhs.uk/conditions/diabetic-ketoacidosis/
108. Klempel MC, Kroeger CM, Bhutani S, Trepanowski JF, Varady KA. Intermittent
fasting combined with calorie restriction is effective for weight loss and cardio-
protection in obese women. Nutr J [Internet]. 2012 [cited 2021 Mar 27];11(1):98.
Available from: /pmc/articles/PMC3511220/
109. Sävendahl L, Underwood LE. Fasting increases serum total cholesterol, LDL
cholesterol and apolipoprotein B in healthy, nonobese humans. J Nutr [Internet].
1999 [cited 2021 Mar 14];129(11):2005–8. Available from:
https://pubmed.ncbi.nlm.nih.gov/10539776/
110. Chan JL, Heist K, DePaoli AM, Veldhuis JD, Mantzoros CS. The role of falling
leptin levels in the neuroendocrine and metabolic adaptation to short-term starvation
in healthy men. J Clin Invest [Internet]. 2003 May 1 [cited 2021 Mar
14];111(9):1409–21. Available from: https://pubmed.ncbi.nlm.nih.gov/12727933/
111. Meyer B, Scholtz H, Schall R, Muller F, Hundt H, Maree J. The effect of fasting on
total serum bilirubin concentrations. Br J Clin Pharmacol [Internet]. 1995 [cited
2021 Mar 14];39(2):169–71. Available from:
https://pubmed.ncbi.nlm.nih.gov/7742155/

74
112. Barrett P V.D. Hyperbilirubinemia of Fasting. JAMA J Am Med Assoc [Internet].
1971 Sep 6 [cited 2021 Mar 14];217(10):1349–53. Available from:
http://jama.jamanetwork.com/article.aspx?doi=10.1001/jama.1971.03190100033006
113. Nguyen LT, Buse JD, Baskin L, Sadrzadeh SMH, Naugler C. Influence of diurnal
variation and fasting on serum iron concentrations in a community-based
population. Clin Biochem [Internet]. 2017 Dec 1 [cited 2021 Mar 15];50(18):1237–
42. Available from:
https://linkinghub.elsevier.com/retrieve/pii/S0009912017304526
114. Epidemiology of severe hypoglycemia in the diabetes control and complications
trial. Am J Med [Internet]. 1991 Apr [cited 2021 Mar 24];90(4):450–9. Available
from: https://linkinghub.elsevier.com/retrieve/pii/000293439180085Z
115. Strich D, Teomim R, Gillis D. The basal insulin dose; a lesson from prolonged
fasting in young individuals with type 1 diabetes. Pediatr Diabetes [Internet]. 2015
Dec 1 [cited 2020 Apr 16];16(8):629–33. Available from:
http://doi.wiley.com/10.1111/pedi.12173
116. Yamada E, Okada S, Nakajima Y, Bastie C, Tagaya Y, Osaki A, et al. Assessment
of factors determining an HbA1c concentration ≤7.5% in patients with type 1
diabetes. J Diabetes [Internet]. 2018 Feb 1 [cited 2021 May 31];10(2):140–7.
Available from: https://pubmed.ncbi.nlm.nih.gov/28544548/
117. Schulten RJ, Piet J, Bruijning PCJL, de Waal WJ. Lower dose basal insulin infusion
has positive effect on glycaemic control for children with type I diabetes on
continuous subcutaneous insulin infusion therapy. Pediatr Diabetes [Internet]. 2017
Feb 1 [cited 2021 May 31];18(1):45–50. Available from:
https://pubmed.ncbi.nlm.nih.gov/26880282/
118. Grajower MM, Horne BD. Clinical management of intermittent fasting in patients
with diabetes mellitus. Nutrients [Internet]. 2019 Apr 1 [cited 2021 Mar 27];11(4).
Available from: /pmc/articles/PMC6521152/
119. Aldasouqi S, Gossain V, Hebdon M, Reddy A, Goldman J, Ansar S, et al. Causes of
Fasting-Evoked en Route Hypoglycemia in Diabetes (FEEHD): A Case Series
Study. Int J Clin Med. 2012;03(07):751–7.

75
Anhang
Publikationen, die während der Diplomarbeit/ Masterarbeit entstanden sind:
1. Moser O, Tripolt N, Pferschy P, Obermayer A, Kojzar H, Mueller A, Yildirim H. et al.
Performance of the Intermittently Scanned Continuous Glucose Monitoring (isCGM)
System during a High Oral Glucose Challenge in Adults with Type 1 Diabetes—A
Prospective Secondary Outcome Analysis. Biosensors [Internet]. 2021 Jan 15 [cited 2021
May 31];11(1):22. Available from: https://www.mdpi.com/2079-6374/11/1/22
2. Moser O, Eckstein ML, Mueller A, Tripolt NJ, Yildirim H, Abbas F, et al.
Impact of a single 36 hours prolonged fasting period in adults with type 1 diabetes – a
cross-over controlled trial. Front Endocrinol (Lausanne). 2021;12:826.
Available from: https://www.frontiersin.org/articles/10.3389/fendo.2021.656346/abstract