the effects of lower mobile termination rates (mtrs) on retail
TRANSCRIPT

COMMUNICATIONS & STRATEGIES, 80, 4th Q. 2010, p. 119. www.comstrat.org
The Effects of Lower Mobile Termination Rates (MTRs) on Retail Price and Demand (*)
Christian GROWITSCH University of Cologne and Martin Luther University Halle-Wittenberg,
Germany
J. Scott MARCUS & Christian WERNICK WIK-Consult GmbH, Bad Honnef, Germany
Abstract: Policy initiatives to lower or eliminate Mobile Termination Rates (MTRs) reflect the belief that lower MTRs would tend to lead to lower retail unit prices for most end-users, and that these lower retail unit prices would lead to higher consumption of mobile services per user on average. Not all experts agree with this prediction. We review the theory and the literature, consider relevant European experience, and use econometric methods to study the impact of MTRs on retail price and demand for 61 mobile operators from 16 European countries in the period from 2003 to 2008. We find that lower MTRs tend indeed to result in a lower average retail unit price, with a highly significant coefficient of +0.71. That the coefficient is less than +1.0 confirms the existence of a "waterbed effect". Our results also demonstrate, with high significance, that lower MTRs (presumably operating through the mechanism of lower retail prices) tend to result in greater consumption of mobile services in terms of minutes of use per month per subscription. Long term elasticity (in the range of -0.52 to -0.61) is much greater than short term elasticity (-0.097). Key words: interconnection, mobile telephony, mobile termination rates, MTRs, price elasticity of demand, retail price, wholesale price, retention.
number of initiatives are under way that will either greatly lower Mobile Termination Rates (MTRs1) – the wholesale payments from the originating network operator whose call initiates the call to the
(*) This paper reflects the results of a study conducted by WIK as part of our research program. WIK’s research program benefits the German Federal Network Agency (BNetzA), There is no commercial client, and no third party directs our results. We would like to thank Jonathan Sandbach, Ottavio Adorisio, Jörg Breitung, Huib de Klein, Ralf Dewenter, Christos Genakos, and Tommaso Valletti for their input. Any errors are solely our own. 1 The European Commission enacted a Recommendation in May, 2009 that seeks to standardise the methodology for determining the cost-based maximum permissible fixed and mobile termination rate. This methodology would, not coincidentally, reduce mobile termination rates by 70 – 80%.
A

120 No. 80, 4th Q. 2010
terminating network operator whose customer receives the call – or perhaps even eliminate them altogether.
A key policy basis for these proposals and changes is the belief that lower MTRs would tend to lead to lower retail unit prices for most end-users, and that the lower retail prices would be associated with higher usage.
There are strong theoretical grounds to believe that this is so.2 The notion is further bolstered by comparisons to the U.S., where MTRs are effectively zero, minutes of use are twice as high as those of any European country, and service-based revenue per minute of use (which serves as a normalised proxy for retail price) is lower than that of any European country.3
But is this really true? Various parties have disputed these relationships. If lower MTRs were to lead to higher retail prices, then the policy rationale for these European initiatives might be called into question.
In this paper, we study the impact of MTRs on retail prices and demand (within a Calling Party's Network Pays [CPNP] regime) for 61 Mobile Network Operators (MNOs) from 16 European Member States in the period between 2003 and 2008.
This analysis is technically challenging for a number of reasons, many of them having to do with limitations and anomalies in the available data. We have used independent sources, especially country-specific data from national regulators, as a cross-check on our data sources and on our overall findings and conclusions.
Our paper has the following structure. The 2nd Section provides background on the theory of network interconnection. The 3rd Section presents our working hypotheses, and explains what motivates them. The 4th Section presents our empirical research design. The 5th Section describes the data. The 6th Section provides a case study of the mobile market in Spain, where the CMT (the Spanish National Regulatory Authority) has provided useful data on retail prices and usage. The 7th Section discusses
2 Cf. LAFFONT AND TIROLE (2000), page 190, speaking of the bill-and-keep fallacy: "…[A] change in the access charge need not affect the (absence of) net payment between the operators, but the access charge affects each operator’s perceived marginal cost and therefore retail prices. It is therefore not neutral, even if traffic is balanced." See also the following Section. 3 Both comparisons are based on data from Merrill Lynch Quarterly Wireless Matrix data.

C. GROWITSCH, J. S. MARCUS & C. WERNICK 121
the results of our econometric analysis. The 8th Section compares our finding to other results in the literature. Finally, the 9th Section draws conclusions and gives policy recommendations.
The theory of network interconnection
Scholarly research has paid much attention to the economics of network interconnection in the Public Switched Telephone Network (PSTN).4 Different charging arrangements can be observed in practice: Calling Party's Network Pays (CPNP) and Bill and Keep (BAK) on wholesale markets; and Calling Party Pays (CPP), Receiving Party Pays (RPP) and flat rates (with or without minute caps) on retail markets. Since our focus in this paper is on Europe, we analyse CPNP/CPP and flat rate arrangements (which are found in Europe), and largely ignore BAK and RPP (which are not).
Each time a user of network A sets up a voice call to a user of network B, network B has to cooperate to realise the call. This service, which comprises the hand-off of the call at the point of interconnection and the transmission of the call to the receiving party, is referred to as call termination.
A key regulatory challenge associated with call termination is the termination monopoly. Only network B, the network operator of the receiving party, is able to terminate a call to a particular subscriber of its network. Without any regulations or obligations, this monopoly is likely to expresses itself in excessive termination charges at the wholesale level.
Different kinds of regulations have been introduced to attempt to address this problem. Obligations to interconnect are common in most regimes to prevent large operators from using interconnection as an entry barrier. Many CPNP countries regulate termination rates rather than permitting the excessive retail and wholesale prices that would result from unregulated free negotiation. Other arrangements are found in other parts of the world (MARCUS, 2004).
4 The issue of interconnection has been subject to a broad range of theoretical contributions. LAFFONT et al. (1998a, 1998b) and ARMSTRONG (1998) represent the initial, ground-breaking work. For a comprehensive survey, see MARCUS et al. (2008a). A focused, short survey appears in MARCUS (2008b).

122 No. 80, 4th Q. 2010
Under CPNP, the network operator of the receiving party is compensated for this service by the network operator of the originating party. In such markets, incoming calls are (usually) free of charge, which corresponds to a Calling Party Pays (CPP) retail arrangement.
The relationship and the flow of payments are portrayed in Figure 1.
Figure 1 - CPNP wholesale arrangements
OriginatingNetwork
TerminatingNetwork
Call placed Call received
RetailCPP
Payment
Wholesale CPNP PaymentWholesale CPNP Payment
Source: WIK-Consult
The relationship between termination rates, retail prices, and usage, which is the core concern addressed by this study, is complex. Termination rates function not only as a source of wholesale income to operators, but also as a wholesale cost. To the extent that traffic is balanced, and rates are symmetric, these charges may net to zero between operators; however, to the extent that termination rates are too large to ignore, operators will tend to view them as a wholesale cost and will tend to reflect them in retail prices (LAFFONT & TIROLE, 2000, p. 190). Thus, to the extent that mobile termination rates are well in excess of costs, as has historically been the case, one might expect retail prices to be well in excess of real underlying costs as well. This is clearly the case for usage-based (e.g. per minute) prices; however, in the case of two part or nonlinear tariffs (comprised for example of a fixed monthly fee plus usage-based per-minute charges), one should expect a tendency in competitive markets for the network operator to return some or all of the profits associated with above-cost termination rates

C. GROWITSCH, J. S. MARCUS & C. WERNICK 123
by effectively lowering the fixed charges. Under perfect competition, the network operators would be expected to compete away all of these profits. The degree to which this is in fact the case has been subject to debate.
High termination rates per minute typically have the effect of setting a minimum retail price per minute for off-net calls for economically operating network operators, and of inhibiting competitive network operators from setting a retail price per minute that is less than the termination rate of the network operator that is terminating the call; however, they have no effect on on-net calls, where the price floor is effectively set by the mobile operator's perceived marginal cost of termination (which has historically been much lower). Mobile operators with a relatively large customer base can benefit by disadvantaging smaller competitors by means of on-net off-net price discrimination, where off-net calls are more costly at retail than on-net calls. A high MTR represents a way to raise smaller rivals' costs, thus making it difficult for smaller mobile operators to compete aggressively with larger ones on price (HARBORD & PAGNOZZI, 2007). A reduction in MTR can enable smaller operators to lower the retail price per minute, which can have the effect of compelling larger operators to lower the retail price per minute in response (assuming that the market is reasonably competitive).
High termination rates have also proven to be a barrier in practice to the introduction of flat-rate plans combining both on-net and off-net calls to mobile phones. Calls to networks with high termination rates are often excluded from the flat rate. When the termination rate declines sufficiently, flat rate plans include off-net minutes (as is now the case in Austria).
A substantial theoretical literature considers how network operators would choose to set fixed and mobile termination rates in the absence of regulation (ARMSTRONG & WRIGHT, 2007). In Europe, however, substantially all fixed and mobile operators are viewed as possessing Significant Market Power (SMP) in regard to call termination, and are therefore subject to termination rates set by the National Regulatory Authority, as well as non-discrimination obligations that require them to set identical termination rates to domestic fixed and to mobile operators.
To the extent that retail prices were inflated relative to costs, one would generally expect call initiation (which is paid for by the consumer placing the call under CPP retail arrangements) to be depressed as a result of normal demand elasticity. To the extent that call initiation is depressed, one should also expect a negative effect on call reception (even though call reception is generally free under CPP, and thus not directly subject to demand elasticity).

124 No. 80, 4th Q. 2010
To the extent that retail and wholesale prices are high in comparison to costs, (mobile) operators should be motivated to obtain as many customers as possible. They could be expected to subsidise handset purchases, and to make pre-paid plans available with no or low initial and monthly fees. They should be content to have low call volume customers who receive calls, even if those customers place very few calls. Those customers may have relatively low disposable income, but they still generate revenue.
The tendency to return some of the profits associated with high retail prices to consumers through handset subsidies and low monthly and initial fees has been referred to as the "waterbed effect". JULLIEN, REY & SAND-ZANTMAN (2009) explain:
"One key to understanding the effect of termination on retail prices is the so-called waterbed effect: the profit that a customer may generate on fixed-to-mobile (FTM) or mobile-to-mobile termination will be at least partially competed away through retail competition, since mobile operators will then fight more fiercely to attract customers. This can take the form of reduced subscription fees but could also translate into increased advertising, larger handset subsidies or reduced fees on particular services."5
As a consequence of the tendency to fight for retail customers, most experts feel that CPNP, with above-cost termination rates, has a positive effect on the number of subscriptions thanks to handset subsidies, low monthly and initial fees, and cheap pre-paid offers; a few disagree (LITTLECHILD, 2006; DEWENTER & HAUCAP, 2005). Some suggest that current arrangements may lead to inefficiently rapid replacement of handsets (LITTLECHILD, 2006). Historically, we have tended to assume that an increase in penetration (measured by the number of subscriptions divided by population) represents an increase in societal welfare thanks to network externalities, to the extent that there are fewer individuals who lack access to a telephone; however, where penetration increases beyond 100%, there must be more than one subscription per individual. These multiple subscriptions do not necessarily generate the same externalities, since they do not serve to reduce the number of individuals who lack access to a telephone.
5 See also LITTLECHILD (2006). Compare this to GENAKOS & VALLETTI (2010): "Under quite general conditions of competition, theory suggests that lower termination charges will result in higher prices for mobile subscribers, a phenomenon known as the ‘waterbed’ effect."

C. GROWITSCH, J. S. MARCUS & C. WERNICK 125
Our hypotheses
We now return to the main issue of this paper. What are the likely effects of a reduction in wholesale termination rates in the European Union, in light of the relevant market characteristics in European Member States?
As previously noted, termination payments represent not only a wholesale cost to a network operator, but also a source of wholesale revenue. Ceteris paribus, a reduction in wholesale costs in a competitive market should lead to a reduction in retail price. On the other hand, a regulated reduction in one component of the effective price of a service (in a competitive market, and subject to constant net costs) might also lead to compensating waterbed increases in other components of the price. Which effect predominates?
The European Commission's Recommendation is likely to reduce both fixed and mobile termination rates. Average European fixed-to-mobile interconnection rates have steadily declined from € 0.1265 in October 2005 to € 0.0855 in October 2008, which is roughly ten times greater than European fixed network (single transit) termination charges, which declined from € 0.0094 to € 0.0086 over the same period (European Commission, 2009, 14th Implementation Report). The Recommendation is expected to reduce MTRs to somewhere between € 0.015 and € 0.030.
Clearly, a reduction in termination costs would not apply equally to all calls that are placed. First, it would not apply at all to on-net calls. Second, the reduction in fixed termination rates will be different from that for mobile termination rates. One should therefore consider the relative volumes of traffic, and the relative revenues, for calls to and from fixed and mobile networks. We know of no comprehensive source of these data for all of Europe, but one can make reasonable inferences based on publicly available data for selected Member States.
The available data at national level indicate that off-net mobile-to-mobile minutes represent a substantial and growing fraction of all minutes. Furthermore, the termination rates to which they are subject are much larger than termination rates to the fixed network, so the total impact on revenue should be considerable.
With all of that in mind, we have formulated the following hypotheses:
• Given the competitive state of mobile origination in Europe, our first hypothesis is that usage-based prices for mobile calls tend to decline in

126 No. 80, 4th Q. 2010
response to MTR cuts, and that those declines are only partially offset by increases in fixed components of two part mobile tariffs.
• Our second hypothesis is that usage (minutes of use per subscription per month) tends to increase in response to MTR reductions, due to price elasticity of demand in response to the predicted net reduction of mobile prices.
The empirical research design
We have accomplished three empirical assessments. The first aimed at evaluating the demand elasticity for mobile voice services. The second analysed the relationship between MTRs and retail prices charged by MNOs. The third estimates the effect of changes in MTR on the minutes of use, giving a partial MTR elasticity of demand. Our analysis is based on Merrill Lynch data on average minutes of use and average service based revenues per minute of use. The latter are PPP adjusted in accordance with the purchasing power parities published by the OECD, and serve as a proxy for the retail price per minute for a mobile call. Our sample combines 61 MNOs from 16 European Member States, from 2003 to 2008.6
To estimate the elasticity of demand for mobile services, we apply the well-established Houthakker-Taylor Model (HOUTHAKKER & TAYLOR, 1970). This model allows for path-dependencies in usage behaviour and differentiates between short run and long run demand elasticities. It is important to distinguish between short run and long run tendencies, because post-paid mobile phone contracts usually last for at least one year and do not support easy switching. Following DEWENTER & HAUCAP (2007), we use a dynamic GMM panel data estimator. Contrasting to them, we apply a System-GMM approach as introduced by ARELLANO & BOVER (1995) and BLUNDELL & BOND (1998). This approach enables us to include the previous period's quantity as a lagged endogenous variable without suffering from autocorrelation problems or an endogeneity bias.
6 These Member States are Austria, Belgium, Czech Republic, Denmark, Finland, France, Germany, Greece, Ireland, Italy, Netherlands, Poland, Portugal, Spain, Sweden, United Kingdom.

C. GROWITSCH, J. S. MARCUS & C. WERNICK 127
To identify the influence of MTRs on retail charges, we also apply the System-GMM approach. In a third step of analysis, we use this estimator again to simultaneously analyse both price and MTR elasticities of demand.
The data
Our econometric analysis of the effects of lower mobile termination rates draws on two primary data sources: BEREC/ERG data on MTRs, and the Merrill Lynch Global Wireless Matrix. The Merrill Lynch Global Wireless Matrix displays quarterly data on company level for Mobile Network Operators (MNOs).7 We focus on information on minutes of use, voice revenue per minute, and subscriber market share.
BEREC (the successor to the ERG) has published an MTR snapshot every 6 months that displays country average values. These BEREC/ERG data served as our source of MTRs.
Voice revenue per minute can be viewed as a proxy for retail price. We chose to use Merrill Lynch data, whereas some earlier studies rely on Teligen data. We consider the Merrill Lynch data to be the greatly superior choice, for reasons that we note below.
Even though the European Commission regularly uses Teligen/OECD data in their annual Implementation Reports, there is reason to doubt that the Teligen data are a meaningful and reliable reflection of real costs to real consumers. They represent hypothetical prices for a hypothetical basket of services, using the least expensive services for that basket from the two largest mobile operators in the market. They do not reflect (1) how much service an average customer in a given country uses; (2) how customers are divided among operators; (3) how customers are divided among pricing plans within an operator; (4) which customers have which plans (and whether customers have plans that are appropriate to their usage – a number of studies suggest otherwise); and (5) most likely, there are details of the price plans that are not fully captured.
7 Merrill Lynch Interactive Global Wireless Matrix 3Q08 data, as reported in the US FCC’s 13th CMRS Competition Report, document DA 09-54, 16 January 2009. http://www.cwes01.com/10323/24789/Interactive_Global_Wireless_Matrix.xls, visited 9 May 2009

128 No. 80, 4th Q. 2010
The limitation of the Teligen data to the two largest mobile operators matters for another reason. Large operators are likely to be affected differently by termination rate changes than operators with small market shares. Small operators are more motivated to price aggressively to gain market share.
The great strength of the Merrill Lynch data, by contrast, is that they are based on real world measurements of total voice service-based revenues. The full range of consumer behaviour is fully reflected in the Merrill Lynch data.
At the same time, the analyst must be aware of certain characteristics or anomalies in the Merrill Lynch data.
• Revenue-bearing minutes only: The Merrill Lynch minutes of use reflect only minutes that are associated with revenue. For on-net mobile-to-mobile calls in CPNP countries, originating minutes are reported, but not on-net terminating minutes (For a detailed explanation, see FCC, 2009). This could bias comparisons between CPNP and non-CPNP countries.
• Voice service-based revenue: The service-based revenue includes retail revenues, including fixed monthly fees and usage-based fees per minute of use. It also includes wholesale termination revenue, which should not be viewed as a component of retail price. We have not identified a means to reliably remove wholesale revenues from the data; however, we note that they have declined in relative importance to the point where they represent not more than some 17% of total voice service-based revenues, so their influence is minor.8
• Handset subsidies: The Merrill Lynch service-based revenue figures do not consider equipment costs, and thus cannot be used to infer the level of handset subsidies.
The reliability of underlying data sources is obviously critical to any results. With this in mind, we attempted to check both Merrill Lynch and Teligen data against other publicly available data. We also used a case study (see the 6th Section) based on publicly available data as a "sanity check" on our econometric results.
8 According to Credit Suisse data, European termination ARPU represented on average between 12-14% of total ARPU and 16-18% of voice related ARPUs in the period between 3Q2007 and 2Q2009. See Credit Suisse (2009), p. 54.

C. GROWITSCH, J. S. MARCUS & C. WERNICK 129
A number of National Regulatory Authorities (NRAs) provide data on some combination of originating minutes of use, terminating minutes of use, and wholesale and retail revenues. Spot checks of the Merrill Lynch data against several sets of NRA data showed a reasonable level of consistency, and did not turn up any noteworthy anomalies.9 We feel that they represent an acceptable proxy for retail prices paid by consumers.
Figure 2 - Teligen retail price data versus CMT data in Spain
CMT SBR/MOU vs Teligen SBR/MOU vs MTR
- €
0.050 €
0.100 €
0.150 €
0.200 €
0.250 €
0.300 €
0.350 €
0.400 €
2Q2006 3Q2006 4Q2006 1Q2007 2Q2007 3Q2007 4Q2007 1Q2008 2Q2008 3Q2008 4Q2008
Average Service Based Voice Revenue perMinute (CMT)Low usage (Movistar)
Low usage (Vodafone)
Medium usage (Movistar)
Medium usage (Vodafone)
High usage (Movistar)
High usage (Vodafone)
Average MTR
The spot check did, however, turn up a surprising anomaly relative to the Teligen data. We evaluated the correspondence of Teligen data for Spain to the CMT data, as shown in Figure 2. It turns out that the Teligen data actually move in the wrong direction relative to the CMT data. The CMT data represent real revenues of real users, and do not entail any of the potential anomalies of the Merrill Lynch data.10 These CMT data represent a pure measure of retail voice revenue per originating minute, which is an appropriate measure of retail price. Thus, the CMT data should be viewed as the authoritative source.
9 It is possible that Merrill Lynch also used the same publicly available sources; thus, the consistency that we observed does not in and of itself guarantee that Merrill Lynch’s estimates in other cases are comparably good. 10 We discuss these CMT data in greater detail in the following Section.

130 No. 80, 4th Q. 2010
The Teligen data for Spain (normalised to originating minutes of use) show a small but definite increase in price during a period when real retail revenues per originating minute of use, as measured by the CMT, were declining.
Case study: Spain
Before plunging into the econometric analysis, we consider it useful to present a case study that serves to demonstrate the expected trends. We have chosen Spain because (1) the Spanish CMT has maintained good data that does not suffer, so far as we can see, from any of the anomalies or defects in the Merrill Lynch or the Teligen data; and (2) there have been multiple changes in MTR over the period for which data are available.
The CMT captures a huge array of data. They capture both originating and terminating minutes, distinguishing originating minutes among on-net mobile, off-net mobile, fixed, international, and additional detailed categories. Revenues are similarly detailed.
A substantial fraction of Spanish mobile traffic is destined to other mobile users, with on-net and off-net representing roughly equal fractions. Mobile-to-fixed (M2F) traffic is relatively small by comparison.
MTRs have progressively declined in Spain over the period 2006-2009. The grey line depicts this steady decline.
Voice service-based revenue per minute of use has steadily declined as MTR declined, as one would expect based on the role of MTR as a cost for the quite substantial number of mobile-to-mobile (M2M) off-net calls, as shown in the black line in Figure 3. These Spanish CMT data include retail voice revenue, but unlike the Merrill Lynch data the retail revenue is not intermixed with wholesale revenue. Similarly, only originating Minutes of Use (MOU) appear in the denominator.
The dotted line depicts subscription and registration fees, i.e. the "fixed" portion of a two-part tariff. We have confirmed with the CMT that these are real, distinguishable fees. Spanish post-paid customers are often subject to a monthly payment of the order of € 9, which entitles them to a bucket of about 50 minutes of calls.

C. GROWITSCH, J. S. MARCUS & C. WERNICK 131
This curve is upward sloping (i.e. positive first derivative). In other words, as MTR declines, monthly fees increase. This is not surprising; in fact, it follows naturally from the earliest studies of telecommunications interconnection, including LAFFONT, REY & TIROLE (1998a; 1998b). Under two-part tariffs, a network operator can change prices by means of the fixed portion without incurring the risk of an "access deficit" (running a net loss on off-net calls). This tends to confirm a prediction that a number of regulators have made in connection with the current focus on lower MTRs, namely that the effect of lower MTRs would be partly offset through increases in the fixed portion of two-part tariffs.11
Figure 3 - MTRs and voice revenue per originating minute of use
0.110 0.1100.100 0.100 0.100 0.100
0.080 0.0800.070 0.070
0.060 0.060 0.057 0.057
0.189 0.190 0.186
0.1700.181
0.171 0.171 0.1660.159 0.157 0.153 0.151 0.148 0.147
0.006 0.005 0.005 0.008 0.008 0.009 0.010 0.010 0.011 0.011 0.013 0.013 0.015 0.014
0.195 0.195 0.1910.178
0.1900.180 0.182 0.177
0.170 0.168 0.166 0.164 0.163 0.162
0.00 €
0.05 €
0.10 €
0.15 €
0.20 €
0.25 €
2Q2006 3Q2006 4Q2006 1Q2007 2Q2007 3Q2007 4Q2007 1Q2008 2Q2008 3Q2008 4Q2008 1Q2009 2Q2009 3Q2009
MTRTraffic SBR / orig MOUSubscription fees / orig MOUVoice SBR / orig MOU
The white curve represents solely the traffic-dependent component of retail price per originating minute. It is equal to the total retail revenue per minute minus the fixed retail revenue per minute, i.e. to the black curve minus the dotted curve.
The white curve moves in the same direction as the MTR curve, but the slope is less. This is again consistent with expectations. There are two primary reasons: (1) not all calls are destined for off-net mobile, thus not all calls benefit from lower costs as a result of lower MTRs; and (2) to the extent
11 This is an illustration of the "waterbed effect", as described in JULLIEN, REY & SAND-ZANTMAN (2009). It is related to, but distinct from, the phenomenon discussed in GENAKOS & VALLETTI (2010).

132 No. 80, 4th Q. 2010
that mobile operators have pricing power, they will not necessarily pass all of their savings on to consumers.
Finally, we note that the black curve moves in the same direction as MTRs, but that the slope is somewhat gentler than that of the white curve. This is once again consistent with expectations. With two-part tariffs, the increase in fixed fees partly offsets the decline in usage-based fees.
The Spanish CMT data also demonstrate that as MTRs decline, demand (in terms of originating Minutes of Use) increases. This is once again consistent with expectations, as a manifestation of demand elasticity.
Quantitatively, these values correspond to an elasticity of retail price (retail voice revenues per MoU) to MTR of about 0.60; an elasticity of usage-based retail voice revenue per MoU of about +0.75; and an elasticity of subscription retail voice revenue per MoU to MTR of about 0.17.
Econometric results
First, we consider the relationship between voice retail price (as represented by voice service-based revenues per minute of use) and minutes of use per month, both based on Merrill Lynch data (see above). To avoid any problems of non-stationarity in the data and the corresponding spurious regression (GRANGER & NEWBOLD, 1974), we start with a series of panel unit root tests. Applying a test suggested by MADDALA & WU (1999), we can reject the hypothesis of the existence of a unit root for all the variables except the MTR. This, however, is not a problem for the difference GMM estimator (ARELLANO & BOND, 1982) that we apply for model validation. To deal with the problem of prices being potentially endogenous (in other words correlated with past or current realisations of the error term), we use a twofold approach of instrumenting our price variable.12 First, we use the national industry average price for every year instead of each individual operator's price as an instrument. It can be assumed not to be influencing the error term of our per company estimates. Second, within the GMM model introduced above, we even go beyond this and additionally use lagged price information as instruments, because the differences of previous
12 Using instrumental variables allows consistent estimations when the explanatory variables are correlated with the error term.

C. GROWITSCH, J. S. MARCUS & C. WERNICK 133
prices are not mathematically related to differences of today's error term, thus solving any potential endogeneity problem.13
To estimate the elasticity of demand for mobile services, we apply the Houthakker-Taylor Model (HOUTHAKKER & TAYLOR, 1970). This model allows for path-dependencies in usage behaviour, and differentiates between short run and long run demand elasticities. Table 1 shows the demand elasticities resulting from the Houthakker-Taylor Model (Houthakker and Taylor, 1970), estimated in a System-GMM setting. We observe a short run price elasticity of demand of - 0.097 (Model [1]) and approximately the same for the price instrument (average industry price, Model [2]). The long run price elasticity is 0.520 (or -0.608 for the price instrument) for mobile voice minutes for the entire sample (long term coefficient of price divided by (1 - coefficient of ln Minutes (t 1)).14 The latter coefficient, which represents the estimated parameter of the lagged endogenous variable, also shows the speed of adjustment to the long run equilibrium. A speed of adjustment of 0.117 (1 0.883) means that in every period, demand adjusts its long run equilibrium by approximately 12%. Mobile telephone demand can be interpreted as rather persistent.
Table 1 - Demand elasticity (1) (2)
VARIABLES ln Minutes ln Minutes ln Minutes (t-1) 0.813*** 0.841***
(22.44) (27.40) ln Price -0.0973*** -0.0968***
(-4.12) (-4.94) ln Subscriber -0.0309*** -0.0311***
(-2.77) (-3.48) Constant 1.033*** 0.930***
(5.43) (5.68) Observations 1007 1012 Number of id 48 48
Time dummies omitted.
*** p<0.01, ** p<0.05, * p<0.1
13 For a detailed overview of dynamic panel data estimation and the use of instruments, see ROODMAN (2009). 14 Industry sources confirm that these estimates of price elasticity of demand are broadly consistent with those that they use for business planning. We regard this as representing a degree of confirmation that the Merrill Lynch data for service based revenue and MOU function well enough as proxies for retail price and for demand, respectively, the previously noted anomalies notwithstanding.

134 No. 80, 4th Q. 2010
This might be reasoned by adjustment costs and, perhaps more significantly, by an average contract duration of more than a year (or 4 periods in our case). The elasticities are slightly lower than recent findings by DEWENTER & HAUCAP (2007) on the demand elasticity on the Austrian mobile market. Applying a difference GMM estimator (ARELLANO & BOND, 1982) produced similar results to previous research.
Next, we consider the relationship between MTRs and retail price (Table 2). In order to deal with possible endogeneity of MTRs relative to service based revenue per MOU, we analysed the relationship between MTRs and retail prices with a dynamic System GMM estimator. In this model (Model [3]), MTRs are treated as being endogenous: MTR lagged values both in levels and differences are used as instruments within the System-GMM framework. Using PPP-adjusted logarithmised data, we obtain a highly significant coefficient for the MTRs of +0.706.
Table 2 - Effect of MTR on service-based revenue per minute (retail price) (3)
VARIABLES ln Price ln MTR 0.706***
(2.87) Constant -0.267***
(-9.25) Observations 920 Number of id 48
Time dummies omitted.
*** p<0.01, ** p<0.05, * p<0.1
This result is consistent with VERONESE & PESENDORFER (2009). This parameter value can be interpreted as a measure of the elasticity of the retail charges. The positive sign of this result again suggests that MTRs and retail mobile prices move into the same direction. This parameter value can be interpreted as a direct measure of the elasticity of the retail charges; thus, a 10% increase in MTR leads to a 7.1% increase in retail revenue per minute.15
15 Another way to look at this result would reflect the fact that the Merrill Lynch data that serve as our proxy for retail price include a small amount of wholesale revenues in addition to retail. Total wholesale revenues are comprised of the MTR times the volume of minutes. Thus, ignoring demand elasticity, the coefficient for this portion of revenues should be +1.0. Multiple sources estimate the wholesale revenues to represent only about 15% of the total service based revenues. Thus, an increase of 10% in MTR would be expected to result in an increase of 1.5% in service based revenue per minute, irrespective of any retail effects and again
C. GROWITSCH, J. S. MARCUS & C. WERNICK 135
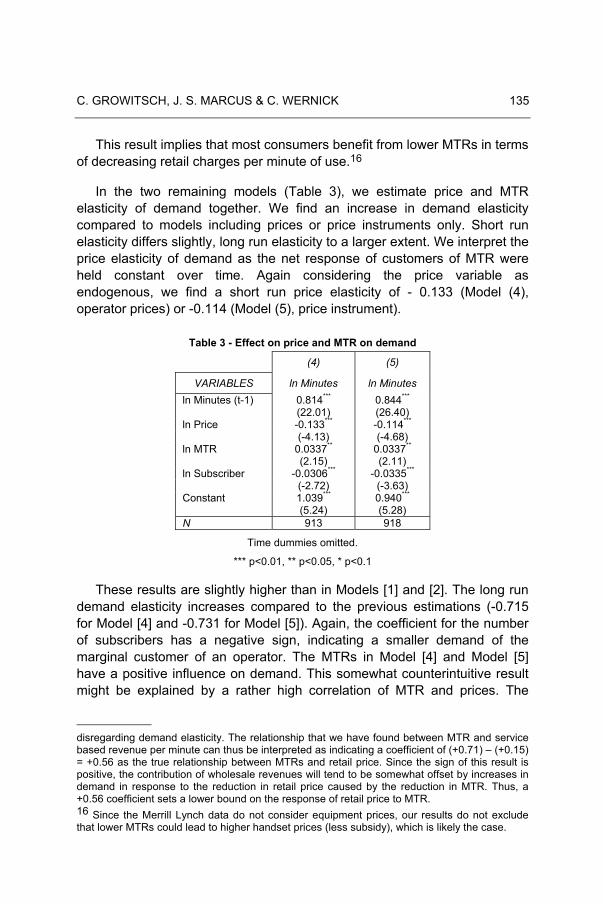
This result implies that most consumers benefit from lower MTRs in terms of decreasing retail charges per minute of use.16
In the two remaining models (Table 3), we estimate price and MTR elasticity of demand together. We find an increase in demand elasticity compared to models including prices or price instruments only. Short run elasticity differs slightly, long run elasticity to a larger extent. We interpret the price elasticity of demand as the net response of customers of MTR were held constant over time. Again considering the price variable as endogenous, we find a short run price elasticity of - 0.133 (Model (4), operator prices) or -0.114 (Model (5), price instrument).
Table 3 - Effect on price and MTR on demand
(4) (5)
VARIABLES ln Minutes ln Minutes ln Minutes (t-1) 0.814*** 0.844***
(22.01) (26.40) ln Price -0.133*** -0.114***
(-4.13) (-4.68) ln MTR 0.0337** 0.0337**
(2.15) (2.11) ln Subscriber -0.0306*** -0.0335***
(-2.72) (-3.63) Constant 1.039*** 0.940***
(5.24) (5.28) N 913 918
Time dummies omitted.
*** p<0.01, ** p<0.05, * p<0.1
These results are slightly higher than in Models [1] and [2]. The long run demand elasticity increases compared to the previous estimations (-0.715 for Model [4] and -0.731 for Model [5]). Again, the coefficient for the number of subscribers has a negative sign, indicating a smaller demand of the marginal customer of an operator. The MTRs in Model [4] and Model [5] have a positive influence on demand. This somewhat counterintuitive result might be explained by a rather high correlation of MTR and prices. The
disregarding demand elasticity. The relationship that we have found between MTR and service based revenue per minute can thus be interpreted as indicating a coefficient of (+0.71) – (+0.15) = +0.56 as the true relationship between MTRs and retail price. Since the sign of this result is positive, the contribution of wholesale revenues will tend to be somewhat offset by increases in demand in response to the reduction in retail price caused by the reduction in MTR. Thus, a +0.56 coefficient sets a lower bound on the response of retail price to MTR. 16 Since the Merrill Lynch data do not consider equipment prices, our results do not exclude that lower MTRs could lead to higher handset prices (less subsidy), which is likely the case.

136 No. 80, 4th Q. 2010
effect we identify here is the marginal effect of MTR on demand over and above the price effect. The parameter value is rather small.17
These econometric findings are broadly consistent with what we see in the country-specific case study based on Spanish CMT data (see above).
Comparison to results in the literature
There have been a number of empirical studies of the relationships amount MTRs, prices and usage.
Numerous papers have analysed the price elasticity of demand for mobile services. For example, DEWENTER & HAUCAP (2007) analyse price elasticities in the Austrian mobile market using firm-specific data for the period from January 1998 to March 2002. They find that business customers have a higher elasticity of demand than private consumers, and that post-paid customers tend to have a higher demand elasticity than pre-paid customers. They also find that demand is generally more elastic in the long run than in the short run.
GENAKOS & VALLETTI (2010) empirically studied the relationships among termination rates, retail prices, and profitability. Using Teligen data based on OECD market baskets, they found that overall retail prices increased moderately in response to a reduction in mobile termination rates. This appears to be at odds with our finding. They also find that profitability (proxied by Merrill Lynch EBITDA data) decreases as a result of reductions in MTRs, suggesting that mobile network operators cannot raise the fixed component of two part mobile tariffs enough to fully compensate for the loss of wholesale termination revenue.
In an empirical study commissioned by the UK regulator Ofcom, Veronese and Pesendorfer considered the relationships among MTRs, penetration, retail price (using Merrill Lynch and Teligen data), and minutes
17 To test for second order autocorrelation, we applied the test suggested by ARELLANO & BOND (1991) finding that the hypothesis of no second order autocorrelation cannot be rejected. A Sargan test of over-identifying restrictions on the number of instruments applied after a conventionally derived variance estimator for generalized method of moments estimation is not significant for the endogenous modelling, but becomes significant for a strictly exogenous modelling of the explanatory variables. The endogeneity assumption seems therefore to be valid.

C. GROWITSCH, J. S. MARCUS & C. WERNICK 137
of use. This study generated surprisingly few statistically reliable findings; however, they found a consistent inverse relationship between MTRs and service-based revenue per minute as provided by Merrill Lynch.18 The relationship was highly statistically significant in all scenarios, and similar in magnitude and identical in sign to our own findings.
Conclusions and recommendations
There are two key expectations that have been implicit in moves by the European Commission and the BEREC/ERG to lower MTRs or to eliminate them altogether:
• Lower MTRs will tend to lead to lower mobile retail unit prices for consumers overall; and
• The resulting lower consumer mobile retail unit prices will tend to result in greater consumption of mobile services (greater call initiation) in terms of minutes of use per month per subscription.
Our findings support these expectations.
• We have shown that lower MTRs tend to result in a lower retail price, with a highly significant coefficient of +0.71.
• Our results also demonstrate, with high significance, that lower MTRs (presumably operating through the mechanism of lower retail prices) tend to result in greater consumption of mobile services (greater call initiation) in terms of minutes of use per month per subscription. Long term elasticity (in the range of -0.52 to -0.61) is much greater than short term elasticity (-0.097).
Two qualifications are appropriate to these points. First, for consumer retail prices to be lower on average with lower MTRs does not exclude the possibility that some customers (e.g. those with lower disposable income) might be worse off.19 Second, for consumer retail prices to be lower on
18 They did not, however, find a statistically significant relationship between MTRs and a set of "de-biased" service-based revenue per minute provided by Ofcom. We conjecture that Ofcom’s transformation of the Merrill Lynch data (which consisted of applying fixed percentages to all SBR and MOU data regardless of year or country) effectively introduced noise and error into the de-biased data. 19 This observation may possibly suggest the need for targeted policy interventions.

138 No. 80, 4th Q. 2010
average does not necessarily mean that all components of the retail price are lower; with a two part tariff, it is probable that monthly fees (for instance) would be higher, while handset subsidies and per minute fees would be lower.
The overall policy implication, in our view, is that efforts to drive MTRs to lower levels are appropriate and will tend to increase consumer welfare.

C. GROWITSCH, J. S. MARCUS & C. WERNICK 139
Bibliography
ARMSTRONG, M., & WRIGHT, J. (2008): "Mobile Call Termination".
ARMSTRONG, M. (1998): "Network Interconnection in Telecommunications", Economic Journal, Vol. 108, S. 545–564.
ARELLANO, M. & BOND, S. (1991): "Some tests of specification for panel data: Monte Carlo evidence and application to employment equations", Journal of Econometrics, Vol. 18, pp. 47-82.
CMT (Comision del Mercado de las Telecomunicaciones): - (2008): Telecommunication Industry Statistics, III Quarter – 2008. - (2009), Telecommunication Industry Statistics, III Quarter – 2009.
Credit Suisse (2009): European First Tel Factsheet.
DEWENTER, R. & HAUCAP, J. (2007): "Demand Elasticities for Mobile Telecommunications in Austria", Ruhr Economic Papers no. 17, Bochum.
European Commission (2009): 14th Implementation Report, 24 March, COM(2009) 140.
FCC (2009): Thirteenth Report: Annual Report and Analysis of Competitive Market Conditions With Respect to Commercial Mobile Services, Washington, D.C.
HOUTHAKKER, H. S. & TAYLOR, L. S. (1970): Consumer Demand in the United States, 2nd edition, Cambridge, MA: Harvard University Press.
GENAKOS, C. & VALLETTI, T. (2010): "Testing the "Waterbed" Effect in Mobile Telephony", forthcoming in the Journal of the European Economic Association.
GRANGER, C. W. J. & NEWBOLD, P. (1974): "Spurious regressions in econometrics", Journal of Econometrics, Vol 2, 111–120.
JULLIEN, B., REY, P., & SAND-ZANTMAN, W. (2009): Mobile call termination revisited.
LAFFONT, J.-J., REY, P. & TIROLE, J.: - (1998a): "Network Competition: I. Overview and Nondiscriminatory Pricing", Rand Journal of Economics, Vol. 29, pp. 1-37. - (1998b): "Network Competition: II. Price Discrimination", Rand Journal of Economics, Vol. 29, pp. 38-56.
LAFFONT, J.-J., & TIROLE, J. (2000): Competition in Telecommunications, MIT Press.
LITTLECHILD, Stephen C. (2006): "Mobile Termination Charges: Calling Party Pays versus Receiving Party Pays", Telecommunications Policy, Vol. 30, pp. 242-277.

140 No. 80, 4th Q. 2010
MARCUS, J. S., ELIXMANN, D., CARTER, K. R., & senior experts Scott BRADNER, Klaus HACKBARTH, Bruno JULLIEN, Gabriele KULENKAMPFF, Karl-Heinz NEUMANN, Antonio PORTILLA, Patrick REY and Ingo VOGELSANG (2008a): The Future of IP Interconnection: Technical, Economic, and Public Policy Aspects, March 2008, Studie für die Europäische Kommission. http://ec.europa.eu/information_society/policy/ecomm/doc/library/ext_studies/future_ip_intercon/ip_intercon_study_final.pdf
MARCUS, J. S.: - (2008b): "IP-Based NGNs and Interconnection: The Debate in Europe", Communications & Strategies, no. 72, p. 17, 4th Quarter 2008. http://ssrn.com/abstract=1373706 - (2004): "Call Termination Fees: The U.S. in global perspective", 4th ZEW Conference on the Economics of Information and Communication Technologies, Mannheim, Germany, July 2004. ftp://ftp.zew.de/pub/zew-docs/div/IKT04/Paper_Marcus_Parallel_Session.pdf
David ROODMAN (2009): "How to do xtabond2: An introduction to difference and system GMM in Stata", Stata Journal, Vol. 9(1), pp. 86-136.
Teligen, Report on Telecoms Price Developments from 1998 to 2007, a report produced for the European Commission, 4 April 2008.
VERONESE, Barbara & Martin PESENDORFER (2009): Wholesale Termination Regime, Termination Charge Levels and Mobile Industry Performance, Ofcom.