the effects of food price and subsidy poucies on egyptian - usaid
TRANSCRIPT

RESEARCH REPORT
THE EFFECTS OF FOOD PRICE AND SUBSIDY POUCIES ON EGYPTIAN AGRICULTURE
Joachim von Braun Hartwig de Haen
INTERNATIONAL FOOD POLICY RESEARCH INSTITUTE
The International Food Policy Research Institute receives support as a constituent of
the Consultative Group onInternational Agricultural Research Iom a number of donors including the governments of Austraiia Canada the Federal Repub ic of Germany India Italy Japan the Netherlands the Philippines and the UntA States the World Bank the Inited NationS [)eweo) meiIt Programme thre Ior( IFonndaion the Intershynational Fund for Agricultural Developmen the Internal ional Development Research Centre (Canada) and the Rockefeller Foun(alion In ad(lilion a number of other
governments and institutions contril)ute funding to special resear(h projects
Board of Trustees
Samar R Sen Nurul Islam Chairman India Bangladesh
Ralph Kirby Davidson Anne de Lattre Vice Chairman USA France
Eliseu Roberto de Andra de Alves Philip Ndegwa Brazil Kenya
Nicolas Ardito Barletta Saburo Okitil Panama Jal)an
Norman E Borlaug T Ajibola Talor USA Nigeria
Mohamed El-Khash Snoh Unakul Syria Thailand
Lowell S Harlin Dick de Zeenw USA Netherla nIs
Ivan L Head John W Mellor Director Canada Ex Officio USA
fy4lf y56
THE EFFECTS OF FOOD PRICE AND SUBSIDY POLICIES ON EGYPTIAN AGRICULTURE
Joachim von Braun Hartwig de Haen
Research Report 42 International Food Policy Research Institute November 1983
Copyright 1983 International Food Policy Research Institute
All rights reserved Sections of this report may be reproduced without the express permission of but with acknowledgment to the International Food Policy Research Institute
Library of Congress Cataloging in Publication Data
Von Braun Joachim 1950-The effects of food price and subsidy policies
on Egyptian agriculture
(Research report 42) Bibliography p 89 1 Food prices-Government policy-Egypt
2 Agricultural price supports- Egypt 3 Agriculshyture and state-Egypt i Haen Hartwig de Ii Title Ill Series Research report (International Food Policy Research Institute) 42
HD9017E4V66 1983 33810962 83-22829 ISBN 0-89629-043-3
1V
CONTENTS
Foreword
1 Summary 9
2 Evaluating the Effects of Food Subshysidies on Agriculture 11
3 The Economic Development of Agshyriculture and Policy Formation 17
4 Effects on Production of Agriculshytural Price Policies and Government Intervention 29
5 How Food Subsidies Affect Public Spending on Agriculture 34
6 Consequences of Government Inshytervention in Agriculture 44
7 The Burden on Agriculture-Deshyvelopment and Determinants with Special Focus on Food Subsidies 71
Appendix 1 Supplementary Tables 78
Appendix 2 The Calculations of the Effects of Government Intervention in Selected Markets 81
Bibliography 89
2
TABLES
1 Share of agriculture in the economy various years
2 Area and holdings by farm size 1952 1961 and 1977
3 Self-sufficiency of major agricul-tural commodities 1965-80
4 Government area planning and actual area forvarious crops 1979-80
com-modities as a percentage of total production 1965-80
5 Procurement of major food
6 Official and black market exchangerates and8 mternational rates 1965-80
7 Agricultural input subsidies and distortion of selected agricultural input prices 1965-80
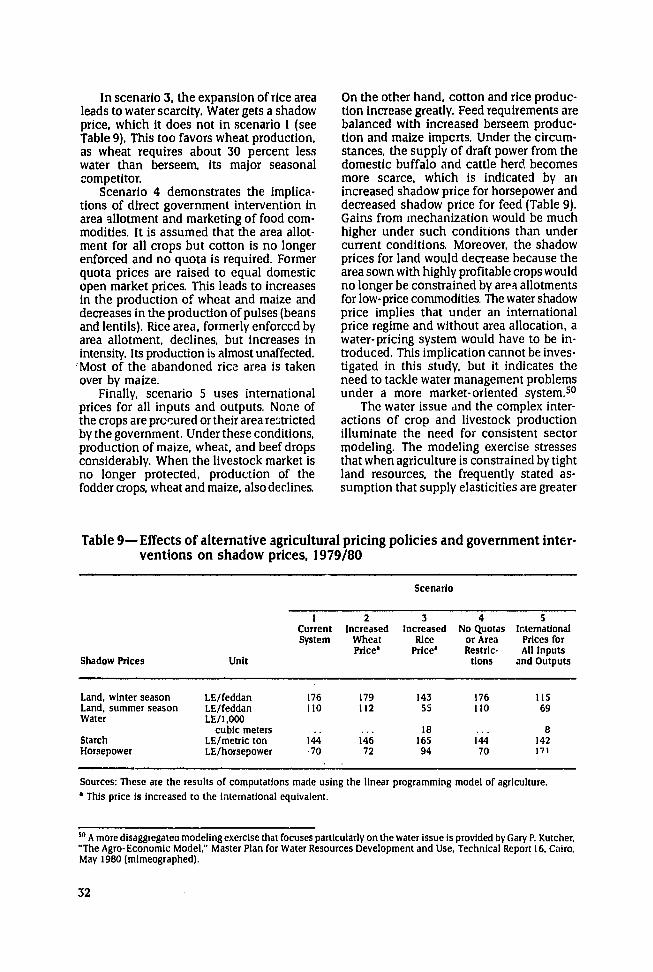
8 Effects of alternative agricultural pricing policies and government interventions on production 1979 80
9 Effects of alternative agricultural pricing policies and government interventions on shadow prices 197980
10 Relationship between increawes in public spending on agriculture GDP and total expenditures 1965-72 and 1972-80
II Correlation coefficients of shares of budget components with special focus on the agricultural budget 1965-80
12 Relationship of wheat prices to international and open market prices 1965-80
18
19
21
22
23
2la5k25
28
31
32
38
39
51
13 Producer losses from price policies and procurement on the wheat rice and maize markets 1965-80 52
14 Consumer gains from price policies and subsidies on the wheat rice and maize markets 1965-80 53
15 Changes in the budget caused by government intervention in the wheat rice and maize markets 1965-80 53
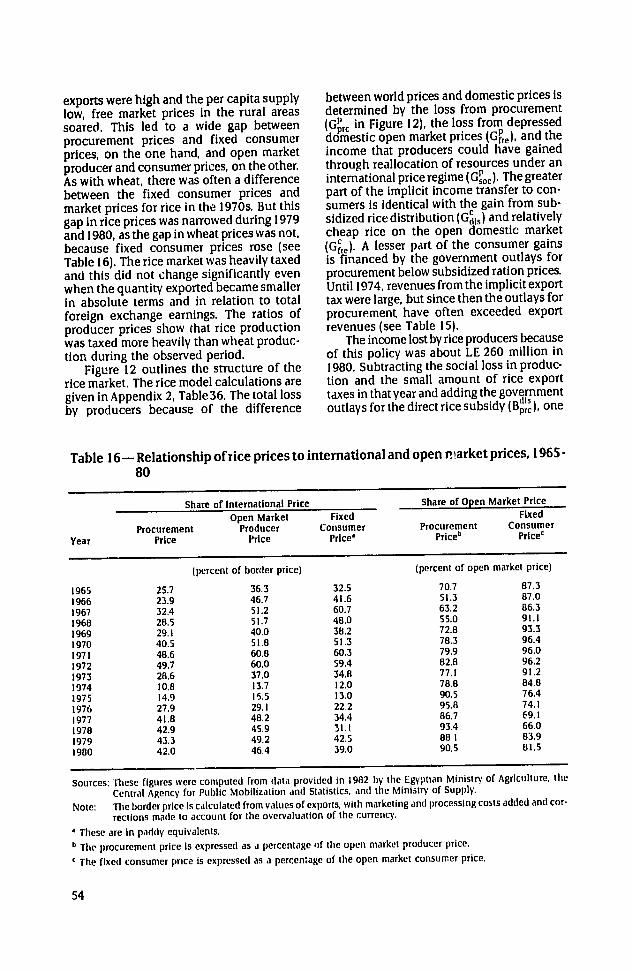
16 Relationship of rice prices to inshyternational and open market prices
541965-80
17 Relationship of maize prices to inshyand open market prices
1965-80 57
18 Relationship of bean prices to inshyternational and open market prices 1965-80 59
19 Producer losses from price policies and procurement on the beans and lentils markets 1965-80 59
20 Consumer gains from price policies on the beans and lentils markets 1965-80 61
21 Relationship of sugar prices to inshyternational and open market prices 1965-80 62
22 Gains and losses of producers and consumers on the sugar market 1965-80 63
23 Producer losses and consumer gains on the cotton market 1963shy
6480
24 Gains and losses of producers and consumers on the meat market 1965-80 66
25 Gains and losses of producers and consumers on the milk market1965-80 68
26 Subsidies for selected feed cate-gories and total feed subsidies1965-80 70
27 Aggregate gains and losses of proshyducers on agricultural commoditymarkets 1965-80 72
28 Components of the burden on ag-riculture 1965-80 73
29 Determinants of changes in the burden on agriculture 75
30 Net returns of major crops 1965-80 78
31 Net returns of major rotations1965-80 78
32 Calculation of border prices at farmgate for wheat 1965-80 79
33 Calculation of border prices at farm gate for rice 1965-80 79
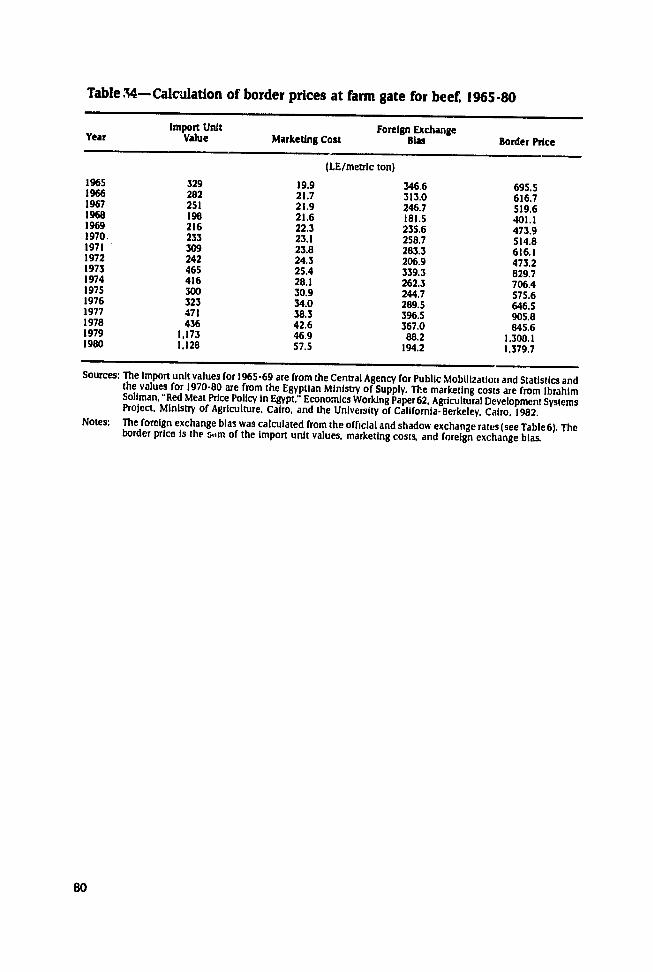
34 Calculation of border prices at farmgate for beef 1965-80 80 35 Model computations for the wheat
market 1965-80 83 36 Model computations for the rice
market 1965-80 84 37 Model computations for the beef
market 1965-80 85 38 Energy demand per unit of live-
stock and livestock numbers seshylected years 86
39 Total requirements of feed 1965shy86
40 Feed supply 1965-80 88
ILLUSTRATIONS
i Analytical framework for the analyshysis of the effects of food subsidies on agriculture 13
2 Cropping pattern 1977-79 20
3 Nominal protection coefficients ofproducer prices 1965-80 26
4 Deficits and revenues in publicexpenditure 1965-80 36
5 Structure of public expenditure1965-80 36
6 Government expenditures on agrishyculture 1965-80 37
7 Share of agricultural investment current expenditures and inputsubsidies in total government exshypenditures 1965-80 37
8 Public investment in agriculture1965-80 41
9 Actual development and a model estimate of government expendishytures on agriculture and the role of food subsidies 1966-80 43
10 Welfare losses of producers resultshying from price distortions and proshycurement 48
11 Average conditions in the wheatmarket 1976-80 50
12 Average conditions in the rice marshyket 1976-80 55
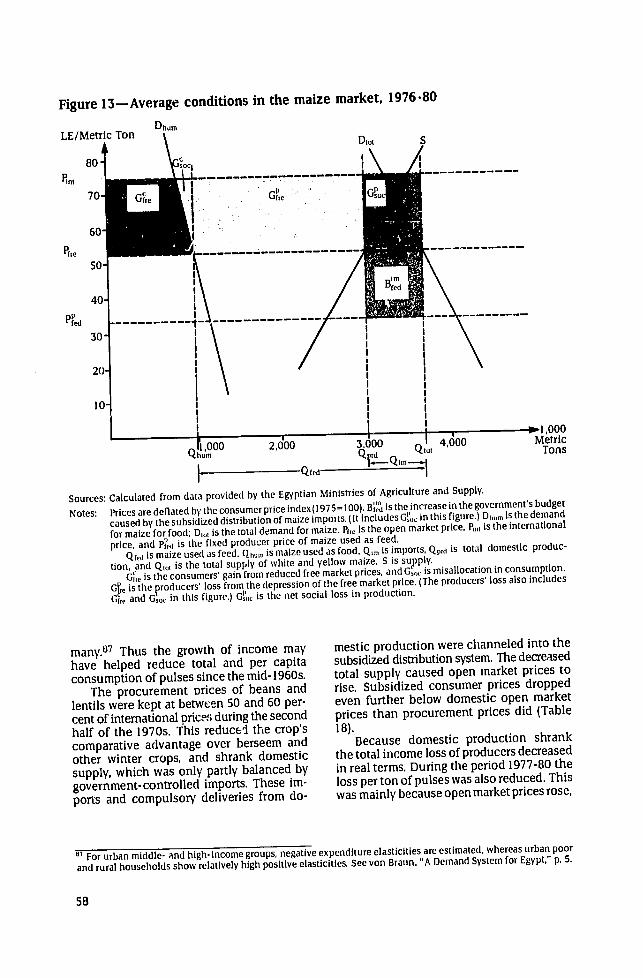
13 Average conditions in the maizemarket 1976-80 58
14 Average conditions in the beef market 1976-80 65
15 Producer losses and gains on comshymodity markets and aggregate netburden 1965-80 73
80
FOREWORD
Food prices are a major factor in deter-mining incentives to agricultural producers and the level of real income and nutritional status of low-income consumers Explicit food subsidies allow lower food prices to consumers relative to producer prices than would otherwise be the case Nevertheless there has been concern that food subsidies may in effect be paid for by farmers and hence serve as a disincentive to agriltural production This report by Joachim von Braun and Hartwig de Haen analyzes this issue through analysis of a wealth of data and the use of innovative methodologicri approaches it examines in particular the effects of agricultural price policies on both consumers and producers on fiscal resources and on the income burden placed on agri-culture
The analysis is part of a series of research reports by IFPRI addressing the effects of food subsidy policies on food consumption nutrition income distribution and macro-economic developments These studies cover a wide range of countries in sia Latin America and Africa and are expected to culminate in a major policy-oriented syn-thesis Egypt because of the large size of its
food subsidy programs is the subject of an intensive interacting set of studies of food subsidies These studies in collaboration with the Institute of National Planning in Cairo and financed by a research contract from the US Agency for International Deshyvelopment are coordinated by Per Pinstrup-Andersen director of IFPRIs Food Conshysumption and Nutrition Policy Program
Two other reports have been published from this project Egypts Food Subsidy and Rationing System A Description Research Report 34 which is an analytical description of the subsidy system in Egypt by Harold Alderman Joachim von Braun and Sakr Ahmed Sakr and FoodSubsidiesin Egypt Their Impact on ForeignExchangeandTrade Research Report 40 in which Grant Scobie assesses the macroeconomic implications of the food subsidy policy Results from analyses of he distribution of benefits and costs of the subshysidy system will be published in a subsequent report
John W Mellor
Washington DC November 1983
ACKNOWLEDGMENTS
The authors gratefully acknowledge the advice of Ismail Badawy Ahmed A Gaffar Kamal El Ganzouri and Yahya Mohie El-Din Fundamental guidance was also provided by Ahmed Goueli Many of the analytical tools used for this study were developed for a joint project of the Institute of AgAicultuyal Economics at the University of Gottingen and the Institute of National Planning Cairo which was funded by the Volkswagen Foundashytion This research was continued through a project funded by the US Agency for Intershynational Development under the technical supervision of the AIDUSDA Nutrition Ecoshynomics Group
The authors are also grateful for the help of the researchers in the Agricultural Planshyning Center of the In3titute of National Planning Most of the data used were proshyvided by the Ministry of Agriculture the Ministry of Supply and Home Trade and the Central Agency for Public Mobilization and Statistics in Cairo
1 SUMMARY
Subsidies to consumers have long beeni a part of Egypts social policy but early in the 1970s government expenditures on food subsidies were greatly expanded in response to increased income population growth and the dramatic increase in world prices Throughout the second half of the 1970s and early 1980s the food subsidy bill ac-counted for 10 to 1S percent of the govern-ments total expenditure The aim of this study is to determine how this rapid growth in consumer subsidies has affected agricul-ture Therefore government spending on agriculture is examined and the govern-ments price policies on inputs and output and its interventions in allocation and mar-keting are evaluated
Much research has been done on the implications of Egypts subsidy scheme for economic growth and income distribution In view of the weaknesses inherent in macro-economic models such as general equilib-rium models this study relies instead on microeconomic quantitative models
Inarguably the subsidy system has led to vast increases in food imports especially grain This conflicts with Egypts desire to achieve self-sufficiEncy According to a widely held theory subsidized distribution of imported food tends to depress producer prices which in turn acts as a disincentive to production and causes crops to be reallo-cated and farm incomes to be reduced Income is transferred indirectly from pro-ducers to consumers On the other hand it may be argued that subsidies represent an increase in real income for consumers that may be spent on additional foods on the open market which would benefit farmers
The time-series analysis of major com-ponents of the governments budget in this report shows that budgeted food subsidies were negatively correlated with public in-vestment (-074) but public nonagricultural investment continued to grow during the mid-1970s when subsidies were rising sharply The correlation coefficient was 071 A re-gression model of the governments agricul-tural spending behavior during the entireoVoUP
period 196S-80 shows that a 10 percent increase in the share of food subsidies in the total budget would cause agricultures share of the budget to decline by 14 percent
Since 1973 however total spending on agriculture haE grown faster than the total budget mainly because input subsidies have grown at about the same rate as food subsidies Thus subsidies to producers have to some extent balanced negative income effects resulting from depressed food prices
The study also analyzes how agricultural price policy evolved while food subsidies were expanding The instruments used by the government to intervene in agriculture include controls on imports and exports compulsory delivery quotas area allotment input subsidies and dual pricing on comshymodity markets
A comprehensive model is applied to quantify the effects on agricultural producshytion of current policies including a policy that would permit all input and output prices to draw closer to international prices Partial analyses demonstrate that both wheat and rice production respond readily to changes in prices It appears that there would be sigshynificant gains for producers if the gap beshytween internationa prices on the one hand and subsidized consumer prices governshyment procurement prices and prices on the uncontrolled market on the other hand became less distinct
The protection of livestock and animal products is a major source of price distorshytions If the whole set of domestic input and output prices were adjusted to correspond to international prices Egyptian wheat proshyduction might actually decline because its current competitiveness stems from the high value of straw fodder If meat and dairy products were no longer protected livestock production would decline reducing the need for fodder and feed and weakening the incentive to grow wheat Production of rice pulses and cotton would increase under such circumstances
The effects of price and market intershyvention policies on agricultural income on
the welfare of producers and consumers and on the government budget are analyzed to assess the burden subsidies place on agriculture A partial equilibrium model of the market for each commodity is con-structed which incorporates all of the major instruments of food police It indicates that the implicit taxation of producers has been considerably reduced since 1974 Procure-ment quotas have been reduced or elimi-nated and farmers incomes have risen-mainly as a result of price increases on the domestic open market Part of the burden of paying for subsidies has shifted from agri-culture to the general budget Between 1977 and 1980 the indirect (implicit) tax on agriculture decreased to about 17 percent
which is similar to the share of public revshyenues in the GDP Aregression model shows that the objective of shielding domestic prices from international fluctuations and the availability of additional government revenues led to the reduction of the burden on agriculture
In sum this study indicates that the expansioi of Egypts food subsidy system in the 1970s was not primarily at the cost of agriculture Price distortions are an inherent feature of Egypts agricultural policy existshying long before explicit food subsidies beshycame an important component in governshyment fiscal outlays Reducing these distorshytions could help to overcome inefficiencies in Egyptian agriculture
10
2 THE EFFECTS OF FOOD SUBSIDIESEVALUATING
ON AGRICULTURE
Food subsidies are one of the most prominent features of the Egyptian economy These subsidies affect various sectors of the economy but their influence on agriculture which comprises both consumers and pro-ducers and employs a considerable share of the nations resources seems particularly strongI
Because of its importance to the econ-omythe subsidy system has been the sub-ject of much research The concepts behind Egypts food policies and prevalent theories about subsidies are reviewed in this chapter and the strengths and weaknesses ofexisting macroeconomic models are assessed
Policy Evaluation
One widely held hypothesis holds that supplies imported for subsidized distribution in domestic markets tend to depress pro-ducer prices of competing commodities and that this price depression creates disincen-tives to production reallocation of crops and reduced farm incomes Lower producer prices cause implicit income transfers from producers to consumers On the other hand it can also be argued that food subsidies cause real income transfers to consumers resulting in increased demand for commodi-ties on the open market from which the farm sector could gain Open markets exist for the subsidized commodities themselves where quantities are rationed such as rice or where the number of outlets for the commodity is low such as for wheat in rural areas
Actually the microeconomic mechanisms are even more complex when practical poll-ces are taken into account In order to avoid a decline of production as a conse-
quence of price disincentives the governshyment operates a strictly cGitrolled area allotshyment scheme for some crops Moreover it has established compulsory delivery quotas at prices fixed below the ma rket prices (see Chapter 3) These delivery quotas and area allotments not only help toreduce variability in resource allocation induced by low prices but they remove at least potentially the need to ensure a market surplus by keeping procurement prices close to or above proshyduction costs Hypothetically there would seem to be a tendency to increase the proshyducer burden (producer tent -forgone)when public funds are scarce
This explains the commodity composishytion of the procurement program Those commodities that are strictly rationed at fixed prices on the food distribution side are also strictly controlled on the production side Rice pulses and sugar are examples Nonrationed or not strictly rationed comshymodities like wheat maize sorghum and meat have experienced considerably less interference in allocation and marketing 2
Agricultural input and output prices are disshytorted in another way whereas field crops are usually taxed the production of meat and milk has typically been protected by import restrictions and by the supply of subsidzed feed The special situation for feed and livestock indicates that food policy may cause a consumer-to-producer transshyfer and even a producer-to-producer transshyfer which accompanies redistribution of incomes among the production sectors within agriculture
Another line of reasoning focuses on the direct fiscal implications of food subsidies and their indirect effects on public spending on agriculture Increased government outshylays for food subsidies may induce relative
IFor adescription ofthe system see Harold Alderman Joachim von Braun and Sakr Ahmed Sakr Egypts Food Subsidy and Rationing Systenr ADescription Research Report 34 (Washington DC International Food Policy Research Inshystitute 1982)21bid p53
11
or absolute reductions in the agricultural budget and thus have a negative effect on sectoral development To the extent that public investments in agriculture and rural infrastructure are connected to food subsi-dies in such a hypothetical relationship the effect on sectoral growth and employment could be detrimental particularly in the long run
An assessment of the effect of food subshysidies on agriculture must take account of specific linkages and policy mechanisms The effects on production of procurement price fixing area allotment and the com-petition for scarce public funds have to be considered A distinction has to be made between those markets where subsidized and rationed commodities are released from government outlets and so- called open or free markets where transactions of food commodities are uncontrolled
In addition supplementary empirical analyses are required that describe specif-ically how and to what extent a wedge is placed between consumer and producer prices by specific producer price and pro-curement policies for th various food com-modities to what extent these policies create gains and burdens for producers and consumers what effects the policy-induced changes in prices and price ratios have on the composition and the level of agricultural production and whether variations in food stbsidies cause adjustments in public agri-cultural investment and current expenditure
The objective of this research is to analyze agricultural policymaking in the environ- ment of an extended food subsidy system Inefficiencies and misallocation of resources in agriculture arising from food subsidies are hidden costs of such systems However it is crucial to separate out from the whole bundle of policy 4cals and related instru-ments those that ire directly or indirectly linked to food subsidies The basis for thiF
can be provided only by a complete quantishytative assessment of a countrys agricultural policy and its determinants The complex institutional and technical structure of Egypts agricultural sector make this an ambitious task Some simplifications are unavoidable Figure I roughly outlines the structure of this report and the approach taken to policy evaluation
Review of Evidence from Macro Models
Conclusions about the macroeconomic effects of subsidies conflict in various models that have been used to evaluate them Some of the contradictions are due to differences in model assumptions and structures Others result from differences in the degree of realism achieved in mapping existing subshysidies3
The following macroeconomic effects of subsidies are however widely accepted Subsidies lead to a reduction of consumer prices for the subsidized commodities or for commodities produced using subsidized inputs This price decline affects price ratios and real disposable income The effect on the price ratio causes a change in the comshyposition of consumption in favor of subsishydized goods The effect on real disposable income causes an increase of real consumer purchasing power and a subsequent increase in total consumption
One line of argumentation arising from these assumptions states that given the inelasticity of food demand the reduction in prices for food leads to an expansion of the demand for other commodities At a given nominal wage level this increase in demand causes a multiplier expansion of employment and output in the rest of the economy This positive growth effect is however accompanied by increased imports and hence an expanded foreign deficit4
The macroeconomic effects of food subsidies in Egypt have been analyzed by several authors More recent publishycations mentioning implications for agriculture of the subsidy system includeJJDethier and HEsfahani Macroshyeffects of Alternative Price Policies in Egypt Economics Working Paper 188 Agricultural Development Systems Prclect Ministry of Agriculture Cairo and the University of California-Berkeley Cairo September 1981 Richard S Fkaus and A Mohie el-Din Consequences of Changes in Food Subsidy Policies in Egypt Working Paper 265 Department of Economics Massachusetts Institute of Technology Cambridge Mass April 1980 Khalid Ikram Egypt Econnmir Management in a Period of Transition (Baltimore Md Johns Hopkins University Press 1980) Lance Taylor uod Subsidies in Egypt Department of Economics Massachusetts Institute of Technology Cambridge Mass October 1979 (mimeographed) and World Bank Arab Republic of Egypt Domestic Resource Mobilization and Growth Prospects for the 1980s Report 3123EGT (Washington DC World Bank 1980)
4 An analysis of food subsidy Impacts on foreign exchange and trade is given in Grant M Scobie FoodSubsidies in Egypt Their Impact on Foreign Exchange and Trade Research Report 40 (Washington DC International Food Policy Research Institute 1983)
12
Figure I-Analytical framework for the analysis of the effects of food subsidies on agriculture
Goals and instruments of agricultural policy
Price and market Public spending intervention policies policies
1 (3) (5)
fl -cto-1 Production Demando effEctsmand Deffeces model_ I (4) (6) i I system _ I__
I- - - Income transfersF 1 I Economic lossesWelfare Budget effects on analysis commodity markets
L (6)
Aggregate burden Allocation of public on agriculture funds for agriculture
(7) (5)
Policy determination
F- - Food subsidies andRegression prices[ analyses
L - - Food subsidies and the agricultural budget
(7)
Notes The numbers in parentheses refer to the chapters of the study The tools used in this report to analyze theeffects on agriculture are outlined with broken lines
The conclusion to be drawn from this argu- inputs in fixed proportion to output) and ment built on Keynesian tradition isobvious savings adjust to changes in demand at a reduction of subsidies would result in an predetermined investment levels Total laboroverall contraction of the economy This supply is assumed to be infinitely elastic atkind of economic reasoning is characteristic the given wage which implies free in- and of the earlier applications of general equi- out- migrationlibrium models (GEM) subsidies affect The main controversy about the macroshyeconomic activities mainly through their economic effects of subsidies relates to the impact c t real disposable incomes in con- question of whether the subsidies indeed junction with the rice responsiveness of have positive growth effects or whether as consumer demand Production levels im- intuitive economic reasoning suggests theyports (which are assumed to be either non- have contractive effects None of the availshycompetitive consumer goods or intermediate able models gives a definite answer to this
Zckaus and Mohie el-Din Consequences of Changes In Food Subsidy Policies p 15
13
question Recent applications of the GEM reveal that this ambiguity is not surprising because the answer is related to two central unresolved issues which involve behavioral assumptions and require further empirical tests First do subsidies lead to reduced savi-igs The answer depends on the follow-ing inequality
reduced savings at lt increased savingsthe source of fi- _ in the recipient nance for subsidies households
Second do subsidies add to inflation The answer again depends on an inequality
inflationary effects lt deflationary of government - effects of price deficits reductions
Both questions are interrelated 6 If gov-eminent deficits would indeed be reduced in the absence of subsidies or if subsidies were reduced the pressure on interest rates and prices might be smaller This implies that the subsidies that are cut would not be substituted for by other components of aggregate demand and the stated contractive effect would occur On the other hand the government would have the chance to sub-stitute for subsidies through increased public savings which would make resources avail-able for more public or private investment
This mechanism is one aspect of the al-ternative closure rules applied to the GEM by Dethier and Esfahani 7 Basically they distinguish between a Keynesian closure rule which yields the results already men-tioned and a neoclassical closure rule For the neoclassical rule they assume that the labor supply is fixed and savings which are mainly determined by government policy are exogenous Investment adjusts endog-enously to savings with fixed sectoral shares Under I hese assumptions they arrive at very different results for the macroeconomic
effects of subsidies In the absence of subshysidies the price of food would increase and food demand would decline as under Keyshynesian assumptions However because food output would also decline the released labor would be allocated to other sectors and the output of the rest of the economy would inshycrease Due to increased government savshyings investment would also increase and as a net effect the reduction of subsidies would have positive growth implications for the overall economy In other words subsishydies cannot be said to favor economic growth
if aggregate demand can also be maintainedwithout subsidies
One way to increase aggregate demand
when subsidies are reduced is through a wage-price spiral if food prices went up there would be pressure to increase wages The resulting wage increments would be passed on in further price increases which would again cause wages to increase which would generate additional demand Another way of increasing aggregate demand would be to create additional public demand in the form of public current consumption or public investment Taylor demonstrates with a Keynesian model that with both a wageshyprice spiral and increased investment to maintain aggr - ate demand income distrishybution might be further biased toward the urban population8 Yet in the short run the absorptive capacity of the economy might not allow for a full substitution of investshyment spending for subsidy expenditures
So a reduction or a removal of subsidies would not automatically have contractive effects on the economy Alternative model formulations show a wide range of outcomes and related policy scenarios
However a major weakness of the GEM at least in its current state is the lack of flexibility on the supply side9 Domestic supply is modeled with Cobb-Douglas valueshyadded functions and reacts only to changes in demand This implies that a price- induced reduction of demand causes domestic supply to fall as well without taking into account
6 See Henry J Bruton Four Issues of Economic Policy in Egypt Economic Studies Unit Ministry of Economy
Foreign Trade and Economic Cooperation Cairo 1980 (mimeographed) 7 Dethier and Esfahani Macro- effects of Alternative Price Policies
8 See Taylor Food Subsidies in Egypt I See Richard S Eckaus F D McCarthy and A Mohie el- Din Multi- Sector General Equilibrium Policy Models for Egypt Development Research and Technology Planning Centre Cairo University 1979 (mimeographed) pp 8-16 and Eckaus and Mohie el-Din Consequences of Changes in Food Subsidy Policies pp 16-17
14
separate producer price movements This weakness obviously comes from the treat-ment of trade in the model This may not matter as long as the model is used for short-term policy analysis but it has important implications when the long-run effects of food subsidies on the agricultural sector are to be represented
Theoretically agriculture could gain from the subsidy-induced increase in food de-mand depending on agricultures competi-tiveness with imports and on practical poli-cies Under the prevailing conditions in Egypt the additional demand is largely met with foreign goods Hence it is likely that agriculture does not gain and that the price disincentive effect has dominated in the past
The models now available do not allow a full empirical test of these hypothetical implications Taking the GEM as an example the following aspects limit its applicability to specific agricultural questions
1 Although imports of consumer goods are not considered to be comptitive with domestic goods in reality most of them are especially wheat meat and sugar There-fore domestic supply mainly responds to demand and not to economic indicators
2 Although the Egyptian government operates its food policy with procurement and price policies such instruments are not included in the model
3 The model only deals with the price effects of subsidies on consumer demand where prices are ccmputed as markups of production costs indirect taxes and subsi-dies As Eckaus and Mohie el Din point out the existence of rationing may yield very different conclusions depending on whether subsidies are affected by a change in the amount of a subsidized commodity or by changes in the subcidy rates 0
4 The GEM identifies four agricultural production sectors ThesE are not quite enough for an analysis of product-specific subsidies The staple food group for instance includes wheat which is not rationed and which is mostly imported and rice which is rationed and is controlled through a strict procurement policy For maize which is in the same group increasing amounts of
imports are released at subsidized prices for use as livestock feed An aggregate model can hardly be used to examine the impact of these subsidies nor can it be used to assess the influence of subsidies on the costs of meat and milk production
5 Available applications of the GEM indicate that distributional effects vary widely depending on the assumptions made for he subsidy and the macroeconomic closure rule Subsidies generally seem to increase the net progressiveness of the fiscal system Yet the results of the GEM applications by Dethier and Esfahani indicate that the disshytribution within sectors is quite stable whereas the distribution betwe the rural and the urban sectors reacts more sensitively to changes in the assumptions about the closure rules11 Eckaus and Mohie el-Din show that subsidy effects are progressive only when subsidies are made effective by a decline in prices For instance if a subsidy is reduced as the result of a reduction in the quantity of subsidized imports and not as a resulc of a reduction of subsidy rates the Eckaus and Mohie el-Din model shows a shift in the distribution of income in favor of agriculture 12
6 Finally one must realize that some of the allocational implications of subsidies will be dynamic rather than static as the typshyical GEM assumes This is true not only of the growth effects the effects that could be expected from higher shares of investment in total aggregate demand as a consequence of reduced subsidies Even if investment were stable and subsidies reduced current public expenditure on other iters such as agricultural research and extension it is likely that such budget reallocations would inhibit the growth of agricultural production which the available models would not cover Unfortunately there has so far been little empirical research on the productivity effects of alternative agricultural development plans and related budget appropriations
For the purposes of this study the lack of an endogenous domestic supply response module is probably the most critical problem with these models Price increases from a cut in subsidies may not only reduce deshymand as the models indicate but they may
Eckaus and Mohie el-Din Consequences of Changes in Food Subsidy Policies pp 37-54
Dethier and Esfahani Macro-effects ot Alternative Price Policies 12 Eckaus and Mohie el-Din Consequences of Changes in Food Subsidy Policies pp 42-55
15
also cause the share of domestic production in total supplies to increase Moreovez even with a given subsidy several policy ystems can separate producer prices from the con-sumer markets In fact niany dual price policy systems are being used in the Egyptian agricultural markets
A moe recent modeling approach the Domestic Resouce Mobilization Model (DRM) doesprovidethepossibilityofmode
l-
ing the domestic supply response at least indirectly 13 As in the GEM subsidy varia-tions have a price ndan income effect on demand where the changes in demand are governed by a linear expenditure system The demand for imported goods is then de-rived from total demand and the relative prices of domestic and imported goods Although this could make it easier to study the production effects of subsidies the DRM does not treat the production of agri-cultural commodities as endogenous Wheat production is exogenous in the model and cotton is realistically treated as a specific export commodity Cotton exports however are related to aggregate cotton production simply by a growth elasticity
The DRM is more flexible than the GEM on macroeconomic closure rules It can also produce time paths of development Although total domestic production is governed by the demand module which includes import substitution domestic resource use and resource capacities are adjusted as functions of technical progress population growth
intersectoral migration and capital accumu-lation Capital accumulation is determined exogenously by specific investment policies
The DRM was used to analyze the effects of a reduction in food subsidies Specifically
a reduction in wheat subsidies an increase in the domestic wheat price and a complete removal of all other subsidies were examined The positive macroeconomic effects domshyinated the solution as n the neoclassical version of the GEM The foreign exchange gap and the savings gap narrowed Agriculshytural exports increased whereas the comshymodity composition of imports shifted toshyward nonagricultural imports which was mainly a reaction to a positive effect on agricultural incomes
In sum three tentative conclusions can be drawn from these macroeconomic models First subsidies do not automatically support or impair economic growth That depends on the accompanying government policies Second subsidies contribute to the proshygressiveness of the fiscal system In other words low-income households benefit more than high-income households Third macshyroeconomic models can only give results for overall economic activities of which agrishyculture is a part Implications for agriculture must be derived from these
The research reviewed in this chapter
has focused on quantitative models The complex structure of Egypts agriculture and the evolution of its agricultural policy and rural development strategies is not explained by these models but must be taken as given A complete assessment of these issues is beyond the scope of this study 4
Finally this study does not evaluate the effect of food price and subsidy policies on the distribution of personal income in agriculture These issues are dealt with elsewhere15
13World Bank Arab Republic of Egypt Domestic Resource Mobilization 14See Mahmoud Abdel-Fadil Development Income Distributionand SocialChange in Rural Egypt (1952-1970) Departshy
ment of Applied Economics Occasional Paper 45 (Cambridge Cambridge University Press 1975) and Alan Richards Egypts Agricultural Development 1800-1980- Technical and Social Change (Boulder Colo Westview Press 1982)
11 See Alderman von Braun and Sak Egypts Food Subsidy rind Rationing System
16
3 THE ECONOMIC DEVELOPMENT OF AGRICULTURE AND POLICY FORMATION
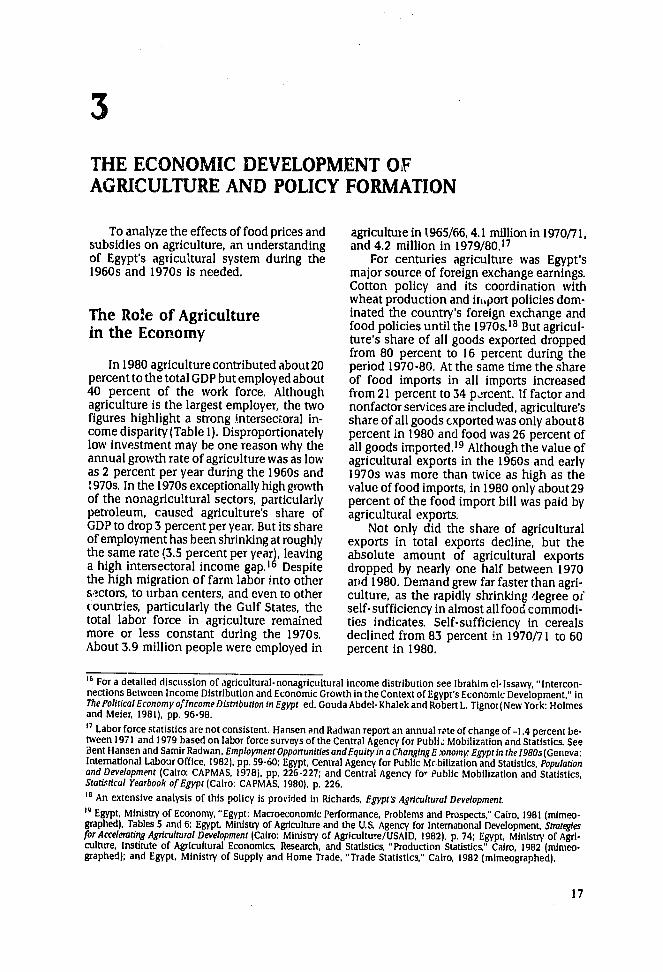
To analyze the effects of food prices and agriculture in 196566 41 million in 19707 1 subsidies on agriculture an understanding and 42 million in 19798017 of Egypts agricultural system during the For centuries agriculture was Egypts1960s and 1970s is needed major source of foreign exchange earnings
Cotton policy and its coordination with wheat production and irnport policies dom-
The Rote of Agriculture inated the countrys foreign exchange andin the Economy food policies until the 1970s18 But agriculshytures share of all goods exported dropped
from 80 percent to 16 percent during the In 1980 agriculture contributed about20 period 1970-80 At the same time the share
percent to the total GDP but employed about of food imports in all imports increased 40 percent of the work force Although from 21 percent to 34 p_rcent If factor and agriculture is the largest employer the two nonfactor services are included agriculturesfigures highlight a strong intersectoral in- share of all goods cxported was only about8 come disparity (Table 1)Disproportionately percent in 1980 and food was 26 percent of low investment may be one reason why the all goods imported 19 Although the value of annual growth rate of agriculture was as low agricultural exports in the 1960s and early as 2 percent per year during the 1960s and 1970s was more than twice as high as the970s In the 1970s exceptionally high growth value of food imports in 1980 only about 29 of the nonagricultural sectors particularly percent of the food import bill was paid bypetroleum caused agricultures share of agricultural exportsGDP to drop 3 percent per year But its share Not only did the share of agriculturalof employment has been shrinking at roughly exports in total exports decline but the the same rate (35 percent per year) leaving absolute amount of agricultural exports a high intersectoral income gap 6 Despite dropped by nearly one half between 1970 the high migration of farm labor into other and 1980 Demand grew far faster than agrishysectors to urban centers and even to other culture as the rapidly shrinking degree of (ountries particularly the Gulf States the self-sufficiency in almost all food commodishytotal labor force in agriculture remained ties indicates Self-sufficiency in cereals more or less constant during the 1970s declined from 83 percent in 197071 to 60 About 39 million people were employed in percent in 1980
16 For adetailed discussion of agricultural-nonagricultural income distribution see Ibrahim el-Issawy Interconshynections Between Income Distribution and Economic Growth in the Context of Egypts Economic Development in The PoliticalEconomy ofIncome Distributionin Egypt ed Gouda Abdel- Khalek and Robert L Tignor(New York Holmes and Meier 1981) pp 96-98 17Labor force statistics are not consistent Hansen and Rddwan report an annual rate of change of-14 percent beshytween 1971 and 1979 based on labor force surveys of the central Agency for Publi Mobilization and Statistics See Bent Hansen and Samir RadwanEmployment OpportunitiesandEquityin a ChangingE -onomy Egypt in the1980s(GenevaInternational Labour Office 1982) pp 59-60 Egypt Central Agency for Public Mbilization and Statistics Populationand Development (Cairo CAPMAS 1978) pp 226-227 and Central Agency foy Public Mobilization and Statistics Statitical Yearbook of Egypt (Cairo CAPMAS 1980) p 226 aAn extensive analysis of this policy is provlded in Richards Egypts Agricultural Development
19Egypt Ministry of Economy Egypt Macroeconomic Performance Problems and Prospects Cairo 1981 (mimeoshygraphed) Tables 5 and 6 Egypt Ministry of Agriculture and the US Agency for International Development Strategiesfor AcceleratingAgricultural Development (Cairo Ministry of AgrlcultueUSAID 1982) p 74 Egypt Ministry of Agrishyculture Institute of Agricultural Economics Research and Statistics Production Statistics Cairo 1982 (milmeoshygraphed) and Egypt Ministry of Supply and Home Trade Trade Statistics Cairo 1982 (mimeographed)
17
Table 1-Share of agriculture in the economy various years
196566 1970171 1 0
(percent)
Share ol total GDP 284 275 210 Share of total gross
fixed investment 81 78 8 0b
Share of total 534 532 3 9 3 b
employment
Sources Egypt Central Agency for Public Mobiliza-tion and Statistics Statistical Yearbook ofFgypt (Cairo CAPMAS 1980) pp 222-227 Egypt Ministry of Economy Egypt Macroeconomic Performance Problems and Prospects Ciro 1981 (mimeographed) Tables 5 and 6 and World Bank Arab Republic of Egypt Economic Management ina Period oflansition(Washing-ton DC World Bank 1970) 611
The figures for gross domestic product (GDP)are at current prices bThis figure is for 1979
The food security issue is extensively discussed in Egypt mainly with respect to this reduction in self-sufficiency 20 Awider view of the food security issue focuses on the decreased ability of agriculture to provide the means to compensate for the growing food import bill 2 1
While the first viewpoint merely leads to a strategy stressing domestic provision of cereals the second asks for a balancing of the foreign exchange budget between sectors Both strategies might have some rationale on political grounds but both can reduce economic efficiency A sector modeling exercise concludes that to increase cereal production as much as desired cereals
would have to be highly protected Balancing the sectoral foreign exchange budet would on the other hand require protection of the sector as awhole if current per capita conshysumption is to be maintained 22
Farm Structures Resources and the Land Use Pattern
There are about 35 million farms in
Egypt with an average size of 16 feddans 23
In 1977 52 percent of farm land belonged to farms smaller than 5 feddans which made
up 95 percent of all holdings (Table 2) Furshy
thermore about 40 percent of all farms are less than 1 feddan these constitute just 12 percent of the total area24 The pressure of a growing population in combination with the customs for inheritance of land have led to an increase in the number of holdings which has increased the man-land ratio and rural
25 poverty
The amount of arable land is a major conshystraint to increasing agricultural production About 58 million feddans of fully irrigated old lands and 05 million feddans of newly reclaimed desert land were under cultivation in 1980 These 63 million feddans cover about 3 percent of the total land area of Egypt This land along the Nile and in the Nile Delta has some of the best soil in the world and is perennially irrigated Rainfed agriculture is insignificant Expanding arable land has been economically technically and managerially difficult26
The water supply for year-round agriculshytural production which Egypts weather conditions make possible is regulated at the Aswan High Dam This gives Egyptian
20 The issue is given major attention in Egypt Ministry of Agriculture and the US Agency for International Developshy
ment Strategiesfor Accelerating Agricultural Development
21 An analysis of the food security issue is provided by Ahmed Goueli Food Security Program in Egypt in Food Press 1981) pp 143-157Security for Developing Countries ed Alberto Valdbs (Boulder Colo Westview
22 See Joachin von Braun and Hartwig de Haen Egypt and the Enlargement of the EEC Impact on the Agricultural
Sector Food Policy 7 (February 1982) 46-56
23 A feddan equals 1038 acres 24See Richard Adams Growth Without Development in Rural Egypt ALocal-level Study of Institutional and Social
Change PhD thesis University of California Berkeley 1981 p 25 25Samir Radwan and Eddy Lee The Anatomy of Rural Poverty Egypt 1977 World Employment Programme Geneva
1980 (mimeographed) 26Carl HGotsch and Wayne MDyer Rhetoric and Reason In the Egyptian New Lands Debate Food Research Instishy
tute Studies 18 (No 2 1982) 129-148
18
Table 2-Area and holdings by farm size 1952 1961 and 1977
Area Holdings 1952 1961 1977
Farm Size Holdings 1952 1961 1977
Less than S feddans (percent) 354 521 520 943 941 950 47 40
5 - 20 feddans (percent) 195 191 214 45 12 12 10
More than 20 feddans (percent) 451 288 266
Average size (feddans) 21 20 16 2801 3101 3162
Number of holdings (1000)
Source Egypt Central Agency for Public Mobilization and Statistics StatisticalYearbook of Egypt (Cairo CAPMAS
1980) pp 54-56
agriculture the characteristics of a huge irrigation project Total water supply may increase during the next decades due to changes in the southern Nile system But the total supply of irrigation water seems to be less a constraint than its management 27
A complex system of overlapping rota-tions is characteristic of Egypts agriculture Figure 2 describes the cropping pattern in 1977-79 The cropping intensity averages about 190 whereas it was 176 in the early 1960s With a higher share of vegetable crops shortened growing periods for new varieties of staple crops and decreased falow it might well exceed 200 in the future28
Development of Production Structures and Economic Incentives
Agricultural production structures changed remarkably during the 1960s and 1970s In the early 1960s the completion of the Aswan High Dam caused land use pat-terns and cropping intensities to change The process of adjusting to the new water availability continued until the second half of the 1960s Since then changing economic incentives and direct government interven-tion in allocation have been mainly respon-
sible for shifting land use patterns and growth of livestock production
Among the winter crops the fodder area which is devoted to a full-season clover called berseem changed the most growing from about 12 million feddans in 1965 to 17 million feddans in 1980 Among the summer crops cotton showed the largest reduction while wheat area remained more or less constant The increase in full- season berseem area was primarily at the cost of the area for pulses and short-season berseem which are cultivated before cotton Total land area has increased 2-300000 feddans since the mid- 1960s which has allowed the area used for fruit and vegetable crops to
29expand
The land use pattern in the summer season shows a continuous growth of maize area and a reduction of cotton and sorghum cultivation 30 Maize area increased by 30 percent (about 05 million feddans) and cotton area shrank by 35 percent (07 million feddans) between 1965 and 1980 The rice area remained almost constant at about 11 million feddans during the 1970s
The tremendous expansion of fodder and animal feed production in both seasonsshyberseem in winter and maize in summershyreflects the growing livestock herd The
27 John Waterbury Hydropolitics of the Nile Valley (Syracuse NY Syracuse University Press 1979)
28James BFitch and Afaf A Aziz Multiple Cropoing Intensity in Egyptian Agriculture AStudy of its Determii ants
Research Paper 5 Microeconomic Study of the Epntlan Farm System Ministry of Agriculture Cairo October 1980
29No accurate data on total land are available as new land under cultivation and losses of cultivated land for nonshy
agricultural purposes are only roughly estimated
30The nili season (autumn) is included in the summer season
19
Figure 2-Cropping pattern 1977-79 Percent of Cropped Land 100 Idle winter land (4)
90 Cash-crop Cotton (22) berseem (l9)
80
70- Rice (18)
Idleb6 Full-term berseer (30)
50- Maize (24)
40-
Sorghum (7)(23)30WheatNo e D eOther summer rogs (4)
Broad beans (4) Idle lan in ps o Idle o4nill i Study otEpiFaSye M y adoel c cIrop midsummer p 2 Summer 7
0 _ Winter veMetbles (4) vegetables (8) L NHL Mveetbles j4)Incude lOther winter crps (7)a
Permanent crops (fruits 15and sugarcane r41)
August September OctoberNovemnber December January February Match Aprill May June July
Source Nabil Tflabashi James BFitch and Salwa Rehiwi Egypts Agricultural Cropping Pattern AReview of the System by which atis Managed and its Relationship to Price Policy Research Paper No 4 Microeconomic Study of the Egyptian Farm System Mint3try of Agriculture Cairo November 1980 p2
bullIncludes lentils chick peas fenugreek flax barley and other crops IsRepresents land that istemporarily idle bet een summer crops such as cotton and rice and winter crops such as
berseem
number of cattle buffalo sheep and goats crop and wheat straw as fodder Governmefit has increased 30-50 percent since the mid- control of the area allotment of rice has had 1960s an effect as well
The changes in net returns per feddan of the major crops reveal that the dynamic reshyallocation of crops corresponds to the com- Agricultural Policy Goals parative advantages of the rotations In 8 and Instruments out of the 16 years from 1965 to 1980 the berseem- maize rotation provided the highest return to land In 5 years returns of the Egypts agricultural policy isbest undershy
berseem-rice rotation exceeded it slightly stood as having two goals The first is to and in 3 years during the late 1960s and provide adequate basic foods to all groups early 1970s the short-season berseem- cotton of the population including those with low
rotation was highest (Appendix 1 Tables 30 incomes The second goal is for Egypt to beshy
and3 1)Since the late 1960s the profitability come fully self-sufficient in as many food of fodder crops has increased far more rapidly commodities as possible Since the revolushy
tion of 1952 two political factors havethanthe profitability of cotton This explains the major shift in crop allocation The ratios helped to determite these goals the security
of social peace and stability on the oneof the net returns of rice and maize and of wheat and full-season berseem have not hand and external independence on the chanped as much The relative stability of other hand the area of these cereals is partly determined More specifically the goals of agricultural by the importance of wheat as a subsistence policy during the past 15 years have been to
20
stabilize farm prices to procure basic food commodities to increase productivity to increase public revenue and to improve the balance of payments3 1
The goal of price stability became im-portant during the 1970s when world market prices of most agricultural commodities fluctuated greatly peaking in 197374 and 197980 Procurement prices and average producer prices rose rapidly during this time Riots in January 1977 which followed an attempt to increase prices of subsidized consumer goods reinforced the belief that keeping prices stable was of prime importance
Since Egypt has enjoyed relatively peace-ful foreign relations foreign exchange avail-ability has increased due to growing oil ex-ports Suez Canal revenues and remittances from Egyptian workers in Arab countries There are indications that these improve-ments favor a closer orientation of domestic agicultural prices to the trends of inter-national prices Whether these trends have
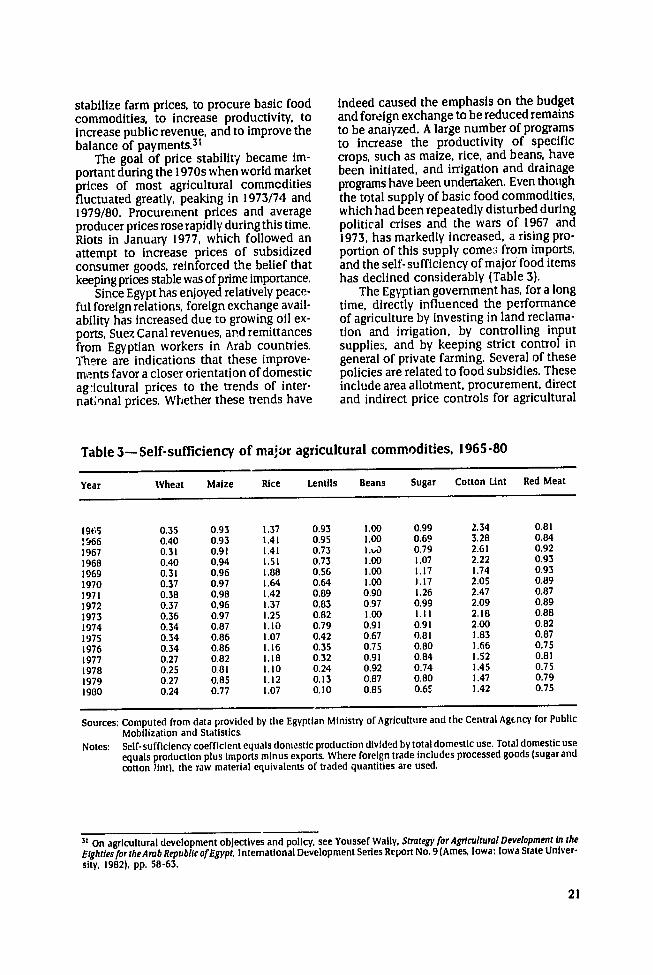
indeed caused the emphasis on the budget and foreign exchange to be reduced remains to be anaiyzed A large number of programs to increase the productivity of specific crops such as maize rice and beans have been initiated and irrigation and drainage programs have been undertaken Even though the total supply of basic food commodities which had been repeatedly disturbed during political crises and the wars of 1967 and 1973 has markedly increased a rising proshyportion of this supply come from imports and the self-sufficiency of major food items has declined considerably (Table 3)
The Egyptian government has for a long time directly influenced the performance of agriculture by investing in land reclamashytion and irrigation by controlling input supplies and by keeping strict control in general of private farming Several of these policies are related to food subsidies These include area allotment procurement direct and indirect price controls for agricultural
Table 3- Self-sufficiency of major agricultural commodities 1965-80
Year Wheat Maize Rice Lentils Beans Sugar Cotton Lint Red Meat
093 100 099 234 0811965 035 093 137 966 040 093 141 095 100 069 328 084 1967 031 091 141 073 1O 079 261 092 1968 040 094 151 073 100 107 222 093
1969 031 096 188 056 100 117 174 093 1970 037 097 164 064 100 117 205 089
1971 038 098 142 089 090 126 247 087 1972 037 096 137 083 097 099 209 089
1973 036 097 125 082 100 111 218 088 1974 034 087 110 079 091 091 200 082
1975 034 086 107 042 067 081 183 087 1976 034 086 116 035 075 080 166 075 1977 027 082 118 032 091 084 152 081
0751978 025 081 110 024 092 074 145 1979 027 085 1i2 013 087 080 147 079
0751980 024 077 107 010 085 06c 142
Sources Computed from data provided by the Egyptian Ministry of Agriculture and the Central Agcncy for Public Mobilization and Statistics
Notes Self-sufficiency coefficient equals domestic production divided by total domestic use Total domestic use
equals production plus imports minus exports Where foreign trade includes processed goods (sugar and cotton lint) the raw material equivalents of traded quantities are used
31On agricultural development objectives and policy see Youssef Wally Strategy for Agricultural Development in the EightiesfortheArob Republic ofEgypt International Development Series Report No 9 (Ames Iowa Iowa State Univershysity 1982) pp 58-63
21
commodities and input pricing and ahotment
Area Allotment
There are several reasons why the Egyp-tian government allocates areas for specific crops even at the farm level 32 In the past
over-area was allotted partly to prevent production of crops such as cotton and rice During the 1960s and 1970s the instrument was used to enforce production of minimum amounts of politically desired crops Today a prominent objective is to ensure that cer-tain amounts of food commodities are pro-duced domestically Another objective is to ensure that production of export crops mainly cotton and rice is large enough to reach foreign exchange targets in spite of low fixed producer prices At least this was a purpose until foreign exchange became available from other sources in the second half of the 1970s Area allotments also help to assure that crop production is on a large enough scale to facilitate efficient operation of irrigation and pesticide programs
Although area allotments undoubtedly have a significant effect on the pattern of production there is evidence that farmers often illegally deviate from prescribed area allotments when they can get higher income from an alternative area allocation Table 4 indicates that the actual area for all crops for which the plan is enforced-rice beans lentils and cotton- islower than the planned area The area planning for the remaining crops only indicates what is desired and is not enforced However the more or less enforced area allocations for rice and cotton in the summer season have strong reper-cussions on the whole cropping system given the interseasonal effects of cotton in the rotation scheme (see Figure 2) The inter-dependency of area allotment by the govern-ment and decisions on allocations by farmers will be discussed later
Procurement
As indicated earlier the government operates a system of compulsory deliveries
Table 4- Government area planning and actual area for various crops 1979-80
Entorced Crop Planned Actual or Not
(1000 feddans)
Wheat 1380 1391 Not enforced Rice 1100 1039 Enforced
1884 Not enforcedMaize 1761 Beans 300 287 Enforced Lentils 40 22 Enforced Sugarcane 290 249 Not enforced Onions (winter) 36 22 Not enforced
Garlic 23 16 Not enforced cotton 1301 1196 Enforccd
Source Data provided by the Egyptian Ministry of Agiculture
For these crops contractual agreements are settled with
farmers in certain regions They involve delivery of the crop at a fixed price
at fixed prices The entire cotton crop and a high share of the winter onion crop must be sold to the cooperatives at low prices Among the basic food commodities certain proportions of wheat rice beans lentils sesame and groundnuts are subject to the quota system In the case of sugarcane nearly all of the crop is sold to the governshyment because all of the processing facilities are state owned
The shares of total production that are procured at low prices vary among comshymodities and in time (Table 5) Rice has the largest volume of procurement usually amounting to one half of total production Traditionally a major portion of this was exported but the amount that isdistributed domestically has steadily increased Wheat the second most important procurement food crop has had a significantly lower relative quota of 15-20 percent Moreover the quota dropped drastically in 1977 when forced deliveries officially ceased Actually some procurement continued even after
32See Nabil T Habashi James B Fitch and Salwi Rehlwi Egypts Agricultural Cropping Pattern A Review of the
System by which it is Managed and its Relationship to Price Policy Research Paper 4 Microeconomic Study of the
Egyptian Farm System Ministry of Agriculture Cairo November 1980
22
Table 5- Procurement of major food commodities as a percentage of total production 1965-80
Year Wheat Rice Beansb Lentils
(percent) 1965 180 500 1966 176 500 1967 192 508 1968 186 511 1969 106 524 1970 120 443 50 1971 165 421 339 1972 149 406 219 1973 153 407 116 1974 190 386 153 1975 187 480 218 202 1976 153 472 250 407 1977 81 463 225 658 1978 65 470 182 381 1979 155 519 344 911 1980 69 512 317 642
Sources Data on procurement of wheat beans and lentils were compiled atom unpublished data provided by the Principal Bank for Developshyment and Agricultural Investment 1982 and data on procurement of rice and productionof wheat beans lentils and rice were ob-tained from the Egyptian Ministry of Agricul-ture 1982
Wheat procurement for 1965-68 is arough estimate by the Principal Bank for Development and AgriculturalInvestment no actual data were available bIt could not be fully ascertained whether beans were procured during 1965-69 or whether lentils were procured during 1965-74 Ahmed Hassan In arecent publication mentions 1967 as the year of introduction of delivery quotas for beans and lentils (Ahmed Hassan Cooperative Marketing and Compulsory Deliveries of Some Agricultural Crops Institute of National Planshyning Cairo 1982 [mimeographed])
1977 apparently as a result of local arrange-ments and special regulations for farms on area distributed during the land reform ofthe 19b0s In 1979 as much wheat wasthe 960s In1979as heatwasmch procured as during the period of enforced deliveries Other procurement crops like beans and lentils are procured in much smaller quantities but relative shares have been significant in recent years
The declared purpose of wheat procure- ment has traditionally been to ensure a stable
flow of domestic grain to the urban populashytion But the factors that apparently motishyvated the drastic reduction of wheat proshycurement in 1977 suggest that the budget is an important constraint for the achievement of this goal In the past procurement prices were close to import prices (converted at official exchange rates) When world market prices went up during the world food crisis (197374) consumer prices were kept well below import prices The consequence was
a heavy burden on the subsidy budget for wheat imports This may explain why proshycurement quotas were raised and enforced with vigor during that period at prices that increased much more slowly than world prices By 1975 the situation changed Imshyport prices declinei again while procureshy
ment prices being more or less strictly linked to costs of production and inflation conshytinued to grow The government reacted by drastically reducing domestic purchases and increasing the share of imports in urban supplies
Amodel that regresses the relative quotaof wheat procurement (w) on government revenues (r) and the ratio of procurementprices to import prices (p) supports the hypothesis that procurement is significantlyinfluenced by the governments finances
w= 3103 - 946 p - 00049 r (-297) (-484)
ft2 - 065
where
w- the share of procurement in the proshyduction of wheat
p - the share of the procurement price in the import price at the official exchange rate and
r - government revenuesinLE million deshyflated by the consumer price index 33
The time series is for the period 1965-80 t-values are in parentheses
De Janvry Siam and Gad address themshyselves to the more general question ofwhether
33The Egyptian pound (LE) equals 100 plasters In July 1982 US $122 equaied LE 100 Between 1977 and August1981 the Egyptian pound equalled US 5143 Prior to devaluation in 1977 the Egyptian pound was valued at more than $250
23
forced deliveries are needed to ensure a sufficiently high market supply34 Their empirical case study for wheat and rice based on predetermined elasticities of supply and demand concludes that forced deliveries are irrelevant to food security in Egypt Voluntary sales would increase more than proportionately if compulsory deliveries were halted Moreover the authors suggest that the dominant effect of this policy in-strument is to tax farm incomes The con-clusionthatitisirrelevanttoensuredomestic supplies to urban areas comes from the as-sumption that the elasticities of supply with respect to changes of price are low for wheat and rice and that free sales are reduced by the quotas In other words a reduction of free sales reduces the immeJiate supply-increasing effect of the procurement policy One side effect of this is that prices increase on the free markets which reduces the welfare of those rural households that do not have full access to subsidized food markets and that produce less than their subsistence requirements
Whether the results that de Janvry Siam and Gad obtained for 1976 with data taken from a sample of farms represent thle sectUal aggregate and are valid for longer periods of time is unclear But because the elasticities used lie within the range of the few available estimates and because the gaps between procurement and the open market prices assumed for 1976 were not atypical for the 1960s and 1970s the calculation appears to be reasonable
Direct and Indirect Price Controls
The Egyptian government operates a complex set of market inteiventions and price regulations that not only cause do-mestic prices and price ratios of agricultural products to diverge from international prices but also cause differences in prices between more or less separated domestic markets
even for the same commodity35 It is evident that these price distortions may affect the allocation of resources and production consumption patterns and foreign trade
Egypt like most other developing counshytries tends to overvalue its currency Most agricultural trade and several nonagricultural imports have been handled at the official foreign exchange rate Other imports are subject to mixed financing with a fixed share of foreign exchange converted at the official exchange rate and the rest at a higher so-called parallel rate 36 Finally imports of some commodities must rely completely on foreign exchange from black market sources When there is a quota on international trade and an increase in prosshyecutions on black market foreign exchange transactions as in the 1960s the black market rate is a somewhat distorted indicator of the marginal shadow price of foreign exchange It is still used here for an assessshyment of price policy because there is no comprehensive model of the Egyptian foreign exchange market The Egyptian government has devalued the Egyptian pound several times Nevertheless a comparison of officii exchange rates with the black market rates for the dollar reveals a permanent though fluctuating overvaluation of the currency (see Table 6) This divergency of exchange rates makes export and import prices in Egyptian pounds appear to be lower than Egypts international purchasing power
The statistics of agricultural producer and consumer prices are incomplete in Egypt Although fixed prices for producers and consumers are well documented open market prices are generally not well known Basically the open market prices used in this report are derived from unpublished statistics made available by the Central Agency for Public Mobilization and Statistics on free rural and urban consumer prices 37 For wheat and pulses free producer prices are assumed to be below free rural consumer
34Alain de Janvry Gamal Siam and Osman Gad Forced Deliveries Theii impact on the Marketed Surplus and the
Distribution of Income in Egyptian Agriculture Economics Working Paper 36 Agricultural Development Systems Prolect Ministry of Agriculture Cairo and the University of California- Berkeley Cairo September 1981
35For adescription of how price policies are implemented in Egypt see William Cuddihy Agricultural PnceManagernent in Egypt World Bank Staff Working Paper 388 (Washington DC World Bank 1980)
For more details on foreign exchange and trade policies and the impact of food subsidies see Scobie FoodSubsidies In Egypt37These basic data are available from the authors upon request
24
Table 6-Official and black market ex-change rates 1965-80
RelativeForeign
Year Official Black
Market Exchange
Biasamp
(US $LE) 1965 1966 1967 196R
230 230 230 230
112 109 116 120
1053 1110 0982 0916
1969 1970 1971 1972
230 230 230 230
110 109 120 124
1090 1110 0916 0854
1973 256 148 0729 1974 1975 1976 1977 1978
256 256 256 256 256
157 141 135 139 139
0630 0815 0896 0841 0841
199 1980
143 143
133 122
0075 0172
Sources Official exchange rates were obtained from the Central Bank of Egypt black market ex-change rates were taken from Picks Currency Yearbook various issues(New York Franz Pick Publishing Co various years)
a The relative deviation (B)of the black market rate (Wb InLEUS$)fromtheofficialrate(W inLEUS$i - WoWb
prices by a marketing margin of 5 percent Free producer prices ol rice are calculated by deducting processing costs from free consumer prices For maize sugarcane cot-ton and livestock products average pro-ducer prices derived from Ministry of Agri-culture data are assumed to apply to the total domestic supply This assumption is made because a separation of producer mar-kets either does not exist (for example for domestic maize and cotton) or is quantita-ively unimportant The latter is also true for
sugar where the majority of produce is sold to sugarcane factories and for livestock where prices are officially fixed for those livestock products that have been produced using subsidized feed but where the fixed prices are seldom enforced
An analysis of the price changes reveals some general characteristics and some commodity-specific phenomena (see Fig-ure 3) Ageneral impression is that official domestic prices to both producers and con-
sumers are much more stable than the corshyresponding international prices Domestic free prices on the other hand fluctuate substantially Throughout the 15-year periodthe domestic prices of grain wheat rice
and maize) and of pulses (beans and lentils) have been lower than the corresponding border price equivalents domestic wheat and rice prices have been even lower than the international prices at the officiai exshychange rate (see Appendix 1 Tables32-33) Depending on whether they are compared to fixed or to open market prices and omitting
the world market price boom of the early 1970s border price equivalents at the farm gate have been two to three times higherthan the producer prices of wheat and rice
Maize prices are mainly influenced by the subsidized release of imported maize most of which is used for feed Because the demand for feed has expanded rapidly faster
than the rapidly growing maize imports open market prices have risen much more swiftly than fixed prices Protection of liveshystock products has favored this development
This protection increased througho
the second half of the 1970s More recently producer prices of beef for example have been 20 to 40 percent higher than their border price equivalents at farm gate Imshyports were admitted after 1973 but limitashytions on foreign exchange at the official exchange rate and a complicated system of import license restrictions made private meat imports difficult On the consumer side the government has subsidized sales supplied mainly from imports Most of this is frozen beef With the exception of a price jump early in the 1970s the subsidized conshysumer prices have been stable since 1974 they have even been nominally constant But because these sales are rationed there exists a free market for beef where prices are considerably higher The free market prices were even higher than world market prices in the second half of the 1970s Nominal protection of milk products is also high although a comparison of international and national prices is more difficult because the traded tood milk powder cannot be easily compared to domestic milk products
Input Subsidies
To assess the effects of price intervenshytions on agricultural production it is not enough to study the taxation of major field
25
Figure 3-Nominal protection coefficients of producer prices 1965-80 Nominal
Protection Wheat and rice Coefficient 10shy
08shy VWheat
06- (official price)
N04- Ricebull
02- R(open market price)
Rice
(official price)
1975 19801965 1970
Nominal Protection
Beans and lentilsCoefficient 10- Lentils (open market price)
08- X Beants (open market price)
08
06-
Beans (official price)
02 Lentils (official price)
I I
1975 19801965 1970
Nominal Protection Cotton and beef Coefficient 14 shy12 f I
BeI 10shy
08 -
06
04- Cotton
02
1975 19801965 1970
Notes Nominal protection at the official price isthe ratio of the official producers price to the world market price equivalent at the farm gate Nominal protection at the open market price is the ratio of the open market producers price to the world market price equivalent at the farm gate The world market prices are converted using the shadow exchange rate (as given in Table 6)
26
crops or the protection of livestock products alone Several inputs including fertilizer cotton pesticides and feed are also provided at distorted prices Moreover faners benefit from indirect subsidies such as low fuel prices free irrigation water and other infra-structural services A considerable share of the direct input subsidies go to pest control for cotton
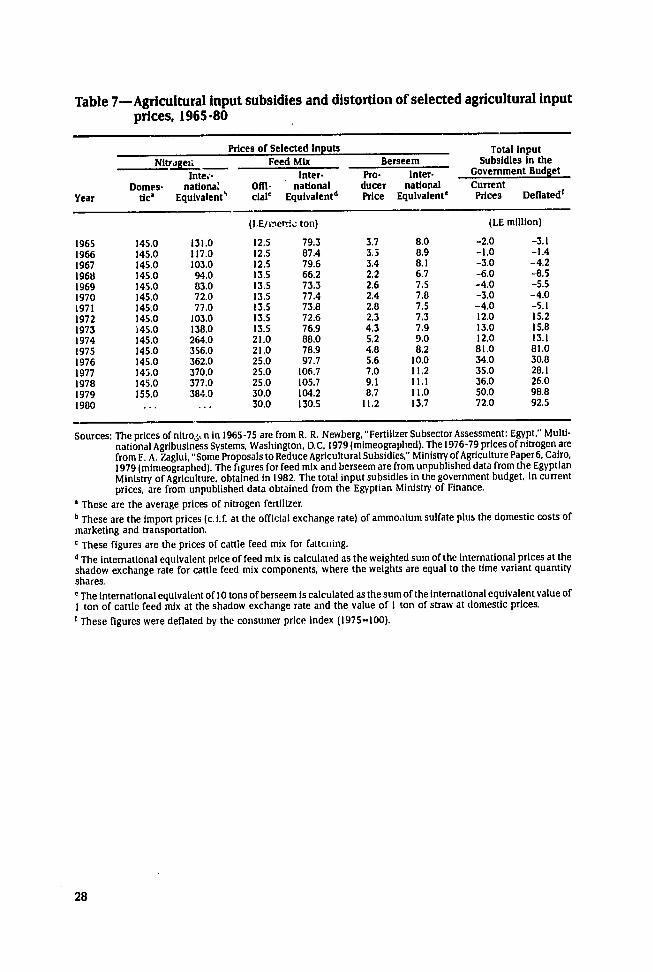
Fertilizer subsidies became important only after 1975 when world market prices rose and domestic prices were kept un-changed With the beginning of the world market boom the agricultural stabilization fund in the government budget which until then had resulted in a net taxation of inputs became a source of increasing input sub-sidization This effect is clearly indicated by the drastic expansion of the total value of direct input subsidies both in nominal and in real terms (see Table 7)
Because the subsidies on major inputs are large they can be assumed to have an important effect on production Accurate information is hard to find but an attempt is made in Table 7 to compare domestic prices and international price equivalents for nitro-gen fertilizer cattle feed supplied by public feed mix companies and berseem Com-ponents of the cattle feed mix are evaluated at their international prices The international price of berseem is computed under the as-sumption that 10 tons of berseem are equiv-alent in nutritional value to I ton of straw and I ton of feed mix 38
A comparison of national and interna-tional input prices indicates that fertilizer was taxed until the mid-1970s and was heavily subsidized in the latter part of the 1970s The tax on fertilizer was the dominant factor in the overall budget effects of input price interventions This changed when the volume of feed being distributed at hightV subsidized prices began to rise As the data in Table 7 indicate the official release price of feed mix has always been exceeded by the
international price equivalent Moreover because the international value of feed mix has been relatively high the computed inshyternational price equivalent of berseem is clearly higher than the domestic farm-gate price of berseem The domestic price of berseem is affected by two counteracting factors its marginal return in the livestock sector which is characterized by low physical outputinput ratios and the taxed price of competing field crops This may explain why the domestic berseem price lies below the international equivalent value despite proshytection of meat
Taxation The direct taxes on agriculture are only
marginal A land tax is levied on all arable land on the basis of the annual rental value of the land The rental value is assessed by the Central Administration about every 10 years This official rental value grossly unshyderestimates the actual rental value of land The tax based on this official rental value is paid by the landowner annually Its basic rate is 14 percent Between 1953 and 1973 taxable landowners whose tax liability did not exceed LE 4 weie exempt After 1973 properties of less than 3 feddans became exempt The land tax contributes less than I percent to total tax revenues and therefore is not included in the following analyses 39
Agriculture is indirectly taxed through export taxes The nominal protection rates for cotton and rice-the two major export crops of the 1960s and 1970s-indicate this The major reason why this taxation policy was adopted is its administrative and political feasibility Korayem concludes in her analysis of the issue thatit is easier and more beneficial politically and economically to the gover ment to tax farmers income disguisedly by the price differential policy of the agricultural crops than to tax this income explicitly by a specific progressive income tax 40
38 Both quantities 10 tons of berseem and I ton of feed mix plus I ton of straw are roughly equivalent in energy and
protein Yet a full substitution is not feasible due to differences in digestibility and other dietary properties For a more detailed discussion of the problem of treating berseem as atraded good see JCIngram and TMoursi Treating Berseem as aTraded Good in the Calculation of Social Returns Economlcs Working Paper 18 Agricultural Developshyment Systems Project Ministry of Agriculture Cairo and the University of California-Berkeley Cairo May 1981
39 MReda Ael- Edel Impact of Taxation on Income Distribution An Exploratory Attempt to Estimate Tax Incidence In Egypt in The Political Economy of income Distribution InEgypt ed Gouda Abdel-Khalek and Robert LTignoriNew York Holmes and Meier 1981) p 135 40Karima Korayem The Agricultural Output Pricing Policy and the Implicit Taxation of Agricultural Income in The
Political Economy ofIncome Distributionin Egypt ed Gouda Abdel- Khalek and Robert LTignor (New York Holmes and Meier 1981) p184
27
Table 7-Agricultural input subsidies and distortion of selected agricultural input prices 1965-80
Prices of Selected Inputs Total Input
Nltrigei Feed Mix Berseem Subsidies in the Pro- Inter- Government BudgetIntei Inter-
Domes nattona Ofl- national ducer national Current Year tic Equivalent clalc Equivalentd Price Equivalente Prices Deflated f
(IEinere ton) (LE million)
1965 1450 1310 125 793 37 80 -20 -31 1966 1450 1170 125 874 35 89 -10 -14 1967 1450 1030 125 796 34 81 -30 -42 1968 1450 940 135 662 22 67 -60 -85 1969 1450 830 135 733 26 75 -40 -55 1970 1450 720 135 774 24 78 -30 -40 1971 1450 770 135 738 28 75 -40 -51 1972 1450 1030 135 726 23 73 120 152 1973 1450 1380 135 769 43 79 130 158 1974 1450 2640 210 880 52 90 120 131 1975 1450 3560 210 789 48 82 810 810 1976 1450 3620 250 977 56 100 340 308 1977 1450 3700 250 1067 70 112 350 281 1978 1450 3770 250 1057 91 111 360 260 1979 1550 3840 300 1042 87 110 500 988 1980 300 1305 112 137 720 925
Sources The prices of nitro n in 1965-75 are from R R Newberg Fertilizer Subsector Assessment Egypt Multishynational Agribusiness Systems Washington DC 1979 (mimeographed) The 1976-79 prices of nitrogen are from E A Zaglui Some Proposals to Reduce Agricultural Subsidies Ministry of Agriculture Paper 6 Cairo 1979 (mimeographed) The figures for feed mix and berseem are from unpublished data from the Egyptian Ministry of Agriculture obtained in 1982 The total input subsidies in the government budget in current prices are from unpublished data obtained from the Egyptian Ministry of Finance
bull These are the average prices of nitrogen fertilizer b These are the import prices (c Lf at the official exchange rate) of ammoaium sulfate plus the domestic costs of
marketing and transportation CThese figures are the prices of cattle feed mix for fattciing
d The international equivalent price of feed mix is calculated as the weighted sum of the international prices at the
shadow exchange rate for cattle feed mix components where the weights are equal to the time variant quantity shares
The international equivalent of 10 tons of berseem is calculated as the sum of the international equivalent value of I ton of cattle feed mix at the shadow exchange rate and the value of I ton of straw at domestic prices
f These figures were deflated by the consumer price index (1975-100)
28
4
EFFECTS ON PRODUCTION OF AGRICULTURAL PRICE POLICIES AND GOVERNMENT INTERVENTION
Previous studies have demonstrated that Egyptian farmers like most farmers respond to changes in economic incentives though empirical estimates of that response vary greatly4 1 Price responsiveness is evident in area allocation and crop yields in the rapid reallocation of labor between farm and nonfarm employment and in the inter-national migration of farm labor
Because of the complexity of technical conditions such as the overlapping of sea-sons and institutional constraints such as area allotment and procurement supply elasticities are not readily available or easily estimated for Egyptian agriculture Econo-metric estimates of the supply response undertaken for this study were rejected because they were inconsistent on the ag-gregate sector level Modeling the price re-sponsiveness of yields seems to be even more difficult than modeling area response Technical changes in farm production have been dramatic during the last two decades Cuddihy was able to obtain statistically valid results with yield response models for the period 1950-75 but an attempt in this re-search to estimate crop- specific models for amorerecenttimeperiod 1960-80 failedto give plausible results for any of the four major Egyptian crops wheat rice maize and cotton which indicates that Cuddihys elasticity estimates are not valid for both periods42
This result is not surprising nor does it prove that yields do not respond to changes in Prices During the period 1950-75 par-ticularly in the second half of the period
developments affecting yields brought about major changes The construction of the Aswan High Dam which permitted secure perennial irrigation allowed rice and maize area to expand into reclaimed desert land where the yield potential is lower Water management problems and the rising water table reduced yields in some areas Losses of fertile old lands to settlement offset reclamation of new lands leading to a reshyduction in average yields At the same time increasing supplies of fertilizer and pesticide helped to balance some of these effects Finally changes in the availability of inputs and resources such as labor and fertilizer changed cropping patterns and intensities
In sum there is no simple way to assess acreage and yield response to price changes in Egypt in the short or medium run The agricultural data available do not permit a satisfactory econometric analysis incorporatshying 1I the factors mentioned above Moreshyover constraints on resources such as land and irrigation water aid shifts in the quality of resources such as soils cannot easily be taken into account In principle this problem could have been solved with a simultaneously estimated system43 But because changes in prices in the past were modest the paramshyeter estimates would have been overstrained if used to analyze fundamental price policy changes as is intended here The effects a major change in the pricing system would have on allocation can hardly be derived from an econometric model that relies for information about the actual system on past data alone
I see Cuddihy Agricultural Price Management inEgypt Bent Hansen and Karim Nashashibi Foreign Trade Regimes and Economic Development Egypt(New York National Bureau of Economic Research 1975) Hadi Esfahani and Alexander H Sarris Agricultural Supply Response for the Main Crops in Egypt tconomics Working Paper 35 Ag aliltural Deshyvelopment Systems Project Ministry of Agriculture Cairo and the University of California-Berkeley Cairo August 1981 and Joachim von Braun Agricultural Sector Analysis and Food Supply in Egypt Interim Report of the Joint Project of the Institute of Agricultural Economics University of Gttingen and the Institute of National Planning Cairo February 1980 (mimeographed) 42 Cuddihy Agricultural Price Management in Egypt pp 32-41 43 Hansen and Nashashibi chose such an approach in their analysis for the 1960s See Hansen and Nashashibi Foreign Trade Regimes and Economic Development Egypt
29
Thus a programming model for agricul-ture is used to derive supply elasticities for specific products Despite the well-known shortcomings of such models they allow the relevant constraints to be incorporated more explicitly and policy instruments to be handled more flexibly The responses of yield arid area to prices are in fact artificial co titualizations of production decisions that are actually made simultaneously In that sense a programming mode is closer to reality The model analysis not only provides the required supply- response parameters for further analysis but it gives additional in-formation on the complex linkages within the sector
Features of a Sector Model
rhe objective function of the model is to allocate resources in order to maximize farm income44 All prices are calculated at the farm gate Resources are allocated ac-cording to the comparative advantages of alternative production activities at prices actually perceived by the producers Price averages foi the year 197980 are used Demand is fixed for that year hence trade is a residual determined by domestic producshytion and consumption This seems to be a realistic specification given the government planning procedure for trade which starts by defining food needs and calculates im-port demand and export supply considering
45 supply from domestic sources This method of trade planning may also explain the low responsiveness of food imports to inter-national price fluctuations46
The model is of a static linear program-ming type It incorporates 18 field crops and 5 animal products Activities for each prod-uct usually consist of production marketing and either importation or exportation For major field crops fertilizer-yield functions are approximated Other major activities are
the provision of inputs including draft animals tractors fertilizers water and labor Water is endogenously distributv-d throughshyout the year according to the monthly reshyquirements resulting from the particular cropping pattern and constrained by the annual supplies from the High Dam Labor is separated into a fixed family labor supply and a variable supply of hired labor
The restrictions of the model include resource capacities differentiated by seasons or months balances for variable factors such as feed and fertilizers and crop rotation stipulations Subsistence demand which is fixed is defined as consumption on a farm of its own produce Trade restrictions account for constraints on the capacity of marketing institutions to successfully manage the quanshytities of products required For example the export traders thathandle fruits and vegetables must be able to store them properly and to ship them promptly to avoid rotting Aconshystraint equal to their processing capacities is also placed on sugar processing The govshyernments intervention in area allocation and the enforced quotas are incorporated where applicable The model includes 182 rows of 137 activities in its basic version An extensive presentation of the entire model will not be furnished in this report4 7
Production Structures under Different Price Regimes
The model analyzes the production efshyfects of the different price regimes It is a comparative static analysis Changes in Egypts agriculture that might result from changes in export marketing and from geshynetic and technical innovations are not exshyplored Insofar as price policy induces such changes sectoral growth effects may be underestimated 4
The different price regimes are presented
4 The structure of the model is presented in von Braun and de Haen Egypt and the EEC- p 52 41 See Aiderman von Braun and Sala Egypts Food Subsidy and Rationing System pp 36-41 46 Scobie Government Policy and Food Imports
47 The model is an updated and inodified version of a model developed in a joint project of the Institute of Agricultural
Economics University of Gbttingen and the Institute of National Planning Cairo Shawky Imam of the University of
Zagazig contributed significantly to an earlier version of the model Adocumentation of the current model is availshy
able from the authors See von Braun Agricultural Sector Analysis and Food Supply
48See for example the agricultural export production data in von Braun and de Haen Egypt and the Enlargement of
the EEC p 53
30
in five scenarios Scenario 1 represents production and allocation in the present system taking into consideration area allot-ment delivery regulations current product prices and input prices By comparing the actual structure of production and factor allocation this scenario helps to explain the discrepancies between the model and reality (see Table 8) The discrepancies that arise are not always negligible but to con-strain them would reduce the flexibility of the model
Scenarios 2 and 3 give some insights into the partial production effects of de-pressed cereal prices Wheat prices are increased to their border price equivalents in scenario 2 the same is done for rice in scenario3 Everything else stays the same as in scena I Scenarios 2 and 3 yield hypo-thetical suipply elasticities for the two crops The implicit price elasticity of supply for wheat calculated from scenarios 1 and 2 is 026 and the one for rice calculated from scenarios I and 3 is 059 This lies within the range of elasticities estimated econo-metrically by others for locations with similar agrarian structures and perennial irrigation49
Under the rigid ares allotment assumption for cotton no cross effects may appear but price increases for rice and wheat reduce maize and berseem production This is the result of increased cropping intensity and of changes in area allocation
Aresult of scenario 3 that is not immedishyately obvious is the increase in wheat proshyduction that follows an increase in rice prices (see Table 8) Rice production would increase mainly at the e-p1 ense of maize the other summer grain Maize provides fodder in the fall It is possible that only some of the roughage needed would be provided by imported maize concentrates Therefore whedt straw would be used as a supplemental fodder The shadow prices of feed rise as a result (see the starch figures in Table 9) Wheat area is expanded but the intensity of input use on wheat is reduced because the by-product wheat straw which is now of major importance is not as responsive to fertilizer as the wheat grain itself The role wheat straw plays in the decision to grow wheat is stressed by this scenario where fodder is less available as a result of the decrease in maize
Table 8- Effects of alternative agricultural pricing policies and government intershyventions on production 197980
Scenario 1 2 3 4 5
Current Increased Increased No Quotas International System Wheat Rice or Area Prices for
Actual Pricea Price Restric- All Inputs Commodity Unit 197980 tions and Outputs
Wheat 1000 metric tons 1826 1560 2019 2016 1775 889
Beans and lentils 1000 metric tons 237 283 283 283 228 393
Maize and sorghum 1000 metric tons 3628 3093 3093 2267 3245 2374
Rice (paddy) 1000 metric tons 2448 2299 2531 3796 2298 3318
Cotton (lint) 1000 metric tons 498 485 485 485 485 536
Beef 1000 metric tons 337 272 278 284 269 246
Sources The actual figures for 197980 are from the Egyptian Ministry of Agriculture The remaining figures are the results of computations made using the linear programming model of agriculture
This price is increased to the international equivalent
49 See Hossein Askari and John T Cummings Agricultural Supply Response A Survey ofthe Econometric Evidence (New York Praeger Publishers 1976)
31
In scenario 3 the expansion of rice area leads to water scarcity Water gets a shadow price which it does not in scenario 1 (see Table 9) This too favors wheat production as wheat requires about 30 percent less water than berseem its major seasonal competitor
Scenario 4 demonstrates the implica-tions of direct government intervention in area allotment and marketing of food com- modities It is assumed that the area allot-ment for all crops but cotton is no longer enforced and no quota is required Former quota prices are raised to equal domestic open market prices This leads to increases in the production of wheat and maize and decreases in the production of pulses (beans and lentils) Rice area formerly enforccd by area allotment declines but increases in intensity Its production is almost unaffected
Most of the abandoned rice area is taken over by maize
Finally scenario 5 uses international prices for all inputs and outputs None of the crops are prcured or their area restricted by the government Under these conditions production of maize wheat and beef drops considerably When the livestock market is no longer protected production of the fodder crops wheat and maize also declines
On the other hand cotton and rice producshytion increase greatly Feed requirements are balanced with increased berseem producshytion and maize impcrts Under the circumshystances the supply of draft power from the domestic buffalo and cattle herd becomes more scarce which is indicated by an increased shadow price for horsepower and decreased shadow price for feed (Table 9) Gains from mechanization would be much higher under such conditions than under current conditions Moreover the shadow prices for land would decrease because the area sown with highly profitable crops would no longer be constrained by area allotments for low- price commodities The water shadow price implies that under an international price regime and without area allocation a water-pricing system would have to be inshytroduced This implication cannot be invesshytigated in this study but it indicates the need to tackle water management problems under a more market-oriented system 50
The water issue and the complex intershyactions of crop and livestock production illuminate the need for consistent sector modeling The modeling exercise stresses that when agriculture is constrained by tight land resources the frequently stated asshysumption that supply elasticities are greater
Table 9- Effects of alternative agricultural pricing policies and government intershy
ventions on shadow prices 197980
Shadow Prices
Land winter season Land summer season Water
Starch Horsepower
Unit
LEfeddan LEfeddanLE1000
cubic meters LEmetric ton LEhorsepower
Scenario
I 2 3 4 5 Current System
Increased Wheat
Increased Rice
No Quotas or Area
International Prices for
Price Price Restric-tions
All Inputs and Outputs
176 179 143 176 115 110 112 55 110 69
18 8 144 146 165 144 142 70 72 94 70 171
Sources These are the results of computations made using the linear programming model of agriculture 8This price is increased to the international equivalent
so Amore disaggiegateu modeling exercise that focuses particularly on the water issue isprovided by Gary PKutcher The Agro- Economic Model Master Plan for Water Resources Development and Use Technical Report 16 Cairo May 1980 (mimeographed)
32
than zero may not be realistic if all input and cropping pattern Hence changes in prices output prices vary simultaneously5 Reduc- and price ratios for the basic food crops and tions in supply are then possible as cross-price effects might overcompensate own-price effects even when prices as a whole rise This is particularly relevant for Egypt where land is scarce an-i the water supply is inflexible
One might argue that the total cultivated land base is also a function of agricultural prices Land reclamation might increase if prices do But this does not seem valid for a number of reasons Land reclamation is mainly undertaken by the public sector and exogenouslydecided 52 Neither the value of the crops to the economy at international prices nor the actual domestic prices appear to have affected the governments decision to expand crop land Moreover the new lands are exempt from any area allotment plan Farmers are free to choose their optima
cotton would not greatly affect returns from new lands which are mostly devoted to fruits vegetables and fodder crops
Addressing the other major concern of Egypts agricultural policy the decreasing self-sufficiency in major staples the effect of a shift to international prices would be neutral The decreases in the production of wheat and maize following such a change in price policy would be roughly offset by increased production of rice and pulses
Whether so rigorous a change as a shift to world market prices would be socially optimal depends upon how risk aversive Egypt is 53 An estimate of national risk aversion could be used to refine the assumpshytion that international prices represent the opportunity costs of production But no such estimate seems possible
51Lutz and Scandizzo for example use supply elasticities assumed to range fromOO toO65 for awelfare analysis of Egypts agricultural price policy on rice cotton and wheat The higher elasticities lead to inconsistent results for production effects of the price distortions assuming that elasticities being 0 is not plausible given the indications of strong response to economic incentives from regression models See Ernst Lutz and Pasquale L Scandizzo Price Distortions in Developing Countries A Bias against Agriculture European Review ofiAgriculturalEconomics 7(No I 1980) 5-27 52 Gotsch and Dyer Rhetoric and Reason in the Egyptian New Lands Debate pp 129-133
53 Sarris indicates that crops that are socially profitable when risk aversion is low (as it is for cash crops in Egypt)become less attractive when risk aversion is high and give way to subsistence crops This reasoning while valid is not taken into account here See Alexdnder H Sarris Food Security and Agricultural Production Strategies Under Risk in Egypt Working Paper249 Division of Agricultural Sciences University of California Berkeley March 1983 (mimeographed)
33
5 HOW FOOD SUBSIDIES AFFECT PUBLIC SPENDING ON AGRICULTURE
Since 1973 food subsidies which were negligible in the 1960s have accounted for 7 to 15 percent of total public expenditures The additional drain on the budget in the 1970s had repercussions on other expendi-tures as they were not entirely financed by increased revenues or deficit spending In analyzing the budget rcallocation effects of food subsidies the governments fiscal pol-icy toward agriculture will be examined
Problems in Analyzing Government Behavior
Unfortunately most theories on how governments allocate funds are largely un-related to each other they seem to have only limited applicability to analyses of government behavior in systems with less
informalized democratic structures and developing economies54
Attempts to study systematic patterns of government behavior for Egypt are aggravated by its recent history The situation in the Middle East the wars during the 1960s and early 1970s the basic change in political-economic strategy in the 1970s and the frequent reshuffling of institutions such as the parliament (Peoples Assembly) minshyistries and political parties are indications of that
Because of tnese problems this analysis is restricted to a descriptive approach It may be looked at as an attempt to better un-derstand the governments fiscal policy behavior Some of the hypotheses underlying earlier models will be taken into considerashytion But it is clear that any attempt to estimate these hypotheses empirically will encounter many difficulties
Shifts in Patterns of Public Expenditures
Before an explanatory model of public spending on agriculture can be devised basic changes in the size and structure of public spending must be examined The actual decisionmaking process its adminshyistrative setup and political- economic deshyterminants will be addressed later
The following budget equation which distinguishes between nonagricultural agrishycultural and food subsidy spending holds for a given year (t)
Rt + Dt = Nt + At + Ft (1)
where
R =government revenues D =the budget deficit N= rnonagricultural expenditures (excludshy
ing food subsidies)
A = public expenditures for agriculture F = food subsidies and t = the index for the fiscal year
The additional financial resources spent on food subsidies must be subtracted from means spent for nonagricultural or agriculshytural purposes financed out of increased revenues or financed through deficit spendshying Thus
AFt t_ = ARtt + ADt1t_I
-ANt 1t 1 -AAt (2)
5 For areview of models tried see Anthony BAtkinson and Joseph EStiglitz Lectures on Public Economics( New York McGraw-Hill Book Co 1980) pp 294-330
34
To begin with some indications of gov-emiments behavior in the frame defined by equation (2) may be derived from i graphic analysis Figures 4 and 5 show the dramatic changes in the size and structure of public expenditures that have 2ccurred since 1972 These changes complicate any analysis of the effects of rising food subsidy bills as ether budget components also fluctuated considerably During the period 1973-80 at the same time that food subsidies rose there was rapid growth (in real terms) of all major budget components Revenues rose mainly as a result of increased oil exports Public-sector investments did not keep pace with these growth rates The governments current expenditures increased dramatically as a result of a growing public-sector work force In part this expansion of the work force could be considered as an employment program Military expenditures and losses in public-sector industries were also costly The overall deficit increased sharply to more than 50 percent of the total budget in 1975 but has shrunk steadily since then
The agricultural budget which had been steadily declining since the mid- 1960s has grown in real terms since 1974 (see Figures 6 ind7) Therise in public expenditures in the aid-1970sreflectstheendofthewarburden and a reshuffling of the economy toward a more open and privately oriented system GDP in real terms grew twice as fast during the period 1972-80 than during 1965-72(73 percent versus 37 percent) The relationship between growth of GDP and public expendishyture growth shows that Egypt is not an ex-ception to Wagners aw of rising public expenditures in the growth process5 5 The expenditure elasticity of GDP rose to 18 during 1972-80 whereas it was unity for 1965-72 (see Table 10)
Agriculture was treated differently in the two time periods Considering the impor-tance to the economy of the employment and national income generated by agricul-ture public investment in agriculture was low during the first period Nevertheless public investment contributed the major share of total investment in the sector The
negative expenditure elasticity of GDP(-079) for the sector during 1965-72 indicates that it was neglected Investment in agriculture was cut back even more than total spending during this time Although it rose remarkably in the 1970s the shares of total public expenditure on agriculture and agricultural investment did not again become as large as they were in the mid- 1960s (see Table 10) However the growth of spending on agriculshyture was higher than the growth of total public expenditures
Of course negative expenditure elasticishyties for agriculture before subsidies became so prevalent (1965-72) and high positive ones during the time of extensive subsidyspending do not necessarily indicate a causal relationship between food subsidies and public expenditures on agriculture Still it is worth considering that gross fiscal support of agriculture was growing rapidly at the same time that agricultures importance to the economy in the share of GDP and emshyployrr nt was shrinking (see Table i) Thus the idea that agriculture was sulering from absnhlte reductions in public spending when food subsidies were rising does not seem to be supported Amajor reason for the support of agriculture may have been the dramatic decrease in self-sufficiency in basic food items during the 1970s which was a matter of concern to those who formulate Egyptian food policy
Changing Structures of the AAgcultural Budget
Figures 6 and7 show that the agricultural budget has undergone far-reaching structural changes Input subsidies mainly for fertilshyizer and pesticides became a major comshyponent of the budget in the 1970s whereas these commodities were slightly taxed in the 1960s Other current expenditures were stable in real terms but their share decreased because expenditures on investment and input subsidies grew In order to analyze
Wagners underlying hypothesis isthat pressure for social considerations inthe growth process san additional driving force for increased public spending This seems to be valid 1jr Egypt as well The extend_d sucial spending among which food subsidies are amajor element iswidely see as anecessary social networ in aperiod of rapidgrowth and structural change See Richard AMusgrave and reggy BMusgrave PublicFinanc inTeoiy and Practice (Tokyo McGraw-Hill Kogakusha 1973) p 116 andAiderman von Braun and Saki ERyptsFcodSubsidyandRation-Ing System pp 13-18
35
Figure 4-Deficits and revenues in public expenditure 1965-80 1975 LE Million
5000-
Total expenditures
4000shy
3000shy
2000 shy
1951970 1975 1980
Sources Calculations based on data from the Egyptian Ministries of Economy and Finance
Figure 5D-Structure of public expenditure 196580 1975 LE Million
5000
expenditure Food subsidies1Toni 4000
3000shycurrent expenditure
uInvestment
19801965 1970 1975
Sources Calculations based on data from the Egyptian Ministries of Economy and Finance
36
Figure 6-Government expenditures on agriculture 1965-80
1975 LE Million
Total government expenditures
300 on agriculture 1 Iogricultura
input 2 subsilies
2 Curent -- - agricul-tu ral-
- experndures
100- _ Agricultural investment
1975 19801995 1170 Sources Calculations based on data from the Egyptian Ministries of Economy and Finance
Figure 7--Share of agricultural investment current expenditures and input subshysidies in total government expenditures 1965-80
Percent of Total Budget 12
Agricultural
Total government input 8 agricultural expenditure on subsidies
exe iueagriculture
4shy-
investment Agricultural -
1965 1970 1975 1980
Sources Calculations based on ua from the Egyptian Ministries of Economy and Finance Note Agricultural input subsidies showed small profitsduring 1965-71
37
Table 10-Relationship between increases in public spending on agriculture GDP and total expenditures 1965-72 and 1972-80
Agricultural Total Agricultural Investment
Expenditure Expendltur Expenditure Elasticity ElasticiR Elasticity of GDPc of GDP of GDOPeriod
-079 -177 197 215
1965-72 101 1972-80 182
AgriculturalExpenditure
Elasticity of Total PublicExpenditured
-07R IOt)
Sources These are the results of computations using data from the Egyptian Ministry of Planning The GDP figures from before 1977 were taken from World Bank statistics the GDP figures for 1977-80 were taken from
unpublished statistics of the Egyptian Ministry of Economy obtained in 1982
This Is the ratio of the percentage increase in public expenditure to the percentage increase in the GDP Note that
the expenditure elasticities of the GNP are slightly lower for the 1972-80 period as the net factor incomes from workers remittances caused GNP to increase faster than GDP b This is the ratio of the percentage increase in public expenditures on agriculture to the percentage increase in GDP
GDPI This is the ratio of the percentage increase in agricultural investment expenditures to the percentage increase itn
d This is the ratio of he percentage increase in public expenditures on agriculture to the percentage iicrt e in total
public expenditures
these changes and their relation to spending on food subsidies within the budget frame-work equation (1) is decomposed
R+ D= NC + Nl + AC+ Al + AS + F1 (3)
whel
current expendituresNC = nonagricultural= xcagfotordlcubsiies)ntr(excliding food subsidies)
NI = nonagricultural investment
AC = agricultural current expenditures (ex-cluding agricultural input subsidies)
Al = agricultural investment and
AS = agricultural input subsidies
The correlation coefficients of the shares of the components in total expenditures are shown in Table 11 It is widely assumed that food subsidies are positively corelated with the budget deficit however the correlation (051) turns out to be not very high The negative correlation food subsidies have with public investment in agriculture on the one hand and the positive correlation they have with nonagriculttral investment on the other are striking This seems to con-tradict the general impression derived from the expenditure elasticities and the earlier
graphic analysis But the discrete comparison of two time periods does not take into account dynamic adjustments in the budget realloshycation process In fact the share of food subsidies was at its height in 1974 when agricultural investment was lowest both in real terms and as measured against total public expenditures Though it shrank rapidly
in the second half of the 1960s and the early 1970s in absolute terms agricultural inshyvestment commanded a much higher share
of the total budget than when food subsidies
were rising This explains the fairly high negative correlation (--074) estimated for
the entire 1965-80 period Nonagricultural investment however continued to grow but at the cost of other budget components
and a growing deficit While the traditional components of the
agricultural budget- investment and curshyrent expenditures- decreased the new oneshyinput subsidies- increased as did food subsidies Thus there appears to be a high positive correlation between the two subshysidlies Clearly when import prices rose and uncontrolled domestic prices were inflated the government attempted to stabilize both consumer prices and input prices But although correlation analysis provides inshyformation on the statistical relations between variables one must refrain from interpreting coefficients in causal relation3hips
38
Table 1I1-Correlation coefficients of shares of budget components with special focus on the agricultural budget 1965-80
Budget Nonagricultural Agricultural Food Subsidies Component NC NI AC Al AS F
D -O54 OS7 -075 076 049 OSI NC -093 074 066 072 -089 NI -066 -069 059 071 AC 073 -084 -085 Al -067 -074 AS 086
Notes D stands for the budget deficit NC Is nonagricultural current expenditures excluding food subsidies and NI is nonagricultural investment AC is current agricultural expenditures excluding agricultural inputsubsidies Al stands for agricultural investment AS agricultural input subsidies and F food sJl)sidies Ccr relation coefficients for revenues are not lited as they are the same as for Dbut with opposite signs
The Role of Food Subsidies in current expenditures deficits and invest-Budgetary Decisionmaking ments Government- cop-rolled consumerprices and rations are unsidered to be
inflexible in this system partly as a result The natlunal budget in Egypt is created of the consumer protests that occurred in
by a complex procedure carried out by the the 1970s after attempts to alter consumer established political institutions influenced pricing58
by major political interest groups 5 6 Tech- The agricultural budget currently involves nically the budget is drafted by the Ministry three separate ministries the Ministry of of Finance in coordination with the ministries Agriculture and Food Security the Ministry concerned It is then discussed and modified of Irrigation and the Sudan and the Ministry in committees of the Peoples Assembly and of Reconstruction and Land Reclamation the Cabinet and delivered to the president Their inestment budgets are handled mainly who presents it to the Peoples Assembly for by state-owned companies authorities for final approval specific programs or crops and regional
The political decisionmaking on the agencies Because the ministries themselves national budget starts with an estimation of act only as consultants in setting agricultural expected revenues and a limit set for the price policy their ability to generaterevenues deficit A ubsidy allocations are given a for agriculture is limited S9 high priority5 7 other budget components The budget shares of preceding years are are adjusted to them The actual food subsidy considered in decisionmaking by the cabinet bill is deternined mainly by fluctuations in Consequently the allocations for adminshyinternational trade and the predetermined istration and investment of the three minisshyquantities to be channeled into the distribu- tries handling agricultural affairs are fairly tion sstem Additional adjustments might stable60 A large share of budget expendishybe made if the international prices assumed tures such as administrative costs is preshydiffer 1om the real ones Because revenues determined The general size of the budget are fixed in the short run short-term ad- is a matter of political priority and changing justments to subsidies are made in other it is not an issue in the short term
The authors are indebted to Ismail Badawy of the Ministry of Economy Saad Barghout of the Ministry of Economy and the Ministry of Planning and Yahya Mohie el- Din of the Ministry of Agriculture for clarification of this issue S7See for example Egyptian Gazette June 14 1980 pp 1-2 see Alderman von araun and Sakr Egypts Food Subsidy and Rationing System pp 59-61
s See Habashy Fitch and Rehiwi Egypts Agricultural Cropping Pattern 60 The permanent budget hypothesis is discussed in 0 A Davis M A H Dempster and A Wildavsky A Theory of the Budgetary Process American PoliticalScience Review 60 (September 1966) 529-547
39
The long-term reduction of agricultural attempts to keep consumer prices down But investment in the 1960s and 1970s was efforts to reduce the deficit require adjustshyapparently based on the assumption that ment somewhere in the budget which could marginal capital productivity would be affect spending on agrizulture smaller in agriculture than in other sectors These statements can be transformed Agriculture grew less than expected follow- into hypotheses that can be tested in a reshying the construction of the Aswan High gression model One such hypothesis is vhat Dam Discouraging results from capital- the ministerial bureaucracies attempt to intensive efforts in new land reclamation defend their shares of the total budget may have contributed to this too Moreover Another is that adjustments in the budget contraction and expansion of the agricultural structure and thus in agriculture are enshybudget are mainly determined by invest- forced by exogenously fluctuating and preshyinent which suffered from a change in atti- determined components such as food subshytude toward investment in reclaiming new sidies and other current expenditures of land Land reclamation accounted for about high priority And a third is that the growth 80 percent of the agricultural investment of the budget deficit measured as a share of budget between 196566 and 197 172 but it the total budget induces cutbacks on exshywas reduced to 51 percent by 19798061 penditures perhaps in agriculture Improvement of old land already under cul- For a regression model qtructurala tivation--through drainage projects for equation is written with the hypothetical example-and investment in research and igns of parameters defined as development on animal production and specific crops wuook over an important share 0= - t-1+ Pa- P2 ft of the budget (see Figure 8)
The government provides an employ- -P 3ct- 1 - 4 dt I+ (4) ment guarantee for university graduates where This adds an item to the budget that like food subsidies is exogenous to it Increased a = the share of the agricultural budget in enrollment and population growth of those the total budget in year t= ([AC + AIJ in the relevant age groups is causing the [Rt+ DtJ) - 100 number of graduates to grow rapidly This has increased the wage bill of the public fl-= the change of the share of food subshysector The 1980 budget provided for 148400 sidies in the total budget from the
= (Ft[R + DtJnew jobs in government mostly for grad- previous year to year t uates62 These new jobs represent an increase - F1t 1 [R1t 1 + DI]1 1 ) 100 of about 8 percent of total government CtJt_ the change of the share of nonagrishyemployees The government actually took
=
cultural current expenditures in the steps to abrogate the employment guarantee total budget from the previous year in 1979 but the policy was reversed in 1980 to year t (that is total current expen-Redundancy seems unavoidable at such ditures less all subsidies) defined growth rates But social and political objec- as equivalent to f- tives similar to those for consumer subsidies
dt-=the change of the share of the overallkeep this policy in action The deficit in the national budget is a deficit in the total budget from the
asprevious year to year tdefinedmatter of continuous concern to the Egyptian equivalent to ft-government 63 The inflationary implications and
of this deficit counteract the governments Et error term
I Direct investment for the Iligh gricultural project is not included inDam which is not considered primarily an
the comparison Figure 8 shows it for illustrative purposes Its inclusion would indicate an even more rapid shift away from new land reclamation policy
61International Labour OrganisationUnited Nations Development Programme Employment Opportunities and Equity in aChanging Economy Egypt in the 1980s draft report of the ILOUNDP Emploment Strategy Mission 1980 (mimeographed) 61See for example Egypt Economic Conference Document on Statement of Minister of Economy Cairo February
13-15 1982 (In Arabic)
40
Figure 8-Public investment in agriculture 1965-80 1975 LE Million
170
160
150
140
130
120
Total public110 investment in
agriculture
100-
90
80
70-
70 New land Improvement60 reclamation of old land
and related 50 investment I
xX 40 Other
4 0 - Aswan bull s agriculturalinvestment
30 High Dam investmen
20
l I I I I I
1965 1970 1975 1980
Sources Calculations based on data from the Egyptian Ministries of Economy and Finance Notes Atentative grouping of total public investment in agriculture isonly possible because some of the titles
cover several activities in different fields Investment in the Aswan High Dam isnot Included in total public investment in agriculture
41
The ordinary least square estimation results show that all parameters have the expected sign and are statistically signifi-cant at the 95 percent level6
a = 01053 + 09523 at- -01445 ft 1 (1487) (-185)
-00919 ctt_1 -05 3 5 dtt-1 (-214) (-347) (5)
ft2 - 0958 DW = 296
The share of the agricultural budget in the total budget decreased when the changes of the share of food subsidies other current expenditures and the deficit were rising Though its share in the total budget is small
agriculture was a residual recipient of public funds Other sectors such as housing also tended to be residual recipients The overall effect of food subsidies was not overwhelmshying I ut they were important in reducing spending on agriculture in some years such as 197374 (see Figure 9) The parametc rs estimated indicate that a 10 percent increase in the share of food subsidies in total expenditures would reduce agricultureb share by 14 percent If there were a similar change in nonsubsidy c irrent expenditures or if the deficit changed by 10 percent the effect on public spending on agriculture would be smaller (09 or 05 percent) Still as the fluctuations of deficit and nonsubsidy current expenditures were much higher than those of food subsidies their effects on the agricultural budget were greater than those of food subsidies
64 The Durbin-Watson statistic indicates that the parameters estimated may not be free from distortions because of autocorrelation of residuals But intercorrelatIons betweenft -i ct -and d t-I are so smallffc--056 fd-O18 cd--004) that they do not cause distortions from that side
42
Figure 9-Actual development and a model estimate of government expenditures on agriculture and the role of food subsidies 1966-80
Percent of Total Government Expenditures
11shy
Actual share of agricultural budget
10 -i
9
8
7 -bull
6-Estimated share of agricultural budget
-- I
4--
Not 3-
Estimated effect of change
2 in the share of food subsidies on the agricultural budget
1966 1970 675980
Sources Calculations based on data from the Egyptian Ministries of Ecoromy and Finance Notes The change in the share of food subsidies in the agricultural budget was calculated from equation (4) It is
the estimated parameter P2 multiplied by observed values of flt-1
43
6 CONSEQUENCES OF GOVERNMENT INTERVENTION IN AGRICULTURE
In this chapter the effects of price and market intervention policies on agricultural income on nroducer and consumer welfare and on the Ijvernment budget are analyzed This market analysis by commodity provides the groundwork for a final policy evaluation based on an assessment of the burden on agriculture
All major agricultural commodities listed below are included in the market analysis65
Percent of Cropped Area
Commodity 197980
Wheat and wheat products 125
Rice 93 Maize 168 Beans 26 Lentils 02 Sugar 22 Cotton 107 Beef Milk and milk products
Feed 48
Sorghum barley 48 Concentrates
InputsFertilizerPesticides
About 84 percent of the agricultural area is covered by these crops The share of these major commodities in household expendi-tures on food is about 73 percent6T
Apartial equilibrium model of the market for each of these commodities is constructed The model incorporates the major instrushyments of food and agricultural policies affecting it which include government proshycurement policies government import and export policies government food distribution schemes dual pricing on both the producer and consumer sides of the market input subsidies for the field crops and subsidized feed distribution to livestock producers
Theoretical Basis for Evaluating the Effects of Price Distortions
Gains and losses from price distortions are derived using a comparative static comshyputation of economic surplus for major agrishycultural commodities The procedure is well known and its merits and its shortcomings have been frequently discussed 67 However a few clarifications are necessary for this study
To know what gains and losses are proshyduced by the price distortions and governshyment interventions induced by subsidiesrequires knowledge of the prices (and proshyduction technology) that would prevail in a hypothetical situation with or without reshyduced food subsidies If food subsidies were the only reason for interventions in the
agricultural markets one would expect that without subsidies there would be free trade with world market prices also serving as domestic prices to producers and consumers But government interventions have other
6 These percentages are calculated from unpublished data provided by the Ministry of Agriculture Institute of Agricultural Economics Research and Statistics Cairo 1982 66 In 197475 houshold expenditures on wheat rice maize beans lentils sugar meat and milk and milk products accounted for 76 percent of the average total expenditure on food in rural households and 68 percent in urban ones (Egypt Central Agency for Public Mobilization and Statistics Family Budget Survy 197475 [Cairo CAPMAS 19781) 67 See J MCurrie JAMurphy and ASchmitz The Concept of Economic Surplus and its Use InEconomic Analysis EconomicJoumal I81(December 1971) 741-799 and JLesourne CostBenefitAnalyssandEconomic Theory (Amsterdam and Oxford Elsevier-North Holland 1975)
44
purposes as well For example the prices of export crops are taxed in order to increase government income and some livestock products are protected in order to stimulate domestic production As long as policy goals other than keeping food prices low exist one cannot assume that a removal of food subsidies wculd rcsult in free trade prices Prices would lie somewhere between current and world market prices Without an explanatory model of agricultural policy decisions it is impossible to separate ob-served price distortions according to the policy goals and instruments behind them
Despite this world market prices are used as a basis for computing the sum of all policy- induced distortions There are several reasons why this seems acceptable First the assurance of low-cost food supplies managed through import subsidies is clearly the dominant goal of agricultural policies in Egypt Imports apart from food aid dis-tributed domestically at subsidized prices are paid for at international prices and thus represent the opportunity cost Second even those interventions in agriculture that are motivated by taxation objectives may stem indirectly from food subsidies insofar as subsidies are a prominent reason for the persistent budget deficit in Egypt Moreover distortions induced by policy provide abasis for an analysis in which the objectives of policy are formulated as exogenous deter-minants of the development of the distorshytions (see Chapter 7)
Price distortions in the following analysis are defined as the divergence between the price of a good at the farm gate (producer price distortions) or at the Cairo retail market (consumer price distortions) and the cor-responding international price International prices are evaluated at the shadow exchange rate and adjusted for transportation costs and state of processing The price wedge resulting frorm the comparison for producers is corrected further to include the input subsidies for each unit of output (see Chap-ter 3)
The computations of the effects of price distortions in major commodity markets on welfare and the budget during the period
1965-80 were made using the following equations Where relevant a distinction is made between controlled and free markets68
The net social loss in production (NSLp) is
NSLp=I2(0w-Q)(P w- p)=2t tl V (5)P (
where
Q = production at domestic prices
Qw = production at world prices Pw = border price equivalent at the shadow
exchange rate Po = producer price on the uncontrolled PP open market
tp tc = proportion of tariff in the domestic producer or consumer price on the open market ([P - Pp]Pp or [P -PC)PC)
1s 1d = supply and demand multipliers measured as the relative change of quantities of a commodity in reshysponse to changes of its own price after a shift of all prices to free trade prices and
o V = value of production at P
The net social loss in consumption (NSLc) is
NSc= 2(C -C) (PCO-P)= 2 t dR (6) where
PO = consumer price on the uncontrolled open market
C = consumption at domestic prices
C = consumption at world prices and deg R = value of consumption at PC
The welfare gain of producers (Gp) is
Gp= Qf(P +s- Pw) +
(Q- Q) (Pp + s - Pw) - NSLp (7)
68 The nomenclature and structure closely follow Bale and Lutz See Malcolm DBale and Ernst Lutz Price Distortions inAgriculture and their Effects An International Comparison AmericanJournalofAgriculturalEconomics63 (January1981) 8-22
45
where
Pf = fixed procurement price
(i = procurement of domestic supplies and
s = direct input subsidy per unit of output
The welfare gain of consumers (Gc) is
f ff 0eters Gc- C (Pw-Pfc)+(C-Cf)(Pw- Pc) - NSLc (8)
where
Pf = fixed consumer price and
Cf = consumption out ofgovernment suppliesat fixed prices
An increase in budget expenditures (TB) is TB = Oa (PI + s + kd - Pfc)
TB- Qf (P f+ sk - P W) - 0) (P + s + kd - P )
+M(PI +km - Pm) (9)
where
kd km= costs of processing marketing and transporting of either procured quantities or imports
Q1 = procured quantity sold to domestic
consumers (the rest s exported)
P = border price equivalent at the offi-Scial exchange ratecialexchngeateresponse
Pin = release price of the imported com-modity going either to consumers or to feed users and
M = imports
The computation of the net social losses of supply and demand is complicated by the hypothetical amounts produced and con-sumed at world prices which are supposed to result not only from a change of their own prices but from adjustments of all other prices as well Hence to assure consistent analysis the parameters 17 and tidin equa-tions (5)and (6) are not defined as the usual
price elasticities of supply and demand which hold true only if nothing but the own price of a respective commodity changes but as implicit multipliers of quantities relshyative to a change in the own price accomshypanying changes in other prices (P with j=1 n m) which set them equal to world market prices
Let Q be a linear supply function of comshymodity i with f3 representing the paramshy69 Thus
m Q +ZPu Pi (10)
The relative change of production Qresulting from changes in all prices can then
be written
in AQi=EI fIampAP (11)
Inserting this into equation (5) gives the
net social loss in production
m
NSLpi= 2 1FPi APjbull AP (12)
0where AP = Pwi - Po
Defining the multiplier as the relative
change of production per unit of a relative change oftothea simultaneousown price measuredchange ofasalla
prices one obtains70
I = (AQiAPi)(PiQi)
=iomnPijAP[(lAP)(PpIQi)] (13) I-I
Inserting equation( 13) into( 12) and rearrangshying the expression as indicated in the second term of equation (5)gives
NSLpi 12 si API (QiPpi) AP - 2 1si (APPpi)2 QPi or
(14) = i1t2 bull
69The procedure implies the usual assumption that the supply function isidentical to the marginal cost function Moreover it is assumed that the changes in coss prices indicate changes in opportunity costs 70 The definition implies that marginal costs vary linearly between the two levels of pruduction computed in the model scenario
46
Figure 10 shows the theoretical approach to measuring the welfare loss of producers when deliveries at fixed prices are forcedthe open market is residual and price dis-tortions exist for competing pioduction enterprises 71
Producers are forced to deliver a quan-tity QOof a certain agricultural commodity at a fixed price Pf An additional quantity Q- Q is supplieon the open market at an open market price Pa Both the fixed price and the open market price are below the world market price A partial switch of the producer price Pp to the world market pricewith all other producer prices remaining unadjusted would yield an elastic responsefrom H to M Yet if the prices of competing products are also raised the supply curve is likely to be shifted to the left and a dampened ploduction increase say from H to Lmayresult
Compared to this hypothetical free-trade situation the producers currently suffer a welfare loss (producers rent forgone in the production of commodity i) of DEGHLI This welfare loss is composed of a loss through forced deliveries DEJI a loss through dis-tortions on open markets GHKJ and a cal-culated loss through reduced production and misallocation HLK (which equals NSLp)
Elasticities for these computations were calculated in a partial equilibrium framework from the relative differences in production between scenario 5 of the programmingmodel (world prices no government inter-ventions) and scenario I (distorted prices area allotment prccurement and inputsubsidies) using the relative difference be-tween world market and domestic open market prices as a denominator
These model results provide implicitelasticities of the response of production to a simultaneous change of prices to their in-ternational equivaents ()72
Implicit Supply Commodities Elasticities
Wheat -038 Rice 028 Maize (and sorghum) -067 Beans 146 Lentils 033 Sugar 001 Cotton 007 Beef and milk 019 Nitrogen fertilizer -003
A coefficient of 01 is used for sugar in the consecutive analysis as an assumption for possible yield effects that are not incorporatedin the model for that crop The elasticities for beef and milk are a weighted average the weights being the shares in value of proshyduction
These elasticities are strictly valid onlyfor 197980 the base year of the linear proshygramming solution The difference between production in the two scenarios is typical of a long-run solution during the period of analysis 1965-80 Therefore the elasticities of supply for any year within this period are derived by dividing the relative deviation of the quantities computed by the linear proshygramming model by the nominal rate of taxation during the respective year
The demand parameters for the analysis are obtained from a complete demand sysshytem The model was estimated as a linear expenditure system based on a time series of cross- sections of household expenditure surveys for 195859 196465 and 197475 73
It distinguishes between three levels of household expenditure within the rural and urban population The own- price elasticities for the weighted average of several groups
74are listed in Appendix 2The approach chosen here combines the
results from a programming model of the
71 For simplification input subsidies are neglected in the graphic presentation 72 Note that these elasticities take ilAo account simultaneous shifts in production and intermediate use of other commodities (see equation 13)They are not equivalent to the common definition of elasticities that hold true under the condition that all other prices remain unchanged 73The data bases are taken from Egypt central Agency for Public Mobilization and Statistics Family Budget Survey195859 (Cairo CAPMAS 1961) CAPMAS Family Budget Survey 96465 (Cairo CAPMAS 1972) and CAPMAS FamilyBudget Survey 197475 74The system is described in detail in Joachim von Braun A Demand System for Egypt- Estimation Results andScenario Analysis for Alternative Food Price Policies Institute of Agricultural Economics University of GbttingenDecember 1981 (mimeographed)
47
Welfare losses of producers resulting from price distortions and pro-Figure 10-curement
Price P Marginai costs
with higher prices of substiLutes
P
AB Q Q QForced I Open market
deliveries - ]-------supply shy
sector with partial equilibrium models forindividual commodities It is an attempt to avoid inconsistencies of partial equilibrium
analyses on the one hand and the method-ological and statistical problems of dynamic muiticommodity sector models on the other This approach does not eliminate these
problems completely as dynamic adjustshyments are not endogenously taken care of but it provides for a more realistic and practical solution than either of the two approaches used alone
Grain Markets
The three major cereals produced in Egypt-wheat rice and maize-areaffected in different ways by agricultural policy and their maket structures do not have much In commo liThe producer prices of all three especially wheat and rice are kept below international prices As stated earlier the government procures rice andwheat but not
maize Although procurement for rice is
Marginal costs with current prices
I of substitutes
IE
C Quantity E bi Al)1 Mgnal
-response to----I free trade I
compulsory with aper feddan quota a sieshyilar regulation for wheat was almost phased out in 1977 (see Chapter3) Imports of wheat
and maize aredistributed atsubsidized prices but the former is channeled to consumers while the latter goes mainly to livestock producers
The Wheat Market
Inthe late 1970s Egypts domestic wheat production covered about25 percent of total consumption Procurement of dce domestic
crop dropped from an average of 20 percentof production in 1974-75 to 10 percent in
1978-80 after the enforcement of procureshyment was relaxed Domestic prices are depressed below
their international equivalents which places a burden on wheat producers This burden may be split into three different sources
G pp ccnrocurement r depression of the free marketprice(GP) and ineffciency in the alshylocation of resources for production which
is usually referred to as net social loss in proshy
48
duction (GPo) (see Figure 11) Note that the social loss in producticii may in fact be neg- ative in some years If all prices are raised toward international prices the supply curve of wheat would shift to the left as the sector model results indicate
Consumers gain from the subsidy on wheat flour and bread (Gcis) But they also gain from the reduction in open market prices net of the misallocation to consump-tion (Gcfe - GcJ Most of these gains which increase demand are covered by govern-ment subsidies on wheat imports or procured domestic wheat and part is indirectly fi-nanced by the wheat producers (GPrc Gfte)
Subsidized fixed consumer prices ranged from 28 to 58 percent of the international wheat price during the period 1965-80 (see Table 12) and were slightly higher than government procurement prices during the 1960s75 This means the governmentwas able to generate revenues from domestic pro-curement policy which was compulsory at that time During the 1970s the procurement prices usually exceedea the average fixed consumer price The uncontrolled price of wheat in rural markets fluctuated much more than the fixed procurement and con-sumer prices but always exceeded both of them The gap between fixed and open market prices was particularly high in years of political crises such as 1967 when the gap was 40 percent and 1973 when the gap was 38 percent Both years a war coincided with a major exogenous shock to the coun-trys wheat supply in 196667 the United States which had covered 35-50 percent of the countrys wheat imports during the early 1960s stopped giving food aid to Egypt for political reasons and in 197374 the inter-national food price crisis began Open market prices also far exceeded fixed prices in 1978 for several reasons Imports decreased in that year possibly because foreign ex-change was tight And consumer prices of maize were unusually high because of a shortage of feed concentrates This may
have contributed to the rise in wheat prices in rural areas which worsened the food situation of the poor7 6
Most open market wheat comes from domestic production Some is subsidized wheat flour from government distribution channels that is resold However as the share of open market wheat in the total wheat supply is falling rapidly fluctuations in the supply from the government distribushytion system will increase instability in this residual market During 1969-71 the average suppIV of wheat from domestic production left after procurement accounted for 31 pershycent of total consumption This dropped to 24 percent in the 1978-80 period Moreshyover only some of this entered the market because wheat is a major subsistence crop for the farm population77
The international wheat price used in the analysis is the reported value of a unit of wheat corrected for handling costs and for the overvaluation of the Egyptian pound (see Appendix 1 Table 32) For the calculation of the producer losses and consumer gains it should reflect the marginal import price However Egypt receives significant amounts of food aid and concessional imports In 1980 they accounted for about 30 percent of all wheat imported If the quantities and prices of commercial imports were functions of concessional imports and given that reshyexports of wheat are restricted under the regulations for food aid disposal of the Food Aid Convention the unit value would overshystate the opportunity cost of producing wheat in Egypt78
The marginal import price which matters in assessing the opportunity costs of wheat products in Egypt would only be affected by food aid donations if all commercial wheat exporters to Egypt were also food aid donors providing aid through a tight reshylationship to commercial sales A somewhat systematic pattern in the ratios between commercial imports and concessional imshy
5 The fixed consumer price is calculated here as a weighted average of subsidized bread and flour prices in wheat grain equivalents 76 See Alderman von Braun and Sakr Egypts Food Subsidy and Rationing System p 59 77 Estimations of marketed surplus based on data of household surveys yield ashare of21 percent oftotal consumption out of marketed domestic production for 1969-71 and 15 percent for 1978 -80 respectively (CAPMAS Family BudgetSurvey 197475) Constant per capita wheat consumption from own production is assumed for the farm population in this calculation 7a The Food Aid Convention is part of the International wheat Agreement of 1967 which was amended in 1981 (inshyternational Wheat Council InternationalWheat Agreement 1981 [London International Wheat Council nd])
49
Figure I 1-Average conditions in the wheat market 1976 -80
LEMetric Ton
80
P 9 I
70-G Q
6C P50
40shy
20-11 I I
1- I
t 1000 500 Metric1000 2000 3000 4000
QI Q Tons
Sources CdlcuIted troinddtd1 Ministries dl tilrincipal Balnkprovided I tieLglptihl of Agriculture dd Suppi for )evelopiment dl Agricultural Ilvestment
Notes Prices aredellied b til( (ohsunier price index (1975 = I00) Ij internationlal 1is the olpeniis tihe price
Ihiidket is te goerninienit prOctii(Iil price and ts is tie-fixed(lsuiner prie QII is domesticprice Pp production (totalQ is ginniveiiit pr(itfureieit of doiuiestic I)roductioii Qj is goertnlenit distrishy
hitiill(Q1 ( uIIUli and Q i implforts (- S is sippIiN 1)is dlmand) is totu il (1isprodceII(vrsIoss IrnngdeiIpressiongt ciIernniat Irocorfnl is the prtiiiu rs loss frcm of
I l ic)eiind I si iot prou tion (i is tIlisuiilers (ifll ft disshyreIirkel nt t l loss iti tii ir i h
tribtitiiii of iealt flourand breadIli insum ersgain alsil jItl s I (i and C ilthe igur)
(ahisIlie cOnfllilrs gail frimt w(1h d Ire itirkle pri s 1l(1I( is IiiS1illt ili)lfl in ( ollsliliullt ll For
further details see Appendil 2
ports from major donors indicates that such by Australia during the years when no US a con(ition may not he completely excludet food aid was availalhle anti the terms for U S
for some time periotls 1 aid (luring the first half of the 1960s differed Yet trade and aid statistics (donot show from those set during the second half of the
that food aid is permanently tight Food aid 1970s In recent years Egypt has relied increasshypolicies toward Egypt have changed as
Egypts political role in the Middle East has ingly less on short-term open tenders and changed rle terms for aid from the USSR more o- lonl- tern bilateral import agreeshy
in 196768 were (lifferent from those imposed ments to acquire wheat The actual price of
t 7 uoildiii liiih dtiil~iiiif I uhf Other (iiilltleS sth IsIltilt l iniiii aid (dlild(rOlitI (I(iIlllH) lmidl Auistrali increasetd
iiig the Ioliticalthese rotintrivs faitir grmi esporler to Igpt tollo frictiolS btveen the UniiedtStites dil [gN ptili1966 55hich ledto cdicellltion ofUS Iioidfid After fflfn(I contsiihtliilt Mlllti Iecamre
iIlows ron tiht Unrited
Stdtes were reestallisd ini 1973 thle i rdl d idb if niltries shiilttil cisf-r Iliir(ious See iodcthill vtnpl)l(rnus Brdun E-ffects ofFood Aol idi IiRe(iiient (ouiitris Lg t ialnd tlighidesh I Compaidrdtive SluIv iliOIionilcs A Iiiannua ollrtion of Re(ent Contributions tothe Ield of Economu Scinenol 26 Iihiogen Iiostitut [irGerman Wissenschdftliche Ziisninnanellfit 190I2) l11-47
50
Table 12- Relationship of wheat prices to international and open market prices1965-80
Share of International Price Open Market-
Procurement ProducerYear Price
1965 369 1966 434 1967 444 1968 504 1969 481 1970 501 1971 572 1972 583 1973 296 1974 290 1975 353 1976 394 1977 532 1978 498 1979 455 1980 415
Price
(percent of border price)
494 615 756 920 666 652 700 691 415 385 438 457 666 772 486 457
Fixed Consumer
Price
426 437 458 581 535 483 561 567 300 296 319 367 471 444 324 284
Share of Open Market Price Fixed
Procurement Consumer Price Price
(percent of open market price)
749 863 706 711 588 606 548 631 723 804 768 740 817 802 843 821 713 722 752 768 806 729 862 804 799 707 644 575 936 667 907 622
Sources These figures were computed from data provided in 1982 by the Egyptian Ministry of Agriculture theCentral Agency for Public Mobilization and Statistics and the Ministry of SupplyNote The border price is calculated from values of imports with marketing costs added and corrections made to account for the overvaluation of the currency (see Table 32)
wheat imports under long-term agreementsis less than the contracted values For ex-ample the current agreement with France and the United States requires repayment atinterejt rates significantly below market rates In fact the import price for Egypt(pint)is not a straight line as drawn for simplifica-tion in Figure 11but a step function Thelowest steps are represented by cost- freewheat donations such as those from the World Food Programme (WFP) and some European Community and US aid shipmentsThe next lowest steps would be the US PL 480 Title I concessional imports whichhave 40-60 percent of their cost subsidized if the long-term loans are discountedprevailing market rates Another step would
at
be formed by imports acquired under easyrepayment terns such as those providedunder agreements with Australia France or the United States and the highest stepwould be composed of actual commercial imports at current international prices
Using the unit values or marginal priceof imports does not impede the calculation of the welfare loss of producers but usingunit values to compute the fiscal costs of
wheat imports does require some explanashytion Whereas the short-term fiscal outlay may be exaggerated by using unit valueswhich do not take into account long-termrepayment schedules for imports acquiredwith soft loans the long-term effects on thebudget of soft- loan imports would be neshyglected if the actual installment paymentsfor them were used in the calculation Ideallythe actual installment payments for importsin the current year and all previous yearsshould enter the calculation of the fiscaleffects of wheat imports but the data aie not available in time series
The following results were obtained from the market analysis In 1980 wheat producershad an income loss of LE 134 million (GPin Appendix 2 Table 35) Although theincome losses of producers fluctuated conshysiderably during the 1960s and l910s beshycause international prices and domestic open market prices were unstable they do not show a trend in any direction Expressedin 1975 prices they shrank from the peaks of1974-78 but increased again in 1979 and1980 (see Table 13) Losses from procureshyment have been minor in recent years In
51
Table 13- Producer losses from price policies and procurement on the wheat rice and maize markets 1965-80
Wheat Rice Maize Wheat Rice and Maize Loss from Total Loss from Total Total Total Loss Per
Year Procurement Loss Procuremetit Loss Loss Loss Metric Ton
(1975 LE million) (1975 LE)
1965 158 582 806 1713 1125 3420 66 1966 145 486 767 1473 912 2871 52 1967 136 471 936 1806 614 2891 50 1968 123 259 1307 2430 757 3446 54 1969 65 333 1250 2533 868 3734 60 1970 89 435 633 1472 1042 2949 45 1971 102 369 416 984 532 1885 29 1972 79 323 365 909 611 1843 28 1973 277 1221 762 1995 1299 55 63 1974 400 1494 2485 7253 1592 1 ) 153 1975 312 1193 2617 6211 1329 3 121 1976 176 844 1228 2957 958 4759 65 1977 39 275 550 1261 130 1666 25 1978 41 254 657 1547 222 2023 27 1979 131 648 693 1438 727 2813 38 1980 67 722 653 1399 156 2277 31
Sources These figures were computed from data provided by the Egyptian Ministry of Supply the Central Agency for Public Mobilization and Statistics and the Principal Bank for Development and Agricultural Investment
Input subsidies (on fertilizer) are already deducted from total losses
1980 they amounted to about 10 percent of the total producer losses in the wheat market
Consumer gains from subsidized gov-emiment distribution and depressed open market prices have been growing consider-ably reaching LE 814 million in 1980 In real per capita terms they were almost twice as high in 1979-80 as they were in the mid- 1960s (Table 14) In 1980 farmers contributed 19 percent of the total income transfer to con-sumers in this market (Appendix 2 Table 35) This means that the implicit subsidy on wheat is about one-fourth of the explicit wheat subsidy that appears in the budget
The official budget figures for the wheat subsidy are available only for the years after 1970 According to estimates made for this study wheat subsidies were a significant drain on the government budget even in the mid-1960s (see Table 15)80 But compared with the subsidies of the 1970s their effect was small The model calculations roughly
follow the ups and downs of the official series but differences between 1977 and 1979 are large (see Table 15) In principle these discrepancies could have arisen either because handling and processing or importshying costs were underestimated or because a different accounting method was used for the official subsidy budget Mostafa et al found a similar deviation in a welfare analysis of wheat price policy for 19787981
The Rice Market
The rice market was particularly dynamic during the 1960s and 1970s Production inshycreased remarkably from the mid- 1960s to the early 1970s Exports were at a peak during 1967-70 when the country was particularly short of foreign exchange Per capita conshysumption was kept at about 28 kilograms per year during these years as compared to 32-33 kilograms in the late 1970s When
80 Official exchange rates were used to calculate the budget effects 81See Rasmia Moustafa et al AWelfare Analysis of Price Policy for Wheat and Wheat Products in Egypt Economics Working Paper 48 Agricultural Development Systems Project Ministry of Agriculture Cairo and the University of California-Berkeley Cairo 1981
52
Table 14- Consumer gains from price policies and subsidies on the wheat rice andmaize markets 196580
Aggregate Per CapitaYear Wheat Rice Maize Gain Gain
(1975 LE million) (1975 LE) 1965 1825 1093 662 3580 1221966 1297 956 402 2655 881967 1345 772 143 2260 741968 678 1059 294 2031 641969 1505 1183 408 3096 961970 1835 685 448 2968 901971 1005 499 189 1693 501972 1149 506 248 1903 551973 3949 1291 556 5799 1641974 4849 5158 650 0657 2941975 3758 4451 541 8750 2361976 3098 2407 330 5835 1541977 1904 1046 106 3056 791978 2367 1371 -49 3689 921979 3755 1156 251 5162 1261980 4380 1189 68 5637 134
Sources These figures were computed from data provided by the Egyptian Ministry of Supply the Central Agency forPublic Mobilization and Statistics and the Principal Bank for Development and Agricultural Investment Total population is the denominator used to calculate this column
Table 15- Changes in the budget caused by government intervention in the wheatrice and maize markets 1965-80
Wheat MaizeYear Model Official Rice Model Official Total
(1975 LE million) 1965 213 145 12 781966 148 -188 -04 -441967 203 -274 -19 -911968 -56 -367 00 -4231969 -54 -269 -01 -2161970 59 211 -43 04 1l 201971 07 -18 -01 -121972 30 192 -14 04 061973 1313 961 -162 18
20 54 11691974 1964 2375 -330 183 181 18171975 1429 2609 -37 142 311 15341976 801 1556 04 95 210 9001977 385 1199 70 77 17 5321978 590 1613 156 -47 294 6991979 2901 3875 -56 184 354 30291980 3281 2748 19 301 208 3601
Sources The official figures are from Harold Alderman Joachim von Braun and Sakr Ahr ied Sdkr EgyprsFoodSubsidy and Rationing System A Description Research Report 34 (Washington DC International Food PolicyResearch Institute 1982) p 16 The calculations for the model figures for wheat and rice are presented inAppendix 2 Tables 35 and 36
Notes The model figures were calculated using the official exchange rate The offic al figures are subsidies menshytioned In the General Authority for Supply Commodities budget for wheat at d flour figures for 1970 and1980 refer to 1970r7l and 198081
These figures are from the calculations with the model
53
exports were high and the per capita supply low free market prices in the rural areas soared This led to a wide gap between procurement prices and fixed consumer prices on the one hand and open market producer and consumer prices on the other As with wheat there was often a difference between the fixed consumer prices and market prices for rice in the 1970s But this gap in rice prices was narrowed during 1979 and 1980 as the gap in wheat prices was not because fixed consumer prices rose (see Table 16) The rice market was heavily taxed and this did not change significantly even when the quantity exported became smaller in absolute terms and in relation to total foreign exchange earnings The ratios of producer prices show that rice production was taxed more heavily than wheat produc-tion during the observed period
Figure 12 outlines the structure of the rice market The rice model calculations are given in Appendix 2 Table 36 The total loss by producers because of the difference
between world prices and domestic prices is determined by the loss from procurement (GP in Figure 12) the loss from depressed domestic open market prices (GP ) and the income that producers could have gained through reallocation of resources under an international price regime (GPoc) The greater part of the implicit income transfer to conshysumers is identical with the gain from subshysidized rice distribution (Grs) and relatively cheap rice on the open domestic market (Gfe) A lesser part of the consumer gains is financed by the government outlays for procurement below subsidized ration prices Until 1974 revenues from the implicit export tax were large but since then the outlays for procurement have often exceeded export revenues (see Table 15)
The income lost by rice producers because of this policy was about LE 260 million in 1980 Subtracting the social loss in producshytion and the small amount of rice export taxes in that year and adding the government outlays for the directrice subsidy (BdiS) one
Table 16- Relationship of rice prices to international and open market prices 1965shy80
Share of Open Market PriceShare of International Price
Year Procurement
Price
Open Market Producer
Price
Fixed Consumer
Price Procurement
Priceb
Fixed Consumer
Pricec
(percent of border price) (percent of open market price)
1965 1966 1967 1968 1969 1970 1971 1972 1973 1974 1975 1976 1977 1978 1979 1980
257 239 324 285 291 405 486 497 286 108 149 279 418 429 433 420
363 467 512 517 400 518 608 600 370 137 155 291 482 459 492 464
325 416 607 480 382 513 603 594 348 120 130 222 344 311 425 390
707 513 632 550 728 783 799 828 771 788 905 958 867 934 881 905
873 870 863 911 933 964 960 962 912 848 764 741 691 660 839 815
Sources llese figures were computed from data provided in 1982 by the Egyptian Ministry of Agriculture the
Central Agency for Public Mobilization and Statistics and the Ministry of Supply
Note The border price is calculated from values of exports with marketing and processing costs added and corshy
rections made to account for the overvaluation of the currency
A These are in paddy equivalents
b The procurement price is expressed as a percentage of the open market producer price
c The fixed consumer price is expressed as a percentage of the open market consumer price
54
----
Figure 12-Average conditions in the rice market 1976-80 LEMetric Ton Dn D I I S
I I in
90shy
80-G G
70
60-
Pill I50------------------------shy
30
0-II2r
I -- --- --- --- --- --- --- -shy10-
I 11I 100012000
11 O00 3000 Metric r QQ11 Qi Tons
Qprr -
Sources Calculated from data provided by the Egyptian Ministries of Agriculture and Supply and the Principal Bank for Development and Agricultural Investment
Notes Prices are deflated by the consumer price index(1975= 100) B is the increase in the government budgetcaused by procuring and distributing rice and B is the budget revenue from procured rice that is exportedPt is the international price Pl is the open market price PI is the government procurement price and P] is the fixed consumer price Q is expons from government procurement (Q = Q - Qi) Qp is government pronrurement Qi is domestic production(total) Q is government eurolistribution(Qe + Q)and Q is total consumption S is sulpply D is demand
GIXis the producers loss from government procurement Gfis the prolucers loss from depression ofthe free market price and GIis the net social loss in proluction G is the consumerss gain from thedisshytribution of rice Gris the consumers gain from reduced free market prices and G is misallocation in consumption For further details see Appendix 2
55
arrives at the actual subsidy to rice con-sumers calculated at the opportunity costs to the economy(see Appendix 2 Table 36 for details) This invisible producer-to-consumerrice subsidy corresponds to 20 percent of the official (explicit) budget subsidy for all food commodities but because it is financed mainly by the farmers it does not appear in the governments accounts and the public awareness of it is small Income transfers from rice producers to consumers were high in the late 1960s and except for the years of the international price crisis they decreased in the 1970s (see Table 13)
The producer loss from depressed openmarket prices was nearly as high as the loss from compulsory deliveries and sometimes even higher In the late 1970s the income lost through procurement accounted for about one-third of the total producer losses on the rice market
Finally the results indicate that income was ftrgone because of policy-irduced in-efficiencies in allocating fewer resources for rice production which amounted to 13 percent of the total income loss of rice producers in 1980 (see Appendix 2 Table 36) The heavy implicit rice taxation and its allocation effects are not distributed at all equally but they contribute to the disparity of the implicit tax structure between regions and thus to regional differences in farm income Rice production is concentrated in the northern Nile Delta8 2
The Maize Market
Maize is the largest cereal crop in Egypt and has shown the greatest expansion since the mid-I 960s Human consumption of maize declined both in per capita terms and in total quantities It is used mostly as animal feed Imports of maize which are also growing are almost entirely channeled to poultry and livestock producers The domestic maize crop is of the white variety whereas yellow maize is imported
Governments interference in the maize market is less stringent than in the wheat and rice markets No maize is procured and no area allotment is enforced Importedmaize is distributed by a quota system at a subsidized price The gap between this subshysidized price and the international price widened during the 1970s while the gapbetween the open market price and the intershynational price has shrunk in recent years(see Table 17) The open market price ranged between 13 and 57 percent below the border price equivalent at the farm gate during the 1970s and the subsidized price was between 10 and 55 percent below the open market price (or between 34 and 75 percent below the international price) Maize producers lose income from depressed domestic prices and ir -fficiency of resource allocation as compared with international prices (see GfPe and GPoc in Figure 13) However the latter is true only if nothing but the price of maize changed If all commodities were sold at international prices maize production would lose its current strong advantage and would decline (see the model scenarios in Chapter 3) This means the supply curve (S) in Figure 13 would shift to the left and the slope of the implicit supply curve might be negative83
Part of the income transfer is acquired by maize consumers (Gfe) but livestock proshy
-ducers also gain (Gfe Ge Therefore the producer loss is largely an intrasectoral transshyfer and if maize producers are also livestock producers it is merely an intrafarm transfer These issues will be addressed in the feed and meat market analysis below
The subsidy to the maize market is estabshylished by the governments import and disshytribution scheme for using maize for feeding purposes It amounted to LE 64 million in 19808184 Other than the implicit consumer subsidy for maize this explicit subsidy is an income transfer to livestock producers Its net effect on sector income depends on the effect of this additional maize supply and the meat price policy on meat production
82 In 1980 82 percent of the rice area was in the governorates of Kafr-el- Sheikh Behera Gharbia and Sharkia in the northern Delta Figure 13 contains apositively sloped implicit supply curve(S) which holds for aseparate maize price change ratherthan achange of all prices As aresult the net social loss in production appears positive in the figure whereas it isnegative In the empirical results 84 Alderman von Braun and Sakr Egyprs Food Subsidy and Rationing System p 16
56
Table 17- Relationship of maize prices to international and openmarket prices 1965 -80
Open Fixed Consumer
Year Market
Producer Price
Fixed Consumer
Price Price as aShare
of the OpenMarket Price
19651966 (percent of border price)
417 521
(percent) less
1967 1968 1969 1970 1971 1972 1973 1974
634 544 540 507 598 635 484 433
430589 519 344 256
847898 817 711 592
19751976 19771978 1979 1980
447518 813788 595 874
264310 369662 480 427
591598 454840 806 489
Sources These figures were computed from data pro-vided in 1982 by the Egyptian Ministry of Ag-riculture the Central Agency for Public Mobilshyization and Statistics and the Ministry ofSupply
Notes No data on fixed prices before 1970 are avail able The border price is calculated front the values of imports with marketing and pro-cessing costs added and corrections made toaccount for the overvaluation of the currency
Maize consumers also gain from the importsindirectly because it leads to reduced do-mestic maize prices Imported yellow maize and domestic white maize may be freelysubstituted for each other in livestock feed-ing Both sell at roughly the same price in the open market8 5
The links between markets for maize are particularly strong Policies affecting comshypetitive cereals and all livestock policy aswell affect the maize market Thus the conclusions from a partial analysis such as this are limited
Income and Budget Effects on the Cereal Markets
How cereal market policy affects agriculshyture becomes clearer when wheat rice andmaize are aggregated Excluding the excepshytional years of the world food crisis (1973shytina ers of rl ood csss (1973shy75) the trend of real income losses of cerealproducers has declined significantly since 1965 Cereal production was taxed much
during the second half of the 1970s thanin the 1960s The income loss per ton of cereals in 1975 prices dropped from an average of LE 56 during 1965-69 to LE 30 in1977-80 (see Table 13) In other words taxation of cereal production was reducedwhile explicit food subsidi( were increasingdramatically The parallel aevelopment ofsubsidies and taxation of production which was so striking during the first half of the 1970s was not the result of a stable causalrelationship between the two Price policiesfor consumers and domestic producers werehardly responsive to international price
changes86 The taxation of cereal productiondeclined in the late 1970s mainly becauseboth rice procurement prices and maize prices increased Wheat price policy did nothave much effect on aggregate cereal pricesDespite the decreased burden on cerealproduction implicit income transfers fromproducers were still LE 422 million in 1980
which corresponds to about 75 percent ofthe explicit cereal subsidy budget in that year Rice alone accounted for about 54 pcrcent of that
Consumers received growing supportthrough depressed cereal prices and subshysidized distribution in the late 1970s after several years of reduced transfers followingthe international food price crisis (see Table 14) In 1980 78 percent of all consumer gains on cereal markets came from wheat21 percent from rice and 1 percent from maize
Pulse Markets
Pulses (Leans and lentils) are a major source of protein in the Egyptian diet parshyticuhrly of the rural and urban poor Howshyever they are considered an inferior food by
These observatlcns were made during market surveys in 198182 in rural and urban areas Subsidized yellow maizeis sometimes resold on the open market Recently some yellow maize has been grown In Fayum86 This finding is also evident from Scobles study on Egyptian wheat policy(Scohie Government Policy and Food Imports)
57
-------------
Figure 13-Average conditions in the maize market 1976-80
Dhum LEMetric Ton Dtot S
80 SGC
70 Gc
6 0
50
Pfred 40 ---------------------------40
PPd --shy
30shy
II I20shy
1 I
100011i
Qhum QTons
sources Calculated from data provided by the Egyptian Ministries of Agriculture and Supply
Prices are deflated by the consumer price index (1975=100) B is the increasein the governments budget Notes
caused by the subsidized distribution of maize impoits (It includes GP in this figure) Dhum is the demand
is the total demand for maize Pire is the open market price Pit is the international for maize for food nto price and Pl is the fixed producer price of maize used as feed
is imports Qp is total domestic produc-Qfed is maize used as feed Qh is maize used as food Q
tion and Q is the total supply of white and yellow maize Sis sutpply is the consumers gain from reduced free market prices and Gf is misallocation in consumption
Gu G is the producers loss from the depression of the free market price (The producers loss also includes
is the net social loss in productionG1 and Gsoc in this figure) G
many837 Thus the growth of income may
have helped reduce total and per capita
consumption of pulses since the mid- 1960s
The procurement orices of beans and
lentils were kept at between 50 and 60 per-
cent of international price during the second
half of the 1970s This reducel the crops
comparative advantage over berseem and other winter crops and shrank domestic supply which was only partly balanced by
government- controlled imports These im-ports and compulsory deliveries from do-
mestic production were channeled into the
subsidized distribution system The decreased
total supply caused open market prices to
rise Subsidized consumer prices dropped
even further below domestic open market
prices than procurement prices did (Table
18) Because domestic production shrank
the total income loss of producers decreased in real terms During the period 1977-80 the
loss per ton of pulses was also reduced This was mainly because open market prices rose
87 For urban middle- and high-income groups negative expenditure elasticities are estimated whereas urban poor
and rural households show relatively high positive elasticities See von Braun A Demand System for Egypt p 5
58
Table 18- Relationship of bean prices to international and open market prices 1965 -80
Share of International Price Share of Open Market Price Open Market Fixed Fixed
Procurement Producer Consumer Procurement Consumer Year Price Price Price Price Price
(percent of border price) (percent of open market price)
1965 593 578 978 1966 581 535 915 1967 766 641 833 1968 738 663 886 1969 608 631 966 1970 394 642 613 613 886 1971 430 872 669 493 683 1972 508 817 684 622 745 1973 337 3486 436 693 833 1974 386 733 500 526 639 1975 531 718 547 739 727 1976 516 758 532 681 669 1977 474 719 489 659 649 1978 624 859 484 728 532 1979 523 809 406 647 464 1980 556 853 346 652 357
Sources These figures were computed from data provided in 1982 by the Egyptian Ministry of Agriculture the Central Agency for Public Mobilization and Statistics and the Ministry of Supply
Notes No data are available for procurement prices before 1970 The border price is calculated from values of exshyports with marketing costs added and corrections made to account for the overvaluation of the currency
Table 19-Producer losses from price policies and procurement on the beans and lentils markets 1965-80
Beans Lentils Loss from Total Loss from Total Aggregate Loss Per
Year Procurement Loss Procurement Loss Loss Metric Ton
(1975 LE million) (1975 LE)
1965 325 03 328 81 1966 368 34 402 95 1967 85 21 106 48 1968 141 33 174 55 1969 224 34 250 811 1970 13 195 24 219 71 1971 68 103 42 145 47 1972 51 133 54 187 45 1973 41 347 279 626 187 1974 34 134 145 279 98 1975 43 161 23 107 268 98 1976 52 150 33 84 234 80 1977 52 173 17 28 201 68 1978 23 66 03 06 72 29 1979 62 120 04 05 125 51 1980 48 86 b5 07 93 41
Sources Computed from data provided by the Egyptian Ministries of Agriculture and Supply the Principal Bankfor Development and Agricultural Investment and the Central Agency for Public Mobilization and Statistics
Notes No data on procurement of beans before 1970 are available no data on procurement of lentils before 1975 are available
These are given In beans equivalent Lentils are weighted with a factor of 12 to adjust for the average value difshyference (the average open market price is used as a point of reference)
59
not because procurement policy changed (see Tables 18 and 19) Total consumer gains from subsidized distribution and depressed domestic open market prices remained high during the 1970s (see Table 20) As lentils received a higher per unit subsidy than beans absolute consumer gains from both com-modities were about the same despite the smaller quantity of lentils consumed
Pulse market policy appears to be similar to cereal policy Taxation was far higher than its long-term average in the mid- 1970s because only small fractions of international price increases were transmitted to the domestic market Implicit taxation d-Lteased in the late 1970s because suppliL3 on the open market were tightened which pressed prices upward and not because government policy was actively changed
Current price policy has an imporcant effect on domestic production of puses The sector modelinp scenarins i idicate that pulse production migiht increase significantly it domestic prices equalled world priccs as current price ratios greatly favoi berseem and vegetables pulses major competitors (see Chapter 3) The increased share of ber-seem among those crops grown before cot-ton shows this
To sum up policies in the pulses market are quite similar to those in the wheat market except that procurement is still compulsory It is characterized by a consistently wide gap between international and procurement prices and by a growing gap between pro-curement and open market prices The po-tential effects on production of a streamlined price regime indicate that current policy creates large inefficiencies in the allocation of land for pulses
The Sugar Market Egypt was one of the first countries to
grow sugarcane and led the trade in sugar until the 16th century Since then the sugar industry has flourished in some periods and gone bankrupt in others88 Before the con-struction of the Aswan High Dam sugar pro-duction was largely affected by fluctuating
water availability Since then the regulated water supply has permitted major stable area expansion Ninety percent of all sugarshycane is grown in the three Upper Egyptian governorates of Menia Qena and Asyut Sugarcane is the major cash crop in this region where no land is allocated to cotton in the government area allotment scheme About 235000 feddan representing 27 pershycent of the area of these three governorates is sown with sugarcane
The state holds a monopoly as miller and trader of cane and sugar Except for a small quantity of privately processed cane mainly used for juice cane is delivered to the state mills Growers are tied by contracts to one of the seven operating factories In recent years sugar beet production has been proshymoted in the northern Nile Delta but only insignificant amounts were produced during the period studied
Sugar production has almost doubled since the mid- 1960s Egypt became a net importer of suga- in the 1970s although net exports occurred in some years untii 1973
Few world agricultural markets are as unstable as the sugar market And in none have more attempts been made to achicve domestic stability In 6 out of the 16 years observed domestic producer prices of sugar (impicit in the price of sugarcane) exceeded the equivalent world price In -ome years during the 1960s the farm-gate equivalent world prices for cane were negative which implies that the value added for sugar proshyduction was negative8 9 Domestic producshytion was protected to maintain farm incomes in a region dependent on the crop and to keep the sugar industry in existence during the trough periods of the price cycles
Because sugarcane is a nontradable havshying no international value production and processing- from cane cultivation to sugar refining- are treated as an integrated activity Consumers are supplied with rationed sugar at subsidized prices Additional sugar comes from open (black) markets The open market sugar price which is an average of black market and second tier (urban) subsidized prices clears the highly regulated market This price was higher than the world price in
8 Ylaus Baumgaiten Zuckerwirtschaft in Agypten [Sugar Economy in Egypt] Zuclerindustle 104 (September 1979)
854-13 9
This finding is in line with calculations from Cuddihy Agricultural PriceManagement inEgypt p 106
60
Table 20- Consumer gains from price were frequently higher than world prices policies on the beans and Price policy stabilized the domestic market
lentils markets 1965-80 and partof the government budget requireshyments for this policy was provided by revshyenues generated during periods of low inter-
Year Beans Lentils Total nationai sugar prices
(1975 LE million)
1965 167 01 167
1966 136 23 159 1967 70 28 98 1968 16970 42 112621071969 1970 87 38 125 1971 53 33 86 1972 50 43 93 1973 168 111 279 1974 97 108 205 1975 185 180 365 1976 153 183 336 1977 122 95 217 1978 62 50 112
2131979 127 86 1980 113 121 234
Sources Computed from data provided by the Egyptian
Ministries of Agriculture and Supply the Principal Bank for Development and Agri-cultural Investment and the Central Agency for Public Mobilization and Statistics
14 out of the 16 years observed9 0 The sugar price of the basic ration was kept nominally constant during the entire period the dif-ference between the fixed and open consumer price grew and ranged from 20 to 70 percent between 1965 and 1980 (see Table 21)
As world prices were particularly unstable only long-term observations of price policy effects make sense for the sugar market As the time series in Table 22 indicates the in-come le 3ses of producers when world prices were high far exceeded the implicit gains of producers when prices were low In fact calculated in constant prices the implicit gains of producers were only 10 percent of their total losses during the entire period 1965-80
Consumer gains from the subsidized rationed distribution were offset in several years by open market sugar prices which
The Cotton Market
Because the cotton market has been intensively researched a description of the policy goals underlying cotton export taxation and the instruments applied may seem reshydundant9 1 Cotton is included in this analysis however because it must con pete with the
major food crops for production resources It is sometimes argued that food subsidies increase government expenditures which
are financed by increasing taxation of agrishy
culture with cotton traditionally ranking first as a crop to be used as a vehicle for indirect taxation
Cottonc prouction d Cotton production decreased signifishy
cantly during the 1970s (see Chapter 3) The decline in production and the increase in domestic consumption have reduced exports to almost half of what they were in the midshy1960s But cotton is still the most important agricultural export commodity
The entire crop is delivered by the farmers to state collection points Cotton prices which are set by a Higher Council with members from several ministries vary by grade and variety92
Average procurement prices ranged beshytween 20 and 50 percent of the international equivalent during the 1960s and 1970s The international equivalent for the farm-gate price of seed cotton is calculated from the export unit values of cotton lint which are converted into seed cotton quantities marshyketing and processing costs are subtracted from them the value of by- products is added and then the values are corrected for the foreign exchange bias in cotton lint and cottonseed prices
Much of Egypts cotton crop is of the extra- long staple type On the average Egypt produced 43 percent of the world supply of
90 The price series was made available by CAPMAS For a description of the complex sugar distribution regulations
see Alderman von Braun and Sakr Egypts Food Subsidy and Rationing System p 34
91 See Hansen and Nashashibi Foreign Trade Regimes and Economic Development p 206
92 For adescription ofhow cotton price policy is administered see Cuddihy AgriultraI PriceManagement in Egypt p85
61
Table 21- Relationship of sugar prices to international and open market prices 1965 -80
Fixed Consumer Price
Year
Domestic Cane Price In Sugar
Equivalents
Fixed Consumer
Price Open Market
Consumer Price
as a Proportion of the Open Market
Consumer Price
(percent of border price) (percent)
1965 1966 1967
288 1058
949 3891
-
1186 4864
800 800 833
1968 1969 1970 1971 1972 1973 1974 1975 1976 1977 1978 1979 1980
0833 662 492
4439 948 282 153 268 515 871
1409 1066 412
2179 1618
15150 2907 701 219 328 564 978
1441 980 292
2603 2581
23333 4506 1157 612
879 1550 2757 4352 2593 1021
837 629 649 645 606 358 373 364 355 333 378 286
Sources Computed from data provided by the Egyptian Ministry of Agriculture and the Central Agency for Public Mobilization and Statistics The border price is calculated from values of imports with marketing and processing costs and correctionsNote made to account for the overvaluation of the currency
In these years the border price of sugar was negative
that type during 1970-77 93 Although this gives Egypt the ability to influence the export price of the commodity somewhat extra-long staple cotton prices are hardly indepen-dent from long staple cotton prices in the world market94 However to the extent that Egypt is able to maximize total foreign ex-change revenues from cotton trade by im-posing an optimum tariff from a quasi-monopoly position distortion-free prices are overestimated if the actual export prices are used as a point of reference The with-holding of largc amounts of cotton from export in the early 1980s seems to support the hypothesis that Egypt at least tries to influence its export price But cotton may have been withheld because prices were expected to rise or because of management
problems Without suitable data and with some reservations the analysis here proshyceeds under the small-country aissumption
Cotton consumption is defined as the quantity acquired by domestic cotton inshydustries 95 It has grown significantly Delivery prices to public-sector factories which are set below procurement prices further proshytect the cotton industry96 Due to shrinking exports the highest share of the income transfer from producers is no longer a conshytribution to the general budget as it was until 1974 Instead it covers an implicit subshysidy (G1) of domestic consumers which amounted to LE 474 million in 1980
Input subsidies are of major importance for cotton because the subsidies on pesticides are high They are considered in the calshy
93John M Page Shadow Prices forTrade Strategy and Investment Planning in Egypt World Bank Staff Working Paper 521
(Washington DC World Bank 1982) p 100
Long staple cotton prices act as a floor for the extra- long grades price Long and extra-long staple prices show highly correlated price developments 9SCuddihy uses this definition In Agricultural Price Management in Egypt pp 86-90
96About LE 80 million were allocated for this purpose in the 198182 budget
62
Table 22- Gains and losses of producers and consumers on the sugar market 1965-80
Producer Consumer
(1975 LE million)
1965 -574 410 19661967 05215 396-664
1968 1969 1970 1971 1972 1973 1974
249 -153 -299
181 -26
-952 -3458
-550 -38 -60
-539-388 565
2183 1975 1976 If07 1978 1979
-1791 -shy588 -41 191 69
1539 247
-395 -818 -162
1980 -906 1256
Sources Computed from data provided by the Egypshytian Ministry of Agriculture and the Central Agency for Public Mobilization and Statistics
Note Positive numbers are gains negative numbers are losses
culation of farm income loss Income trans-fers from producers fluctuated between LE350 and LE700 million during the 1970s The average income transter per ton ot raw cotton measured in deflated prices was somewhat higher in the second half of the 1970s than in the second half of the 1960s but in 1979-80 there was a significant drop in the implicit taxation of production (see Table23) This was because domebitc output prices rose and input subsidies increased The total income loss of producers was LE 593 million in 1980
Cotton producer price policy is largely determined by income support objectives Prices are set on the basis of the cost of production and a mark-u p felt to be adequate for a target farm income9 7 Little adjustment of domestic prices to world prices is made Hence the extreme taxation of the cotton
crop during 1974-77 was mainly an effect of high international prices while domestic prices remained more or less stable Howshyever budget revenue consideiations might
have caused this low transmission elasticity This will be analyzed more comprehensively with particular reference to food subsidies
later At this point it is worth noting that when government outlays for food subsidies were exploding during 1973-80 there were two distinct price policies for cotton exshy
tremely high taxation during the first period (1974-77) and moderate to low taxation-if measured against standards of the 1960s and
early 1970s-during the following period (1978-80) No obvious relation between the taxation of cotton and the increase in budshygetary needs because of increased subsidy
outlays is apparent The important by-product of cotton proshy
duction-cottonseed cake-is taken into account in the feed market analysis in the
next chapter
Animal Produce Markets and Feed
Egypts livestock density is one of the highest in the world its animal production sector is closely linked to all cropping activities because cattle and buffalo are used as draft animals and because fodder production and fodder by- products of major crops are important Because almost no range land is available in the country the opportunity cost of fodder is determined by the prices of all other crops The following analysis foctises on the red meat and milk markets and the policies affecting the output and input prices of these commodities The fast-growing poultry sector is included in the feed policy analysis
Red Meat
A detailed analysis of the implications of price policy for the Egyptian meat market is impaired by insufficient data 98 Because
17See Saad Nassar M Rel-Amir and AA Moustafa Determinants if Agricultural Price Policy in Egypt Economics
Working Paper 50 Agricultural Development Systems Project Ministry of Agriculture Cairo and the University of
California-Berkeley Cairo 1982 p 12
98 James B Fmch and Ibrahim Soliman The Livestock Economy in Egypt An Appraisal of the Current Situation
Cairo 1982 (mimeographed)
63
Table 23- Producer losses and con-sumer gains on the cotton market L965-80
Producer Loss Ate- Loss Per Consumer
Year gate Metric Ton Gln
(1975 LE (LE) (1975 LE million) million)
1398 1966 3908 278 700 1967 3118 231 759 1968 3573 265 1055 1969 6008 361 2135 1970 5505 353 1641 1971 4738 302 1204 1972 4485 284 1434 1973 5050 343 1501 1974 8055 617 1922 1975 6065 532 1619
1965 5288 328
1976 4734 406 1574 1977 6050 514 1706 1978 3692 311 1514 1979 2662 207 1882 1980 3192 228 1878
Sources Computed from data provided by the Egyp-tlan Ministry of Agriculture and the Central Agency for Public Mobilization and Statistics
Calculated for the cotton industry on the basis of the governments delivery price of cotton to factories
production statistics are based on crude estimates the analytical results should be interpreted cautiously The meat analysis in this report focuses on cattle and buffalo meat Sheep goats and camels which supply about 15 percent of all red meat produced are not dealt with here Ministry of Agriculture meat production figures show that the number of sheep goats and camels showed a slight tendency to grow in the 1970s Despite rapidly increasing imports the growth of total supply of red meat was only modest which as income growth and the income elasticities of meat demand were high led to a tremendous rise in prices during the 1970s The consumer price index of meat products rose to 428 between 197071 and 198081 and the cost-of-living price
index rose to 25299 The index of farm-gate prices of beef rose to 369 (also see the border price equivalents given in AppendixI Table 34)
Since the mid- 1970s domestic meat priceshave exceeded international prices which indicates that meat production is protected Although private meat imports have been
permitted in principle since the mi- 1970s they are still small This does not seem
plausible at first glance With domestic prices higher than import prices importing meat should be profitable But import license restrictions the importers lack of foreign exchange and controls on the marketing margins of importers calculated on the basis
of the official exchange rate have discouraged private imports and contributed to protecshytionism Another constraint on private imshyports is the lack of privately owned refrigershy
ated transport and distribution facilities Thus the Ministry of Supplys foreign purshychasing decision remains the determinant of import quantities The Ministry uses
numerous instruments to influence domestic meat production and distribution Among these are the compulsory delivery of meat produced with subsidized feed (197980) and restriction of sales of retail meat tothre s ofh eeek
three days of the week
Government frozen meat imports are sold in portions at a subsidized fixed price that is less than both the import and domestic open market prices 10 0 The basic features of the beef market in the late 1970s are desshycribed in Figure 14 It demonstrates that consumers lose in open market purchases (Gc) whereas they gain from the distribution of subsidized imports by the government (Gcs)
Livestock production in Egyptian agrishyculture rarely serves just one purpose Most meat and milk is produced from draft animals kept on small family farms This means that high meat (and milk) prices are an indirect incentive for continuing to use draft animals instead of machinery using diesel or electrical power10 1 The dual uses for cattle and buffalo also explain why domestic meat production
The consumer price index refers to meat fish and eggs (CAPMAS 1982) 1ooSee Alderman von Braun and Sakr Egypts Food Subsidy and Rationing System for a description of the system of subsidized meat distribution to consumers 1ol Note that energy is subsidized too which somewhat offsets the distortion in favor of draft animals
64
Figure 14-Average conditions in the beef market 1976-80 LEMetric Ton
Pt
400shy11000
S I
200
100shy
00 2C0
Qd
Qdls
Qdem
500 Metric Tons
Sources Calculated from data provided by the Egyptian Ministries of Agriculture and Supply Notes Prites are deflated by the consumer price index (1975 = i00) Pinisthe international price Prreisthe open
market price and Psiisthe fixed consumer price Qprd isdomestic pr duction (total) QdJ isgovernmentdistribution Qdem is tctai consumption and Qim isimports (-Qde - Qprd) SiSsupply D is demand
Gf~e isthe producers gain from the free market price and G50c isthe net social loss in production Gd1 is the consumers gain from the distribution of subsidized beef Gf~eisthe consumers loss from protectedfree market prices and G ismisallocation in consumption For further details see Appendix 2
has not been able to keep pace with demand Egyptian agriculture has no real comparativedespite the high price increases As the high advantage in livestock production givenfeedmeat conversion rates indicate the the high opportunity costs of land and in marginal productivity Gf fodder used for the long run of water (see Chapter 3)increased meat output is low partly because Because meat isconsumed mainly by the of the genetic characteristics of the local high-income population the price policybreeds Nevertheless the growth in fodder has important implications for equity as production during the 1970s indicates that well The income transfer calculations disshythe price structures gave farmers a strong cussed below should be seen in this lightincentive to expand livestock production About 50 percent of all meat products are The modeling exercise demonstrates that consumed by the high- and middle-income
65
urban population which is 31 percent of the total populationt0 2 In other words meat protection transfers income from the urban (rich) to the small-farm sector Taxation of most other farm products does the opposite Farmers gains from protectionist prices increased remarkably during the 1970s reaching about LE 41 million in 1980 This partially compensates for the producers losses on the other commodity markets
Consumers losses from open market meat )urchases are of roughly the same order But subsidized rationed meat dis-tribution has compensated for a larger share of these losses in recent years because sub-sidized meat prices are nominally constant (see Table 24) Most subsidized meat i5 channeled into urban areas103 This implies that the high open market prices for meat which favor producers in rural areas mainly at the cost of urban consumers are some-what balanced by the governments subsidyand rationing program The subsidy budget for beef is calculated at about LE 57 million for 1980 (see Appendix 2 Table 37) It has
grown quickly in recent years
Milk
Egypts milk market is flourishing in on pro-obscurity Statistical information
duction is vague and based on estimates rather than on surveys 10 4 According to statistics of the Ministry of Agriculture production increased steadily during the 1970s by about 15 percent per year Milk is mainly produced on small and medium family farms Milk home-processed butter (ghee) and cheese provide major sources of regular cash income for those farm house-holds producing a marketed surplus These milk products are marketed either directly by producers or by small peddlers
The eight government-operated milk plants in the country process about 50000 tons of fresh milk per year some of which is
Table 24- Gains and losses of producers and consumers on the meat market 1965 -80
consumerGain or Loss Producer from Fixed Total
Gain or Price Meat Gain or Year Loss Distribution Loss
(1975 LE million) 1965 -1633 189 926 1966 -1528 49 627 1967 -1050 -15 316 1968 1969 1970 1971
-402 -603 -573 -945
-55 -17 -59 -43
-91 216 -50 164
1972 -302 -124 -576 197319741975
-1771 -827
189
10 20
-51 641
14-1051
1976 313 -30 -1620 1977 1978 1979 1980
-shy103 203
-612 223
129 132 339 422
-805 -1002
291 -621
Sources Computed from data provided by the Egyptian
Ministries of Agriculture and Supply and the Central Agency for Public Mobilizationand Statistics
Note Positive numbers are gains negative numbers are losses
sold through government outlets at fixed prices and some of which is marketed by merchants10 5 Public-sector companies are major recipients of imported skimmed milk powder and butter oil The bulk of these two commodities is delivered to Egypt under food aid terms from the European Community which in recent years has normally sent about 10000 tons of milk powder and 3000 tons ofbutteroileachyee Of that in 1980shy81 7000 tons of milk powder and 2800 tons of butter oil were used as nonproject
102This is calculated on the basis of CAPMAS Family Pudget Survey 197475 See von Braun ADemand System for Egypt 103See Alderman von Braun and Sakr Egypt s Food Subsidy and Rationing System p 35
1G4 The most recent representative survey on livestock and animal production available is for 1970 Since then
annual milk production has been estimated on the basis of a projected change of the cattle herd its assumed age structure and milk production per head The milk yields per head used in the calculation for 1979 were for buffalo old 3168 kilograms per year medium 899 kilograms per year and for cows average 674 kilograms per year This unpublished information was provided by the Ministry of Agriculture Cairo 105This information was obtained from the Mist Dairy Company Cairo 1979
66
food aid which means it was processed in the public plants It is z2ither reconstituted as milk or made into cheese1deg 6 These imports are exempt from the analysis of the milk market because they make up onlyabout 4 percent of total consumption (cal-culated in milk equivalents)
Consumption of milk products in Egptis not confined to the higher income (urban) population as it is in many subtropical or tropical countries The average consumptionof milk and milk products in 1975 by rural low-income groups was about 5I kilograms per capita while the country average was 67 kilograms107 Village- made butter and cheese is a major fat and protein component in the diet of the rural poor
Despite the dietary importance of the commodity the government intervenes less in the milk market than in other basic food markets Most of the interventions are iii production (for example the public-sector feed supply upgrading of local cattle and veterinary services) Although these may have helped increase domestic milk pro-duction demand seems to have grown faster which explains rising milk pricesThe index of farm-gate prices for milk has increased from 100 to 350 since 1970 This increase like the increase in meat prices is far greater than the average increase of consunier prices
There are particular problems associated with calculating the income transfers and welfare effects on the milk market because fresh milk is not traded To measure the shadow pri of milk the unit value of milk powder impnts is converted to a liquid milk equivalent and corrected for the distortion in the rate of foreign exchange Of course this is an approximation only Domestic milk prices seem to have been much higher than the equivalent international prices in recent years In 1980 domestic prices were about 80 percent higher than world prices The prices were close together until the mid-1970s the world price exceeded the domestic in some years before that Since then inter-national prices have been nominally stable because milk production has been heavily
protected in the major milk producing counshytries which has led to increases of export surpluses from those countries
According to estimates based on the world price Egyptian milk producers gained
out LE 200 million in 1980 (see Table 25) nsumer income lo3ses were about LE 370
lion in 198 0i The net social loss in consumption is rather high as demand for milk is price elastic
In spite of uncertainties with the data it is clear that protection of the kailk market has icreased as domestic prices have risen and world prices have remained nominallystable Although these developmei its occurred at the same time that food subsidy expendishytures were increasing no particular causal linkage is evident However it is worth noting that implicit income transfers to milk producers added to those calculated for meat producers offset a large share of the losses of producers in those markets that are effectively taxed The ruminants appear to allow producers to compensate for some of the burden depressed prices of cereals pulses cotton and sugar put on their income
Feed As stated earlier price distortions affect
not only the distribution of income between producers and consumers but income transshyfers between crop and livestock production sectors as well Insofar as feed prices are distorted they will change the competitiveshyness of livestock production with crop proshyduction Whether this also implies that income will shift between crop farms and livestock farms depends on the degree of specialization in Egyptian agriculture Availshyable information suggests that except for a small but steadily growing specialized poultry sector livestock production in general and cattle and buffalo production in particular are evenly distributed among farms Table 38 in Appendix 2 shows the development of stocks in the livestock sector
About 65 percent of all animals are kept on farms of less than 3 feddan The value of
These statistics wert provided by the office of the World Food Programme Cairo 1982 These figures are calculated h1-ow milk equivalents from CAPMAS Family Budget Suvey 197475 See von BraunA Demand System forEgypt p 47 OfConsumer prices are derivrd from farm gate price statistics adding a constant relative markup of 20 percent for marketing costs
67
Table 25-Gains and losses of producers and consumers on the milk market 1965 -80
Producer consumer Year Gain or Loss Gain or Loss
1975 LE million)
1965 1966
112 212
-365 -516
1967 1968 1969 1970
327 -915 -1153 -704
-714 569 703 393
1971 -481 175 1972 1973 1974 1975
-1349 -402
70 -320
839 51
-506 -58
1976 -03 -504 1977 1978 1979
653 775
1077
-1378 -1575 -2036
1980 1064 -1987
Sources Computed from data provided by the Egyptian Ministries of Agriculture and Supply and the Central Agencyk fno bull Mobilization and Statistics
Note Positive numbers are gains negative numbers are losses
animal products on these small farms is nearly as high as the value of crop produc-tion109 Because the majority of the small farms operate a mixed crop- livestock pro-duction patarn one may assume that most implicit feed subsidies do not have much effect on the distribution uf personal income within agiculture Adetailed livestock survey by Soliman et al indicates that the share of subsidized concentrate feed mix in the total feed supply used is about the same for all sizes of farmn110
The implicz tions of feed subsidies for distribution would change if intensive poultry production were to continue to grow espe-cially near urban areas These specialized poultry production companies would benefit
from the low-priced feel supplies Yet in 1980 the total feed used to produce poultry and eggs most of which is still produced under typical small- farm conditions amounted to just 577000 tons of starch units This is not more than 7 percent of total feed demand and approximately 18 percent of the total
nutrients in concentrate feed (see Appendix2 TablIs 39 and 40)
Another question needs to be raised about the relationship between feed subsishy
dies and the prices of livestock products Do feed subsidies benefit consumers by reducshying meat prices Considering the marketing system and the supply-demand situation
this is unlikely to happen as long as Egypt is an importing country where prices are deshytermined mainly by import prices and the tariffs and costs of implicit trade barriers
Actually the Egyptian government has been trying for some time to have the feed subsidy transmitted to meat prices Those farmers who receive subsidized feed have been obliged
since September 1981 to sell some of the livestock produced with that feed to govshyernment slaughterhouses at a low fixed price Yet frequent observations suggest
Ithat these fixed prices for livestock producshytion are seldom enforced According to calculations presented by Solimn this should not be surprising at least insofar as the gcneya tprice-fixing policy is conshycerned Sohnan calculates that under average production conditions a farmer who receives only the official fixed price for his cattle cannot cover his costs of producshytion itobliged to sell the product at the fixed price As a result he may refrain from fattening rattle unless he is able to sell his produce on the opet s7rket Most farmers seem to be doing this
As a consequence in the following calshyculation the subsidy of feed (S) of a certain category (i) is defined asthe wedge between
t P11) plied by the quantity (Q) without adjustshyments for changes of vestock prices inshyduced by subsidies
national and world prices (P~n- multishy
109 Ibrahim Soliman James RFitch and Nesreen Abdel Aziz The Role of Livestock Production on the Egyptian Farm Economics Werklng Paper 85 Agdicultural Development Systems Project Ministry of Agriculture Cairo and the University of California-Berkeley Cairo July 1982 p 7 110Ibid pp 31-32
in Egypt Economics Working Paper 62 Agricultural Development Systems Project Ministry of Agriculture 0ro and the University of California-Berkeley Cairo 1982 I Ibrahim Soliman Red Meat Price ie4
68
S Q(Pi p) (15)
The main sources of feed supply in Egypt are berseem and leaves of maize which provide green fodder straw and concentrated feed components including wheat and rice bran and cottonseed cake Direct subsidies are being paid to distribute imported maize directly and for the growing amount of feed mix available which consists of several combinations of bran imported maize cot-tonseed cake and other minor ingredients A comparison of domestic and world prices or price equivalents for the remaining feed categories- namely berseem but also do-mestic cottonseed cake bran and maize not used in feed mix-reveals that their prices are also distorted This is obviously not only the result of trade barriers and quotas for these commodities themselves but also of prices transmitted indirectlyfrom the directly subsidized feed and fcod categories
The empirical basis for the computation of feed quantities is provided by the supply-disappearance balances as described in Appendix 2 These balances have beer gen-erated using estimates of production con-sumption waste seed and stock changes With the exception of maize and sorghum where human consumption was reestimated from family budget surveys most data in-cuding the extraction rates of by-prodt s are derived from FAO and Ministry of Agri-culture sources
As the data in Appendix indicate supplies of maize and wheat bran show the highest growth rates The rapid growth of maize supplies is a consequence of increases of prouuction and since 197475 of importscoupled with a steady decrease in human consumption According to the extrapolations from family budget surveys between 1965 and 1980 annual maize consumption declined from 67 to 38 kilograms per capita in rural areas and from 14 to 4 kilograms per capita in urban areas As a consequence the share of maize in the total supply of energy from concentrates rose from 50 percent to 75
percent It is evident that the implicit subsishydies on maize strongly affect the feed subsidy
Sorghum shows a similar pattern Conshysumption in animal feed substitutes for that consumed by humans This explains the strong growth ofthis feed component which is mainly used for poultry The total supply of the other major components of conce ate feed rice bran and cottonseed cake was more stagnant which reflects their decreasshying share of total area Finally much of the increase in berseem production is a direct reflection of the decline in the area sown with cotton which enabled long-season berseem to be substituted for short- season berseem
An aggregation of all major feed categories using starch units as weighting factors shows that the proportion of concentrates in total feed has beer steadily increasing amounting to nearly 40 percent in 1980 (see Appendix 2Table 40)112 While the total supply of energy increased by approximately50 percent between 1965 and 1980 the supshyply of energy in concentrates has almost tripled
An assessment of total feed subsidies can be made from a comparison of the total feed supplies valued -t domestic prices with the total supplies vlued at world market prices (see Table 26) A major and growing proportion of the governments direct subsidy occurs through the distribution of readyfeed mix which has included a large share of cotionseed cake since the mid-1970s Therefore the subsidy on feed mix is calshyculated separately from the subsidy on the remaining quantities of feed components
If berseem is included the total of exshyplicit and implicit subsidies in 1980 came to nearly LE400 million Yet the time series using 1975 prices shows a clearly decliningtrend for subsidies This is mainly because of the rapid decline ofreal subsidies implied in the domestic berseem price The gap between the farm- gate price of berseem and the world price equivalent has been steadily reduced It is difficult to explain what determines the producer price of berseem especially since only a small proportion of total production is marketed 1 3 The comshy
12 Starch units are chosen because energy is typically ascarce factor in Egyptian feed diets whereas protein is avhle in sufficient quantities due to the large amounts of berseem and maize that are fed According to survey results only about 13 percent of the berseem produced ismarketed See Soliman Fitch and
Aziz The Role of Livestock Production p 31
69
Table 26- Subsidies for selected feed categories and total feed subsidies 1965 -80
Feed Cotton-Year Mix seed Cake
1965 155 842 1966 1967 1968
186 260 200
780 668 510
1969 272 708 1970 1971 1972
276 291 335
681 648 628
1973 358 614 1974 1975 1976 1977 1978 1979 1980
329 308 496 539 577 661 938
488 93 64 85 37 99 71
Individual Feedsa Wheat and Rice Bran Maize
(1975 LE million)
179 462 75 411 41 284 53 360 97 414
112 542 43 244 55 333
124 765 187 1246 122 1206 140 921 52 365 55 409 41 676 19 417
Total Berseem
1638 2820 1451 3292 1253 3148 1124 3162 1492 3330 1611 3546 1225 3089 1351 3299 1861 2196 2250 2123 1729 1766 1622 2091 1042 1010 1077 784 1478 796 1445 693
Total Current Constant Prices Prices
(LE million)(1975 LE million)
2876 4458 3335 4743 3116 4401 2991 4285 3476 4822 3862 5157 3331 4315 3664 4650 3335 4057 3984 4373 3495 3495 4096 3713 3545 2852 2570 1861 3452 2274 3974 2138
Source Computed from data provided by the Egyptian Ministries of Agriculture and Supply and the Central Agency
for Public Mobilization and Statistics These feeds were not included in the feed mix
parative advantage of berseem can be seen in the farming system in general There are indications that factors that increase pro-duction may have dampened the price in-crease These factors include the steady substitution of long-season berseem for short-season berseem mentioned above and the low opportunity costs of land because competing winter crops especially wheat are taxed throughout the period 1965-80 The price of berseem may have increased because both beef prices and the derived demand for ruminant feed did If berseem is excluded from the feed subsidies a time series of direct and indirect subsidies on concentrate feed components can be derived While the sum of these subsidies has been growing in nominal terms they have been constant in real terms (Table 26) Yet the mix of feeds receiving these subsidies has changed The subsidies on those feed categories
subject to direct government intervention such as ready feed mix and maize used sepshyarately as feed have grown But the subsishydies on individual feed components not included in ready feed mix have shrunk
Insofar as the implicit feed subsidies are not just transfers between sectors within agriculture or farms they affect agricultural income significantly And insofar as these feed and roughage items are unevenly disshytributed by types of farms and by regions the price structure has important implications for the income distribution between sectors and regions This issue requires further analyses based on farm household producshytion and income information Direct and indirect feed subsidies with protectionism on the output siue of animal production give a different picture of the aggregate taxation of agriculture than if only the major field crops are taken into account
70
7 THE BURDEN ON AGRICULTURE-DEVELOPMENT AND DETERMINANTS WITH SPECIAL FOCUS ON FOOD SUBSIDIES
The analysis of agricultural policy by commodity in the last chapter made the system seem like a confusing mosaic This chapter will try to show how the parts of the mosaic fit together Attempts will be made to explain how the aggregate burden on pro-ducers developed and to define its major components Hypotheses will be tested to find out what policies determine its size and form And the way food subsidies change the burden will be analyzed
Development and Componentsof the Burden
The aggregate burden on the sector (TB) in year t is the sum of all welfare gains and losses of producers 114
TB (16)TBt GpPt
where
Gpt = the burden on producers from Implicit taxation or protection of commodity i in year t (Go as defined in equation [71) and
i= 1 10 = the commodities wheat rice maize beans lentils sugar cotton meat milk and feed
TB represents the sum of all farm income transferred by government procurement farmerss open market activities and sub-sidized input supplies and of net losses from the misallocation of resources This burder expressed in 1975 prices fluctuated between LE 500 million and LE I billion
between 1965 and 1972 Aftcr an extraordishynary peak in 1973-75 it dropped to about LE 350 niiiionper year in 1976 (see Table 27) In other words agriculture was implicitly taxed much less in the second half of the 1970s than before
The total burden was reduced mostly by lowering the burden on cereals and cotton and increasing protection of animal products it was mainly the development of livestock protection after 1974 that changed the relashytionship between agriculture and the rest of the economy (see Figure 15)
Table 28 confirms that wheat price policy added little to aggregate taxation Producer losses in wheat production usually added only 3 to 10 percent to the total burden Only in recent years when implicit taxation on that commodity remained stable while the aggregate burden shrank has wheats conshytribution increased The contribution of maize is also low though it has fluctuated much more because its domestic prices have been unstable Rices contribution has been higher about 30 to 40 percent in the second half of the 1970s Cottons effect on the tot3l burden has been overwhelming Since the gains from livestock protection and input subsidies have reduced the total burden the share of cotton has increased The rapid changes in the livestock market are a major cause of the reduction of the burden since 1974 (Table 28) Without the livestock protection and feed subsidies the aggregate burden in 1980 would have been 73 percent higher
The producer burden-the farm income forgone as a conseque~nce of price and market interventions-is determined by several seemingly unrelated factors Policies on taxation of agriculture support of farm income and price policies which are directed
114Direct taxation is excluded here Cuddihys assumption that this may balance offwith the implicit subsidy of free
water supply to field borders Is followed (Cuddihy AgriculturalPriceManagement inEgypt)
71
Table 27-Aggregate gains andlosses of producers on agricultural commodity marshykets 1965-80
Cereals Pulses Year and Sugar Meat and Milk Feed Cotton Total Burden
(1975 LE million)
1965 -43220 -15217 16383 -52879 -94934 -703941966 -32670 -13155 14510 -39078
1967 -27816 -7238 12532 -31179 -53701 -35728 -713701968 -33713 -13166 11237 -60881 -104162 1969 -41440 -17556 14916
1970 -34671 -12776 16109 -55049 -86387 1971 -18497 -14266 12255 -47376 -67884
-684211972 -20570 -16510 13508 -44849 -50504 -114556 1973 -60926 -21737 18610
22503 -80550 -206378 1974 -140761 -7571 -152872 1975 -108217 -1303 17295 -60646
1976 -55803 3091 16225 -47344 -83831 -636721977 -19088 5498 10419 -60501
1978 -19032 9774 10774 -36925 -35409
1979 -28682 4656 14779 -26615 -35862 1980 -32776 12874 14446 -31911) -37374
Sources These are aggregated results of partial equilibrium models of the indicated markets calculated from data
provided by the Egyptian Ministries ofAgriculture and Supply and the Central Agency for Public Mobilization and Statistics
Notes Positive numbers are gains negative numbers are losses I This excludes berseem Itshould be noted that the producer losses computed for the maize market are compensated for by the implicit producer gains from depressed feed maize prices to the extent that domestically produced maize is fed to animals
toward improving Egypts self-sufficiency ment and income redistribution In other
contribute positively or negatively to the words the government revenues in a given
aggregate net burden The following is an year should be expected to affect the burden
attempt to identify the major determinants on agriculture Indirect taxation of agriculshy
of theproducer burden to trace the explana- ture is particularly attractive for a governshy
tory variables accounting for its recent rapid ment that has problems collecting direct Indirect taxes through procurementdecrease and to assess the effect food sub- taxes
are easier to administer in the short runsidies have had on it especially since procurement prices in Egypt are usually announced shortly before the
procurement season beginsDeterminants of the Burden
As the time series of the implicit producershyconsumer transfers on the major food com-
Because Egyptian policymakers give high modity markets show explicit food subsidies
priority to stabilizing domestic agricultural evolved out of a system of implicit consumer
prices and food prices in particular it subsidies largely financed by agriculture (see
seems obvious that instability in international Tables 13 14 and 15) The skyrocketing
prices would contribute to fluctuations in budget for the system after 1973 is astonishing So would govern- only if the implicit subsidies of earlier yearsthe producers burden
ment interventions in crop allocation pro- are ignored 11igh population growth high curement and input subsidization Gov- income growth and weak performance of ernment quotas on imports and exports add agricultural production suddenly induced a to the burden by affecting domestic open rapid decrease in self-sufficiency How did market prices Each of these factors reflects agricultural policy react the amount of resources available to the If stabilizing the prices of subsidized
and rationed commodities were a fixed obshygovernment and the goals set for develop-
72
Figure 15- Producer losses and gains on commodity markets and aggregate netburden 196580
1975 LE Million
2000-
Otton 1500
1000x G Meat milk feed (gains)
500- rains pulses
4j- Total burden
1965 1970 1975 1980Sources These are aggregated results of partial equilibrium models of the indicated markets calculated from dataprovided by the Egyptian Ministries ofAgriculture and Supply and the Central Agency for Public Mobilizationand StatisticsNotes The total burden isthe sum of the losses from taxation minus the gains from protection on the markets Theamount a commodity contributes to the burden is the distance between its line and the line below it(not
contribution ofmeat milk and feed lies above the total burden line it shows again from meat milk andfeed (which isdeducted from the burden) When that shaded area isbelow the total burden line it shows aloss from meat milk and feed Similarly when the line for sugar is below the line for grains and pulses the
the distance from the horizontal axis except for grains and pulses) When the shaded area representing the
shaded area represents again from sugar and when it is above it shows a loss from sugar Grains and pulsesand cotton always show losses Table 28 - Components of the burden on agriculture 1965-80
Year Wheat Maize Rice Meat MilkBeans Lentils and Feed Sugar Cotton
(percent)1965 61 112 180 34 031966 -1269 129 209 52 60 557 1967 87 114 336
04 -01 555-1915 031968 36 106 340 19 04
-98 -39 580 1969 31 83 27 -34 502243 21 031970 2550 120 170 14 57622 021971 -3854 78 145 15 06
34 637 1972 47 29 -26 69789 132 191973 108 07 43 03113 174 65530 241974 72 77 351 06
27 83 440 1975 78 88
07 -72 167 390406 101976 100 114 352 06 -104 117 39617 091977 -23043 20 197 27 70 564
1978 04 -25071 62 436 18 06 95001 -5801979 180 202 400 -53 104233 011980 -541 -19193 41 742374 23 02 -730 242 854
Sources These are aggregated results of partial equilibrium models of the indicated markets calculated from dataprovided by the Egyptian Ministries ofAgriculture and Supply and the Central Agency for Public Mobilizationand StatisticsNotes All rows add up to approximately 100 which equals the total burden Subsidies for inputs other than feedsuch as fertilizers and pesticides reduction of the burden
are included In the models for specific crops Anegative number indicates a
73
jective the government had in principle all the instruments necessary to reduce the budgeted subsidy expenditures by increasing implicit taxation of the agricultural sector But the government would not apply them if self-sufficiency were the dominant goal In that case an increase in explicit food subsidies might be the consequence of efforts to reduce implicit taxation of agriculture in order to increase domestic food output In this sense there is an inherent conflict be-tween short-term fiscal objectives and self-sufficiency objectives It is basically the production effects of pricing that determine an optimal long-run solution of this conflict
Aregression model is used here to assess more comprehensively the role of each of the contributors to the total burden The model evaluates the hypothetical effects on the agricultural burden of the three objec-tives outlined above to isolate domestic prices from international price fluctuations to generate public revenues and to reduce explicit food subsidies Aquantitative speci-fication for year t is
TBt = f(Pntt Rt Ft) (17)
where
= total burden on agriculture(as definedTBt in equation [161) multiplied by (-1)in 1975 prices
Pnt t = international price index of agricul-tural commodities imported toex-ported from Egypt (196566 average = 1)
Rt = government revenues in 1975 prices and
prices increased the burden on agriculture by 13 percent A10 percent increase in total government revenues had the opposite efshyfect it reduced the burden by 16 percent I15
The impression that explicit food subsidy policies did not increase the burden on agrishyculture is supported by the model results The estimation results also reveal how imporshytant increased revenues from other sources were in the rapid decrease of the burden Growing revenues not only reduced the burden induced by price policy but they were also used to support agricilture through public investment (see Chapter 5)
The results do not indicate that agriculshytural policy is being revised as part of an economic strategy that emphasizes agriculshyture more and industry less They simply show a general shift in this direction The opening of the economy after 1973 affected agriculture only by generating government revenue However it is not unlikely that if government revenues get tight again agrishycultural policy will be redirected to increase the burden on agriculture
The basic findings from the regression model apply not only to commodities as a whole but to basic food commodities as well as Table 29 shows Food subsidy expendishytures seem to induce hgher burdens for these commodities but again the parameter is hardly statistically significant Yet it seems possible that the governments actions to reduce the drain from the budget are particushylarly concentrated on those commodities that induce the food subsidy outlays But if these actions have any importance at all it is only a minor effect on agricultural incomes
The full effects of price subsidy and procurement policies do not show up in the
official budget as explicit food subsidies An =food subsidy expenditure as budgetedin 1975u icesf baggregation of all positive and negative
budget effects on the commodity marketsin 1975 prices shows these effects more completely In addition to food subsidies the export taxesThe results in Table 29 show that for cotton and rice are included here as wellfactors representing the domestic price sta-
bilization objective and the availability of as some of the procurement costs which were neglected in examining the officialgovernment revenues dominate changes in subsidy budget Fiscal costs generated conshythe burden The effect of budgeted food sistently in the welfare analytical frameworksubsidies on the change in the total burden are used in the aggregation which is basedis not statistically significant A 10 percent
rise in the index of international agricultural on the following equation
Is These Implicit elasticities are calculated at mean values from 1965-80 and parameters estimated with equadon (17)
74
Table 29- Determinants of changes in the burden on agriculture
DepenshydentVariable Independent Variables F DW
TB - 10270 +7698 P - 08404 R+ 03633 F 2210845 218(354) (-741) (052)
FB - 4689 + 5823 P1 - 06080 R + 06698 F 0899 355 232(438) (-878) (158)
TB - 3496 + 10110 Pin- 051 R -2236 A 0904 377 204 (916) (-364) (-281)
GBI - 2044 + 10430 Pt - 05190 R- 2452 A 0912 416 202 (916) (-364) (-281)
Notes TB is the total burdc (implicit taxation) on agriculture In 1975 prices multiplied by(-]) FB is the burdenon basic food commodities markets (wheat rice maize pulses and sugar) GB is Y2 with public expendishytures on agriculture subtracted Plt Is the international price index of agricultural commodities imported tonr exported from Egypt R is total government revenues in 1975 prices F is food subsidy expenditures asbuuls-4 in 1975 prices and A Is net budget spent on agricultural commodities as computed with the partialequilibrium models (sum of government expenditures minus revenues for procured quantities sold on thedomestic market for procured quantities being exported and for Imports sold on domestic markets)
=t R (Bpr Bex t+ B mt) (18) The explicit food subsidy variable (F)is
replaced with this budget effect variable (A)where in the equations for TB (see Table 29) Inequation (19) government outlays for agri-At = the net increase of the budget spent culture are combined with agricultureson agricultural commodities burden for a more complete picture of the
Bprc t = net budget expenditures for procured relationship between agriculture and the restof the cconomy It might be argued thatquantities being sold on the domestic parts of the current expenditure budgets ofmarket (net revenues are negative) the agricultural minisLries have little to do Bt -net budget expenditures for procured with the agricultural income as they arequantities being exported (which mainly for employment in agricultural adshyusually are negative representing ministration and may have little effect onexport tax revenues) production However research and extenshysion personnel atid those who manage theBImt net budget expenditures for imports investment and input provision programssold on domestic markets (which are and the water system cannot be separatedmostly rationed and subsidized com- from those less directly concerned withmodities which means this variable production Thus the total agricultural budgetalso includes explicit food subsidies) comprising investment (AI) and current
and expenditures (AC) is deducted from the total i the index for commodities (wheat burden for the following analysis16
rice maize beans lentils sugarcotton and meat) GBt = f(Pint Rt At) (19)
116The Input subsidies are already deducted from theburden so they are not included as exogenous determinants
75
where
GB = TB - Al t -AC
Again the results in Table 29 show how important domestic price stabilization is and how revenue affects the burden More-over the higher the governments net ex-penditures for interventions in the agricul-tural commodity markets (A) the lower the general burden (GB) This supports the hypothe5 s that the burden was reduced as government outlays for food subsidies and agriculture as a whole increased Self-suffi-ciency and income support objectives also seem to support this hypothesis This means that the rising food subsidy bill either had no effect on the burden on agriculture or perhaps reduced it
Conclusions and PolicyImplications
Egypts current food subsidy system did not spring from one decision made in the early 1970s even though it was then that the huge fiscal outlays which characterize it be-gan It evolved from existing agricultural and consumer price policies that were im-plemented a long time before These policies included export taxes to finance the industrial growth strategy adopted and implicit transfers of income from producers to consumers-implicit food subsidies to finance the cheap food prices Given this background it is not surprising that Egypt moved to an explicit food subsidy scheme as the self-sufficiency of major commoaities that were implicitly subsidized (such as wheat) decreased rapidly Indeed a major change in consumer price policy would have had to occur for Egypt not to have drifted toward an explicit subsidy system in the 1970s as the time-series analy-ses for the relevant food commodity markets show
The course that Egypts food policies have taken provides an important lesson for countries keeping producer prices low to support consumers Supply and demand pro-jections show that many of these countries
are going to become net importers of food in the years ahead 17 If they have rather plenshytiful nonagricultural resources-as Egypt had mainly because of its rapidly developed oil reserves the Suez Canal and foreign assistance-it seems fair to predict that many of these countries are going to drift from implicit to explicit food subsidy schemes as Egypt did But when this happens tight budgets will make severe internal distribution conflicts unavoidable These countries will have to know more about how to revise their food pricing systems and still ensure nutrishytional well-being
Another issue is raised by the conclusion that in spite of rising budget outlays for food subsidies the income burden on farm production has been steadily reduced This reduction was the result of several factors including changes in procurement policies adjustments of prices and price ratios and variations in interventions in agricultural trade It was particularly a result of rising prices in domestic open food markets In the course of the 1970s agriculture financed low copsumer prices less and the general taxpayei financed them more Agricultures contribution to the system decreased in absolute terms This means it may not be concluded that consumer subsidies always burden agricultural production In Egypt the systems expansion by and large did not However it was possible to shift from the implicit to explicit subsidies only because government revenues increased Foreign assistance had its part in that
It has been shown that in the early years of exploding food subsidy outlays public investment in agriculture already disproshyportionatly low was reduced further In recent years more funds have been allocated to promote production of those crops whose output has lagged the most behind demand This suggests that the countries with cheap food price policies may find themselves under pressure to promote agricultural proshyduction Research forecasting how producshytion and demand develop in specific counshytries may help those countries to make their policies more timely so that production can keep up with demand This could help counshytries to avoid exploding food subsidy proshygrams as in Egypts case
I 7 International Food Policy Research Institute Food Needs ofDeveloping Countries Projections ofProductionand Con sumption to 1990 Research Report 3 (Washington DC IFPRI 1977)
76
It has to be emphasized that the burden on the income of Egypts farm producers was not reduced primarily by streamlining price distortions in agriculture Policy changed partly because of increased sub-sidies on inputs so that implicit taxation of basic food commodities was reduced and livestock production was increasingly pro-tected The major inefficiencies in allocation were inherent in Egyptian agricultural policy before the budget outlays for food subsidies began to expand in the 1970s118 The net social loss in the production and consump-tion of all the commodities considered in this study accounted for 15 percent of na-tional income in 197980 But the increase of the explicit subsidy expenses alone can-not be held responsible for these costs the total sum of theses ial costs resulted from distorted prices as the price policy analysis demonstrated The bulk of the social costs resulted from the protection of livestock pro shyduction the taxation of cotton and depressed cereal prices only the latter being partly a result of explicit and implicit food sub-sidies As in many other countries Egypts agricultural policy has yet to remove distor-tions in agricultural price ratios and in the terms of trade between agriculture and the rest of the economy at least insofar as the development strategy does not require that part of the agricultural surplus be taxed indirectly A removal of price distortions
might be neded if agriculture is to grow more rapidly But as the analysis of supply response has indicated it may not be enough The rigid constraints on resources deficits of public water and input supply manageshyment and the inefficiency of the agricultural extension service tend to offset the incenshytives price adjustments give for growth Price policy should not be viewed as a panacea for Egypts rural development and national food problems
Although increasing producer prices while keeping subsidized consumer prices steady might not increase agricultural proshyduction significantly it might still affect rural income growth through multiplier efshyfects that stimulate production and emshyployment in nonagricultuial rural sectors
The expansion of the food subsidy and rationing scheme into rural areas in recent years has increased the transfer of income to both the farm and nonfarm populations in rural areas Support for producer prices would add to that increase More microecoshynomic analyses could improve the undershystanding of these linkages between sectors and regions and their repercussions on agrishyculture Such knowledge might contribute to the design of a comprehensive food policy favoring immediate improvements in nutrishytion and growth of rural income as well as easing the adjustments a developing economy needs to make in the longer run
118See Hansen and Nashashibi Foreign Trade Regimes and Economic Development Egypt for the agricultural price polshyicies in the 1950s and 1960s
77
APPENDIX 1
SUPPLEMENTARY TABLES
Table 30- Net returns of major crops 1965 -80
Rice Cotton Long Berseem Short Berseem Year Wheat Maize
(LEfeddan) 324292 676
1965 88 79 39 97 634 306
1966 168 160 85 610 295
1967 98 183 187 252 313 17135648 100 2031968 209
37 160 199 484 400 1969 189 1970 195 199 186 272 354
230448309181 200 158 469 338 181
1971 188 252 1341972 373769341167 449353 9231973 321 356 202 4244591974 396778317284279 959 4751975 430 252 607266 222 5931976 449 1195404i977 507 542 752820 1480743 386 586 7221978 1231 1427585 187 640 9461979 1078 1900282 830 4661980
Source Calculated from data provided by the Egyptian Ministry of Agriculture
The net returns are calculated as yield times price plus the value of by- products minus the cost of production Note
The cost of production includes labor wages and land rer
returns of major rotations 1965-80Table 31 -Net
Short BerseemLong Berseem Long Berseem CottonMaize
Year WheatMaize WheatRice Rice
(LEfeddan) 616
1965 167 127 715 795 403 755
7192541966 329 793 5477982751967 270 413 5275162511968 148 560 6945991969 197 236 4625535403811970 394 5386476053381971 380 6505904733231972 440 71411229364881973 674 1279 87311256611974 815 713105710617147101975 1082118112111976 488 518 1042173815999111977 1049 572186720671978 1130 1329 i9531614 1979 771 1225 2067 20242731748 23651980 1112
Source Calculated from data provided by the Egyptian Ministry of Agriculture
The net returns are calculated as yield times price plus the value of by- products minus the cost of production Note
The cost of production includes labor wages and land rent
78
Table 32-Calculation of border prices at farm gate for wheat 196580
Import Uot Foreign ExchangeYear Value Marketing Cost Bias Border Price
(LEmetric ton) 1965 320 36 337 6931966 300 42 333 6751967 310 42 305 6571968 270 42 248 5601969 270 42 295 6071970 299 42 332 6731971 277 48 254 5781972 283 48 242 5731973 632 48 461 11411974 885 54 558 14971975 731 60 596 13871976 601 66 538 12061977 472 72 397 9411978 524 84 441 10491979 1253 90 94 14371980 1497 114 258 1869
Sources The import init values for 1965-69 are from the Central Agency for Public Mobilization and Statistics andthe values or 1970-80 are from the Egyptian Ministry of Supply The marketing costs are from Black andVetch International Master Plan for the Development of Egyptian Storage duid Distribution System forFood Grains paper prepared for the General Authority for pply Commodities Cairo 1978Notes The foreign exchange bias was calculated from the official and shadow exchange rates (see Table 6) Theborder price is the sum of the import unit values marketing costs and foreign exchange bias
rable 33-Calculation of border prices at farm gate for rice 1965-80
Export Unit Processing Foreign ExchangeYear Value Marketing Cost and Milling Bias Border Price
(LEmetric ton) 1965 623 75 26 656 12301966 652 82 26 724 13201967 696 82 20 684 13181968 814 81 20 746 14991969 731 84 22 797 14661970 530 87 21 588 10521971 495 90 21 454 8801972 501 91 20 428 8581973 907 95 20 662 14941974 2914 106 31 1837 46771975 2384 116 32 1944 42441976 1540 128 41 1380 28331977 1082 144 42 911 18901978 1367 160 38 I150 23961979 2324 176 47 175 23701980 2512 216 94 432 2823
Sources The export unit values for 1965-69 are from the Central Agency for Public Mobilization and Statistics andthe values for 1970-80 are from the Egyptian Ministry of Supply The marketing costs are from Black andVetch International Master Plan for the Development of Egyptian Storage and Distribution System forFood Grains paper prepared for the General Authority for Supply Commodities Cairo 1978 Notes The foreign exchange bias was calculated from the official and shadow exchange rates (see Table 6) The
border price is the sum of the export unit values marketing and processing costs and foreign exchange bias
79
Table3- Calculation of border prices at farm gate for beef 1965 -80
Year Import Unit
Value Marketing Cost Foreign Exchange
Bias Border Price
(LEmetric ton) 1965 329 199 3466 69551966 282 217 3130 61671967 251 219 2467 51961968 198 216 1815 40111969 216 223 2356 47391970 233 231 2587 51481971 309 238 2833 61611972 242 243 2069 47321973 465 254 3393 82971974 416 281 2623 70641975 300 309 2447 57561976 323 340 2895 64651977 471 383 3965 90581978 436 426 3670 84561979 1173 469 882 130811980 1128 575 1942 13797
Sources The import unit values for 1965-69 are from the Central Agency for Public Mobilization and Statistics andthe values for 1970-80 are from the Egyptian Ministry of Supply The marketing costs are from IbrahimSollman Red Meat Price Policy in Egypt Economics Working Paper62 Agricultural Development SystemsProject Ministry of Agriculture Cairo and the University of California-Berkeley Cairo 1982 Notes The foreign exchange bias was calculated from the official and shadow exchange rates (see Table 6) The
border price is the sm of the import unit values marketing costs and foreign exchange bias
80
APPENDIX 2 THE CALCULATIONS OF THE EFFECTS OF GOVERNMENT INTERVENTION IN SELECTED MARKETS
The effects of government intervention Pdis - the price for quantities distributedin the wheat rice red meat and feed markets by thi governrrent (subsidized or wce discussed in Chapter 6 The calculations ratioiled)of those effects are described here s
The price elasticities of demand used are - second tier subsidizedrationed for wheat -013 for rice -001 for maize price (or urban free price) -0 13 for beans and lentils -038 for sugar t1111 - the domestic price paid by the farmer -040 for red meat -072 for milk -084 Pfe - the free market consumer priceand for cotton 020 The wheat price elasshyticity is a weighted average of estimated co- Pfe - the free market producer price (atefficients for wheat grain bread and flour the farm gate) The elasticity for cotton is not based on an Pnt - the border price equivalent at theestiration result it is an informed guess shadow exchange rate All were calculated from disaggregated reshysuits in the annex to Joachim von Braun Pnt - the border price equivalent at the A Demand System for Egypt official exchange rate
The abbreviations used in this appendix PpPrc- the procurement pricefollow Qdem - the quantity consumed domestically
(production trade waste indusshytrial use change in stocks animal
B - increase in the governments bud- feed with seed for the crop subshyget because of exports tracted)
Bim - increase in the governments bud- Q1i - the quantity distributed by the govshyget because of imports ernment (rationed and subsidized)
Bpmc - increase in the governments bud- Qf = the quantity of feed of commodity i get because of procurement and Qre - tha quantity marketed on the opendistribution market
Blt - total increase in the governments Qhum - human consumption of maize and budget sorghum estimated from family
G - income transfer from or to con- budget surveys and consumption sumers by governmentdistribution projected to 1980 from the per capitatrend of 196465-197475 Gre - income transfer from or to con- trentityi196 te6 netip475 sumers in the open market thequantityimported(net imports)
- income transfer from or to producers Qime - the quantity of feed importedin the open market Qnd - the quantity used by industry
GP - income transfer from or to producers Qprc - the quantity procured from domesP from procurement tic production
Goc - net social loss in consumption Qpd - the quantity produced domesticallyGP - net social loss in production - the change in stocks Gc - total consumer loss or gain Qse the quantity used as seeds
GPIt - total producer loss or gain Q K - milling and handling costs for feed Qstr - the quantity of starch units in conshy
mix production centrates (c) or roughage (r) m - marketing and handling costs per Q - the quantity wasted
unit S - input subsidies per unit
81
tfPre - the tax rate on the producer price
- the tax rate on the consumer pricetf e
ns - the price elasticity of supply (for the definition see Chapter 6) and
nd - the price elasticity of demand
Wheat Rice and
Red Meat Markets
The calculations of the effects of govshy
ernment intervention in the wheat market are based on the following set of equations
Producer loss or gain from procurement
1 G~ (P c+ S- Pi) -QprG
Producer loss or gain in free market sales
GfPe = (Qprd - Qprc) (Pire +
Net social loss in production
G -P 2 (tpfe)2 so
The producer loss or gain
S - PntI
GP - G~p + GP - G77 C
Consumer loss or gain from governmentwheat distribution
Qjemn- Qprd + Qim - Qind - Qse - Qw - QThe
and
Gd-c- (Qdem - Qprd + Qprc (Pint - Picre)
Consumer loss or gain in free market purshychases
Gre = (Qprd - Qprc) (P - P~J
Net social loss in consumption
G -coc12 (te)2 d Qden - Pe--
p P putation results of the model are avaiablefrfrom the authors They are adjusted for ex-
Total consumer loss or gain
G s + G - G o
Increase in governments budget from proshy
curement and distrtbution
Bpc Qprc (Pc + m - j
Increase in governments budget from the subsidized distribution of imports (calshyculated at the official exchange rate)
Bim = Q1m (P nt + m - Pds)
Total budget increase
Bprc + Bim
The calculations of the effects of governshyment intervention in the rice and red meat markets follow the same logic as those for wheat The other markets discussed in Chapshyter6 maize pulses sugar cotton and milk are similarly modeled The details and comshy
ports milling and other utilization ratios for the commodity For some commodities GP or G1sis zero The results for these marshykets are given in Tables 35-37
Feed Market Analysis
analysis of the feed mdrket has four parts The first the data used to determine the demand for feed is given in Table 38 The second the total feed requirement is given in Table39 The other two parts are the calculations of the supply of feed and of feed subsidies
Calculation of Feed Supply
The supply of the by- products of milling and processing wheat bran rice bran and cottonseed cake is given by
QfeI = e (Qpdi + QIm- Qind1023
Qsei- Qsci) + QInfe
82
Table 35-Model computations for the wheat market 1965-80
QP Qdtm 0d 0fiYear qQi Ob
(1000 metric tons)
1965 1966 1967 1968 1969 1970 1971 1972 1973 1974 1975 1976 1977 3978 1979 1980
12716 14659 12905 15176 12690 15171 17301 16151 18383 18845 20325 19600 16973 19330 18560 17960
23260 21270 28170 22690 27060 25680 27820 26820 31715 35478 39140 37095 44531 55640 49056 55996
2290 2580 2490 2830 1346 1821 2856 2411 2824
94 3816 3012 1385 1275 2893 1252
32936 29169 33495 31586 43310 45551 36793 4222 1 46838 48153 46005 50705 55134 68430 66016 68986
22510 i090 2 380 19240 31966 32201 22346 28481 31279 32902 29496 34117 39546 50375 50349 52278
10426 12079 10415 12346 11344 13350 14445 13740 15559 35251 16509 16588 15588 18055 15667 16708
Year GP G9 GGPM Gdi Gce
LE nallion)
1965 1966 1967 1968 1969 1970 1971 1972 1973 1974 1975 1976 1977 1978 1979 1980
-03 -102
-96 -86 -47 -67 -79 -62
-228 -365 -312 -194 -49 -56
-199 -125
-373 -330 -190
-87 -268 -359 -294 -267
-1042 -1331 -155
-945 -353 -267
-1008 -1539
-100 -91
47 08
-75 -300
-88 -74
-266 -335 -274 -209
-59 29
-224 -323
-375 -342 -333 -181 -240 -325 -285 -255
-1004 -1361 -3193 -931 -342 -351 -984
-1341
896 649 823 452 903 1321 568 707
2498 3469 2786 2603 1973 2935 4888 6991
347 288 139 22
206 282 223 214 999
1357 1234 1038 438 354
1099 1620
Year Yea GGHi Geurolo Bprc 111m Btot
(LE million)
1965 1966 1967 1968 1969 1970 1971 1972 1973 1974 1975 1976 1977 1978 1979 1980
66 25 07 00 22 29 13 16
252 408 261 222
43 20
287 469
1177 912 952 473
1085 1374
76 90 5
3246 4418 3758 3418 2387 3289 5700 8142
-04 05 03
-10 -04
02 04 07 09 29 67 51 28 27
102 54
141 300 143 -29 -34 42 01 17
1071 1760 1363 832 451 728
4300 6046
137 104 144 -39 -39 44 05 24
1079 1789 1430 883 479 815
4403 6101
83
Table 36-Model computations for the rice market 1965-80
Year QA QOex Qprc dem Qdls Qffe
1965 1966 1967 1968 1969 1970 1971 1972 1973 1974 1975 1976 1977 1978 1979 1980
17869 16749 22755 25827 25570 26030 25357 25124 22706 22389 24279 23000 22720 23510 25110 23840
311 311 419 555 762 646 480 433 293 136 102 208 221 146 175 100
(i000 metric tons)
894 8483 839 8774
1156 8719 1322 9205 1342 8999 1154 9529 1068 10459 1021 10785
925 10742 866 11858
1166 12477 1086 12555 1054 11427 1107 12665 1305 13362 1222 13328
2548 2200 3126 2817 874 844
1959 2132 2924 4121 6360 4793 4461 5546 6510 6735
5935 6574 5592 6388 8125 8685 8499 8653 7818 7737 6117 7761 6966 7118 6853 6594
Year GPC GKe GPoc GPot Ges Gfe
1965 1966 1967 1968 1969 1970 1971 1972 1973 1974 1975 1976 1977 1978 1979 1980
-520 -539 -663 -912 -902 -474 -321 -288 -626
-2264 -2617 -1354 -684 -907
-1052 -1214
-446 -378 -465 -591 -693 -486 -341 -337 -803
-3472 -2779 -1486
-696 -963 -866
-1063
(LE million)
140 -1105 119 -1036 150 -1279 193 -1696 232 -1827 142 -1103 98 -760 92 -717
211 -1640 872 -6607 816 -6211 422 -3261 187 -1567 267 -2136 264 -2183 324 -2601
238 205 183 273 133 64 82 91
326 1710 2380 1114 612 965 923
1205
472 471 366 469 725 451 304 309 746
3134 2178 1571 694 937 840
1016
centC
Year GcO 0Gtot Bprc Bex Btot
1965 1966 1967 1968 1969 1970 1971 1972 H3 19I4 1975 1976 1977 1978 1979 1980
06 03 02 03 O 02 01 01 08
145 108 29 05 09 ()8 10
705 672 547 739 853 513 385 399
1063 4699 4450 2655 1300 1893 1755 2212
(LE million)
-14 -45
-107 -75 -10 -07 -15 -09 -12
16 133 142 128 247 119 156
80 87 87
181 185 24 00 01
119 317 170 138 42 32
204 120
-94 -132 -194 -256 -194 -32 -15 -11
-130 -301
-37 04 87
215 -85 35
84
Sources and notes for Tables 35 and 36
Sources Calculated from data provided by the Egyptian Ministries of Agriculture and Supply and the Principal Bank for Development and Agricultural Investment
Notes Qrd Is the quantity of paddy produced domestically Q1 the quantity imported Qxthe quantity exportedQ~o the quantity procured from domestic prodution Qdem the quantity consumed domestically Qdisthe quantity distributed by the government and Qr the quantity marketed on the open market Gpt is the Income transfer from or to producers from procurement G the income transfer from or to producers in the open market GP the net social loss in production and GiPot is thethe total producer lorz or gain Gcdjsincome transfer from or to consumes by government distribution Gfce the Income transfer from or to consumers in the open market Gcoc the net social loss in consumption and Grtthe total consumer loss or gain Bprc is the increase in the governmers budget because of procurement and distribution Bim the increase in the budget because of imports Be the increase in the budget because of exports and Bratthe total increase in the budget
Table 37-Model computations for the beef market 1965-80
Year Qprd Qdem Qim GFe GPoc GPot
(1000 metric tons) (LE million)
1965 241 296 55 -972 82 -1053 1966 284 338 54 -884 190 -1074 1967 332 359 27 -690 53 -744 1968 348 371 23 -275 05 -280 1969 340 363 23 -422 13 -435 1970 1971
295 282
330 321
35 39
-415 -678
14 52
--429 -730
1972 291 325 34 -235 04 -238 1973 313 354 41 -1230 226 -1456 1974 326 396 70 -720 33 -754 1975 1976
337 302
386 400
49 98
190 348
01 03
189 345
1977 323 394 71 -127 00 -128 1978 337 447 110 282 02 280 1979 326 408 82 -906 23 -929 1980 336 448 112 417 02 415
Year GGd G Gl Bi
(LE million)
1965 682 122 207 597 -69 1966 486 34 80 440 -135 1967 251 -11 17 224 -78 1968 -25 -38 00 -63 -80 1969 176 -12 08 156 -66 1970 07 -44 00 -37 -135 1971 167 -33 07 126 -144 1972 -330 -98 26 -454 -168 1973 590 08 71 527 -131 1974 -06 18 00 13 -165 1975 -885 -51 114 -1051 -171 1976 -1457 -33 297 -1787 -317 1977 -1041 160 120 -1001 -121 1978 -1357 182 209 -1384 -222 1979 -73 515 01 441 443 1980 -1716 784 223 -1155 566
Sources Calculated from data provided by the Egyptian Ministries of Agriculture and Supply and the Principal Bank for Development and Agricultural Investment
Notes Qp~d is the quantity produced domestically Qdjm the quantity consumed domestically and Qj the quantity imported (net imports) Gil is tne income transfer from or to producers in the open market GPOC the net social loss in production and G gain G is the income transferthe total producer loss or
aiomor to consumers in the open market GiI5 the income transfer from or to consumers by government distribution G the net social loss in consumption and GtOthe tota consumer loss or gain Bm is the Increase in the governments budg( t because of imports distributed at the subsidized price
85
Table 38- Energy demand per unit of livestock apd livestock numbers selected
years Livestock
Total StockEnergy Share of
1965 1970 1975 1980Demand Total StockType of LivestockAge
(1000 starch (percent) (1000 head)
unitsyearhead) 2102 212009075 1000 1608 2115
Over 2 years 11 516
1 - 2 years
Cattle
084 282
Less than 1 year 051 202 23791277 1000 1617 2009 2204
Over 2 years 1544 637 I - 2 years 095 207 Less th I year
Buffalo
062 155 0243 100 1 2642 3221 3247 4189
Sheep and goats 30146 170 56 35 29Horses
219 10 15 127 1O5 100 Camels
073 1000 I18 1392 1533 1500Donkeys
(1000 metric tons)
25 1000 86 96 110 123 Poultry
35 1000 40 50 60 77 Eggs
Sources Data on energy demands of livestock are taken from Alois Grosse-Rueschkamp Optimal Planning of
Feed Mix Industries in Egypt (PhD thesis University of Bonn 1979) (In German) The age distribution
of livestock is taken from James D Fitch and Ibrahim Soliman -The Livestock Economy in Egypt An
Appraisal of the Current Situation Cairo 1982 (mimeographed) The data on total stock comes from
Egypt Central Agency for Public Mobilization and Statistics
This figure is in 1000 starch units per year per metric ton
Table 39- Total requirements of feed 1965 -80
Other Livestock TotalPoultry and Eggs Cattle and Buffalo RequireRequire- Share of Require- Share of Require- Share of
Total mentsTotal mentsYear ments Total ments
(1000 metric (percent) (1000 metric(1000 metric (percent) (1000 metric (percent)
tons of tons of tons of tons of starch units) starch units)
starch units) starch units)
1965 3550 61 35240 605 19377 333 58167
1966 3825 64 35810 602 19822 333 59457
1967 4100 67 36370 598 20284 333 60755
1968 4105 60 43486 645 19787 293 67378 299 68778
1969 3995 58 44171 642 20612
1970 4150 59 44806 638 21280 302 70277 4 445 644 20811 294 70561
1971 4305 61 t
6110 640 21402 297 720121972 4500 62
295 76311973 4580 63 46564 641 21487
294 732311974 4710 64 46938 640 21582
295 738721975 4850 65 47218 639 21804
293 743121976 5080 68 47418 638 21813
292 7485747520 634 218621977 5475 73 302 76914
1978 5430 70 48201 626 23283 301 78031
1979 5610 71 48904 626 23516 300 79143
1980 5770 72 49616 626 23757
Sources Calculated from data provided by the Egyptian Ministry of Agriculture The amounts required per head
were taken from Alois Grosse-Rueschkamp Optimal Planning of Feed Mix Industries in Egypt (PhD
thesis University of Bonn 1979) (in German)
Note The calculated total requirements deviate from the toto supply calculated in Table 40 because of difshy
ferences in the estimation procedures for supply and Yequirements
86
where i equals 1 wheat bran 2 rice bran or 3 cottonseed cake and e equals the extracshytion rates of the by-products The extraction rate for wheat-the wheat milling rate-as calculated from data provided by the Ministry of Supply and Honie Trade w-Ii 083 in 1965 090 in 1966092 in 1967 and 1968 088 from 1969 to 1972 082 in 1973 and 1974 and087 from 1975 to 1980 The rice bran extraction rate was 0062 and the cottonseed cake ex-traction rate was 044 percent Raw paddy contains 14 percent husk the rest yields9 percent bran 80 percent of which is used for feed and 20 percent ofwhich is processed into bran oil Raw cotton contains 64 per-cept seed of which 69 percent is processed into cottonseed cake
The supply of maize sorghum and bar-ley for feed is calculated by
Qfei = Qprd1 + Qimi - Qind
Qw - Qsei - Qsci - QhumI
where i equals 4 maize 5 sorghum or 6 barley
Human consumption is estimated using data in family budget surveys for rural and urban per capita consuniption (ci and Cu)multiplied by population (POP or POPu) The consumption figures between the family budget surveys (196465 and 197475) are interpolated and the figures are extrapolated to 1980
cit = POPt - Crit + POPu t - Cujt
where t equals 1965 1980 and i equals4 (maize) or 5 (sorghum) The figures for the human consumption of barley were taken from Food and Agriculture Organization of the United Nations FoodBalanceSheets1965-80 (Rome FAO 1982)
The supply of berseem is given byT
Qfe =j yieldj bullarea
where i equals 7 berseem and where yield is the yield of long season berseem(j equals 1 22 tons per feddan) short season bershyseem (j equals 2 97 tons per feddan) and seed berseem (jequals 3 195 tons per fed-dan) and where areaj is the area of these same three types of berseem
Similarly the supply of straw is given by
4 = straw area
where i equals 8 straw and where straw is is the yield of straw from wheat (j equals 1 168 tons per feddan) barley (j equals 2 122 tons per feddan) beans (j equals 3 11 tons per feddan) and lentils (j equals 4076 tons per feddan) and where area is the area of these same four sources of straw
Green fodder of maize is a by- product of maize production obtained by stripping the staks of their green leaves The yield is asshysumed to be 043 tons per feddan of maize so the supply of green maize leaves is given by
Qfei = 043 area1
where i equals 9 green maize leaves These components of total feed supplies
are aggregated using the units of starch they contain as weights The total starch units in concentrates are given by
Qc= 049bull QfeI + 023 Qfe
+043 Qf0 + 081 Q +074 Qim 4
(Qfe4 - Qim4) + 06 - Q-5 +072
Qf6
The total starch units in green fodder roughshyage are given by
Qscr = 008 bull Qfe7 + 0145 SQfea+ 01 Qfe9
and the total supply of starch units is given by
Qst = QstC + Qstr
The results of the calculations of the
feed supply are given in Table 40
CalcuIation of Feed Subsidies The subsidi on feed mix is given by
S s (Pnt pP i t= - disi
where i equdls 1feed mix The data for QdiI come from the Principa Bank for Developshy
87
Table 40- Feed supply 1965-80
Major Feed Components Total Supply
Year Wheat
Bran Rice Bran Maize
Sqrghum and
Barley
Cottonshyseed Cake Berseem
Concen-trates
Fodder and Roughage Total
(1000 metric tons) (1000 starch units)
1965 1966 1967 1968 1969 1970 1971 1972 1973 1974 1975 1976 1977 1978 1979 1980
4069 2240 1976 1943 3859 4288 2853 4170 7273 7194 4848 5586 5969 7026 6815 7345
1139 1168 1269 1450 1633 1571 1500 1486 1344 1299 1327 1438 1340 1388 1485 1408
7875 9785 9470
10390 10736 11671 10673 12162 12934 15876 17778 21916 21181 28079 23903 29478
3113 3786 4215 5102 4964 5432 5805 5562 5596 5403 5483 5590 4891 5589 5267 5552
6303 5401 5251 5289 6513 6055 6192 6176 5758 5222 4375 4487 4994 5272 5326 6157
419756 433520 476741 487198 495817 490522 509751 516657 507663 512665 521397 522320 535593 536991 532987 522651
11629 11593 11103 11982 13534 14206 12753 14702 16512 18583 18670 22231 28082 28082 24740 29788
37453 38853 42041 43304 43601 43230 44810 45254 44457 45099 45898 46017 46626 47107 46788 45816
49081 50447 53148 55286 57135 57436 57563 59956 60969 63681 64568 68248 68708 75189 71528 75604
Sources These are calculated from data provided by the Egyptian Ministries of Agriculture and Supply and the
Central Agency fo Public Mobilization and Statistics
Note The calculated total supply deviates from the total requirements calculatedampin Table 39 because of differshyences in the estimation procedures for supply and requirements
ment and Agricultural Investment In cal- ponents of concentrates not included in the
culating Pint i the average composition of all feed mix were calculated using this equation
feed mix was assumed to eq-ial the composishytion for cattle Pint i was calculated using the S= (QfeI- a Qdlsl (Pinti- Pd i) formula
where i equals 2 cottonseed cake 3 wheat6 bran 4 rice bran and 5 maize and jequals
PintI = ajlPinti+Kl 1 cottonseed cake 2 wheat bran 3 rice bran and 4 maize It isassumed that the price
where j equals 1 cottonseed cake 2 wheat of minerals and molasses are free from disshybran 3 rice bran 4 maize 5molasses and tortion 6 minerals and where a is the time variant The subsidy of berseem is given by share of feed component j in the total feed mix The shares for 1965 and 1980 are listed
Si = Qfe int7 - Pfte)below as examples 1965 1980
055 028a1 030 030 where i equal 6 The international equivashy
a 2 010 004 lent price of berseem Pint 7 is derived from a 3 000 032 the international equivalent price of feed
a 4 mix (Pint1) and the domestic price of straw a5 002 003
(Pstraw) using the following relationship1 19003 003a6
The subsidies of the individual com- int7 = (Pntl + Pstraw) 010
=t9 Ingram and Moursi Treating Berseem as a Traded Good
88
Bibliography
Abdel-Khalek Gouda and Tignor Robert L eds The PoliticalEconomyofIncome Distributionin Egypt New York Holmes and Meier 1981
Abdel- Fadil Mahmoud Development IncomeDistributionandSocialChangein RuralEgypt(1952shy1970) Department of Applied Economis Occasional Paper No 45 Cambridge Camshybridge University Press 1975
Adams Richard Growth Without Development in Rural Egypt A Local-level Study of Instishytutional and Social Change PhD thesis University of California Berkeley 1981
Alderman Harold von Braun Joachim and Sakr Sakr Ahmed Egypt FoodSubsidy andRashytioning System A Description Research Report 34 Washington DC International Food Policy Research Institute 1982
Askari Hossein and Cummings John TAgriculturalSupply Response ASurvey ofthe Econometric Evidence New York Praeger Publishers 1976
Atkinson Anthony Band Stiglitz Joseph ELectureson PublicEconomics New York McGraw-Hill Book Co 1980
Badawy Ismail Deputy Minister of Economy Egypt Personal communications 1981-82
Bale Malcom Dand Lutz Ernst Price Distortions in Agriculture and their Effects An Intershynational Comparison AmericanJournalofAgricultural Economics 63 (January 1981) 8-22
Bar~hout Saad Undersecretary Ministry of Econo - Ministry of Planning Egypt Personal communications 1981-82
Baumgarten Klaus Zuckerwirtschaft in Agypten [Sugar Economy in Egypt] Zuckerindustrie 104 (September 1979) 854-859
Black and Vetch International Master Plan for the Development of Egyptian Storage and Disshytribution System for Food Grains Paper prepared for General Authority for Supply Commodities Cairo 1978
Braun Joachim von Agricultural Sector Analysis and Food Supply in Egypt Interim Report of the Joint Project of the Institute of Agricultural Economics University of Gbttingen and the Institute of National Planning Cairo February 1980 (mimeographed)
_ _ A Demand System for Egypt-Estimation Results and Scenario Analysis for Altershynative Food Price Policies Institute of Agricultural Economics University of Gbttingen December 1981 (mimeographed)
- Effects of Food Aid in Recipient Countries Egypt and Bangladesh a Comparative Study Economics(BiannualCollectionofRecent German Contributionsto the FieldofEcoshynomic Science) 26 (No 2 1982) 18-47
Braun Joachim von and Haen Hartwig de Egypt and the Enlargement of the EEC Impact on the AgAcultural Sector Food Policy 7 (February 1982) 46-56
Bruton Henry JIour Issues of Economic Policy in Egypt Economics Study Unit Ministry of Economy Foreign Trade and Economic Cooperation Cairo 1980 (mimeographed)
Cuddihy William AgriculturalPriceManagementin Egypt World Bank Staff Working Paper 388 Washington DC World Bank 1980
Currie J M Murphy J A and Schmitz AThe Concept of Economic Surplus and Its Use in Economic Analysis The Economic Journal81 (December 1971) 741-799
89
Davis 0 A Dempster M A H and Wildavsky A ATheory of the Budgetary Process American PoliticalScience Review 60 (September 1966) 529-547
de Janvry Alain Siam Gamal and Gad Osman Forced Deliveries Their Impact on the Marketed Surplus and the Distribution of Income in Egyptian Agriculture Economics Working P ner 38 Agricultural Development Systems Project Ministry of Agriculture Cairo and the University of California- Berkeley Cairo September 1981
Dethier J J and Esfahani M Macro-effects of Alternative Price Policies in Egypt Ecoshynomics Working Paper 188 Agricultural Development Systems Project Ministry of Agriculture Cairo and the University of California- Berkeley Cairo September 1981
Eckaus Richard S McCarthy F D and Mohie el- Din AMulti- Sector General Equilibrium Policy Models for Egypt Development Research and Technology Planning Centre Cairo University 1979 (mimeographed)
Eckaus Richard Sand Mohie el- Din AConsequences ofChanges in Food Subsidy Policies in Egypt Working Paper 265 Department of Economics Massachusetts Institute of Technology Cambridge Mass April 1980
Egypt Economic Conference Cairo February 13-15 1982 Various papers (In Arabic)
Egypt Central Agency for Public Mobilization and Statistics Annual Trade Statistics Cairo various years (mimeographed) (In Arabic)
_ Consumer Cost of Living Indexes for Rural and Urban Areas Cairo various years (mimeographed) (In Arabic)
- Family Budget Survey 195859 Cairo CAPMAS 1961
- Family Budget Survey 196465 Cairo CAPMAS 1972
Family Budget Survey 197475 Cairo CAPMAS 1978
Open Market Prices for Urban and Rural Areas 1965-1981 Cairo nd (mimeoshygraphed)
Populationand Development Cairo CAPMAS 1978
___StatisticalYearbook of Egypt Cairo CAPMAS 1980
Egypt Ministry of Agriculture Institute of Agricultural Economics Research and Statistics Production Statistics Cairo 1982 (mimeographed)
Egypt Ministry of Agriculture and the US Agency for International Development Strategies forAccelerating AgriculturalDevelopment Cairo Ministry of AgricultureUSAID 1982
Egypt Ministry of Economy Egypt Macroeconomic Performance Problems and Prospects Cairo 198i (mimeographed)
Egypt Ministry of Economy Foreign Trade and Economic Cooperation Policy Study on Pricing and Taxation of Major Alternative Agricultural Crops Cairo 1980 (mimeoshygraphed)
Egypt Ministry of Finance Statistics on Goverrnment Budget Cairo nd (mimeographed)
Egypt Ministry of Planning Statistics of Public Agricultural Investment 1965-1980 Cairo 1982 (mimeographed)
Egypt Ministry of Supply and Home Trade Statistics 3 Fixed Consumer Prices Government Distribution of Food Import Quantities and Cost Cairo nd (mimeographed)
90
_ Trade Statistics Cairo 1982 (mimeographed)
Egypt Principal Bank for Development and Agricultural Investment Storage and Marketing Divisions Unpublished materials
Egyptian Gazette June 14 1980 pp 1-2
Esfahani Hadi and Sarris Alexander H Agricultural Supply Response for the Main Crops in Egypt Economics Working Paper 35 Agricultural Development Systems Project Ministry of Agriculture Cairo and the University of California-Berkeley Cairo August 1981
Fitch James Band Aziz Afaf AMultiple Cropping Intensity in Egyptian Agriculture AStudy of its Determinants Research Paper 5 Microeconomic Study of the Egyptian Farm System Ministry of Agricultre Cairo October 1980
Fitch James B Gandi A and el-Gabely MThe Cropping System for Maize in Egypt Survey Findings and Implications for Policy and Research Paper presented to FAO workshyshop on Improved Farming Systems in the Nile Valley Cairo May 1979
Fitch James Band Soliman Ibrahim The Livestock Economy in Egypt An Appraisal of the Current Situation Cairo 1982 (mimeographed)
Frey Bruno S Politico-economic Models and Cycles Journalof Public Economics 9 (April 1978) 203-220
Ghaffar Ahmed Abdel First Undersecretary Ministry of Supply and Home Trade Egypt Personal communications 1981-82
Gotsch Carl Hand Dyer Wayne MRhetoric and Reason in the Egyptian New Lands Debate FoodResearch Institute Studies 18 (No 2 1982) 129-148
Goueli Ahmed Food Security Program in Egypt In FoodSecurity for Developing Countries pp 143-157 Edited by Alberto Vald~s Boulder Colo Westview Press 1981
Grosse- Rueschkamp Alois Optimal Planning of Feed Mix Indust ies in Egypt PhD thesis University of Bonn 1979 (In German)
Habashi Nabil T Fitch J B and Rehiwi SEgypts Agricultural Cropping Pattern AReview of the System by which it is Managed and its Relationship to Price Policy Research Paper 4 Microeconomic Study of the Egyptian Farm System Ministry of Agriculture Cairo November 1980
a
Hansen Bent and Nashashibi Karim ForeignTradeRpgimes andEconomicDevelopment Egypt New Yoyk National Bureau of Economic Research 1975
Hansen Bent and Radwan Samir Employment OpportunitiesandEquity in a ChangingEconomy Egypt in the 1980s Geneva international Labour Office 1982
Hassan Ahmed Cooperative Marketing and Compulsory Deliveries of Some Agricultural Crops Institute of National Planning Cairo 1982 (mimeographed)
el-Hindy Mohamed KFood Systems Development in Egypt Economics Working Paper 58 Agricultural Development Systems Project Ministry of Agriculture Cairo and the University of California- Berkeley Cairo December 1981
lkram Khalid Egypt Economic Managementin a Periodof Transition Baltimore Md Johns Hopkins University Press 1980
Imam Shawky and Fitch Jemes BWheat Farming System in Egypt Cairo 1978 (mimeoshygraphed)
91
Ingram J Cand Moursi T Treating Berseem as a Traded Good in the Calculation of Social Returns Economics Working Paper 18 Agricultural Development Systems Project Ministry of Agriculture Cairo and the University of California- Berkeley Cairo May 1981
International Food Policy Research Institute FoodNeeds of Developing Countries Projections of ProductionandConsumption to 1990 Research Report 3 Washington DC IFPRI 1977
International Labour OrganisationUnited Nations Development Programme Employment Opportunities and Equity in a Changing Economy Egypt in the 1980s Draft report of the ILOUNDP Employment Strategy Mission 1980 (mimeographed)
International Wheat Council International Wheat Agreement 1981 London International Wheat Council nd
Kutcher Gary PThe Agro- Economic Model Master Plan for Water Resources Development and Use Technical Report 16 Cairo May 1980 (mimeographed)
Lesourne J Cost-BenefitAnalysisand EconomicTheoryAmsterdam and Oxford Elsevier- North Holland 1975
Lutz Ernst and Scandizzo Pasquale L Price Distortions in Developing Countries A Bias
against Agriculture European Review ofAgricultural Economics 7 (No 1 1980) 5-27
Misr Dairy Company Unpublished data Cairo 1979
Mohie el-Din Yahya First Undersecretary Ministry of Agriculture Egypt Personal comshymunications 1981-82
Moustafa Rasmia Abdou D Gardener B0 and Green RAWelfare Analysis of Price Policy for Wheat and Wheat Products in Egypt Economics Working Paper 48 Agricultural Development Systems Project Ministry of Agriculture Cairo and the University of California-Berkeley Cairo 1981
Musgrave Richard A and Musgrave Peggy BPublicFinance in Theory and PracticeTokyo McGraw-Hill Kogakusha 1973
Nasr Mamdouh M Farmers Supply Response within the Egyptian System of Government Acreage Planning PhD thesis Institute of Agricultural Economics University of Gbttingen 1983 (In German)
Nassar Saad el-Amir M R and Moustafa A ADeterminants of Agricultural Price Policy in Egypt Economics Working Paper 50 Agricultural Development Systems Project Ministry of Agriculture Cairo and the University of California- Berkeley Cairo 1982
Newberg R R Fertilizer Subsector Assessment Egypt Multinational Agribusiness Systems Washington DC 1979 (mimeographed)
Pacific Consultants New Lands Productivity in Egypt Its Technical and Economic Feasibilshyity Washington DC 1980 (mimeographed)
Page John M Shadow Pricesfor Trade Strategy andInvestment Planningin Egypt World Bank
Staff Working Paper 521 Washington DC World Bank 1982
Picks Currency Yearbook various issues New York Franz Pick Publishing C3 various years
Radwan Samir and Lee Eddy The Anatomy of Rural Poverty Egypt 1977 World Employshyment Programme Geneva 1980 (mimeographed)
Richards Alan FgyptsAgriculturalDevelopment1800-1980 Technical andSocial Change Boulder Colo Westview Press 1982
92
Sarris Alexander H Food Security and Agricultural Production Strategies Under Risk in Egypt Working Paper 249 Division of Agricultural Sciences University of California Berkeley March 1983 (mimeographed)
Scobie Grant M Food Subsidies in Egypt TheirImpact on ForeignExchange andTrade Research Report 40 Washington DC International Food Policy Research Institute 1983
_ Government PoliciesandFoodImports The Caseof Wheat in Egypt Research Report 29 Washington DC International Food Policy Research Institute 1981
Soliman Ibrahim Red Meat Price Policy in Egypt Economics Working Paper 62 Agriculshytural Development Systems Project Ministry of Agriculture Cairo and the University of California- Berkeley Cairo 1982
Soliman lbrahim Fitch J B and Aziz N A The Role of Livestock Production on the Egyptian Farm Economics Working Paper 85 Agricultural Development SystemsProject Ministry of Agriculture Cairo and the University of California-Berkeley Cairo July 1982
Taylor Lance Food Suboidies in Egypt Department of Economics Massachusetts Institute of Technology Cambridge Mass October 1979 (mimeographed)
Waterbury John Hydropoliticsofthe Nile Valley Syracuse NY Syracuse University Press 1979
World Bank Arab Republic ofEgypt DomesticResourceMobilizationand GrowthProspectsforthe 1980s Report 3123EGT Washington DC World Bank 1980
_ Arab RepublicofEgypt EconomicManagementin a Period of TransitionVol6 Washingshyton DC World Bank 1978
World Food Programme Office Unpublished data Cairo 1982
Wally Youssef el-Kholei Osman Abbas Mohamad and Heady Earl 0 StrategyforAgriculshyruralDevelopment in the Eighties for theArab RepublicofEgypt International Development Series Report No 9 Ames Iowa Iowa State University 1982
Zaglui EASome Proposals to Reduce Agricultural Subsidies Ministry of Agriculture Paper6 Cairo 1979 (mimeographed)
93
Joachim von Braun has been a researcher at IFPRl since 1981 Hartwig de Haen is a professor of agricultural economics at the University of Gottingen in the Federal Republic of Germany
IFPRI RESEARCH REPORTS (continued)
15 FOOD PRODUCTION IN THE PEOPLES REPUBLIC OF CHINA May 1980 by Anthony M Tang and Bruce Stone
14 DEVELOPED-COUNTRY AGRICULTURAL POLICIES AND DEVELOPING-COUNTRY SUPPLIES THE CASE OF WHEAT March 1980 by Timothy Josling
13 THE IMPACT OF PUBLIC FOOD GRAIN DISTRIBUTION ON FOOD CONSUMPTION AND WELFARE IN SRI LANKA December 1979 by James O Gavan and Indrani Sri Chandrasekera
12 IVVO ANALYSES OF INDIAN FOOD GRAIN PRODUCTION AND CONSUMPTION DATA November 1979 by J S Sarma and Shyamai Roy and by P S George
II RAPID FOOD PRODUCTION GROWTH IN SELECTED DEVELOPING COUNTRIES A COMPARATlVE ANALYSIS OF UNDERLYING TRENDS 1961-76 October 1979 by Kenneth L Bachman and Leonardo A Paulino
10 INVESTMENT AND INPUT REQUIREMENTS FOR ACCELERATING FOOD PRODUCTION IN LOW-INCOME COUNTRIES BY I99Q September 1979 by Peter Oram Juan Zapata George Alibaruho and Shyamal Roy
9 BRAZILS MINIMUM PRICE POLICY AND THE AGRICULTURAL SECTOR OF NORTHEAST BRAZIL June 1979 by Roger Fox
8 FOODCRAIN SUPPLY DISTRIBUIION AND CONSUMPTION POLICIES WITHIN A DUAL PRICING MECHANISM A CASE STUDY OF BANGLADESH May 1979 by Raisuddin Ahmed
7 PUBLIC DISTRIBUTION OF FOOD GRAINS IN KERALA-INCOME DISTRIBUTION IMPLICATIONS AND EFFECTIVENESS March 1979 by P S George
6 INTERSECTORAL FACTOR MOBILITY AND AGRICULTURAL GROWTH February 1979 by Yair Mundlak
5 IMPACT OF SUBSIDIZED RICE ON FOOD CONSUMPTION AND NUTRITION IN KERALA January 1979 by Shubh K Kumar
4 FOOD SECURITY AN INSURANCE APPROACH September 1978 by Panos Konandreas Barbara Huddleston and Virabongsa Ramangkura
3 FOOD NEEDS OF DEVELOPING COUNTRIES PROJECTIONS OF PRODUCTION AND CONSUMPTONTD 990 December 1977
2 RECENT AND PROSPECTIVE DEVELOPMENTS IN FOOD CONSUMPTION SOME POLICY ISSUES July 1977
MEETING FOOD NEEDS IN THE DEVELOPING WORLD LOCATION AND MAGNITUDE OF THE TASK IN THE NEXT DECADE February 1976
IFPRI RESEARCH REPORTS
41 RURAL GROWTH LINKAGES HOUSEHOLD EXPENDITURE PATTERNS IN MAL4YSIA AND NIGERIA Sepshytember 1983 by Peter B R Hazell and Ailsa Roell
40 FOOD SUBSIDIES IN EGYPT THEIR IMPACT ON FOREIGN EXCHANGE AND TRADE August 1983 by Grant M Scobie
39 THE WORLD RICE MARKET STRUCTURE CONDUCT AND PERFORMANCE June 1983 by Ammar Siamwalla and Stephen Haykin
38 POLICY MODELING OF A DUAL GRAIN MARKET THE CASE OF WHEAT IN INDIA May 19B3 by Raj Krishna and Ajay Chhibber
37 SERVICE PROVISION AND RURAL DEVELOPMENT IN INDIAA STUDYOF MIRYALGUDA TALUKA February 1983 by SudhiT Wanmali
36 AGRJCULTURE AND ECONOMIC GROWTH IN AN OPEN ECONOMY THE CASE OF ARGENTINA December 1982 by Domingo Cavallo and Yair Mundlak
35 POLICY OPTIONS FOR THE GRAIN ECONOMY OF THE EUROPEAN COMMUNITY IMPLICATIONS FOR DEVELOPING COUNTRIES November 1982 by ulrich Koester
34 EGYPTS FOOD SUBSIDY AND RATIONING SYSTEM A DESCRIPTION October 1982 by Harold Alderman Joachim von Braun and Sakr Ahmed Sakr
33 AGRICULTURAL GROWTH AND INDUSTRIAL PERFORMANCE IN INDIA October 1982 by C Rangarajan 32 FOOD CONSUMPTION PARAMETERS FOR BRAZIL AND THEIR APPLICATION TO FOOD POLlCy September
1982 by Cheryl Williamson Gray
31 SUSTAINING RAPID GROWTH IN INDIAS FERTILIZER CONSUMPTION A PERSPECTIVE BASED ON COMshyPOSITION OF USE August 1982 by Gunvant M Desai
30 INSTABILITY IN INDIAN FOOD GRAIN PRODUCTION May 1982 by Peter B R Hazell
29 GOVERNMENT POLlCY AND FOOD IMPORTS THE CASE OF WHEAT IN EGYPT December 1981 by Grant M Scobie
28 GROWm AND EQUITY POLICIES AND IMPLEMENTATION IN INDIAN AGRICULTURE November 1981 by J S Sarma
27 AGRICULTURAL PRICE POLICIES UNDER COMPLEX SOCIOECONOMIC AND NATURAL CONSTRAINTS THE CASE OF BANGLADESH October 1981 by Raisuddin Ahmed
26 FOOD SECURITY IN THE SAHEL VARIABLE IMPORT LEVY GRAIN RESERVES AND FOREIGN EXCHANGE ASSISTANCE September 1981 by John McIntire
25 INSTABILITY IN INDIAN AGRICULTURE IN THE CONTEXT OF THE NEW TECHNOLOGY July 1981 by Shakuntla Mehra
24 THE EFFECTS OF EXCHANGE RATES AND COMMERCIAL POLICY ON AGRICULTURAL INCENTIVES IN COLOMBIA 1953middot1978 June 1981 by Jorge Garda Garda
23 GOVERNMENT EXPENDITURES ON AGRICULTURE IN LATIN AMERICA May 1981 by Victor J Elias
22 ESTIMATES OF SOVIET GRAIN IMPORTS IN 1980-85 ALTERNATIVE APPROACHES February 1981 by Padma Desai
21 AGRICULTURAL PROTECTION IN OECD COUNTRIES ITS cosito LESS-DEVELOPED COUNTRIES December 1980 by Alberto Valdes and Joachim Zietz
20 IMPACT OF IRRIGATION AND LABOR AVAILABILITY ON MULTIPLE CROPPING A CASE STUDY OF INDIA November 1980 by Dharm Narain and Shyamal Roy
19 A COMPARATIVE STUDY OF FAOAND USDA DATA ON PRODUCTION AREA AND TRADE OF MAJOR FOOD STAPLES October 1980 by Leonardo A Paulino and Shen Sheng Tseng
18 THE ECONOMICS OF THE INTERNATIONAL STOCKHOLDING OF WHEA[ September 1980 by Daniel T Morrow
17 AGRICULTURAL RESEARCH POLICY IN NIGERIA August 1980 by Francis Sulemanu Idachaba
16 A REVIEW OF CHINESE AGRICULTURAL STATISTICS 1949-79 July 1980 by Bruce Stone
(continued on inside bach cover)

INTERNATIONAL FOOD POLICY RESEARCH INSTITUTE
The International Food Policy Research Institute receives support as a constituent of
the Consultative Group onInternational Agricultural Research Iom a number of donors including the governments of Austraiia Canada the Federal Repub ic of Germany India Italy Japan the Netherlands the Philippines and the UntA States the World Bank the Inited NationS [)eweo) meiIt Programme thre Ior( IFonndaion the Intershynational Fund for Agricultural Developmen the Internal ional Development Research Centre (Canada) and the Rockefeller Foun(alion In ad(lilion a number of other
governments and institutions contril)ute funding to special resear(h projects
Board of Trustees
Samar R Sen Nurul Islam Chairman India Bangladesh
Ralph Kirby Davidson Anne de Lattre Vice Chairman USA France
Eliseu Roberto de Andra de Alves Philip Ndegwa Brazil Kenya
Nicolas Ardito Barletta Saburo Okitil Panama Jal)an
Norman E Borlaug T Ajibola Talor USA Nigeria
Mohamed El-Khash Snoh Unakul Syria Thailand
Lowell S Harlin Dick de Zeenw USA Netherla nIs
Ivan L Head John W Mellor Director Canada Ex Officio USA
fy4lf y56
THE EFFECTS OF FOOD PRICE AND SUBSIDY POLICIES ON EGYPTIAN AGRICULTURE
Joachim von Braun Hartwig de Haen
Research Report 42 International Food Policy Research Institute November 1983
Copyright 1983 International Food Policy Research Institute
All rights reserved Sections of this report may be reproduced without the express permission of but with acknowledgment to the International Food Policy Research Institute
Library of Congress Cataloging in Publication Data
Von Braun Joachim 1950-The effects of food price and subsidy policies
on Egyptian agriculture
(Research report 42) Bibliography p 89 1 Food prices-Government policy-Egypt
2 Agricultural price supports- Egypt 3 Agriculshyture and state-Egypt i Haen Hartwig de Ii Title Ill Series Research report (International Food Policy Research Institute) 42
HD9017E4V66 1983 33810962 83-22829 ISBN 0-89629-043-3
1V
CONTENTS
Foreword
1 Summary 9
2 Evaluating the Effects of Food Subshysidies on Agriculture 11
3 The Economic Development of Agshyriculture and Policy Formation 17
4 Effects on Production of Agriculshytural Price Policies and Government Intervention 29
5 How Food Subsidies Affect Public Spending on Agriculture 34
6 Consequences of Government Inshytervention in Agriculture 44
7 The Burden on Agriculture-Deshyvelopment and Determinants with Special Focus on Food Subsidies 71
Appendix 1 Supplementary Tables 78
Appendix 2 The Calculations of the Effects of Government Intervention in Selected Markets 81
Bibliography 89
2
TABLES
1 Share of agriculture in the economy various years
2 Area and holdings by farm size 1952 1961 and 1977
3 Self-sufficiency of major agricul-tural commodities 1965-80
4 Government area planning and actual area forvarious crops 1979-80
com-modities as a percentage of total production 1965-80
5 Procurement of major food
6 Official and black market exchangerates and8 mternational rates 1965-80
7 Agricultural input subsidies and distortion of selected agricultural input prices 1965-80
8 Effects of alternative agricultural pricing policies and government interventions on production 1979 80
9 Effects of alternative agricultural pricing policies and government interventions on shadow prices 197980
10 Relationship between increawes in public spending on agriculture GDP and total expenditures 1965-72 and 1972-80
II Correlation coefficients of shares of budget components with special focus on the agricultural budget 1965-80
12 Relationship of wheat prices to international and open market prices 1965-80
18
19
21
22
23
2la5k25
28
31
32
38
39
51
13 Producer losses from price policies and procurement on the wheat rice and maize markets 1965-80 52
14 Consumer gains from price policies and subsidies on the wheat rice and maize markets 1965-80 53
15 Changes in the budget caused by government intervention in the wheat rice and maize markets 1965-80 53
16 Relationship of rice prices to inshyternational and open market prices
541965-80
17 Relationship of maize prices to inshyand open market prices
1965-80 57
18 Relationship of bean prices to inshyternational and open market prices 1965-80 59
19 Producer losses from price policies and procurement on the beans and lentils markets 1965-80 59
20 Consumer gains from price policies on the beans and lentils markets 1965-80 61
21 Relationship of sugar prices to inshyternational and open market prices 1965-80 62
22 Gains and losses of producers and consumers on the sugar market 1965-80 63
23 Producer losses and consumer gains on the cotton market 1963shy
6480
24 Gains and losses of producers and consumers on the meat market 1965-80 66
25 Gains and losses of producers and consumers on the milk market1965-80 68
26 Subsidies for selected feed cate-gories and total feed subsidies1965-80 70
27 Aggregate gains and losses of proshyducers on agricultural commoditymarkets 1965-80 72
28 Components of the burden on ag-riculture 1965-80 73
29 Determinants of changes in the burden on agriculture 75
30 Net returns of major crops 1965-80 78
31 Net returns of major rotations1965-80 78
32 Calculation of border prices at farmgate for wheat 1965-80 79
33 Calculation of border prices at farm gate for rice 1965-80 79
34 Calculation of border prices at farmgate for beef 1965-80 80 35 Model computations for the wheat
market 1965-80 83 36 Model computations for the rice
market 1965-80 84 37 Model computations for the beef
market 1965-80 85 38 Energy demand per unit of live-
stock and livestock numbers seshylected years 86
39 Total requirements of feed 1965shy86
40 Feed supply 1965-80 88
ILLUSTRATIONS
i Analytical framework for the analyshysis of the effects of food subsidies on agriculture 13
2 Cropping pattern 1977-79 20
3 Nominal protection coefficients ofproducer prices 1965-80 26
4 Deficits and revenues in publicexpenditure 1965-80 36
5 Structure of public expenditure1965-80 36
6 Government expenditures on agrishyculture 1965-80 37
7 Share of agricultural investment current expenditures and inputsubsidies in total government exshypenditures 1965-80 37
8 Public investment in agriculture1965-80 41
9 Actual development and a model estimate of government expendishytures on agriculture and the role of food subsidies 1966-80 43
10 Welfare losses of producers resultshying from price distortions and proshycurement 48
11 Average conditions in the wheatmarket 1976-80 50
12 Average conditions in the rice marshyket 1976-80 55
13 Average conditions in the maizemarket 1976-80 58
14 Average conditions in the beef market 1976-80 65
15 Producer losses and gains on comshymodity markets and aggregate netburden 1965-80 73
80
FOREWORD
Food prices are a major factor in deter-mining incentives to agricultural producers and the level of real income and nutritional status of low-income consumers Explicit food subsidies allow lower food prices to consumers relative to producer prices than would otherwise be the case Nevertheless there has been concern that food subsidies may in effect be paid for by farmers and hence serve as a disincentive to agriltural production This report by Joachim von Braun and Hartwig de Haen analyzes this issue through analysis of a wealth of data and the use of innovative methodologicri approaches it examines in particular the effects of agricultural price policies on both consumers and producers on fiscal resources and on the income burden placed on agri-culture
The analysis is part of a series of research reports by IFPRI addressing the effects of food subsidy policies on food consumption nutrition income distribution and macro-economic developments These studies cover a wide range of countries in sia Latin America and Africa and are expected to culminate in a major policy-oriented syn-thesis Egypt because of the large size of its
food subsidy programs is the subject of an intensive interacting set of studies of food subsidies These studies in collaboration with the Institute of National Planning in Cairo and financed by a research contract from the US Agency for International Deshyvelopment are coordinated by Per Pinstrup-Andersen director of IFPRIs Food Conshysumption and Nutrition Policy Program
Two other reports have been published from this project Egypts Food Subsidy and Rationing System A Description Research Report 34 which is an analytical description of the subsidy system in Egypt by Harold Alderman Joachim von Braun and Sakr Ahmed Sakr and FoodSubsidiesin Egypt Their Impact on ForeignExchangeandTrade Research Report 40 in which Grant Scobie assesses the macroeconomic implications of the food subsidy policy Results from analyses of he distribution of benefits and costs of the subshysidy system will be published in a subsequent report
John W Mellor
Washington DC November 1983
ACKNOWLEDGMENTS
The authors gratefully acknowledge the advice of Ismail Badawy Ahmed A Gaffar Kamal El Ganzouri and Yahya Mohie El-Din Fundamental guidance was also provided by Ahmed Goueli Many of the analytical tools used for this study were developed for a joint project of the Institute of AgAicultuyal Economics at the University of Gottingen and the Institute of National Planning Cairo which was funded by the Volkswagen Foundashytion This research was continued through a project funded by the US Agency for Intershynational Development under the technical supervision of the AIDUSDA Nutrition Ecoshynomics Group
The authors are also grateful for the help of the researchers in the Agricultural Planshyning Center of the In3titute of National Planning Most of the data used were proshyvided by the Ministry of Agriculture the Ministry of Supply and Home Trade and the Central Agency for Public Mobilization and Statistics in Cairo
1 SUMMARY
Subsidies to consumers have long beeni a part of Egypts social policy but early in the 1970s government expenditures on food subsidies were greatly expanded in response to increased income population growth and the dramatic increase in world prices Throughout the second half of the 1970s and early 1980s the food subsidy bill ac-counted for 10 to 1S percent of the govern-ments total expenditure The aim of this study is to determine how this rapid growth in consumer subsidies has affected agricul-ture Therefore government spending on agriculture is examined and the govern-ments price policies on inputs and output and its interventions in allocation and mar-keting are evaluated
Much research has been done on the implications of Egypts subsidy scheme for economic growth and income distribution In view of the weaknesses inherent in macro-economic models such as general equilib-rium models this study relies instead on microeconomic quantitative models
Inarguably the subsidy system has led to vast increases in food imports especially grain This conflicts with Egypts desire to achieve self-sufficiEncy According to a widely held theory subsidized distribution of imported food tends to depress producer prices which in turn acts as a disincentive to production and causes crops to be reallo-cated and farm incomes to be reduced Income is transferred indirectly from pro-ducers to consumers On the other hand it may be argued that subsidies represent an increase in real income for consumers that may be spent on additional foods on the open market which would benefit farmers
The time-series analysis of major com-ponents of the governments budget in this report shows that budgeted food subsidies were negatively correlated with public in-vestment (-074) but public nonagricultural investment continued to grow during the mid-1970s when subsidies were rising sharply The correlation coefficient was 071 A re-gression model of the governments agricul-tural spending behavior during the entireoVoUP
period 196S-80 shows that a 10 percent increase in the share of food subsidies in the total budget would cause agricultures share of the budget to decline by 14 percent
Since 1973 however total spending on agriculture haE grown faster than the total budget mainly because input subsidies have grown at about the same rate as food subsidies Thus subsidies to producers have to some extent balanced negative income effects resulting from depressed food prices
The study also analyzes how agricultural price policy evolved while food subsidies were expanding The instruments used by the government to intervene in agriculture include controls on imports and exports compulsory delivery quotas area allotment input subsidies and dual pricing on comshymodity markets
A comprehensive model is applied to quantify the effects on agricultural producshytion of current policies including a policy that would permit all input and output prices to draw closer to international prices Partial analyses demonstrate that both wheat and rice production respond readily to changes in prices It appears that there would be sigshynificant gains for producers if the gap beshytween internationa prices on the one hand and subsidized consumer prices governshyment procurement prices and prices on the uncontrolled market on the other hand became less distinct
The protection of livestock and animal products is a major source of price distorshytions If the whole set of domestic input and output prices were adjusted to correspond to international prices Egyptian wheat proshyduction might actually decline because its current competitiveness stems from the high value of straw fodder If meat and dairy products were no longer protected livestock production would decline reducing the need for fodder and feed and weakening the incentive to grow wheat Production of rice pulses and cotton would increase under such circumstances
The effects of price and market intershyvention policies on agricultural income on
the welfare of producers and consumers and on the government budget are analyzed to assess the burden subsidies place on agriculture A partial equilibrium model of the market for each commodity is con-structed which incorporates all of the major instruments of food police It indicates that the implicit taxation of producers has been considerably reduced since 1974 Procure-ment quotas have been reduced or elimi-nated and farmers incomes have risen-mainly as a result of price increases on the domestic open market Part of the burden of paying for subsidies has shifted from agri-culture to the general budget Between 1977 and 1980 the indirect (implicit) tax on agriculture decreased to about 17 percent
which is similar to the share of public revshyenues in the GDP Aregression model shows that the objective of shielding domestic prices from international fluctuations and the availability of additional government revenues led to the reduction of the burden on agriculture
In sum this study indicates that the expansioi of Egypts food subsidy system in the 1970s was not primarily at the cost of agriculture Price distortions are an inherent feature of Egypts agricultural policy existshying long before explicit food subsidies beshycame an important component in governshyment fiscal outlays Reducing these distorshytions could help to overcome inefficiencies in Egyptian agriculture
10
2 THE EFFECTS OF FOOD SUBSIDIESEVALUATING
ON AGRICULTURE
Food subsidies are one of the most prominent features of the Egyptian economy These subsidies affect various sectors of the economy but their influence on agriculture which comprises both consumers and pro-ducers and employs a considerable share of the nations resources seems particularly strongI
Because of its importance to the econ-omythe subsidy system has been the sub-ject of much research The concepts behind Egypts food policies and prevalent theories about subsidies are reviewed in this chapter and the strengths and weaknesses ofexisting macroeconomic models are assessed
Policy Evaluation
One widely held hypothesis holds that supplies imported for subsidized distribution in domestic markets tend to depress pro-ducer prices of competing commodities and that this price depression creates disincen-tives to production reallocation of crops and reduced farm incomes Lower producer prices cause implicit income transfers from producers to consumers On the other hand it can also be argued that food subsidies cause real income transfers to consumers resulting in increased demand for commodi-ties on the open market from which the farm sector could gain Open markets exist for the subsidized commodities themselves where quantities are rationed such as rice or where the number of outlets for the commodity is low such as for wheat in rural areas
Actually the microeconomic mechanisms are even more complex when practical poll-ces are taken into account In order to avoid a decline of production as a conse-
quence of price disincentives the governshyment operates a strictly cGitrolled area allotshyment scheme for some crops Moreover it has established compulsory delivery quotas at prices fixed below the ma rket prices (see Chapter 3) These delivery quotas and area allotments not only help toreduce variability in resource allocation induced by low prices but they remove at least potentially the need to ensure a market surplus by keeping procurement prices close to or above proshyduction costs Hypothetically there would seem to be a tendency to increase the proshyducer burden (producer tent -forgone)when public funds are scarce
This explains the commodity composishytion of the procurement program Those commodities that are strictly rationed at fixed prices on the food distribution side are also strictly controlled on the production side Rice pulses and sugar are examples Nonrationed or not strictly rationed comshymodities like wheat maize sorghum and meat have experienced considerably less interference in allocation and marketing 2
Agricultural input and output prices are disshytorted in another way whereas field crops are usually taxed the production of meat and milk has typically been protected by import restrictions and by the supply of subsidzed feed The special situation for feed and livestock indicates that food policy may cause a consumer-to-producer transshyfer and even a producer-to-producer transshyfer which accompanies redistribution of incomes among the production sectors within agriculture
Another line of reasoning focuses on the direct fiscal implications of food subsidies and their indirect effects on public spending on agriculture Increased government outshylays for food subsidies may induce relative
IFor adescription ofthe system see Harold Alderman Joachim von Braun and Sakr Ahmed Sakr Egypts Food Subsidy and Rationing Systenr ADescription Research Report 34 (Washington DC International Food Policy Research Inshystitute 1982)21bid p53
11
or absolute reductions in the agricultural budget and thus have a negative effect on sectoral development To the extent that public investments in agriculture and rural infrastructure are connected to food subsi-dies in such a hypothetical relationship the effect on sectoral growth and employment could be detrimental particularly in the long run
An assessment of the effect of food subshysidies on agriculture must take account of specific linkages and policy mechanisms The effects on production of procurement price fixing area allotment and the com-petition for scarce public funds have to be considered A distinction has to be made between those markets where subsidized and rationed commodities are released from government outlets and so- called open or free markets where transactions of food commodities are uncontrolled
In addition supplementary empirical analyses are required that describe specif-ically how and to what extent a wedge is placed between consumer and producer prices by specific producer price and pro-curement policies for th various food com-modities to what extent these policies create gains and burdens for producers and consumers what effects the policy-induced changes in prices and price ratios have on the composition and the level of agricultural production and whether variations in food stbsidies cause adjustments in public agri-cultural investment and current expenditure
The objective of this research is to analyze agricultural policymaking in the environ- ment of an extended food subsidy system Inefficiencies and misallocation of resources in agriculture arising from food subsidies are hidden costs of such systems However it is crucial to separate out from the whole bundle of policy 4cals and related instru-ments those that ire directly or indirectly linked to food subsidies The basis for thiF
can be provided only by a complete quantishytative assessment of a countrys agricultural policy and its determinants The complex institutional and technical structure of Egypts agricultural sector make this an ambitious task Some simplifications are unavoidable Figure I roughly outlines the structure of this report and the approach taken to policy evaluation
Review of Evidence from Macro Models
Conclusions about the macroeconomic effects of subsidies conflict in various models that have been used to evaluate them Some of the contradictions are due to differences in model assumptions and structures Others result from differences in the degree of realism achieved in mapping existing subshysidies3
The following macroeconomic effects of subsidies are however widely accepted Subsidies lead to a reduction of consumer prices for the subsidized commodities or for commodities produced using subsidized inputs This price decline affects price ratios and real disposable income The effect on the price ratio causes a change in the comshyposition of consumption in favor of subsishydized goods The effect on real disposable income causes an increase of real consumer purchasing power and a subsequent increase in total consumption
One line of argumentation arising from these assumptions states that given the inelasticity of food demand the reduction in prices for food leads to an expansion of the demand for other commodities At a given nominal wage level this increase in demand causes a multiplier expansion of employment and output in the rest of the economy This positive growth effect is however accompanied by increased imports and hence an expanded foreign deficit4
The macroeconomic effects of food subsidies in Egypt have been analyzed by several authors More recent publishycations mentioning implications for agriculture of the subsidy system includeJJDethier and HEsfahani Macroshyeffects of Alternative Price Policies in Egypt Economics Working Paper 188 Agricultural Development Systems Prclect Ministry of Agriculture Cairo and the University of California-Berkeley Cairo September 1981 Richard S Fkaus and A Mohie el-Din Consequences of Changes in Food Subsidy Policies in Egypt Working Paper 265 Department of Economics Massachusetts Institute of Technology Cambridge Mass April 1980 Khalid Ikram Egypt Econnmir Management in a Period of Transition (Baltimore Md Johns Hopkins University Press 1980) Lance Taylor uod Subsidies in Egypt Department of Economics Massachusetts Institute of Technology Cambridge Mass October 1979 (mimeographed) and World Bank Arab Republic of Egypt Domestic Resource Mobilization and Growth Prospects for the 1980s Report 3123EGT (Washington DC World Bank 1980)
4 An analysis of food subsidy Impacts on foreign exchange and trade is given in Grant M Scobie FoodSubsidies in Egypt Their Impact on Foreign Exchange and Trade Research Report 40 (Washington DC International Food Policy Research Institute 1983)
12
Figure I-Analytical framework for the analysis of the effects of food subsidies on agriculture
Goals and instruments of agricultural policy
Price and market Public spending intervention policies policies
1 (3) (5)
fl -cto-1 Production Demando effEctsmand Deffeces model_ I (4) (6) i I system _ I__
I- - - Income transfersF 1 I Economic lossesWelfare Budget effects on analysis commodity markets
L (6)
Aggregate burden Allocation of public on agriculture funds for agriculture
(7) (5)
Policy determination
F- - Food subsidies andRegression prices[ analyses
L - - Food subsidies and the agricultural budget
(7)
Notes The numbers in parentheses refer to the chapters of the study The tools used in this report to analyze theeffects on agriculture are outlined with broken lines
The conclusion to be drawn from this argu- inputs in fixed proportion to output) and ment built on Keynesian tradition isobvious savings adjust to changes in demand at a reduction of subsidies would result in an predetermined investment levels Total laboroverall contraction of the economy This supply is assumed to be infinitely elastic atkind of economic reasoning is characteristic the given wage which implies free in- and of the earlier applications of general equi- out- migrationlibrium models (GEM) subsidies affect The main controversy about the macroshyeconomic activities mainly through their economic effects of subsidies relates to the impact c t real disposable incomes in con- question of whether the subsidies indeed junction with the rice responsiveness of have positive growth effects or whether as consumer demand Production levels im- intuitive economic reasoning suggests theyports (which are assumed to be either non- have contractive effects None of the availshycompetitive consumer goods or intermediate able models gives a definite answer to this
Zckaus and Mohie el-Din Consequences of Changes In Food Subsidy Policies p 15
13
question Recent applications of the GEM reveal that this ambiguity is not surprising because the answer is related to two central unresolved issues which involve behavioral assumptions and require further empirical tests First do subsidies lead to reduced savi-igs The answer depends on the follow-ing inequality
reduced savings at lt increased savingsthe source of fi- _ in the recipient nance for subsidies households
Second do subsidies add to inflation The answer again depends on an inequality
inflationary effects lt deflationary of government - effects of price deficits reductions
Both questions are interrelated 6 If gov-eminent deficits would indeed be reduced in the absence of subsidies or if subsidies were reduced the pressure on interest rates and prices might be smaller This implies that the subsidies that are cut would not be substituted for by other components of aggregate demand and the stated contractive effect would occur On the other hand the government would have the chance to sub-stitute for subsidies through increased public savings which would make resources avail-able for more public or private investment
This mechanism is one aspect of the al-ternative closure rules applied to the GEM by Dethier and Esfahani 7 Basically they distinguish between a Keynesian closure rule which yields the results already men-tioned and a neoclassical closure rule For the neoclassical rule they assume that the labor supply is fixed and savings which are mainly determined by government policy are exogenous Investment adjusts endog-enously to savings with fixed sectoral shares Under I hese assumptions they arrive at very different results for the macroeconomic
effects of subsidies In the absence of subshysidies the price of food would increase and food demand would decline as under Keyshynesian assumptions However because food output would also decline the released labor would be allocated to other sectors and the output of the rest of the economy would inshycrease Due to increased government savshyings investment would also increase and as a net effect the reduction of subsidies would have positive growth implications for the overall economy In other words subsishydies cannot be said to favor economic growth
if aggregate demand can also be maintainedwithout subsidies
One way to increase aggregate demand
when subsidies are reduced is through a wage-price spiral if food prices went up there would be pressure to increase wages The resulting wage increments would be passed on in further price increases which would again cause wages to increase which would generate additional demand Another way of increasing aggregate demand would be to create additional public demand in the form of public current consumption or public investment Taylor demonstrates with a Keynesian model that with both a wageshyprice spiral and increased investment to maintain aggr - ate demand income distrishybution might be further biased toward the urban population8 Yet in the short run the absorptive capacity of the economy might not allow for a full substitution of investshyment spending for subsidy expenditures
So a reduction or a removal of subsidies would not automatically have contractive effects on the economy Alternative model formulations show a wide range of outcomes and related policy scenarios
However a major weakness of the GEM at least in its current state is the lack of flexibility on the supply side9 Domestic supply is modeled with Cobb-Douglas valueshyadded functions and reacts only to changes in demand This implies that a price- induced reduction of demand causes domestic supply to fall as well without taking into account
6 See Henry J Bruton Four Issues of Economic Policy in Egypt Economic Studies Unit Ministry of Economy
Foreign Trade and Economic Cooperation Cairo 1980 (mimeographed) 7 Dethier and Esfahani Macro- effects of Alternative Price Policies
8 See Taylor Food Subsidies in Egypt I See Richard S Eckaus F D McCarthy and A Mohie el- Din Multi- Sector General Equilibrium Policy Models for Egypt Development Research and Technology Planning Centre Cairo University 1979 (mimeographed) pp 8-16 and Eckaus and Mohie el-Din Consequences of Changes in Food Subsidy Policies pp 16-17
14
separate producer price movements This weakness obviously comes from the treat-ment of trade in the model This may not matter as long as the model is used for short-term policy analysis but it has important implications when the long-run effects of food subsidies on the agricultural sector are to be represented
Theoretically agriculture could gain from the subsidy-induced increase in food de-mand depending on agricultures competi-tiveness with imports and on practical poli-cies Under the prevailing conditions in Egypt the additional demand is largely met with foreign goods Hence it is likely that agriculture does not gain and that the price disincentive effect has dominated in the past
The models now available do not allow a full empirical test of these hypothetical implications Taking the GEM as an example the following aspects limit its applicability to specific agricultural questions
1 Although imports of consumer goods are not considered to be comptitive with domestic goods in reality most of them are especially wheat meat and sugar There-fore domestic supply mainly responds to demand and not to economic indicators
2 Although the Egyptian government operates its food policy with procurement and price policies such instruments are not included in the model
3 The model only deals with the price effects of subsidies on consumer demand where prices are ccmputed as markups of production costs indirect taxes and subsi-dies As Eckaus and Mohie el Din point out the existence of rationing may yield very different conclusions depending on whether subsidies are affected by a change in the amount of a subsidized commodity or by changes in the subcidy rates 0
4 The GEM identifies four agricultural production sectors ThesE are not quite enough for an analysis of product-specific subsidies The staple food group for instance includes wheat which is not rationed and which is mostly imported and rice which is rationed and is controlled through a strict procurement policy For maize which is in the same group increasing amounts of
imports are released at subsidized prices for use as livestock feed An aggregate model can hardly be used to examine the impact of these subsidies nor can it be used to assess the influence of subsidies on the costs of meat and milk production
5 Available applications of the GEM indicate that distributional effects vary widely depending on the assumptions made for he subsidy and the macroeconomic closure rule Subsidies generally seem to increase the net progressiveness of the fiscal system Yet the results of the GEM applications by Dethier and Esfahani indicate that the disshytribution within sectors is quite stable whereas the distribution betwe the rural and the urban sectors reacts more sensitively to changes in the assumptions about the closure rules11 Eckaus and Mohie el-Din show that subsidy effects are progressive only when subsidies are made effective by a decline in prices For instance if a subsidy is reduced as the result of a reduction in the quantity of subsidized imports and not as a resulc of a reduction of subsidy rates the Eckaus and Mohie el-Din model shows a shift in the distribution of income in favor of agriculture 12
6 Finally one must realize that some of the allocational implications of subsidies will be dynamic rather than static as the typshyical GEM assumes This is true not only of the growth effects the effects that could be expected from higher shares of investment in total aggregate demand as a consequence of reduced subsidies Even if investment were stable and subsidies reduced current public expenditure on other iters such as agricultural research and extension it is likely that such budget reallocations would inhibit the growth of agricultural production which the available models would not cover Unfortunately there has so far been little empirical research on the productivity effects of alternative agricultural development plans and related budget appropriations
For the purposes of this study the lack of an endogenous domestic supply response module is probably the most critical problem with these models Price increases from a cut in subsidies may not only reduce deshymand as the models indicate but they may
Eckaus and Mohie el-Din Consequences of Changes in Food Subsidy Policies pp 37-54
Dethier and Esfahani Macro-effects ot Alternative Price Policies 12 Eckaus and Mohie el-Din Consequences of Changes in Food Subsidy Policies pp 42-55
15
also cause the share of domestic production in total supplies to increase Moreovez even with a given subsidy several policy ystems can separate producer prices from the con-sumer markets In fact niany dual price policy systems are being used in the Egyptian agricultural markets
A moe recent modeling approach the Domestic Resouce Mobilization Model (DRM) doesprovidethepossibilityofmode
l-
ing the domestic supply response at least indirectly 13 As in the GEM subsidy varia-tions have a price ndan income effect on demand where the changes in demand are governed by a linear expenditure system The demand for imported goods is then de-rived from total demand and the relative prices of domestic and imported goods Although this could make it easier to study the production effects of subsidies the DRM does not treat the production of agri-cultural commodities as endogenous Wheat production is exogenous in the model and cotton is realistically treated as a specific export commodity Cotton exports however are related to aggregate cotton production simply by a growth elasticity
The DRM is more flexible than the GEM on macroeconomic closure rules It can also produce time paths of development Although total domestic production is governed by the demand module which includes import substitution domestic resource use and resource capacities are adjusted as functions of technical progress population growth
intersectoral migration and capital accumu-lation Capital accumulation is determined exogenously by specific investment policies
The DRM was used to analyze the effects of a reduction in food subsidies Specifically
a reduction in wheat subsidies an increase in the domestic wheat price and a complete removal of all other subsidies were examined The positive macroeconomic effects domshyinated the solution as n the neoclassical version of the GEM The foreign exchange gap and the savings gap narrowed Agriculshytural exports increased whereas the comshymodity composition of imports shifted toshyward nonagricultural imports which was mainly a reaction to a positive effect on agricultural incomes
In sum three tentative conclusions can be drawn from these macroeconomic models First subsidies do not automatically support or impair economic growth That depends on the accompanying government policies Second subsidies contribute to the proshygressiveness of the fiscal system In other words low-income households benefit more than high-income households Third macshyroeconomic models can only give results for overall economic activities of which agrishyculture is a part Implications for agriculture must be derived from these
The research reviewed in this chapter
has focused on quantitative models The complex structure of Egypts agriculture and the evolution of its agricultural policy and rural development strategies is not explained by these models but must be taken as given A complete assessment of these issues is beyond the scope of this study 4
Finally this study does not evaluate the effect of food price and subsidy policies on the distribution of personal income in agriculture These issues are dealt with elsewhere15
13World Bank Arab Republic of Egypt Domestic Resource Mobilization 14See Mahmoud Abdel-Fadil Development Income Distributionand SocialChange in Rural Egypt (1952-1970) Departshy
ment of Applied Economics Occasional Paper 45 (Cambridge Cambridge University Press 1975) and Alan Richards Egypts Agricultural Development 1800-1980- Technical and Social Change (Boulder Colo Westview Press 1982)
11 See Alderman von Braun and Sak Egypts Food Subsidy rind Rationing System
16
3 THE ECONOMIC DEVELOPMENT OF AGRICULTURE AND POLICY FORMATION
To analyze the effects of food prices and agriculture in 196566 41 million in 19707 1 subsidies on agriculture an understanding and 42 million in 19798017 of Egypts agricultural system during the For centuries agriculture was Egypts1960s and 1970s is needed major source of foreign exchange earnings
Cotton policy and its coordination with wheat production and irnport policies dom-
The Rote of Agriculture inated the countrys foreign exchange andin the Economy food policies until the 1970s18 But agriculshytures share of all goods exported dropped
from 80 percent to 16 percent during the In 1980 agriculture contributed about20 period 1970-80 At the same time the share
percent to the total GDP but employed about of food imports in all imports increased 40 percent of the work force Although from 21 percent to 34 p_rcent If factor and agriculture is the largest employer the two nonfactor services are included agriculturesfigures highlight a strong intersectoral in- share of all goods cxported was only about8 come disparity (Table 1)Disproportionately percent in 1980 and food was 26 percent of low investment may be one reason why the all goods imported 19 Although the value of annual growth rate of agriculture was as low agricultural exports in the 1960s and early as 2 percent per year during the 1960s and 1970s was more than twice as high as the970s In the 1970s exceptionally high growth value of food imports in 1980 only about 29 of the nonagricultural sectors particularly percent of the food import bill was paid bypetroleum caused agricultures share of agricultural exportsGDP to drop 3 percent per year But its share Not only did the share of agriculturalof employment has been shrinking at roughly exports in total exports decline but the the same rate (35 percent per year) leaving absolute amount of agricultural exports a high intersectoral income gap 6 Despite dropped by nearly one half between 1970 the high migration of farm labor into other and 1980 Demand grew far faster than agrishysectors to urban centers and even to other culture as the rapidly shrinking degree of (ountries particularly the Gulf States the self-sufficiency in almost all food commodishytotal labor force in agriculture remained ties indicates Self-sufficiency in cereals more or less constant during the 1970s declined from 83 percent in 197071 to 60 About 39 million people were employed in percent in 1980
16 For adetailed discussion of agricultural-nonagricultural income distribution see Ibrahim el-Issawy Interconshynections Between Income Distribution and Economic Growth in the Context of Egypts Economic Development in The PoliticalEconomy ofIncome Distributionin Egypt ed Gouda Abdel- Khalek and Robert L Tignor(New York Holmes and Meier 1981) pp 96-98 17Labor force statistics are not consistent Hansen and Rddwan report an annual rate of change of-14 percent beshytween 1971 and 1979 based on labor force surveys of the central Agency for Publi Mobilization and Statistics See Bent Hansen and Samir RadwanEmployment OpportunitiesandEquityin a ChangingE -onomy Egypt in the1980s(GenevaInternational Labour Office 1982) pp 59-60 Egypt Central Agency for Public Mbilization and Statistics Populationand Development (Cairo CAPMAS 1978) pp 226-227 and Central Agency foy Public Mobilization and Statistics Statitical Yearbook of Egypt (Cairo CAPMAS 1980) p 226 aAn extensive analysis of this policy is provlded in Richards Egypts Agricultural Development
19Egypt Ministry of Economy Egypt Macroeconomic Performance Problems and Prospects Cairo 1981 (mimeoshygraphed) Tables 5 and 6 Egypt Ministry of Agriculture and the US Agency for International Development Strategiesfor AcceleratingAgricultural Development (Cairo Ministry of AgrlcultueUSAID 1982) p 74 Egypt Ministry of Agrishyculture Institute of Agricultural Economics Research and Statistics Production Statistics Cairo 1982 (milmeoshygraphed) and Egypt Ministry of Supply and Home Trade Trade Statistics Cairo 1982 (mimeographed)
17
Table 1-Share of agriculture in the economy various years
196566 1970171 1 0
(percent)
Share ol total GDP 284 275 210 Share of total gross
fixed investment 81 78 8 0b
Share of total 534 532 3 9 3 b
employment
Sources Egypt Central Agency for Public Mobiliza-tion and Statistics Statistical Yearbook ofFgypt (Cairo CAPMAS 1980) pp 222-227 Egypt Ministry of Economy Egypt Macroeconomic Performance Problems and Prospects Ciro 1981 (mimeographed) Tables 5 and 6 and World Bank Arab Republic of Egypt Economic Management ina Period oflansition(Washing-ton DC World Bank 1970) 611
The figures for gross domestic product (GDP)are at current prices bThis figure is for 1979
The food security issue is extensively discussed in Egypt mainly with respect to this reduction in self-sufficiency 20 Awider view of the food security issue focuses on the decreased ability of agriculture to provide the means to compensate for the growing food import bill 2 1
While the first viewpoint merely leads to a strategy stressing domestic provision of cereals the second asks for a balancing of the foreign exchange budget between sectors Both strategies might have some rationale on political grounds but both can reduce economic efficiency A sector modeling exercise concludes that to increase cereal production as much as desired cereals
would have to be highly protected Balancing the sectoral foreign exchange budet would on the other hand require protection of the sector as awhole if current per capita conshysumption is to be maintained 22
Farm Structures Resources and the Land Use Pattern
There are about 35 million farms in
Egypt with an average size of 16 feddans 23
In 1977 52 percent of farm land belonged to farms smaller than 5 feddans which made
up 95 percent of all holdings (Table 2) Furshy
thermore about 40 percent of all farms are less than 1 feddan these constitute just 12 percent of the total area24 The pressure of a growing population in combination with the customs for inheritance of land have led to an increase in the number of holdings which has increased the man-land ratio and rural
25 poverty
The amount of arable land is a major conshystraint to increasing agricultural production About 58 million feddans of fully irrigated old lands and 05 million feddans of newly reclaimed desert land were under cultivation in 1980 These 63 million feddans cover about 3 percent of the total land area of Egypt This land along the Nile and in the Nile Delta has some of the best soil in the world and is perennially irrigated Rainfed agriculture is insignificant Expanding arable land has been economically technically and managerially difficult26
The water supply for year-round agriculshytural production which Egypts weather conditions make possible is regulated at the Aswan High Dam This gives Egyptian
20 The issue is given major attention in Egypt Ministry of Agriculture and the US Agency for International Developshy
ment Strategiesfor Accelerating Agricultural Development
21 An analysis of the food security issue is provided by Ahmed Goueli Food Security Program in Egypt in Food Press 1981) pp 143-157Security for Developing Countries ed Alberto Valdbs (Boulder Colo Westview
22 See Joachin von Braun and Hartwig de Haen Egypt and the Enlargement of the EEC Impact on the Agricultural
Sector Food Policy 7 (February 1982) 46-56
23 A feddan equals 1038 acres 24See Richard Adams Growth Without Development in Rural Egypt ALocal-level Study of Institutional and Social
Change PhD thesis University of California Berkeley 1981 p 25 25Samir Radwan and Eddy Lee The Anatomy of Rural Poverty Egypt 1977 World Employment Programme Geneva
1980 (mimeographed) 26Carl HGotsch and Wayne MDyer Rhetoric and Reason In the Egyptian New Lands Debate Food Research Instishy
tute Studies 18 (No 2 1982) 129-148
18
Table 2-Area and holdings by farm size 1952 1961 and 1977
Area Holdings 1952 1961 1977
Farm Size Holdings 1952 1961 1977
Less than S feddans (percent) 354 521 520 943 941 950 47 40
5 - 20 feddans (percent) 195 191 214 45 12 12 10
More than 20 feddans (percent) 451 288 266
Average size (feddans) 21 20 16 2801 3101 3162
Number of holdings (1000)
Source Egypt Central Agency for Public Mobilization and Statistics StatisticalYearbook of Egypt (Cairo CAPMAS
1980) pp 54-56
agriculture the characteristics of a huge irrigation project Total water supply may increase during the next decades due to changes in the southern Nile system But the total supply of irrigation water seems to be less a constraint than its management 27
A complex system of overlapping rota-tions is characteristic of Egypts agriculture Figure 2 describes the cropping pattern in 1977-79 The cropping intensity averages about 190 whereas it was 176 in the early 1960s With a higher share of vegetable crops shortened growing periods for new varieties of staple crops and decreased falow it might well exceed 200 in the future28
Development of Production Structures and Economic Incentives
Agricultural production structures changed remarkably during the 1960s and 1970s In the early 1960s the completion of the Aswan High Dam caused land use pat-terns and cropping intensities to change The process of adjusting to the new water availability continued until the second half of the 1960s Since then changing economic incentives and direct government interven-tion in allocation have been mainly respon-
sible for shifting land use patterns and growth of livestock production
Among the winter crops the fodder area which is devoted to a full-season clover called berseem changed the most growing from about 12 million feddans in 1965 to 17 million feddans in 1980 Among the summer crops cotton showed the largest reduction while wheat area remained more or less constant The increase in full- season berseem area was primarily at the cost of the area for pulses and short-season berseem which are cultivated before cotton Total land area has increased 2-300000 feddans since the mid- 1960s which has allowed the area used for fruit and vegetable crops to
29expand
The land use pattern in the summer season shows a continuous growth of maize area and a reduction of cotton and sorghum cultivation 30 Maize area increased by 30 percent (about 05 million feddans) and cotton area shrank by 35 percent (07 million feddans) between 1965 and 1980 The rice area remained almost constant at about 11 million feddans during the 1970s
The tremendous expansion of fodder and animal feed production in both seasonsshyberseem in winter and maize in summershyreflects the growing livestock herd The
27 John Waterbury Hydropolitics of the Nile Valley (Syracuse NY Syracuse University Press 1979)
28James BFitch and Afaf A Aziz Multiple Cropoing Intensity in Egyptian Agriculture AStudy of its Determii ants
Research Paper 5 Microeconomic Study of the Epntlan Farm System Ministry of Agriculture Cairo October 1980
29No accurate data on total land are available as new land under cultivation and losses of cultivated land for nonshy
agricultural purposes are only roughly estimated
30The nili season (autumn) is included in the summer season
19
Figure 2-Cropping pattern 1977-79 Percent of Cropped Land 100 Idle winter land (4)
90 Cash-crop Cotton (22) berseem (l9)
80
70- Rice (18)
Idleb6 Full-term berseer (30)
50- Maize (24)
40-
Sorghum (7)(23)30WheatNo e D eOther summer rogs (4)
Broad beans (4) Idle lan in ps o Idle o4nill i Study otEpiFaSye M y adoel c cIrop midsummer p 2 Summer 7
0 _ Winter veMetbles (4) vegetables (8) L NHL Mveetbles j4)Incude lOther winter crps (7)a
Permanent crops (fruits 15and sugarcane r41)
August September OctoberNovemnber December January February Match Aprill May June July
Source Nabil Tflabashi James BFitch and Salwa Rehiwi Egypts Agricultural Cropping Pattern AReview of the System by which atis Managed and its Relationship to Price Policy Research Paper No 4 Microeconomic Study of the Egyptian Farm System Mint3try of Agriculture Cairo November 1980 p2
bullIncludes lentils chick peas fenugreek flax barley and other crops IsRepresents land that istemporarily idle bet een summer crops such as cotton and rice and winter crops such as
berseem
number of cattle buffalo sheep and goats crop and wheat straw as fodder Governmefit has increased 30-50 percent since the mid- control of the area allotment of rice has had 1960s an effect as well
The changes in net returns per feddan of the major crops reveal that the dynamic reshyallocation of crops corresponds to the com- Agricultural Policy Goals parative advantages of the rotations In 8 and Instruments out of the 16 years from 1965 to 1980 the berseem- maize rotation provided the highest return to land In 5 years returns of the Egypts agricultural policy isbest undershy
berseem-rice rotation exceeded it slightly stood as having two goals The first is to and in 3 years during the late 1960s and provide adequate basic foods to all groups early 1970s the short-season berseem- cotton of the population including those with low
rotation was highest (Appendix 1 Tables 30 incomes The second goal is for Egypt to beshy
and3 1)Since the late 1960s the profitability come fully self-sufficient in as many food of fodder crops has increased far more rapidly commodities as possible Since the revolushy
tion of 1952 two political factors havethanthe profitability of cotton This explains the major shift in crop allocation The ratios helped to determite these goals the security
of social peace and stability on the oneof the net returns of rice and maize and of wheat and full-season berseem have not hand and external independence on the chanped as much The relative stability of other hand the area of these cereals is partly determined More specifically the goals of agricultural by the importance of wheat as a subsistence policy during the past 15 years have been to
20
stabilize farm prices to procure basic food commodities to increase productivity to increase public revenue and to improve the balance of payments3 1
The goal of price stability became im-portant during the 1970s when world market prices of most agricultural commodities fluctuated greatly peaking in 197374 and 197980 Procurement prices and average producer prices rose rapidly during this time Riots in January 1977 which followed an attempt to increase prices of subsidized consumer goods reinforced the belief that keeping prices stable was of prime importance
Since Egypt has enjoyed relatively peace-ful foreign relations foreign exchange avail-ability has increased due to growing oil ex-ports Suez Canal revenues and remittances from Egyptian workers in Arab countries There are indications that these improve-ments favor a closer orientation of domestic agicultural prices to the trends of inter-national prices Whether these trends have
indeed caused the emphasis on the budget and foreign exchange to be reduced remains to be anaiyzed A large number of programs to increase the productivity of specific crops such as maize rice and beans have been initiated and irrigation and drainage programs have been undertaken Even though the total supply of basic food commodities which had been repeatedly disturbed during political crises and the wars of 1967 and 1973 has markedly increased a rising proshyportion of this supply come from imports and the self-sufficiency of major food items has declined considerably (Table 3)
The Egyptian government has for a long time directly influenced the performance of agriculture by investing in land reclamashytion and irrigation by controlling input supplies and by keeping strict control in general of private farming Several of these policies are related to food subsidies These include area allotment procurement direct and indirect price controls for agricultural
Table 3- Self-sufficiency of major agricultural commodities 1965-80
Year Wheat Maize Rice Lentils Beans Sugar Cotton Lint Red Meat
093 100 099 234 0811965 035 093 137 966 040 093 141 095 100 069 328 084 1967 031 091 141 073 1O 079 261 092 1968 040 094 151 073 100 107 222 093
1969 031 096 188 056 100 117 174 093 1970 037 097 164 064 100 117 205 089
1971 038 098 142 089 090 126 247 087 1972 037 096 137 083 097 099 209 089
1973 036 097 125 082 100 111 218 088 1974 034 087 110 079 091 091 200 082
1975 034 086 107 042 067 081 183 087 1976 034 086 116 035 075 080 166 075 1977 027 082 118 032 091 084 152 081
0751978 025 081 110 024 092 074 145 1979 027 085 1i2 013 087 080 147 079
0751980 024 077 107 010 085 06c 142
Sources Computed from data provided by the Egyptian Ministry of Agriculture and the Central Agcncy for Public Mobilization and Statistics
Notes Self-sufficiency coefficient equals domestic production divided by total domestic use Total domestic use
equals production plus imports minus exports Where foreign trade includes processed goods (sugar and cotton lint) the raw material equivalents of traded quantities are used
31On agricultural development objectives and policy see Youssef Wally Strategy for Agricultural Development in the EightiesfortheArob Republic ofEgypt International Development Series Report No 9 (Ames Iowa Iowa State Univershysity 1982) pp 58-63
21
commodities and input pricing and ahotment
Area Allotment
There are several reasons why the Egyp-tian government allocates areas for specific crops even at the farm level 32 In the past
over-area was allotted partly to prevent production of crops such as cotton and rice During the 1960s and 1970s the instrument was used to enforce production of minimum amounts of politically desired crops Today a prominent objective is to ensure that cer-tain amounts of food commodities are pro-duced domestically Another objective is to ensure that production of export crops mainly cotton and rice is large enough to reach foreign exchange targets in spite of low fixed producer prices At least this was a purpose until foreign exchange became available from other sources in the second half of the 1970s Area allotments also help to assure that crop production is on a large enough scale to facilitate efficient operation of irrigation and pesticide programs
Although area allotments undoubtedly have a significant effect on the pattern of production there is evidence that farmers often illegally deviate from prescribed area allotments when they can get higher income from an alternative area allocation Table 4 indicates that the actual area for all crops for which the plan is enforced-rice beans lentils and cotton- islower than the planned area The area planning for the remaining crops only indicates what is desired and is not enforced However the more or less enforced area allocations for rice and cotton in the summer season have strong reper-cussions on the whole cropping system given the interseasonal effects of cotton in the rotation scheme (see Figure 2) The inter-dependency of area allotment by the govern-ment and decisions on allocations by farmers will be discussed later
Procurement
As indicated earlier the government operates a system of compulsory deliveries
Table 4- Government area planning and actual area for various crops 1979-80
Entorced Crop Planned Actual or Not
(1000 feddans)
Wheat 1380 1391 Not enforced Rice 1100 1039 Enforced
1884 Not enforcedMaize 1761 Beans 300 287 Enforced Lentils 40 22 Enforced Sugarcane 290 249 Not enforced Onions (winter) 36 22 Not enforced
Garlic 23 16 Not enforced cotton 1301 1196 Enforccd
Source Data provided by the Egyptian Ministry of Agiculture
For these crops contractual agreements are settled with
farmers in certain regions They involve delivery of the crop at a fixed price
at fixed prices The entire cotton crop and a high share of the winter onion crop must be sold to the cooperatives at low prices Among the basic food commodities certain proportions of wheat rice beans lentils sesame and groundnuts are subject to the quota system In the case of sugarcane nearly all of the crop is sold to the governshyment because all of the processing facilities are state owned
The shares of total production that are procured at low prices vary among comshymodities and in time (Table 5) Rice has the largest volume of procurement usually amounting to one half of total production Traditionally a major portion of this was exported but the amount that isdistributed domestically has steadily increased Wheat the second most important procurement food crop has had a significantly lower relative quota of 15-20 percent Moreover the quota dropped drastically in 1977 when forced deliveries officially ceased Actually some procurement continued even after
32See Nabil T Habashi James B Fitch and Salwi Rehlwi Egypts Agricultural Cropping Pattern A Review of the
System by which it is Managed and its Relationship to Price Policy Research Paper 4 Microeconomic Study of the
Egyptian Farm System Ministry of Agriculture Cairo November 1980
22
Table 5- Procurement of major food commodities as a percentage of total production 1965-80
Year Wheat Rice Beansb Lentils
(percent) 1965 180 500 1966 176 500 1967 192 508 1968 186 511 1969 106 524 1970 120 443 50 1971 165 421 339 1972 149 406 219 1973 153 407 116 1974 190 386 153 1975 187 480 218 202 1976 153 472 250 407 1977 81 463 225 658 1978 65 470 182 381 1979 155 519 344 911 1980 69 512 317 642
Sources Data on procurement of wheat beans and lentils were compiled atom unpublished data provided by the Principal Bank for Developshyment and Agricultural Investment 1982 and data on procurement of rice and productionof wheat beans lentils and rice were ob-tained from the Egyptian Ministry of Agricul-ture 1982
Wheat procurement for 1965-68 is arough estimate by the Principal Bank for Development and AgriculturalInvestment no actual data were available bIt could not be fully ascertained whether beans were procured during 1965-69 or whether lentils were procured during 1965-74 Ahmed Hassan In arecent publication mentions 1967 as the year of introduction of delivery quotas for beans and lentils (Ahmed Hassan Cooperative Marketing and Compulsory Deliveries of Some Agricultural Crops Institute of National Planshyning Cairo 1982 [mimeographed])
1977 apparently as a result of local arrange-ments and special regulations for farms on area distributed during the land reform ofthe 19b0s In 1979 as much wheat wasthe 960s In1979as heatwasmch procured as during the period of enforced deliveries Other procurement crops like beans and lentils are procured in much smaller quantities but relative shares have been significant in recent years
The declared purpose of wheat procure- ment has traditionally been to ensure a stable
flow of domestic grain to the urban populashytion But the factors that apparently motishyvated the drastic reduction of wheat proshycurement in 1977 suggest that the budget is an important constraint for the achievement of this goal In the past procurement prices were close to import prices (converted at official exchange rates) When world market prices went up during the world food crisis (197374) consumer prices were kept well below import prices The consequence was
a heavy burden on the subsidy budget for wheat imports This may explain why proshycurement quotas were raised and enforced with vigor during that period at prices that increased much more slowly than world prices By 1975 the situation changed Imshyport prices declinei again while procureshy
ment prices being more or less strictly linked to costs of production and inflation conshytinued to grow The government reacted by drastically reducing domestic purchases and increasing the share of imports in urban supplies
Amodel that regresses the relative quotaof wheat procurement (w) on government revenues (r) and the ratio of procurementprices to import prices (p) supports the hypothesis that procurement is significantlyinfluenced by the governments finances
w= 3103 - 946 p - 00049 r (-297) (-484)
ft2 - 065
where
w- the share of procurement in the proshyduction of wheat
p - the share of the procurement price in the import price at the official exchange rate and
r - government revenuesinLE million deshyflated by the consumer price index 33
The time series is for the period 1965-80 t-values are in parentheses
De Janvry Siam and Gad address themshyselves to the more general question ofwhether
33The Egyptian pound (LE) equals 100 plasters In July 1982 US $122 equaied LE 100 Between 1977 and August1981 the Egyptian pound equalled US 5143 Prior to devaluation in 1977 the Egyptian pound was valued at more than $250
23
forced deliveries are needed to ensure a sufficiently high market supply34 Their empirical case study for wheat and rice based on predetermined elasticities of supply and demand concludes that forced deliveries are irrelevant to food security in Egypt Voluntary sales would increase more than proportionately if compulsory deliveries were halted Moreover the authors suggest that the dominant effect of this policy in-strument is to tax farm incomes The con-clusionthatitisirrelevanttoensuredomestic supplies to urban areas comes from the as-sumption that the elasticities of supply with respect to changes of price are low for wheat and rice and that free sales are reduced by the quotas In other words a reduction of free sales reduces the immeJiate supply-increasing effect of the procurement policy One side effect of this is that prices increase on the free markets which reduces the welfare of those rural households that do not have full access to subsidized food markets and that produce less than their subsistence requirements
Whether the results that de Janvry Siam and Gad obtained for 1976 with data taken from a sample of farms represent thle sectUal aggregate and are valid for longer periods of time is unclear But because the elasticities used lie within the range of the few available estimates and because the gaps between procurement and the open market prices assumed for 1976 were not atypical for the 1960s and 1970s the calculation appears to be reasonable
Direct and Indirect Price Controls
The Egyptian government operates a complex set of market inteiventions and price regulations that not only cause do-mestic prices and price ratios of agricultural products to diverge from international prices but also cause differences in prices between more or less separated domestic markets
even for the same commodity35 It is evident that these price distortions may affect the allocation of resources and production consumption patterns and foreign trade
Egypt like most other developing counshytries tends to overvalue its currency Most agricultural trade and several nonagricultural imports have been handled at the official foreign exchange rate Other imports are subject to mixed financing with a fixed share of foreign exchange converted at the official exchange rate and the rest at a higher so-called parallel rate 36 Finally imports of some commodities must rely completely on foreign exchange from black market sources When there is a quota on international trade and an increase in prosshyecutions on black market foreign exchange transactions as in the 1960s the black market rate is a somewhat distorted indicator of the marginal shadow price of foreign exchange It is still used here for an assessshyment of price policy because there is no comprehensive model of the Egyptian foreign exchange market The Egyptian government has devalued the Egyptian pound several times Nevertheless a comparison of officii exchange rates with the black market rates for the dollar reveals a permanent though fluctuating overvaluation of the currency (see Table 6) This divergency of exchange rates makes export and import prices in Egyptian pounds appear to be lower than Egypts international purchasing power
The statistics of agricultural producer and consumer prices are incomplete in Egypt Although fixed prices for producers and consumers are well documented open market prices are generally not well known Basically the open market prices used in this report are derived from unpublished statistics made available by the Central Agency for Public Mobilization and Statistics on free rural and urban consumer prices 37 For wheat and pulses free producer prices are assumed to be below free rural consumer
34Alain de Janvry Gamal Siam and Osman Gad Forced Deliveries Theii impact on the Marketed Surplus and the
Distribution of Income in Egyptian Agriculture Economics Working Paper 36 Agricultural Development Systems Prolect Ministry of Agriculture Cairo and the University of California- Berkeley Cairo September 1981
35For adescription of how price policies are implemented in Egypt see William Cuddihy Agricultural PnceManagernent in Egypt World Bank Staff Working Paper 388 (Washington DC World Bank 1980)
For more details on foreign exchange and trade policies and the impact of food subsidies see Scobie FoodSubsidies In Egypt37These basic data are available from the authors upon request
24
Table 6-Official and black market ex-change rates 1965-80
RelativeForeign
Year Official Black
Market Exchange
Biasamp
(US $LE) 1965 1966 1967 196R
230 230 230 230
112 109 116 120
1053 1110 0982 0916
1969 1970 1971 1972
230 230 230 230
110 109 120 124
1090 1110 0916 0854
1973 256 148 0729 1974 1975 1976 1977 1978
256 256 256 256 256
157 141 135 139 139
0630 0815 0896 0841 0841
199 1980
143 143
133 122
0075 0172
Sources Official exchange rates were obtained from the Central Bank of Egypt black market ex-change rates were taken from Picks Currency Yearbook various issues(New York Franz Pick Publishing Co various years)
a The relative deviation (B)of the black market rate (Wb InLEUS$)fromtheofficialrate(W inLEUS$i - WoWb
prices by a marketing margin of 5 percent Free producer prices ol rice are calculated by deducting processing costs from free consumer prices For maize sugarcane cot-ton and livestock products average pro-ducer prices derived from Ministry of Agri-culture data are assumed to apply to the total domestic supply This assumption is made because a separation of producer mar-kets either does not exist (for example for domestic maize and cotton) or is quantita-ively unimportant The latter is also true for
sugar where the majority of produce is sold to sugarcane factories and for livestock where prices are officially fixed for those livestock products that have been produced using subsidized feed but where the fixed prices are seldom enforced
An analysis of the price changes reveals some general characteristics and some commodity-specific phenomena (see Fig-ure 3) Ageneral impression is that official domestic prices to both producers and con-
sumers are much more stable than the corshyresponding international prices Domestic free prices on the other hand fluctuate substantially Throughout the 15-year periodthe domestic prices of grain wheat rice
and maize) and of pulses (beans and lentils) have been lower than the corresponding border price equivalents domestic wheat and rice prices have been even lower than the international prices at the officiai exshychange rate (see Appendix 1 Tables32-33) Depending on whether they are compared to fixed or to open market prices and omitting
the world market price boom of the early 1970s border price equivalents at the farm gate have been two to three times higherthan the producer prices of wheat and rice
Maize prices are mainly influenced by the subsidized release of imported maize most of which is used for feed Because the demand for feed has expanded rapidly faster
than the rapidly growing maize imports open market prices have risen much more swiftly than fixed prices Protection of liveshystock products has favored this development
This protection increased througho
the second half of the 1970s More recently producer prices of beef for example have been 20 to 40 percent higher than their border price equivalents at farm gate Imshyports were admitted after 1973 but limitashytions on foreign exchange at the official exchange rate and a complicated system of import license restrictions made private meat imports difficult On the consumer side the government has subsidized sales supplied mainly from imports Most of this is frozen beef With the exception of a price jump early in the 1970s the subsidized conshysumer prices have been stable since 1974 they have even been nominally constant But because these sales are rationed there exists a free market for beef where prices are considerably higher The free market prices were even higher than world market prices in the second half of the 1970s Nominal protection of milk products is also high although a comparison of international and national prices is more difficult because the traded tood milk powder cannot be easily compared to domestic milk products
Input Subsidies
To assess the effects of price intervenshytions on agricultural production it is not enough to study the taxation of major field
25
Figure 3-Nominal protection coefficients of producer prices 1965-80 Nominal
Protection Wheat and rice Coefficient 10shy
08shy VWheat
06- (official price)
N04- Ricebull
02- R(open market price)
Rice
(official price)
1975 19801965 1970
Nominal Protection
Beans and lentilsCoefficient 10- Lentils (open market price)
08- X Beants (open market price)
08
06-
Beans (official price)
02 Lentils (official price)
I I
1975 19801965 1970
Nominal Protection Cotton and beef Coefficient 14 shy12 f I
BeI 10shy
08 -
06
04- Cotton
02
1975 19801965 1970
Notes Nominal protection at the official price isthe ratio of the official producers price to the world market price equivalent at the farm gate Nominal protection at the open market price is the ratio of the open market producers price to the world market price equivalent at the farm gate The world market prices are converted using the shadow exchange rate (as given in Table 6)
26
crops or the protection of livestock products alone Several inputs including fertilizer cotton pesticides and feed are also provided at distorted prices Moreover faners benefit from indirect subsidies such as low fuel prices free irrigation water and other infra-structural services A considerable share of the direct input subsidies go to pest control for cotton
Fertilizer subsidies became important only after 1975 when world market prices rose and domestic prices were kept un-changed With the beginning of the world market boom the agricultural stabilization fund in the government budget which until then had resulted in a net taxation of inputs became a source of increasing input sub-sidization This effect is clearly indicated by the drastic expansion of the total value of direct input subsidies both in nominal and in real terms (see Table 7)
Because the subsidies on major inputs are large they can be assumed to have an important effect on production Accurate information is hard to find but an attempt is made in Table 7 to compare domestic prices and international price equivalents for nitro-gen fertilizer cattle feed supplied by public feed mix companies and berseem Com-ponents of the cattle feed mix are evaluated at their international prices The international price of berseem is computed under the as-sumption that 10 tons of berseem are equiv-alent in nutritional value to I ton of straw and I ton of feed mix 38
A comparison of national and interna-tional input prices indicates that fertilizer was taxed until the mid-1970s and was heavily subsidized in the latter part of the 1970s The tax on fertilizer was the dominant factor in the overall budget effects of input price interventions This changed when the volume of feed being distributed at hightV subsidized prices began to rise As the data in Table 7 indicate the official release price of feed mix has always been exceeded by the
international price equivalent Moreover because the international value of feed mix has been relatively high the computed inshyternational price equivalent of berseem is clearly higher than the domestic farm-gate price of berseem The domestic price of berseem is affected by two counteracting factors its marginal return in the livestock sector which is characterized by low physical outputinput ratios and the taxed price of competing field crops This may explain why the domestic berseem price lies below the international equivalent value despite proshytection of meat
Taxation The direct taxes on agriculture are only
marginal A land tax is levied on all arable land on the basis of the annual rental value of the land The rental value is assessed by the Central Administration about every 10 years This official rental value grossly unshyderestimates the actual rental value of land The tax based on this official rental value is paid by the landowner annually Its basic rate is 14 percent Between 1953 and 1973 taxable landowners whose tax liability did not exceed LE 4 weie exempt After 1973 properties of less than 3 feddans became exempt The land tax contributes less than I percent to total tax revenues and therefore is not included in the following analyses 39
Agriculture is indirectly taxed through export taxes The nominal protection rates for cotton and rice-the two major export crops of the 1960s and 1970s-indicate this The major reason why this taxation policy was adopted is its administrative and political feasibility Korayem concludes in her analysis of the issue thatit is easier and more beneficial politically and economically to the gover ment to tax farmers income disguisedly by the price differential policy of the agricultural crops than to tax this income explicitly by a specific progressive income tax 40
38 Both quantities 10 tons of berseem and I ton of feed mix plus I ton of straw are roughly equivalent in energy and
protein Yet a full substitution is not feasible due to differences in digestibility and other dietary properties For a more detailed discussion of the problem of treating berseem as atraded good see JCIngram and TMoursi Treating Berseem as aTraded Good in the Calculation of Social Returns Economlcs Working Paper 18 Agricultural Developshyment Systems Project Ministry of Agriculture Cairo and the University of California-Berkeley Cairo May 1981
39 MReda Ael- Edel Impact of Taxation on Income Distribution An Exploratory Attempt to Estimate Tax Incidence In Egypt in The Political Economy of income Distribution InEgypt ed Gouda Abdel-Khalek and Robert LTignoriNew York Holmes and Meier 1981) p 135 40Karima Korayem The Agricultural Output Pricing Policy and the Implicit Taxation of Agricultural Income in The
Political Economy ofIncome Distributionin Egypt ed Gouda Abdel- Khalek and Robert LTignor (New York Holmes and Meier 1981) p184
27
Table 7-Agricultural input subsidies and distortion of selected agricultural input prices 1965-80
Prices of Selected Inputs Total Input
Nltrigei Feed Mix Berseem Subsidies in the Pro- Inter- Government BudgetIntei Inter-
Domes nattona Ofl- national ducer national Current Year tic Equivalent clalc Equivalentd Price Equivalente Prices Deflated f
(IEinere ton) (LE million)
1965 1450 1310 125 793 37 80 -20 -31 1966 1450 1170 125 874 35 89 -10 -14 1967 1450 1030 125 796 34 81 -30 -42 1968 1450 940 135 662 22 67 -60 -85 1969 1450 830 135 733 26 75 -40 -55 1970 1450 720 135 774 24 78 -30 -40 1971 1450 770 135 738 28 75 -40 -51 1972 1450 1030 135 726 23 73 120 152 1973 1450 1380 135 769 43 79 130 158 1974 1450 2640 210 880 52 90 120 131 1975 1450 3560 210 789 48 82 810 810 1976 1450 3620 250 977 56 100 340 308 1977 1450 3700 250 1067 70 112 350 281 1978 1450 3770 250 1057 91 111 360 260 1979 1550 3840 300 1042 87 110 500 988 1980 300 1305 112 137 720 925
Sources The prices of nitro n in 1965-75 are from R R Newberg Fertilizer Subsector Assessment Egypt Multishynational Agribusiness Systems Washington DC 1979 (mimeographed) The 1976-79 prices of nitrogen are from E A Zaglui Some Proposals to Reduce Agricultural Subsidies Ministry of Agriculture Paper 6 Cairo 1979 (mimeographed) The figures for feed mix and berseem are from unpublished data from the Egyptian Ministry of Agriculture obtained in 1982 The total input subsidies in the government budget in current prices are from unpublished data obtained from the Egyptian Ministry of Finance
bull These are the average prices of nitrogen fertilizer b These are the import prices (c Lf at the official exchange rate) of ammoaium sulfate plus the domestic costs of
marketing and transportation CThese figures are the prices of cattle feed mix for fattciing
d The international equivalent price of feed mix is calculated as the weighted sum of the international prices at the
shadow exchange rate for cattle feed mix components where the weights are equal to the time variant quantity shares
The international equivalent of 10 tons of berseem is calculated as the sum of the international equivalent value of I ton of cattle feed mix at the shadow exchange rate and the value of I ton of straw at domestic prices
f These figures were deflated by the consumer price index (1975-100)
28
4
EFFECTS ON PRODUCTION OF AGRICULTURAL PRICE POLICIES AND GOVERNMENT INTERVENTION
Previous studies have demonstrated that Egyptian farmers like most farmers respond to changes in economic incentives though empirical estimates of that response vary greatly4 1 Price responsiveness is evident in area allocation and crop yields in the rapid reallocation of labor between farm and nonfarm employment and in the inter-national migration of farm labor
Because of the complexity of technical conditions such as the overlapping of sea-sons and institutional constraints such as area allotment and procurement supply elasticities are not readily available or easily estimated for Egyptian agriculture Econo-metric estimates of the supply response undertaken for this study were rejected because they were inconsistent on the ag-gregate sector level Modeling the price re-sponsiveness of yields seems to be even more difficult than modeling area response Technical changes in farm production have been dramatic during the last two decades Cuddihy was able to obtain statistically valid results with yield response models for the period 1950-75 but an attempt in this re-search to estimate crop- specific models for amorerecenttimeperiod 1960-80 failedto give plausible results for any of the four major Egyptian crops wheat rice maize and cotton which indicates that Cuddihys elasticity estimates are not valid for both periods42
This result is not surprising nor does it prove that yields do not respond to changes in Prices During the period 1950-75 par-ticularly in the second half of the period
developments affecting yields brought about major changes The construction of the Aswan High Dam which permitted secure perennial irrigation allowed rice and maize area to expand into reclaimed desert land where the yield potential is lower Water management problems and the rising water table reduced yields in some areas Losses of fertile old lands to settlement offset reclamation of new lands leading to a reshyduction in average yields At the same time increasing supplies of fertilizer and pesticide helped to balance some of these effects Finally changes in the availability of inputs and resources such as labor and fertilizer changed cropping patterns and intensities
In sum there is no simple way to assess acreage and yield response to price changes in Egypt in the short or medium run The agricultural data available do not permit a satisfactory econometric analysis incorporatshying 1I the factors mentioned above Moreshyover constraints on resources such as land and irrigation water aid shifts in the quality of resources such as soils cannot easily be taken into account In principle this problem could have been solved with a simultaneously estimated system43 But because changes in prices in the past were modest the paramshyeter estimates would have been overstrained if used to analyze fundamental price policy changes as is intended here The effects a major change in the pricing system would have on allocation can hardly be derived from an econometric model that relies for information about the actual system on past data alone
I see Cuddihy Agricultural Price Management inEgypt Bent Hansen and Karim Nashashibi Foreign Trade Regimes and Economic Development Egypt(New York National Bureau of Economic Research 1975) Hadi Esfahani and Alexander H Sarris Agricultural Supply Response for the Main Crops in Egypt tconomics Working Paper 35 Ag aliltural Deshyvelopment Systems Project Ministry of Agriculture Cairo and the University of California-Berkeley Cairo August 1981 and Joachim von Braun Agricultural Sector Analysis and Food Supply in Egypt Interim Report of the Joint Project of the Institute of Agricultural Economics University of Gttingen and the Institute of National Planning Cairo February 1980 (mimeographed) 42 Cuddihy Agricultural Price Management in Egypt pp 32-41 43 Hansen and Nashashibi chose such an approach in their analysis for the 1960s See Hansen and Nashashibi Foreign Trade Regimes and Economic Development Egypt
29
Thus a programming model for agricul-ture is used to derive supply elasticities for specific products Despite the well-known shortcomings of such models they allow the relevant constraints to be incorporated more explicitly and policy instruments to be handled more flexibly The responses of yield arid area to prices are in fact artificial co titualizations of production decisions that are actually made simultaneously In that sense a programming mode is closer to reality The model analysis not only provides the required supply- response parameters for further analysis but it gives additional in-formation on the complex linkages within the sector
Features of a Sector Model
rhe objective function of the model is to allocate resources in order to maximize farm income44 All prices are calculated at the farm gate Resources are allocated ac-cording to the comparative advantages of alternative production activities at prices actually perceived by the producers Price averages foi the year 197980 are used Demand is fixed for that year hence trade is a residual determined by domestic producshytion and consumption This seems to be a realistic specification given the government planning procedure for trade which starts by defining food needs and calculates im-port demand and export supply considering
45 supply from domestic sources This method of trade planning may also explain the low responsiveness of food imports to inter-national price fluctuations46
The model is of a static linear program-ming type It incorporates 18 field crops and 5 animal products Activities for each prod-uct usually consist of production marketing and either importation or exportation For major field crops fertilizer-yield functions are approximated Other major activities are
the provision of inputs including draft animals tractors fertilizers water and labor Water is endogenously distributv-d throughshyout the year according to the monthly reshyquirements resulting from the particular cropping pattern and constrained by the annual supplies from the High Dam Labor is separated into a fixed family labor supply and a variable supply of hired labor
The restrictions of the model include resource capacities differentiated by seasons or months balances for variable factors such as feed and fertilizers and crop rotation stipulations Subsistence demand which is fixed is defined as consumption on a farm of its own produce Trade restrictions account for constraints on the capacity of marketing institutions to successfully manage the quanshytities of products required For example the export traders thathandle fruits and vegetables must be able to store them properly and to ship them promptly to avoid rotting Aconshystraint equal to their processing capacities is also placed on sugar processing The govshyernments intervention in area allocation and the enforced quotas are incorporated where applicable The model includes 182 rows of 137 activities in its basic version An extensive presentation of the entire model will not be furnished in this report4 7
Production Structures under Different Price Regimes
The model analyzes the production efshyfects of the different price regimes It is a comparative static analysis Changes in Egypts agriculture that might result from changes in export marketing and from geshynetic and technical innovations are not exshyplored Insofar as price policy induces such changes sectoral growth effects may be underestimated 4
The different price regimes are presented
4 The structure of the model is presented in von Braun and de Haen Egypt and the EEC- p 52 41 See Aiderman von Braun and Sala Egypts Food Subsidy and Rationing System pp 36-41 46 Scobie Government Policy and Food Imports
47 The model is an updated and inodified version of a model developed in a joint project of the Institute of Agricultural
Economics University of Gbttingen and the Institute of National Planning Cairo Shawky Imam of the University of
Zagazig contributed significantly to an earlier version of the model Adocumentation of the current model is availshy
able from the authors See von Braun Agricultural Sector Analysis and Food Supply
48See for example the agricultural export production data in von Braun and de Haen Egypt and the Enlargement of
the EEC p 53
30
in five scenarios Scenario 1 represents production and allocation in the present system taking into consideration area allot-ment delivery regulations current product prices and input prices By comparing the actual structure of production and factor allocation this scenario helps to explain the discrepancies between the model and reality (see Table 8) The discrepancies that arise are not always negligible but to con-strain them would reduce the flexibility of the model
Scenarios 2 and 3 give some insights into the partial production effects of de-pressed cereal prices Wheat prices are increased to their border price equivalents in scenario 2 the same is done for rice in scenario3 Everything else stays the same as in scena I Scenarios 2 and 3 yield hypo-thetical suipply elasticities for the two crops The implicit price elasticity of supply for wheat calculated from scenarios 1 and 2 is 026 and the one for rice calculated from scenarios I and 3 is 059 This lies within the range of elasticities estimated econo-metrically by others for locations with similar agrarian structures and perennial irrigation49
Under the rigid ares allotment assumption for cotton no cross effects may appear but price increases for rice and wheat reduce maize and berseem production This is the result of increased cropping intensity and of changes in area allocation
Aresult of scenario 3 that is not immedishyately obvious is the increase in wheat proshyduction that follows an increase in rice prices (see Table 8) Rice production would increase mainly at the e-p1 ense of maize the other summer grain Maize provides fodder in the fall It is possible that only some of the roughage needed would be provided by imported maize concentrates Therefore whedt straw would be used as a supplemental fodder The shadow prices of feed rise as a result (see the starch figures in Table 9) Wheat area is expanded but the intensity of input use on wheat is reduced because the by-product wheat straw which is now of major importance is not as responsive to fertilizer as the wheat grain itself The role wheat straw plays in the decision to grow wheat is stressed by this scenario where fodder is less available as a result of the decrease in maize
Table 8- Effects of alternative agricultural pricing policies and government intershyventions on production 197980
Scenario 1 2 3 4 5
Current Increased Increased No Quotas International System Wheat Rice or Area Prices for
Actual Pricea Price Restric- All Inputs Commodity Unit 197980 tions and Outputs
Wheat 1000 metric tons 1826 1560 2019 2016 1775 889
Beans and lentils 1000 metric tons 237 283 283 283 228 393
Maize and sorghum 1000 metric tons 3628 3093 3093 2267 3245 2374
Rice (paddy) 1000 metric tons 2448 2299 2531 3796 2298 3318
Cotton (lint) 1000 metric tons 498 485 485 485 485 536
Beef 1000 metric tons 337 272 278 284 269 246
Sources The actual figures for 197980 are from the Egyptian Ministry of Agriculture The remaining figures are the results of computations made using the linear programming model of agriculture
This price is increased to the international equivalent
49 See Hossein Askari and John T Cummings Agricultural Supply Response A Survey ofthe Econometric Evidence (New York Praeger Publishers 1976)
31
In scenario 3 the expansion of rice area leads to water scarcity Water gets a shadow price which it does not in scenario 1 (see Table 9) This too favors wheat production as wheat requires about 30 percent less water than berseem its major seasonal competitor
Scenario 4 demonstrates the implica-tions of direct government intervention in area allotment and marketing of food com- modities It is assumed that the area allot-ment for all crops but cotton is no longer enforced and no quota is required Former quota prices are raised to equal domestic open market prices This leads to increases in the production of wheat and maize and decreases in the production of pulses (beans and lentils) Rice area formerly enforccd by area allotment declines but increases in intensity Its production is almost unaffected
Most of the abandoned rice area is taken over by maize
Finally scenario 5 uses international prices for all inputs and outputs None of the crops are prcured or their area restricted by the government Under these conditions production of maize wheat and beef drops considerably When the livestock market is no longer protected production of the fodder crops wheat and maize also declines
On the other hand cotton and rice producshytion increase greatly Feed requirements are balanced with increased berseem producshytion and maize impcrts Under the circumshystances the supply of draft power from the domestic buffalo and cattle herd becomes more scarce which is indicated by an increased shadow price for horsepower and decreased shadow price for feed (Table 9) Gains from mechanization would be much higher under such conditions than under current conditions Moreover the shadow prices for land would decrease because the area sown with highly profitable crops would no longer be constrained by area allotments for low- price commodities The water shadow price implies that under an international price regime and without area allocation a water-pricing system would have to be inshytroduced This implication cannot be invesshytigated in this study but it indicates the need to tackle water management problems under a more market-oriented system 50
The water issue and the complex intershyactions of crop and livestock production illuminate the need for consistent sector modeling The modeling exercise stresses that when agriculture is constrained by tight land resources the frequently stated asshysumption that supply elasticities are greater
Table 9- Effects of alternative agricultural pricing policies and government intershy
ventions on shadow prices 197980
Shadow Prices
Land winter season Land summer season Water
Starch Horsepower
Unit
LEfeddan LEfeddanLE1000
cubic meters LEmetric ton LEhorsepower
Scenario
I 2 3 4 5 Current System
Increased Wheat
Increased Rice
No Quotas or Area
International Prices for
Price Price Restric-tions
All Inputs and Outputs
176 179 143 176 115 110 112 55 110 69
18 8 144 146 165 144 142 70 72 94 70 171
Sources These are the results of computations made using the linear programming model of agriculture 8This price is increased to the international equivalent
so Amore disaggiegateu modeling exercise that focuses particularly on the water issue isprovided by Gary PKutcher The Agro- Economic Model Master Plan for Water Resources Development and Use Technical Report 16 Cairo May 1980 (mimeographed)
32
than zero may not be realistic if all input and cropping pattern Hence changes in prices output prices vary simultaneously5 Reduc- and price ratios for the basic food crops and tions in supply are then possible as cross-price effects might overcompensate own-price effects even when prices as a whole rise This is particularly relevant for Egypt where land is scarce an-i the water supply is inflexible
One might argue that the total cultivated land base is also a function of agricultural prices Land reclamation might increase if prices do But this does not seem valid for a number of reasons Land reclamation is mainly undertaken by the public sector and exogenouslydecided 52 Neither the value of the crops to the economy at international prices nor the actual domestic prices appear to have affected the governments decision to expand crop land Moreover the new lands are exempt from any area allotment plan Farmers are free to choose their optima
cotton would not greatly affect returns from new lands which are mostly devoted to fruits vegetables and fodder crops
Addressing the other major concern of Egypts agricultural policy the decreasing self-sufficiency in major staples the effect of a shift to international prices would be neutral The decreases in the production of wheat and maize following such a change in price policy would be roughly offset by increased production of rice and pulses
Whether so rigorous a change as a shift to world market prices would be socially optimal depends upon how risk aversive Egypt is 53 An estimate of national risk aversion could be used to refine the assumpshytion that international prices represent the opportunity costs of production But no such estimate seems possible
51Lutz and Scandizzo for example use supply elasticities assumed to range fromOO toO65 for awelfare analysis of Egypts agricultural price policy on rice cotton and wheat The higher elasticities lead to inconsistent results for production effects of the price distortions assuming that elasticities being 0 is not plausible given the indications of strong response to economic incentives from regression models See Ernst Lutz and Pasquale L Scandizzo Price Distortions in Developing Countries A Bias against Agriculture European Review ofiAgriculturalEconomics 7(No I 1980) 5-27 52 Gotsch and Dyer Rhetoric and Reason in the Egyptian New Lands Debate pp 129-133
53 Sarris indicates that crops that are socially profitable when risk aversion is low (as it is for cash crops in Egypt)become less attractive when risk aversion is high and give way to subsistence crops This reasoning while valid is not taken into account here See Alexdnder H Sarris Food Security and Agricultural Production Strategies Under Risk in Egypt Working Paper249 Division of Agricultural Sciences University of California Berkeley March 1983 (mimeographed)
33
5 HOW FOOD SUBSIDIES AFFECT PUBLIC SPENDING ON AGRICULTURE
Since 1973 food subsidies which were negligible in the 1960s have accounted for 7 to 15 percent of total public expenditures The additional drain on the budget in the 1970s had repercussions on other expendi-tures as they were not entirely financed by increased revenues or deficit spending In analyzing the budget rcallocation effects of food subsidies the governments fiscal pol-icy toward agriculture will be examined
Problems in Analyzing Government Behavior
Unfortunately most theories on how governments allocate funds are largely un-related to each other they seem to have only limited applicability to analyses of government behavior in systems with less
informalized democratic structures and developing economies54
Attempts to study systematic patterns of government behavior for Egypt are aggravated by its recent history The situation in the Middle East the wars during the 1960s and early 1970s the basic change in political-economic strategy in the 1970s and the frequent reshuffling of institutions such as the parliament (Peoples Assembly) minshyistries and political parties are indications of that
Because of tnese problems this analysis is restricted to a descriptive approach It may be looked at as an attempt to better un-derstand the governments fiscal policy behavior Some of the hypotheses underlying earlier models will be taken into considerashytion But it is clear that any attempt to estimate these hypotheses empirically will encounter many difficulties
Shifts in Patterns of Public Expenditures
Before an explanatory model of public spending on agriculture can be devised basic changes in the size and structure of public spending must be examined The actual decisionmaking process its adminshyistrative setup and political- economic deshyterminants will be addressed later
The following budget equation which distinguishes between nonagricultural agrishycultural and food subsidy spending holds for a given year (t)
Rt + Dt = Nt + At + Ft (1)
where
R =government revenues D =the budget deficit N= rnonagricultural expenditures (excludshy
ing food subsidies)
A = public expenditures for agriculture F = food subsidies and t = the index for the fiscal year
The additional financial resources spent on food subsidies must be subtracted from means spent for nonagricultural or agriculshytural purposes financed out of increased revenues or financed through deficit spendshying Thus
AFt t_ = ARtt + ADt1t_I
-ANt 1t 1 -AAt (2)
5 For areview of models tried see Anthony BAtkinson and Joseph EStiglitz Lectures on Public Economics( New York McGraw-Hill Book Co 1980) pp 294-330
34
To begin with some indications of gov-emiments behavior in the frame defined by equation (2) may be derived from i graphic analysis Figures 4 and 5 show the dramatic changes in the size and structure of public expenditures that have 2ccurred since 1972 These changes complicate any analysis of the effects of rising food subsidy bills as ether budget components also fluctuated considerably During the period 1973-80 at the same time that food subsidies rose there was rapid growth (in real terms) of all major budget components Revenues rose mainly as a result of increased oil exports Public-sector investments did not keep pace with these growth rates The governments current expenditures increased dramatically as a result of a growing public-sector work force In part this expansion of the work force could be considered as an employment program Military expenditures and losses in public-sector industries were also costly The overall deficit increased sharply to more than 50 percent of the total budget in 1975 but has shrunk steadily since then
The agricultural budget which had been steadily declining since the mid- 1960s has grown in real terms since 1974 (see Figures 6 ind7) Therise in public expenditures in the aid-1970sreflectstheendofthewarburden and a reshuffling of the economy toward a more open and privately oriented system GDP in real terms grew twice as fast during the period 1972-80 than during 1965-72(73 percent versus 37 percent) The relationship between growth of GDP and public expendishyture growth shows that Egypt is not an ex-ception to Wagners aw of rising public expenditures in the growth process5 5 The expenditure elasticity of GDP rose to 18 during 1972-80 whereas it was unity for 1965-72 (see Table 10)
Agriculture was treated differently in the two time periods Considering the impor-tance to the economy of the employment and national income generated by agricul-ture public investment in agriculture was low during the first period Nevertheless public investment contributed the major share of total investment in the sector The
negative expenditure elasticity of GDP(-079) for the sector during 1965-72 indicates that it was neglected Investment in agriculture was cut back even more than total spending during this time Although it rose remarkably in the 1970s the shares of total public expenditure on agriculture and agricultural investment did not again become as large as they were in the mid- 1960s (see Table 10) However the growth of spending on agriculshyture was higher than the growth of total public expenditures
Of course negative expenditure elasticishyties for agriculture before subsidies became so prevalent (1965-72) and high positive ones during the time of extensive subsidyspending do not necessarily indicate a causal relationship between food subsidies and public expenditures on agriculture Still it is worth considering that gross fiscal support of agriculture was growing rapidly at the same time that agricultures importance to the economy in the share of GDP and emshyployrr nt was shrinking (see Table i) Thus the idea that agriculture was sulering from absnhlte reductions in public spending when food subsidies were rising does not seem to be supported Amajor reason for the support of agriculture may have been the dramatic decrease in self-sufficiency in basic food items during the 1970s which was a matter of concern to those who formulate Egyptian food policy
Changing Structures of the AAgcultural Budget
Figures 6 and7 show that the agricultural budget has undergone far-reaching structural changes Input subsidies mainly for fertilshyizer and pesticides became a major comshyponent of the budget in the 1970s whereas these commodities were slightly taxed in the 1960s Other current expenditures were stable in real terms but their share decreased because expenditures on investment and input subsidies grew In order to analyze
Wagners underlying hypothesis isthat pressure for social considerations inthe growth process san additional driving force for increased public spending This seems to be valid 1jr Egypt as well The extend_d sucial spending among which food subsidies are amajor element iswidely see as anecessary social networ in aperiod of rapidgrowth and structural change See Richard AMusgrave and reggy BMusgrave PublicFinanc inTeoiy and Practice (Tokyo McGraw-Hill Kogakusha 1973) p 116 andAiderman von Braun and Saki ERyptsFcodSubsidyandRation-Ing System pp 13-18
35
Figure 4-Deficits and revenues in public expenditure 1965-80 1975 LE Million
5000-
Total expenditures
4000shy
3000shy
2000 shy
1951970 1975 1980
Sources Calculations based on data from the Egyptian Ministries of Economy and Finance
Figure 5D-Structure of public expenditure 196580 1975 LE Million
5000
expenditure Food subsidies1Toni 4000
3000shycurrent expenditure
uInvestment
19801965 1970 1975
Sources Calculations based on data from the Egyptian Ministries of Economy and Finance
36
Figure 6-Government expenditures on agriculture 1965-80
1975 LE Million
Total government expenditures
300 on agriculture 1 Iogricultura
input 2 subsilies
2 Curent -- - agricul-tu ral-
- experndures
100- _ Agricultural investment
1975 19801995 1170 Sources Calculations based on data from the Egyptian Ministries of Economy and Finance
Figure 7--Share of agricultural investment current expenditures and input subshysidies in total government expenditures 1965-80
Percent of Total Budget 12
Agricultural
Total government input 8 agricultural expenditure on subsidies
exe iueagriculture
4shy-
investment Agricultural -
1965 1970 1975 1980
Sources Calculations based on ua from the Egyptian Ministries of Economy and Finance Note Agricultural input subsidies showed small profitsduring 1965-71
37
Table 10-Relationship between increases in public spending on agriculture GDP and total expenditures 1965-72 and 1972-80
Agricultural Total Agricultural Investment
Expenditure Expendltur Expenditure Elasticity ElasticiR Elasticity of GDPc of GDP of GDOPeriod
-079 -177 197 215
1965-72 101 1972-80 182
AgriculturalExpenditure
Elasticity of Total PublicExpenditured
-07R IOt)
Sources These are the results of computations using data from the Egyptian Ministry of Planning The GDP figures from before 1977 were taken from World Bank statistics the GDP figures for 1977-80 were taken from
unpublished statistics of the Egyptian Ministry of Economy obtained in 1982
This Is the ratio of the percentage increase in public expenditure to the percentage increase in the GDP Note that
the expenditure elasticities of the GNP are slightly lower for the 1972-80 period as the net factor incomes from workers remittances caused GNP to increase faster than GDP b This is the ratio of the percentage increase in public expenditures on agriculture to the percentage increase in GDP
GDPI This is the ratio of the percentage increase in agricultural investment expenditures to the percentage increase itn
d This is the ratio of he percentage increase in public expenditures on agriculture to the percentage iicrt e in total
public expenditures
these changes and their relation to spending on food subsidies within the budget frame-work equation (1) is decomposed
R+ D= NC + Nl + AC+ Al + AS + F1 (3)
whel
current expendituresNC = nonagricultural= xcagfotordlcubsiies)ntr(excliding food subsidies)
NI = nonagricultural investment
AC = agricultural current expenditures (ex-cluding agricultural input subsidies)
Al = agricultural investment and
AS = agricultural input subsidies
The correlation coefficients of the shares of the components in total expenditures are shown in Table 11 It is widely assumed that food subsidies are positively corelated with the budget deficit however the correlation (051) turns out to be not very high The negative correlation food subsidies have with public investment in agriculture on the one hand and the positive correlation they have with nonagriculttral investment on the other are striking This seems to con-tradict the general impression derived from the expenditure elasticities and the earlier
graphic analysis But the discrete comparison of two time periods does not take into account dynamic adjustments in the budget realloshycation process In fact the share of food subsidies was at its height in 1974 when agricultural investment was lowest both in real terms and as measured against total public expenditures Though it shrank rapidly
in the second half of the 1960s and the early 1970s in absolute terms agricultural inshyvestment commanded a much higher share
of the total budget than when food subsidies
were rising This explains the fairly high negative correlation (--074) estimated for
the entire 1965-80 period Nonagricultural investment however continued to grow but at the cost of other budget components
and a growing deficit While the traditional components of the
agricultural budget- investment and curshyrent expenditures- decreased the new oneshyinput subsidies- increased as did food subsidies Thus there appears to be a high positive correlation between the two subshysidlies Clearly when import prices rose and uncontrolled domestic prices were inflated the government attempted to stabilize both consumer prices and input prices But although correlation analysis provides inshyformation on the statistical relations between variables one must refrain from interpreting coefficients in causal relation3hips
38
Table 1I1-Correlation coefficients of shares of budget components with special focus on the agricultural budget 1965-80
Budget Nonagricultural Agricultural Food Subsidies Component NC NI AC Al AS F
D -O54 OS7 -075 076 049 OSI NC -093 074 066 072 -089 NI -066 -069 059 071 AC 073 -084 -085 Al -067 -074 AS 086
Notes D stands for the budget deficit NC Is nonagricultural current expenditures excluding food subsidies and NI is nonagricultural investment AC is current agricultural expenditures excluding agricultural inputsubsidies Al stands for agricultural investment AS agricultural input subsidies and F food sJl)sidies Ccr relation coefficients for revenues are not lited as they are the same as for Dbut with opposite signs
The Role of Food Subsidies in current expenditures deficits and invest-Budgetary Decisionmaking ments Government- cop-rolled consumerprices and rations are unsidered to be
inflexible in this system partly as a result The natlunal budget in Egypt is created of the consumer protests that occurred in
by a complex procedure carried out by the the 1970s after attempts to alter consumer established political institutions influenced pricing58
by major political interest groups 5 6 Tech- The agricultural budget currently involves nically the budget is drafted by the Ministry three separate ministries the Ministry of of Finance in coordination with the ministries Agriculture and Food Security the Ministry concerned It is then discussed and modified of Irrigation and the Sudan and the Ministry in committees of the Peoples Assembly and of Reconstruction and Land Reclamation the Cabinet and delivered to the president Their inestment budgets are handled mainly who presents it to the Peoples Assembly for by state-owned companies authorities for final approval specific programs or crops and regional
The political decisionmaking on the agencies Because the ministries themselves national budget starts with an estimation of act only as consultants in setting agricultural expected revenues and a limit set for the price policy their ability to generaterevenues deficit A ubsidy allocations are given a for agriculture is limited S9 high priority5 7 other budget components The budget shares of preceding years are are adjusted to them The actual food subsidy considered in decisionmaking by the cabinet bill is deternined mainly by fluctuations in Consequently the allocations for adminshyinternational trade and the predetermined istration and investment of the three minisshyquantities to be channeled into the distribu- tries handling agricultural affairs are fairly tion sstem Additional adjustments might stable60 A large share of budget expendishybe made if the international prices assumed tures such as administrative costs is preshydiffer 1om the real ones Because revenues determined The general size of the budget are fixed in the short run short-term ad- is a matter of political priority and changing justments to subsidies are made in other it is not an issue in the short term
The authors are indebted to Ismail Badawy of the Ministry of Economy Saad Barghout of the Ministry of Economy and the Ministry of Planning and Yahya Mohie el- Din of the Ministry of Agriculture for clarification of this issue S7See for example Egyptian Gazette June 14 1980 pp 1-2 see Alderman von araun and Sakr Egypts Food Subsidy and Rationing System pp 59-61
s See Habashy Fitch and Rehiwi Egypts Agricultural Cropping Pattern 60 The permanent budget hypothesis is discussed in 0 A Davis M A H Dempster and A Wildavsky A Theory of the Budgetary Process American PoliticalScience Review 60 (September 1966) 529-547
39
The long-term reduction of agricultural attempts to keep consumer prices down But investment in the 1960s and 1970s was efforts to reduce the deficit require adjustshyapparently based on the assumption that ment somewhere in the budget which could marginal capital productivity would be affect spending on agrizulture smaller in agriculture than in other sectors These statements can be transformed Agriculture grew less than expected follow- into hypotheses that can be tested in a reshying the construction of the Aswan High gression model One such hypothesis is vhat Dam Discouraging results from capital- the ministerial bureaucracies attempt to intensive efforts in new land reclamation defend their shares of the total budget may have contributed to this too Moreover Another is that adjustments in the budget contraction and expansion of the agricultural structure and thus in agriculture are enshybudget are mainly determined by invest- forced by exogenously fluctuating and preshyinent which suffered from a change in atti- determined components such as food subshytude toward investment in reclaiming new sidies and other current expenditures of land Land reclamation accounted for about high priority And a third is that the growth 80 percent of the agricultural investment of the budget deficit measured as a share of budget between 196566 and 197 172 but it the total budget induces cutbacks on exshywas reduced to 51 percent by 19798061 penditures perhaps in agriculture Improvement of old land already under cul- For a regression model qtructurala tivation--through drainage projects for equation is written with the hypothetical example-and investment in research and igns of parameters defined as development on animal production and specific crops wuook over an important share 0= - t-1+ Pa- P2 ft of the budget (see Figure 8)
The government provides an employ- -P 3ct- 1 - 4 dt I+ (4) ment guarantee for university graduates where This adds an item to the budget that like food subsidies is exogenous to it Increased a = the share of the agricultural budget in enrollment and population growth of those the total budget in year t= ([AC + AIJ in the relevant age groups is causing the [Rt+ DtJ) - 100 number of graduates to grow rapidly This has increased the wage bill of the public fl-= the change of the share of food subshysector The 1980 budget provided for 148400 sidies in the total budget from the
= (Ft[R + DtJnew jobs in government mostly for grad- previous year to year t uates62 These new jobs represent an increase - F1t 1 [R1t 1 + DI]1 1 ) 100 of about 8 percent of total government CtJt_ the change of the share of nonagrishyemployees The government actually took
=
cultural current expenditures in the steps to abrogate the employment guarantee total budget from the previous year in 1979 but the policy was reversed in 1980 to year t (that is total current expen-Redundancy seems unavoidable at such ditures less all subsidies) defined growth rates But social and political objec- as equivalent to f- tives similar to those for consumer subsidies
dt-=the change of the share of the overallkeep this policy in action The deficit in the national budget is a deficit in the total budget from the
asprevious year to year tdefinedmatter of continuous concern to the Egyptian equivalent to ft-government 63 The inflationary implications and
of this deficit counteract the governments Et error term
I Direct investment for the Iligh gricultural project is not included inDam which is not considered primarily an
the comparison Figure 8 shows it for illustrative purposes Its inclusion would indicate an even more rapid shift away from new land reclamation policy
61International Labour OrganisationUnited Nations Development Programme Employment Opportunities and Equity in aChanging Economy Egypt in the 1980s draft report of the ILOUNDP Emploment Strategy Mission 1980 (mimeographed) 61See for example Egypt Economic Conference Document on Statement of Minister of Economy Cairo February
13-15 1982 (In Arabic)
40
Figure 8-Public investment in agriculture 1965-80 1975 LE Million
170
160
150
140
130
120
Total public110 investment in
agriculture
100-
90
80
70-
70 New land Improvement60 reclamation of old land
and related 50 investment I
xX 40 Other
4 0 - Aswan bull s agriculturalinvestment
30 High Dam investmen
20
l I I I I I
1965 1970 1975 1980
Sources Calculations based on data from the Egyptian Ministries of Economy and Finance Notes Atentative grouping of total public investment in agriculture isonly possible because some of the titles
cover several activities in different fields Investment in the Aswan High Dam isnot Included in total public investment in agriculture
41
The ordinary least square estimation results show that all parameters have the expected sign and are statistically signifi-cant at the 95 percent level6
a = 01053 + 09523 at- -01445 ft 1 (1487) (-185)
-00919 ctt_1 -05 3 5 dtt-1 (-214) (-347) (5)
ft2 - 0958 DW = 296
The share of the agricultural budget in the total budget decreased when the changes of the share of food subsidies other current expenditures and the deficit were rising Though its share in the total budget is small
agriculture was a residual recipient of public funds Other sectors such as housing also tended to be residual recipients The overall effect of food subsidies was not overwhelmshying I ut they were important in reducing spending on agriculture in some years such as 197374 (see Figure 9) The parametc rs estimated indicate that a 10 percent increase in the share of food subsidies in total expenditures would reduce agricultureb share by 14 percent If there were a similar change in nonsubsidy c irrent expenditures or if the deficit changed by 10 percent the effect on public spending on agriculture would be smaller (09 or 05 percent) Still as the fluctuations of deficit and nonsubsidy current expenditures were much higher than those of food subsidies their effects on the agricultural budget were greater than those of food subsidies
64 The Durbin-Watson statistic indicates that the parameters estimated may not be free from distortions because of autocorrelation of residuals But intercorrelatIons betweenft -i ct -and d t-I are so smallffc--056 fd-O18 cd--004) that they do not cause distortions from that side
42
Figure 9-Actual development and a model estimate of government expenditures on agriculture and the role of food subsidies 1966-80
Percent of Total Government Expenditures
11shy
Actual share of agricultural budget
10 -i
9
8
7 -bull
6-Estimated share of agricultural budget
-- I
4--
Not 3-
Estimated effect of change
2 in the share of food subsidies on the agricultural budget
1966 1970 675980
Sources Calculations based on data from the Egyptian Ministries of Ecoromy and Finance Notes The change in the share of food subsidies in the agricultural budget was calculated from equation (4) It is
the estimated parameter P2 multiplied by observed values of flt-1
43
6 CONSEQUENCES OF GOVERNMENT INTERVENTION IN AGRICULTURE
In this chapter the effects of price and market intervention policies on agricultural income on nroducer and consumer welfare and on the Ijvernment budget are analyzed This market analysis by commodity provides the groundwork for a final policy evaluation based on an assessment of the burden on agriculture
All major agricultural commodities listed below are included in the market analysis65
Percent of Cropped Area
Commodity 197980
Wheat and wheat products 125
Rice 93 Maize 168 Beans 26 Lentils 02 Sugar 22 Cotton 107 Beef Milk and milk products
Feed 48
Sorghum barley 48 Concentrates
InputsFertilizerPesticides
About 84 percent of the agricultural area is covered by these crops The share of these major commodities in household expendi-tures on food is about 73 percent6T
Apartial equilibrium model of the market for each of these commodities is constructed The model incorporates the major instrushyments of food and agricultural policies affecting it which include government proshycurement policies government import and export policies government food distribution schemes dual pricing on both the producer and consumer sides of the market input subsidies for the field crops and subsidized feed distribution to livestock producers
Theoretical Basis for Evaluating the Effects of Price Distortions
Gains and losses from price distortions are derived using a comparative static comshyputation of economic surplus for major agrishycultural commodities The procedure is well known and its merits and its shortcomings have been frequently discussed 67 However a few clarifications are necessary for this study
To know what gains and losses are proshyduced by the price distortions and governshyment interventions induced by subsidiesrequires knowledge of the prices (and proshyduction technology) that would prevail in a hypothetical situation with or without reshyduced food subsidies If food subsidies were the only reason for interventions in the
agricultural markets one would expect that without subsidies there would be free trade with world market prices also serving as domestic prices to producers and consumers But government interventions have other
6 These percentages are calculated from unpublished data provided by the Ministry of Agriculture Institute of Agricultural Economics Research and Statistics Cairo 1982 66 In 197475 houshold expenditures on wheat rice maize beans lentils sugar meat and milk and milk products accounted for 76 percent of the average total expenditure on food in rural households and 68 percent in urban ones (Egypt Central Agency for Public Mobilization and Statistics Family Budget Survy 197475 [Cairo CAPMAS 19781) 67 See J MCurrie JAMurphy and ASchmitz The Concept of Economic Surplus and its Use InEconomic Analysis EconomicJoumal I81(December 1971) 741-799 and JLesourne CostBenefitAnalyssandEconomic Theory (Amsterdam and Oxford Elsevier-North Holland 1975)
44
purposes as well For example the prices of export crops are taxed in order to increase government income and some livestock products are protected in order to stimulate domestic production As long as policy goals other than keeping food prices low exist one cannot assume that a removal of food subsidies wculd rcsult in free trade prices Prices would lie somewhere between current and world market prices Without an explanatory model of agricultural policy decisions it is impossible to separate ob-served price distortions according to the policy goals and instruments behind them
Despite this world market prices are used as a basis for computing the sum of all policy- induced distortions There are several reasons why this seems acceptable First the assurance of low-cost food supplies managed through import subsidies is clearly the dominant goal of agricultural policies in Egypt Imports apart from food aid dis-tributed domestically at subsidized prices are paid for at international prices and thus represent the opportunity cost Second even those interventions in agriculture that are motivated by taxation objectives may stem indirectly from food subsidies insofar as subsidies are a prominent reason for the persistent budget deficit in Egypt Moreover distortions induced by policy provide abasis for an analysis in which the objectives of policy are formulated as exogenous deter-minants of the development of the distorshytions (see Chapter 7)
Price distortions in the following analysis are defined as the divergence between the price of a good at the farm gate (producer price distortions) or at the Cairo retail market (consumer price distortions) and the cor-responding international price International prices are evaluated at the shadow exchange rate and adjusted for transportation costs and state of processing The price wedge resulting frorm the comparison for producers is corrected further to include the input subsidies for each unit of output (see Chap-ter 3)
The computations of the effects of price distortions in major commodity markets on welfare and the budget during the period
1965-80 were made using the following equations Where relevant a distinction is made between controlled and free markets68
The net social loss in production (NSLp) is
NSLp=I2(0w-Q)(P w- p)=2t tl V (5)P (
where
Q = production at domestic prices
Qw = production at world prices Pw = border price equivalent at the shadow
exchange rate Po = producer price on the uncontrolled PP open market
tp tc = proportion of tariff in the domestic producer or consumer price on the open market ([P - Pp]Pp or [P -PC)PC)
1s 1d = supply and demand multipliers measured as the relative change of quantities of a commodity in reshysponse to changes of its own price after a shift of all prices to free trade prices and
o V = value of production at P
The net social loss in consumption (NSLc) is
NSc= 2(C -C) (PCO-P)= 2 t dR (6) where
PO = consumer price on the uncontrolled open market
C = consumption at domestic prices
C = consumption at world prices and deg R = value of consumption at PC
The welfare gain of producers (Gp) is
Gp= Qf(P +s- Pw) +
(Q- Q) (Pp + s - Pw) - NSLp (7)
68 The nomenclature and structure closely follow Bale and Lutz See Malcolm DBale and Ernst Lutz Price Distortions inAgriculture and their Effects An International Comparison AmericanJournalofAgriculturalEconomics63 (January1981) 8-22
45
where
Pf = fixed procurement price
(i = procurement of domestic supplies and
s = direct input subsidy per unit of output
The welfare gain of consumers (Gc) is
f ff 0eters Gc- C (Pw-Pfc)+(C-Cf)(Pw- Pc) - NSLc (8)
where
Pf = fixed consumer price and
Cf = consumption out ofgovernment suppliesat fixed prices
An increase in budget expenditures (TB) is TB = Oa (PI + s + kd - Pfc)
TB- Qf (P f+ sk - P W) - 0) (P + s + kd - P )
+M(PI +km - Pm) (9)
where
kd km= costs of processing marketing and transporting of either procured quantities or imports
Q1 = procured quantity sold to domestic
consumers (the rest s exported)
P = border price equivalent at the offi-Scial exchange ratecialexchngeateresponse
Pin = release price of the imported com-modity going either to consumers or to feed users and
M = imports
The computation of the net social losses of supply and demand is complicated by the hypothetical amounts produced and con-sumed at world prices which are supposed to result not only from a change of their own prices but from adjustments of all other prices as well Hence to assure consistent analysis the parameters 17 and tidin equa-tions (5)and (6) are not defined as the usual
price elasticities of supply and demand which hold true only if nothing but the own price of a respective commodity changes but as implicit multipliers of quantities relshyative to a change in the own price accomshypanying changes in other prices (P with j=1 n m) which set them equal to world market prices
Let Q be a linear supply function of comshymodity i with f3 representing the paramshy69 Thus
m Q +ZPu Pi (10)
The relative change of production Qresulting from changes in all prices can then
be written
in AQi=EI fIampAP (11)
Inserting this into equation (5) gives the
net social loss in production
m
NSLpi= 2 1FPi APjbull AP (12)
0where AP = Pwi - Po
Defining the multiplier as the relative
change of production per unit of a relative change oftothea simultaneousown price measuredchange ofasalla
prices one obtains70
I = (AQiAPi)(PiQi)
=iomnPijAP[(lAP)(PpIQi)] (13) I-I
Inserting equation( 13) into( 12) and rearrangshying the expression as indicated in the second term of equation (5)gives
NSLpi 12 si API (QiPpi) AP - 2 1si (APPpi)2 QPi or
(14) = i1t2 bull
69The procedure implies the usual assumption that the supply function isidentical to the marginal cost function Moreover it is assumed that the changes in coss prices indicate changes in opportunity costs 70 The definition implies that marginal costs vary linearly between the two levels of pruduction computed in the model scenario
46
Figure 10 shows the theoretical approach to measuring the welfare loss of producers when deliveries at fixed prices are forcedthe open market is residual and price dis-tortions exist for competing pioduction enterprises 71
Producers are forced to deliver a quan-tity QOof a certain agricultural commodity at a fixed price Pf An additional quantity Q- Q is supplieon the open market at an open market price Pa Both the fixed price and the open market price are below the world market price A partial switch of the producer price Pp to the world market pricewith all other producer prices remaining unadjusted would yield an elastic responsefrom H to M Yet if the prices of competing products are also raised the supply curve is likely to be shifted to the left and a dampened ploduction increase say from H to Lmayresult
Compared to this hypothetical free-trade situation the producers currently suffer a welfare loss (producers rent forgone in the production of commodity i) of DEGHLI This welfare loss is composed of a loss through forced deliveries DEJI a loss through dis-tortions on open markets GHKJ and a cal-culated loss through reduced production and misallocation HLK (which equals NSLp)
Elasticities for these computations were calculated in a partial equilibrium framework from the relative differences in production between scenario 5 of the programmingmodel (world prices no government inter-ventions) and scenario I (distorted prices area allotment prccurement and inputsubsidies) using the relative difference be-tween world market and domestic open market prices as a denominator
These model results provide implicitelasticities of the response of production to a simultaneous change of prices to their in-ternational equivaents ()72
Implicit Supply Commodities Elasticities
Wheat -038 Rice 028 Maize (and sorghum) -067 Beans 146 Lentils 033 Sugar 001 Cotton 007 Beef and milk 019 Nitrogen fertilizer -003
A coefficient of 01 is used for sugar in the consecutive analysis as an assumption for possible yield effects that are not incorporatedin the model for that crop The elasticities for beef and milk are a weighted average the weights being the shares in value of proshyduction
These elasticities are strictly valid onlyfor 197980 the base year of the linear proshygramming solution The difference between production in the two scenarios is typical of a long-run solution during the period of analysis 1965-80 Therefore the elasticities of supply for any year within this period are derived by dividing the relative deviation of the quantities computed by the linear proshygramming model by the nominal rate of taxation during the respective year
The demand parameters for the analysis are obtained from a complete demand sysshytem The model was estimated as a linear expenditure system based on a time series of cross- sections of household expenditure surveys for 195859 196465 and 197475 73
It distinguishes between three levels of household expenditure within the rural and urban population The own- price elasticities for the weighted average of several groups
74are listed in Appendix 2The approach chosen here combines the
results from a programming model of the
71 For simplification input subsidies are neglected in the graphic presentation 72 Note that these elasticities take ilAo account simultaneous shifts in production and intermediate use of other commodities (see equation 13)They are not equivalent to the common definition of elasticities that hold true under the condition that all other prices remain unchanged 73The data bases are taken from Egypt central Agency for Public Mobilization and Statistics Family Budget Survey195859 (Cairo CAPMAS 1961) CAPMAS Family Budget Survey 96465 (Cairo CAPMAS 1972) and CAPMAS FamilyBudget Survey 197475 74The system is described in detail in Joachim von Braun A Demand System for Egypt- Estimation Results andScenario Analysis for Alternative Food Price Policies Institute of Agricultural Economics University of GbttingenDecember 1981 (mimeographed)
47
Welfare losses of producers resulting from price distortions and pro-Figure 10-curement
Price P Marginai costs
with higher prices of substiLutes
P
AB Q Q QForced I Open market
deliveries - ]-------supply shy
sector with partial equilibrium models forindividual commodities It is an attempt to avoid inconsistencies of partial equilibrium
analyses on the one hand and the method-ological and statistical problems of dynamic muiticommodity sector models on the other This approach does not eliminate these
problems completely as dynamic adjustshyments are not endogenously taken care of but it provides for a more realistic and practical solution than either of the two approaches used alone
Grain Markets
The three major cereals produced in Egypt-wheat rice and maize-areaffected in different ways by agricultural policy and their maket structures do not have much In commo liThe producer prices of all three especially wheat and rice are kept below international prices As stated earlier the government procures rice andwheat but not
maize Although procurement for rice is
Marginal costs with current prices
I of substitutes
IE
C Quantity E bi Al)1 Mgnal
-response to----I free trade I
compulsory with aper feddan quota a sieshyilar regulation for wheat was almost phased out in 1977 (see Chapter3) Imports of wheat
and maize aredistributed atsubsidized prices but the former is channeled to consumers while the latter goes mainly to livestock producers
The Wheat Market
Inthe late 1970s Egypts domestic wheat production covered about25 percent of total consumption Procurement of dce domestic
crop dropped from an average of 20 percentof production in 1974-75 to 10 percent in
1978-80 after the enforcement of procureshyment was relaxed Domestic prices are depressed below
their international equivalents which places a burden on wheat producers This burden may be split into three different sources
G pp ccnrocurement r depression of the free marketprice(GP) and ineffciency in the alshylocation of resources for production which
is usually referred to as net social loss in proshy
48
duction (GPo) (see Figure 11) Note that the social loss in producticii may in fact be neg- ative in some years If all prices are raised toward international prices the supply curve of wheat would shift to the left as the sector model results indicate
Consumers gain from the subsidy on wheat flour and bread (Gcis) But they also gain from the reduction in open market prices net of the misallocation to consump-tion (Gcfe - GcJ Most of these gains which increase demand are covered by govern-ment subsidies on wheat imports or procured domestic wheat and part is indirectly fi-nanced by the wheat producers (GPrc Gfte)
Subsidized fixed consumer prices ranged from 28 to 58 percent of the international wheat price during the period 1965-80 (see Table 12) and were slightly higher than government procurement prices during the 1960s75 This means the governmentwas able to generate revenues from domestic pro-curement policy which was compulsory at that time During the 1970s the procurement prices usually exceedea the average fixed consumer price The uncontrolled price of wheat in rural markets fluctuated much more than the fixed procurement and con-sumer prices but always exceeded both of them The gap between fixed and open market prices was particularly high in years of political crises such as 1967 when the gap was 40 percent and 1973 when the gap was 38 percent Both years a war coincided with a major exogenous shock to the coun-trys wheat supply in 196667 the United States which had covered 35-50 percent of the countrys wheat imports during the early 1960s stopped giving food aid to Egypt for political reasons and in 197374 the inter-national food price crisis began Open market prices also far exceeded fixed prices in 1978 for several reasons Imports decreased in that year possibly because foreign ex-change was tight And consumer prices of maize were unusually high because of a shortage of feed concentrates This may
have contributed to the rise in wheat prices in rural areas which worsened the food situation of the poor7 6
Most open market wheat comes from domestic production Some is subsidized wheat flour from government distribution channels that is resold However as the share of open market wheat in the total wheat supply is falling rapidly fluctuations in the supply from the government distribushytion system will increase instability in this residual market During 1969-71 the average suppIV of wheat from domestic production left after procurement accounted for 31 pershycent of total consumption This dropped to 24 percent in the 1978-80 period Moreshyover only some of this entered the market because wheat is a major subsistence crop for the farm population77
The international wheat price used in the analysis is the reported value of a unit of wheat corrected for handling costs and for the overvaluation of the Egyptian pound (see Appendix 1 Table 32) For the calculation of the producer losses and consumer gains it should reflect the marginal import price However Egypt receives significant amounts of food aid and concessional imports In 1980 they accounted for about 30 percent of all wheat imported If the quantities and prices of commercial imports were functions of concessional imports and given that reshyexports of wheat are restricted under the regulations for food aid disposal of the Food Aid Convention the unit value would overshystate the opportunity cost of producing wheat in Egypt78
The marginal import price which matters in assessing the opportunity costs of wheat products in Egypt would only be affected by food aid donations if all commercial wheat exporters to Egypt were also food aid donors providing aid through a tight reshylationship to commercial sales A somewhat systematic pattern in the ratios between commercial imports and concessional imshy
5 The fixed consumer price is calculated here as a weighted average of subsidized bread and flour prices in wheat grain equivalents 76 See Alderman von Braun and Sakr Egypts Food Subsidy and Rationing System p 59 77 Estimations of marketed surplus based on data of household surveys yield ashare of21 percent oftotal consumption out of marketed domestic production for 1969-71 and 15 percent for 1978 -80 respectively (CAPMAS Family BudgetSurvey 197475) Constant per capita wheat consumption from own production is assumed for the farm population in this calculation 7a The Food Aid Convention is part of the International wheat Agreement of 1967 which was amended in 1981 (inshyternational Wheat Council InternationalWheat Agreement 1981 [London International Wheat Council nd])
49
Figure I 1-Average conditions in the wheat market 1976 -80
LEMetric Ton
80
P 9 I
70-G Q
6C P50
40shy
20-11 I I
1- I
t 1000 500 Metric1000 2000 3000 4000
QI Q Tons
Sources CdlcuIted troinddtd1 Ministries dl tilrincipal Balnkprovided I tieLglptihl of Agriculture dd Suppi for )evelopiment dl Agricultural Ilvestment
Notes Prices aredellied b til( (ohsunier price index (1975 = I00) Ij internationlal 1is the olpeniis tihe price
Ihiidket is te goerninienit prOctii(Iil price and ts is tie-fixed(lsuiner prie QII is domesticprice Pp production (totalQ is ginniveiiit pr(itfureieit of doiuiestic I)roductioii Qj is goertnlenit distrishy
hitiill(Q1 ( uIIUli and Q i implforts (- S is sippIiN 1)is dlmand) is totu il (1isprodceII(vrsIoss IrnngdeiIpressiongt ciIernniat Irocorfnl is the prtiiiu rs loss frcm of
I l ic)eiind I si iot prou tion (i is tIlisuiilers (ifll ft disshyreIirkel nt t l loss iti tii ir i h
tribtitiiii of iealt flourand breadIli insum ersgain alsil jItl s I (i and C ilthe igur)
(ahisIlie cOnfllilrs gail frimt w(1h d Ire itirkle pri s 1l(1I( is IiiS1illt ili)lfl in ( ollsliliullt ll For
further details see Appendil 2
ports from major donors indicates that such by Australia during the years when no US a con(ition may not he completely excludet food aid was availalhle anti the terms for U S
for some time periotls 1 aid (luring the first half of the 1960s differed Yet trade and aid statistics (donot show from those set during the second half of the
that food aid is permanently tight Food aid 1970s In recent years Egypt has relied increasshypolicies toward Egypt have changed as
Egypts political role in the Middle East has ingly less on short-term open tenders and changed rle terms for aid from the USSR more o- lonl- tern bilateral import agreeshy
in 196768 were (lifferent from those imposed ments to acquire wheat The actual price of
t 7 uoildiii liiih dtiil~iiiif I uhf Other (iiilltleS sth IsIltilt l iniiii aid (dlild(rOlitI (I(iIlllH) lmidl Auistrali increasetd
iiig the Ioliticalthese rotintrivs faitir grmi esporler to Igpt tollo frictiolS btveen the UniiedtStites dil [gN ptili1966 55hich ledto cdicellltion ofUS Iioidfid After fflfn(I contsiihtliilt Mlllti Iecamre
iIlows ron tiht Unrited
Stdtes were reestallisd ini 1973 thle i rdl d idb if niltries shiilttil cisf-r Iliir(ious See iodcthill vtnpl)l(rnus Brdun E-ffects ofFood Aol idi IiRe(iiient (ouiitris Lg t ialnd tlighidesh I Compaidrdtive SluIv iliOIionilcs A Iiiannua ollrtion of Re(ent Contributions tothe Ield of Economu Scinenol 26 Iihiogen Iiostitut [irGerman Wissenschdftliche Ziisninnanellfit 190I2) l11-47
50
Table 12- Relationship of wheat prices to international and open market prices1965-80
Share of International Price Open Market-
Procurement ProducerYear Price
1965 369 1966 434 1967 444 1968 504 1969 481 1970 501 1971 572 1972 583 1973 296 1974 290 1975 353 1976 394 1977 532 1978 498 1979 455 1980 415
Price
(percent of border price)
494 615 756 920 666 652 700 691 415 385 438 457 666 772 486 457
Fixed Consumer
Price
426 437 458 581 535 483 561 567 300 296 319 367 471 444 324 284
Share of Open Market Price Fixed
Procurement Consumer Price Price
(percent of open market price)
749 863 706 711 588 606 548 631 723 804 768 740 817 802 843 821 713 722 752 768 806 729 862 804 799 707 644 575 936 667 907 622
Sources These figures were computed from data provided in 1982 by the Egyptian Ministry of Agriculture theCentral Agency for Public Mobilization and Statistics and the Ministry of SupplyNote The border price is calculated from values of imports with marketing costs added and corrections made to account for the overvaluation of the currency (see Table 32)
wheat imports under long-term agreementsis less than the contracted values For ex-ample the current agreement with France and the United States requires repayment atinterejt rates significantly below market rates In fact the import price for Egypt(pint)is not a straight line as drawn for simplifica-tion in Figure 11but a step function Thelowest steps are represented by cost- freewheat donations such as those from the World Food Programme (WFP) and some European Community and US aid shipmentsThe next lowest steps would be the US PL 480 Title I concessional imports whichhave 40-60 percent of their cost subsidized if the long-term loans are discountedprevailing market rates Another step would
at
be formed by imports acquired under easyrepayment terns such as those providedunder agreements with Australia France or the United States and the highest stepwould be composed of actual commercial imports at current international prices
Using the unit values or marginal priceof imports does not impede the calculation of the welfare loss of producers but usingunit values to compute the fiscal costs of
wheat imports does require some explanashytion Whereas the short-term fiscal outlay may be exaggerated by using unit valueswhich do not take into account long-termrepayment schedules for imports acquiredwith soft loans the long-term effects on thebudget of soft- loan imports would be neshyglected if the actual installment paymentsfor them were used in the calculation Ideallythe actual installment payments for importsin the current year and all previous yearsshould enter the calculation of the fiscaleffects of wheat imports but the data aie not available in time series
The following results were obtained from the market analysis In 1980 wheat producershad an income loss of LE 134 million (GPin Appendix 2 Table 35) Although theincome losses of producers fluctuated conshysiderably during the 1960s and l910s beshycause international prices and domestic open market prices were unstable they do not show a trend in any direction Expressedin 1975 prices they shrank from the peaks of1974-78 but increased again in 1979 and1980 (see Table 13) Losses from procureshyment have been minor in recent years In
51
Table 13- Producer losses from price policies and procurement on the wheat rice and maize markets 1965-80
Wheat Rice Maize Wheat Rice and Maize Loss from Total Loss from Total Total Total Loss Per
Year Procurement Loss Procuremetit Loss Loss Loss Metric Ton
(1975 LE million) (1975 LE)
1965 158 582 806 1713 1125 3420 66 1966 145 486 767 1473 912 2871 52 1967 136 471 936 1806 614 2891 50 1968 123 259 1307 2430 757 3446 54 1969 65 333 1250 2533 868 3734 60 1970 89 435 633 1472 1042 2949 45 1971 102 369 416 984 532 1885 29 1972 79 323 365 909 611 1843 28 1973 277 1221 762 1995 1299 55 63 1974 400 1494 2485 7253 1592 1 ) 153 1975 312 1193 2617 6211 1329 3 121 1976 176 844 1228 2957 958 4759 65 1977 39 275 550 1261 130 1666 25 1978 41 254 657 1547 222 2023 27 1979 131 648 693 1438 727 2813 38 1980 67 722 653 1399 156 2277 31
Sources These figures were computed from data provided by the Egyptian Ministry of Supply the Central Agency for Public Mobilization and Statistics and the Principal Bank for Development and Agricultural Investment
Input subsidies (on fertilizer) are already deducted from total losses
1980 they amounted to about 10 percent of the total producer losses in the wheat market
Consumer gains from subsidized gov-emiment distribution and depressed open market prices have been growing consider-ably reaching LE 814 million in 1980 In real per capita terms they were almost twice as high in 1979-80 as they were in the mid- 1960s (Table 14) In 1980 farmers contributed 19 percent of the total income transfer to con-sumers in this market (Appendix 2 Table 35) This means that the implicit subsidy on wheat is about one-fourth of the explicit wheat subsidy that appears in the budget
The official budget figures for the wheat subsidy are available only for the years after 1970 According to estimates made for this study wheat subsidies were a significant drain on the government budget even in the mid-1960s (see Table 15)80 But compared with the subsidies of the 1970s their effect was small The model calculations roughly
follow the ups and downs of the official series but differences between 1977 and 1979 are large (see Table 15) In principle these discrepancies could have arisen either because handling and processing or importshying costs were underestimated or because a different accounting method was used for the official subsidy budget Mostafa et al found a similar deviation in a welfare analysis of wheat price policy for 19787981
The Rice Market
The rice market was particularly dynamic during the 1960s and 1970s Production inshycreased remarkably from the mid- 1960s to the early 1970s Exports were at a peak during 1967-70 when the country was particularly short of foreign exchange Per capita conshysumption was kept at about 28 kilograms per year during these years as compared to 32-33 kilograms in the late 1970s When
80 Official exchange rates were used to calculate the budget effects 81See Rasmia Moustafa et al AWelfare Analysis of Price Policy for Wheat and Wheat Products in Egypt Economics Working Paper 48 Agricultural Development Systems Project Ministry of Agriculture Cairo and the University of California-Berkeley Cairo 1981
52
Table 14- Consumer gains from price policies and subsidies on the wheat rice andmaize markets 196580
Aggregate Per CapitaYear Wheat Rice Maize Gain Gain
(1975 LE million) (1975 LE) 1965 1825 1093 662 3580 1221966 1297 956 402 2655 881967 1345 772 143 2260 741968 678 1059 294 2031 641969 1505 1183 408 3096 961970 1835 685 448 2968 901971 1005 499 189 1693 501972 1149 506 248 1903 551973 3949 1291 556 5799 1641974 4849 5158 650 0657 2941975 3758 4451 541 8750 2361976 3098 2407 330 5835 1541977 1904 1046 106 3056 791978 2367 1371 -49 3689 921979 3755 1156 251 5162 1261980 4380 1189 68 5637 134
Sources These figures were computed from data provided by the Egyptian Ministry of Supply the Central Agency forPublic Mobilization and Statistics and the Principal Bank for Development and Agricultural Investment Total population is the denominator used to calculate this column
Table 15- Changes in the budget caused by government intervention in the wheatrice and maize markets 1965-80
Wheat MaizeYear Model Official Rice Model Official Total
(1975 LE million) 1965 213 145 12 781966 148 -188 -04 -441967 203 -274 -19 -911968 -56 -367 00 -4231969 -54 -269 -01 -2161970 59 211 -43 04 1l 201971 07 -18 -01 -121972 30 192 -14 04 061973 1313 961 -162 18
20 54 11691974 1964 2375 -330 183 181 18171975 1429 2609 -37 142 311 15341976 801 1556 04 95 210 9001977 385 1199 70 77 17 5321978 590 1613 156 -47 294 6991979 2901 3875 -56 184 354 30291980 3281 2748 19 301 208 3601
Sources The official figures are from Harold Alderman Joachim von Braun and Sakr Ahr ied Sdkr EgyprsFoodSubsidy and Rationing System A Description Research Report 34 (Washington DC International Food PolicyResearch Institute 1982) p 16 The calculations for the model figures for wheat and rice are presented inAppendix 2 Tables 35 and 36
Notes The model figures were calculated using the official exchange rate The offic al figures are subsidies menshytioned In the General Authority for Supply Commodities budget for wheat at d flour figures for 1970 and1980 refer to 1970r7l and 198081
These figures are from the calculations with the model
53
exports were high and the per capita supply low free market prices in the rural areas soared This led to a wide gap between procurement prices and fixed consumer prices on the one hand and open market producer and consumer prices on the other As with wheat there was often a difference between the fixed consumer prices and market prices for rice in the 1970s But this gap in rice prices was narrowed during 1979 and 1980 as the gap in wheat prices was not because fixed consumer prices rose (see Table 16) The rice market was heavily taxed and this did not change significantly even when the quantity exported became smaller in absolute terms and in relation to total foreign exchange earnings The ratios of producer prices show that rice production was taxed more heavily than wheat produc-tion during the observed period
Figure 12 outlines the structure of the rice market The rice model calculations are given in Appendix 2 Table 36 The total loss by producers because of the difference
between world prices and domestic prices is determined by the loss from procurement (GP in Figure 12) the loss from depressed domestic open market prices (GP ) and the income that producers could have gained through reallocation of resources under an international price regime (GPoc) The greater part of the implicit income transfer to conshysumers is identical with the gain from subshysidized rice distribution (Grs) and relatively cheap rice on the open domestic market (Gfe) A lesser part of the consumer gains is financed by the government outlays for procurement below subsidized ration prices Until 1974 revenues from the implicit export tax were large but since then the outlays for procurement have often exceeded export revenues (see Table 15)
The income lost by rice producers because of this policy was about LE 260 million in 1980 Subtracting the social loss in producshytion and the small amount of rice export taxes in that year and adding the government outlays for the directrice subsidy (BdiS) one
Table 16- Relationship of rice prices to international and open market prices 1965shy80
Share of Open Market PriceShare of International Price
Year Procurement
Price
Open Market Producer
Price
Fixed Consumer
Price Procurement
Priceb
Fixed Consumer
Pricec
(percent of border price) (percent of open market price)
1965 1966 1967 1968 1969 1970 1971 1972 1973 1974 1975 1976 1977 1978 1979 1980
257 239 324 285 291 405 486 497 286 108 149 279 418 429 433 420
363 467 512 517 400 518 608 600 370 137 155 291 482 459 492 464
325 416 607 480 382 513 603 594 348 120 130 222 344 311 425 390
707 513 632 550 728 783 799 828 771 788 905 958 867 934 881 905
873 870 863 911 933 964 960 962 912 848 764 741 691 660 839 815
Sources llese figures were computed from data provided in 1982 by the Egyptian Ministry of Agriculture the
Central Agency for Public Mobilization and Statistics and the Ministry of Supply
Note The border price is calculated from values of exports with marketing and processing costs added and corshy
rections made to account for the overvaluation of the currency
A These are in paddy equivalents
b The procurement price is expressed as a percentage of the open market producer price
c The fixed consumer price is expressed as a percentage of the open market consumer price
54
----
Figure 12-Average conditions in the rice market 1976-80 LEMetric Ton Dn D I I S
I I in
90shy
80-G G
70
60-
Pill I50------------------------shy
30
0-II2r
I -- --- --- --- --- --- --- -shy10-
I 11I 100012000
11 O00 3000 Metric r QQ11 Qi Tons
Qprr -
Sources Calculated from data provided by the Egyptian Ministries of Agriculture and Supply and the Principal Bank for Development and Agricultural Investment
Notes Prices are deflated by the consumer price index(1975= 100) B is the increase in the government budgetcaused by procuring and distributing rice and B is the budget revenue from procured rice that is exportedPt is the international price Pl is the open market price PI is the government procurement price and P] is the fixed consumer price Q is expons from government procurement (Q = Q - Qi) Qp is government pronrurement Qi is domestic production(total) Q is government eurolistribution(Qe + Q)and Q is total consumption S is sulpply D is demand
GIXis the producers loss from government procurement Gfis the prolucers loss from depression ofthe free market price and GIis the net social loss in proluction G is the consumerss gain from thedisshytribution of rice Gris the consumers gain from reduced free market prices and G is misallocation in consumption For further details see Appendix 2
55
arrives at the actual subsidy to rice con-sumers calculated at the opportunity costs to the economy(see Appendix 2 Table 36 for details) This invisible producer-to-consumerrice subsidy corresponds to 20 percent of the official (explicit) budget subsidy for all food commodities but because it is financed mainly by the farmers it does not appear in the governments accounts and the public awareness of it is small Income transfers from rice producers to consumers were high in the late 1960s and except for the years of the international price crisis they decreased in the 1970s (see Table 13)
The producer loss from depressed openmarket prices was nearly as high as the loss from compulsory deliveries and sometimes even higher In the late 1970s the income lost through procurement accounted for about one-third of the total producer losses on the rice market
Finally the results indicate that income was ftrgone because of policy-irduced in-efficiencies in allocating fewer resources for rice production which amounted to 13 percent of the total income loss of rice producers in 1980 (see Appendix 2 Table 36) The heavy implicit rice taxation and its allocation effects are not distributed at all equally but they contribute to the disparity of the implicit tax structure between regions and thus to regional differences in farm income Rice production is concentrated in the northern Nile Delta8 2
The Maize Market
Maize is the largest cereal crop in Egypt and has shown the greatest expansion since the mid-I 960s Human consumption of maize declined both in per capita terms and in total quantities It is used mostly as animal feed Imports of maize which are also growing are almost entirely channeled to poultry and livestock producers The domestic maize crop is of the white variety whereas yellow maize is imported
Governments interference in the maize market is less stringent than in the wheat and rice markets No maize is procured and no area allotment is enforced Importedmaize is distributed by a quota system at a subsidized price The gap between this subshysidized price and the international price widened during the 1970s while the gapbetween the open market price and the intershynational price has shrunk in recent years(see Table 17) The open market price ranged between 13 and 57 percent below the border price equivalent at the farm gate during the 1970s and the subsidized price was between 10 and 55 percent below the open market price (or between 34 and 75 percent below the international price) Maize producers lose income from depressed domestic prices and ir -fficiency of resource allocation as compared with international prices (see GfPe and GPoc in Figure 13) However the latter is true only if nothing but the price of maize changed If all commodities were sold at international prices maize production would lose its current strong advantage and would decline (see the model scenarios in Chapter 3) This means the supply curve (S) in Figure 13 would shift to the left and the slope of the implicit supply curve might be negative83
Part of the income transfer is acquired by maize consumers (Gfe) but livestock proshy
-ducers also gain (Gfe Ge Therefore the producer loss is largely an intrasectoral transshyfer and if maize producers are also livestock producers it is merely an intrafarm transfer These issues will be addressed in the feed and meat market analysis below
The subsidy to the maize market is estabshylished by the governments import and disshytribution scheme for using maize for feeding purposes It amounted to LE 64 million in 19808184 Other than the implicit consumer subsidy for maize this explicit subsidy is an income transfer to livestock producers Its net effect on sector income depends on the effect of this additional maize supply and the meat price policy on meat production
82 In 1980 82 percent of the rice area was in the governorates of Kafr-el- Sheikh Behera Gharbia and Sharkia in the northern Delta Figure 13 contains apositively sloped implicit supply curve(S) which holds for aseparate maize price change ratherthan achange of all prices As aresult the net social loss in production appears positive in the figure whereas it isnegative In the empirical results 84 Alderman von Braun and Sakr Egyprs Food Subsidy and Rationing System p 16
56
Table 17- Relationship of maize prices to international and openmarket prices 1965 -80
Open Fixed Consumer
Year Market
Producer Price
Fixed Consumer
Price Price as aShare
of the OpenMarket Price
19651966 (percent of border price)
417 521
(percent) less
1967 1968 1969 1970 1971 1972 1973 1974
634 544 540 507 598 635 484 433
430589 519 344 256
847898 817 711 592
19751976 19771978 1979 1980
447518 813788 595 874
264310 369662 480 427
591598 454840 806 489
Sources These figures were computed from data pro-vided in 1982 by the Egyptian Ministry of Ag-riculture the Central Agency for Public Mobilshyization and Statistics and the Ministry ofSupply
Notes No data on fixed prices before 1970 are avail able The border price is calculated front the values of imports with marketing and pro-cessing costs added and corrections made toaccount for the overvaluation of the currency
Maize consumers also gain from the importsindirectly because it leads to reduced do-mestic maize prices Imported yellow maize and domestic white maize may be freelysubstituted for each other in livestock feed-ing Both sell at roughly the same price in the open market8 5
The links between markets for maize are particularly strong Policies affecting comshypetitive cereals and all livestock policy aswell affect the maize market Thus the conclusions from a partial analysis such as this are limited
Income and Budget Effects on the Cereal Markets
How cereal market policy affects agriculshyture becomes clearer when wheat rice andmaize are aggregated Excluding the excepshytional years of the world food crisis (1973shytina ers of rl ood csss (1973shy75) the trend of real income losses of cerealproducers has declined significantly since 1965 Cereal production was taxed much
during the second half of the 1970s thanin the 1960s The income loss per ton of cereals in 1975 prices dropped from an average of LE 56 during 1965-69 to LE 30 in1977-80 (see Table 13) In other words taxation of cereal production was reducedwhile explicit food subsidi( were increasingdramatically The parallel aevelopment ofsubsidies and taxation of production which was so striking during the first half of the 1970s was not the result of a stable causalrelationship between the two Price policiesfor consumers and domestic producers werehardly responsive to international price
changes86 The taxation of cereal productiondeclined in the late 1970s mainly becauseboth rice procurement prices and maize prices increased Wheat price policy did nothave much effect on aggregate cereal pricesDespite the decreased burden on cerealproduction implicit income transfers fromproducers were still LE 422 million in 1980
which corresponds to about 75 percent ofthe explicit cereal subsidy budget in that year Rice alone accounted for about 54 pcrcent of that
Consumers received growing supportthrough depressed cereal prices and subshysidized distribution in the late 1970s after several years of reduced transfers followingthe international food price crisis (see Table 14) In 1980 78 percent of all consumer gains on cereal markets came from wheat21 percent from rice and 1 percent from maize
Pulse Markets
Pulses (Leans and lentils) are a major source of protein in the Egyptian diet parshyticuhrly of the rural and urban poor Howshyever they are considered an inferior food by
These observatlcns were made during market surveys in 198182 in rural and urban areas Subsidized yellow maizeis sometimes resold on the open market Recently some yellow maize has been grown In Fayum86 This finding is also evident from Scobles study on Egyptian wheat policy(Scohie Government Policy and Food Imports)
57
-------------
Figure 13-Average conditions in the maize market 1976-80
Dhum LEMetric Ton Dtot S
80 SGC
70 Gc
6 0
50
Pfred 40 ---------------------------40
PPd --shy
30shy
II I20shy
1 I
100011i
Qhum QTons
sources Calculated from data provided by the Egyptian Ministries of Agriculture and Supply
Prices are deflated by the consumer price index (1975=100) B is the increasein the governments budget Notes
caused by the subsidized distribution of maize impoits (It includes GP in this figure) Dhum is the demand
is the total demand for maize Pire is the open market price Pit is the international for maize for food nto price and Pl is the fixed producer price of maize used as feed
is imports Qp is total domestic produc-Qfed is maize used as feed Qh is maize used as food Q
tion and Q is the total supply of white and yellow maize Sis sutpply is the consumers gain from reduced free market prices and Gf is misallocation in consumption
Gu G is the producers loss from the depression of the free market price (The producers loss also includes
is the net social loss in productionG1 and Gsoc in this figure) G
many837 Thus the growth of income may
have helped reduce total and per capita
consumption of pulses since the mid- 1960s
The procurement orices of beans and
lentils were kept at between 50 and 60 per-
cent of international price during the second
half of the 1970s This reducel the crops
comparative advantage over berseem and other winter crops and shrank domestic supply which was only partly balanced by
government- controlled imports These im-ports and compulsory deliveries from do-
mestic production were channeled into the
subsidized distribution system The decreased
total supply caused open market prices to
rise Subsidized consumer prices dropped
even further below domestic open market
prices than procurement prices did (Table
18) Because domestic production shrank
the total income loss of producers decreased in real terms During the period 1977-80 the
loss per ton of pulses was also reduced This was mainly because open market prices rose
87 For urban middle- and high-income groups negative expenditure elasticities are estimated whereas urban poor
and rural households show relatively high positive elasticities See von Braun A Demand System for Egypt p 5
58
Table 18- Relationship of bean prices to international and open market prices 1965 -80
Share of International Price Share of Open Market Price Open Market Fixed Fixed
Procurement Producer Consumer Procurement Consumer Year Price Price Price Price Price
(percent of border price) (percent of open market price)
1965 593 578 978 1966 581 535 915 1967 766 641 833 1968 738 663 886 1969 608 631 966 1970 394 642 613 613 886 1971 430 872 669 493 683 1972 508 817 684 622 745 1973 337 3486 436 693 833 1974 386 733 500 526 639 1975 531 718 547 739 727 1976 516 758 532 681 669 1977 474 719 489 659 649 1978 624 859 484 728 532 1979 523 809 406 647 464 1980 556 853 346 652 357
Sources These figures were computed from data provided in 1982 by the Egyptian Ministry of Agriculture the Central Agency for Public Mobilization and Statistics and the Ministry of Supply
Notes No data are available for procurement prices before 1970 The border price is calculated from values of exshyports with marketing costs added and corrections made to account for the overvaluation of the currency
Table 19-Producer losses from price policies and procurement on the beans and lentils markets 1965-80
Beans Lentils Loss from Total Loss from Total Aggregate Loss Per
Year Procurement Loss Procurement Loss Loss Metric Ton
(1975 LE million) (1975 LE)
1965 325 03 328 81 1966 368 34 402 95 1967 85 21 106 48 1968 141 33 174 55 1969 224 34 250 811 1970 13 195 24 219 71 1971 68 103 42 145 47 1972 51 133 54 187 45 1973 41 347 279 626 187 1974 34 134 145 279 98 1975 43 161 23 107 268 98 1976 52 150 33 84 234 80 1977 52 173 17 28 201 68 1978 23 66 03 06 72 29 1979 62 120 04 05 125 51 1980 48 86 b5 07 93 41
Sources Computed from data provided by the Egyptian Ministries of Agriculture and Supply the Principal Bankfor Development and Agricultural Investment and the Central Agency for Public Mobilization and Statistics
Notes No data on procurement of beans before 1970 are available no data on procurement of lentils before 1975 are available
These are given In beans equivalent Lentils are weighted with a factor of 12 to adjust for the average value difshyference (the average open market price is used as a point of reference)
59
not because procurement policy changed (see Tables 18 and 19) Total consumer gains from subsidized distribution and depressed domestic open market prices remained high during the 1970s (see Table 20) As lentils received a higher per unit subsidy than beans absolute consumer gains from both com-modities were about the same despite the smaller quantity of lentils consumed
Pulse market policy appears to be similar to cereal policy Taxation was far higher than its long-term average in the mid- 1970s because only small fractions of international price increases were transmitted to the domestic market Implicit taxation d-Lteased in the late 1970s because suppliL3 on the open market were tightened which pressed prices upward and not because government policy was actively changed
Current price policy has an imporcant effect on domestic production of puses The sector modelinp scenarins i idicate that pulse production migiht increase significantly it domestic prices equalled world priccs as current price ratios greatly favoi berseem and vegetables pulses major competitors (see Chapter 3) The increased share of ber-seem among those crops grown before cot-ton shows this
To sum up policies in the pulses market are quite similar to those in the wheat market except that procurement is still compulsory It is characterized by a consistently wide gap between international and procurement prices and by a growing gap between pro-curement and open market prices The po-tential effects on production of a streamlined price regime indicate that current policy creates large inefficiencies in the allocation of land for pulses
The Sugar Market Egypt was one of the first countries to
grow sugarcane and led the trade in sugar until the 16th century Since then the sugar industry has flourished in some periods and gone bankrupt in others88 Before the con-struction of the Aswan High Dam sugar pro-duction was largely affected by fluctuating
water availability Since then the regulated water supply has permitted major stable area expansion Ninety percent of all sugarshycane is grown in the three Upper Egyptian governorates of Menia Qena and Asyut Sugarcane is the major cash crop in this region where no land is allocated to cotton in the government area allotment scheme About 235000 feddan representing 27 pershycent of the area of these three governorates is sown with sugarcane
The state holds a monopoly as miller and trader of cane and sugar Except for a small quantity of privately processed cane mainly used for juice cane is delivered to the state mills Growers are tied by contracts to one of the seven operating factories In recent years sugar beet production has been proshymoted in the northern Nile Delta but only insignificant amounts were produced during the period studied
Sugar production has almost doubled since the mid- 1960s Egypt became a net importer of suga- in the 1970s although net exports occurred in some years untii 1973
Few world agricultural markets are as unstable as the sugar market And in none have more attempts been made to achicve domestic stability In 6 out of the 16 years observed domestic producer prices of sugar (impicit in the price of sugarcane) exceeded the equivalent world price In -ome years during the 1960s the farm-gate equivalent world prices for cane were negative which implies that the value added for sugar proshyduction was negative8 9 Domestic producshytion was protected to maintain farm incomes in a region dependent on the crop and to keep the sugar industry in existence during the trough periods of the price cycles
Because sugarcane is a nontradable havshying no international value production and processing- from cane cultivation to sugar refining- are treated as an integrated activity Consumers are supplied with rationed sugar at subsidized prices Additional sugar comes from open (black) markets The open market sugar price which is an average of black market and second tier (urban) subsidized prices clears the highly regulated market This price was higher than the world price in
8 Ylaus Baumgaiten Zuckerwirtschaft in Agypten [Sugar Economy in Egypt] Zuclerindustle 104 (September 1979)
854-13 9
This finding is in line with calculations from Cuddihy Agricultural PriceManagement inEgypt p 106
60
Table 20- Consumer gains from price were frequently higher than world prices policies on the beans and Price policy stabilized the domestic market
lentils markets 1965-80 and partof the government budget requireshyments for this policy was provided by revshyenues generated during periods of low inter-
Year Beans Lentils Total nationai sugar prices
(1975 LE million)
1965 167 01 167
1966 136 23 159 1967 70 28 98 1968 16970 42 112621071969 1970 87 38 125 1971 53 33 86 1972 50 43 93 1973 168 111 279 1974 97 108 205 1975 185 180 365 1976 153 183 336 1977 122 95 217 1978 62 50 112
2131979 127 86 1980 113 121 234
Sources Computed from data provided by the Egyptian
Ministries of Agriculture and Supply the Principal Bank for Development and Agri-cultural Investment and the Central Agency for Public Mobilization and Statistics
14 out of the 16 years observed9 0 The sugar price of the basic ration was kept nominally constant during the entire period the dif-ference between the fixed and open consumer price grew and ranged from 20 to 70 percent between 1965 and 1980 (see Table 21)
As world prices were particularly unstable only long-term observations of price policy effects make sense for the sugar market As the time series in Table 22 indicates the in-come le 3ses of producers when world prices were high far exceeded the implicit gains of producers when prices were low In fact calculated in constant prices the implicit gains of producers were only 10 percent of their total losses during the entire period 1965-80
Consumer gains from the subsidized rationed distribution were offset in several years by open market sugar prices which
The Cotton Market
Because the cotton market has been intensively researched a description of the policy goals underlying cotton export taxation and the instruments applied may seem reshydundant9 1 Cotton is included in this analysis however because it must con pete with the
major food crops for production resources It is sometimes argued that food subsidies increase government expenditures which
are financed by increasing taxation of agrishy
culture with cotton traditionally ranking first as a crop to be used as a vehicle for indirect taxation
Cottonc prouction d Cotton production decreased signifishy
cantly during the 1970s (see Chapter 3) The decline in production and the increase in domestic consumption have reduced exports to almost half of what they were in the midshy1960s But cotton is still the most important agricultural export commodity
The entire crop is delivered by the farmers to state collection points Cotton prices which are set by a Higher Council with members from several ministries vary by grade and variety92
Average procurement prices ranged beshytween 20 and 50 percent of the international equivalent during the 1960s and 1970s The international equivalent for the farm-gate price of seed cotton is calculated from the export unit values of cotton lint which are converted into seed cotton quantities marshyketing and processing costs are subtracted from them the value of by- products is added and then the values are corrected for the foreign exchange bias in cotton lint and cottonseed prices
Much of Egypts cotton crop is of the extra- long staple type On the average Egypt produced 43 percent of the world supply of
90 The price series was made available by CAPMAS For a description of the complex sugar distribution regulations
see Alderman von Braun and Sakr Egypts Food Subsidy and Rationing System p 34
91 See Hansen and Nashashibi Foreign Trade Regimes and Economic Development p 206
92 For adescription ofhow cotton price policy is administered see Cuddihy AgriultraI PriceManagement in Egypt p85
61
Table 21- Relationship of sugar prices to international and open market prices 1965 -80
Fixed Consumer Price
Year
Domestic Cane Price In Sugar
Equivalents
Fixed Consumer
Price Open Market
Consumer Price
as a Proportion of the Open Market
Consumer Price
(percent of border price) (percent)
1965 1966 1967
288 1058
949 3891
-
1186 4864
800 800 833
1968 1969 1970 1971 1972 1973 1974 1975 1976 1977 1978 1979 1980
0833 662 492
4439 948 282 153 268 515 871
1409 1066 412
2179 1618
15150 2907 701 219 328 564 978
1441 980 292
2603 2581
23333 4506 1157 612
879 1550 2757 4352 2593 1021
837 629 649 645 606 358 373 364 355 333 378 286
Sources Computed from data provided by the Egyptian Ministry of Agriculture and the Central Agency for Public Mobilization and Statistics The border price is calculated from values of imports with marketing and processing costs and correctionsNote made to account for the overvaluation of the currency
In these years the border price of sugar was negative
that type during 1970-77 93 Although this gives Egypt the ability to influence the export price of the commodity somewhat extra-long staple cotton prices are hardly indepen-dent from long staple cotton prices in the world market94 However to the extent that Egypt is able to maximize total foreign ex-change revenues from cotton trade by im-posing an optimum tariff from a quasi-monopoly position distortion-free prices are overestimated if the actual export prices are used as a point of reference The with-holding of largc amounts of cotton from export in the early 1980s seems to support the hypothesis that Egypt at least tries to influence its export price But cotton may have been withheld because prices were expected to rise or because of management
problems Without suitable data and with some reservations the analysis here proshyceeds under the small-country aissumption
Cotton consumption is defined as the quantity acquired by domestic cotton inshydustries 95 It has grown significantly Delivery prices to public-sector factories which are set below procurement prices further proshytect the cotton industry96 Due to shrinking exports the highest share of the income transfer from producers is no longer a conshytribution to the general budget as it was until 1974 Instead it covers an implicit subshysidy (G1) of domestic consumers which amounted to LE 474 million in 1980
Input subsidies are of major importance for cotton because the subsidies on pesticides are high They are considered in the calshy
93John M Page Shadow Prices forTrade Strategy and Investment Planning in Egypt World Bank Staff Working Paper 521
(Washington DC World Bank 1982) p 100
Long staple cotton prices act as a floor for the extra- long grades price Long and extra-long staple prices show highly correlated price developments 9SCuddihy uses this definition In Agricultural Price Management in Egypt pp 86-90
96About LE 80 million were allocated for this purpose in the 198182 budget
62
Table 22- Gains and losses of producers and consumers on the sugar market 1965-80
Producer Consumer
(1975 LE million)
1965 -574 410 19661967 05215 396-664
1968 1969 1970 1971 1972 1973 1974
249 -153 -299
181 -26
-952 -3458
-550 -38 -60
-539-388 565
2183 1975 1976 If07 1978 1979
-1791 -shy588 -41 191 69
1539 247
-395 -818 -162
1980 -906 1256
Sources Computed from data provided by the Egypshytian Ministry of Agriculture and the Central Agency for Public Mobilization and Statistics
Note Positive numbers are gains negative numbers are losses
culation of farm income loss Income trans-fers from producers fluctuated between LE350 and LE700 million during the 1970s The average income transter per ton ot raw cotton measured in deflated prices was somewhat higher in the second half of the 1970s than in the second half of the 1960s but in 1979-80 there was a significant drop in the implicit taxation of production (see Table23) This was because domebitc output prices rose and input subsidies increased The total income loss of producers was LE 593 million in 1980
Cotton producer price policy is largely determined by income support objectives Prices are set on the basis of the cost of production and a mark-u p felt to be adequate for a target farm income9 7 Little adjustment of domestic prices to world prices is made Hence the extreme taxation of the cotton
crop during 1974-77 was mainly an effect of high international prices while domestic prices remained more or less stable Howshyever budget revenue consideiations might
have caused this low transmission elasticity This will be analyzed more comprehensively with particular reference to food subsidies
later At this point it is worth noting that when government outlays for food subsidies were exploding during 1973-80 there were two distinct price policies for cotton exshy
tremely high taxation during the first period (1974-77) and moderate to low taxation-if measured against standards of the 1960s and
early 1970s-during the following period (1978-80) No obvious relation between the taxation of cotton and the increase in budshygetary needs because of increased subsidy
outlays is apparent The important by-product of cotton proshy
duction-cottonseed cake-is taken into account in the feed market analysis in the
next chapter
Animal Produce Markets and Feed
Egypts livestock density is one of the highest in the world its animal production sector is closely linked to all cropping activities because cattle and buffalo are used as draft animals and because fodder production and fodder by- products of major crops are important Because almost no range land is available in the country the opportunity cost of fodder is determined by the prices of all other crops The following analysis foctises on the red meat and milk markets and the policies affecting the output and input prices of these commodities The fast-growing poultry sector is included in the feed policy analysis
Red Meat
A detailed analysis of the implications of price policy for the Egyptian meat market is impaired by insufficient data 98 Because
17See Saad Nassar M Rel-Amir and AA Moustafa Determinants if Agricultural Price Policy in Egypt Economics
Working Paper 50 Agricultural Development Systems Project Ministry of Agriculture Cairo and the University of
California-Berkeley Cairo 1982 p 12
98 James B Fmch and Ibrahim Soliman The Livestock Economy in Egypt An Appraisal of the Current Situation
Cairo 1982 (mimeographed)
63
Table 23- Producer losses and con-sumer gains on the cotton market L965-80
Producer Loss Ate- Loss Per Consumer
Year gate Metric Ton Gln
(1975 LE (LE) (1975 LE million) million)
1398 1966 3908 278 700 1967 3118 231 759 1968 3573 265 1055 1969 6008 361 2135 1970 5505 353 1641 1971 4738 302 1204 1972 4485 284 1434 1973 5050 343 1501 1974 8055 617 1922 1975 6065 532 1619
1965 5288 328
1976 4734 406 1574 1977 6050 514 1706 1978 3692 311 1514 1979 2662 207 1882 1980 3192 228 1878
Sources Computed from data provided by the Egyp-tlan Ministry of Agriculture and the Central Agency for Public Mobilization and Statistics
Calculated for the cotton industry on the basis of the governments delivery price of cotton to factories
production statistics are based on crude estimates the analytical results should be interpreted cautiously The meat analysis in this report focuses on cattle and buffalo meat Sheep goats and camels which supply about 15 percent of all red meat produced are not dealt with here Ministry of Agriculture meat production figures show that the number of sheep goats and camels showed a slight tendency to grow in the 1970s Despite rapidly increasing imports the growth of total supply of red meat was only modest which as income growth and the income elasticities of meat demand were high led to a tremendous rise in prices during the 1970s The consumer price index of meat products rose to 428 between 197071 and 198081 and the cost-of-living price
index rose to 25299 The index of farm-gate prices of beef rose to 369 (also see the border price equivalents given in AppendixI Table 34)
Since the mid- 1970s domestic meat priceshave exceeded international prices which indicates that meat production is protected Although private meat imports have been
permitted in principle since the mi- 1970s they are still small This does not seem
plausible at first glance With domestic prices higher than import prices importing meat should be profitable But import license restrictions the importers lack of foreign exchange and controls on the marketing margins of importers calculated on the basis
of the official exchange rate have discouraged private imports and contributed to protecshytionism Another constraint on private imshyports is the lack of privately owned refrigershy
ated transport and distribution facilities Thus the Ministry of Supplys foreign purshychasing decision remains the determinant of import quantities The Ministry uses
numerous instruments to influence domestic meat production and distribution Among these are the compulsory delivery of meat produced with subsidized feed (197980) and restriction of sales of retail meat tothre s ofh eeek
three days of the week
Government frozen meat imports are sold in portions at a subsidized fixed price that is less than both the import and domestic open market prices 10 0 The basic features of the beef market in the late 1970s are desshycribed in Figure 14 It demonstrates that consumers lose in open market purchases (Gc) whereas they gain from the distribution of subsidized imports by the government (Gcs)
Livestock production in Egyptian agrishyculture rarely serves just one purpose Most meat and milk is produced from draft animals kept on small family farms This means that high meat (and milk) prices are an indirect incentive for continuing to use draft animals instead of machinery using diesel or electrical power10 1 The dual uses for cattle and buffalo also explain why domestic meat production
The consumer price index refers to meat fish and eggs (CAPMAS 1982) 1ooSee Alderman von Braun and Sakr Egypts Food Subsidy and Rationing System for a description of the system of subsidized meat distribution to consumers 1ol Note that energy is subsidized too which somewhat offsets the distortion in favor of draft animals
64
Figure 14-Average conditions in the beef market 1976-80 LEMetric Ton
Pt
400shy11000
S I
200
100shy
00 2C0
Qd
Qdls
Qdem
500 Metric Tons
Sources Calculated from data provided by the Egyptian Ministries of Agriculture and Supply Notes Prites are deflated by the consumer price index (1975 = i00) Pinisthe international price Prreisthe open
market price and Psiisthe fixed consumer price Qprd isdomestic pr duction (total) QdJ isgovernmentdistribution Qdem is tctai consumption and Qim isimports (-Qde - Qprd) SiSsupply D is demand
Gf~e isthe producers gain from the free market price and G50c isthe net social loss in production Gd1 is the consumers gain from the distribution of subsidized beef Gf~eisthe consumers loss from protectedfree market prices and G ismisallocation in consumption For further details see Appendix 2
has not been able to keep pace with demand Egyptian agriculture has no real comparativedespite the high price increases As the high advantage in livestock production givenfeedmeat conversion rates indicate the the high opportunity costs of land and in marginal productivity Gf fodder used for the long run of water (see Chapter 3)increased meat output is low partly because Because meat isconsumed mainly by the of the genetic characteristics of the local high-income population the price policybreeds Nevertheless the growth in fodder has important implications for equity as production during the 1970s indicates that well The income transfer calculations disshythe price structures gave farmers a strong cussed below should be seen in this lightincentive to expand livestock production About 50 percent of all meat products are The modeling exercise demonstrates that consumed by the high- and middle-income
65
urban population which is 31 percent of the total populationt0 2 In other words meat protection transfers income from the urban (rich) to the small-farm sector Taxation of most other farm products does the opposite Farmers gains from protectionist prices increased remarkably during the 1970s reaching about LE 41 million in 1980 This partially compensates for the producers losses on the other commodity markets
Consumers losses from open market meat )urchases are of roughly the same order But subsidized rationed meat dis-tribution has compensated for a larger share of these losses in recent years because sub-sidized meat prices are nominally constant (see Table 24) Most subsidized meat i5 channeled into urban areas103 This implies that the high open market prices for meat which favor producers in rural areas mainly at the cost of urban consumers are some-what balanced by the governments subsidyand rationing program The subsidy budget for beef is calculated at about LE 57 million for 1980 (see Appendix 2 Table 37) It has
grown quickly in recent years
Milk
Egypts milk market is flourishing in on pro-obscurity Statistical information
duction is vague and based on estimates rather than on surveys 10 4 According to statistics of the Ministry of Agriculture production increased steadily during the 1970s by about 15 percent per year Milk is mainly produced on small and medium family farms Milk home-processed butter (ghee) and cheese provide major sources of regular cash income for those farm house-holds producing a marketed surplus These milk products are marketed either directly by producers or by small peddlers
The eight government-operated milk plants in the country process about 50000 tons of fresh milk per year some of which is
Table 24- Gains and losses of producers and consumers on the meat market 1965 -80
consumerGain or Loss Producer from Fixed Total
Gain or Price Meat Gain or Year Loss Distribution Loss
(1975 LE million) 1965 -1633 189 926 1966 -1528 49 627 1967 -1050 -15 316 1968 1969 1970 1971
-402 -603 -573 -945
-55 -17 -59 -43
-91 216 -50 164
1972 -302 -124 -576 197319741975
-1771 -827
189
10 20
-51 641
14-1051
1976 313 -30 -1620 1977 1978 1979 1980
-shy103 203
-612 223
129 132 339 422
-805 -1002
291 -621
Sources Computed from data provided by the Egyptian
Ministries of Agriculture and Supply and the Central Agency for Public Mobilizationand Statistics
Note Positive numbers are gains negative numbers are losses
sold through government outlets at fixed prices and some of which is marketed by merchants10 5 Public-sector companies are major recipients of imported skimmed milk powder and butter oil The bulk of these two commodities is delivered to Egypt under food aid terms from the European Community which in recent years has normally sent about 10000 tons of milk powder and 3000 tons ofbutteroileachyee Of that in 1980shy81 7000 tons of milk powder and 2800 tons of butter oil were used as nonproject
102This is calculated on the basis of CAPMAS Family Pudget Survey 197475 See von Braun ADemand System for Egypt 103See Alderman von Braun and Sakr Egypt s Food Subsidy and Rationing System p 35
1G4 The most recent representative survey on livestock and animal production available is for 1970 Since then
annual milk production has been estimated on the basis of a projected change of the cattle herd its assumed age structure and milk production per head The milk yields per head used in the calculation for 1979 were for buffalo old 3168 kilograms per year medium 899 kilograms per year and for cows average 674 kilograms per year This unpublished information was provided by the Ministry of Agriculture Cairo 105This information was obtained from the Mist Dairy Company Cairo 1979
66
food aid which means it was processed in the public plants It is z2ither reconstituted as milk or made into cheese1deg 6 These imports are exempt from the analysis of the milk market because they make up onlyabout 4 percent of total consumption (cal-culated in milk equivalents)
Consumption of milk products in Egptis not confined to the higher income (urban) population as it is in many subtropical or tropical countries The average consumptionof milk and milk products in 1975 by rural low-income groups was about 5I kilograms per capita while the country average was 67 kilograms107 Village- made butter and cheese is a major fat and protein component in the diet of the rural poor
Despite the dietary importance of the commodity the government intervenes less in the milk market than in other basic food markets Most of the interventions are iii production (for example the public-sector feed supply upgrading of local cattle and veterinary services) Although these may have helped increase domestic milk pro-duction demand seems to have grown faster which explains rising milk pricesThe index of farm-gate prices for milk has increased from 100 to 350 since 1970 This increase like the increase in meat prices is far greater than the average increase of consunier prices
There are particular problems associated with calculating the income transfers and welfare effects on the milk market because fresh milk is not traded To measure the shadow pri of milk the unit value of milk powder impnts is converted to a liquid milk equivalent and corrected for the distortion in the rate of foreign exchange Of course this is an approximation only Domestic milk prices seem to have been much higher than the equivalent international prices in recent years In 1980 domestic prices were about 80 percent higher than world prices The prices were close together until the mid-1970s the world price exceeded the domestic in some years before that Since then inter-national prices have been nominally stable because milk production has been heavily
protected in the major milk producing counshytries which has led to increases of export surpluses from those countries
According to estimates based on the world price Egyptian milk producers gained
out LE 200 million in 1980 (see Table 25) nsumer income lo3ses were about LE 370
lion in 198 0i The net social loss in consumption is rather high as demand for milk is price elastic
In spite of uncertainties with the data it is clear that protection of the kailk market has icreased as domestic prices have risen and world prices have remained nominallystable Although these developmei its occurred at the same time that food subsidy expendishytures were increasing no particular causal linkage is evident However it is worth noting that implicit income transfers to milk producers added to those calculated for meat producers offset a large share of the losses of producers in those markets that are effectively taxed The ruminants appear to allow producers to compensate for some of the burden depressed prices of cereals pulses cotton and sugar put on their income
Feed As stated earlier price distortions affect
not only the distribution of income between producers and consumers but income transshyfers between crop and livestock production sectors as well Insofar as feed prices are distorted they will change the competitiveshyness of livestock production with crop proshyduction Whether this also implies that income will shift between crop farms and livestock farms depends on the degree of specialization in Egyptian agriculture Availshyable information suggests that except for a small but steadily growing specialized poultry sector livestock production in general and cattle and buffalo production in particular are evenly distributed among farms Table 38 in Appendix 2 shows the development of stocks in the livestock sector
About 65 percent of all animals are kept on farms of less than 3 feddan The value of
These statistics wert provided by the office of the World Food Programme Cairo 1982 These figures are calculated h1-ow milk equivalents from CAPMAS Family Budget Suvey 197475 See von BraunA Demand System forEgypt p 47 OfConsumer prices are derivrd from farm gate price statistics adding a constant relative markup of 20 percent for marketing costs
67
Table 25-Gains and losses of producers and consumers on the milk market 1965 -80
Producer consumer Year Gain or Loss Gain or Loss
1975 LE million)
1965 1966
112 212
-365 -516
1967 1968 1969 1970
327 -915 -1153 -704
-714 569 703 393
1971 -481 175 1972 1973 1974 1975
-1349 -402
70 -320
839 51
-506 -58
1976 -03 -504 1977 1978 1979
653 775
1077
-1378 -1575 -2036
1980 1064 -1987
Sources Computed from data provided by the Egyptian Ministries of Agriculture and Supply and the Central Agencyk fno bull Mobilization and Statistics
Note Positive numbers are gains negative numbers are losses
animal products on these small farms is nearly as high as the value of crop produc-tion109 Because the majority of the small farms operate a mixed crop- livestock pro-duction patarn one may assume that most implicit feed subsidies do not have much effect on the distribution uf personal income within agiculture Adetailed livestock survey by Soliman et al indicates that the share of subsidized concentrate feed mix in the total feed supply used is about the same for all sizes of farmn110
The implicz tions of feed subsidies for distribution would change if intensive poultry production were to continue to grow espe-cially near urban areas These specialized poultry production companies would benefit
from the low-priced feel supplies Yet in 1980 the total feed used to produce poultry and eggs most of which is still produced under typical small- farm conditions amounted to just 577000 tons of starch units This is not more than 7 percent of total feed demand and approximately 18 percent of the total
nutrients in concentrate feed (see Appendix2 TablIs 39 and 40)
Another question needs to be raised about the relationship between feed subsishy
dies and the prices of livestock products Do feed subsidies benefit consumers by reducshying meat prices Considering the marketing system and the supply-demand situation
this is unlikely to happen as long as Egypt is an importing country where prices are deshytermined mainly by import prices and the tariffs and costs of implicit trade barriers
Actually the Egyptian government has been trying for some time to have the feed subsidy transmitted to meat prices Those farmers who receive subsidized feed have been obliged
since September 1981 to sell some of the livestock produced with that feed to govshyernment slaughterhouses at a low fixed price Yet frequent observations suggest
Ithat these fixed prices for livestock producshytion are seldom enforced According to calculations presented by Solimn this should not be surprising at least insofar as the gcneya tprice-fixing policy is conshycerned Sohnan calculates that under average production conditions a farmer who receives only the official fixed price for his cattle cannot cover his costs of producshytion itobliged to sell the product at the fixed price As a result he may refrain from fattening rattle unless he is able to sell his produce on the opet s7rket Most farmers seem to be doing this
As a consequence in the following calshyculation the subsidy of feed (S) of a certain category (i) is defined asthe wedge between
t P11) plied by the quantity (Q) without adjustshyments for changes of vestock prices inshyduced by subsidies
national and world prices (P~n- multishy
109 Ibrahim Soliman James RFitch and Nesreen Abdel Aziz The Role of Livestock Production on the Egyptian Farm Economics Werklng Paper 85 Agdicultural Development Systems Project Ministry of Agriculture Cairo and the University of California-Berkeley Cairo July 1982 p 7 110Ibid pp 31-32
in Egypt Economics Working Paper 62 Agricultural Development Systems Project Ministry of Agriculture 0ro and the University of California-Berkeley Cairo 1982 I Ibrahim Soliman Red Meat Price ie4
68
S Q(Pi p) (15)
The main sources of feed supply in Egypt are berseem and leaves of maize which provide green fodder straw and concentrated feed components including wheat and rice bran and cottonseed cake Direct subsidies are being paid to distribute imported maize directly and for the growing amount of feed mix available which consists of several combinations of bran imported maize cot-tonseed cake and other minor ingredients A comparison of domestic and world prices or price equivalents for the remaining feed categories- namely berseem but also do-mestic cottonseed cake bran and maize not used in feed mix-reveals that their prices are also distorted This is obviously not only the result of trade barriers and quotas for these commodities themselves but also of prices transmitted indirectlyfrom the directly subsidized feed and fcod categories
The empirical basis for the computation of feed quantities is provided by the supply-disappearance balances as described in Appendix 2 These balances have beer gen-erated using estimates of production con-sumption waste seed and stock changes With the exception of maize and sorghum where human consumption was reestimated from family budget surveys most data in-cuding the extraction rates of by-prodt s are derived from FAO and Ministry of Agri-culture sources
As the data in Appendix indicate supplies of maize and wheat bran show the highest growth rates The rapid growth of maize supplies is a consequence of increases of prouuction and since 197475 of importscoupled with a steady decrease in human consumption According to the extrapolations from family budget surveys between 1965 and 1980 annual maize consumption declined from 67 to 38 kilograms per capita in rural areas and from 14 to 4 kilograms per capita in urban areas As a consequence the share of maize in the total supply of energy from concentrates rose from 50 percent to 75
percent It is evident that the implicit subsishydies on maize strongly affect the feed subsidy
Sorghum shows a similar pattern Conshysumption in animal feed substitutes for that consumed by humans This explains the strong growth ofthis feed component which is mainly used for poultry The total supply of the other major components of conce ate feed rice bran and cottonseed cake was more stagnant which reflects their decreasshying share of total area Finally much of the increase in berseem production is a direct reflection of the decline in the area sown with cotton which enabled long-season berseem to be substituted for short- season berseem
An aggregation of all major feed categories using starch units as weighting factors shows that the proportion of concentrates in total feed has beer steadily increasing amounting to nearly 40 percent in 1980 (see Appendix 2Table 40)112 While the total supply of energy increased by approximately50 percent between 1965 and 1980 the supshyply of energy in concentrates has almost tripled
An assessment of total feed subsidies can be made from a comparison of the total feed supplies valued -t domestic prices with the total supplies vlued at world market prices (see Table 26) A major and growing proportion of the governments direct subsidy occurs through the distribution of readyfeed mix which has included a large share of cotionseed cake since the mid-1970s Therefore the subsidy on feed mix is calshyculated separately from the subsidy on the remaining quantities of feed components
If berseem is included the total of exshyplicit and implicit subsidies in 1980 came to nearly LE400 million Yet the time series using 1975 prices shows a clearly decliningtrend for subsidies This is mainly because of the rapid decline ofreal subsidies implied in the domestic berseem price The gap between the farm- gate price of berseem and the world price equivalent has been steadily reduced It is difficult to explain what determines the producer price of berseem especially since only a small proportion of total production is marketed 1 3 The comshy
12 Starch units are chosen because energy is typically ascarce factor in Egyptian feed diets whereas protein is avhle in sufficient quantities due to the large amounts of berseem and maize that are fed According to survey results only about 13 percent of the berseem produced ismarketed See Soliman Fitch and
Aziz The Role of Livestock Production p 31
69
Table 26- Subsidies for selected feed categories and total feed subsidies 1965 -80
Feed Cotton-Year Mix seed Cake
1965 155 842 1966 1967 1968
186 260 200
780 668 510
1969 272 708 1970 1971 1972
276 291 335
681 648 628
1973 358 614 1974 1975 1976 1977 1978 1979 1980
329 308 496 539 577 661 938
488 93 64 85 37 99 71
Individual Feedsa Wheat and Rice Bran Maize
(1975 LE million)
179 462 75 411 41 284 53 360 97 414
112 542 43 244 55 333
124 765 187 1246 122 1206 140 921 52 365 55 409 41 676 19 417
Total Berseem
1638 2820 1451 3292 1253 3148 1124 3162 1492 3330 1611 3546 1225 3089 1351 3299 1861 2196 2250 2123 1729 1766 1622 2091 1042 1010 1077 784 1478 796 1445 693
Total Current Constant Prices Prices
(LE million)(1975 LE million)
2876 4458 3335 4743 3116 4401 2991 4285 3476 4822 3862 5157 3331 4315 3664 4650 3335 4057 3984 4373 3495 3495 4096 3713 3545 2852 2570 1861 3452 2274 3974 2138
Source Computed from data provided by the Egyptian Ministries of Agriculture and Supply and the Central Agency
for Public Mobilization and Statistics These feeds were not included in the feed mix
parative advantage of berseem can be seen in the farming system in general There are indications that factors that increase pro-duction may have dampened the price in-crease These factors include the steady substitution of long-season berseem for short-season berseem mentioned above and the low opportunity costs of land because competing winter crops especially wheat are taxed throughout the period 1965-80 The price of berseem may have increased because both beef prices and the derived demand for ruminant feed did If berseem is excluded from the feed subsidies a time series of direct and indirect subsidies on concentrate feed components can be derived While the sum of these subsidies has been growing in nominal terms they have been constant in real terms (Table 26) Yet the mix of feeds receiving these subsidies has changed The subsidies on those feed categories
subject to direct government intervention such as ready feed mix and maize used sepshyarately as feed have grown But the subsishydies on individual feed components not included in ready feed mix have shrunk
Insofar as the implicit feed subsidies are not just transfers between sectors within agriculture or farms they affect agricultural income significantly And insofar as these feed and roughage items are unevenly disshytributed by types of farms and by regions the price structure has important implications for the income distribution between sectors and regions This issue requires further analyses based on farm household producshytion and income information Direct and indirect feed subsidies with protectionism on the output siue of animal production give a different picture of the aggregate taxation of agriculture than if only the major field crops are taken into account
70
7 THE BURDEN ON AGRICULTURE-DEVELOPMENT AND DETERMINANTS WITH SPECIAL FOCUS ON FOOD SUBSIDIES
The analysis of agricultural policy by commodity in the last chapter made the system seem like a confusing mosaic This chapter will try to show how the parts of the mosaic fit together Attempts will be made to explain how the aggregate burden on pro-ducers developed and to define its major components Hypotheses will be tested to find out what policies determine its size and form And the way food subsidies change the burden will be analyzed
Development and Componentsof the Burden
The aggregate burden on the sector (TB) in year t is the sum of all welfare gains and losses of producers 114
TB (16)TBt GpPt
where
Gpt = the burden on producers from Implicit taxation or protection of commodity i in year t (Go as defined in equation [71) and
i= 1 10 = the commodities wheat rice maize beans lentils sugar cotton meat milk and feed
TB represents the sum of all farm income transferred by government procurement farmerss open market activities and sub-sidized input supplies and of net losses from the misallocation of resources This burder expressed in 1975 prices fluctuated between LE 500 million and LE I billion
between 1965 and 1972 Aftcr an extraordishynary peak in 1973-75 it dropped to about LE 350 niiiionper year in 1976 (see Table 27) In other words agriculture was implicitly taxed much less in the second half of the 1970s than before
The total burden was reduced mostly by lowering the burden on cereals and cotton and increasing protection of animal products it was mainly the development of livestock protection after 1974 that changed the relashytionship between agriculture and the rest of the economy (see Figure 15)
Table 28 confirms that wheat price policy added little to aggregate taxation Producer losses in wheat production usually added only 3 to 10 percent to the total burden Only in recent years when implicit taxation on that commodity remained stable while the aggregate burden shrank has wheats conshytribution increased The contribution of maize is also low though it has fluctuated much more because its domestic prices have been unstable Rices contribution has been higher about 30 to 40 percent in the second half of the 1970s Cottons effect on the tot3l burden has been overwhelming Since the gains from livestock protection and input subsidies have reduced the total burden the share of cotton has increased The rapid changes in the livestock market are a major cause of the reduction of the burden since 1974 (Table 28) Without the livestock protection and feed subsidies the aggregate burden in 1980 would have been 73 percent higher
The producer burden-the farm income forgone as a conseque~nce of price and market interventions-is determined by several seemingly unrelated factors Policies on taxation of agriculture support of farm income and price policies which are directed
114Direct taxation is excluded here Cuddihys assumption that this may balance offwith the implicit subsidy of free
water supply to field borders Is followed (Cuddihy AgriculturalPriceManagement inEgypt)
71
Table 27-Aggregate gains andlosses of producers on agricultural commodity marshykets 1965-80
Cereals Pulses Year and Sugar Meat and Milk Feed Cotton Total Burden
(1975 LE million)
1965 -43220 -15217 16383 -52879 -94934 -703941966 -32670 -13155 14510 -39078
1967 -27816 -7238 12532 -31179 -53701 -35728 -713701968 -33713 -13166 11237 -60881 -104162 1969 -41440 -17556 14916
1970 -34671 -12776 16109 -55049 -86387 1971 -18497 -14266 12255 -47376 -67884
-684211972 -20570 -16510 13508 -44849 -50504 -114556 1973 -60926 -21737 18610
22503 -80550 -206378 1974 -140761 -7571 -152872 1975 -108217 -1303 17295 -60646
1976 -55803 3091 16225 -47344 -83831 -636721977 -19088 5498 10419 -60501
1978 -19032 9774 10774 -36925 -35409
1979 -28682 4656 14779 -26615 -35862 1980 -32776 12874 14446 -31911) -37374
Sources These are aggregated results of partial equilibrium models of the indicated markets calculated from data
provided by the Egyptian Ministries ofAgriculture and Supply and the Central Agency for Public Mobilization and Statistics
Notes Positive numbers are gains negative numbers are losses I This excludes berseem Itshould be noted that the producer losses computed for the maize market are compensated for by the implicit producer gains from depressed feed maize prices to the extent that domestically produced maize is fed to animals
toward improving Egypts self-sufficiency ment and income redistribution In other
contribute positively or negatively to the words the government revenues in a given
aggregate net burden The following is an year should be expected to affect the burden
attempt to identify the major determinants on agriculture Indirect taxation of agriculshy
of theproducer burden to trace the explana- ture is particularly attractive for a governshy
tory variables accounting for its recent rapid ment that has problems collecting direct Indirect taxes through procurementdecrease and to assess the effect food sub- taxes
are easier to administer in the short runsidies have had on it especially since procurement prices in Egypt are usually announced shortly before the
procurement season beginsDeterminants of the Burden
As the time series of the implicit producershyconsumer transfers on the major food com-
Because Egyptian policymakers give high modity markets show explicit food subsidies
priority to stabilizing domestic agricultural evolved out of a system of implicit consumer
prices and food prices in particular it subsidies largely financed by agriculture (see
seems obvious that instability in international Tables 13 14 and 15) The skyrocketing
prices would contribute to fluctuations in budget for the system after 1973 is astonishing So would govern- only if the implicit subsidies of earlier yearsthe producers burden
ment interventions in crop allocation pro- are ignored 11igh population growth high curement and input subsidization Gov- income growth and weak performance of ernment quotas on imports and exports add agricultural production suddenly induced a to the burden by affecting domestic open rapid decrease in self-sufficiency How did market prices Each of these factors reflects agricultural policy react the amount of resources available to the If stabilizing the prices of subsidized
and rationed commodities were a fixed obshygovernment and the goals set for develop-
72
Figure 15- Producer losses and gains on commodity markets and aggregate netburden 196580
1975 LE Million
2000-
Otton 1500
1000x G Meat milk feed (gains)
500- rains pulses
4j- Total burden
1965 1970 1975 1980Sources These are aggregated results of partial equilibrium models of the indicated markets calculated from dataprovided by the Egyptian Ministries ofAgriculture and Supply and the Central Agency for Public Mobilizationand StatisticsNotes The total burden isthe sum of the losses from taxation minus the gains from protection on the markets Theamount a commodity contributes to the burden is the distance between its line and the line below it(not
contribution ofmeat milk and feed lies above the total burden line it shows again from meat milk andfeed (which isdeducted from the burden) When that shaded area isbelow the total burden line it shows aloss from meat milk and feed Similarly when the line for sugar is below the line for grains and pulses the
the distance from the horizontal axis except for grains and pulses) When the shaded area representing the
shaded area represents again from sugar and when it is above it shows a loss from sugar Grains and pulsesand cotton always show losses Table 28 - Components of the burden on agriculture 1965-80
Year Wheat Maize Rice Meat MilkBeans Lentils and Feed Sugar Cotton
(percent)1965 61 112 180 34 031966 -1269 129 209 52 60 557 1967 87 114 336
04 -01 555-1915 031968 36 106 340 19 04
-98 -39 580 1969 31 83 27 -34 502243 21 031970 2550 120 170 14 57622 021971 -3854 78 145 15 06
34 637 1972 47 29 -26 69789 132 191973 108 07 43 03113 174 65530 241974 72 77 351 06
27 83 440 1975 78 88
07 -72 167 390406 101976 100 114 352 06 -104 117 39617 091977 -23043 20 197 27 70 564
1978 04 -25071 62 436 18 06 95001 -5801979 180 202 400 -53 104233 011980 -541 -19193 41 742374 23 02 -730 242 854
Sources These are aggregated results of partial equilibrium models of the indicated markets calculated from dataprovided by the Egyptian Ministries ofAgriculture and Supply and the Central Agency for Public Mobilizationand StatisticsNotes All rows add up to approximately 100 which equals the total burden Subsidies for inputs other than feedsuch as fertilizers and pesticides reduction of the burden
are included In the models for specific crops Anegative number indicates a
73
jective the government had in principle all the instruments necessary to reduce the budgeted subsidy expenditures by increasing implicit taxation of the agricultural sector But the government would not apply them if self-sufficiency were the dominant goal In that case an increase in explicit food subsidies might be the consequence of efforts to reduce implicit taxation of agriculture in order to increase domestic food output In this sense there is an inherent conflict be-tween short-term fiscal objectives and self-sufficiency objectives It is basically the production effects of pricing that determine an optimal long-run solution of this conflict
Aregression model is used here to assess more comprehensively the role of each of the contributors to the total burden The model evaluates the hypothetical effects on the agricultural burden of the three objec-tives outlined above to isolate domestic prices from international price fluctuations to generate public revenues and to reduce explicit food subsidies Aquantitative speci-fication for year t is
TBt = f(Pntt Rt Ft) (17)
where
= total burden on agriculture(as definedTBt in equation [161) multiplied by (-1)in 1975 prices
Pnt t = international price index of agricul-tural commodities imported toex-ported from Egypt (196566 average = 1)
Rt = government revenues in 1975 prices and
prices increased the burden on agriculture by 13 percent A10 percent increase in total government revenues had the opposite efshyfect it reduced the burden by 16 percent I15
The impression that explicit food subsidy policies did not increase the burden on agrishyculture is supported by the model results The estimation results also reveal how imporshytant increased revenues from other sources were in the rapid decrease of the burden Growing revenues not only reduced the burden induced by price policy but they were also used to support agricilture through public investment (see Chapter 5)
The results do not indicate that agriculshytural policy is being revised as part of an economic strategy that emphasizes agriculshyture more and industry less They simply show a general shift in this direction The opening of the economy after 1973 affected agriculture only by generating government revenue However it is not unlikely that if government revenues get tight again agrishycultural policy will be redirected to increase the burden on agriculture
The basic findings from the regression model apply not only to commodities as a whole but to basic food commodities as well as Table 29 shows Food subsidy expendishytures seem to induce hgher burdens for these commodities but again the parameter is hardly statistically significant Yet it seems possible that the governments actions to reduce the drain from the budget are particushylarly concentrated on those commodities that induce the food subsidy outlays But if these actions have any importance at all it is only a minor effect on agricultural incomes
The full effects of price subsidy and procurement policies do not show up in the
official budget as explicit food subsidies An =food subsidy expenditure as budgetedin 1975u icesf baggregation of all positive and negative
budget effects on the commodity marketsin 1975 prices shows these effects more completely In addition to food subsidies the export taxesThe results in Table 29 show that for cotton and rice are included here as wellfactors representing the domestic price sta-
bilization objective and the availability of as some of the procurement costs which were neglected in examining the officialgovernment revenues dominate changes in subsidy budget Fiscal costs generated conshythe burden The effect of budgeted food sistently in the welfare analytical frameworksubsidies on the change in the total burden are used in the aggregation which is basedis not statistically significant A 10 percent
rise in the index of international agricultural on the following equation
Is These Implicit elasticities are calculated at mean values from 1965-80 and parameters estimated with equadon (17)
74
Table 29- Determinants of changes in the burden on agriculture
DepenshydentVariable Independent Variables F DW
TB - 10270 +7698 P - 08404 R+ 03633 F 2210845 218(354) (-741) (052)
FB - 4689 + 5823 P1 - 06080 R + 06698 F 0899 355 232(438) (-878) (158)
TB - 3496 + 10110 Pin- 051 R -2236 A 0904 377 204 (916) (-364) (-281)
GBI - 2044 + 10430 Pt - 05190 R- 2452 A 0912 416 202 (916) (-364) (-281)
Notes TB is the total burdc (implicit taxation) on agriculture In 1975 prices multiplied by(-]) FB is the burdenon basic food commodities markets (wheat rice maize pulses and sugar) GB is Y2 with public expendishytures on agriculture subtracted Plt Is the international price index of agricultural commodities imported tonr exported from Egypt R is total government revenues in 1975 prices F is food subsidy expenditures asbuuls-4 in 1975 prices and A Is net budget spent on agricultural commodities as computed with the partialequilibrium models (sum of government expenditures minus revenues for procured quantities sold on thedomestic market for procured quantities being exported and for Imports sold on domestic markets)
=t R (Bpr Bex t+ B mt) (18) The explicit food subsidy variable (F)is
replaced with this budget effect variable (A)where in the equations for TB (see Table 29) Inequation (19) government outlays for agri-At = the net increase of the budget spent culture are combined with agricultureson agricultural commodities burden for a more complete picture of the
Bprc t = net budget expenditures for procured relationship between agriculture and the restof the cconomy It might be argued thatquantities being sold on the domestic parts of the current expenditure budgets ofmarket (net revenues are negative) the agricultural minisLries have little to do Bt -net budget expenditures for procured with the agricultural income as they arequantities being exported (which mainly for employment in agricultural adshyusually are negative representing ministration and may have little effect onexport tax revenues) production However research and extenshysion personnel atid those who manage theBImt net budget expenditures for imports investment and input provision programssold on domestic markets (which are and the water system cannot be separatedmostly rationed and subsidized com- from those less directly concerned withmodities which means this variable production Thus the total agricultural budgetalso includes explicit food subsidies) comprising investment (AI) and current
and expenditures (AC) is deducted from the total i the index for commodities (wheat burden for the following analysis16
rice maize beans lentils sugarcotton and meat) GBt = f(Pint Rt At) (19)
116The Input subsidies are already deducted from theburden so they are not included as exogenous determinants
75
where
GB = TB - Al t -AC
Again the results in Table 29 show how important domestic price stabilization is and how revenue affects the burden More-over the higher the governments net ex-penditures for interventions in the agricul-tural commodity markets (A) the lower the general burden (GB) This supports the hypothe5 s that the burden was reduced as government outlays for food subsidies and agriculture as a whole increased Self-suffi-ciency and income support objectives also seem to support this hypothesis This means that the rising food subsidy bill either had no effect on the burden on agriculture or perhaps reduced it
Conclusions and PolicyImplications
Egypts current food subsidy system did not spring from one decision made in the early 1970s even though it was then that the huge fiscal outlays which characterize it be-gan It evolved from existing agricultural and consumer price policies that were im-plemented a long time before These policies included export taxes to finance the industrial growth strategy adopted and implicit transfers of income from producers to consumers-implicit food subsidies to finance the cheap food prices Given this background it is not surprising that Egypt moved to an explicit food subsidy scheme as the self-sufficiency of major commoaities that were implicitly subsidized (such as wheat) decreased rapidly Indeed a major change in consumer price policy would have had to occur for Egypt not to have drifted toward an explicit subsidy system in the 1970s as the time-series analy-ses for the relevant food commodity markets show
The course that Egypts food policies have taken provides an important lesson for countries keeping producer prices low to support consumers Supply and demand pro-jections show that many of these countries
are going to become net importers of food in the years ahead 17 If they have rather plenshytiful nonagricultural resources-as Egypt had mainly because of its rapidly developed oil reserves the Suez Canal and foreign assistance-it seems fair to predict that many of these countries are going to drift from implicit to explicit food subsidy schemes as Egypt did But when this happens tight budgets will make severe internal distribution conflicts unavoidable These countries will have to know more about how to revise their food pricing systems and still ensure nutrishytional well-being
Another issue is raised by the conclusion that in spite of rising budget outlays for food subsidies the income burden on farm production has been steadily reduced This reduction was the result of several factors including changes in procurement policies adjustments of prices and price ratios and variations in interventions in agricultural trade It was particularly a result of rising prices in domestic open food markets In the course of the 1970s agriculture financed low copsumer prices less and the general taxpayei financed them more Agricultures contribution to the system decreased in absolute terms This means it may not be concluded that consumer subsidies always burden agricultural production In Egypt the systems expansion by and large did not However it was possible to shift from the implicit to explicit subsidies only because government revenues increased Foreign assistance had its part in that
It has been shown that in the early years of exploding food subsidy outlays public investment in agriculture already disproshyportionatly low was reduced further In recent years more funds have been allocated to promote production of those crops whose output has lagged the most behind demand This suggests that the countries with cheap food price policies may find themselves under pressure to promote agricultural proshyduction Research forecasting how producshytion and demand develop in specific counshytries may help those countries to make their policies more timely so that production can keep up with demand This could help counshytries to avoid exploding food subsidy proshygrams as in Egypts case
I 7 International Food Policy Research Institute Food Needs ofDeveloping Countries Projections ofProductionand Con sumption to 1990 Research Report 3 (Washington DC IFPRI 1977)
76
It has to be emphasized that the burden on the income of Egypts farm producers was not reduced primarily by streamlining price distortions in agriculture Policy changed partly because of increased sub-sidies on inputs so that implicit taxation of basic food commodities was reduced and livestock production was increasingly pro-tected The major inefficiencies in allocation were inherent in Egyptian agricultural policy before the budget outlays for food subsidies began to expand in the 1970s118 The net social loss in the production and consump-tion of all the commodities considered in this study accounted for 15 percent of na-tional income in 197980 But the increase of the explicit subsidy expenses alone can-not be held responsible for these costs the total sum of theses ial costs resulted from distorted prices as the price policy analysis demonstrated The bulk of the social costs resulted from the protection of livestock pro shyduction the taxation of cotton and depressed cereal prices only the latter being partly a result of explicit and implicit food sub-sidies As in many other countries Egypts agricultural policy has yet to remove distor-tions in agricultural price ratios and in the terms of trade between agriculture and the rest of the economy at least insofar as the development strategy does not require that part of the agricultural surplus be taxed indirectly A removal of price distortions
might be neded if agriculture is to grow more rapidly But as the analysis of supply response has indicated it may not be enough The rigid constraints on resources deficits of public water and input supply manageshyment and the inefficiency of the agricultural extension service tend to offset the incenshytives price adjustments give for growth Price policy should not be viewed as a panacea for Egypts rural development and national food problems
Although increasing producer prices while keeping subsidized consumer prices steady might not increase agricultural proshyduction significantly it might still affect rural income growth through multiplier efshyfects that stimulate production and emshyployment in nonagricultuial rural sectors
The expansion of the food subsidy and rationing scheme into rural areas in recent years has increased the transfer of income to both the farm and nonfarm populations in rural areas Support for producer prices would add to that increase More microecoshynomic analyses could improve the undershystanding of these linkages between sectors and regions and their repercussions on agrishyculture Such knowledge might contribute to the design of a comprehensive food policy favoring immediate improvements in nutrishytion and growth of rural income as well as easing the adjustments a developing economy needs to make in the longer run
118See Hansen and Nashashibi Foreign Trade Regimes and Economic Development Egypt for the agricultural price polshyicies in the 1950s and 1960s
77
APPENDIX 1
SUPPLEMENTARY TABLES
Table 30- Net returns of major crops 1965 -80
Rice Cotton Long Berseem Short Berseem Year Wheat Maize
(LEfeddan) 324292 676
1965 88 79 39 97 634 306
1966 168 160 85 610 295
1967 98 183 187 252 313 17135648 100 2031968 209
37 160 199 484 400 1969 189 1970 195 199 186 272 354
230448309181 200 158 469 338 181
1971 188 252 1341972 373769341167 449353 9231973 321 356 202 4244591974 396778317284279 959 4751975 430 252 607266 222 5931976 449 1195404i977 507 542 752820 1480743 386 586 7221978 1231 1427585 187 640 9461979 1078 1900282 830 4661980
Source Calculated from data provided by the Egyptian Ministry of Agriculture
The net returns are calculated as yield times price plus the value of by- products minus the cost of production Note
The cost of production includes labor wages and land rer
returns of major rotations 1965-80Table 31 -Net
Short BerseemLong Berseem Long Berseem CottonMaize
Year WheatMaize WheatRice Rice
(LEfeddan) 616
1965 167 127 715 795 403 755
7192541966 329 793 5477982751967 270 413 5275162511968 148 560 6945991969 197 236 4625535403811970 394 5386476053381971 380 6505904733231972 440 71411229364881973 674 1279 87311256611974 815 713105710617147101975 1082118112111976 488 518 1042173815999111977 1049 572186720671978 1130 1329 i9531614 1979 771 1225 2067 20242731748 23651980 1112
Source Calculated from data provided by the Egyptian Ministry of Agriculture
The net returns are calculated as yield times price plus the value of by- products minus the cost of production Note
The cost of production includes labor wages and land rent
78
Table 32-Calculation of border prices at farm gate for wheat 196580
Import Uot Foreign ExchangeYear Value Marketing Cost Bias Border Price
(LEmetric ton) 1965 320 36 337 6931966 300 42 333 6751967 310 42 305 6571968 270 42 248 5601969 270 42 295 6071970 299 42 332 6731971 277 48 254 5781972 283 48 242 5731973 632 48 461 11411974 885 54 558 14971975 731 60 596 13871976 601 66 538 12061977 472 72 397 9411978 524 84 441 10491979 1253 90 94 14371980 1497 114 258 1869
Sources The import init values for 1965-69 are from the Central Agency for Public Mobilization and Statistics andthe values or 1970-80 are from the Egyptian Ministry of Supply The marketing costs are from Black andVetch International Master Plan for the Development of Egyptian Storage duid Distribution System forFood Grains paper prepared for the General Authority for pply Commodities Cairo 1978Notes The foreign exchange bias was calculated from the official and shadow exchange rates (see Table 6) Theborder price is the sum of the import unit values marketing costs and foreign exchange bias
rable 33-Calculation of border prices at farm gate for rice 1965-80
Export Unit Processing Foreign ExchangeYear Value Marketing Cost and Milling Bias Border Price
(LEmetric ton) 1965 623 75 26 656 12301966 652 82 26 724 13201967 696 82 20 684 13181968 814 81 20 746 14991969 731 84 22 797 14661970 530 87 21 588 10521971 495 90 21 454 8801972 501 91 20 428 8581973 907 95 20 662 14941974 2914 106 31 1837 46771975 2384 116 32 1944 42441976 1540 128 41 1380 28331977 1082 144 42 911 18901978 1367 160 38 I150 23961979 2324 176 47 175 23701980 2512 216 94 432 2823
Sources The export unit values for 1965-69 are from the Central Agency for Public Mobilization and Statistics andthe values for 1970-80 are from the Egyptian Ministry of Supply The marketing costs are from Black andVetch International Master Plan for the Development of Egyptian Storage and Distribution System forFood Grains paper prepared for the General Authority for Supply Commodities Cairo 1978 Notes The foreign exchange bias was calculated from the official and shadow exchange rates (see Table 6) The
border price is the sum of the export unit values marketing and processing costs and foreign exchange bias
79
Table3- Calculation of border prices at farm gate for beef 1965 -80
Year Import Unit
Value Marketing Cost Foreign Exchange
Bias Border Price
(LEmetric ton) 1965 329 199 3466 69551966 282 217 3130 61671967 251 219 2467 51961968 198 216 1815 40111969 216 223 2356 47391970 233 231 2587 51481971 309 238 2833 61611972 242 243 2069 47321973 465 254 3393 82971974 416 281 2623 70641975 300 309 2447 57561976 323 340 2895 64651977 471 383 3965 90581978 436 426 3670 84561979 1173 469 882 130811980 1128 575 1942 13797
Sources The import unit values for 1965-69 are from the Central Agency for Public Mobilization and Statistics andthe values for 1970-80 are from the Egyptian Ministry of Supply The marketing costs are from IbrahimSollman Red Meat Price Policy in Egypt Economics Working Paper62 Agricultural Development SystemsProject Ministry of Agriculture Cairo and the University of California-Berkeley Cairo 1982 Notes The foreign exchange bias was calculated from the official and shadow exchange rates (see Table 6) The
border price is the sm of the import unit values marketing costs and foreign exchange bias
80
APPENDIX 2 THE CALCULATIONS OF THE EFFECTS OF GOVERNMENT INTERVENTION IN SELECTED MARKETS
The effects of government intervention Pdis - the price for quantities distributedin the wheat rice red meat and feed markets by thi governrrent (subsidized or wce discussed in Chapter 6 The calculations ratioiled)of those effects are described here s
The price elasticities of demand used are - second tier subsidizedrationed for wheat -013 for rice -001 for maize price (or urban free price) -0 13 for beans and lentils -038 for sugar t1111 - the domestic price paid by the farmer -040 for red meat -072 for milk -084 Pfe - the free market consumer priceand for cotton 020 The wheat price elasshyticity is a weighted average of estimated co- Pfe - the free market producer price (atefficients for wheat grain bread and flour the farm gate) The elasticity for cotton is not based on an Pnt - the border price equivalent at theestiration result it is an informed guess shadow exchange rate All were calculated from disaggregated reshysuits in the annex to Joachim von Braun Pnt - the border price equivalent at the A Demand System for Egypt official exchange rate
The abbreviations used in this appendix PpPrc- the procurement pricefollow Qdem - the quantity consumed domestically
(production trade waste indusshytrial use change in stocks animal
B - increase in the governments bud- feed with seed for the crop subshyget because of exports tracted)
Bim - increase in the governments bud- Q1i - the quantity distributed by the govshyget because of imports ernment (rationed and subsidized)
Bpmc - increase in the governments bud- Qf = the quantity of feed of commodity i get because of procurement and Qre - tha quantity marketed on the opendistribution market
Blt - total increase in the governments Qhum - human consumption of maize and budget sorghum estimated from family
G - income transfer from or to con- budget surveys and consumption sumers by governmentdistribution projected to 1980 from the per capitatrend of 196465-197475 Gre - income transfer from or to con- trentityi196 te6 netip475 sumers in the open market thequantityimported(net imports)
- income transfer from or to producers Qime - the quantity of feed importedin the open market Qnd - the quantity used by industry
GP - income transfer from or to producers Qprc - the quantity procured from domesP from procurement tic production
Goc - net social loss in consumption Qpd - the quantity produced domesticallyGP - net social loss in production - the change in stocks Gc - total consumer loss or gain Qse the quantity used as seeds
GPIt - total producer loss or gain Q K - milling and handling costs for feed Qstr - the quantity of starch units in conshy
mix production centrates (c) or roughage (r) m - marketing and handling costs per Q - the quantity wasted
unit S - input subsidies per unit
81
tfPre - the tax rate on the producer price
- the tax rate on the consumer pricetf e
ns - the price elasticity of supply (for the definition see Chapter 6) and
nd - the price elasticity of demand
Wheat Rice and
Red Meat Markets
The calculations of the effects of govshy
ernment intervention in the wheat market are based on the following set of equations
Producer loss or gain from procurement
1 G~ (P c+ S- Pi) -QprG
Producer loss or gain in free market sales
GfPe = (Qprd - Qprc) (Pire +
Net social loss in production
G -P 2 (tpfe)2 so
The producer loss or gain
S - PntI
GP - G~p + GP - G77 C
Consumer loss or gain from governmentwheat distribution
Qjemn- Qprd + Qim - Qind - Qse - Qw - QThe
and
Gd-c- (Qdem - Qprd + Qprc (Pint - Picre)
Consumer loss or gain in free market purshychases
Gre = (Qprd - Qprc) (P - P~J
Net social loss in consumption
G -coc12 (te)2 d Qden - Pe--
p P putation results of the model are avaiablefrfrom the authors They are adjusted for ex-
Total consumer loss or gain
G s + G - G o
Increase in governments budget from proshy
curement and distrtbution
Bpc Qprc (Pc + m - j
Increase in governments budget from the subsidized distribution of imports (calshyculated at the official exchange rate)
Bim = Q1m (P nt + m - Pds)
Total budget increase
Bprc + Bim
The calculations of the effects of governshyment intervention in the rice and red meat markets follow the same logic as those for wheat The other markets discussed in Chapshyter6 maize pulses sugar cotton and milk are similarly modeled The details and comshy
ports milling and other utilization ratios for the commodity For some commodities GP or G1sis zero The results for these marshykets are given in Tables 35-37
Feed Market Analysis
analysis of the feed mdrket has four parts The first the data used to determine the demand for feed is given in Table 38 The second the total feed requirement is given in Table39 The other two parts are the calculations of the supply of feed and of feed subsidies
Calculation of Feed Supply
The supply of the by- products of milling and processing wheat bran rice bran and cottonseed cake is given by
QfeI = e (Qpdi + QIm- Qind1023
Qsei- Qsci) + QInfe
82
Table 35-Model computations for the wheat market 1965-80
QP Qdtm 0d 0fiYear qQi Ob
(1000 metric tons)
1965 1966 1967 1968 1969 1970 1971 1972 1973 1974 1975 1976 1977 3978 1979 1980
12716 14659 12905 15176 12690 15171 17301 16151 18383 18845 20325 19600 16973 19330 18560 17960
23260 21270 28170 22690 27060 25680 27820 26820 31715 35478 39140 37095 44531 55640 49056 55996
2290 2580 2490 2830 1346 1821 2856 2411 2824
94 3816 3012 1385 1275 2893 1252
32936 29169 33495 31586 43310 45551 36793 4222 1 46838 48153 46005 50705 55134 68430 66016 68986
22510 i090 2 380 19240 31966 32201 22346 28481 31279 32902 29496 34117 39546 50375 50349 52278
10426 12079 10415 12346 11344 13350 14445 13740 15559 35251 16509 16588 15588 18055 15667 16708
Year GP G9 GGPM Gdi Gce
LE nallion)
1965 1966 1967 1968 1969 1970 1971 1972 1973 1974 1975 1976 1977 1978 1979 1980
-03 -102
-96 -86 -47 -67 -79 -62
-228 -365 -312 -194 -49 -56
-199 -125
-373 -330 -190
-87 -268 -359 -294 -267
-1042 -1331 -155
-945 -353 -267
-1008 -1539
-100 -91
47 08
-75 -300
-88 -74
-266 -335 -274 -209
-59 29
-224 -323
-375 -342 -333 -181 -240 -325 -285 -255
-1004 -1361 -3193 -931 -342 -351 -984
-1341
896 649 823 452 903 1321 568 707
2498 3469 2786 2603 1973 2935 4888 6991
347 288 139 22
206 282 223 214 999
1357 1234 1038 438 354
1099 1620
Year Yea GGHi Geurolo Bprc 111m Btot
(LE million)
1965 1966 1967 1968 1969 1970 1971 1972 1973 1974 1975 1976 1977 1978 1979 1980
66 25 07 00 22 29 13 16
252 408 261 222
43 20
287 469
1177 912 952 473
1085 1374
76 90 5
3246 4418 3758 3418 2387 3289 5700 8142
-04 05 03
-10 -04
02 04 07 09 29 67 51 28 27
102 54
141 300 143 -29 -34 42 01 17
1071 1760 1363 832 451 728
4300 6046
137 104 144 -39 -39 44 05 24
1079 1789 1430 883 479 815
4403 6101
83
Table 36-Model computations for the rice market 1965-80
Year QA QOex Qprc dem Qdls Qffe
1965 1966 1967 1968 1969 1970 1971 1972 1973 1974 1975 1976 1977 1978 1979 1980
17869 16749 22755 25827 25570 26030 25357 25124 22706 22389 24279 23000 22720 23510 25110 23840
311 311 419 555 762 646 480 433 293 136 102 208 221 146 175 100
(i000 metric tons)
894 8483 839 8774
1156 8719 1322 9205 1342 8999 1154 9529 1068 10459 1021 10785
925 10742 866 11858
1166 12477 1086 12555 1054 11427 1107 12665 1305 13362 1222 13328
2548 2200 3126 2817 874 844
1959 2132 2924 4121 6360 4793 4461 5546 6510 6735
5935 6574 5592 6388 8125 8685 8499 8653 7818 7737 6117 7761 6966 7118 6853 6594
Year GPC GKe GPoc GPot Ges Gfe
1965 1966 1967 1968 1969 1970 1971 1972 1973 1974 1975 1976 1977 1978 1979 1980
-520 -539 -663 -912 -902 -474 -321 -288 -626
-2264 -2617 -1354 -684 -907
-1052 -1214
-446 -378 -465 -591 -693 -486 -341 -337 -803
-3472 -2779 -1486
-696 -963 -866
-1063
(LE million)
140 -1105 119 -1036 150 -1279 193 -1696 232 -1827 142 -1103 98 -760 92 -717
211 -1640 872 -6607 816 -6211 422 -3261 187 -1567 267 -2136 264 -2183 324 -2601
238 205 183 273 133 64 82 91
326 1710 2380 1114 612 965 923
1205
472 471 366 469 725 451 304 309 746
3134 2178 1571 694 937 840
1016
centC
Year GcO 0Gtot Bprc Bex Btot
1965 1966 1967 1968 1969 1970 1971 1972 H3 19I4 1975 1976 1977 1978 1979 1980
06 03 02 03 O 02 01 01 08
145 108 29 05 09 ()8 10
705 672 547 739 853 513 385 399
1063 4699 4450 2655 1300 1893 1755 2212
(LE million)
-14 -45
-107 -75 -10 -07 -15 -09 -12
16 133 142 128 247 119 156
80 87 87
181 185 24 00 01
119 317 170 138 42 32
204 120
-94 -132 -194 -256 -194 -32 -15 -11
-130 -301
-37 04 87
215 -85 35
84
Sources and notes for Tables 35 and 36
Sources Calculated from data provided by the Egyptian Ministries of Agriculture and Supply and the Principal Bank for Development and Agricultural Investment
Notes Qrd Is the quantity of paddy produced domestically Q1 the quantity imported Qxthe quantity exportedQ~o the quantity procured from domestic prodution Qdem the quantity consumed domestically Qdisthe quantity distributed by the government and Qr the quantity marketed on the open market Gpt is the Income transfer from or to producers from procurement G the income transfer from or to producers in the open market GP the net social loss in production and GiPot is thethe total producer lorz or gain Gcdjsincome transfer from or to consumes by government distribution Gfce the Income transfer from or to consumers in the open market Gcoc the net social loss in consumption and Grtthe total consumer loss or gain Bprc is the increase in the governmers budget because of procurement and distribution Bim the increase in the budget because of imports Be the increase in the budget because of exports and Bratthe total increase in the budget
Table 37-Model computations for the beef market 1965-80
Year Qprd Qdem Qim GFe GPoc GPot
(1000 metric tons) (LE million)
1965 241 296 55 -972 82 -1053 1966 284 338 54 -884 190 -1074 1967 332 359 27 -690 53 -744 1968 348 371 23 -275 05 -280 1969 340 363 23 -422 13 -435 1970 1971
295 282
330 321
35 39
-415 -678
14 52
--429 -730
1972 291 325 34 -235 04 -238 1973 313 354 41 -1230 226 -1456 1974 326 396 70 -720 33 -754 1975 1976
337 302
386 400
49 98
190 348
01 03
189 345
1977 323 394 71 -127 00 -128 1978 337 447 110 282 02 280 1979 326 408 82 -906 23 -929 1980 336 448 112 417 02 415
Year GGd G Gl Bi
(LE million)
1965 682 122 207 597 -69 1966 486 34 80 440 -135 1967 251 -11 17 224 -78 1968 -25 -38 00 -63 -80 1969 176 -12 08 156 -66 1970 07 -44 00 -37 -135 1971 167 -33 07 126 -144 1972 -330 -98 26 -454 -168 1973 590 08 71 527 -131 1974 -06 18 00 13 -165 1975 -885 -51 114 -1051 -171 1976 -1457 -33 297 -1787 -317 1977 -1041 160 120 -1001 -121 1978 -1357 182 209 -1384 -222 1979 -73 515 01 441 443 1980 -1716 784 223 -1155 566
Sources Calculated from data provided by the Egyptian Ministries of Agriculture and Supply and the Principal Bank for Development and Agricultural Investment
Notes Qp~d is the quantity produced domestically Qdjm the quantity consumed domestically and Qj the quantity imported (net imports) Gil is tne income transfer from or to producers in the open market GPOC the net social loss in production and G gain G is the income transferthe total producer loss or
aiomor to consumers in the open market GiI5 the income transfer from or to consumers by government distribution G the net social loss in consumption and GtOthe tota consumer loss or gain Bm is the Increase in the governments budg( t because of imports distributed at the subsidized price
85
Table 38- Energy demand per unit of livestock apd livestock numbers selected
years Livestock
Total StockEnergy Share of
1965 1970 1975 1980Demand Total StockType of LivestockAge
(1000 starch (percent) (1000 head)
unitsyearhead) 2102 212009075 1000 1608 2115
Over 2 years 11 516
1 - 2 years
Cattle
084 282
Less than 1 year 051 202 23791277 1000 1617 2009 2204
Over 2 years 1544 637 I - 2 years 095 207 Less th I year
Buffalo
062 155 0243 100 1 2642 3221 3247 4189
Sheep and goats 30146 170 56 35 29Horses
219 10 15 127 1O5 100 Camels
073 1000 I18 1392 1533 1500Donkeys
(1000 metric tons)
25 1000 86 96 110 123 Poultry
35 1000 40 50 60 77 Eggs
Sources Data on energy demands of livestock are taken from Alois Grosse-Rueschkamp Optimal Planning of
Feed Mix Industries in Egypt (PhD thesis University of Bonn 1979) (In German) The age distribution
of livestock is taken from James D Fitch and Ibrahim Soliman -The Livestock Economy in Egypt An
Appraisal of the Current Situation Cairo 1982 (mimeographed) The data on total stock comes from
Egypt Central Agency for Public Mobilization and Statistics
This figure is in 1000 starch units per year per metric ton
Table 39- Total requirements of feed 1965 -80
Other Livestock TotalPoultry and Eggs Cattle and Buffalo RequireRequire- Share of Require- Share of Require- Share of
Total mentsTotal mentsYear ments Total ments
(1000 metric (percent) (1000 metric(1000 metric (percent) (1000 metric (percent)
tons of tons of tons of tons of starch units) starch units)
starch units) starch units)
1965 3550 61 35240 605 19377 333 58167
1966 3825 64 35810 602 19822 333 59457
1967 4100 67 36370 598 20284 333 60755
1968 4105 60 43486 645 19787 293 67378 299 68778
1969 3995 58 44171 642 20612
1970 4150 59 44806 638 21280 302 70277 4 445 644 20811 294 70561
1971 4305 61 t
6110 640 21402 297 720121972 4500 62
295 76311973 4580 63 46564 641 21487
294 732311974 4710 64 46938 640 21582
295 738721975 4850 65 47218 639 21804
293 743121976 5080 68 47418 638 21813
292 7485747520 634 218621977 5475 73 302 76914
1978 5430 70 48201 626 23283 301 78031
1979 5610 71 48904 626 23516 300 79143
1980 5770 72 49616 626 23757
Sources Calculated from data provided by the Egyptian Ministry of Agriculture The amounts required per head
were taken from Alois Grosse-Rueschkamp Optimal Planning of Feed Mix Industries in Egypt (PhD
thesis University of Bonn 1979) (in German)
Note The calculated total requirements deviate from the toto supply calculated in Table 40 because of difshy
ferences in the estimation procedures for supply and Yequirements
86
where i equals 1 wheat bran 2 rice bran or 3 cottonseed cake and e equals the extracshytion rates of the by-products The extraction rate for wheat-the wheat milling rate-as calculated from data provided by the Ministry of Supply and Honie Trade w-Ii 083 in 1965 090 in 1966092 in 1967 and 1968 088 from 1969 to 1972 082 in 1973 and 1974 and087 from 1975 to 1980 The rice bran extraction rate was 0062 and the cottonseed cake ex-traction rate was 044 percent Raw paddy contains 14 percent husk the rest yields9 percent bran 80 percent of which is used for feed and 20 percent ofwhich is processed into bran oil Raw cotton contains 64 per-cept seed of which 69 percent is processed into cottonseed cake
The supply of maize sorghum and bar-ley for feed is calculated by
Qfei = Qprd1 + Qimi - Qind
Qw - Qsei - Qsci - QhumI
where i equals 4 maize 5 sorghum or 6 barley
Human consumption is estimated using data in family budget surveys for rural and urban per capita consuniption (ci and Cu)multiplied by population (POP or POPu) The consumption figures between the family budget surveys (196465 and 197475) are interpolated and the figures are extrapolated to 1980
cit = POPt - Crit + POPu t - Cujt
where t equals 1965 1980 and i equals4 (maize) or 5 (sorghum) The figures for the human consumption of barley were taken from Food and Agriculture Organization of the United Nations FoodBalanceSheets1965-80 (Rome FAO 1982)
The supply of berseem is given byT
Qfe =j yieldj bullarea
where i equals 7 berseem and where yield is the yield of long season berseem(j equals 1 22 tons per feddan) short season bershyseem (j equals 2 97 tons per feddan) and seed berseem (jequals 3 195 tons per fed-dan) and where areaj is the area of these same three types of berseem
Similarly the supply of straw is given by
4 = straw area
where i equals 8 straw and where straw is is the yield of straw from wheat (j equals 1 168 tons per feddan) barley (j equals 2 122 tons per feddan) beans (j equals 3 11 tons per feddan) and lentils (j equals 4076 tons per feddan) and where area is the area of these same four sources of straw
Green fodder of maize is a by- product of maize production obtained by stripping the staks of their green leaves The yield is asshysumed to be 043 tons per feddan of maize so the supply of green maize leaves is given by
Qfei = 043 area1
where i equals 9 green maize leaves These components of total feed supplies
are aggregated using the units of starch they contain as weights The total starch units in concentrates are given by
Qc= 049bull QfeI + 023 Qfe
+043 Qf0 + 081 Q +074 Qim 4
(Qfe4 - Qim4) + 06 - Q-5 +072
Qf6
The total starch units in green fodder roughshyage are given by
Qscr = 008 bull Qfe7 + 0145 SQfea+ 01 Qfe9
and the total supply of starch units is given by
Qst = QstC + Qstr
The results of the calculations of the
feed supply are given in Table 40
CalcuIation of Feed Subsidies The subsidi on feed mix is given by
S s (Pnt pP i t= - disi
where i equdls 1feed mix The data for QdiI come from the Principa Bank for Developshy
87
Table 40- Feed supply 1965-80
Major Feed Components Total Supply
Year Wheat
Bran Rice Bran Maize
Sqrghum and
Barley
Cottonshyseed Cake Berseem
Concen-trates
Fodder and Roughage Total
(1000 metric tons) (1000 starch units)
1965 1966 1967 1968 1969 1970 1971 1972 1973 1974 1975 1976 1977 1978 1979 1980
4069 2240 1976 1943 3859 4288 2853 4170 7273 7194 4848 5586 5969 7026 6815 7345
1139 1168 1269 1450 1633 1571 1500 1486 1344 1299 1327 1438 1340 1388 1485 1408
7875 9785 9470
10390 10736 11671 10673 12162 12934 15876 17778 21916 21181 28079 23903 29478
3113 3786 4215 5102 4964 5432 5805 5562 5596 5403 5483 5590 4891 5589 5267 5552
6303 5401 5251 5289 6513 6055 6192 6176 5758 5222 4375 4487 4994 5272 5326 6157
419756 433520 476741 487198 495817 490522 509751 516657 507663 512665 521397 522320 535593 536991 532987 522651
11629 11593 11103 11982 13534 14206 12753 14702 16512 18583 18670 22231 28082 28082 24740 29788
37453 38853 42041 43304 43601 43230 44810 45254 44457 45099 45898 46017 46626 47107 46788 45816
49081 50447 53148 55286 57135 57436 57563 59956 60969 63681 64568 68248 68708 75189 71528 75604
Sources These are calculated from data provided by the Egyptian Ministries of Agriculture and Supply and the
Central Agency fo Public Mobilization and Statistics
Note The calculated total supply deviates from the total requirements calculatedampin Table 39 because of differshyences in the estimation procedures for supply and requirements
ment and Agricultural Investment In cal- ponents of concentrates not included in the
culating Pint i the average composition of all feed mix were calculated using this equation
feed mix was assumed to eq-ial the composishytion for cattle Pint i was calculated using the S= (QfeI- a Qdlsl (Pinti- Pd i) formula
where i equals 2 cottonseed cake 3 wheat6 bran 4 rice bran and 5 maize and jequals
PintI = ajlPinti+Kl 1 cottonseed cake 2 wheat bran 3 rice bran and 4 maize It isassumed that the price
where j equals 1 cottonseed cake 2 wheat of minerals and molasses are free from disshybran 3 rice bran 4 maize 5molasses and tortion 6 minerals and where a is the time variant The subsidy of berseem is given by share of feed component j in the total feed mix The shares for 1965 and 1980 are listed
Si = Qfe int7 - Pfte)below as examples 1965 1980
055 028a1 030 030 where i equal 6 The international equivashy
a 2 010 004 lent price of berseem Pint 7 is derived from a 3 000 032 the international equivalent price of feed
a 4 mix (Pint1) and the domestic price of straw a5 002 003
(Pstraw) using the following relationship1 19003 003a6
The subsidies of the individual com- int7 = (Pntl + Pstraw) 010
=t9 Ingram and Moursi Treating Berseem as a Traded Good
88
Bibliography
Abdel-Khalek Gouda and Tignor Robert L eds The PoliticalEconomyofIncome Distributionin Egypt New York Holmes and Meier 1981
Abdel- Fadil Mahmoud Development IncomeDistributionandSocialChangein RuralEgypt(1952shy1970) Department of Applied Economis Occasional Paper No 45 Cambridge Camshybridge University Press 1975
Adams Richard Growth Without Development in Rural Egypt A Local-level Study of Instishytutional and Social Change PhD thesis University of California Berkeley 1981
Alderman Harold von Braun Joachim and Sakr Sakr Ahmed Egypt FoodSubsidy andRashytioning System A Description Research Report 34 Washington DC International Food Policy Research Institute 1982
Askari Hossein and Cummings John TAgriculturalSupply Response ASurvey ofthe Econometric Evidence New York Praeger Publishers 1976
Atkinson Anthony Band Stiglitz Joseph ELectureson PublicEconomics New York McGraw-Hill Book Co 1980
Badawy Ismail Deputy Minister of Economy Egypt Personal communications 1981-82
Bale Malcom Dand Lutz Ernst Price Distortions in Agriculture and their Effects An Intershynational Comparison AmericanJournalofAgricultural Economics 63 (January 1981) 8-22
Bar~hout Saad Undersecretary Ministry of Econo - Ministry of Planning Egypt Personal communications 1981-82
Baumgarten Klaus Zuckerwirtschaft in Agypten [Sugar Economy in Egypt] Zuckerindustrie 104 (September 1979) 854-859
Black and Vetch International Master Plan for the Development of Egyptian Storage and Disshytribution System for Food Grains Paper prepared for General Authority for Supply Commodities Cairo 1978
Braun Joachim von Agricultural Sector Analysis and Food Supply in Egypt Interim Report of the Joint Project of the Institute of Agricultural Economics University of Gbttingen and the Institute of National Planning Cairo February 1980 (mimeographed)
_ _ A Demand System for Egypt-Estimation Results and Scenario Analysis for Altershynative Food Price Policies Institute of Agricultural Economics University of Gbttingen December 1981 (mimeographed)
- Effects of Food Aid in Recipient Countries Egypt and Bangladesh a Comparative Study Economics(BiannualCollectionofRecent German Contributionsto the FieldofEcoshynomic Science) 26 (No 2 1982) 18-47
Braun Joachim von and Haen Hartwig de Egypt and the Enlargement of the EEC Impact on the AgAcultural Sector Food Policy 7 (February 1982) 46-56
Bruton Henry JIour Issues of Economic Policy in Egypt Economics Study Unit Ministry of Economy Foreign Trade and Economic Cooperation Cairo 1980 (mimeographed)
Cuddihy William AgriculturalPriceManagementin Egypt World Bank Staff Working Paper 388 Washington DC World Bank 1980
Currie J M Murphy J A and Schmitz AThe Concept of Economic Surplus and Its Use in Economic Analysis The Economic Journal81 (December 1971) 741-799
89
Davis 0 A Dempster M A H and Wildavsky A ATheory of the Budgetary Process American PoliticalScience Review 60 (September 1966) 529-547
de Janvry Alain Siam Gamal and Gad Osman Forced Deliveries Their Impact on the Marketed Surplus and the Distribution of Income in Egyptian Agriculture Economics Working P ner 38 Agricultural Development Systems Project Ministry of Agriculture Cairo and the University of California- Berkeley Cairo September 1981
Dethier J J and Esfahani M Macro-effects of Alternative Price Policies in Egypt Ecoshynomics Working Paper 188 Agricultural Development Systems Project Ministry of Agriculture Cairo and the University of California- Berkeley Cairo September 1981
Eckaus Richard S McCarthy F D and Mohie el- Din AMulti- Sector General Equilibrium Policy Models for Egypt Development Research and Technology Planning Centre Cairo University 1979 (mimeographed)
Eckaus Richard Sand Mohie el- Din AConsequences ofChanges in Food Subsidy Policies in Egypt Working Paper 265 Department of Economics Massachusetts Institute of Technology Cambridge Mass April 1980
Egypt Economic Conference Cairo February 13-15 1982 Various papers (In Arabic)
Egypt Central Agency for Public Mobilization and Statistics Annual Trade Statistics Cairo various years (mimeographed) (In Arabic)
_ Consumer Cost of Living Indexes for Rural and Urban Areas Cairo various years (mimeographed) (In Arabic)
- Family Budget Survey 195859 Cairo CAPMAS 1961
- Family Budget Survey 196465 Cairo CAPMAS 1972
Family Budget Survey 197475 Cairo CAPMAS 1978
Open Market Prices for Urban and Rural Areas 1965-1981 Cairo nd (mimeoshygraphed)
Populationand Development Cairo CAPMAS 1978
___StatisticalYearbook of Egypt Cairo CAPMAS 1980
Egypt Ministry of Agriculture Institute of Agricultural Economics Research and Statistics Production Statistics Cairo 1982 (mimeographed)
Egypt Ministry of Agriculture and the US Agency for International Development Strategies forAccelerating AgriculturalDevelopment Cairo Ministry of AgricultureUSAID 1982
Egypt Ministry of Economy Egypt Macroeconomic Performance Problems and Prospects Cairo 198i (mimeographed)
Egypt Ministry of Economy Foreign Trade and Economic Cooperation Policy Study on Pricing and Taxation of Major Alternative Agricultural Crops Cairo 1980 (mimeoshygraphed)
Egypt Ministry of Finance Statistics on Goverrnment Budget Cairo nd (mimeographed)
Egypt Ministry of Planning Statistics of Public Agricultural Investment 1965-1980 Cairo 1982 (mimeographed)
Egypt Ministry of Supply and Home Trade Statistics 3 Fixed Consumer Prices Government Distribution of Food Import Quantities and Cost Cairo nd (mimeographed)
90
_ Trade Statistics Cairo 1982 (mimeographed)
Egypt Principal Bank for Development and Agricultural Investment Storage and Marketing Divisions Unpublished materials
Egyptian Gazette June 14 1980 pp 1-2
Esfahani Hadi and Sarris Alexander H Agricultural Supply Response for the Main Crops in Egypt Economics Working Paper 35 Agricultural Development Systems Project Ministry of Agriculture Cairo and the University of California-Berkeley Cairo August 1981
Fitch James Band Aziz Afaf AMultiple Cropping Intensity in Egyptian Agriculture AStudy of its Determinants Research Paper 5 Microeconomic Study of the Egyptian Farm System Ministry of Agricultre Cairo October 1980
Fitch James B Gandi A and el-Gabely MThe Cropping System for Maize in Egypt Survey Findings and Implications for Policy and Research Paper presented to FAO workshyshop on Improved Farming Systems in the Nile Valley Cairo May 1979
Fitch James Band Soliman Ibrahim The Livestock Economy in Egypt An Appraisal of the Current Situation Cairo 1982 (mimeographed)
Frey Bruno S Politico-economic Models and Cycles Journalof Public Economics 9 (April 1978) 203-220
Ghaffar Ahmed Abdel First Undersecretary Ministry of Supply and Home Trade Egypt Personal communications 1981-82
Gotsch Carl Hand Dyer Wayne MRhetoric and Reason in the Egyptian New Lands Debate FoodResearch Institute Studies 18 (No 2 1982) 129-148
Goueli Ahmed Food Security Program in Egypt In FoodSecurity for Developing Countries pp 143-157 Edited by Alberto Vald~s Boulder Colo Westview Press 1981
Grosse- Rueschkamp Alois Optimal Planning of Feed Mix Indust ies in Egypt PhD thesis University of Bonn 1979 (In German)
Habashi Nabil T Fitch J B and Rehiwi SEgypts Agricultural Cropping Pattern AReview of the System by which it is Managed and its Relationship to Price Policy Research Paper 4 Microeconomic Study of the Egyptian Farm System Ministry of Agriculture Cairo November 1980
a
Hansen Bent and Nashashibi Karim ForeignTradeRpgimes andEconomicDevelopment Egypt New Yoyk National Bureau of Economic Research 1975
Hansen Bent and Radwan Samir Employment OpportunitiesandEquity in a ChangingEconomy Egypt in the 1980s Geneva international Labour Office 1982
Hassan Ahmed Cooperative Marketing and Compulsory Deliveries of Some Agricultural Crops Institute of National Planning Cairo 1982 (mimeographed)
el-Hindy Mohamed KFood Systems Development in Egypt Economics Working Paper 58 Agricultural Development Systems Project Ministry of Agriculture Cairo and the University of California- Berkeley Cairo December 1981
lkram Khalid Egypt Economic Managementin a Periodof Transition Baltimore Md Johns Hopkins University Press 1980
Imam Shawky and Fitch Jemes BWheat Farming System in Egypt Cairo 1978 (mimeoshygraphed)
91
Ingram J Cand Moursi T Treating Berseem as a Traded Good in the Calculation of Social Returns Economics Working Paper 18 Agricultural Development Systems Project Ministry of Agriculture Cairo and the University of California- Berkeley Cairo May 1981
International Food Policy Research Institute FoodNeeds of Developing Countries Projections of ProductionandConsumption to 1990 Research Report 3 Washington DC IFPRI 1977
International Labour OrganisationUnited Nations Development Programme Employment Opportunities and Equity in a Changing Economy Egypt in the 1980s Draft report of the ILOUNDP Employment Strategy Mission 1980 (mimeographed)
International Wheat Council International Wheat Agreement 1981 London International Wheat Council nd
Kutcher Gary PThe Agro- Economic Model Master Plan for Water Resources Development and Use Technical Report 16 Cairo May 1980 (mimeographed)
Lesourne J Cost-BenefitAnalysisand EconomicTheoryAmsterdam and Oxford Elsevier- North Holland 1975
Lutz Ernst and Scandizzo Pasquale L Price Distortions in Developing Countries A Bias
against Agriculture European Review ofAgricultural Economics 7 (No 1 1980) 5-27
Misr Dairy Company Unpublished data Cairo 1979
Mohie el-Din Yahya First Undersecretary Ministry of Agriculture Egypt Personal comshymunications 1981-82
Moustafa Rasmia Abdou D Gardener B0 and Green RAWelfare Analysis of Price Policy for Wheat and Wheat Products in Egypt Economics Working Paper 48 Agricultural Development Systems Project Ministry of Agriculture Cairo and the University of California-Berkeley Cairo 1981
Musgrave Richard A and Musgrave Peggy BPublicFinance in Theory and PracticeTokyo McGraw-Hill Kogakusha 1973
Nasr Mamdouh M Farmers Supply Response within the Egyptian System of Government Acreage Planning PhD thesis Institute of Agricultural Economics University of Gbttingen 1983 (In German)
Nassar Saad el-Amir M R and Moustafa A ADeterminants of Agricultural Price Policy in Egypt Economics Working Paper 50 Agricultural Development Systems Project Ministry of Agriculture Cairo and the University of California- Berkeley Cairo 1982
Newberg R R Fertilizer Subsector Assessment Egypt Multinational Agribusiness Systems Washington DC 1979 (mimeographed)
Pacific Consultants New Lands Productivity in Egypt Its Technical and Economic Feasibilshyity Washington DC 1980 (mimeographed)
Page John M Shadow Pricesfor Trade Strategy andInvestment Planningin Egypt World Bank
Staff Working Paper 521 Washington DC World Bank 1982
Picks Currency Yearbook various issues New York Franz Pick Publishing C3 various years
Radwan Samir and Lee Eddy The Anatomy of Rural Poverty Egypt 1977 World Employshyment Programme Geneva 1980 (mimeographed)
Richards Alan FgyptsAgriculturalDevelopment1800-1980 Technical andSocial Change Boulder Colo Westview Press 1982
92
Sarris Alexander H Food Security and Agricultural Production Strategies Under Risk in Egypt Working Paper 249 Division of Agricultural Sciences University of California Berkeley March 1983 (mimeographed)
Scobie Grant M Food Subsidies in Egypt TheirImpact on ForeignExchange andTrade Research Report 40 Washington DC International Food Policy Research Institute 1983
_ Government PoliciesandFoodImports The Caseof Wheat in Egypt Research Report 29 Washington DC International Food Policy Research Institute 1981
Soliman Ibrahim Red Meat Price Policy in Egypt Economics Working Paper 62 Agriculshytural Development Systems Project Ministry of Agriculture Cairo and the University of California- Berkeley Cairo 1982
Soliman lbrahim Fitch J B and Aziz N A The Role of Livestock Production on the Egyptian Farm Economics Working Paper 85 Agricultural Development SystemsProject Ministry of Agriculture Cairo and the University of California-Berkeley Cairo July 1982
Taylor Lance Food Suboidies in Egypt Department of Economics Massachusetts Institute of Technology Cambridge Mass October 1979 (mimeographed)
Waterbury John Hydropoliticsofthe Nile Valley Syracuse NY Syracuse University Press 1979
World Bank Arab Republic ofEgypt DomesticResourceMobilizationand GrowthProspectsforthe 1980s Report 3123EGT Washington DC World Bank 1980
_ Arab RepublicofEgypt EconomicManagementin a Period of TransitionVol6 Washingshyton DC World Bank 1978
World Food Programme Office Unpublished data Cairo 1982
Wally Youssef el-Kholei Osman Abbas Mohamad and Heady Earl 0 StrategyforAgriculshyruralDevelopment in the Eighties for theArab RepublicofEgypt International Development Series Report No 9 Ames Iowa Iowa State University 1982
Zaglui EASome Proposals to Reduce Agricultural Subsidies Ministry of Agriculture Paper6 Cairo 1979 (mimeographed)
93
Joachim von Braun has been a researcher at IFPRl since 1981 Hartwig de Haen is a professor of agricultural economics at the University of Gottingen in the Federal Republic of Germany
IFPRI RESEARCH REPORTS (continued)
15 FOOD PRODUCTION IN THE PEOPLES REPUBLIC OF CHINA May 1980 by Anthony M Tang and Bruce Stone
14 DEVELOPED-COUNTRY AGRICULTURAL POLICIES AND DEVELOPING-COUNTRY SUPPLIES THE CASE OF WHEAT March 1980 by Timothy Josling
13 THE IMPACT OF PUBLIC FOOD GRAIN DISTRIBUTION ON FOOD CONSUMPTION AND WELFARE IN SRI LANKA December 1979 by James O Gavan and Indrani Sri Chandrasekera
12 IVVO ANALYSES OF INDIAN FOOD GRAIN PRODUCTION AND CONSUMPTION DATA November 1979 by J S Sarma and Shyamai Roy and by P S George
II RAPID FOOD PRODUCTION GROWTH IN SELECTED DEVELOPING COUNTRIES A COMPARATlVE ANALYSIS OF UNDERLYING TRENDS 1961-76 October 1979 by Kenneth L Bachman and Leonardo A Paulino
10 INVESTMENT AND INPUT REQUIREMENTS FOR ACCELERATING FOOD PRODUCTION IN LOW-INCOME COUNTRIES BY I99Q September 1979 by Peter Oram Juan Zapata George Alibaruho and Shyamal Roy
9 BRAZILS MINIMUM PRICE POLICY AND THE AGRICULTURAL SECTOR OF NORTHEAST BRAZIL June 1979 by Roger Fox
8 FOODCRAIN SUPPLY DISTRIBUIION AND CONSUMPTION POLICIES WITHIN A DUAL PRICING MECHANISM A CASE STUDY OF BANGLADESH May 1979 by Raisuddin Ahmed
7 PUBLIC DISTRIBUTION OF FOOD GRAINS IN KERALA-INCOME DISTRIBUTION IMPLICATIONS AND EFFECTIVENESS March 1979 by P S George
6 INTERSECTORAL FACTOR MOBILITY AND AGRICULTURAL GROWTH February 1979 by Yair Mundlak
5 IMPACT OF SUBSIDIZED RICE ON FOOD CONSUMPTION AND NUTRITION IN KERALA January 1979 by Shubh K Kumar
4 FOOD SECURITY AN INSURANCE APPROACH September 1978 by Panos Konandreas Barbara Huddleston and Virabongsa Ramangkura
3 FOOD NEEDS OF DEVELOPING COUNTRIES PROJECTIONS OF PRODUCTION AND CONSUMPTONTD 990 December 1977
2 RECENT AND PROSPECTIVE DEVELOPMENTS IN FOOD CONSUMPTION SOME POLICY ISSUES July 1977
MEETING FOOD NEEDS IN THE DEVELOPING WORLD LOCATION AND MAGNITUDE OF THE TASK IN THE NEXT DECADE February 1976
IFPRI RESEARCH REPORTS
41 RURAL GROWTH LINKAGES HOUSEHOLD EXPENDITURE PATTERNS IN MAL4YSIA AND NIGERIA Sepshytember 1983 by Peter B R Hazell and Ailsa Roell
40 FOOD SUBSIDIES IN EGYPT THEIR IMPACT ON FOREIGN EXCHANGE AND TRADE August 1983 by Grant M Scobie
39 THE WORLD RICE MARKET STRUCTURE CONDUCT AND PERFORMANCE June 1983 by Ammar Siamwalla and Stephen Haykin
38 POLICY MODELING OF A DUAL GRAIN MARKET THE CASE OF WHEAT IN INDIA May 19B3 by Raj Krishna and Ajay Chhibber
37 SERVICE PROVISION AND RURAL DEVELOPMENT IN INDIAA STUDYOF MIRYALGUDA TALUKA February 1983 by SudhiT Wanmali
36 AGRJCULTURE AND ECONOMIC GROWTH IN AN OPEN ECONOMY THE CASE OF ARGENTINA December 1982 by Domingo Cavallo and Yair Mundlak
35 POLICY OPTIONS FOR THE GRAIN ECONOMY OF THE EUROPEAN COMMUNITY IMPLICATIONS FOR DEVELOPING COUNTRIES November 1982 by ulrich Koester
34 EGYPTS FOOD SUBSIDY AND RATIONING SYSTEM A DESCRIPTION October 1982 by Harold Alderman Joachim von Braun and Sakr Ahmed Sakr
33 AGRICULTURAL GROWTH AND INDUSTRIAL PERFORMANCE IN INDIA October 1982 by C Rangarajan 32 FOOD CONSUMPTION PARAMETERS FOR BRAZIL AND THEIR APPLICATION TO FOOD POLlCy September
1982 by Cheryl Williamson Gray
31 SUSTAINING RAPID GROWTH IN INDIAS FERTILIZER CONSUMPTION A PERSPECTIVE BASED ON COMshyPOSITION OF USE August 1982 by Gunvant M Desai
30 INSTABILITY IN INDIAN FOOD GRAIN PRODUCTION May 1982 by Peter B R Hazell
29 GOVERNMENT POLlCY AND FOOD IMPORTS THE CASE OF WHEAT IN EGYPT December 1981 by Grant M Scobie
28 GROWm AND EQUITY POLICIES AND IMPLEMENTATION IN INDIAN AGRICULTURE November 1981 by J S Sarma
27 AGRICULTURAL PRICE POLICIES UNDER COMPLEX SOCIOECONOMIC AND NATURAL CONSTRAINTS THE CASE OF BANGLADESH October 1981 by Raisuddin Ahmed
26 FOOD SECURITY IN THE SAHEL VARIABLE IMPORT LEVY GRAIN RESERVES AND FOREIGN EXCHANGE ASSISTANCE September 1981 by John McIntire
25 INSTABILITY IN INDIAN AGRICULTURE IN THE CONTEXT OF THE NEW TECHNOLOGY July 1981 by Shakuntla Mehra
24 THE EFFECTS OF EXCHANGE RATES AND COMMERCIAL POLICY ON AGRICULTURAL INCENTIVES IN COLOMBIA 1953middot1978 June 1981 by Jorge Garda Garda
23 GOVERNMENT EXPENDITURES ON AGRICULTURE IN LATIN AMERICA May 1981 by Victor J Elias
22 ESTIMATES OF SOVIET GRAIN IMPORTS IN 1980-85 ALTERNATIVE APPROACHES February 1981 by Padma Desai
21 AGRICULTURAL PROTECTION IN OECD COUNTRIES ITS cosito LESS-DEVELOPED COUNTRIES December 1980 by Alberto Valdes and Joachim Zietz
20 IMPACT OF IRRIGATION AND LABOR AVAILABILITY ON MULTIPLE CROPPING A CASE STUDY OF INDIA November 1980 by Dharm Narain and Shyamal Roy
19 A COMPARATIVE STUDY OF FAOAND USDA DATA ON PRODUCTION AREA AND TRADE OF MAJOR FOOD STAPLES October 1980 by Leonardo A Paulino and Shen Sheng Tseng
18 THE ECONOMICS OF THE INTERNATIONAL STOCKHOLDING OF WHEA[ September 1980 by Daniel T Morrow
17 AGRICULTURAL RESEARCH POLICY IN NIGERIA August 1980 by Francis Sulemanu Idachaba
16 A REVIEW OF CHINESE AGRICULTURAL STATISTICS 1949-79 July 1980 by Bruce Stone
(continued on inside bach cover)