the effects of federal transit subsidy policy on investment decisions… · · 2012-10-17the...
TRANSCRIPT
The Effects of Federal Transit Subsidy Policy on Investment Decisions: The Case of San Francisco's Geary Corridor
By
Jianling Li Assistant Professor
School of Urban & Public Affairs University of Texas at Arlington
and
Martin Wachs
Director, Institute of Transportation Studies Professor City & Regional Planning and Carlson Distinguished Professor of Civil and
Environmental Engineering University of California, Berkeley
Revised for Publication in Transportation
July 19, 2003

Abstract
In the United States, federal funding for public transit often accounts for a large proportion of a
local agency’s budget, especially for capital investments. For this reason, local governments can
be expected to plan a portfolio of projects that maximize federal contributions. This study
examines the financial effects of federal transit subsidy policy on local transit investment
decisions. Data from a System Planning Study for the Geary Corridor in San Francisco are used
as an illustration. It is found that federal transit subsidy policy provides financial incentives for
local decision-makers to select capital-intensive investment options that may not be efficient or
effective. While federal financial incentives are not the only factor influencing local investment
decisions, some reform of the current subsidy policy may be necessary to reduce the incentive
for ineffective use of public resources.

1
Introduction
Since the 1960s, the U.S. government has provided financial support for public transit
and stipulated conditions governing the allocation of subsidies from other levels of government.
Along with many other contributing factors, federal subsidy policies have played an important
role in shaping local transit investment decisions even as federal subsidies have gradually
decreased as a proportion of public support for transit projects. How does federal transit subsidy
policy influence new transit service investment decisions by local governments? This question
has been raised frequently but rarely has it been addressed empirically.
Over the past two decades, research on federal transit subsidy policies has largely focused
on the effects of policy on transit cost and productivity.1 Some researchers (e.g. Barnum and
Gleason, 1979) found that a higher level of subsidy is associated with a higher level of
effectiveness and that subsidies helped reverse declines in transit service and ridership. Most,
however, have concluded that federal subsidy policy has encouraged service expansion and
lower fares while inducing higher operating costs and lower labor productivity (Pucher, et al.,
1983; Pucher and Markstedt, 1983; Cervero, 1984a, 1984b; Pickrell, 1986; Wachs, 1989; Li,
1992; Moore, 1993; Obeng, et al., 1995). Some studies further suggest that federal transit
subsidy policy, which has a long history of favoring capital over operating subsidies, may have
induced early retirement of bus fleets and encouraged investments in capital intensive but
inefficient transit services (Hilton, 1974; Gomez-Ibanez, 1985; Frankena, 1987; Wachs, 1989;
Cromwell, 1989; Kain, 1988, 1990; Pickrell, 1992; Obeng and Azam, 1995). However, little
1 Research related to this subject also examines the impacts of transit investments on land use, air quality, and travel behavior. For more information on effects of transit investments, see Cervero (1994), Cervero and Landis (1997), among many others.
1
research has empirically documented how federal subsidy policy affects local investment
decisions on new transit services and whether it leads to the selection of inefficient and
ineffective alternatives for new transit services. Research on these questions is timely as the
“reauthorization” of the Transportation Equity Act for the 21st Century (TEA-21), which was
passed in 1998, is being considered now.
This paper explores the possible effects of federal transit subsidy policy on local transit
investment decisions. We argue that several factors, including the need to balance political
interests, the financial constraints of local governments, the division of financial responsibilities
among governments at various levels, and the distinctive characteristics of the American political
system, have motivated local decision-makers to weigh heavily the financial incentives provided
by federal transit subsidy policy. Because federal transit subsidy policy favors capital over
operating subsidies, it may encourage a preference for capital-intensive transit investments.
However, a capital-intensive transit investment may not be the most efficient and effective
option.
In the following sections, we first discuss the importance of federal subsidies in local
investment decision-making. Following the discussion, we illustrate the potential effects of
federal transit subsidy policy using data from the Geary Corridor System Planning Study
(GCSPS) in San Francisco. The final section summarizes findings and their implications.
While limited, a case study is appropriate given the absence of systematic data on local
transit investment decisions in the U.S. and variations in policy effects due to different locational
factors. The case study can provide some evidence on the possible effects of federal transit
subsidy policy and shed light on the mechanisms through which federal subsidy policy
influences local transit investment decisions.

2
The importance of federal financial subsidies in local decision-making
Federal policies can influence local transit investment decisions by providing financial
incentives or disincentives for transit investments since financial considerations are important
when making local transit investment decisions. The importance of federal financial factors in
local decision-making can be examined by analyzing the nature of transportation
decision-making in the U.S. and the distinct structure of federal transit subsidy programs.
Numerous studies have demonstrated that the transportation planning and
decision-making process in the U.S. is pluralistic, resource allocative, consensus-seeking,
problem-simplifying, and uncertainty-avoiding (Meyer and Miller, 1984). In the case of transit
investment decisions, the goals of proposed investments and alternatives are identified through a
planning process in which policymakers, planners, and stakeholders interact, and the final
investment decision is made on the basis of consensus among the parties involved in the process.
Such a transit investment decision-making process is inherently political and extremely
complicated. It involves many stakeholders with dramatically different visions and conflicting
interests. The selection of alternatives to be considered, the assumptions and analytical methods
to be used in the evaluations, the criteria chosen for comparisons of transit investment options,
and the final investment decisions are all reflections of political power and products of complex
political interactions aiming to achieve consensus among diverse interest groups (Wachs, 1995).
Because of the nature of such a decision-making process, politics plays a key role in
shaping transit investment decisions. Several political factors create pressures and motivate
local government decision-makers to make financial considerations an important criterion in
making transit investment decisions. Such factors include the needs for balancing the interests
of different groups and political constituencies and for accomplishing policy goals, the division

3
of financial responsibility between the federal and local governments, local financial constraints,
and political motivations.
The Needs for Balancing Political Interests and Fulfilling Federal Requirements
Many communities often have conflicting interests when it comes to transit investment
decisions. A classic example of conflict is the spatial distribution of the benefits and costs of
transit services. Too often, communities that most need transit are in central cities, while most
revenues for supporting transit services are raised from suburban communities. Transit
investment decisions must consider such a conflict and balance the demand and interest of inner
cities and suburban communities. Besides the mismatch between transit demand and resources
for providing the services, each community may have different preferences for public
transportation. This is evidenced from the results of a survey of voters in Arlington, Texas, in
2001, with regard to their preferences for types of transit services. Residents in the northern
areas of the city near commuter rail service to Dallas and Fort Worth preferred transit services
connecting to the rail line, people in the southern areas tended to favor bus services connecting
to park-and-ride facilities near highways, and others preferred bus services connecting
neighborhoods with major activity centers in Arlington (Cole & Li, 2001).
In addition to preferences and needs, there are different priorities among different
community groups. Transit must compete with other public services for limited city budgets,
including street repair and maintenance, police, schools, museums, parks, etc. For example, in
the case of a tax election in the City of Arlington, transit supporters perceived transit services as
an urgent need for the city, while opponents considered street repair a more urgent priority
(Rushing, 2002).

4
Moreover, many cities have to meet a growing list of government mandates, such as
requirements to provide costly services under the Americans with Disabilities Act (ADA) and
the Clean Air Act Amendments (CAAA). In order to balance the interests of various groups and
communities and to fulfill requirements of federal mandates, local governments must always
look for financial resources. Hence, financial considerations become key factors in transit
investment decisions.
Division of Financial Responsibility
The division of financial responsibility between the federal and local governments and
the difficulty of local governments in raising money for transit services also make external
financial resources attractive. Transit services in the U.S. have long been provided by local
governments with financial support from the federal and state governments. Historically, local
governments have been mainly responsible for financing transit operations while the federal
government has assisted with capital costs. This can be seen from the history of federal
subsidies since the 1960s. For example, the federal government did not provide any operating
assistance until 1975 and has gradually withdrawn its support for transit operations since the
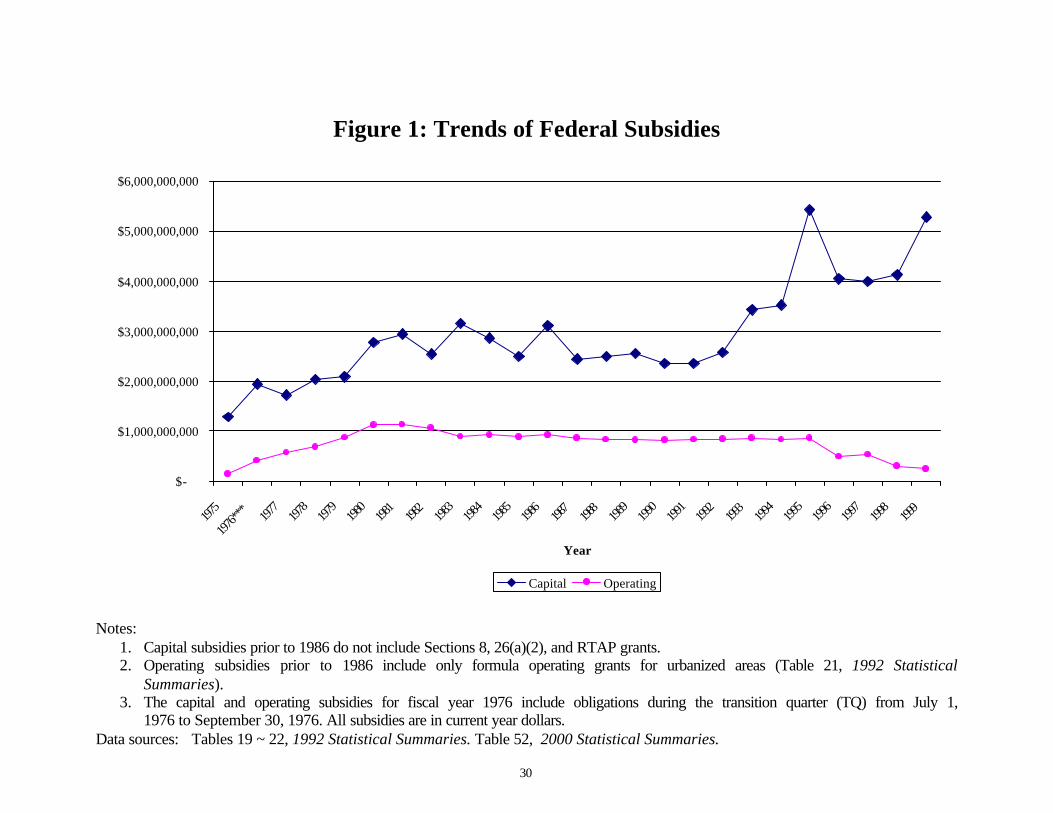
1980s. On the other hand, federal capital assistance has risen to more than 90% of federal transit
expenditures (Figure 1).
[Figure 1 about here]
The declining importance of federal subsidies in transit operation is shown in Table 1.
Over the years, the level of available resources for local transit operations from the federal
government has been shrinking, making transit operation ever more dependent upon state and
local subsidies.
[Table 1 about here]

5
Local Financial Constraints
Although local governments have responded to declining federal support for transit
operation with locally enacted dedicated tax sources, their ability to raise money is not unlimited.
Local taxes often require approval by voters. While certain tax-based propositions have been
popular, some cities and counties have difficulty raising or retaining taxes for transit projects
(Goldman and Wachs, 2001). For example, voters in Kansas City rejected a tax-based
proposition that would have extended two existing one-half percent sales taxes from January 1,
2001 through December 31, 2015 that would have been used for light rail construction and
operation and for other transportation infrastructure. Similar rejections have occurred in
Sonoma County, California; San Antonio, Texas; Chandler County, Arizona; and Miami-Dade
County, Florida in recent years (Center for Transportation Excellence, 1994~2000). Voters in
the City of Arlington, Texas, have rejected several tax increases for public transit over the past
twenty years, making the city well known as the largest city without public transit in the U.S.2
Besides the difficulty of raising taxes for transit operations, some approved measures
have faced challenges. For example, Proposition C, a half-cent sales tax for transportation
programs was challenged in court after it was approved by Los Angeles County voters in 1990
on the basis of claims that the measure did not comply with Proposition 13, which requires two-
thirds of the voters to support a special-purpose tax increase (Hager and Stein, 1992). Los
Angeles County voters also passed a measure in 1998 to bar the use of local sales tax revenues to
expand the local subway program (Center for Transportation Excellence, 1998). These examples
all demonstrate that financial constraints frequently dominate transit investment decisions. The
2 For list of transit tax elections before 1994, see “Urban Mass Transportation Planning” by Alan Black (1995).

6
problems of financial constraints and equitable allocation of resources exert strong pressures on
local decision-makers to seek external financial resources.
Political Motivations
The American political system also motivates local decision makers to make financial
considerations a central criterion. The federal resources brought into local jurisdictions and
miles of track built are often used as performance measures by politicians seeking election or by
the media evaluating candidates. For example, in responding to the question: “how would you
pay for new mass transit expansion projects” by radio station WAMU3, Terry Lierman, a
candidate running for the 8th Congressional District seat in Maryland in the 2000 Election
responded that he would “take the lead to ensure that Montgomery County's traffic problems get
the attention in the transportation appropriation bill and funding that is long over due” (WAMU,
2000). Similarly, in a newspaper article discussing his nomination for the position of U.S.
Secretary of Transportation by President Bush in January 2001, Norman Mineta was credited
with helping win federal funding for Santa Clara County’s light-rail system and other projects
(Cabanatuan, 2001). Because of the nature of political competition, the desire to maximize
financial support from the federal government is rational and not unique to transportation.
3 WAMU is a public radio station for National Public Radio (NPR) news and information in the greater Washington D.C. area.
In summary, balancing various interests, local financial constraints, the division of
financial responsibility among several levels of government, and other aspects of the American
political system put pressure on local decision-makers to maximize the receipt of external funds
through the decision-making process. Because of financial need, political goals, and the

7
availability of significant external funding from the federal government, the incentive or
disincentive provided by federal transit subsidy policy could have significant influence in
shaping local investment decisions.
Case study of the Effects of Federal Transit Subsidy Policy
To what extent does federal transit subsidy under TEA-21 influence local decision-
makers to choose one transit alternative over another? How do our hypothesized factors play out
in reality? Would federal transit policy prompt the selection of less efficient and effective
alternatives? The remainder of the paper explores these questions using the Geary Corridor as
an example. The Geary Corridor is used because it is both unique and representative. On the
one hand, it is one of the most heavily used transit corridors in the U.S. On the other hand,
because the GCSPS consists of many common components of a typical planning process such as
the involvement of stakeholders and the public in setting goals and scoring alternatives, this
corridor is also quite representative of the corridor planning process.
In the following, we first describe the GCSPS, analyze political interests involved in the
process of forming project objectives, and explore financial constraints facing Muni and city
political leaders at the time the study was conducted. We then present the major structure of
transit programs under TEA-21 and illustrate the financial responsibilities of the federal and
local governments given the provisions of TEA-21. Finally we compare the efficiency and
effectiveness of transit investment options to assess the effects of TEA-21 on local investment
decision-making.
The Geary Corridor System Planning Study
The GCSPS was completed by Merrill and Associates in 1995 after the corridor was

8
identified by the San Francisco Municipal Railway (Muni) in 1993 as one of four rail corridors4
for major improvements. Like many corridor studies, the planning process for the Geary
Corridor included such steps as forming planning goals and objectives, developing transit
alternatives, evaluating alternatives, and making recommendations. A main
4 The four corridors are the Bayshore, Geary, North Beach, and Van Ness (Muni, 1995). Bayshore Corridor was identified as the first priority corridor. A light rail alternative was selected as the “Locally Proferred Alternative” for the Bayshore Corridor in 1998. Muni is currently constructing the light rail line, which has been renamed the Third Street Light Rail Project (Muni, 2001). Geary Corridor was named as the next highest priority corridor for “fixed guideway” transit improvements.
component in the process of forming planning goals and objectives was a public participation
program that involved all groups in the corridor. Working with Muni Service Planning staff, the
consultant team involved Geary Corridor stakeholders in the public participation process. Some
examples of stakeholders were the Geary Sub-committee of the Citizen’s Advisory Committee
of the San Francisco County Transportation Authority, transit service providers such as the Bay
Area Rapid Transit (BART) District and community groups including Asian and African
American communities in the corridor and business groups such as the Geary Merchant
Association, the Golden Gate Democratic League, etc. Through a series of outreach activities,
including public and special meetings, newsletters, surveys, transit tours, and telephone and fax
input hotlines, the consulting team was able to develop a set of goals and objectives that
reflected the interests of stakeholders. Among the goals and objectives, reducing travel time
along the corridor and enhancing equity in access to transportation reflected the interests of
transit users and various communities, especially ethnic communities, people with

9
socioeconomic disadvantages and the mobility impaired. Other goals and objectives, such as
providing access to the central business district and to areas where business activities were vital,
revealed the interests of businesses likely to be served by the transit services. The goals and
objectives also included the views and interests of environmental groups, transit service
providers, and planning communities. In addition, financial objectives were emphasized, in
particular to minimize construction cost and to match proposals with available funds.
Such financial concerns were expected, given the financial constraints that Muni faced
then. This is evident from a report by city budget analyst Harvey Rose in 1995. According to
Rose, Muni faces an annual operating budget deficit of $66 million by 2006, assuming that fares
will not rise and that general fund contributions increase at an annual rate of 3.5 percent. Rose
suggested two basic approaches to reducing deficits: raising transit fares and finding new sources
of money. Predictably, both approaches were troublesome. As pointed out by Rose, any
financial bailouts face serious political obstacles. Increasing fares would be difficult, given the
fact that fares had been raised not too long before. Other financial options, such as introducing a
sales tax, special transit tax, private vehicle tax increase, and property tax, were suggested.
However, a citywide transit tax would likely encounter political resistance. For example, in a
report to the Chamber of Commerce, San Francisco transit consultant Richard Swanson
suggested a citywide transit tax to address Muni’s financial deficits. However, the proposal
received a cool greeting from then-Mayor Frank Jordan and business interests. Proposals to tax
downtown businesses for Muni support in 1994 also died in the face of public hostility.
Proposals to raise the sales tax, impose vehicle license and registration surcharges, increase Bay
Bridge tolls, impose a county or regional gas tax, or dedicate funds that the airport might owe the
city also faced certain opposition from the affected communities (Dietz, 1995). With such
10
financial constraints, it was not surprising that city decision-makers sought external funds to
support their various proposals.
Based on the established goals, objectives, and inputs from the public participation
program, the consultant team reduced the original thirty-one potential alternatives to seven for
evaluation. The seven alternatives consisted of one Transportation Systems Management (TSM)
alternative, two subway-surface light rail alternatives (2A & 2B), three subway-surface electric
trolley bus alternatives (3A, 3B & 3C), and an all-surface light rail alternative (4). The TSM
alternative retained existing transit services with minor modifications, including the replacement
of existing articulated diesel buses with low floor diesel buses and the conversion of existing
traffic signals to demand-activated devices at some locations in the corridor. The two
subway-surface light rail alternatives replaced existing diesel bus services on Geary Boulevard
with partial subway light rail service. Alternative 3A included dual mode buses operated on the
surface and in underground tunnels in the corridor. Alternatives 3B and 3C included low floor
articulated electric trolley buses operated in the corridor through different lengths of subway.
Alternative 4 was a light rail system in which trains travel on a surface median between 39th
Avenue and Gough Street, and in mixed flow or semi-exclusive lanes on the rest of the line. All
six non-TSM alternatives also included improvements that were part of the TSM alternative.
The system planning study recommended advancing all alternatives but one, 3A, into the
Major Investment Study phase of the federal implementation and funding process (Merrill &
Associates, 1995). The six alternatives were regrouped into four in the final recommendation:
the TSM alternative, a surface/subway light rail alternative including two options (2A and 2B), a
surface/subway electric trolley bus alternative with two options (3B and 3C), and the all surface
11
light rail alternative (#4).5 Recognizing the financial limitations and the steep competition for
federal and state transportation funding, Muni’s governing board at the time, the Public
Transportation Commission (PTC), accepted the report and elected not to move forward until a
viable financial plan could be developed.
While the PTC did not select a preferred mode and alignment at the time, “Muni
envisions a surface/subway LRT line serving this (Geary) corridor,” as indicated in a newly
released document entitled “A Vision for Rapid Transit in San Francisco” (Muni, 2002).
Provisions of TEA-21
What would be the financial responsibilities of the City of San Francisco and the federal
government under TEA-21 for the surface/subway options, as compared to other options? To
answer this question, one must understand the distinctive structure of the federal transit subsidies
under TEA-21. TEA-21 provides $36 billion of guaranteed funding for transit programs over the
six-year period that started in 1998. Under this law, transit funding is distributed among various
programs. Each program has requirements for eligible uses and allocation criteria. Major
assistance programs for traditional transit services include the urbanized and non-urbanized area
formula programs (Section 5307 and Section 5311) and the capital investment program (Section
5309). Funding for these three programs accounts for about 94 percent of the total guaranteed
funds. Formula funds are non-competitive and allocated to urbanized and non-urbanized areas
on the basis of factors such as population, population density, bus miles, rail miles, passenger
miles, etc.6 The funds can be used for planning, engineering, and design of transit projects,
5 According to the San Francisco Countywide Transportation Plan (CTP) draft report, only three non-TSM alternatives were recommended in a system level study by Muni (SFCTA, 2001). 6 An urbanized area is an incorporated area with a population of 50,000 or more, as designated by the U.S. Department of Commerce, Bureau of the Census.

12
transit capital investment and operating assistance. TEA-21 eliminates operating subsidies for
areas with populations over 200,000, but also revises the definition of "capital project" to include
a wider range of projects eligible for federal transit formula funds. For example, some of the
former operating expenses, such as preventive maintenance, are redefined as capital expenses.
Federal capital subsidy may cover as much as 80 percent of a project’s capital cost. The
maximum federal share for transit operating assistance is 50 percent of the net operating cost (U.
S. Department of Transportation, 1998, 2000a).
The capital investment program provides assistance for three primary activities: new and
replacement buses and facilities, modernization of existing rail systems, and new fixed guideway
systems. Like the Inter-Modal Surface Transportation Efficiency Act (ISTEA) of 1991, funds
under the capital investment program were divided into 20 percent for bus and bus-related
activities, 40 percent for fixed guideway modernization, and 40 percent for new fixed guideway
systems or extensions to existing fixed guideway systems. The federal share for these activities
can be up to 80 percent. Funds are allocated on a discretionary basis except for fixed guideway
modernization activities, for which funds are allocated by a statutory formula to urbanized areas
with rail systems that have been in operation for at least seven years. Although there is a fixed
amount apportioned to the capital investment program each year, there is no limit to the number
of projects that a state or local government can apply for, or to the maximum amount that a
project can request.
One feature of TEA-21 is that the competition for funding under this program is
extremely political, as most of the money is designated by Congress for specific projects.
Therefore, in order to be competitive, applicants must have the support of congressional
delegates from their local jurisdictions. Without such support, it is almost impossible to get

13
funding under this program, even when a community has successfully completed the required
steps in the major capital investment planning and project development process and been
recommended by the Federal Transit Administration (FTA) to the Congress. This funding
allocation process and the distinctive structure of the federal funding policy both open up
opportunities for and encourage local governments to compete for federal assistance for new
transit investments.
Financial Shares Under TEA-21
Based on the provisions of TEA-21, we analyze the financial responsibilities of
governments for the six alternatives to explore whether the federal transit subsidy policies do
provide financial incentives for local governments to invest in more expensive alternatives. To
do so, we estimated the annual operating costs of the alternatives, annualized their capital costs,
and applied the federal subsidy policies to derive the financial shares of the federal and local
governments.
To estimate the annual operating costs of the alternatives, we developed three cost
estimation models using a cost allocation method and operating cost and service statistics
obtained from Muni's data in the National Transit Database Reporting System (Muni, 1994).
The cost allocation model is widely used in transit planning practice. The key assumption of the
model is that each operating cost item can be assigned or allocated to a specific operating
statistic. The basic form of the model is that the cost of a route or a service equals the sum of a
few unit costs of service statistics times the corresponding quantities of those statistics, such as
vehicle miles or hours, or peak vehicles. This can be expressed in equation (1):
N Estimated Operating Cost = Σ ui * Xi (1) i=1

14
where
i = a particular measurable service characteristic which represents the scale of
operations;
N = number of service characteristics included in the model;
Xi = quantity or value of characteristic i in the analysis;
ui = unit cost of characteristic i;
To derive the unit costs of service data, we first assigned the operating cost items
reported in the database to relevant service measures for each mode, summed up the costs in
each category, and divided the costs by the service measurements. That is:
n Σ Cj (TCi) j=1 (2) ui = --- = ------ Xi Xi
where:
TCi = the total operating cost associated with service characteristic i;
j = a particular class of function and expense object, such as labor for vehicle maintenance,
or materials and supplies for vehicle maintenance, etc.;
Cj = cost of j, such as cost of labor for vehicle maintenance, or cost of materials and
supplies for vehicle maintenance, etc. These costs are associated with a service
characteristic i, which is revenue vehicle miles or hours in this particular example.
n = number of class of functions and expense objects associated with a particular service
characteristic i.
By using the cost allocation method and Muni’s data, three models were developed:

15
Motor Bus: OC = 2.45 * RVM + 40.64 * RVH + 76923.97 PV (3)
Trolley Bus: OC = 2.04 * RVM + 41.87 * RVH + 63473.21 PV (4)
Light Rail: OC = 4.90 * RCM + 69.37 * RCH + 121544.32 * PV
+ 376023.71 * ST + 114899.35 * RM (5)
Where OC is annual operating cost, RVM stands for annual revenue vehicle miles, RVH
represents annual revenue vehicle hours, RCM is annual revenue car miles, RCH is annual
revenue car hours, PV represents maximum number vehicles in operation during the peak hour
period, ST stands for number of subway stations, and RM denotes route miles.
Table 2 shows estimates of service input, output, and consumption for each alternative by
the GCSPS. In addition, the GCSPS also provides design components such as rail stations and
route miles for each alternative. Based the GCSPS data, we were able to derive the annual
operating costs of the alternatives.
[Table 2 About Here]
The annual capital cost estimates of the alternatives were calculated based on the detailed
capital components of each alternative, and their costs and economic lives provided by the
GCSPS.7 A 7 percent discount rate was used in the calculation. The annual capital cost
estimates were also adjusted to FY 1994 constant dollars.
In addition, we assumed that the preventive maintenance costs for motor bus, trolley bus,
and light rail would be 28, 25, and 42 percent of their annual operating costs, respectively.
These percentages were derived from Muni's 1994 National Transportation Database Report.
The 1994 Report also indicates that the state subsidy accounted for about 10 percent of the total
7 See Tables 5A ~ 5G in GCSPS.
16
operating revenue. Since the state's contribution is relatively small, we included the state
subsidy with local costs in order to focus on the effects of federal subsidy policy.
Based on these estimates, we calculated the financial shares of the federal and local
governments for each alternative. As described before, the maximum federal share of cost is 80
percent of a project’s capital and preventive maintenance costs. The rest is the responsibilities of
state and local governments. The results are shown in Table 3. As one can see from the table,
the federal share of annual total cost would be about 66 ~ 69 percent, or $52 ~ $68 million, for
the surface/subway light rail options. The federal shares range between 61 ~ 65 percent, or $36
~ $49 million for the trolley bus alternatives and 60 percent, or $32 million for the surface light
rail alternative. The federal financial share of the annual total cost would only be 35 percent or
$7 million for the TSM alternative. These numbers indicate that the surface/subway light rail
alternatives would generate the most financial support from the federal government both in terms
of absolute amount and percentage of total annual costs. Although the surface/subway light rail
alternatives also require the highest amount of state and local matches among all the options, the
increase in such matches (that is the difference in local matches between the surface/subway
light rail alternatives and other options) is far less than the increase in federal subsidy. In
addition, the increase in state and local matches required for capital intensive-investments is
often justified by local economic benefits such as jobs created by rail capital investment and
other multiplier effects of large transit investment. This makes the surface/subway light rail
alternatives more attractive than other options.
[Table 3 About Here]

17
Performance Comparison of Transit Alternatives
How good would the surface/subway light rail alternatives be as compared to other
options? Would they still be the preferred choices of Muni in the absence of federal financial
incentives? To answer this question, it is necessary to compare the efficiency and effectiveness
of the alternatives and evaluate them based on the objectives of transit investment. The
efficiency and effectiveness of the alternatives can be compared using inter-modal performance
indicators.
Inter-modal performance indicators are a set of standardized indicators that measure the
efficiency and effectiveness of all transit modes (Lem, Li, and Wachs, 1994). Inter-modal
performance indicators incorporate the principles of life cycle costing and the variation of
vehicle capacity among transit modes. With inter-modal performance indicators, service input is
measured by total costs including capital and operating costs. Service output is measured by
revenue vehicle capacity miles and hours, which is equal to the products of revenue vehicle
miles or hours and the vehicle capacities (seats and standees) of the transit modes. Service
consumption is measured both by unlinked passenger trips and passenger miles. Each
performance indicator is calculated as a ratio between two measures of service input, output, or
consumption.
In this study, seating capacities were assumed to be 56 for an articulated bus or a trolley
bus, and 68 for a rail car. Total capacity of vehicles was assumed to be 150 percent of the
seating capacities for bus and trolley, and 300 percent of the seating capacity for rail. Based on
the characteristics of service design and estimated patronage provided by the GCSPS, as well as
these vehicle capacity assumptions, we calculated annual service outputs, which incorporate the
variations of vehicle capacities of different modes, and service consumptions of the proposed

18
alternatives in addition to the annual capital and operating cost estimates described in the above
section. Furthermore, we incorporated time savings of the alternatives provided by the GCSPS
into the calculations of performance indicators. Specifically, total annual costs of the
alternatives were adjusted by their values of time savings.8
Figures 2 to 4 show the performance indicators for the six options. As seen from the
Figures, the surface/subway light rail options are neither the most cost efficient nor the most
effective options. In terms of cost efficiency, which is measured by total annual cost per revenue
vehicle capacity mile ($/RVCM) and total annual cost per revenue vehicle capacity hour
($/RVCH), the TSM option would be most cost efficient, followed by the all surface light rail
alternative (alternative #4). The trolley bus alternatives would be the least cost efficient among
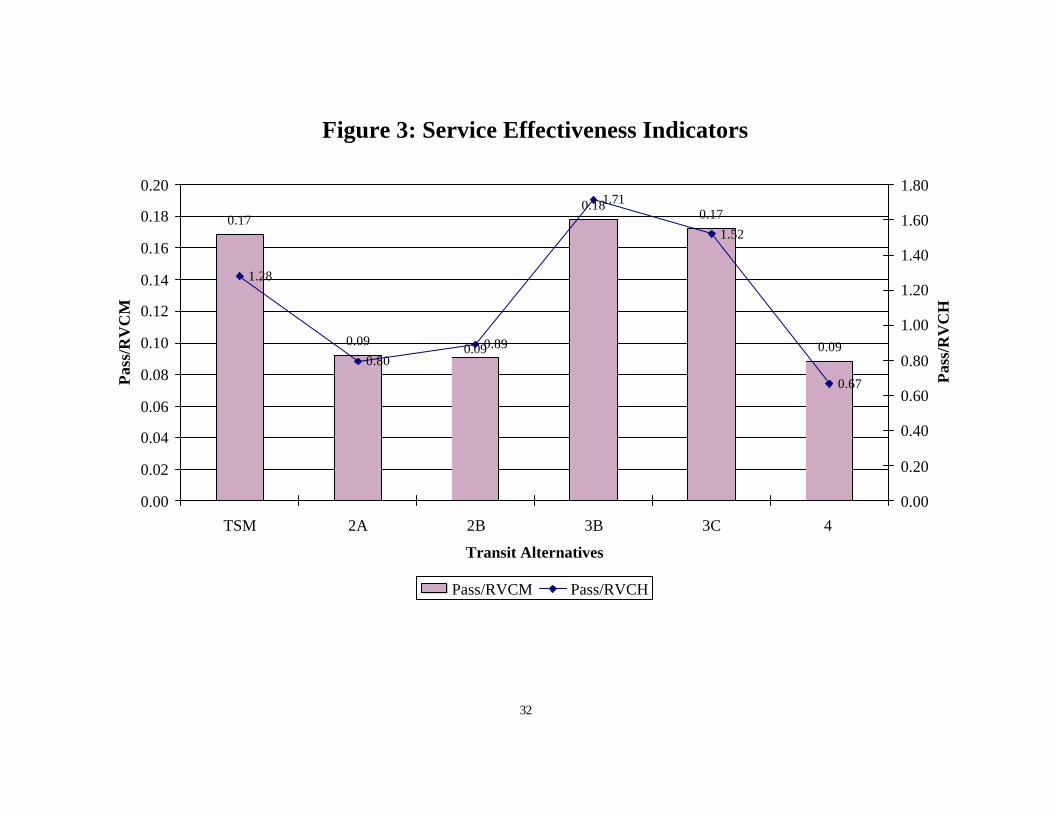
all six options (Figure 2). On the other hand, service effectiveness indicators show that the
trolley bus alternatives would carry more passenger trips per unit of service output, followed by
the TSM alternative and the light rail alternatives (Figure 3). The two cost effectiveness
indicators, total cost per passenger trip and total cost per new passenger trip, show somewhat
different performance ranking results. As seen from Figure 4, while the cost per passenger trip
of the TSM alternative would be the lowest, the TSM alternative would attract the fewest new
transit passenger trips, and therefore the cost per new passenger trip would be the highest among
all the options. The results of the all-surface light rail option also show a pattern similar to TSM.
While the costs per passenger trip of the trolley bus alternatives would be higher than the TSM
and the all-surface light rail alternative, the trolley bus alternatives would cost the least for each
8 Values of time savings were computed based on information provided in Tables 7 and 10 of the GCSPS. The GCSPS also assumed the time values of $4.80/hour for work trips and $2.40 for non-work trips.

19
new passenger trip. In comparison, the surface/subway light rail alternatives would cost the
most per passenger trip on average, but not the least per new passenger trip.
[Figures 2~4 About Here]
The results imply that in the absence of federal financial incentives, the surface/subway
light rail alternatives may not be the preferred choices of Muni, if a decision is made rationally
on the basis of efficiency and effectiveness criteria. In terms of cost efficiency, the TSM
alternative would be the first choice, followed by the all surface light rail option #4. If the
investment objective were to be to maximize service effectiveness and attract new passengers at
the least cost, the trolley bus alternatives would be Muni’s preferred choices. However, if a
decision were made on the basis of maximizing the federal financial gain, Alternatives 2B and
2A would be the first and second choices.
Discussion
Numerous studies have found optimistic ridership forecasts and underestimated costs in
many light rail projects. For instance, Pickrell (1992) compared actual transit patronage and
costs with the forecasted figures for rail transit projects built in Washington, D.C., Baltimore,
Miami, Buffalo, Pittsburgh, Portland, and Sacramento. He reported that in almost all these
cases, transit ridership was overestimated and the cost was underestimated. The actual total cost
per passenger was twice to five times the forecast value. Similar conclusions are also found in
studies of rail projects in Los Angeles and Dallas (Kain, 1988, 1990; Moore, 1993; Rubin &
Moore, 1996). Some researchers further suggested that federal capital subsidies are part of the
explanation for unbounded enthusiasm for rail systems. In some cases, decisions to build rail

20
dictated the results of technical analyses of transit investment alternatives and voters were misled
about costs and performance of alternative systems. (Kain, 1988; Richmond, 1998).
In this study, we did not attempt to judge whether the GCSPS miscalculated the costs and
ridership of the alternatives, which is beyond the scope of our study. Instead our analyses are
largely based on the data of the GCSPS. However, the results of the foregoing analyses do
show that the more capital-intensive surface/subway light rail options envisioned in the
document “A Vision for Rapid Transit in San Francisco” tend to be less efficient and effective,
but would generate more federal financial support than other less capital-intensive options under
the current transit subsidy policies. The findings seem to suggest that the federal subsidy policy
would provide an incentive for capital-intensive investments in the Geary Corridor.
Conclusion
While previous studies suggest that federal transit subsidy policy might have induced
costly early retirement of capital assets and encouraged expensive transit investments, little prior
research has demonstrated how federal subsidy policy affects local transit investment decisions.
This study attempts to explain the possible effects of federal subsidy policy on local transit
investment decisions, and illustrates these effects using the data from the San Francisco GCSPS.
We argue that due to financial and political constraints, local decision-makers have to
include financial considerations among the important criteria in making transit investment
decisions. Because federal financial support is a significant external source for local transit
investments, federal transit subsidy can shape local transit investment decisions. While federal
financial incentives may not completely determine local transit investment decisions, they are a
catalyst for capital-intensive investments. When combined with other motivations, federal
21
financial incentives could lead to inefficient investment decisions. Our illustration shows that
based on the data from the GCSPS, more capital-intensive investment alternatives tend to
generate larger financial support from the federal government. However, they may not be the
most efficient and effective options. The finding implies that federal subsidy policy does
provide financial incentives for local governments to invest in more capital-intensive modes.
Decisions made on the basis of maximizing federal financial support or minimizing local
financial burden may lead to the selection of inefficient and ineffective alternatives.
The relationship between federal policy and local decisions is very complex. The actual
effect of federal policy on local decisions depends on local political conditions and structure, as
well as special circumstances under which transit investment decisions are made. Although the
findings from this case study cannot be generalized to other locations and a more solid
conclusion on the issue would have to be reached as more case studies become available, the
study does empirically address the question of how federal transit subsidy policy may influence
local transit investment decisions and shed light on the issue.
In the past, policy debate has focused on the division of operating and capital funds or
eliminating operating funds. In the future, transit subsidy policy debates should focus not only
on elevating the requirement of local matches for capital projects, but also on offering rewards to
transit operators that provide high-quality transit services to passengers at low costs. In addition,
the current funding allocation approach may need reform. With a large proportion of funding
earmarked by Congress, the political nature of funding allocation can discourage serious
comparison of transit investment alternatives. Without reform, it would also be difficult to
implement the Federal Transit Administration’s rules for major capital project evaluation and the
rating processes, as outlined in federal law (U.S. DOT, 2000b). A more radical alternative to the

22
current funding allocation approach would be to return a larger proportion of the locally
generated money to state and local governments. While this approach may not guarantee that
public resources are spent efficiently, it would at least reduce the incentive for inefficient use of
public resources, and limit the federal government’s involvement in local investment decisions,
while maintaining the federal government’s role in balancing the needs of areas having limited
local funding resources.

23
References:
American Public Transit Association. 1988 & 2000. Transit Fact Books, Washington, D.C. Barnum, D. T., and J. M. Gleason. 1979. Measuring the Influence of Subsidies on Transit
Efficiency and Effectiveness. UMTA-NE-11-0002-80-4. Indiana University, Gary; Nebraska University, Omaha.
Black, Alan. 1995. Urban Mass Transportation Planning, McGraw-Hill, Inc., New York,
London, Tokyo, Toronto. Cabanatuan, Michael. 2001. “Mineta’s Mass-Transit Advocacy Democratic Nominee An
Uncertain Fit in Bush’s Cabinet.” San Francisco Chronicle, January 4, 2001. Center for Transportation Excellence. 1994~2000. “Election Issues.”
http://www.cfte.org/election/election.htm. Cervero, Robert. 1984a. Cost and performance impacts of transit subsidy programs.
Transportation Research Part A, 18A (5/6): 407-413. Cervero, Robert. 1984b. Examining the performance impacts of transit operating subsidies.
Journal of Transportation Engineering. 110(5): 467-480. Cervero, Robert. 1994. Rail Transit and Joint Development: Land Market Impacts in
Washington, D. C. and Atlanta. Journal of the American Planning Association. 60 (1): 83-94.
Cervero, Robert, and John Landis. 1997. Twenty Years of the Bay Area Rapid Transit System:
Land Use and Development Impacts. Transportation Research Part A, 31A (4): 332-333. Cole, Richard, and Jianling Li. 2001. Arlington Transportation Survey, report prepared for the
City of Arlington, School of Urban and Public Affairs, the University of Texas at Arlington.
Cromwell, Brian A. 1989. Capital Subsidies and the Infrastructure Crisis: Evidence from the
Local Mass-Transit Industry. Economic Review. Federal Reserve Bank of Cleveland. 2: 11-21.
Dietz, David. 1995. “Budget Analyst Offers Gloomy Forecast for Muni New Taxes Suggested
to Stem Deficit.” San Francisco Chronicle, November 8, 1995. Federal Transit Administration (FTA). 1993. 1992 Statistical Summaries: Grant Assistant
Programs. U.S. Department of Transportation (DOT). Washington, D.C.
24
Federal Transit Administration (FTA). 2001. 2000 Statistical Summaries: FTA Grant Assistant Programs. Report No. FTA-TMM10-2001-01, U.S. Department of Transportation (DOT). Washington, D.C.
Frankena, Mark W. 1987. Capital-Biased Subsidies, Bureaucratic Monitoring, and Bus
Scrapping. Journal of Urban Economics. 21: 180-193. Goldman, Todd and Martin Wachs. 2001. A Quiet Revolution in Transportation Finance: The
Rise of Local Option Transportation Taxes, submitted to Journal of the American Planning Association, August 2001.
Gomez-Ibanez, Jose A. 1985. A Dark Side to Light Rail? The Experience of Three New Transit
Systems. Journal of the American Planning Association. 51 (3): 337-35 1. Hager, Philip and Mark A. Stein. 1992. “State Justics Reject Transit Tax Challenge
Government: Foes of Half-cent Surcharge Approved in 1990 Said It Needed Two-Thirds Vote. Officials Look to Funds for Budget Bailout.” Los Angeles Time, May 15, 1992.
Hilton, George W. 1974. Federal Transit Studies, American Enterprise Institute for Public Policy
Research, Washington. Kain, John. 1988. “Choosing the Wrong Technology: Or How to Spend Billions and Reduce
Transit Use.” Journal of Advanced Transportation, Vol. 21 (3): 197-213. Kain, John. 1990. “Deception in Dallas: Strategic Misrepresentation in Rail Transit
Performance and Evaluation,” Journal of the American Planning Association, 56 (2): 184-196.
Lem, Lewison Lee, Jianling Li, and Martin Wachs. 1994. Comprehensive Transit Performance
Indicators. Report prepared for the University of California Transportation Center & the California Department of Transportation. Institute of Transportation Studies, University of California, Los Angeles.
Li, Jianling. 1992. Transit Subsidies and Performance: The Case of Los Angeles County. Master
Thesis. University of California, Los Angeles. Merrill & Associates. April, 1995. Geary Corridor System Planning Study: Final Report.
Meyer, Michael A., and Eric J. Miller. 1984. Urban Transportation Planning: A Decision
Oriented Approach. McGraw-Hill Book Company, New York.
Moore II, James E. 1993. Ridership and Cost on The Long-Beach-Los Angeles Blue Line Train. Transportation Research A. 27A (2): 139-152.
Obeng, K. and G. A. Azam. 1995. Allocative Distortions From Transit Subsidies. International
Journal of Transport Economics, 22 (1): 15-34.

25
Obeng, K., W. K. Talley, and C. Colburn. 1995. The Effects of Subsidies on Public Transit
Long-Run Costs. Journal of the Transportation Research Forum, 35 (1): 69-86. Pickrell, Don H. 1986. Federal Operating Assistance for Urban Mass Transit: Assessing a
Decade of Experience. Transportation Research Record. 1078: 1 -10. Pickrell, Don H. 1992. A Desire Named Streetcar: Fantasy and Fact in Rail Transit Planning.
Journal of the American Planning Association. 58 (2): 158-176. Pucher, John, Anders Markstedt and Ira Hirschman. 1983. Impacts of Subsidies on the Costs of
Urban Public Transport. Journal of Transport Economics and Policy. 17 (2): 155-176. Pucher, John, and Anders Markstedt. 1983. Consequences of Public Ownership and Subsidies for
Mass Transit: Evidence from Case Studies and Regression Analysis. Transportation. 11: 323-345.
Richmond, Jonathan. 1998. New Rail Transit Investments - A Review. Taubman Center for State
and Local Government, John F. Kennedy School of Government, Harvard University, Cambridge, MA.
Rubin, Thomas A. and James E. Moore, II. 1996. Why Rail Will Fail: An Analysis of the Los
Angeles County Metropolitan Authority’s Long Range Plan. Policy Study No. 209, Reason Foundation, Los Angeles, CA.
Rushing, Taylor, J. May 5, 2002. “Transit, Taxes Should Wait, Observers Say.” Arlington Star-Telegram.
San Francisco County Transportation Authority (SFCTA). 2001. San Francisco Countywide Transportation Plan: Draft Report. http://www.ci.sf.ca.us/sfta/transportplan/plan2000/sftransportationplan.htm
San Francisco Municipal Railway (Muni). 1994. Section 15 Report, Fiscal Year 1993-1994. San Francisco Municipal Railway (Muni). April 1995. Executive Summary, San Francisco Long
Range Fixed Guideway Plan. San Francisco Municipal Railway (Muni). April 2001. Project History.
http://sfmuni.com/aboutmun/3rdhist.htm. San Francisco Municipal Railway (Muni). 2002. A Vision for Rapid Transit in San Francisco. U.S. Department of Transportation (DOT). July, 1998. The Transportation Equity Act for the 21"
Century: A Summary. Washington, D.C.

26
U.S. Department of Transportation (DOT). 2000a. This is the Federal Transit Administration, Report # FTA-TBP10-2000-03. Washington, D.C.
U.S. Department of Transportation, Federal Transit Administration. 2000b. Federal Register,
Vol. 65, No. 236. Wachs, Martin. 1989. U.S. Transit Subsidy Policy: In Need of Reform. Science. 244: 1545 1549. Wachs, Martin. 1995. “The Political Context of Transportation Policy,” in The Geography of
Urban Transportation, 2nd edition, Susan Hanson, editor, the Guiford Press, New York, London.
WAMU. 2000. “Terry L. Lierman: Running for 8th Congressional District in Maryland.” http://www.wamu.org/election/t_lierman.php.

27
Table 1: Sources of Operating Revenue Among U.S. Transit Systems Operating Revenue (% of total)
Sources
1975 1980 1985 1990 1995 1999(P) Passenger fares (a) 54 39 37 37 37 37 Other operating income (b)
5 4 6 5 15 16
State and local subsidies (b)
32 40 50 52 43 42
Federal subsidies 9 17 8 6 4 4
Notes: P = Preliminary data.
(a) Includes fares retained by contractors; beginning 1991 includes fare subsidies formerly included in "other".
(b) "Local" includes taxes levied directly by transit agency and other subsidies from local government such as bridge and tunnel tolls and non-transit parking lot funds. Beginning 1994, such funds reclassified from "local" to "other".
Sources: American Public Transit Association, Transit Fact Books, 1988 & 2000, Washington, D.C.

Table 2. Service Input, Output and Consumption Estimates from GCSPS
Alternatives Existing TSM 2A (LR)
2B (LR)
3A (TB,DMB)1
3B (TB, Long)
3C (TB, Short)
4 (LR, Surface)
Peak Vehicles: LR
36
32
38
TB 23 43 46
DMB 26
MB 60 58 15 15 12 15 15 15
Annual RVM: LR (CarMile)
1,125,576
1,182,946
1,060,863
TB (VM) 1,140,347 1,289,051 1,222,610
MB (VM) 1,337,061 1,398,800 398,256 398,256 336,569 398,256 389,383 389,383
Annual RVH: LR (CarHour)
123,594
111,534
136,038
TB (VH) 133,880 111,695 119,677
MB (VH) 181,702 184,370 63,316 63,316 68,395 63,316 63,316 63,316
Total Capital $ (in 000’) N/A $33,033 $654,076 $899,774 $595,289 $686,705 $484,835 $333,885
One-way travel time (minutes) 40~49 28.6 29.1 41 30.6 34.7 34.3
Annual Passengers 19,339,200 19,813,200 24,300,400 25,058,800 21,108,800 25,185,200 23,352,400 22,088,400
Note: TSM = Transportation System Management; LR = light rail; TB = trolley bus; DMB = dual bus mode; long = long segment in tunnel; short = short segment in tunnel; surface = entire alignment at grade.
Source: Table D-3, Table D-4, Tables 3 - 4, Tables 5A-5G, "Geary Corridor System Planning Study," by Merrill & Associates, April 1995.
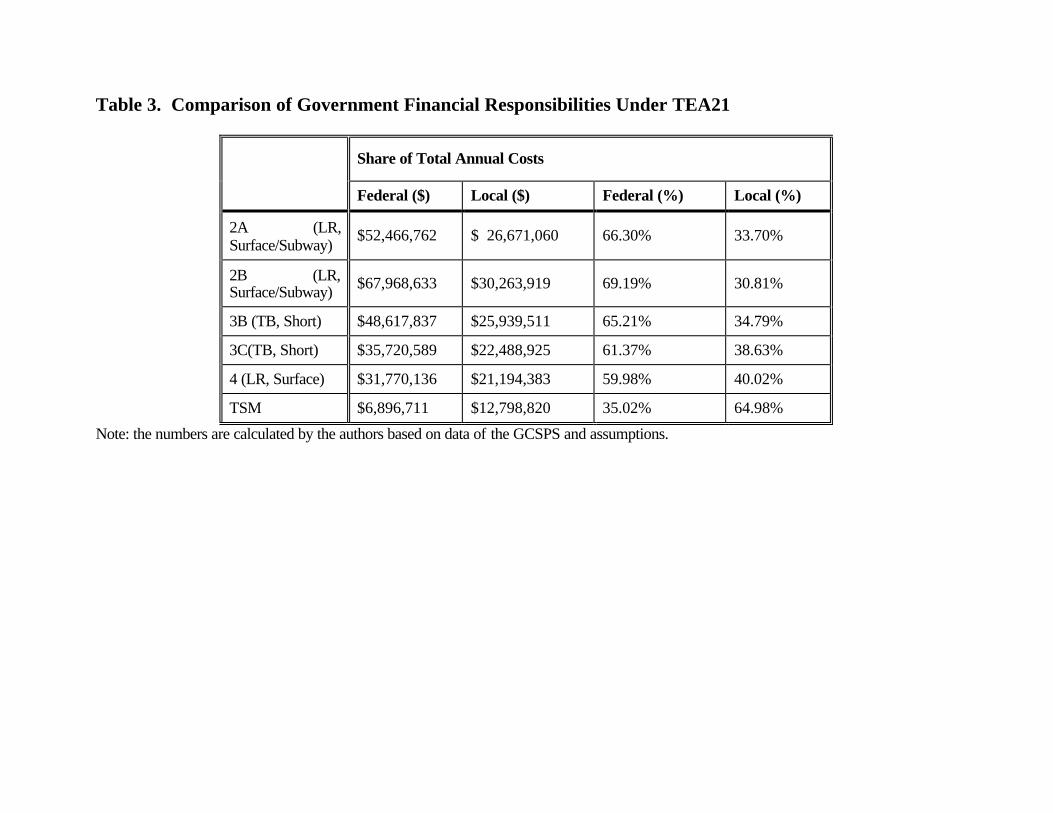
Table 3. Comparison of Government Financial Responsibilities Under TEA21
Share of Total Annual Costs
Federal ($) Local ($) Federal (%) Local (%)
2A (LR, Surface/Subway)
$52,466,762 $ 26,671,060 66.30% 33.70%
2B (LR, Surface/Subway) $67,968,633 $30,263,919 69.19% 30.81%
3B (TB, Short) $48,617,837 $25,939,511 65.21% 34.79%
3C(TB, Short) $35,720,589 $22,488,925 61.37% 38.63%
4 (LR, Surface) $31,770,136 $21,194,383 59.98% 40.02%
TSM $6,896,711 $12,798,820 35.02% 64.98%
Note: the numbers are calculated by the authors based on data of the GCSPS and assumptions.
30
Figure 1: Trends of Federal Subsidies
$-
$1,000,000,000
$2,000,000,000
$3,000,000,000
$4,000,000,000
$5,000,000,000
$6,000,000,000
1975
1976**
* 1977
1978
1979
1980
1981
1982
1983
1984
1985
1986
1987
1988
1989
1990
1991
1992
1993
1994
1995
1996
1997
1998
1999
Year
Capital Operating
Notes:
1. Capital subsidies prior to 1986 do not include Sections 8, 26(a)(2), and RTAP grants. 2. Operating subsidies prior to 1986 include only formula operating grants for urbanized areas (Table 21, 1992 Statistical
Summaries). 3. The capital and operating subsidies for fiscal year 1976 include obligations during the transition quarter (TQ) from July 1,
1976 to September 30, 1976. All subsidies are in current year dollars. Data sources: Tables 19 ~ 22, 1992 Statistical Summaries. Table 52, 2000 Statistical Summaries.

Figure 2: Cost Efficiency Indicators
$0.17
$0.27
$0.33
$0.49
$0.41
$0.19
$1.27
$2.30
$3.25
$4.75
$3.61
$1.44
$-
$0.10
$0.20
$0.30
$0.40
$0.50
$0.60
TSM 2A 2B 3B 3C 4
Transit Alternatives
$/R
VC
M
$-
$0.50
$1.00
$1.50
$2.00
$2.50
$3.00
$3.50
$4.00
$4.50
$5.00
$/R
VC
H
$/RVCM $/RVCH
32
Figure 3: Service Effectiveness Indicators
0.17
0.09
0.180.17
0.090.09
1.28
0.800.89
1.71
1.52
0.67
0.00
0.02
0.04
0.06
0.08
0.10
0.12
0.14
0.16
0.18
0.20
TSM 2A 2B 3B 3C 4
Transit Alternatives
Pas
s/R
VC
M
0.00
0.20
0.40
0.60
0.80
1.00
1.20
1.40
1.60
1.80
Pas
s/R
VC
H
Pass/RVCM Pass/RVCH

33
Figure 4: Cost Effectiveness Indicators
$0.99
$2.89
$3.64
$2.77
$2.38$2.15
$41.36
$14.17$15.95
$11.93$13.84
$17.27
$-
$0.50
$1.00
$1.50
$2.00
$2.50
$3.00
$3.50
$4.00
TSM 2A 2B 3B 3C 4
Transit Alternatives
$/Pa
ss
$-
$5
$10
$15
$20
$25
$30
$35
$40
$45
$/N
ew P
ass.
$/Pass $/New Pass

Biographical Sketch
Jianling Li is Assistant Professor of Urban Planning at the School of Urban & Public Affairs, the
University of Texas at Arlington.
Martin Wachs is Director of the Institute of Transportation Studies at the University of
California, Berkeley, where he is also Roy W. Carlson Distinguished Professor of Civil &
Environmental Engineering and Professor of City and Regional Planning.

Acknowledgement
This work was supported by the University of California Transportation Center (UCTC). An
earlier version of this paper was presented at the annual meeting of the Association of Collegiate
Schools of Planning in Pasadena, California. We would like to thank Philip Yang at the Texas
Woman’s University, Joel Goldsteen, Guisette Salazar, Delbert Taebel, and Robert Wagner at
the University of Texas at Arlington, and Douglass Lee at the Volpe National Transportation
Systems Center for their useful comments on early versions of the paper. The comments
provided by the two anonymous reviewers and editor David T. Hartgen significantly enhance the
quality of the final version of this paper and are greatly appreciated. We are grateful for the
research support provided by the University of Texas at Arlington and the University of
California at Berkeley for the completion of the paper. The opinions and conclusions are those
of the authors alone, and represent the views of neither the University of California
Transportation Center nor of its sponsoring organizations, the California Department of
Transportation and the United States Department of Transportaiton.