the effects of credit rating announcements on shares · · 2004-09-17the effects of credit rating...
TRANSCRIPT

The Effects of Credit Rating Announcements on Shares
in the Swedish Stock Market
Hui Li1, Nuttawat Visaltanachoti1, and Puspakaran Kesayan2*
1Department of Commerce, Massey University, North Shore Mail Center, Private Bag 102 904, Auckland, New Zealand
2Division of Banking and Finance, Nanyang Technological University, Singapore & University Utara Malaysia, Malaysia
“Working Paper: Please Do Not Quote Without Permission”
Abstract
This paper examines the controversial issue regarding informational value of credit
rating announcements. For the rating assignments, positive outlooks and affirmations
announcements, there is no significant share price reaction following credit rating
announcements in both the long-term and short-term. However, there is significantly
positive (negative) market reaction to the upgrade (downgrade) announcements. For
the downgrade and negative outlook announcements, the short-term returns show no
significant reaction but long-term returns show significant negative response. In
conclusion, the results suggest that the liquidity may play a significant role in the
informational value of credit rating announcement. In the small but liquid stock
market like the Swedish share market, credit rating agencies only provide limited
informational value to the investors.
Keywords: credit rating announcement, event study, Swedish JEL Classifications: G10 ___________________ *Corresponding author. Address to: Ph.D. Office, Nanyang Business School, S3-01B-73, Nanyang Technological University, Nanyang Avenue, Singapore 639798. Email address: [email protected] +Acknowledgements: We thank Thomas Meyer for his helpful discussions.

1. Introduction
The informational value of credit rating agency is a controversial and inconclusive
issue. Do the credit rating announcements have any impact on the stock market? If
they have, how does the security market react to the different types of credit rating
announcements? This paper aims to shed light on the above research questions. A
number of researchers have explored this issue by different methods but the results
are conflicting. Some of the earlier studies have examined the credit rating
announcements on the security returns and found no significant returns (Weinstein,
1977; Pinches and Singleton, 1978). Kaplan and Urwitz (1979) and Wakeman (1981)
suggested that bond rating agencies only had access to public information and their
ratings have no added value to the investors.
However, other researchers argued that the rating agencies had information that was
not available in the public domain and that the stock market reacted significantly to
the relevant information. Ederington and Yawitz (1991) indicated that the rating
agencies are the low cost providers of such information. Danos, Holt, and Imhoff
(1984) concluded that bond rating agencies possess expert judgment and are
specialists at processing information related to firm’s financial condition. Cornell,
Landsman and Shapiro (1989) argued that revisions in bond ratings may have
information content because they reflected a more informed estimate of the intangible
asset values of a firm and the implicit claims on an entity by other stakeholders.
Most of the above research examined relatively larger market such as US, UK, and
Australia, so the effect on smaller markets remains unclear. Elayan et al (2003) found
that the announcements of a credit rating assignment were associated with a positive
and statistically significant market reaction from New Zealand share prices, which is
consistent with other researchers’ findings. Unlike the previous research, a significant
market reaction to rating upgrades was also found in their research. In addition, there
were no significant market reactions to positive credit placement and rating upgrade
announcements for those dual-listing (American Depository Receipt traded) firms.
This paper employs the event study methodology to examine whether credit rating
announcements provide new information that investors have not already anticipated in
the small market like the Swedish share market and how stocks in the small market

reacts to the credit rating announcements. The Swedish share market has some
unique characteristics, its total value of shares listed is at the same level as that of
Australia and the market liquidity is even more than the Australia market but the
number of shares is roughly at the same level as that of New Zealand. The high
liquidity directly affects the degree of asymmetric information in the market. It is
expected that due to the higher level of liquidity the credit rating announcement
should exhibit a weaker effect in the Swedish share market compared to the New
Zealand stock market. Our results confirm this proposition. We found no abnormal
return during the two-day announcement periods, but for a negative outlook
announcement there are significantly positive cumulative average abnormal return
following 10 and 20 days after announcement date. This finding implies that the
market has already anticipated the negative return but overreacted to the negative
news, therefore, the stock price slowly recovers after the event day. Moreover, we
show that after 2 to 6 months the excess returns of announced stocks are significantly
different from zero, indicating that the new credit information may not be
instantaneously incorporated into stocks prices.
The rest of the paper is presented as follows. Section 2 reviews the related literature
and states the hypotheses. Section 3 describes the data and the methodology. Section
4 presents the empirical results. Conclusion and summary are in section 5.
2. Literature Review
2.1 Theoretical Perspectives
There are two opposite views on the question whether rating agencies provide
valuable information to investors. Kapland and Urwitz (1979) developed a simple
linear model using subordination dummy, total asset, leverage, and the common stock
systematic risk to measure and classify a sample of newly issued bonds. They argue
that this model may be predicting the actual risk of a bond better than the rating
agency, raising the question whether rating agencies outperform the statistical model.
Additionally, Wakeman (1981) suggested that rating agencies only act as the outside
auditors and performed no economic functions with their rating services. The
opposite view is that rating agencies do add value. Hsueh and Kidwell (1988) argued
that the bond issuers would like to buy rating agent services due to the information
asymmetry. Accordingly, issuers pay the credit rating agency to convey the quality of
their securities to the market. Investors use credit rating to assess the credit quality of
a bond. Hence, a rating agency can reduce the moral hazard of direct information
transfer between the issuer and the investor. Their empirical findings suggested that
issuers’ using two credit ratings could significantly reduce the borrowing costs
because the additional information value provided by the second agent exceeded the
cost of obtaining it. Danos et al (1984) argued that rating agencies possessed expert
judgment and were specialists at processing information related to a firm’s financial
situation, thus they could provide valuable information which is not easily available to
the public to the investors. Furthermore, Cornell, Landsman and Shapiro (1989)
argued that revisions in bond ratings may have informational content because they
reflected a more informed estimate of the intangible assets of a firm and the implicit
claims on an entity by other stakeholders. Ederington et al (1991) pointed out that if
that kind of information was costly, the rating agencies were the lowest cost
providers, and therefore, the rating changes may affect security prices.
According to Megginson and Weiss (1991, p881), the reliable credit information
provided by rating agencies must be costly for the issuing firms. The firms purchased
credit service to reduce the information asymmetry, hence, credit information should
contain valuable information to outside investors. Ellis (1998) conducted a survey to
examine the different opinions about the function of the rating agencies between
issuers and investors and how they would use the rating services. The findings
showed that the investors would restrict themselves to the ratings issued by those
agencies with the strongest reputation and the investors tend to use the rating agencies
that they felt to be the most accurate and consistent. However, many bond issuers
wanted to obtain three or four ratings services even they knew that only one or two
rating services were enough because they scared of receiving an inaccurate rating.
This survey reinforced the opinion that bond issuers regarded rating agencies as a
useful intermediary to convey more accurate state of their firms. Partnoy (1999)
explained the functions of the credit agencies from a regulatory point of view. On one
hand, the credit agencies were supposed to provide valuable information to the
investors, but the information value they provided had been declining in recent years
due to the economy globalization and rapid technology development. Consequently,
their information seemed to be more reactive rather than proactive. He named this
phenomenon as the “regulatory license”, which meant that the security regulations

substantially depended on the credit ratings. He suggested the regulators to reduce the
dependences on the credit ratings.
2.2 Empirical Evidence
The empirical results of testing the significance of credit rating announcements on
bond or equity prices are conflicting. A number of papers examined the behavior of
corporate bond prices during the period surrounding the announcement of a rating
change. Some papers suggested that stock market had no significant reaction to rating
announcements. Other papers found evidence indicating that credit rating
announcements provide informational value to the market.
2.2.1 Market Efficiency Studies Weinstein (1977) found some evidence of price change during the period from 18 to 7
months before the rating change was announced, but no evidence of any reaction
during 6 months prior to the rating change, and there was little reaction during the
month of the change or for 6 months after the change. Pinches and Singleton (1978)
examined the effects of bond rating changes on stock price using the monthly return
data from January 1950 to September 1972. They found that there was no evidence of
any upward or downward drift in the cumulative abnormal returns before or after the
month of the bond rating change. Their results indicated that the investors had
realized the overall improvement or deterioration in a firm’s financial condition and
the information content of the rating changes had been fully discounted by the month
of the change. The bond rating agencies just reacted to the changing financial
conditions after the investors had already understood the changes, so the rating
announcements did not provide any informational value.
2.2.2 The US Bond Market Studies Some researchers found evidence supporting that credit agencies provided
informational value to investors. Katz (1974) tested the efficiency of bond market in
terms of an event study on the price adjustment process of bonds to rating
reclassifications. He developed regression models to forecast the expected yield to
maturity of a reclassified bond for both its old and new rating class in each of eighteen
months with twelve months prior to and five months after a rating change. Then the

actual yield to maturity was compared to the two expected yields to investigate to
what extent the adjustment process prevailed. The results indicated that no
anticipation prevailed before public credit rating announcements of reclassification. A
slight lag existed in the price adjustment process after a public announcement and
100% adjustment took place in 6-10 weeks. Grier and Katz (1976) also found that the
new information was not instantaneously absorbed by the industrial bond price and
there was a step-by-step price adjustment after the rating change for a significant
period. Ingram et al (1983) studied the municipal bond market reaction to the rating
change announcement, they selected a sample of non-callable, general obligation
bonds issued by 127 municipalities during the period from August 1976 to February
1979 and compared the average yield premium for municipalities which experienced
a rating change with the average premium for equivalently rated municipalities which
experienced no rating change. The empirical results showed that the mean differential
was significant during the month of the change for both the upgrading and
downgrading bonds, whereas there was no significant mean differential prior to the
rating change.
2.2.3 The US Stock Market Studies Griffin and Sanvicente (1982) explored the common stock price reaction to the rating
changes. They examined the price changes in the eleven months preceding the
announcement and during the month of announcement itself. They used a controlled
portfolio method to test the cumulative residuals significance between the event and
controlled samples. The control portfolios used in their study were constructed by
matching on beta, industry, and key financial variables. They found that the
cumulative abnormal returns were significant in either the preceding eleven months or
the month of announcement for the downgrading stocks, whereas, were insignificant
in the month of announcement for the upgrading. Holthausen et al (1985)
investigated the effect of bond rating changes on common stock prices using the daily
stock returns. They argued that using monthly data may increase the probability that
the price response is due to other information released during the month. They
calculated the cumulative abnormal returns for the two-day event window (from t-1 to
t, where t is the announcement release date). Particularly, they considered that the
contamination news may decrease the power of the statistical test, hence, they

classified the sample into two groups: one is non-contaminated group; the other is
contaminated group (they defined this group as there are other firm-specific
information during the trading days from t-1 to t+2). They performed the statistical
test on the two groups separately and also investigated the potential determinants of
the cross-sectional variation in the price response to rating changes. The evidence
suggested that the downgrades were associated with negative abnormal stock returns
in the two-day window either in the contaminated or non-contaminated group. There
was little evidence of abnormal returns associated with upgrades rating changes.
Glascock et al (1987) examined the stock movement surrounding announcement date
of a bond rating change by Moody’s bond services. They pointed out that Moody’s
has two announcement days, the date it announces the rating change to the public via
the Dow Jones New Service, and the date it publishes the change and the reason in the
Moody’s Bond Survey. Particularly, they differentiated the two announcement days in
their test in order to more precisely check the price response. They found that for the
down-ratings, there was a negative reaction on Moody’s Bond Survey publication
date. In addition, there was a return reversal after the publication date. The evidence
for up-ratings was not clear. They also concluded that the reaction that took place on
the publication date instead of on the wire service data implied that the market was
somewhat slow in assimilating the re-rating information.
Elayan et al (1990) examined the stock price response to false signals – positive and
negative placements on CreditWatch that were not followed by a rating change of the
indicated direction. Their sample stocks were those that had securities placed on the
CreditWatch list for positive or negative reasons between November 1981 and
December 1985. The data was divided into four categories Negative placement and
rating subsequently lowered, Negative placement and rating affirmed, Positive
placement and rating subsequently raised, and Positive placement and rating affirmed.
The statistical test results indicated that there was a negative stock price response to
negative placements that were followed by rating affirmation, but no response at the
time of placement for firms placed for negative reasons with a subsequent lowering of
the rating. There was no response to positive placement whether or not the rating
subsequently was increased and no response at the time of removal from the
CreditWatch list.

Dichev et al (2001) investigated the long-term stock returns following bond rating
changes. They used a sample that included Moody’s entire available bond rating
changing announcements during 1970 to 1997 and 4,700 observations. The abnormal
returns and buy-and-hold returns were calculated in terms of three-month, six-month,
first-year, second, year, and third year. They found that no significant abnormal
returns for stocks whose ratings were upgraded and significant abnormal returns for
stocks whose ratings are downgraded. They also performed the test on the long-run
returns conditional on firm size, credit quality and preceding quarter’s earning
surprise. The empirical evidences were consistent with the downgrade
underperformance. Particularly, the underperformance was likely to be more
pronounced for small and low-credit-quality firms and would continue even after
positive earning announcements.
2.2.4 The US Bond and Stock Market Studies
Wansley et al (1985) conducted a research about the equity returns and bond prices of
firms around the dates of their placement on CreditWatch by Standard and Poor’s.
The data included two samples: one involved the firms placed on CreditWatch
between November 1981 and December 1983 and the other involved the firms not
placed on CreditWatch but whose debt was rerated during the same period. The stock
returns and bond prices were compared with each other. The results showed that there
was significant market reaction to the downgrading firms and no significant reaction
to the upgrading or affirmed rating firms. Bond prices for downgrading firms
continued to decrease as long as seven months after the rating change indicating the
bond market did not appear as efficient as the stock market. Hand et al (1992)
categorized two types of bond rating agency announcements: warnings of possible
rating changes on the CreditWatch list between 1981 and 1983, and actual rating
changes announcements by Moody’s and Standard and Poor’s between 1977 and
1982. They measured excess bond returns as raw bond returns minus the return on a
risk free bond. The raw return for each bond was calculated from the last transaction
price in the period t-11 to t-1 to the first transaction price on or after t+1 (due to the
bond trade infrequency). The excess stock returns were calculated from the market
model and summed over t to t+1. They showed that significant excess bond and stock
returns to the downgrading announcements and insignificant response to the
upgrading announcements.
Kliger et al (2000) argued that the rating agencies could repackage the firm-related
private disclosed information into the ratings without fully revealed it to the investors.
Hence, theoretically the rating information should have informational value. They
considered that the previous research regarding the informational value of rating
changes might not distinguish the rating change information from other fundamental
economical change information. They used a new approach to investigate the price
reaction to rating changes that exclusively reflected rating information – rating
changes that occurred when Moody’s refined its rating reports. The refined
information did not include any fundamental change in the issuer’s risk. After
analyzing the bond price, stock price, and stock option price reaction before and after
the announcement date, they found that the stocks returns decreased (increased) and
the bond value increased (decreased) when Moody’s announced better (worse) that
expected ratings, while the implied volatilities of the stock options declined (rise).
2.2.5 Non-US Studies Unlike previous US-based studies, Matolcsy et al (1995) examined the incremental
informational content of bond rating changes in the Australian stock market. Their
study realized the informational content of unexpected accounting income number as
the confounding announcements. Hence, they proposed two hypotheses. First, the
joint information content of unexpected accounting income numbers and bond rating
revision was non-zero. Second, the information content of bond rating revisions
beyond the information content of unexpected accounting income numbers was non-
zero. Based on the weekly stock returns during 1982-1991, there were significant
abnormal returns that could be explained by the joint information content of
unexpected accounting income numbers and the rating changes. They found that the
abnormal returns were significant for the downgrading bonds and non-significant for
the upgrading bonds. Barron et al (1997) also conducted a study based on the UK
share market. They used daily data around a rating change or CreditWatch
announcement for the period from 1984 to 1992. Significant excess stock returns were
found being associated with bond rating downgrades and positive CreditWatch

announcements. They concluded that credit rating announcements provided
information to the capital market in UK but an assignment of rating could not reduce
the cost of equity capital of a firm. Unlike the previous studies that concentrated on
large market, Elayan et al (2003) examined effects of credit rating announcements on
the share prices in a relatively small market – New Zealand stock market. They
employed the daily stock return data form July 1990 to June 2000. They found
significant price reaction to both positive and negative announcements, and the
cumulative average abnormal returns (CAAR) are statistically different between firms
with American Receipt Depository (ADR) traded and firms with non-ADR traded for
the upgrade and downgrade rating actions.
2.3 Hypotheses
Many researches have investigated the impact of credit rating announcements in
several share markets such as USA, UK, Australia, and New Zealand. According to
the International Federation of Stock Exchanges, as of May 2003, the Swedish share
market has 286 listed firms with total market capitalization of 20.89 billion dollars,
which is roughly the same as large as that of Australian Stock Exchange (25.31 billion
dollars with 1,425 listed firms), while the market capitalization of NYSE and LSE are
811.65 and 311.69 billion respectively. This shows that the Swedish market is
relatively small compared to the US market, but its average firm size is larger than
those of the Australian Stock Exchange. Moreover, Swedish market is about twenty-
five times as mush as the New Zealand share market (0.81 billion dollars with 196
listed firms). The turnover velocity in Swedish market is about as three times as that
of New Zealand, indicating that the Swedish share market is much more liquid than
New Zealand share market.
Elayan et al. (2003) pointed out that the announcements of credit ratings could reduce
the information asymmetry and attract the attention of international market in the New
Zealand market due to the relatively smaller number of analyst coverage and less
attention from the international capital markets. They proposed that the
announcement of a NZ firm being assigned a debt rating was expected to be
associated with a positive and statistically significant stock reaction. However, this
findings may not hold in the Swedish market because the average market
capitalization and the overall market liquidity in the Swedish market are much higher

than those in the NZ market. Moreover, previous studies in large markets such as US,
UK have demonstrated that significant negative reaction to negative credit rating
announcements. Elyan et al. (2003) argued that in a smaller market, a positive
implication may have a greater effect and the smaller market should more sensitive to
the rating announcements. We however argue that the higher liquidity in the Swedish
share market would result in a lower degree of information asymmetry and therefore
limit the informational value of credit rating announcement. As a result, the
following hypotheses are proposed:
Hypothesis 1: Credit assignments and credit rating affirmations for Swedish firms are
not expected to generate a significant positive or negative market reaction.
Hypothesis 2: A positive (negative) outlook is expected to be associated with a
significantly positive (negative) share market reaction. Similarly, upgrade
(downgrade) rating announcements will be associated with significant excess positive
(negative) stock returns.
3. Methodology
3.1 Data Description
We collect the announcements of rating assignments, CreditWatch placements, and
rating actions (upgrade or downgrade) from the end of February, 1992 to February,
2003 from the FACTIVA database, which compiles announcements from several
rating agencies including Moody’s and Standard and Poor’s. There are 83 credit
rating announcements during the study period. The following six groups categorized
these announcements. Assignment is an event when a firm is assigned a credit grade
and there is no other action. Downgrade is an event when a firm’s credit rating is
downgraded. Upgrade is an event when a firms’ credit rating is upgraded. Positive
outlook is an event when a firm’s credit rating has a positive outlook. Negative
outlook is an event when a firm’s credit rating has a negative outlook. Lastly,
Affirmation is an event when a firm’s existing credit rating is affirmed. The
corresponding stocks’ total daily return index listed on the Swedish stock market was
collected from Datastream. These returns assumed that all of the dividends were
reinvested. The stock daily return data must be available from a period of day t-150 to
t+50, where t is the announcement date. The Swedish OMX index was used as the

market index for the calculation of the excess returns of the stocks over the market. If
there were other confounding announcements around the event day (t-1 to t+1), then
the observation was deleted. The total market value of equity (daily), total debt value
of firm (at the end of year), and total book asset value of firm (at the end of year) were
also obtained from Datastream to conduct the cross-sectional regression analysis. The
missing observations are excluded from the regression. The information about
whether a firm was listed as ADR in the American share market is obtained from the
website www.adr.com.
[Insert Table 1 around here]
Table 1 exhibits the number of announcements in different categories by year. The
downgrade announcements forms the largest group containing 19 out of 83 (22.89%)
of all announcements. There are 15 (18.07%) assignment announcements, 17 negative
outlook announcements (20.48%), and 17 affirmation announcements (20.48%)
respectively. There are only 9 (10.84%) upgrade announcements and 6 (7.23%)
positive outlook announcements indicating bad performance of the Swedish stock
market during this period. Most rating announcements concentrate in the year 2002
representing 33 out of 83 (39.76%) sample announcements. The sample size of this
research is admittedly smaller than that of the previous studies in large markets such
as USA and UK.
3.2 Methodology
3.2.1 Event Study
An event-study is conducted through the EVENTUS package. The cumulative
average abnormal returns (CAAR) is computed based on a GARCH (1,1) model.
Returns of day t-150 to day t-30 were used to estimate the parameters of the market
model, where the Sweden OMX index is a proxy of market index. The generalized Z
test was used to test whether the fraction of positive returns was equal to that of
negative returns. The CAARs are expected to be statistically significant for the
upgrade, downgrade, negative outlook, and positive outlook group.
3.2.2 Cross-Sectional Regression Analysis
The association of firm characteristics and the cumulative average abnormal returns
variation was examined using a cross-sectional multivariate regression. Due to small
sample, the six events were combined into three events: positive announcements that
included credit rating upgrades and positive outlooks; neutral announcements that
included credit rating assignments and affirmations; negative announcements that
included credit rating downgrades and negative outlooks. Three regressions were run
for these three events with the CAAR during period t-1 to t+1, and t-1 to t+0 as
dependent variables. The independent variables are Size, Leverage, BM and ADR.
Size is the natural log of the average market equity value one year before the
announcement day. Leverage is the ratio of firm’s total debt to the book value of total
assets. This ratio was calculated using the year-end data before the announcement
data. Kligr and Sarig (2000) found that firms with high leverage tended to react more
to rating announcement. Excluding four missing values, there were 79 observations
available for the regressions. The sample size of neutral event group is 29, negative
event group is 36, and positive event group is 14.
The third factor is the book value of equity divided by the market value of equity
(BM). The equity book value is the difference between the total assets and total
debts, while the equity market value is the daily average value one year before the
announcement day. ADR is a dummy variable indicating whether the firm is ADR-
listed (ADR = 1) or non-ADR-listed (ADR = 0). Elayan et al. (2003) contended that
non-ADR and small firms should react to credit rating announcements stronger than
the large ADR firms. Therefore, for the positive group, the signs of the coefficients
for both ADR and Size variable are expected to be negative, and coefficients of
Leverage and BM are expected to be positive and negative respectively. For the
negative group, the signs of the coefficients for both ADR and Size are expected to be
positive, and the coefficients for Leverage and BM are expected to be negative and
positive respectively.
Moreover, the category variable (D) is used to measure the extent of different credit
rating announcements impact to the CAARs. The variable was ordered from the most
negative news to the most positive news, i.e., one was assigned to the downgrade
announcement, two for negative outlook, three for assignment, four for affirmation,
five for positive outlook, and size for upgrade. The regression formula is as follows:
εαααααα ++++++= DBMLeverageSizeADRCAAR 543210 )()()()( (1)
Because the most positive (negative) news are expected to generate a most positive
(negative) reaction and is assigned a greatest (smallest) number, therefore, the sign of
this ordered category variable is expected to be positively significant, indicating that
the stock market reaction is in the same direction as the direction of the news events.
3.2.3 Long-term Excess Returns Analysis
This paper employs the information ratio to examine the long-run effects of the credit
rating announcements on the Swedish stock market. Two-month, four-month, and six-
month returns after the corresponding announcements were calculated. If the related
stock daily returns data during these time frames were not available, the associated
announcement was deleted from the sample. Thus, the sample sizes for the six event
types (from one to six) are 15, 15, 9, 6, 15, and 16 respectively. Information ratio was
calculated by the following equations:
ER
ERIRσ
= (2)
Where ER
ER
is the cross-sectional average difference of individual return and market
return; σ is the cross-sectional standard deviation of ER . The returns were
examined in terms of the t-statistic test. According to Grinold and Kahn (1995), an IR
of 0.5 was good, of 0.75 was “very good”, and of 1.0 was “exceptional.” Therefore,
the calculated information ratios can indicate the performance of the stock during the
related time period. For the rating assignments and affirmations the long-term average
excess returns are not expected to be significant. For the upgrade (downgrade) and
positive (negative) outlook announcements the long-term average excess returns are
expected to be significant positive (negative) and the information ratios are expected
to be more (less) than 0.5.
4. Empirical Results
4.1 Event Study Results
In sum, the findings from the event study are mixed. Some of them are in accordance
with the proposed hypotheses and others are not. According to Table 2, out of the
number of stocks with positive CAARs are not statistically different from the number
of stocks with negative CAARs during period t-1 to t+1 and t-1 to t in all six
announcement types. For the assignment group, the number of positive returns in the
event windows (t-20, t+20) is significantly lower than the number of negative returns
(3:12). The CAAR for the period t-20 to t+20 is significantly negative at -10.38%.
This result is in contrast to the result of Elayan et al. (2003). This suggests that the
negative returns could be driven by other fundamental economic variables rather than
the rating announcements in this research. The result for the group of affirmation is
consistent with the expectation of the researcher and the finding of Elayan et al
(2003). There were no significant CAARs and Z tests.
[Insert Table 2 around here]
For the upgrade credit rating announcements, the mean values of CAAR for the
period (t+1, t+10) and (t+1, t+20) are 5.36% and 5.39% respectively, both are
significantly greater than zero. The positive to negative ratio is 7:2, which is also
significant as Rank Z test indicates. This result is in consistent with the expectation
and the result of Elayan et al. (2003). It may suggest that the market take longer times
to absorb the credit rating information. An investor could earn significant positive
returns after twenty days of the announcement. For the group with positive outlook
information, it is quite surprising that during the period (t-20, t-2) and (t-5, t-2) the
CAARs are significantly negative, they are –8.83% and –5.97% respectively, the
positive to negative ration are both 0:6 and the Rank Z tests are both significant. It
would appear that inventors overlooked the positive credit information and were still
pessimistic about the future returns of the stocks. From this point of view, the results
are consistent with the group of rating assignments, suggesting that there may be
some important factors that drive the negative returns.
The CAARs of downgraded group are insignificant, indicating that the market had
already anticipated the information provided by the rating agencies, therefore there
are no abnormal returns. This output also contradicts the researcher’s anticipation and
is in contrast to the findings of previous studies (Holthausen et al, 1985, Glascock et
al, 1997, Elayan et al, 1990, 2003, Matolcsy et al, 1995, Barron et al, 1997, and Hand
et al, 1992). The results for the group of negative outlook are interesting. After the
event day, the CAARs of (t+1, t+10) and (t+1, t+20) are both significantly positive.
CAAR (t+1,t+20) has significantly positive value of 6.24%. Rank Z tests for these
two periods are both insignificant. These results suggest that the investors had
realized the negative outlooks for the stocks before the announcement day, but they

overreacted the news and those positive returns after the event day were just the
correction of their overreaction. This finding also contradicts to the previous
empirical evidence that significant negative returns are associated with negative news.
4.2 Cross-Sectional Regression Results
Table 3 shows the results from multiple regressions for the three different groups that
represent neutral, positive, and negative credit rating assignments. The dependent
variables are CAARs at period t-1 to t+1 and period t-1 to t. In the neutral regression
model, the only significant variable is Size. Large firms have higher CAARs than the
small firms during the credit assignments and affirmations announcements. The
regression can explain 21% and 27% of the variation in the CAARs. For the positive
regression model, the adjusted R-squares are negative and the F-statistics are only
0.49 and 0.85 respectively. This indicates that the explanatory power of this model is
poor. While all of the four variables are not significant, their coefficient sign are
consistent with the expectations, i.e. stronger stock price reaction for large, high
leverage, low book-to-market ratio and non-ADR traded firms.
[Insert Table 3 around here]
Similarly, the two negative regressions have no explanatory power with the F-
statistics of 0.15 and 0.86 respectively and the four variables are all insignificant. The
coefficient signs of leverage and the ADR dummy in the period t-1 to t+1 are different
from the coefficients in the period t-1 to t. When the category variable is included
and all of the credit announcements are regressed together, the coefficient of category
variable (D) or the informational value of credit rating announcements, are not
statistically significant and their signs are not consistent to what we expected.
Generally, the poor explanatory power of the firm characteristics variable such as
size, leverage, book-to-market value, and the ADR listed dummy, are no surprised
because the CAARs surrounding credit rating announcement date are not statistically
different from zero.
4.3 Long-term Excess Returns Results
Table 4 presents the information ratios and t-Statistics for the six event groups during
the 2-month, 4-month, and 6-month periods after the credit rating announcements.
The excess returns of the assignment and affirmation groups are not statistically
different from zero with the information ratios (IR) from –0.29 to 0.29. These results
are consistent with the expectations. For the upgrades group, the highest IR, 0.48, is
in the 2-month period, indicating that the stocks takes about 2 –month time to adjust
its prices to reflect the credit information. Unlike the short-term event study test, for
the downgrades group, all the excess returns are significant negative. The associated
information ratios are from –0.59 to –0.90 indicating the “bad” performance. These
results are in line with the expectations.
[Insert Table 4 around here]
There are no significant excess returns and information ratios for the positive
outlooks. It is noted that there are also no significant short-term CAARs for this
group. The results imply that the positive outlook credit announcements have a little
effect to the stocks’ prices adjustment. For the negative outlooks group, it is
surprising that the 2-month excess return is positive and significant with the IR of
0.54 indicating the “good” performance. These results are consistent with the short-
term event-study. This interesting outcome may provide evidence of the overreaction
in the Swedish share market. The investors slowly realize their overreaction before
the bad news, so the returns are positive after the announcement day. In conclusion,
the long-term stock reaction to the credit announcements is consistent with the short-
term reaction. However, unlike the short-term reaction, the downgrades group shows
the significant long-term negative return after the announcements days. Credit rating
announcements seem to provide some informational content to the stock market. The
extent of the stock market reaction varies depending on the type of credit rating
information. The long-term test results indicate that the new credit information is not
instantaneously absorbed by the stocks prices and the adjustment process continues
after the rating announcement for a significant period. It should be noted that the
long-term results only provide the indication of the effects of credit rating
announcements since there are many factors that may affect the stock returns in the
long term.
5. Conclusion
This research investigated the issue whether credit announcements provide any
informational value to investors. Under the semi-strong market efficiency, the rating
agencies, who only exploit the public information, are considered to have no
informational value to investors. Previous studies with respect to this topic have
shown the mixed results. Studies on the US, the UK, and the Australia stock market
demonstrated that positive news were associated with positive cumulative average
abnormal returns (CAAR), but the negative credit announcements have a little effect
to the CAARs. The study in the small open economy- the New Zealand stock market-
indicated that positive (negative) news generated positive (negative) CAARs. In the
Swedish share market the total number of stocks is about at the same level as that of
the New Zealand market, but its the total value of shares is about as twenty-six times
much as the New Zealand market, indicating that its liquidity is much more than the
New Zealand market. Because the high liquid stock market generally has low
asymmetric information, the impacts of credit rating announcements are expected to
become weaker in Swedish share market. This statement is well supported from the
event-study results, where the CAARs of all six events are all insignificant, so it is no
surprise to see a low the explanatory power of the firm characteristics in the cross-
sectional regression. Nevertheless, firm size can explain the variation of CAARs for
the cases of credit assignments and confirmations. However, there is significantly
negative CAAR during the period (t-20, t+20) for the rating assignment group, and
significantly positive CAARs during the event period (t+1, t+10) and (t+1, t+20) for
the upgrade group. This result may suggest that the Swedish share market may
slowly absorb the credit information announcements. For the negative outlook group,
the CAARs are significantly positive in 10 and 20 days after announcement date,
suggesting that the market has already anticipated the negative return but overreacted
to the negative news.
Moreover, for the credit upgrade, there is significant positive average excess return
two months after the announcement day and the IR is as much as the “good” level
(0.5). Similarly, for the credit downgrades, the associated information ratios indicate
the “bad” performance (from –0.591 to –0.899). In summary, although the event
study shows no significant CAARs in all credit rating announcement types during the
two and three days surrounding announcement periods, the credit rating
announcements may provide some informational content to the stock market,
especially the case of credit upgrade and credit downgrade.

References
Barron, M.J., Clare, A.D., and Thomas, S.H., 1997. “The Effect of Bond Rating Changes and New Ratings on UK Stock Returns.” Journal of Business Finance & Accounting, 24: 497-509.
Cornell, B., W. Landsman and A. Shapiro, 1989. “Cross-Sectional Regularities in the
Response of Stock Prices to Bond Rating Changes.” Journal of Accounting, Auditing, and Finance, 4: 460-479.
Danos, P., D.L., Holt, and E.A., Imhoff, Jr., 1984. “Bond Raters’ Use of Management
Financial Forecasts: An Experiment in Expert Judgment.” The Accounting Review, 59: 547-573.
Dichev, I. D. and Piotroski, J. D., 2001. “The Long-Run Stock Returns Following
Bond Ratings Changes.” Journal of Finance 56: 173-203. Ederington, L. and J. Yawitz, 1991. “The Bond Rating Process.” In E. Altman (ed.),
The Financial Handbook, 6th ed. Elayan, F. A., Maris, B. A., and Maris, J. B., 1990. “Common Stock Response to
False Signal from CreditWatch Placement.” Quarterly Journal of Business and Economics 29: 16-35.
Elayan, F. A., Maris, B. A., and Young, P. J., 1996. “The Effect of Commercial Paper
Rating Changes and CreditWatch Placement on Common Stock Prices.” The Financial Review 31: 149-167.
Elayan, Fayez A., Wei-Huei Hsu and Thomas O. Meyer, 2003. "The Information
Effect of Credit Rating Announcements on Share Prices in a Small Market", Journal of Economics and Finance, (forthcoming).
Ellis, D., 1998. “Different Sides of the Same Story: Investors’ and Issuer’s Views of
Rating Agencies.” Journal of Fixed Income 7: 35-46. Grier, P. and Katz S., 1976. “The Differential Effects of Bond Rating Change among
Industrial and Public Utility Bonds by Maturity.” Journal of Business 49: 226-239.
Griffin, P. A. and Sanvicente A. Z., 1982. “Common Stock Returns and Rating Changes: A Methodological Comparison.” Journal of Finance 37:103-119.
Glascock, J. L., Davidson III, W. N., and Young, P. J., 1987. “Announcement Effects
of Moody’s Bond Rating Changes on Equity Returns.” Quarterly Journal of Business and Economics 26: 67-78.
Grinold, R. C., and Kahn R. H., 1995. Active Portfolio Management. Chicago, IL:
Richard D. Irwin. Hand, J. R. M., Holthausen, R. W., and Leftwich, R. W., 1992. “The Effect of Bond
Rating Agency Announcements on Bond and Stock Prices.” Journal of Finance 47: 733-752.
Holthausen, R. W. and Leftwich R. W., 1985. “The Effect of Bond Rating Changes
on Common Stock Prices.” Journal of Financial Economics 17: 57-89. Hsueh, L. P. and Kidwell, D, 1988. “Bond Ratings: Are Two Better than One?”
Financial Management 17: 46-53. Ingram, R. W., Brooks, L.D. and Copeland, R. M., 1983. “The Information Content of
Municipal Bond Rating Change: A Note.” Journal of Finance 38: 997-1003. Kapland, R.S and Urwitz Gabriel, 1979. “ Statistical Models of Bond Ratings: A
Methodological Inquiry.” The Journal of Business 52: 231-261. Katz Steven, 1974. “The Price and Adjustment Process of Bonds to Rating
Reclassifications: A Test of Bond Market Efficiency.” Journal of Finance 29:551-559.
Kliger, D. and Sarig, O., 2000. “The Information Value of Bond Ratings.” Journal of
Finance 55: 2879-2902. Matolcsy, Z. P. and Lianto, T., 1995. “The Incremental Information Content of Bond
Rating Revisions: The Australia Evdidence.” Journal of Banking & Finance, 19: 891-902.
Megginson, W. L., and Weiss, K., 1991. “Venture Capital Certification in Initial
Public Offerings.” Journal of Finance 46: 879-903. Partnoy, J., 1999. “The Siskel and Ebert of Financial Markets: Two Thumbs Down
for the Credit Rating Agencies.” Washington University Law Quarterly 77:619-712.
Pinches, G. E. and J. C. Singleton, 1978. “The Adjustment of Stock Prices to Bond
Rating Changes.” Journal of Finance 33: 29-44. Stickel, S, 1986. “The Effect of Preferred Stock Rating Changes on Preferred and
Common Stock Changes.” Journal of Accounting and Economics 15: 31-60. Wakeman, L. M, 1981. “The Real Function of Bond Rating Agencies.” Chase
Financial Quarterly: 18-26. Wansley J.W. and Clauretie M., 1985. “The Impact of CreditWatch Placement on
Equity Returns and Bond Prices.” The Journal of Financial Research 8:31-42. Weinstein, Mark, 1977. “The Effect of a Rating Change Announcement on Bond
Price.” Journal of Financial Economics 5: 329-350.
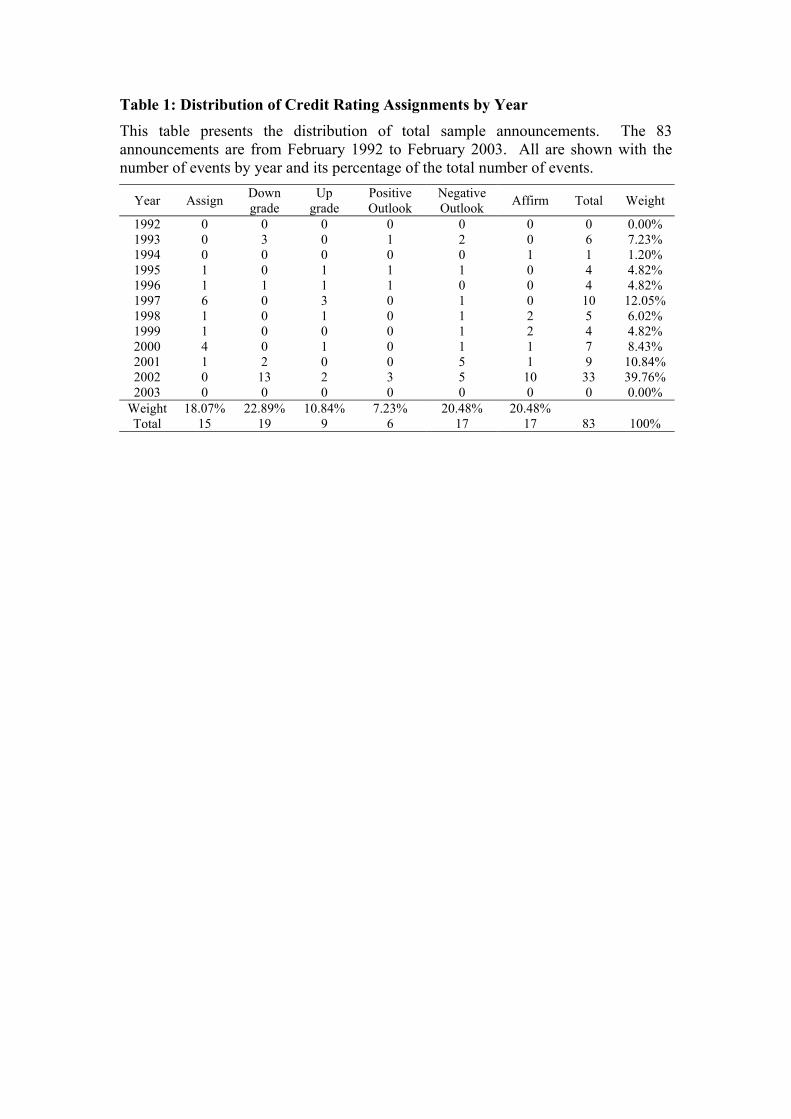
Table 1: Distribution of Credit Rating Assignments by Year This table presents the distribution of total sample announcements. The 83 announcements are from February 1992 to February 2003. All are shown with the number of events by year and its percentage of the total number of events.
Year Assign Down grade
Up grade
Positive Outlook
Negative Outlook Affirm Total Weight
1992 0 0 0 0 0 0 0 0.00% 1993 0 3 0 1 2 0 6 7.23% 1994 0 0 0 0 0 1 1 1.20% 1995 1 0 1 1 1 0 4 4.82% 1996 1 1 1 1 0 0 4 4.82% 1997 6 0 3 0 1 0 10 12.05% 1998 1 0 1 0 1 2 5 6.02% 1999 1 0 0 0 1 2 4 4.82% 2000 4 0 1 0 1 1 7 8.43% 2001 1 2 0 0 5 1 9 10.84% 2002 0 13 2 3 5 10 33 39.76% 2003 0 0 0 0 0 0 0 0.00%
Weight 18.07% 22.89% 10.84% 7.23% 20.48% 20.48% Total 15 19 9 6 17 17 83 100%
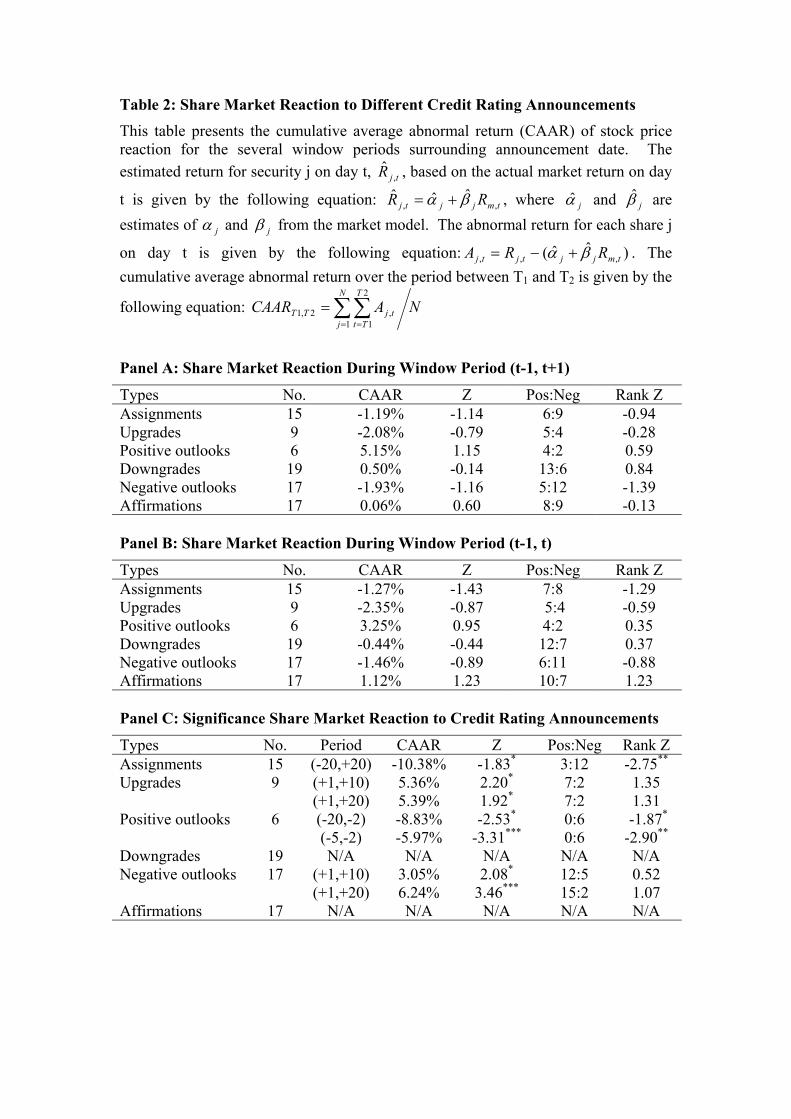
Table 2: Share Market Reaction to Different Credit Rating Announcements This table presents the cumulative average abnormal return (CAAR) of stock price reaction for the several window periods surrounding announcement date. The estimated return for security j on day t, , based on the actual market return on day
t is given by the following equation: , where tjR ,
ˆ
jR ,ˆ
tmjjt R ,ˆˆ βα += jα̂ and are
estimates of jβ̂
jα and jβ from the market model. The abnormal return for each share j
on day t is given by the following equation: . The cumulative average abnormal return over the period between T
)β̂+ˆ( ,, tmjjtj RR α−,tjA =
1 and T2 is given by the
following equation: NA tj ,CAAR N
j
T
TtTT ∑∑
= =
=1
2
12,1
Panel A: Share Market Reaction During Window Period (t-1, t+1)
Types No. CAAR Z Pos:Neg Rank Z Assignments 15 -1.19% -1.14 6:9 -0.94 Upgrades 9 -2.08% -0.79 5:4 -0.28 Positive outlooks 6 5.15% 1.15 4:2 0.59 Downgrades 19 0.50% -0.14 13:6 0.84 Negative outlooks 17 -1.93% -1.16 5:12 -1.39 Affirmations 17 0.06% 0.60 8:9 -0.13 Panel B: Share Market Reaction During Window Period (t-1, t)
Types No. CAAR Z Pos:Neg Rank Z Assignments 15 -1.27% -1.43 7:8 -1.29 Upgrades 9 -2.35% -0.87 5:4 -0.59 Positive outlooks 6 3.25% 0.95 4:2 0.35 Downgrades 19 -0.44% -0.44 12:7 0.37 Negative outlooks 17 -1.46% -0.89 6:11 -0.88 Affirmations 17 1.12% 1.23 10:7 1.23 Panel C: Significance Share Market Reaction to Credit Rating Announcements
Types No. Period CAAR Z Pos:Neg Rank Z Assignments 15 (-20,+20) -10.38% -1.83* 3:12 -2.75** Upgrades 9 (+1,+10) 5.36% 2.20* 7:2 1.35 (+1,+20) 5.39% 1.92* 7:2 1.31 Positive outlooks 6 (-20,-2) -8.83% -2.53* 0:6 -1.87* (-5,-2) -5.97% -3.31*** 0:6 -2.90** Downgrades 19 N/A N/A N/A N/A N/A Negative outlooks 17 (+1,+10) 3.05% 2.08* 12:5 0.52 (+1,+20) 6.24% 3.46*** 15:2 1.07 Affirmations 17 N/A N/A N/A N/A N/A
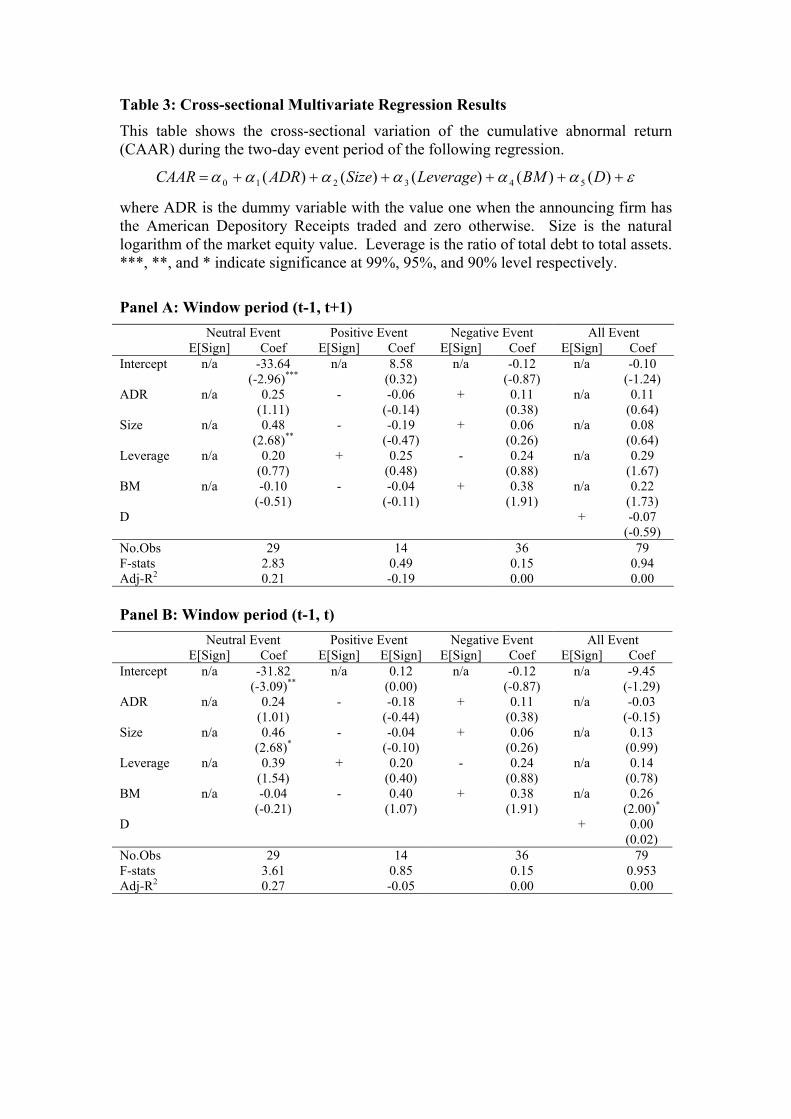
Table 3: Cross-sectional Multivariate Regression Results This table shows the cross-sectional variation of the cumulative abnormal return (CAAR) during the two-day event period of the following regression.
εαααααα ++++++= )()()()()( 543210 DBMLeverageSizeADRCAAR
where ADR is the dummy variable with the value one when the announcing firm has the American Depository Receipts traded and zero otherwise. Size is the natural logarithm of the market equity value. Leverage is the ratio of total debt to total assets. ***, **, and * indicate significance at 99%, 95%, and 90% level respectively.
Panel A: Window period (t-1, t+1) Neutral Event Positive Event Negative Event All Event E[Sign] Coef E[Sign] Coef E[Sign] Coef E[Sign] Coef Intercept n/a -33.64 n/a 8.58 n/a -0.12 n/a -0.10 (-2.96)*** (0.32) (-0.87) (-1.24) ADR n/a 0.25 - -0.06 + 0.11 n/a 0.11 (1.11) (-0.14) (0.38) (0.64) Size n/a 0.48 - -0.19 + 0.06 n/a 0.08 (2.68)** (-0.47) (0.26) (0.64) Leverage n/a 0.20 + 0.25 - 0.24 n/a 0.29 (0.77) (0.48) (0.88) (1.67) BM n/a -0.10 - -0.04 + 0.38 n/a 0.22 (-0.51) (-0.11) (1.91) (1.73) D + -0.07 (-0.59) No.Obs 29 14 36 79 F-stats 2.83 0.49 0.15 0.94 Adj-R2 0.21 -0.19 0.00 0.00 Panel B: Window period (t-1, t) Neutral Event Positive Event Negative Event All Event E[Sign] Coef E[Sign] E[Sign] E[Sign] Coef E[Sign] Coef Intercept n/a -31.82 n/a 0.12 n/a -0.12 n/a -9.45 (-3.09)** (0.00) (-0.87) (-1.29) ADR n/a 0.24 - -0.18 + 0.11 n/a -0.03 (1.01) (-0.44) (0.38) (-0.15) Size n/a 0.46 - -0.04 + 0.06 n/a 0.13 (2.68)* (-0.10) (0.26) (0.99) Leverage n/a 0.39 + 0.20 - 0.24 n/a 0.14 (1.54) (0.40) (0.88) (0.78) BM n/a -0.04 - 0.40 + 0.38 n/a 0.26 (-0.21) (1.07) (1.91) (2.00)*
D + 0.00 (0.02) No.Obs 29 14 36 79 F-stats 3.61 0.85 0.15 0.953 Adj-R2 0.27 -0.05 0.00 0.00
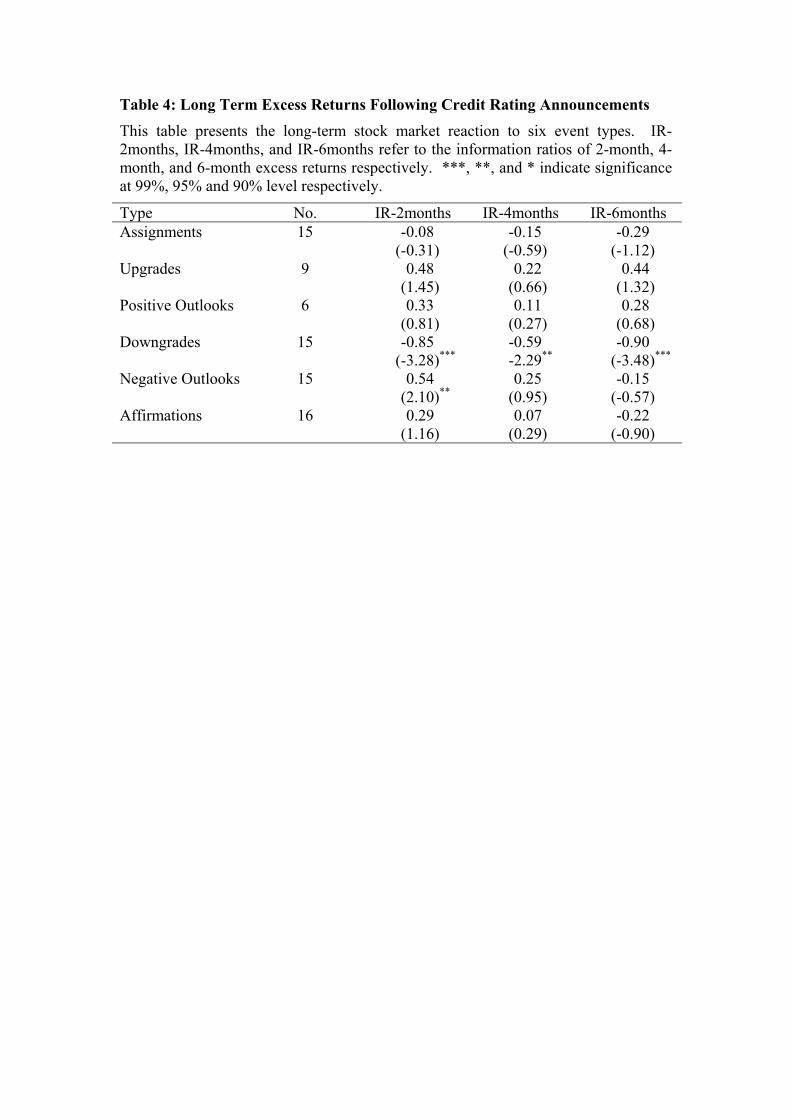
Table 4: Long Term Excess Returns Following Credit Rating Announcements This table presents the long-term stock market reaction to six event types. IR-2months, IR-4months, and IR-6months refer to the information ratios of 2-month, 4-month, and 6-month excess returns respectively. ***, **, and * indicate significance at 99%, 95% and 90% level respectively.
Type No. IR-2months IR-4months IR-6months Assignments 15 -0.08 -0.15 -0.29 (-0.31) (-0.59) (-1.12) Upgrades 9 0.48 0.22 0.44 (1.45) (0.66) (1.32) Positive Outlooks 6 0.33 0.11 0.28 (0.81) (0.27) (0.68) Downgrades 15 -0.85 -0.59 -0.90 (-3.28)*** -2.29** (-3.48)***
Negative Outlooks 15 0.54 0.25 -0.15 (2.10)** (0.95) (-0.57) Affirmations 16 0.29 0.07 -0.22 (1.16) (0.29) (-0.90)