bis working papers · bis working papers no 207 the price impact of rating announcements: which...
TRANSCRIPT
BIS Working Papers No 207
The price impact of rating announcements: which announcements matter? by Marian Micu, Eli Remolona and Philip Wooldridge
Monetary and Economic Department June 2006
Abstract Credit rating agencies make multiple announcements, some of which are intended to reflect the latest information available about a firm and others of which are intended to provide a stable signal of credit quality. Using data on CDS spreads, we examine which of these different types of rating announcements contains pricing-relevant information. We find that all types, including changes in outlook, have a significant impact on CDS spreads. Even rating announcements preceded by similar announcements have an impact. The price impact is greatest for firms with split ratings, small-cap firms and firms rated near the threshold of investment grade. JEL Classification Numbers: G14. Keywords: Credit default swaps; credit ratings; event study; market reaction.

BIS Working Papers are written by members of the Monetary and Economic Department of the Bank for International Settlements, and from time to time by other economists, and are published by the Bank. The views expressed in them are those of their authors and not necessarily the views of the BIS.
Copies of publications are available from:
Bank for International Settlements Press & Communications CH-4002 Basel, Switzerland E-mail: [email protected]
Fax: +41 61 280 9100 and +41 61 280 8100
This publication is available on the BIS website (www.bis.org).
© Bank for International Settlements 2006. All rights reserved. Brief excerpts may be reproduced or translated provided the source is cited.
ISSN 1020-0959 (print)
ISSN 1682-7678 (online)

iii
Contents
1. Introduction ....................................................................................................................................1 2. Types of rating announcements.....................................................................................................1 3. Literature review.............................................................................................................................3
Information content hypothesis I..........................................................................................3 Information content hypothesis II.........................................................................................4 Differential information hypothesis.......................................................................................5 Price pressure hypothesis ...................................................................................................5
4. Sample and methodology ..............................................................................................................6 Data ...................................................................................................................................6 Event window.......................................................................................................................7 Calculation of daily returns ..................................................................................................7 Calculation of abnormal returns...........................................................................................9 Test statistics .......................................................................................................................9
5. Empirical results...........................................................................................................................11 Negative rating announcements ........................................................................................11 Positive rating announcements..........................................................................................13
6. Conclusions..................................................................................................................................13 References .............................................................................................................................................14

1
The price impact of rating announcements: which announcements matter?
Marian Micu, Eli Remolona and Philip Wooldridge
1. Introduction1
When pronouncing on an issuer’s creditworthiness, rating agencies face a trade-off between timeliness and volatility. Information material to assessing an issuer’s creditworthiness arrives at a high frequency, and so credit ratings must be continually updated if they are to incorporate the latest information. Yet, such updating increases the volatility of credit ratings. Rating agencies attempt to balance these conflicting goals by making multiple announcements, some of which are intended to reflect the latest information and others of which are intended to provide a stable signal of credit quality. In this paper, we examine which, if any, of these different types of rating announcements contain pricing-relevant information. In particular, we examine the impact of various rating announcements on credit default swap (CDS) spreads.
We extend the literature on the price impact of rating announcements in three ways. First and foremost, whereas most previous studies focussed on the price impact of rating changes, ie upgrades and downgrades, we consider outlooks and reviews as well. Second, we control for events that might foreshadow a rating announcement, in particular a similar announcement by the same or another rating agency. Third, we apply traditional event study methodology to the fast growing CDS market.
We find that all types of rating announcements, whether negative or positive, have a significant impact on CDS spreads. Investors appear to value both a timely signal of possible changes in creditworthiness as well as a stable signal of underlying creditworthiness. The impact is greatest when an issuer is placed on review for a downgrade and is non-negligible even when a rating announcement is preceded by a similar announcement. Notably, to our knowledge ours is the first study to find that changes in outlooks have a significant price impact. Furthermore, our results indicate that the price impact of rating announcements derives not only from their information content but also from buying and selling pressure by restricted investors. Thus, rating announcements have the largest impact on issuers at risk of being downgraded to speculative grade or upgraded to investment grade.
The following section defines the various types of rating announcements. Section 3 outlines the reasons why ratings might be expected to have an impact on asset prices and reviews the existing literature. Section 4 discusses our sample and methodology. Section 5 presents the empirical results and section 6 concludes.
2. Types of rating announcements
Rating agencies provide investors with an opinion about an issuer’s capacity to meet its financial obligations. This opinion is encapsulated in a credit rating.2 A credit rating is not a precise measure of
1 Corresponding author: Philip Wooldridge, Monetary and Economic Department, Bank for International Settlements, Basel,
Switzerland, CH-4002, tel +41 61 280 8819, fax +41 61 280 9100, email [email protected]. This paper is a revised and extended version of an article published in the BIS Quarterly Review in June 2004 entitled “The price impact of rating announcements: evidence from the credit default swap market.” Thanks are due to Jeff Amato, Claudio Borio, Jacob Gyntelberg, Frank Packer and participants in seminars at the Bank for International Settlements and the European Financial Management Association Annual Conference 2005 for helpful comments. All errors remain our own. The views expressed in this paper are those of the authors and do not necessarily reflect those of the Bank for International Settlements.

2
default risk but instead facilitates comparisons across issuers by means of standardised risk categories.
The largest international rating agencies are Standard & Poor’s (S&P), Moody’s Investors Service and Fitch Ratings. All three agencies rate a wide variety of issuers and structures in markets around the world. Each agency defines its own risk categories but the correspondence between the three agencies’ ratings is well understood by market participants. Moody’s top rating of Aaa is generally regarded as equivalent to AAA from either S&P or Fitch (Table 1). The threshold of investment-grade debt, below which investments are often labelled speculative in nature, corresponds to a rating of Baa3 from Moody’s and BBB– from S&P and Fitch. Below B3 or B– rating agencies’ risk categories differ in significant ways and so it is difficult to compare the lowest ratings. For example, Moody’s lowest ratings reflect expected recovery values as well as default risk whereas S&P’s and Fitch’s lowest ratings reflect only default risk.
Credit ratings are intended to reflect an issuer’s underlying or long-term creditworthiness. It is for this reason that rating agencies are often said to “rate through the cycle”. Rating decisions are typically not influenced by events whose impact on credit quality is expected to be temporary, such as a slowdown in economic growth; whose impact is uncertain, such as a prospective merger; or whose impact might be reversible, such as a decline in profit margins. Therefore, rating changes are frequently driven by stale information. In a random sample of 30 downgrades over the 2001-04 period, we find that only 10% make reference to new developments; the remainder relate to longer-term financial trends or previously released information. Similarly, Weinstein (1977) finds that, in a sample of 100 rating changes by Moody’s over the 1962-74 period, at least 65% of the announcements constitute a reaction to information that is already publicly available.
In contrast to credit ratings, debt and equity prices rapidly incorporate any information relevant to assessing a firm’s operating and financial conditions – including information about temporary, uncertain and reversible events. When new information becomes available, investors revise their forecasts and prices move accordingly. Therefore, market prices are more timely indicators of changes in credit quality than credit ratings. Yet, owing to this continual updating, market prices are also more volatile indicators. There is a growing microstructure literature that links the volatility of returns to the frequency with which information arrives in the market (Ross (1989), Kalev et al (2004)).
To meet investors’ demand for more timely indicators than credit ratings but less volatile indicators than market prices, in the 1980s rating agencies introduced two other types of rating announcements: outlooks and reviews.3 Whereas a rating change signals a fundamental change in an issuer’s creditworthiness, rating reviews and outlooks forewarn investors of possible changes in creditworthiness. More specifically, a rating outlook reflects a rating agency’s prognosis regarding the likely direction of an issuer’s credit quality over the medium term, usually over a two year horizon. An outlook is modified when a change in an issuer’s risk profile has been observed but is not yet regarded as permanent enough to warrant a new credit rating. A positive outlook indicates that an issuer’s rating is likely to be raised; a negative outlook indicates that it is likely to be lowered; a stable outlook indicates that the rating is unlikely to change; and a developing or evolving outlook indicates that the rating may be raised or lowered.
Reviews give a stronger indication than outlooks of future changes in ratings. When a rating is placed by S&P on “CreditWatch”, by Moody’s on a “Watchlist” or by Fitch on “RatingAlert”, it indicates that there is a very high probability that the issuer will be downgraded or upgraded.4 An issuer might be placed on review when a significant event has occurred, such as a merger, regulatory action or unexpected deterioration in profitability, but the impact of the event on an issuer’s underlying creditworthiness is not yet clear. In a random sample of 30 negative reviews over the 2001-04 period, we find that 60% refer to a recent announcement by the company. Rating agencies typically aim to conclude a review within 90 days, after receiving additional information to clarify the impact of the event.
3 Moody’s started to rate bonds in 1909 but only began announcing reviews in 1985 (and did not consider reviews formal
rating actions until 1991). Standard and Poor’s introduced reviews in 1981 and outlooks in 1986. 4 In addition to reviews for possible upgrades or downgrades, agencies sometimes place ratings on review when the direction
of the change is uncertain (“evolving” or “developing”).
3
Credit ratings need not be on review to be changed. Agencies at times upgrade or downgrade issuers without any prior announcement of a review or a change in outlook. Likewise, a review or a change in outlook does not always lead to a change in rating. Issuers at times forestall a change in rating by taking actions to address rating agencies’ concerns or by providing sufficient information to alleviate those concerns.
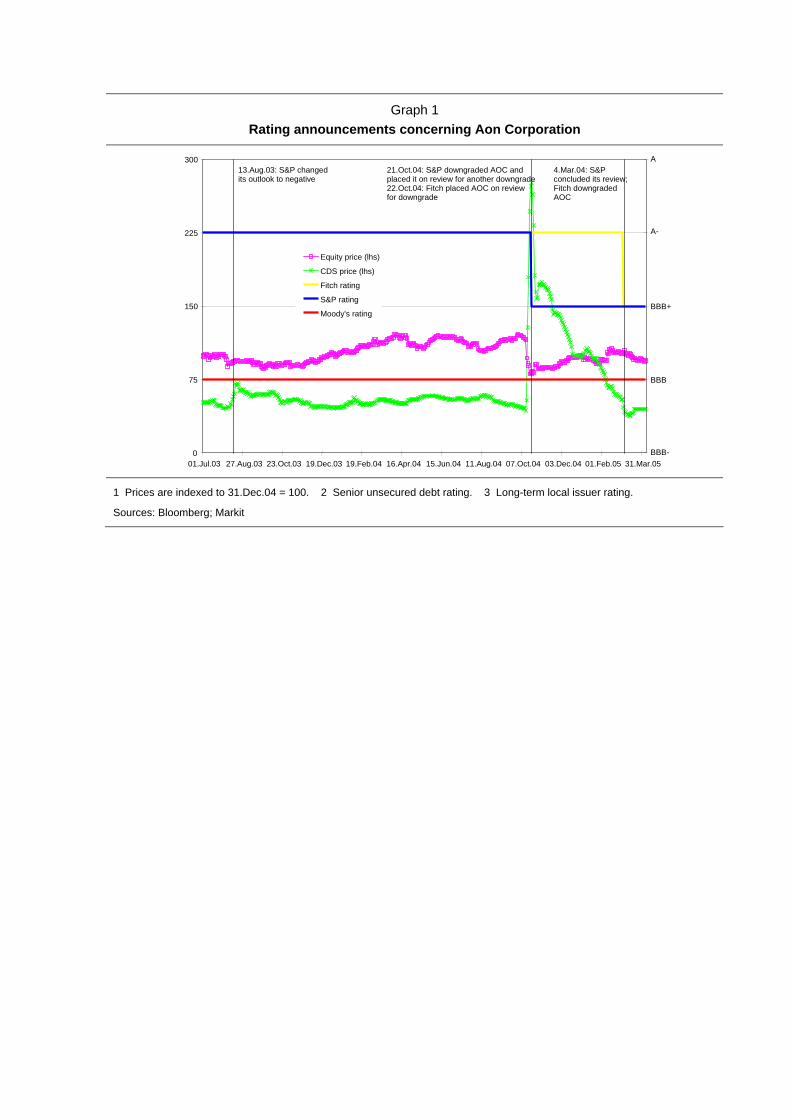
A typical sequence of rating announcements is illustrated in Graph 1. S&P changed its rating outlook on US insurance broker Aon to negative in August 2003 following an earnings report which indicated that Aon’s profit margins were below those of its competitors. In October 2004 S&P downgraded Aon and placed the company’s rating on review for another downgrade after regulators announced an investigation into its business practices. The review was concluded in March 2005 when Aon reached a settlement with regulators. Following the settlement, S&P left Aon’s rating unchanged but Fitch downgraded the company.
3. Literature review
Credit rating agencies are widely perceived to exert a significant influence in financial markets. US Senator Joe Lieberman (2002) echoed the views of many market participants and observers when he opined that rating agencies “wield immense, quasi-government power to determine which companies within the corporate world are creditworthy and which are not.” A sizeable literature on the price impact of rating announcements has emerged over the past three decades, and many of these studies provide empirical support for this perception.
Information content hypothesis I
The focus of much of the academic literature on credit ratings is on whether rating announcements contain pricing-relevant information. Rating agencies enjoy privileged access to information about issuers and consequently rating announcements potentially convey new information to market participants. Rating agencies gather information about issuers’ operating and financial conditions from company reports and other public sources as well as through confidential discussions with issuers. Indeed, in the United States rating agencies are exempt from the Securities and Exchange Commission’s fair disclosure regulation. Introduced in 2000, Regulation FD prohibits firms from making selective non-public disclosures to market participants but allows them to share non-public information with rating agencies.5 Issuers might choose to communicate sensitive information to investors and creditors through confidential discussions with rating agencies rather than through full public disclosure so as to avoid disclosing details to, for example, their competitors (Griffin and Sanvicente (1982); Ederington, Yawitz and Roberts (1987)).
If rating announcements do convey new information, then negative announcements – downgrades, reviews for downgrade and negative outlook changes – should result in a widening of credit spreads. Similarly, positive announcements – upgrades, reviews for upgrade and positive outlook changes – should result in a tightening of credit spreads. The impact should be the same for both yield spreads between corporate and government bonds and credit default swap (CDS) prices, although differences in the liquidity of corporate bonds and CDSs might affect the speed of adjustment in the two markets.6
The potential impact of rating announcements on equity prices is more ambiguous and depends on the reason for the announcement (Goh and Ederington (1993)). Rating announcements motivated by changes in the issuer’s financial prospects, such as prospective earnings growth, should have the same impact in equity markets as in corporate bond markets; negative announcements should cause
5 Similarly, the code of conduct for rating agencies promulgated by the International Organisation of Securities Commissions
recognises that issuers might share confidential information with rating agencies and recommends that rating agencies use such information only for purposes related to their rating activities.
6 A credit default swap is in essence an insurance contract protecting against losses arising from a default. In a CDS contract, the buyer of credit protection pays to the seller of protection a periodic fee analogous to the spread between the yield on a defaultable security and the risk-free interest rate. In the event that the reference entity defaults, the buyer typically delivers to the seller debt owed by the reference entity in return for a lump sum equal to the face value of the debt.

4
equity prices to fall and positive announcements equity prices to rise. However, rating announcements motivated by changes in leverage should have opposite effects in equity and corporate bond markets. An increase in financial leverage transfers wealth from debt holders to equity holders by increasing the expected returns to equity holders and reducing the returns to debt holders. Therefore, negative announcements motivated by an increase in leverage should result in a rise in equity prices and positive announcements motivated by a decline in leverage a fall in equity prices. Most of the negative rating announcements during our sample period were motivated by changes in the issuer’s financial prospects, and so we would expect negative announcements to lead to a fall in equity prices on average. However, those that were related to an increase in leverage might dampen the average announcement effect.
It is equally possible that rating announcements have no impact on credit spreads or equity prices. Notwithstanding rating agencies’ privileged access, other factors might negate the informational value of rating announcements. First, some market participants, in particular banks and corporate insiders, also enjoy privileged access to information. Second, rating agencies might react with a lag to new information. As discussed in section 2, credit ratings could reflect stale or incomplete information. Conflicts of interest could also dissuade rating agencies from acting upon pricing-relevant information in a timely manner. Rating agencies purport to provide investors with independent credit analysis. Yet, rating agencies have a financial incentive to act in the interest of issuers rather than investors because most of their revenues are generated from services sold to issuers. In particular, issuers pay for the assignment of credit ratings and decide which agencies to solicit for a rating. This financial arrangement could lead rating agencies to seek favour with issuers, for example by delaying the announcement of a downgrade. That being said, concern for their reputation provides rating agencies with a countervailing incentive to act in the interest of investors.
There is considerable evidence that rating announcements, in particular reviews for downgrade and downgrades, do in fact impart new information relevant to the formation of prices. Results from the earliest empirical studies were mixed. Whereas Katz (1974) finds that bond investors do not anticipate rating changes and react with a delay to the announcement of such changes, Weinstein (1977) finds no evidence of a reaction to rating changes. Later studies were more conclusive. Hand et al (1992) conclude that the announcement of a downgrade results in a statistically significant adjustment of corporate bond and equity prices. Kliger and Sarig (2000) find that corporate bond and equity prices react to Moody’s refinement of its rating categories in April 1982, when it introduced numeric modifiers. Based on a sample of international bonds, Steiner and Heinke (2001) find that both downgrades and reviews for downgrade impact prices. Hull et al (2004) and Norden and Weber (2004) conclude that the reaction of credit default swap prices is most pronounced for reviews for downgrade. Ammer and Clinton (2004) examine the impact of credit ratings on the pricing of asset-backed securities and find a significant negative reaction to downgrades.
Notably, with the exception of Katz (1974) and Kliger and Sarig (2000), in none of the aforementioned studies are rating upgrades or reviews for upgrade found to have a significant impact on prices. Furthermore, even while finding that negative announcements have an impact, most of the recent studies conclude that market participants anticipate rating announcements; most of the price adjustment takes place long before any announcement by a rating agency. Covitz and Harrison (2003) estimate that approximately 75% of the change in bond spreads occurs in the six months prior to a rating downgrade.
A few studies find that rating announcements have different effects in equity and credit markets. Goh and Ederington (1993) were the first to test whether the reaction of equity prices depends upon the reason for the rating announcement. They find that equity prices fall in response to downgrades motivated by a deterioration in the issuer’s financial prospects but do not react to downgrades motivated by an increase in leverage. Kliger and Sarig (2000) conclude that rating announcements cause bond and equity prices to move in opposite directions and so do not impact the value of the firm; debt prices rise and equity prices fall when Moody’s announces better-than-expected ratings.
Information content hypothesis II
A second question closely related to the previous question is whether two credit ratings are more informative than one. Or more generally, whether two rating announcements are more informative than one. Rating changes are often (but not always) preceded by other rating announcements which may foreshadow the new rating. If a series of rating announcements is motivated by the same information, then only the first announcement should convey pricing-relevant information.
5
A rating change may be foreshadowed by another announcement by the same agency. As previously mentioned, reviews typically result in a rating change within a few weeks. Alternatively, a rating change by one agency may be foreshadowed by another agency’s rating announcement. Rating agencies often do not act at the same time. In a sample of over 2600 downgrades by the three largest rating agencies in the period between January 2004 and March 2005, 5% were preceded within 60 business days by a rating announcement by the same agency and 25% by an announcement by a different agency (Table 2).
One of the few previous studies to control for different rating announcements both within and across the three major agencies is Norden and Weber (2004). They find that reviews for downgrade by Moody’s and S&P are associated with significant abnormal movements in equity and credit default swap prices, whereas actual downgrades are not. Hull et al (2004) obtain a similar result, although they examine only rating announcements by Moody’s. Norden and Weber (2004) also find that the reaction of equity and credit default swap prices to rating announcements is more pronounced if no other rating announcements were made during the preceding 12 months.
In contrast to these studies, Cantor et al (1997) find that in the case of split ratings – where Moody’s and S&P assign different ratings – both ratings affect corporate bond spreads. Well over half of all credit ratings differ by at least one notch. For example, in March 2005, Moody’s rated Aon one notch below S&P and Fitch: Baa2 versus BBB+ (Graph 1).
Differential information hypothesis
The informational value of ratings may depend on the size of the firm. The differential information hypothesis states that the production and dissemination of private information are an increasing function of firm size (Atiase (1985)). Many studies have found this to be true. For example, Beard and Sias (1997) show that the number of analysts following a firm is highly correlated with the capitalisation of the firm. Investors arguably attach greater weight to rating agencies’ assessments of small-cap firms than to their assessments of large-cap firms, owing to the relative scarcity of other sources of information about small-cap firms. Therefore, one implication of the differential information hypothesis is that the price impact of ratings should be greater for small-cap firms than for large-cap firms.
Price pressure hypothesis
Even if rating announcements convey no new information about the creditworthiness of issuers, institutional and regulatory constraints may still cause them to have an impact on asset prices. Market participants and regulatory authorities frequently delegate the monitoring of credit risk to rating agencies. Investors may be restricted from acting upon their own risk assessments – and so restricted from buying or selling securities – until a rating agency has pronounced on an issuer’s creditworthiness. Quite apart from their information content, therefore, rating announcements might impact prices because of buying or selling pressure from restricted investors.
Many mutual funds, pension funds and other institutional investors are restricted by mandate from holding debt securities rated below a pre-defined threshold. Furthermore, many regulations and statutes restrict regulated institutions from investing in lower rated debt. In the United States, eight federal statutes, 47 federal regulations and over 100 state laws and regulations make reference to credit ratings (US Senate (2002, p 102)). Finally, many financial contracts link payment conditions to credit ratings. For example, some debt contracts specify that a downgrade entitles creditors to demand immediate repayment and other contracts that a downgrade triggers a higher coupon.
The most commonly referenced threshold is BBB–, the lowest investment-grade credit rating. Since the 1980s market participants and regulatory authorities have increasingly made use of thresholds other than BBB– (Cantor and Packer (1994)). Nevertheless, the distinction between investment-grade and speculative-grade ratings remains the most significant, especially for defining permissible investments.
Institutions affected by institutional or regulatory constraints are often required to sell securities that are downgraded to below the threshold. The price pressure hypothesis implies that the announcement of a downgrade from investment grade to speculative grade, or of a review for downgrade to speculative grade, should have a larger price impact than other downgrades. Indeed, if the announcement of a downgrade from investment grade to speculative grade results in forced sales, then prices might overshoot their new equilibrium level at the time of the announcement and rebound
6
in the days that follow. The constraints typically relate to debt instruments and so the impact should be more noticeable for credit spreads than for equity prices.
Several studies have found support for the price pressure hypothesis. The dislocation in the US commercial paper market in early 2001 and the sell-off in credit markets in mid-2002 provide anecdotal evidence; at the time, investors shifted out of securities perceived to be susceptible to being downgraded to speculative grade (BIS (2001, 2003)).Steiner and Heinke (2001) find that downgrades from investment grade to speculative grade elicit a larger widening of credit spreads. Hand et al (1992) find that the reaction of investment-grade bonds to rating downgrades is larger than that of speculative-grade bonds. Kliger and Sarig (2000) suggest that the impact of rating announcements is greater for firms with high leverage (which are typically rated speculative grade) than for firms with low leverage (which are typically rated investment grade).
4. Sample and methodology
To test the various hypotheses outlined above, we collected daily data on CDS spreads and rating announcements covering the period from 1 January 2001 to 31 March 2005. The raw sample includes almost 800 issuers and more than 6000 rating announcements.
Data
Data on CDS spreads were obtained from Markit, a London-based distributor of credit pricing data. Markit provides a composite CDS price, which is calculated as the daily average of quotes contributed by more than 20 dealers. Even though the composite CDS price is based on indicative quotes, rigorous cleaning of the data helps to ensure that the composite price closely reflects transaction prices. Markit eliminates stale quotes and outliers, rejecting on average 45% of the data submitted. Furthermore, Markit constructs composite prices only when at least three dealers contribute quotes. Finally, we include in the sample only the most liquid CDS contracts. Dealers update quotes for five-year maturities more frequently than those for other maturities, and so we restrict our sample to five-year contracts.7 In addition, we include only those issuers for which there are at least five price changes in a given six-month period.
Nevertheless, owing to a lack of liquidity CDS prices are not available for some issuers on some days. To close gaps in time series, we assume that price changes are driven by the arrival of new information. Therefore, we hold composite CDS prices constant until a new price is provided by Markit. This differs from Hull et al (2004) and Norden and Weber (2004), who close gaps by linearly interpolating between CDS quotes. We do not interpolate across announcement days. The sample includes only issuers for which CDS spreads are available for at least two of the three days surrounding a rating announcement and, moreover, for which prices are not constant, ie not stale. Consequently, price changes in the interval [0,+1] are calculated only from observed data.
For each issuer, data on rating announcements were obtained from Bloomberg. All types of announcements – rating changes, reviews and outlooks – were considered. Furthermore, announcements by all three of the major rating agencies – Moody’s, S&P and Fitch – were retrieved. Announcements relating to the most senior credit rating available were selected, usually the long-term issuer rating.
To isolate the impact of different types of announcements, we exclude all contemporaneous rating announcements. If on any given day an agency makes two rating announcements concerning the same company, then both announcements are excluded from the sample. Rating agencies often change a firm’s rating outlook at the same time as they change its rating. Therefore, failure to control for contemporaneous announcements can bias the results.
7 Dealers contribute to Markit quotes for 10 different maturities, ranging from 6 months to 30 years. In 2001, contracts with a
five year maturity accounted for 20% of all dealer quotes, followed by contracts with a three-year maturity at 18%. By 2004, these proportions had fallen to 16% and 14%, respectively, owing to the rapid growth of trading in other maturities.
7
It is also important to control for other events that might impact prices on the day of a rating announcement. We construct a proxy for other events by counting the number of rating announcements in a 10-day window around any given announcement. If there is evidence of clustering (ie if the sum of announcements is greater than one), then we assume that the rating announcement is driven by other information and exclude the announcement from our sample. Each firm in our sample is rated by 1.9 agencies on average, and so significant events are likely to elicit a response from more than one agency.
The clustering of rating announcements is an imperfect proxy for other events. In a sample of 30 events that led to rating announcements, only 50% resulted in a rating announcement by two or more agencies. Nevertheless, it goes some way towards isolating rating announcements from other potentially significant events. To the extent that the elimination of rating announcements which occur within 5 days of another rating announcement makes it more difficult to detect whether rating announcements have a price impact, it represents an improvement over most other studies.
The final sample comprises 439 issuers and 2014 related rating announcements. Financial institutions make up 18% of the issuers and non-financial corporations the remaining 82%. US issuers account for 56% of the total, followed by European issuers at 26% and Japanese issuers at 18%. The distribution of rating announcements is shown in Table 2. Negative announcements account for 74% of all rating announcements, reflecting the deterioration in credit quality between 2001 and 2003. Downgrades account for 43% of the negative announcements, reviews 24% and outlook changes 33%. Even after controlling for contemporaneous announcements and clustering, nearly 40% of the negative announcements were preceded within 60 business days by other rating announcements.
Event window
The event window is set equal to four months, starting 60 business days before a rating announcement and ending 20 business days after an announcement. Sixty business days was selected as the preceding period because rating agencies seek to act upon material information within three months (Keenan et al (2000)). Over the sample period, the average period between a review for downgrade and a downgrade was 32 business days.
The event window is subdivided into four time intervals: 60 to 21 business days before a rating announcement; 20 to one day before an announcement; the day of an announcement and the following day; and two to 20 days after an announcement. If a rating announcement is fully anticipated, then equity prices and CDS spreads should adjust prior to the announcement, in either the [-60,-21] or [-20,-1] intervals. If a rating announcement has informational value or results in price pressure, then it should have a discernible price impact in the [0,+1] interval. The impact of the announcement is tested over a two day interval because the announcement might have been made after markets closed for the day.8 In the case of less liquid names, the full impact of a rating announcement might be delayed to the [+2,+20] interval.
Calculation of daily returns
To examine the price impact of rating announcements, we focus on daily holding period returns for a buy-and-hold investment. The calculation of CDS returns C
t,iR is complicated by the fact that the market value of a CDS contract C
t,iP depends upon an uncertain stream of premia. The buyer of a CDS contract pays to the seller regular (usually quarterly) payments until the maturity of the contract or until a credit event occurs, whichever is sooner. C
t,iP represents the expected present value of these payments:
t,it,iCt,i RPVSP 01⋅= (1)
where t,iS = CDS spread for issuer i on day t
8 Neither the CDS prices nor the rating announcements are time stamped. It is in principle possible – but in practice highly
unlikely – for an announcement in Tokyo on day 0 to have an impact on prices in New York on day -1.

8
t,iRPV01 = present value on day t of a 1 basis point stream of premia which terminates at maturity or default, whichever occurs first
The calculation of t,iRPV01 requires a CDS pricing model. In particular, the probability of the reference entity surviving to each payment date must be modelled. There are several different approaches for modelling this probability. For purposes of pricing, reduced-form models, such as that developed by Hull and White (2000), are the most widely used. In these models, t,iRPV01 is negatively correlated with CDS spreads (from which default probabilities are derived), risk-free interest rates and recovery rates (ie the amount that creditors expect to receive in settlement of their claims on a defaulting borrower, usually stated as a percentage of the debt’s par value).
We skirt controversies regarding the appropriate pricing model by assuming that t,it,i RPVRPV 0101 1 =− . This greatly simplifies the calculation of CDS returns:
1101
011
1111
−=−⋅
⋅=−=
−−−− t,i
t,i
t,it,i
t,it,iCt,i
Ct,iC
t,iS
S
RPVS
RPVS
P
PR (2)
For a one day horizon, this assumption seems reasonable. Providing that CDS spreads are at least as volatile as interest and recovery rates, the impact of 10101 −t,it,i RPVRPV on C
t,iR is dwarfed by the impact of C
t,iC
t,i SS 1− . In other words, CDS returns are much more sensitive to changes in CDS spreads than to changes in interest or recovery rates. In any case, recovery rates very rarely change. And for testing the price impact of rating announcements, we are interested in returns arising from company-specific changes in spreads, not those which arise from economy-wide changes in the discount rate. Therefore, while equation (2) tends to overestimate returns, on most days the bias is not significant.9 Based on a simple CDS pricing model developed by O’Kane and Turnbull (2003), we calculated the average daily change in t,iRPV01 to be close to zero for our sample of issuers over the sample period.10
Equation (2) calculates returns from the perspective of an investor who has bought protection against default. This is equivalent to a “short” position in the underlying security; in the event of a default by the reference entity, the buyer of protection is obligated to deliver to the seller the underlying security in return for a lump sum equivalent to the face value of the security. Therefore, returns to the investor are positive when CDS spreads widen and negative when CDS spreads tighten.
Our methodology for calculating CDS returns differs from Hull et al (2004) and Norden and Weber (2004). They focus on absolute changes in CDS spreads, calculated as daily differences in basis points: 1−− t,it,i SS . One disadvantage of their methodology is that it does not facilitate a comparison of returns across markets. Furthermore, it does not adjust for differences in the level of spreads across issuers. Issuers trading at higher spreads, such as those rated below investment grade, will by construction have more volatile spreads than issuers trading at lower spreads, such as those rated investment grade. This makes it difficult to pool observations. Nevertheless, to test the robustness of our results, we replicate their methodology.
9 Another source of bias – albeit an insignificant source at very short time intervals – is the use of at-market prices in place of
off-market prices. In equation (2), Si,t-1 represents the price of a CDS contract with an original maturity of T years and Si,t the price of the same contract one period later. Off-market prices are not available from Markit and so we approximate Si,t using at-market prices. The price difference between contracts with a remaining maturity of five years less a day and contracts with an original maturity of five years is negligible.
10 The model makes a number of simplifying assumptions. For example, it assumes that the hazard rate process is deterministic. According to O’Kane and Turnbull (2003), the pricing impact of these assumptions is insignificant, smaller than the typical bid-ask spread. For ease of implementation, we follow O’Kane et al (2003) and further simplify the model by assuming that the term structure of interest rates and credit spreads is flat and ignoring the effect of accrued premia. Recovery rates were retrieved from Markit; each dealer who contributes a quote to Markit also contributes an estimate of the recovery rate. Risk-free interest rates were proxied using 5-year government spot rates.

9
Calculation of abnormal returns
Following the literature on event studies, we calculate abnormal price changes to control for possible market-wide systematic factors that could move all prices simultaneously. We adjust CDS returns using the market model:
Ck,t
Ci
Ci
Ci,t
Ci,t RβαRAR −−=
where Ct,iAR = abnormal return for issuer i on day t
Ct,iR = return for issuer i on day t
Ct,kR = return for the index k on day t
The parameters Ciα and C
iβ are estimated over a six-month period preceding each event window. The market index k used to adjust returns corresponds to the nationality of the issuer. Separate indices are constructed for US, Japanese, euro area, UK, Swedish, Swiss and Norwegian issuers. The market index k should ideally comprise the universe of issuers in a given market. For CDS markets, broad indices were launched only towards the end of our sample period.11 Consequently, we construct an index based on CDS prices in our sample. The index return on a given day is set equal to the median CDS return for the relevant sample of issuers.
To replicate the methodology of Hull et al (2004) and Norden and Weber (2004), we also calculate abnormal CDS spread changes:
( )11 −− −−−= t,gt,gt,it,it,i INDIND)SS(ASC
where t,iASC = abnormal CDS spread change for issuer i on day t
t,gIND = market index corresponding to the issuer’s rating category g on day t
Four market indices INDg,t are constructed, corresponding to the whole letter rating categories AA, A, BBB, BB. Ratings by different agencies are mapped into these categories according to the schematic presented in Table 1.12 The value of the index on a given day is set equal to the median spread for the relevant rating category.13
Rating-based indices partially adjust for differences in the level of spreads across issuers. The variance of ASCi,t is similar for issuers in a given rating category, although heteroscedasticity is still a problem because of the pronounced skewness of spreads. A shortcoming of rating-based indices as a control for systematic factors is that they combine issuers of many different nationalities and so assume that any macroeconomic shocks are global in nature. By contrast, nationality-based indices allow common shocks to differ across countries (or monetary areas).
Test statistics
To control for event-induced changes in variance, we employ a standardised cross-sectional t-test to test whether the mean of abnormal CDS returns is significantly different from zero. The alternative hypothesis is that ARC>0 for negative rating announcements and ARC<0 for positive announcements. Abnormal changes are assumed to be independent and distributed Student’s t with n–1 degrees of freedom, where n denotes the number of observations.
11 The first sets of CDS indices, known as Trac-x and iBoxx, appeared in 2003. Competing indices were merged in 2004 to
form two new sets of indices under the names DJ CDX for North American and emerging market issuers and DJ iTraxx for European and Asian issuers.
12 For issuers with split ratings, an average rating is calculated, as suggested by Cantor et al (1997). Changes in CDS spreads after a rating downgrade or upgrade are adjusted by the market index corresponding to the new rating category.
13 Hull et al (2004) and Norden and Weber (2004) base their index on the mean spread rather than the median. The distribution of credit spreads tends to be highly positively skewed and so the mean of the distribution can be heavily influenced by one or two extreme observations; therefore, the median provides a more accurate measure of central tendency.

10
Rating announcements potentially lead to a change in both the mean and variance of equity and CDS prices. The change in variance is due to a possible change in the firm’s perceived risk. Brown and Warner (1980) note that when the variance induced by an event is underestimated, the test statistic results in the rejection of the null hypothesis more frequently than it should, even when the average abnormal performance is zero. One remedy to this problem is to ignore the estimation period residual variance and use instead the cross-sectional variance in the event window itself to form the test statistic. With this approach the t-test is obtained by dividing the average event window residual by its contemporaneous cross-sectional standard error.14
However, if the event window residuals for different firms are drawn from different distributions, this cross-sectional t-test is misspecified. Boehmer et al (1991) propose a procedure to address this problem. They standardise the abnormal returns of the event window by the standard deviation of the estimation period (adjusted for forecast error) and then apply the cross-sectional t-test to the standardised abnormal returns. The test statistic is found by dividing the average abnormal return in event window by its contemporaneous cross-sectional standard error.
For event days, the standardised abnormal return is obtained as follows:
( )( )∑
=
−
−++
=
T
p
Ck
Cp,k
Ck
Ct,kC
i
Ct,iC
t,i
RR
RRT
s
ARSR
1
11
where Ct,iSR = standardised abnormal return for issuer i on event day t
Cis = standard deviation of abnormal returns for issuer i during the estimation period
CkR = average return for index k during the estimation period
T = number of days p in the estimation period
The standardised cross-sectional test statistic incorporates variance information from both the estimation period and the event window and is defined as follows:
( )
2
1 1
11
11
1
1
∑ ∑
∑
= =
=−
⎟⎟⎠
⎞⎜⎜⎝
⎛−
−
=n
i
n
i
Ct,i
Ct,i
n
i
Ct,i
Sn
SRn
SRnn
SRn
t
Boehmer et al (1991) perform various simulations and find that this test statistics yields better inferences when there is a simultaneous increase in the mean and the variance of the abnormal returns at the time of the event.
To address the possible misspecification induced by the skewness of abnormal returns, we employ a second test based on the bootstrap technique described by Efron and Tibshirani (1993). The bootstrap test refers to the t-statistic: σμ /)s(nt 0−= , where s and σ are the sample mean and variance, respectively, of the abnormal returns and 0μ denotes the mean of the test under the null hypothesis (in our case equal to zero). To carry out the bootstrapping, we define sss ii −=~ for ni ,,1K= . The values nsss ~,,~,~
21 K correspond to the null distribution, ie the distribution defined by the null hypothesis of the test. We sample 1000 times with replacement and calculate ( )BBB snt σ/= , where Bs and
Bσ are the bootstrapped sample mean and standard deviation. By comparing t with the desired percentile of this distribution, we can reject or accept the null hypothesis at the specified confidence level.
14 The event window standard deviation is usually larger than the estimation period standard deviation.
11
5. Empirical results
Our results indicate that all types of rating announcements have a statistically significant impact on CDS prices. Even outlook changes have an impact, although the evidence is more tenuous than for rating changes and reviews. These results notwithstanding, rating announcements are to a large degree anticipated; much of the adjustment in CDS prices occurs before the announcement of a rating action. These results are elaborated below. Test statistics are summarised in Tables 3 through 8, and cumulative returns are plotted in Graphs 2 through 5.
Negative rating announcements
We first consider the impact of negative rating announcements on CDS prices. Past studies and the hypotheses outlined in section 2 suggest that the evidence is likely to be strongest for such announcements. Our results do indeed indicate that all types of negative rating announcements have a statistically significant impact on CDS spreads. Nevertheless, much of the adjustment in CDS spreads occurs before the announcement of a rating action.
Table 3 presents abnormal changes in prices around negative rating announcements. To control for foreshadowed announcements, Table 3 excludes rating announcements which were preceded by another rating announcement within 60 days. Recall that we also control for other events by excluding from the sample rating announcements that occurred within 5 days of another rating announcement. For each type of negative announcement, the null hypothesis ARC = 0 during the [0,+1] period is rejected. Abnormal CDS returns ARC increase by 1.1% on average following a negative review, 0.3% following a downgrade and 0.2% following a negative outlook change. For negative reviews the null hypothesis is rejected at the 1% level regardless of which of the two tests – t- or bootstap tests – is considered. For downgrades and negative outlooks the results are weaker but, according to the bootstrap test, are still significant at the 5% and 10% levels, respectively.
Much of the price adjustment occurs prior to the rating announcement, during the [-20,-1] period. Presumably it was during this period that the news which motivated the downgrade or negative review was announced. Nevertheless, rating announcements are important source of additional information. In the absence of other rating announcements, price movements during the 2-day announcement window account for about 30% of the cumulative abnormal CDS return over the 80-day event window (Graph 2). There is less anticipation of outlook changes, perhaps because outlook changes tend to be motivated by longer-term developments rather than unexpected news.
As expected, the results differ depending whether abnormal CDS returns are estimated or abnormal spread changes. Consistent with the results of Hull, Predescu and White (2004), downgrades and outlook changes have no impact on ASC (Table 3). At the same time, they have a discernible impact on ARC. For the reasons outlined in section 4, ARC provides more robust estimates than ASC. Consequently, in the remainder of this section the discussion is limited to ARC.
In Table 4 we present the results for foreshadowed announcements. In contrast to Table 3, we include only rating announcements which were preceded by another rating announcement within 60 days and exclude those which were not. The results are basically the same. For each type of negative announcement, the null hypothesis ARC = 0 during the [0,+1] period is rejected at at least the 10% level according to the t-test (or at least the 5% level according to the bootstrap test). This result holds regardless of whether the preceding announcement was made by the same agency or a different agency.15 Therefore, two rating announcement are more informative than one.
Again, however, much of the adjustment in CDS prices occurs before the announcement window, in either the [-60,-21] period or the [-20,-1] period. The degree of anticipation is greater than that in the absence of preceding rating announcements. Price movements during the 2-day announcement window account for about 24% of the cumulative abnormal CDS return over the 80-day event window for reviews, but much less for downgrades and negative outlook changes (Graph 3).
In Table 5 we divide the sample between firms with different ratings from different agencies, ie split ratings, and firms with equivalent ratings from different agencies. Given that controlling for
15 Reviews and outlook changes are rarely preceded by another rating announcement by the same agency.
12
foreshadowed announcements seems not to have a material impact on the results, we include both announcements which are foreshadowed and those which are not. Evidence of an announcement window effect is strongest for firms with split ratings. This may partly explain why second rating announcements have a significant impact on CDS prices. Yet for firms with the same rating from different agencies, negative reviews and outlook changes also have an impact on ARC. So the informational value of ratings is not wholly dependent on split ratings.
Table 6 uses firm size as the criteria for dividing the sample. We first ranked the sample of firms by average market capitalisation over the sample period and then split the sample into three equal sub-samples. The top third comprises firms with a market capitalisation greater than $877 million. Most of the firms in this sub-sample would be classified as mid- or large-cap firms and would likely be followed by several analysts. The middle third comprises firms with a market capitalisation of between $253 and $877 million. These firms are usually referred to as small caps and they would typically be followed by two or more analysts. 16 The bottom third comprises firms with a market capitalisation of less than $253 million. These are the smallest of the small caps, labelled micro caps, and many would be ignored by analysts or followed by at most one analyst.
As discussed in section 2, one implication of the differential information hypothesis is that the price impact of ratings should be greater for small-cap firms than for large-cap firms. This seems to be the case. Only for micro caps, in the bottom third, do all types of rating announcements have a significant impact: the null hypothesis ARC = 0 during the [0,+1] period is rejected at the 5% level according to the t-test (or 1% level according to the bootstrap test) for all three types of announcements. For small-cap and mid-cap firms, only negative reviews have a highly significant impact on abnormal CDS returns. Downgrades have a weaker albeit still significant impact on small-cap and mid-cap firms, but negative outlooks have no apparent impact.
To test the price pressure hypothesis, we divided the sample by whole letter rating (Table 7). There were very few observations for firms with ratings higher than AA or lower than BB and so we ignored those rating categories. Among the remaining four rating categories – AA, A, BBB and BB – the impact of negative rating announcements is greatest for firms at the threshold of investment grade, BBB. In the case of downgrades and negative outlooks, the null hypothesis ARC = 0 during the announcement window can be rejected only for BBB-rated issuers. In the case of negative reviews, the price impact is significant for both BBB- and A-rated issuers. However, the impact on BBB-rated issuers is twice as large: 1.5% versus 0.7%. Moreover, whereas price movements during the 2-day announcement window account for only 12% of the cumulative abnormal CDS return over the 80-day event window when A-rated issuers are placed on review, they account for almost 50% when BBB-rated issuers are placed on review (Graph 4).
Buying or selling pressure from restricted investors should, in principle, have only a temporary price impact. Any abnormal returns during the announcement window should be reversed in subsequent days as informed traders drive prices back to their fundamental value. However, we do not find any evidence of mean reversal. In fact, following negative reviews the opposite occurs: CDS spreads continue to drift upwards during the [+2,+20] period. Even for issuers rated BBB at the time of the announcement, there is no evidence of mean reversion. This might reflect poor liquidity conditions. In particular, to the extent that investment-grade and high-yield debt markets are not fully integrated, selling pressure from restricted investors could have an impact on CDS prices beyond the announcement window. Even so, the absence of mean reversion casts at least some doubt on the importance of price pressure as the main explanation for the price impact of rating announcements.
As a final test of the price pressure hypothesis, we examined the price impact of rating announcements after controlling for both the whole-letter rating and size of the firm. The resulting samples were sometimes less than 30 observations and so we focussed on the results of the bootstrap test.17. As shown in Table 8, rating appears to be a more important determinant than size of the price impact of negative rating announcements. Whereas negative rating announcements have a significant impact on the CDS returns of almost all BBB-rated firms, the same is not true of all micro-
16 In the S&P Composite 1500, large-cap firms are defined as those with a market capitalisation of $4 billion or greater, mid-
cap as those with a capitalisation of between $1 billion and $4 billion, and small cap less than $1 billion. 17 The results of the t test were very similar, albeit slightly less significant. For example, test statistics significant at the 5%
level according to the bootstrap test were significant at the 10% level according to the t test.
13
or small-cap firms. Among micro- and small-cap firms, downgrades and negative outlook changes are significant (at the 5% level or lower) only for BBB-rated firms. Surprisingly, among mid-cap firms the impact is most pronounced for A-rated firms. This suggests that price pressure is not the sole explanation for the price impact of rating announcements.
Positive rating announcements
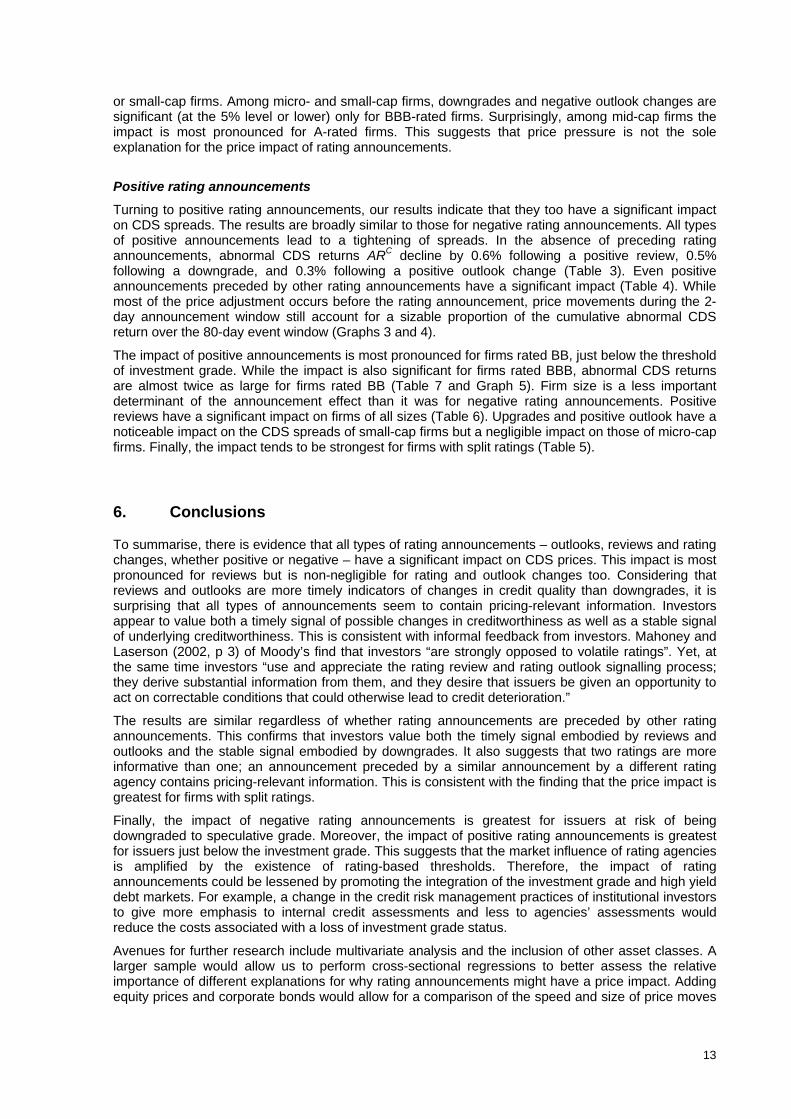
Turning to positive rating announcements, our results indicate that they too have a significant impact on CDS spreads. The results are broadly similar to those for negative rating announcements. All types of positive announcements lead to a tightening of spreads. In the absence of preceding rating announcements, abnormal CDS returns ARC decline by 0.6% following a positive review, 0.5% following a downgrade, and 0.3% following a positive outlook change (Table 3). Even positive announcements preceded by other rating announcements have a significant impact (Table 4). While most of the price adjustment occurs before the rating announcement, price movements during the 2-day announcement window still account for a sizable proportion of the cumulative abnormal CDS return over the 80-day event window (Graphs 3 and 4).
The impact of positive announcements is most pronounced for firms rated BB, just below the threshold of investment grade. While the impact is also significant for firms rated BBB, abnormal CDS returns are almost twice as large for firms rated BB (Table 7 and Graph 5). Firm size is a less important determinant of the announcement effect than it was for negative rating announcements. Positive reviews have a significant impact on firms of all sizes (Table 6). Upgrades and positive outlook have a noticeable impact on the CDS spreads of small-cap firms but a negligible impact on those of micro-cap firms. Finally, the impact tends to be strongest for firms with split ratings (Table 5).
6. Conclusions
To summarise, there is evidence that all types of rating announcements – outlooks, reviews and rating changes, whether positive or negative – have a significant impact on CDS prices. This impact is most pronounced for reviews but is non-negligible for rating and outlook changes too. Considering that reviews and outlooks are more timely indicators of changes in credit quality than downgrades, it is surprising that all types of announcements seem to contain pricing-relevant information. Investors appear to value both a timely signal of possible changes in creditworthiness as well as a stable signal of underlying creditworthiness. This is consistent with informal feedback from investors. Mahoney and Laserson (2002, p 3) of Moody’s find that investors “are strongly opposed to volatile ratings”. Yet, at the same time investors “use and appreciate the rating review and rating outlook signalling process; they derive substantial information from them, and they desire that issuers be given an opportunity to act on correctable conditions that could otherwise lead to credit deterioration.”
The results are similar regardless of whether rating announcements are preceded by other rating announcements. This confirms that investors value both the timely signal embodied by reviews and outlooks and the stable signal embodied by downgrades. It also suggests that two ratings are more informative than one; an announcement preceded by a similar announcement by a different rating agency contains pricing-relevant information. This is consistent with the finding that the price impact is greatest for firms with split ratings.
Finally, the impact of negative rating announcements is greatest for issuers at risk of being downgraded to speculative grade. Moreover, the impact of positive rating announcements is greatest for issuers just below the investment grade. This suggests that the market influence of rating agencies is amplified by the existence of rating-based thresholds. Therefore, the impact of rating announcements could be lessened by promoting the integration of the investment grade and high yield debt markets. For example, a change in the credit risk management practices of institutional investors to give more emphasis to internal credit assessments and less to agencies’ assessments would reduce the costs associated with a loss of investment grade status.
Avenues for further research include multivariate analysis and the inclusion of other asset classes. A larger sample would allow us to perform cross-sectional regressions to better assess the relative importance of different explanations for why rating announcements might have a price impact. Adding equity prices and corporate bonds would allow for a comparison of the speed and size of price moves

14
in different markets in response to rating announcements and could provide insights into linkages between various markets.
References
Ammer, J and N Clinton (2004): “Good news is no news? The impact of credit rating changes on the pricing of asset-backed securities”, Federal Reserve Board, International Finance Discussion Paper, no 809.
Atiase, R (1985): “Predisclosure information, firm capitalisation and security price behaviour around earnings announcements”, Journal of Accounting Research, pp 21-36.
Bank for International Settlements (2001): 71st Annual Report, 11 June, pp 101-22.
——— (2003): 73rd Annual Report, 30 June, pp 98-119.
Beard, C and R Saas (1997): “Is there a neglected-firm effect?”, Financial Analysts Journal, September/October, pp 19-23.
Boehmer, E, J Musumeci and A Poulsen (1991): “Event-study methodology under conditions of event-induced variance”, Journal of Financial Economics, vol 50, pp 253-72.
Brown, S and J Warner (1980): “Measuring security price performance”, Journal of Financial Economics, vol 8, pp 205-58.
Cantor, R and F Packer (1994): “The credit rating industry”, FRBNY Quarterly Review, Summer-Fall, pp 1-26.
Cantor, R, F Packer and K Cole (1997): “Split ratings and the pricing of credit risk”, Journal of Fixed Income, vol 7, December, pp 72–82.
Covitz, M and P Harrison (2003): “Testing conflicts of interest at bond ratings agencies with market anticipation: evidence that reputation incentives dominate”, Federal Reserve Board, Finance and Economics Discussion Series, no 2003-68 (December).
Ederington, L, J Yawitz and B Roberts (1987): “The informational content of bond ratings”, Journal of Financial Research, vol 10, pp 211-26.
Efron, B and R Tibshirani (1993): An introduction to the bootstrap, Chapman & Hall, New York.
Goh, J and L Ederington (1993): “Is a bond rating downgrade bad news, good news, or no news for stockholders?”, Journal of Finance, vol 48, pp 2001-08.
Griffin, P and A Sanvicente (1982): “Common stock returns and rating changes: a methodological comparison”, Journal of Finance, vol 37, pp 103–19.
Hand, J, R Holthausen and R Leftwich (1992): “The effect of bond rating agency announcements on bond and stock prices”, Journal of Finance, vol 47, pp 733–52.
Hull, J and A White (2000): “Valuing credit default swaps I: no counterparty default risk”, Journal of Derivatives, vol 8, pp 29-40.
Hull, J, M Predescu and A White (2004): “The relationship between credit default swap spreads, bond yields, and credit rating announcements”, Journal of Banking & Finance, vol 28, pp 2789-811.
Kalev, P, W-M Liu, P Pham and E Jarnecic (2004): “Public information arrival and volatility of intraday stock returns”, Journal of Banking & Finance, vol 28, pp1441-67.
Katz, S (1974): “The price and adjustment process of bonds to rating reclassifications: a test of bond market efficiency”, Journal of Finance, vol 29, pp 551–59.
Keenan, S, J Fons and L Carty (2000): “Credit rating dynamics – Moody’s Watchlist, rating migration, and credit quality correlation”, in S Das, ed, Credit derivatives and credit linked notes, 2nd ed, John Wiley & Sons, pp 477-533.
Kliger, D and O Sarig (2000): “The information value of bond ratings”, Journal of Finance, vol 55, pp 2879–902.

15
Lieberman, J (2002): “Rating the raters: Enron and the credit rating agencies”, Statement to the Senate Committee on Governmental Affairs, 20 March.
Mahoney, C and F Laserson (2002): “The bond rating process: a progress report”, Moody’s Investors Service, Special Comment, February.
Norden, L and M Weber (2004): “Informational efficiency of credit default swap and stock markets: the impact of credit rating announcements”, Journal of Banking & Finance, vol 28, pp 2813-43.
O’Kane, D and S Turnbull (2003): “Valuation of credit default swaps”, Lehman Brothers, mimeo, April.
O’Kane, D, C Pedersen, M Naldi, L Schloegl, S Ganapati, R Mashal and A Berd (2003): “Guide to exotic credit derivatives”, Lehman Brothers, mimeo, October.
Ross, S (1989): “Information and volatility: the no-arbitrage martingale approach to timing and resolution irrelevancy”, Journal of Finance, vol 44, pp 1-18.
Steiner, M and V Heinke (2001): “Event study concerning international bond price effects of credit rating actions”, International Journal of Finance and Economics, vol 6, pp 139–57.
United States Senate (2002): Financial Oversight of Enron: the SEC and Private-Sector Watchdogs, Report of the Staff to the Senate Committee on Governmental Affairs, 8 October.
Weinstein, M (1977): “The effect of a rating change announcement on bond price”, Journal of Financial Economics, vol 5, pp 329–50.

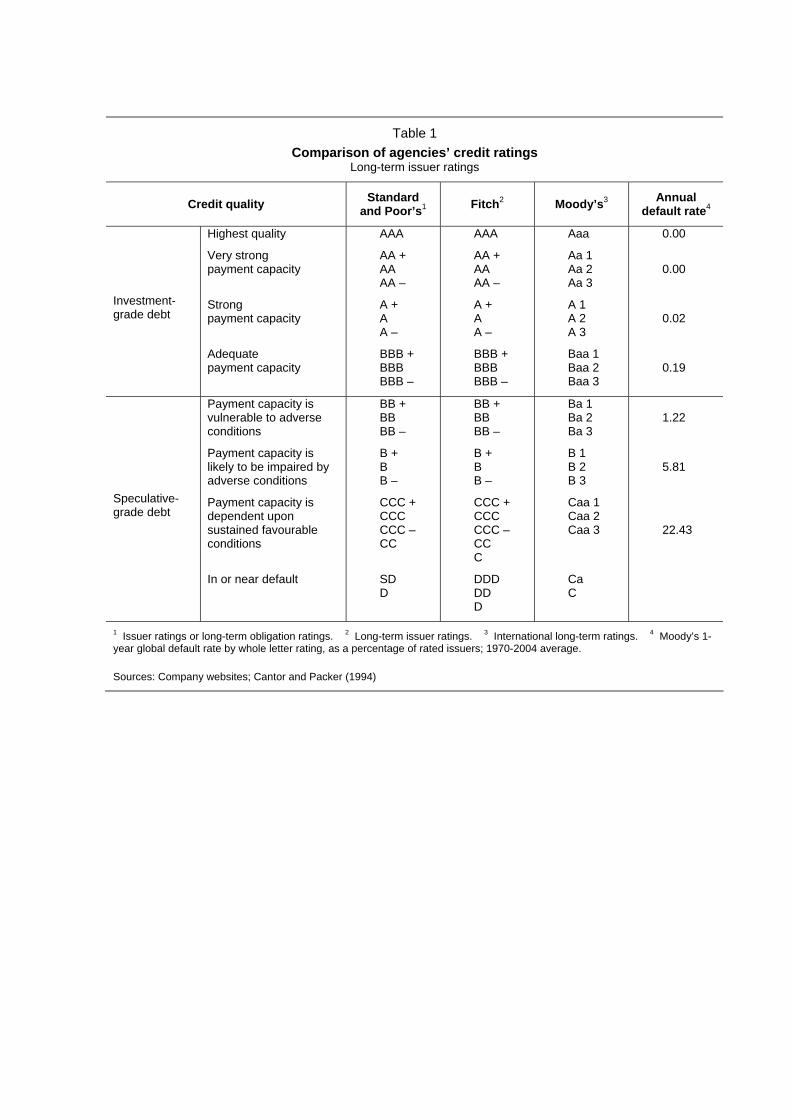
Table 1 Comparison of agencies’ credit ratings
Long-term issuer ratings
Credit quality Standard and Poor’s1 Fitch2 Moody’s3 Annual
default rate4
Investment- grade debt
Highest quality
Very strong payment capacity
Strong payment capacity
Adequate payment capacity
AAA
AA + AA AA –
A + A A –
BBB + BBB BBB –
AAA
AA + AA AA –
A + A A –
BBB + BBB BBB –
Aaa
Aa 1 Aa 2 Aa 3
A 1 A 2 A 3
Baa 1 Baa 2 Baa 3
0.00
0.00
0.02
0.19
Speculative- grade debt
Payment capacity is vulnerable to adverse conditions
Payment capacity is likely to be impaired by adverse conditions
Payment capacity is dependent upon sustained favourable conditions
In or near default
BB + BB BB –
B + B B –
CCC + CCC CCC – CC
SD D
BB + BB BB –
B + B B –
CCC + CCC CCC – CC C
DDD DD D
Ba 1 Ba 2 Ba 3
B 1 B 2 B 3
Caa 1 Caa 2 Caa 3
Ca C
1.22
5.81
22.43
1 Issuer ratings or long-term obligation ratings. 2 Long-term issuer ratings. 3 International long-term ratings. 4 Moody’s 1-year global default rate by whole letter rating, as a percentage of rated issuers; 1970-2004 average.
Sources: Company websites; Cantor and Packer (1994)
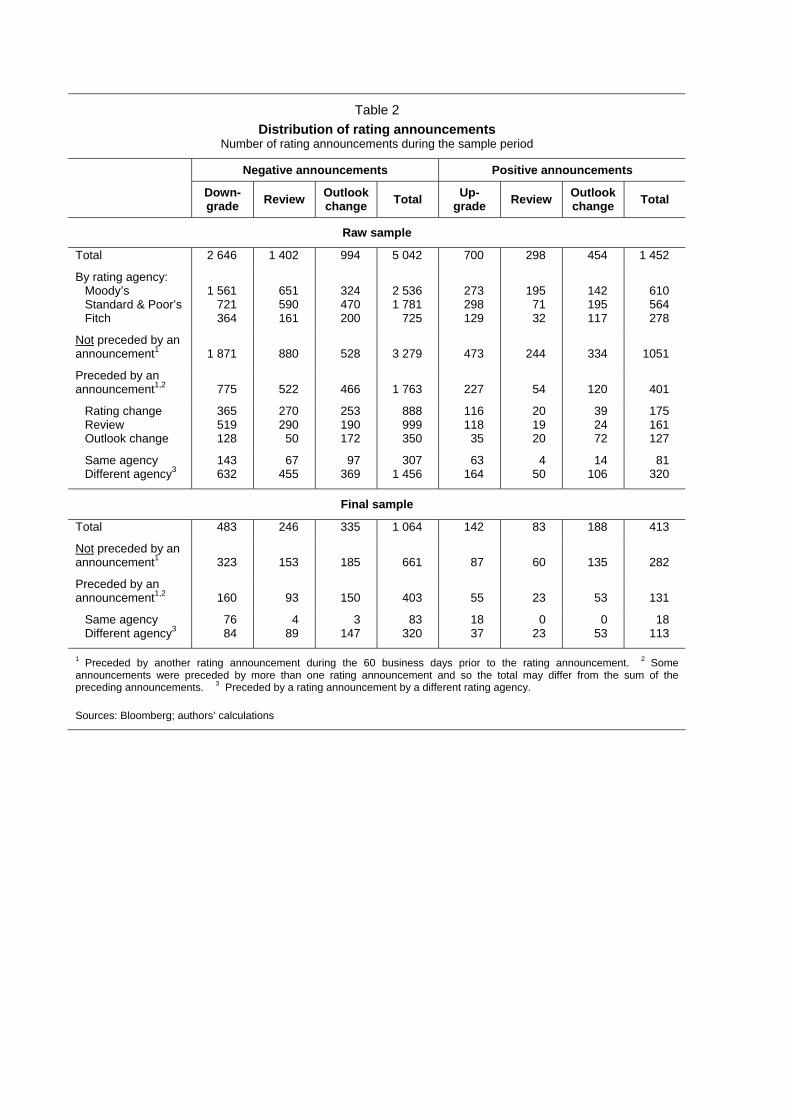
Table 2 Distribution of rating announcements
Number of rating announcements during the sample period
Negative announcements Positive announcements
Down- grade Review Outlook
change Total Up- grade Review Outlook
change Total
Raw sample
Total 2 646 1 402 994 5 042 700 298 454 1 452
By rating agency: Moody’s Standard & Poor’s Fitch
1 561 721 364
651 590 161
324 470 200
2 536 1 781
725
273 298 129
195 71 32
142 195 117
610 564 278
Not preceded by an announcement1 1 871 880 528 3 279 473 244 334 1051
Preceded by an announcement1,2 775 522 466 1 763 227 54 120 401
Rating change Review Outlook change
365 519 128
270 290 50
253 190 172
888 999 350
116 118 35
20 19 20
39 24 72
175 161 127
Same agency Different agency3
143 632
67 455
97 369
307 1 456
63 164
4 50
14 106
81 320
Final sample
Total 483 246 335 1 064 142 83 188 413
Not preceded by an announcement1 323 153 185 661 87 60 135 282
Preceded by an announcement1,2 160 93 150 403 55 23 53 131
Same agency Different agency3
76 84
4 89
3 147
83 320
18 37
0 23
0 53
18 113
1 Preceded by another rating announcement during the 60 business days prior to the rating announcement. 2 Some announcements were preceded by more than one rating announcement and so the total may differ from the sum of the preceding announcements. 3 Preceded by a rating announcement by a different rating agency.
Sources: Bloomberg; authors’ calculations
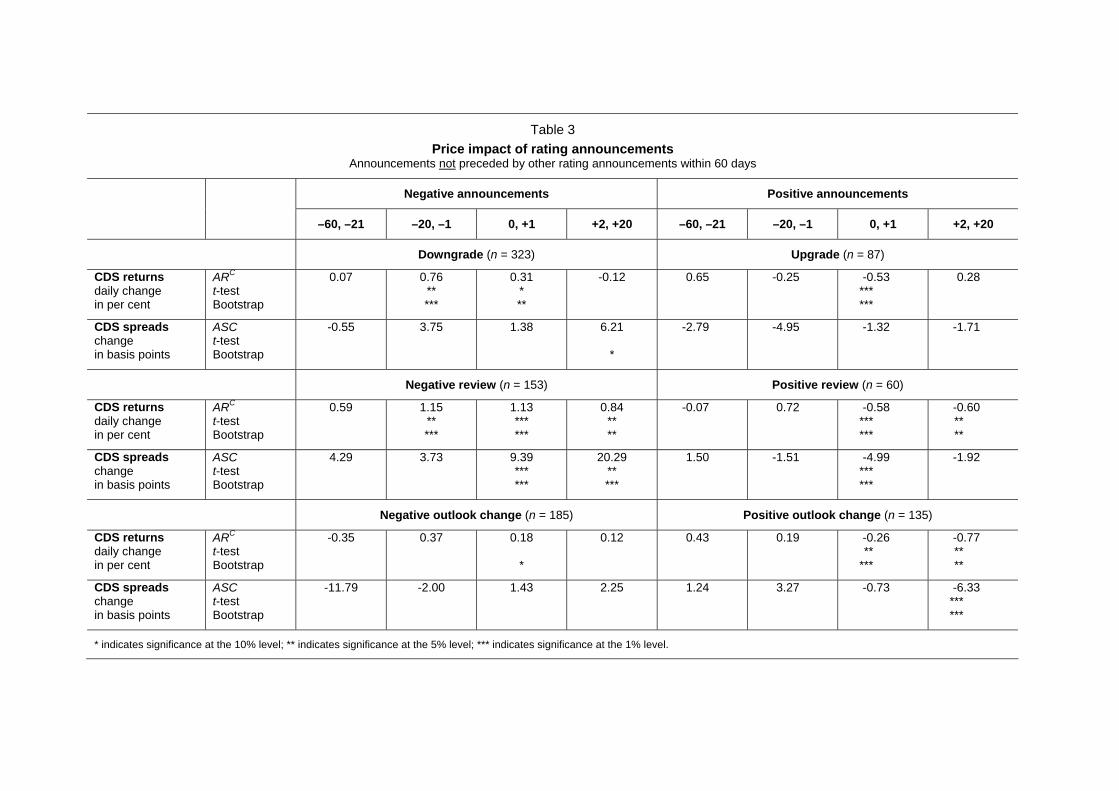
Table 3 Price impact of rating announcements
Announcements not preceded by other rating announcements within 60 days
Negative announcements Positive announcements
–60, –21 –20, –1 0, +1 +2, +20 –60, –21 –20, –1 0, +1 +2, +20
Downgrade (n = 323) Upgrade (n = 87)
CDS returns daily change in per cent
ARC t-test Bootstrap
0.07
0.76 ** ***
0.31 * **
-0.12
0.65
-0.25
-0.53 *** ***
0.28
CDS spreads change in basis points
ASC t-test Bootstrap
-0.55
3.75
1.38
6.21 *
-2.79
-4.95
-1.32
-1.71
Negative review (n = 153) Positive review (n = 60)
CDS returns daily change in per cent
ARC t-test Bootstrap
0.59
1.15 ** ***
1.13 *** ***
0.84 ** **
-0.07
0.72
-0.58 *** ***
-0.60 ** **
CDS spreads change in basis points
ASC t-test Bootstrap
4.29
3.73
9.39 *** ***
20.29 ** ***
1.50
-1.51
-4.99 *** ***
-1.92
Negative outlook change (n = 185) Positive outlook change (n = 135)
CDS returns daily change in per cent
ARC t-test Bootstrap
-0.35
0.37
0.18 *
0.12
0.43
0.19
-0.26 **
***
-0.77 ** **
CDS spreads change in basis points
ASC t-test Bootstrap
-11.79
-2.00
1.43
2.25
1.24
3.27
-0.73
-6.33 *** ***
* indicates significance at the 10% level; ** indicates significance at the 5% level; *** indicates significance at the 1% level.
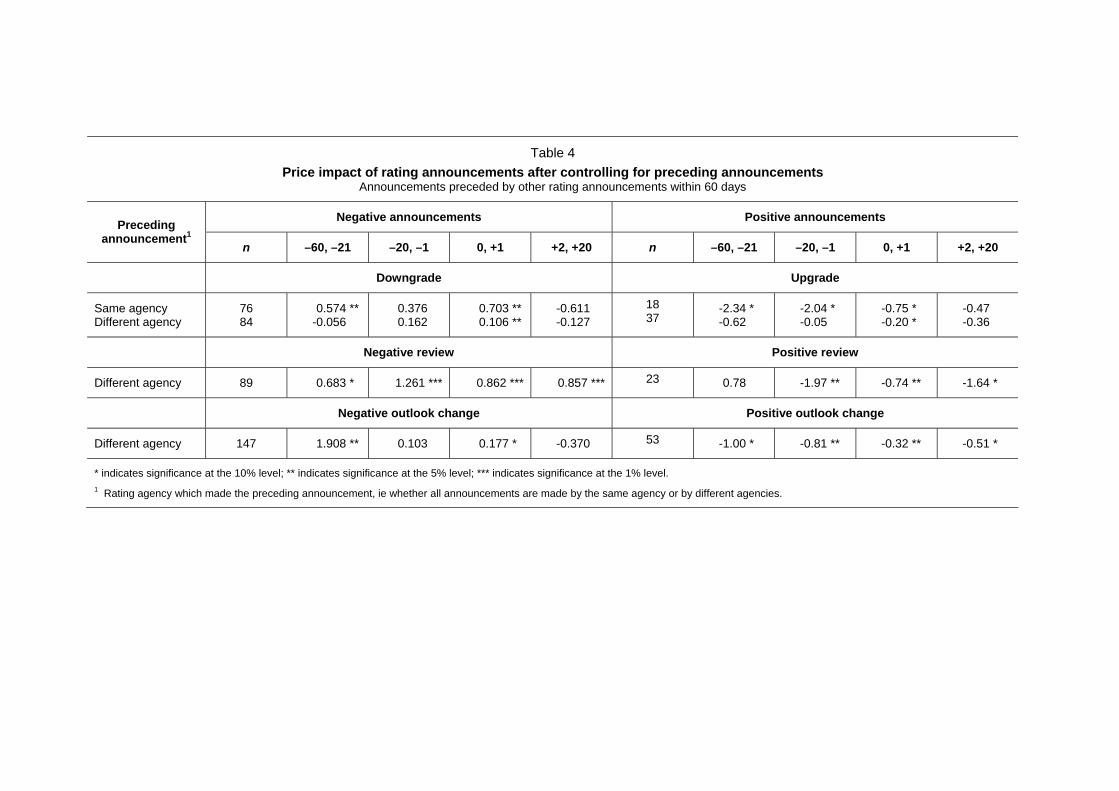
Table 4 Price impact of rating announcements after controlling for preceding announcements
Announcements preceded by other rating announcements within 60 days
Negative announcements Positive announcements Preceding announcement1
n –60, –21 –20, –1 0, +1 +2, +20 n –60, –21 –20, –1 0, +1 +2, +20
Downgrade Upgrade
Same agency Different agency
76 84
0.574 ** -0.056
0.376 0.162
0.703 ** 0.106 **
-0.611 -0.127
18 37
-2.34 * -0.62
-2.04 * -0.05
-0.75 * -0.20 *
-0.47 -0.36
Negative review Positive review
Different agency 89 0.683 * 1.261 *** 0.862 *** 0.857 *** 23 0.78 -1.97 ** -0.74 ** -1.64 *
Negative outlook change Positive outlook change
Different agency 147 1.908 ** 0.103 0.177 * -0.370 53 -1.00 * -0.81 ** -0.32 ** -0.51 *
* indicates significance at the 10% level; ** indicates significance at the 5% level; *** indicates significance at the 1% level. 1 Rating agency which made the preceding announcement, ie whether all announcements are made by the same agency or by different agencies.
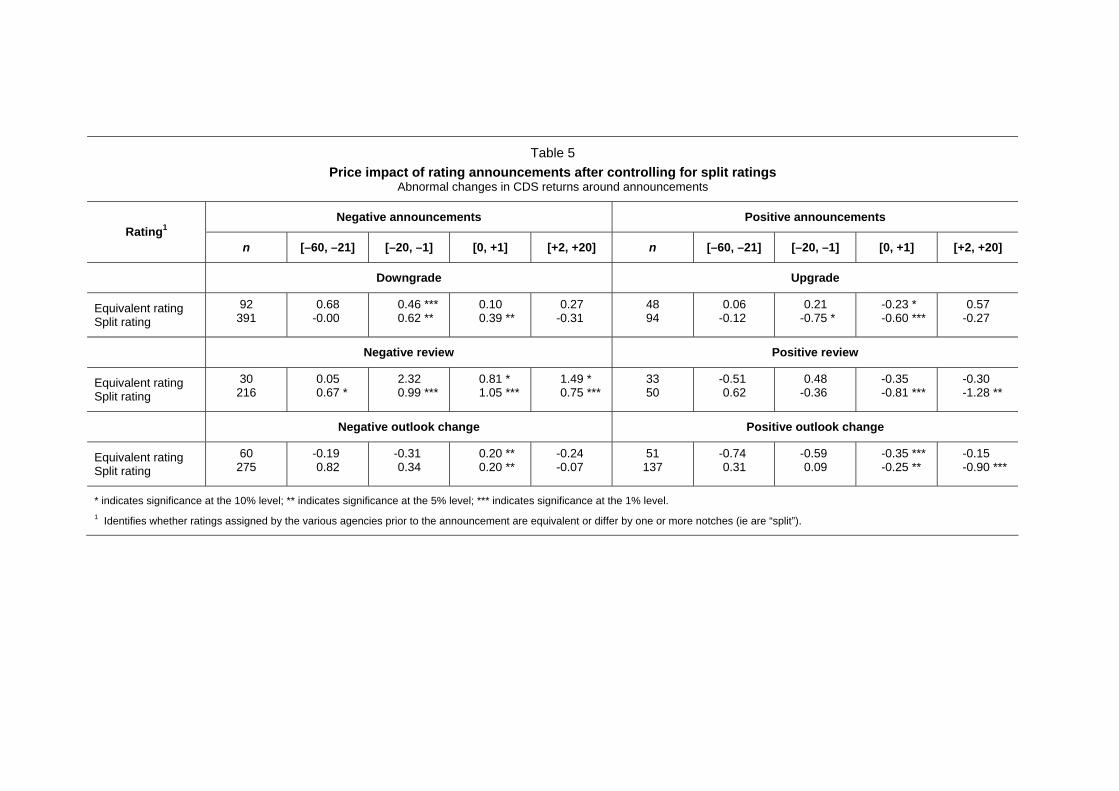
Table 5 Price impact of rating announcements after controlling for split ratings
Abnormal changes in CDS returns around announcements
Negative announcements Positive announcements Rating1
n [–60, –21] [–20, –1] [0, +1] [+2, +20] n [–60, –21] [–20, –1] [0, +1] [+2, +20]
Downgrade Upgrade
Equivalent rating Split rating
92 391
0.68 -0.00
0.46 *** 0.62 **
0.10 0.39 **
0.27 -0.31
48 94
0.06 -0.12
0.21 -0.75 *
-0.23 * -0.60 ***
0.57 -0.27
Negative review Positive review
Equivalent rating Split rating
30 216
0.05 0.67 *
2.32 0.99 ***
0.81 * 1.05 ***
1.49 * 0.75 ***
33 50
-0.51 0.62
0.48 -0.36
-0.35 -0.81 ***
-0.30 -1.28 **
Negative outlook change Positive outlook change
Equivalent rating Split rating
60 275
-0.19 0.82
-0.31 0.34
0.20 ** 0.20 **
-0.24 -0.07
51 137
-0.74 0.31
-0.59 0.09
-0.35 *** -0.25 **
-0.15 -0.90 ***
* indicates significance at the 10% level; ** indicates significance at the 5% level; *** indicates significance at the 1% level. 1 Identifies whether ratings assigned by the various agencies prior to the announcement are equivalent or differ by one or more notches (ie are “split”).
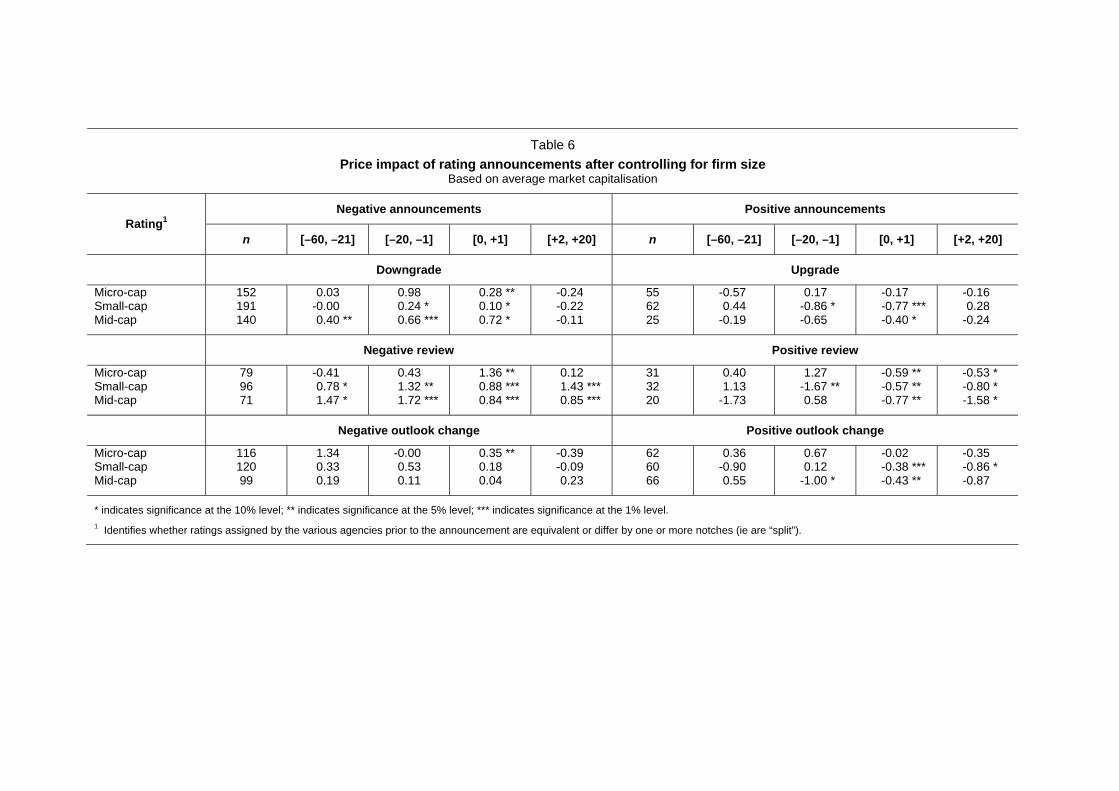
Table 6 Price impact of rating announcements after controlling for firm size
Based on average market capitalisation
Negative announcements Positive announcements Rating1
n [–60, –21] [–20, –1] [0, +1] [+2, +20] n [–60, –21] [–20, –1] [0, +1] [+2, +20]
Downgrade Upgrade
Micro-cap Small-cap Mid-cap
152 191 140
0.03 -0.00 0.40 **
0.98 0.24 * 0.66 ***
0.28 ** 0.10 * 0.72 *
-0.24 -0.22 -0.11
55 62 25
-0.57 0.44
-0.19
0.17 -0.86 * -0.65
-0.17 -0.77 *** -0.40 *
-0.16 0.28
-0.24
Negative review Positive review
Micro-cap Small-cap Mid-cap
79 96 71
-0.41 0.78 * 1.47 *
0.43 1.32 ** 1.72 ***
1.36 ** 0.88 *** 0.84 ***
0.12 1.43 *** 0.85 ***
31 32 20
0.40 1.13
-1.73
1.27 -1.67 ** 0.58
-0.59 ** -0.57 ** -0.77 **
-0.53 * -0.80 * -1.58 *
Negative outlook change Positive outlook change
Micro-cap Small-cap Mid-cap
116 120 99
1.34 0.33 0.19
-0.00 0.53 0.11
0.35 ** 0.18 0.04
-0.39 -0.09 0.23
62 60 66
0.36 -0.90 0.55
0.67 0.12
-1.00 *
-0.02 -0.38 *** -0.43 **
-0.35 -0.86 * -0.87
* indicates significance at the 10% level; ** indicates significance at the 5% level; *** indicates significance at the 1% level. 1 Identifies whether ratings assigned by the various agencies prior to the announcement are equivalent or differ by one or more notches (ie are “split”).
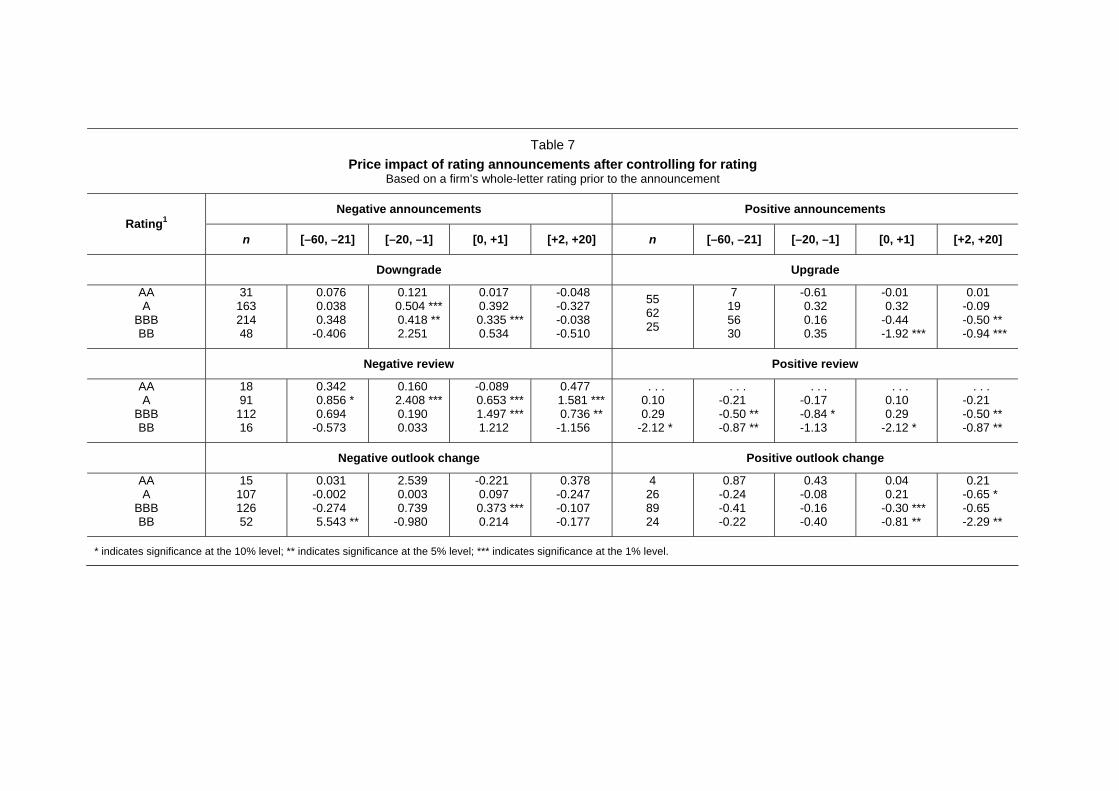
Table 7 Price impact of rating announcements after controlling for rating
Based on a firm’s whole-letter rating prior to the announcement
Negative announcements Positive announcements Rating1
n [–60, –21] [–20, –1] [0, +1] [+2, +20] n [–60, –21] [–20, –1] [0, +1] [+2, +20]
Downgrade Upgrade
AA A
BBB BB
31 163 214 48
0.076 0.038 0.348
-0.406
0.121 0.504 *** 0.418 ** 2.251
0.017 0.392 0.335 *** 0.534
-0.048 -0.327 -0.038 -0.510
55 62 25
7 19 56 30
-0.61 0.32 0.16 0.35
-0.01 0.32
-0.44 -1.92 ***
0.01 -0.09 -0.50 ** -0.94 ***
Negative review Positive review
AA A
BBB BB
18 91
112 16
0.342 0.856 * 0.694
-0.573
0.160 2.408 *** 0.190 0.033
-0.089 0.653 *** 1.497 *** 1.212
0.477 1.581 *** 0.736 **
-1.156
. . . 0.10 0.29
-2.12 *
. . . -0.21 -0.50 ** -0.87 **
. . . -0.17 -0.84 * -1.13
. . . 0.10 0.29
-2.12 *
. . . -0.21 -0.50 ** -0.87 **
Negative outlook change Positive outlook change
AA A
BBB BB
15 107 126 52
0.031 -0.002 -0.274 5.543 **
2.539 0.003 0.739
-0.980
-0.221 0.097 0.373 *** 0.214
0.378 -0.247 -0.107 -0.177
4 26 89 24
0.87 -0.24 -0.41 -0.22
0.43 -0.08 -0.16 -0.40
0.04 0.21
-0.30 *** -0.81 **
0.21 -0.65 * -0.65 -2.29 **
* indicates significance at the 10% level; ** indicates significance at the 5% level; *** indicates significance at the 1% level.
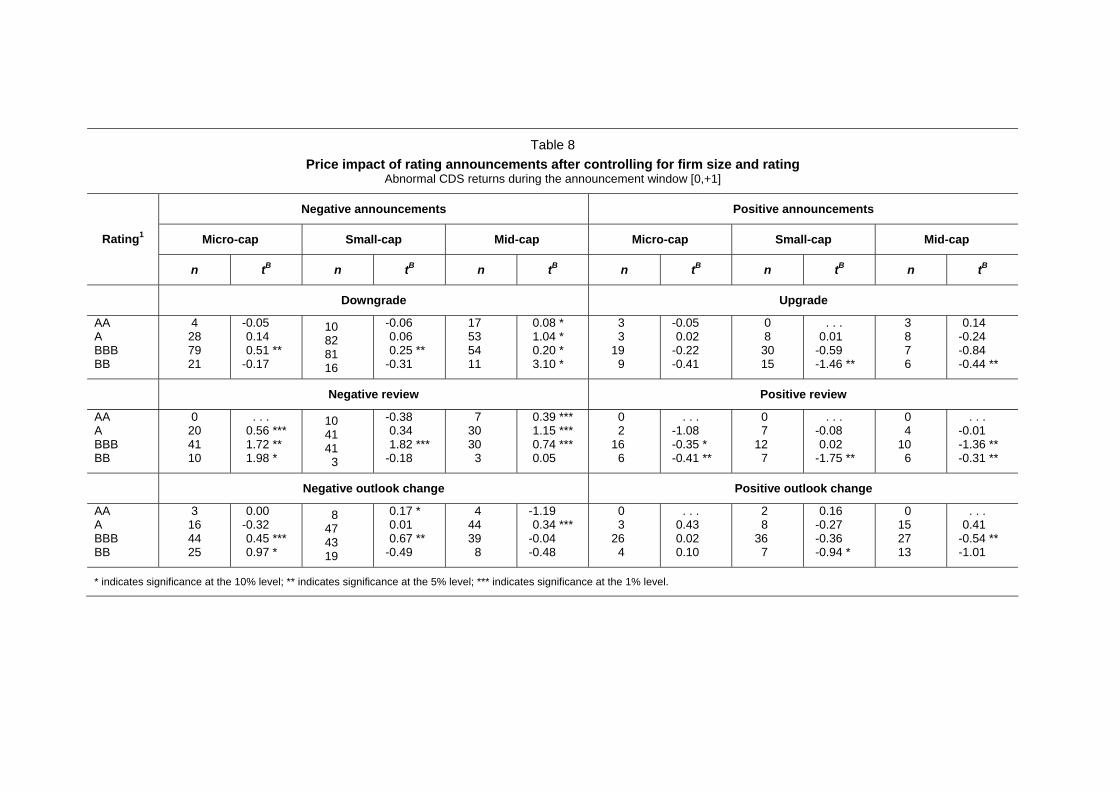
Table 8 Price impact of rating announcements after controlling for firm size and rating
Abnormal CDS returns during the announcement window [0,+1]
Negative announcements Positive announcements
Micro-cap Small-cap Mid-cap Micro-cap Small-cap Mid-cap Rating1
n tB n tB n tB n tB n tB n tB
Downgrade Upgrade
AA A BBB BB
4 28 79 21
-0.05 0.14 0.51 **
-0.17
10 82 81 16
-0.06 0.06 0.25 **
-0.31
17 53 54 11
0.08 * 1.04 * 0.20 * 3.10 *
3 3
19 9
-0.05 0.02
-0.22 -0.41
0 8 30 15
. . . 0.01
-0.59 -1.46 **
3 8 7 6
0.14 -0.24 -0.84 -0.44 **
Negative review Positive review
AA A BBB BB
0 20 41 10
. . . 0.56 *** 1.72 ** 1.98 *
10 41 41 3
-0.38 0.34 1.82 ***
-0.18
7 30 30 3
0.39 *** 1.15 *** 0.74 *** 0.05
0 2
16 6
. . . -1.08 -0.35 * -0.41 **
0 7
12 7
. . . -0.08 0.02
-1.75 **
0 4
10 6
. . . -0.01 -1.36 ** -0.31 **
Negative outlook change Positive outlook change
AA A BBB BB
3 16 44 25
0.00 -0.32 0.45 *** 0.97 *
8 47 43 19
0.17 * 0.01 0.67 **
-0.49
4 44 39 8
-1.19 0.34 ***
-0.04 -0.48
0 3
26 4
. . . 0.43 0.02 0.10
2 8
36 7
0.16 -0.27 -0.36 -0.94 *
0 15 27 13
. . . 0.41
-0.54 ** -1.01
* indicates significance at the 10% level; ** indicates significance at the 5% level; *** indicates significance at the 1% level.
Graph 1 Rating announcements concerning Aon Corporation
1 Prices are indexed to 31.Dec.04 = 100. 2 Senior unsecured debt rating. 3 Long-term local issuer rating.
Sources: Bloomberg; Markit
0
75
150
225
300
01.Jul.03 27.Aug.03 23.Oct.03 19.Dec.03 19.Feb.04 16.Apr.04 15.Jun.04 11.Aug.04 07.Oct.04 03.Dec.04 01.Feb.05 31.Mar.05
Equity price (lhs)
CDS price (lhs)
Fitch rating
S&P rating
Moody's rating
A
BBB+
BBB
BBB-
A-
13.Aug.03: S&P changed its outlook to negative
21.Oct.04: S&P downgraded AOC andplaced it on review for another downgrade22.Oct.04: Fitch placed AOC on review for downgrade
4.Mar.04: S&P concluded its review; Fitch downgraded AOC
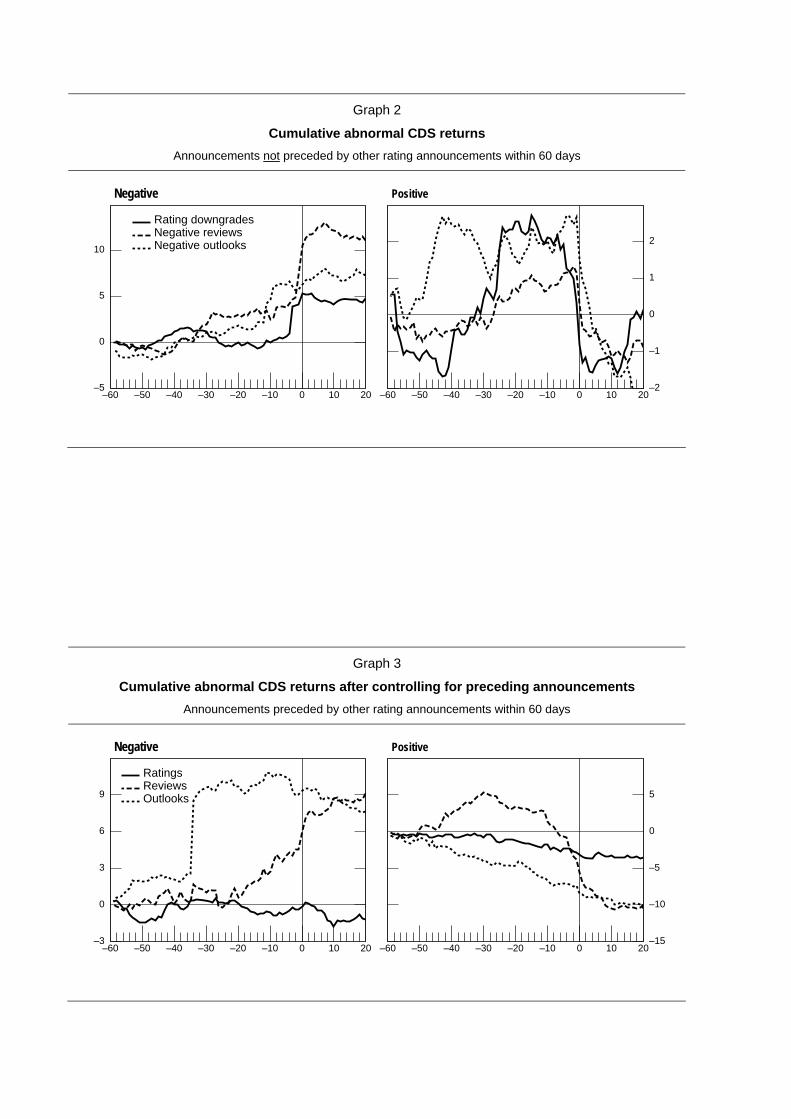
Graph 2
Cumulative abnormal CDS returns Announcements not preceded by other rating announcements within 60 days
–5
0
5
10
–60 –50 –40 –30 –20 –10 0 10 20–2
–1
0
1
2
–60 –50 –40 –30 –20 –10 0 10 20
Rating downgradesNegative reviews Negative outlooks
Negative Positive
Graph 3
Cumulative abnormal CDS returns after controlling for preceding announcements Announcements preceded by other rating announcements within 60 days
–3
0
3
6
9
–60 –50 –40 –30 –20 –10 0 10 20–15
–10
–5
0
5
–60 –50 –40 –30 –20 –10 0 10 20
Ratings Reviews Outlooks
Negative Positive
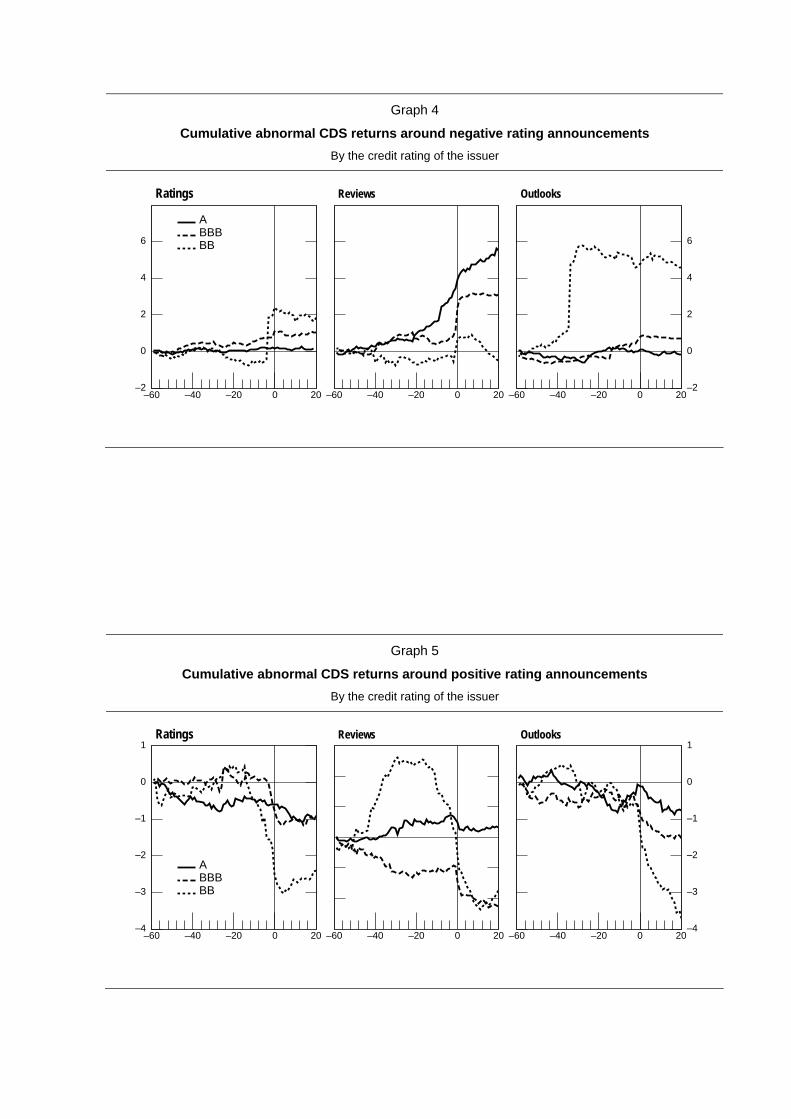
Graph 4
Cumulative abnormal CDS returns around negative rating announcements By the credit rating of the issuer
–2
0
2
4
6
–60 –40 –20 0 20 –60 –40 –20 0 20–2
0
2
4
6
–60 –40 –20 0 20
A BBBBB
Ratings Reviews Outlooks
Graph 5
Cumulative abnormal CDS returns around positive rating announcements By the credit rating of the issuer
–4
–3
–2
–1
0
1
–60 –40 –20 0 20 –60 –40 –20 0 20–4
–3
–2
–1
0
1
–60 –40 –20 0 20
A BBBBB
Ratings Reviews Outlooks