the effect of warnings on irresponsible ….… · 1 the effect of warnings on irresponsible online...
TRANSCRIPT
Benjamin Timmermans
Monique van Maare
Eva Zinger-Mityok
THE EFFECT OF WARNINGS ON
IRRESPONSIBLE ONLINE PURCHASE
BEHAVIOUR
Research Challenge
Technical Report

1
THE EFFECT OF WARNINGS ON IRRESPONSIBLE ONLINE PURCHASE
BEHAVIOUR1*
TECHNICAL REPORT
Benjamin Timmermans, Monique van Maare & Eva Zinger-Mityok†
April 2018
Abstract
Consumers take financially irresponsible decisions when they buy products that they cannot
really afford. We pose that online buying in particular has a low associated "pain of paying"
and therefore carries a higher risk of irresponsible spending. In our research, we investigate
the effectiveness of warnings during online payments in triggering more responsible
decision-making. We hypothesize that this "last moment" before committing to a purchase
can be used to raise the pain of paying, by highlighting the opportunity costs of the purchase,
thereby lowering the purchase rate. Through crowdsourced data gathering, we find that
warnings are an effective mechanism to reduce spending, and that severe warnings are the
most effective ones. We confirm that these warnings are associated with a more negative
emotional response, which we attribute to a higher pain of paying. Our results provide
insights for further study, in particular on warning types and the effects on high-risk buyer
demographics, and are encouraging for future implementation in online payment
applications.
Keywords: Nudges, Warnings, Online payments, Pain of paying
* This report has been prepared by the authors for the Think Forward Initiative – Research Challenge. † Timmermans: IBM, email: [email protected]. Van Maare: IBM, email: [email protected]. Zinger-
Mityok: [email protected]

2
Economics has long assumed people behave
rationally and use their resources in an optimal way
by weighing their choices and deciding what is in
their best interest. When considering the options, it
is not only about what we end up choosing, but also
the alternatives we give up on. While this seems
logical, in practice people rarely think about
opportunity costs. Ariely and Kreisler argue that this
lack of consideration for the opportunity costs "is our
biggest money mistake and the reason we make
many other mistakes" (Ariely, & Kreisler, 2017).
When this lack of consideration of our future
interests leads to unpaid credit card bills or
mortgage payments, then it becomes problematic,
not just for the individuals themselves, but for a
society as a whole. International statistics paint a
bleak picture: according to Dutch financial advice
organisation Nibud, 37% of households in the
Netherlands have issues paying back their debts,
and for 22% their situation is considered
problematic (Van der Schors et.al, 2015). Credit card
debt in the US is at an all-time high of $6.534,- per
person1 and the in the UK is reportedly “in the grip of
a personal debt crisis” with levels of unsecured
borrowing predicted to hit a record of £19,000.- per
household in 20222, and household debt reaching
£1,887 billion last year. (Harari, 2017).
The growth of online shopping poses further
challenges to manage our finances well. Advanced
and targeted marketing, social media pressure and
attractive product presentation all contribute to us
spending more: worldwide online spending has
grown to 1.9 trillion US$ in 2016 and expecting to
grow to 4 trillion US$ in 20203. In 2017, e-retail sales
accounted for 10.2 percent of all retail sales
worldwide, and this figure is expected to reach 17.5
percent in 20214.
The user experience for online payments also
continues to improve, with features like wallets, one-
click ordering and shortened authentication
processes lowering the “pain” we feel when we shop
online.
The “pain of paying” in Zellermayer’s original
definition, is a “direct and immediate displeasure or
pain from the act of making a payment,” and is
generally & Matthijsen, 2013). The two main
determinants of the “pain of paying” are:
1. The temporal gap between payment and
consumption - This refers to the time gap
between payment and consumption. The less
we link the act of payment to the consumption
itself, the more we consume.
2. The salience of the payment situation - This
refers to the payment method, and the
attention this creates to the payment details
such as the payment amount. Having to take
out our wallet and counting the cash we are
handing over results in more “pain” than a one-
click payment at online shopping or a quick
signature on the credit-card bill. We are more
conscious of the amount we are spending, and
feel more like we are "parting" with our money.
Given these components, paying with credit cards,
for example, is shown to cause higher levels of
spending than paying with cash (Van der Horst &
Matthijsen, 2013). Online payments have several
characteristics that further lower the associated
1. Introduction

3
pain of paying compared to credit card payments.
The payment action is often further removed from
the time of consumption, and the payment action
itself is increasingly easy and abstract. So, as our
buying habits shift towards increasingly low-pain
methods, we expect that the issue of irresponsible
online payments is also likely to grow.
What is needed to create more financially
responsible behaviour? Financial literacy education
geared towards improving forward-thinking
financial capability, like “how to save for retirement”
or “how to select a mortgage” tend to have limited
impact on our day-to-day actions. Even experts get
it wrong - in the US 46% of financial advisors do not
have a retirement plan themselves (Ariely & Kreisler,
2017). Education and awareness are often not
sufficient - to override the desire for the short-term
gratification associated with consumption, we need
stronger levels of self-control at key decision
moments (Ariely & Kreisler, 2017).
Thaler and Sunstain have argued that “nudges” offer
a more effective way to steer people towards better
choices. (Thaler & Sunstein, 2008). Nudging is a way
to limit the options available, so that we do not have
to rely on self-control alone to help us act
responsibly. So how can we "nudge" people towards
financially responsible behaviour? Creating effective
"triggers" in their day-to-day digital actions may
offer a better chance of success. (Weinmann et al,
2016).
In our research, we create these “digital nudges” by
adding a warning to the payment screen at the time
participant is about to complete a payment,
highlighting a possible consequence of the
payment. The aim of our research is to see if people
will be more likely to cancel an irresponsible
purchase if they receive a reminder for its
opportunity cost. By raising awareness of the
opportunity costs of the purchase right at the time
of payment, we aim to create a "last chance"
moment of consciously weighing the purchase
need, benefits and costs.
We define irresponsible purchases for the purpose
of our research, as a purchase for which the bank
account of the purchaser contains insufficient funds,
so would lead to the person going into overdraft.
To compare the number of irresponsible purchase
we define the purchase ratio as the ratio of
purchases that are completed (as opposed to
cancelled by the user) to the overall number of
purchases. A purchase ratio of 40% means that 60%
of the purchases were cancelled by the participants.
Hypotheses
Our base hypothesis is that financial warnings
presented at the moment of payment decrease the
number of a financially irresponsible purchases, or
the purchase ratio. We hypothesize what type of
warnings will be most effective in decreasing the
purchase ratio:
H1. Severe warnings decrease the purchase ratio
more than less severe warnings (experiment 1)
H2. Short-term consequences decrease the
purchase ratio more than longer-term
consequences (experiment 2)
H3. Concrete consequences decrease the purchase
ratio more than abstract consequences
(experiment 2)

4
2.1 Overview
To validate our hypotheses, our experiments consist
of a questionnaire in which we simulate online
purchases of shoes, electronics or concert tickets.
These products were chosen as items that are
generally desired, but not always essential, and
within a similar price range. Once the participants
have chosen their preferred object to purchase, they
are presented with a brief description of the
purchase situation, and the payment screen, where
the participant can choose to "buy" or "cancel" the
product. For every purchase, the bank account
balance is lower than the price they are about to
pay, therefore completing the payment means
going into debt. We vary the warning messages at
the time of payment, and record whether the
participant decides to cancel rather than buy the
product. The participants' purchase decisions are
aggregated to calculate the purchase ratio: the
percentage of products purchased compared to all
purchases.
2.2 Experimental setup
Our study consisted of two experiments, conducted
serially. In experiment 1, the effect of financial
warnings on the purchase ratio was tested by
comparing the purchase ratio without a warning at
the moment of payment to the purchase ratio in
case of a suggestion and a more severe warning.
This experiment evaluated hypothesis 1.
In experiment 2 the participants were presented
with warnings with a short-term or long-term
consequence, and with warnings varying in
concreteness (financial/numerical, or more
abstract). In this experiment, we compared the
effectiveness of these different types of warnings,
evaluating hypothesis 2 and 3.
Both experiments used a questionnaire consisting of
three pre-questions, followed by three purchase
scenarios with randomized warning messages, and
four post-questions to evaluate the emotional
impact of the warnings, the financial capability of
the participant, and the participants’ appreciation of
the functionality.
The main difference between the two experiments
was in the warning messages that were shown at
the time of payment.
2.2.1 Pre-questions
Both questionnaires started with three pre-
questions which were used to select the details in
the remainder of the questionnaire. Participants
were asked about their income level, their product
preference and their name.
The goal of asking for the income level was two-fold.
First, we wanted to ensure that the product price
corresponded to what a person with that income
range would generally be willing to pay for the
chosen product. We determined relevant pricing for
our original Dutch questionnaire from the survey on
household spending from the Dutch Central Bureau
of Statistics (CBS) 5. In this overview, average yearly
spending per product category is given for different
Dutch income brackets. For the English
questionnaire, we adjusted the income brackets
based on US income ranges6, the associated prices
per income bracket were kept constant. The second
reason to request the participant’s income was to be
2. Methodology
5
able to validate if the income level would affect the
response to different warnings.
Next, participants were asked to choose which
product they would most like to buy: electronics,
concert tickets or shoes. We selected these three
products to create a comparable level of interest for
the purchase across the test population, since
according to the CBS data, all income brackets spend
on average similar amounts on these products per
year (around 1%).
Lastly, the participants were also asked to fill in their
names, to create a more realistic situation on the
payment screen. Names and other identifying
elements have been removed from the results file,
as indicated to the participant at the start of the
task.
2.2.2 Purchase scenarios
Once the pre-questions were completed, the
participants were shown three consecutive purchase
scenarios for the product of their choice. After each
scenario, they were asked to record their emotional
state.
To increase the resemblance to a real purchase, a
guiding description of the situation was written to
trigger their desire to buy the product. These guiding
texts were always shown in the same order to create
a storyline, emphasizing that the scenarios are
independent and take place months away from
each other, throughout a full year. The participants
then saw a picture representing the product and the
payment screen, modelled after the ING Bank iDeal
payment screen.
To create an irresponsible buying condition, all
scenarios are designed to create an overdraft
situation. The price of the products was set up based
on the income brackets selected by the participant
in the pre-questions. In all scenarios, the price of the
product exceeded the available bank account
balance, corresponding to approximately 50% of the
product price. So, if the shoes cost $200, - the current
bank account held around $100, - and completing
the purchase would make the participant go into
debt.
A small variation in the payment amount was added
to help the participant see the three purchases as
three distinct transactions. The prices for the
participants’ income bracket were adjusted with -
$10, $0 and +$10, randomly distributed to each of
the three scenarios presented.
Each purchase was accompanied by a different
warning. The warning scenarios as well as the
product images were presented to the participant in
random order. The warnings presented to the user
vary in warning severity (experiment 1), warning
timing (experiment 2), and warning concreteness
(experiment 2).
Warning severity refers to the level of danger in the
expected negative consequence that is expressed
with the warning. "Are you sure?" expresses a lower
level of danger than "Warning!" Our “no warning”
condition, where the participant sees the payment
screen but receives no warning, corresponds to the
lowest severity level.
Warning timing refers to the timeframe that a
described consequence will take effect: this week,
this month, or this year.
Warning concreteness refers to the level of
abstraction in the warning messages. For example,
"You may not be able to do further purchase this

6
month" is more abstract than "You will pay $14 in
interest this month."
The detailed warnings for the two experiments are
described in sections 2.3.1 Scenarios of experiment
1 and 2.3.2: Scenarios of experiment 2.
In the screen showing the payment as well as the
random warning, the participant was then
requested to select “buy” or “cancel” for this
purchase. The purchase ratio is calculated by the
number of bought products divided by the total
number of products.
To understand if our participants were emotionally
affected by the warnings after their buy or cancel
action, we assessed the emotional response
immediately after the cancel or purchase decision. If
highlighting the consequence of a payment is
effective by raising the “pain of paying”, then we
would expect that more effective warnings should
trigger more negative emotions. We used Ritchins'
Consumer Emotional Scale (CES) (Richins, 2007). This
scale was developed specifically to assess buyer
emotions. The scale consists of 47 terms, balanced
in terms of positive and negative ones. Richins notes
that researches do not need to use the entire
spectrum of the scale, but can choose the emotional
categories that are appropriate for the specific
research situation. We selected the 10 most relevant
emotions for our payment situation: satisfied,
happy, excited, relieved, angry, unhappy, worried,
sad, ashamed, guilty. Participants could also answer
“I don´t know.”
2.2.3 Post-questions
Having completed the purchase scenarios, the
participants were asked to answer questions
validating their level of financial capability, their
rationale for cancelling any of the purchases, and
their appreciation for the functionality. The answers
to these post-questions are used in further
interpreting our results.
We validated participants’ financial capability using
two relevant questions from the OECD Financial
Behaviour scale (Atkinson, 2016): "Before I buy
something I carefully consider whether I can afford it”
and "I pay my bills on time." The answers are scored
in the following way: for “Agree” participants
received 1 point, for “Disagree” or “I don't know” the
participants received 0 points. This corresponds to
scoring in the OECD study, which uses a Likert scale,
but as in our setup, counts the responses "very
likely" and "likely" as a 1-point score, and the
remaining answers as 0-point scores. The sum of
these two scores was taken as a measure to
approximate the financial capability of the
participant (low, medium or high).
If the participant cancelled a payment, this could be
the result of the persuasive warning, and the
resulting judgment by the participant that the
purchase is financially irresponsible. Alternatively,
they may cancel the payment because they dislike
the product being shown, or consider the price too
high, or are bored or inattentive to the task. The
experimental setup randomizes the warning
messages, so any significant difference in purchase
ratio with different warnings is assumed to be the
effect of the warning itself. However, to further
validate this, the participant was asked to select
their “reason for cancelling” in a post-question.
Furthermore, we wanted to learn whether
participants would appreciate having this kind of
warning functionality. Participants were asked, after
completing the questionnaire, if they would turn on
such functionality if it was made available.

7
Lastly, the participants were able to leave their free-
format comments about the questionnaire and the
functionality. The comments were collected and
scored based on the topic and positive or negative
sentiment expressed.
2.3 Warning scenarios
2.3.1 Warning scenarios of Experiment 1
In the first experiment the effect of the severity of
warnings in online purchases was tested. The
scenario’s tested were: a scenario with no warning,
a scenario with a light suggestive warning not to
purchase, and a scenario with a severe warning,
stating the participant has insufficient funds in their
bank account at this time.
The language of the notification messages was
derived from warning messaging generally used in
online applications. The notifications, as can be seen
in table 1, draw the participant's attention to the
consequence of the payment with increasing
severity.
As described in the methodology section, each
participant was asked to complete three purchase
scenarios. The explanatory storyline is presented in
the same order to all participants, while the three
warnings are presented to the participant in random
order.
Figure 1: Template design for the scenario where the participant is given a warning about the potential financial
consequence of the transaction
.
Table 1: Scenarios for Experiment 1
Scenario Notification
No warning -
Suggestion Are you sure? You may not be able to do any further purchases this month.
Warning Warning! You have insufficient balance to complete this purchase.

8
2.3.2 Scenarios of Experiment 2
In the second experiment, we tested the
effectiveness of warnings with varying timing and
concreteness. Warning timing refers to short-term
consequences, now, versus medium and long-term
consequences, in a month's time, in a year's time.
We would like to understand how adding short-term
versus long-term consequences of the payment
impacts the decision to cancel the purchase.
We would also like to understand if the concreteness
of a consequence may positively impact the
purchase ratio. Warning concreteness compares a
more abstract consequence to a concrete financial
consequence.
We also included an alternative value consequence.
Consequences of a purchase are typically financial
in nature: the buyer may go into overdraft, or will
not be able to reach their savings target. But
alternative consequence types are also possible.
Previous studies have shown that people regard
different forms of value differently, even if they
represent equal monetary value. In particular, one
study showed that translating monetary value into
"hours worked" would typically lower its appeal." In
short, we found that the consideration of time is not
a remedy to induce more responsible spending
decisions. The main identified reason for this is time
misperception and underweighting of its
opportunity cost" (StarTeam, 2017).
So, as part of our warning setup, we include a
condition that highlights the consequence of a
purchase by translating the value of the purchase
into equivalent work hours. Although this provides a
concrete numerical consequence (the purchase
corresponds to doing approximately 7 hours of work
in figure 2), based on our previous study we would
expect that consequences identified in terms of
hours of work would be less effective in preventing
irresponsible payments than other more concrete
financial warnings. The resulting set of scenario’s is
listed in Table 2.
Figure 2: Financial warning expressed in the equivalent hours of work.
9
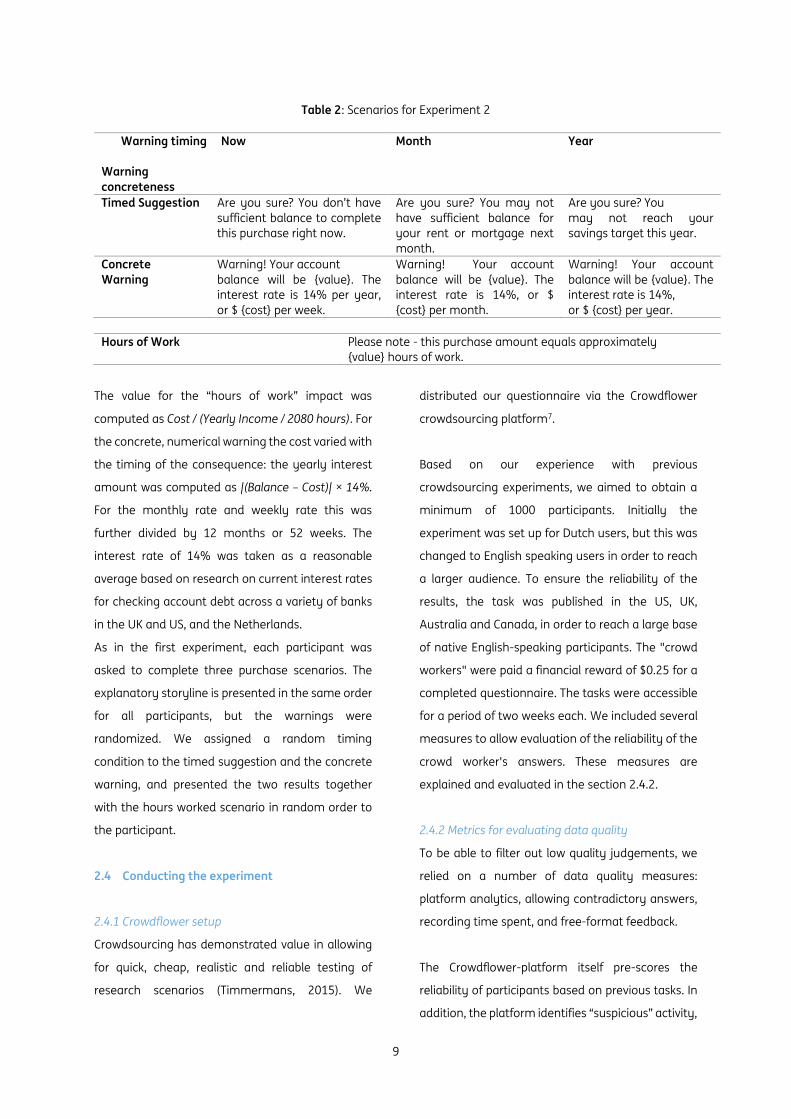
Table 2: Scenarios for Experiment 2
Warning timing
Warning
concreteness
Now
Month
Year
Timed Suggestion
Are you sure? You don’t have
sufficient balance to complete
this purchase right now.
Are you sure? You may not
have sufficient balance for
your rent or mortgage next
month.
Are you sure? You
may not reach your
savings target this year.
Concrete
Warning
Warning! Your account
balance will be {value}. The
interest rate is 14% per year,
or $ {cost} per week.
Warning! Your account
balance will be {value}. The
interest rate is 14%, or $
{cost} per month.
Warning! Your account
balance will be {value}. The
interest rate is 14%,
or $ {cost} per year.
Hours of Work Please note - this purchase amount equals approximately
{value} hours of work.
The value for the “hours of work” impact was
computed as Cost / (Yearly Income / 2080 hours). For
the concrete, numerical warning the cost varied with
the timing of the consequence: the yearly interest
amount was computed as |(Balance – Cost)| × 14%.
For the monthly rate and weekly rate this was
further divided by 12 months or 52 weeks. The
interest rate of 14% was taken as a reasonable
average based on research on current interest rates
for checking account debt across a variety of banks
in the UK and US, and the Netherlands.
As in the first experiment, each participant was
asked to complete three purchase scenarios. The
explanatory storyline is presented in the same order
for all participants, but the warnings were
randomized. We assigned a random timing
condition to the timed suggestion and the concrete
warning, and presented the two results together
with the hours worked scenario in random order to
the participant.
2.4 Conducting the experiment
2.4.1 Crowdflower setup
Crowdsourcing has demonstrated value in allowing
for quick, cheap, realistic and reliable testing of
research scenarios (Timmermans, 2015). We
distributed our questionnaire via the Crowdflower
crowdsourcing platform7.
Based on our experience with previous
crowdsourcing experiments, we aimed to obtain a
minimum of 1000 participants. Initially the
experiment was set up for Dutch users, but this was
changed to English speaking users in order to reach
a larger audience. To ensure the reliability of the
results, the task was published in the US, UK,
Australia and Canada, in order to reach a large base
of native English-speaking participants. The "crowd
workers" were paid a financial reward of $0.25 for a
completed questionnaire. The tasks were accessible
for a period of two weeks each. We included several
measures to allow evaluation of the reliability of the
crowd worker's answers. These measures are
explained and evaluated in the section 2.4.2.
2.4.2 Metrics for evaluating data quality
To be able to filter out low quality judgements, we
relied on a number of data quality measures:
platform analytics, allowing contradictory answers,
recording time spent, and free-format feedback.
The Crowdflower-platform itself pre-scores the
reliability of participants based on previous tasks. In
addition, the platform identifies “suspicious” activity,
10
such as multiple questionnaires sent from the same
IP-address. These were immediately removed from
the datasets.
In crowdsourcing experiments generally, unreliable
judgments can be identified by comparing the
answers of participants across their input data. In
our experiments there was only a single instance of
the crowdsourcing task, containing the three
scenarios to be completed. Therefore, we relied on
allowing the contributors to give contradicting
answers within the questionnaire to a number of
validation questions, a method that was previously
applied successfully (Timmermans et al, 2015).
These validation questions were embedded as post-
questions.
First, in the statements to validate financial
capability, the participant could select multiple
options from “Agree,” “Disagree” and “I don’t know.”
If the participant selected Agree as well as Disagree,
this participant’s answers were deemed unreliable
and removed from the dataset.
Furthermore, we allowed contradiction in the post-
question about the reason for cancelling a payment.
The possible answers to this question were: “It was
not financially responsible”, “I didn´t want to buy the
product” or “Not applicable (I bought all three
products)”. In the case where a participant bought
all products, but still gave a reason for cancelling, as
well as in the case where a user cancelled all three
purchases but nevertheless chose “not applicable (I
bought all three products),” these answers were
rated as contradicting, and the data of these
participants was judged unreliable and removed.
Aside from detecting contradicting answers, we also
recorded time spent on each scenario. Participants
that spent less than three seconds on any scenario,
were also not considered reliable, as they would not
have had sufficient time to read the actual payment
and warning text.
In the free-format feedback, five users indicated that
they could not always cancel the purchase because
the cancel button did not work. Through this
feedback we identified an issue with the
questionnaire with a limited number of mobile
operating systems on Android or iPhone devices. We
removed all participants in this situation from the
data.
As a result of these measures, 428 participants
(27,6%) were removed from the results.
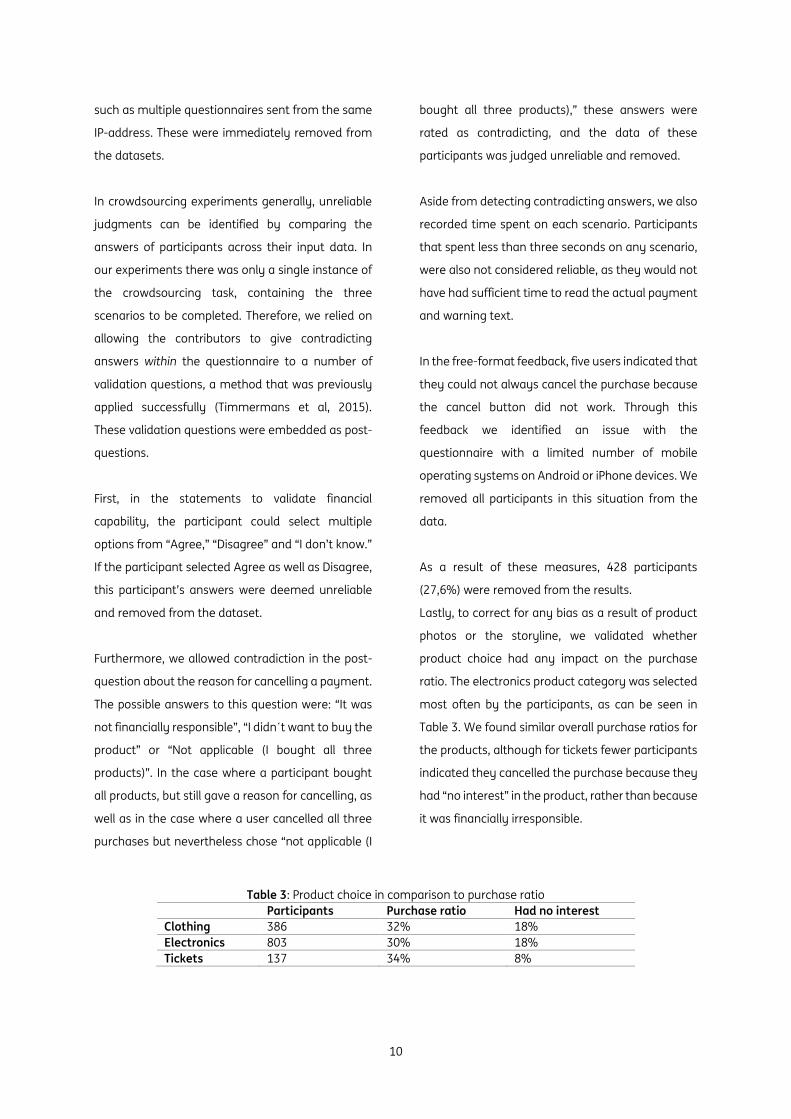
Lastly, to correct for any bias as a result of product
photos or the storyline, we validated whether
product choice had any impact on the purchase
ratio. The electronics product category was selected
most often by the participants, as can be seen in
Table 3. We found similar overall purchase ratios for
the products, although for tickets fewer participants
indicated they cancelled the purchase because they
had “no interest” in the product, rather than because
it was financially irresponsible.
Table 3: Product choice in comparison to purchase ratio
Participants Purchase ratio Had no interest
Clothing 386 32% 18%
Electronics 803 30% 18%
Tickets 137 34% 8%

11
3.1 Participation
The two experiments were run on crowdsourcing
platform CrowdFlower for a period of two weeks
each. As can be seen in Table 4, The first experiment
was performed by 925 participants, and the second
experiment by 628 participants. Each participant
judged three scenarios, resulting in 4659
judgements. Based on the data validation
measurements discussed in section 2.4.2 27,6% of
participants were removed, resulting in a total of
3375 judgments, 1872 for experiment 1 and 1503
for experiment 2.
Filtering out these potentially unreliable answers
increased the probability that the remaining data
were reliable. In the following sections the
hypotheses will be evaluated based on these
datasets. The full dataset and code used to filter and
aggregate the data can be downloaded from github.
3.2 Decreasing financially irresponsible
purchases
3.2.1 Results of Experiment 1
The objective of the first experiment was to assess
whether warnings at the time of payment reduce
financially irresponsible purchases, with our first
hypothesis that more severe warnings are more
effective in decreasing the number of financially
irresponsible purchases.
In the control scenario - a purchase without a
warning - the purchase ratio was 50%. This means
that half of the population completed the purchase,
despite going into overdraft as a result. Comparing
this baseline to the two warning conditions, the
suggestion ("Are you sure?") and the more severe
warning ("Warning!") it is evident that the warnings
are effective in reducing the purchase ratio, with the
warning lowering the purchase ratio by 39
percentage points, or 78%.
The results for experiment 1 are shown below in
Table 5.
Using ANOVA, we find that the difference in
purchase ratio between the three warning
conditions is significant (F=57.4 p=2.95e-25). We
conclude that the warning messages effectively
decreased the purchase ratio, and we accept our
first hypothesis that more severe warnings decrease
the ratio of financially irresponsible purchases.
Table 4: Number of judgments gathered per experiment
Participants Low quality Used in
Analysis
Scenarios Judgments
Experiment 1 925 301 624 3 1872
Experiment 2 628 127 501 3 1503
Total 1553 428 1125 6 3375
3. Results and Discussion
12
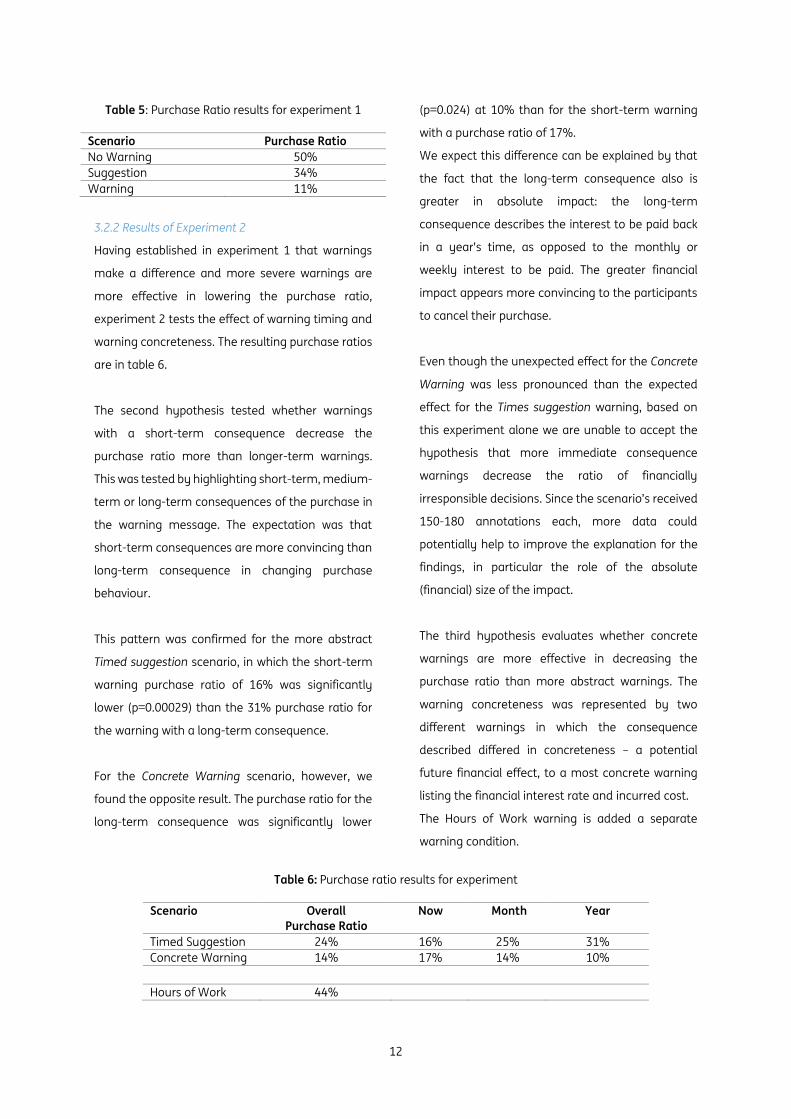
Table 5: Purchase Ratio results for experiment 1
Scenario Purchase Ratio
No Warning 50%
Suggestion 34%
Warning 11%
3.2.2 Results of Experiment 2
Having established in experiment 1 that warnings
make a difference and more severe warnings are
more effective in lowering the purchase ratio,
experiment 2 tests the effect of warning timing and
warning concreteness. The resulting purchase ratios
are in table 6.
The second hypothesis tested whether warnings
with a short-term consequence decrease the
purchase ratio more than longer-term warnings.
This was tested by highlighting short-term, medium-
term or long-term consequences of the purchase in
the warning message. The expectation was that
short-term consequences are more convincing than
long-term consequence in changing purchase
behaviour.
This pattern was confirmed for the more abstract
Timed suggestion scenario, in which the short-term
warning purchase ratio of 16% was significantly
lower (p=0.00029) than the 31% purchase ratio for
the warning with a long-term consequence.
For the Concrete Warning scenario, however, we
found the opposite result. The purchase ratio for the
long-term consequence was significantly lower
(p=0.024) at 10% than for the short-term warning
with a purchase ratio of 17%.
We expect this difference can be explained by that
the fact that the long-term consequence also is
greater in absolute impact: the long-term
consequence describes the interest to be paid back
in a year’s time, as opposed to the monthly or
weekly interest to be paid. The greater financial
impact appears more convincing to the participants
to cancel their purchase.
Even though the unexpected effect for the Concrete
Warning was less pronounced than the expected
effect for the Times suggestion warning, based on
this experiment alone we are unable to accept the
hypothesis that more immediate consequence
warnings decrease the ratio of financially
irresponsible decisions. Since the scenario’s received
150-180 annotations each, more data could
potentially help to improve the explanation for the
findings, in particular the role of the absolute
(financial) size of the impact.
The third hypothesis evaluates whether concrete
warnings are more effective in decreasing the
purchase ratio than more abstract warnings. The
warning concreteness was represented by two
different warnings in which the consequence
described differed in concreteness – a potential
future financial effect, to a most concrete warning
listing the financial interest rate and incurred cost.
The Hours of Work warning is added a separate
warning condition.
Table 6: Purchase ratio results for experiment
Scenario Overall
Purchase Ratio
Now Month Year
Timed Suggestion 24% 16% 25% 31%
Concrete Warning 14% 17% 14% 10%
Hours of Work 44%

13
This pattern is confirmed, with the Concrete Warning
(14%) being more effective than the Timed
Suggestion (24%) in lowering the purchase ratio. The
difference in effect of the different warnings in
experiment 2 was significant (F=24.7 p=2.14e-11)
and the most concrete warning had the lowest
purchase ratio. Because of this we accept the third
hypothesis that more concrete warnings decrease
the purchase ratio more than warnings describing
more abstract consequences.
As expected, the Hours of Work scenario appears
fairly ineffective, only slightly lowering the purchase
ratio compared to the control scenario with no
warning in the first experiment.
3.3 Exploring other impacts on the purchase ratio
To further explore and understand our results, we
looked at a number of other relationships in our
data: whether the purchase ratios differed per
income bracket, whether financial capability
predicted the purchase ratio, and whether the
purchase decision had an impact on the emotional
response. We also discuss results on the
participants’ appreciation for the functionality.
In this section, we discuss combined data from
experiments 1 and 2.
3.3.1 Income
The first relationship investigated concerns the
income-bracket. The income bracket was asked as a
pre-question in order to create a relevant pricing for
the products for participants from each income
bracket. The income distribution was similar for both
experiments, with a participant count of 248 for
incomes up to $25k, 340 for $25k to $50k, 247 for
$50k to $75k, 182 for $75k to $100k and 108 above
$100k. The higher income groups were less
represented as expected in the crowdworker
population, yet frequent enough to be included in
the analysis.
Figure 3: Purchase ratio per income bracket for the different scenarios

14
Based on the income distribution we investigated
whether the purchase ratio varied with income. As
can be seen in Figure 3, overall the income did not
appear to have an influence on the purchase ratio,
with the purchase ratio remaining relatively
constant across all income brackets. One “outlier”
was the Suggestion scenario from experiment 1,
which for the $75k - $100k income bracket the
purchase ratio shows an unexplained peak.
When the purchase ratios for experiment 2 are
broken down in their different timing conditions,
however, the results do show differences per income
bracket, as can be seen in Figure 4. For the timed
suggestion warnings in red, the short-term
suggestion was most effective for the lowest income
brackets (9%). The longer-term suggestions
referring to year-end savings or month-end worries
were less convincing for this group at 30% and 34%
purchase ratios respectively. For the concrete
warnings in green, the long-term warning (with the
highest overall cost impact) was particularly
effective for high income groups. This warning
reduced the purchase ratio to zero for the highest
income group. For this group, the short-term
concrete warning (with the low overall cost impact)
is much less effective, possibly pointing to a different
impact-assessment strategy.
3.3.2 Financial capability
The financial capability of the participants was
measured with questions from the OECD-financial
behaviour scale (Atkinson, 2016).
To validate the answers from our participants, we
compare our results on these questions to those in
the OECD study. For the question "Before I buy
something I carefully consider whether I can afford
it," 91.5% of our participants agreed, compared to
79% in the reference study in OECD countries. For
the question "I pay my bills on time" our participants
agreed in 91.4% of the questionnaires, compared to
84% in OECD countries. (Atkinson, 2016). So, overall
our participants report themselves slightly more
capable than the population of the reference study.
Figure 4: Purchase ratio per income bracket for different timing consequences
15
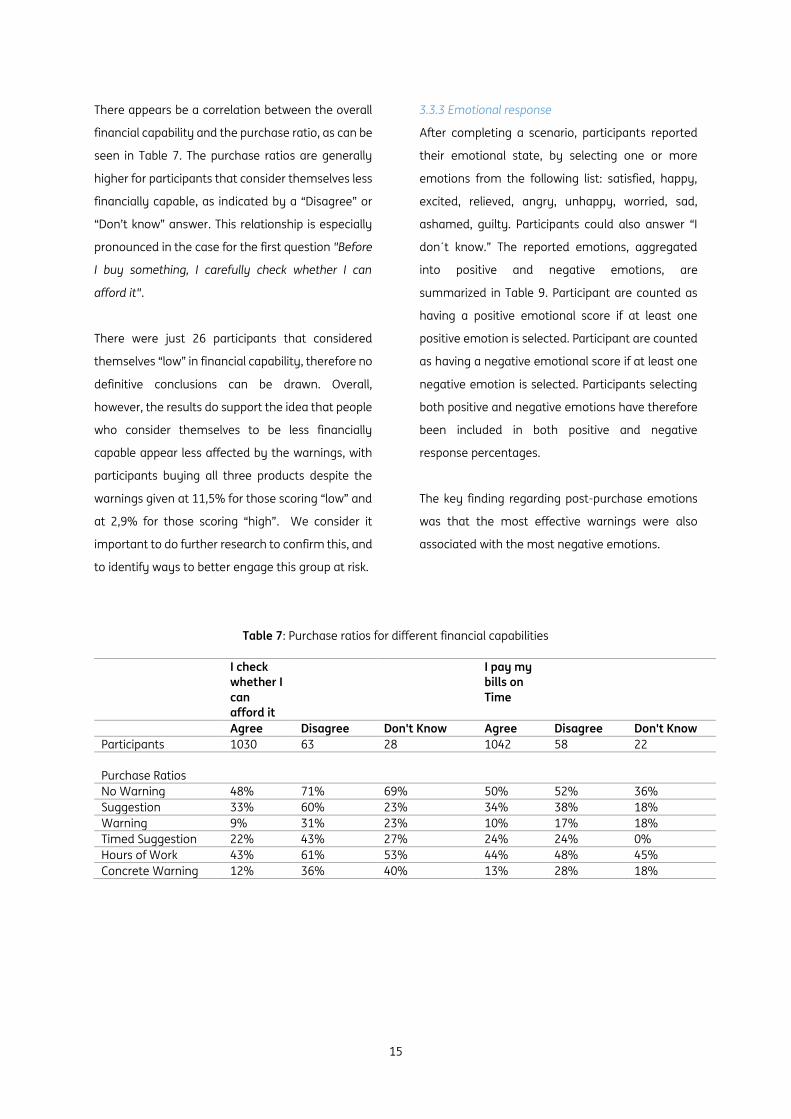
There appears be a correlation between the overall
financial capability and the purchase ratio, as can be
seen in Table 7. The purchase ratios are generally
higher for participants that consider themselves less
financially capable, as indicated by a “Disagree” or
“Don’t know” answer. This relationship is especially
pronounced in the case for the first question "Before
I buy something, I carefully check whether I can
afford it".
There were just 26 participants that considered
themselves “low” in financial capability, therefore no
definitive conclusions can be drawn. Overall,
however, the results do support the idea that people
who consider themselves to be less financially
capable appear less affected by the warnings, with
participants buying all three products despite the
warnings given at 11,5% for those scoring “low” and
at 2,9% for those scoring “high”. We consider it
important to do further research to confirm this, and
to identify ways to better engage this group at risk.
3.3.3 Emotional response
After completing a scenario, participants reported
their emotional state, by selecting one or more
emotions from the following list: satisfied, happy,
excited, relieved, angry, unhappy, worried, sad,
ashamed, guilty. Participants could also answer “I
don´t know.” The reported emotions, aggregated
into positive and negative emotions, are
summarized in Table 9. Participant are counted as
having a positive emotional score if at least one
positive emotion is selected. Participant are counted
as having a negative emotional score if at least one
negative emotion is selected. Participants selecting
both positive and negative emotions have therefore
been included in both positive and negative
response percentages.
The key finding regarding post-purchase emotions
was that the most effective warnings were also
associated with the most negative emotions.
Table 7: Purchase ratios for different financial capabilities
I check
whether I
can
afford it
I pay my
bills on
Time
Agree Disagree Don't Know Agree Disagree Don't Know
Participants 1030 63 28 1042 58 22
Purchase Ratios
No Warning 48% 71% 69% 50% 52% 36%
Suggestion 33% 60% 23% 34% 38% 18%
Warning 9% 31% 23% 10% 17% 18%
Timed Suggestion 22% 43% 27% 24% 24% 0%
Hours of Work 43% 61% 53% 44% 48% 45%
Concrete Warning 12% 36% 40% 13% 28% 18%
16
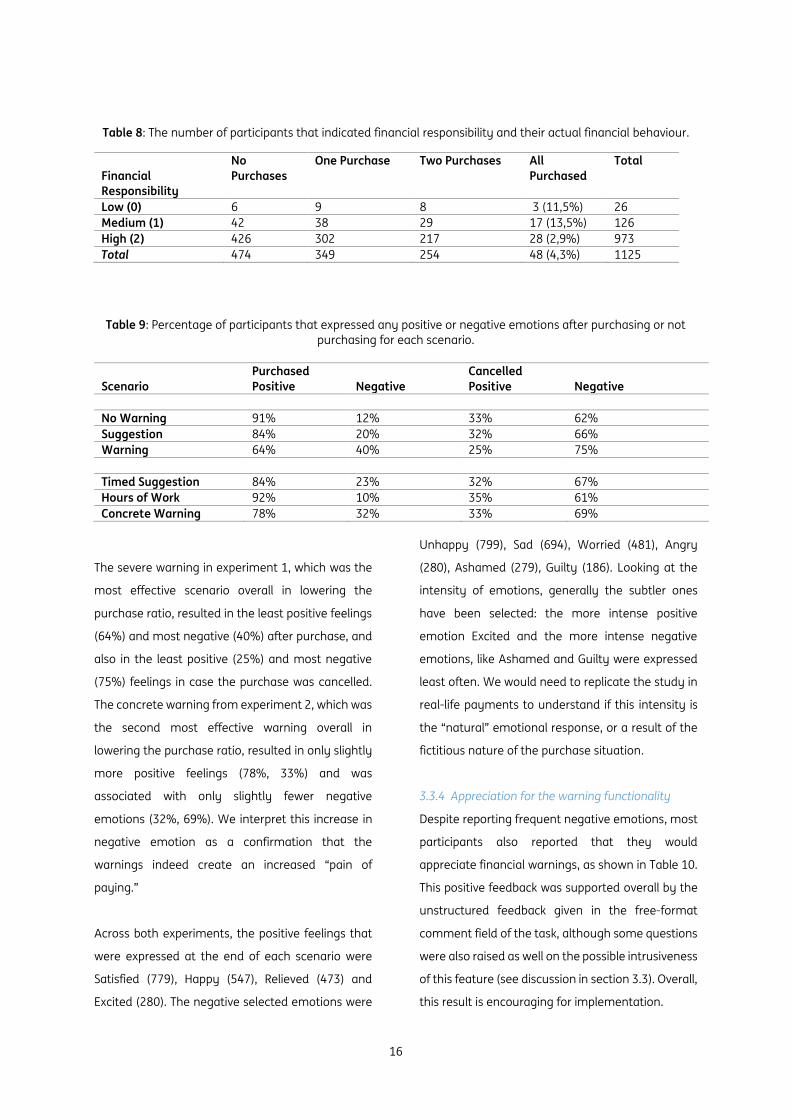
Table 8: The number of participants that indicated financial responsibility and their actual financial behaviour.
Financial
Responsibility
No
Purchases
One Purchase Two Purchases All
Purchased
Total
Low (0) 6 9 8 3 (11,5%) 26
Medium (1) 42 38 29 17 (13,5%) 126
High (2) 426 302 217 28 (2,9%) 973
Total 474 349 254 48 (4,3%) 1125
Table 9: Percentage of participants that expressed any positive or negative emotions after purchasing or not
purchasing for each scenario.
Scenario
Purchased
Positive
Negative
Cancelled
Positive
Negative
No Warning 91% 12% 33% 62%
Suggestion 84% 20% 32% 66%
Warning 64% 40% 25% 75%
Timed Suggestion 84% 23% 32% 67%
Hours of Work 92% 10% 35% 61%
Concrete Warning 78% 32% 33% 69%
The severe warning in experiment 1, which was the
most effective scenario overall in lowering the
purchase ratio, resulted in the least positive feelings
(64%) and most negative (40%) after purchase, and
also in the least positive (25%) and most negative
(75%) feelings in case the purchase was cancelled.
The concrete warning from experiment 2, which was
the second most effective warning overall in
lowering the purchase ratio, resulted in only slightly
more positive feelings (78%, 33%) and was
associated with only slightly fewer negative
emotions (32%, 69%). We interpret this increase in
negative emotion as a confirmation that the
warnings indeed create an increased “pain of
paying.”
Across both experiments, the positive feelings that
were expressed at the end of each scenario were
Satisfied (779), Happy (547), Relieved (473) and
Excited (280). The negative selected emotions were
Unhappy (799), Sad (694), Worried (481), Angry
(280), Ashamed (279), Guilty (186). Looking at the
intensity of emotions, generally the subtler ones
have been selected: the more intense positive
emotion Excited and the more intense negative
emotions, like Ashamed and Guilty were expressed
least often. We would need to replicate the study in
real-life payments to understand if this intensity is
the “natural” emotional response, or a result of the
fictitious nature of the purchase situation.
3.3.4 Appreciation for the warning functionality
Despite reporting frequent negative emotions, most
participants also reported that they would
appreciate financial warnings, as shown in Table 10.
This positive feedback was supported overall by the
unstructured feedback given in the free-format
comment field of the task, although some questions
were also raised as well on the possible intrusiveness
of this feature (see discussion in section 3.3). Overall,
this result is encouraging for implementation.

17
A correlation appears between participants’
appreciation for the functionality and their financial
capability score, with highly financially capable
participants reporting higher appreciation for the
functionality (81% vs 60%) and low financial
capability reporting higher percentages of “no
interest’ (20% vs. 15%). This further supports our
understanding that the “low capability” participants
are less affected by the current set of warnings and
less interested in being coached or reminded in this
way.
The general positive reception of the feature tested
here is also reflected in the participant feedback
received from the end of the questionnaire.
3.3 Participant feedback
The participants had the option to leave a free-
format comment about the questionnaire. Out of
202 relevant comments, 122 were explicitly positive
about the questionnaire and/or the functionality, 33
of these directly expressing thankfulness for raising
awareness and welcoming the functionality.
Five comments were explicitly negative, finding the
warnings condescending, intrusive or ‘pushy’. A
further 12 participants indicated that they check
their balance anyway before they complete a
purchase, suggesting that the functionality is
unnecessary
The “hours worked” warning received very mixed
feedback.
There were 18 participants who had some
misunderstandings regarding the task. Most of them
thought that the purchase would take place in a real
shop, not in a webshop, assuming that the sales
assistant would then be able to see their financial
information.
Another 5 people indicated that the cancel button
did not work for them, those questionnaires have
been removed from this evaluation as well as from
the data analysis, as discussed in section 2.4.2
Metrics for evaluating data quality.
Based on this unsolicited feedback from the
participants we can conclude that a majority of
participants would welcome such a functionality,
especially if privacy concerns were clarified and they
understood that the warnings are coming from their
own bank based on information the bank already
has access to.
Table 10: Ratio of participants that would appreciate the financial warning functionality.
Financial
Responsibility
Desire No Desire Don't know
Low 60% 20% 20%
Medium 73% 14% 13%
High 81% 15% 4%

18
4.1 Key outcomes
The key outcomes of this study are as follows:
1) Warnings at the time of payment are effective in
reducing irresponsible purchases. Warnings
highlighting a severe consequence are most
effective, reducing the purchase ratio by 39
percentage points, or 78%.
2) The most effective warnings are associated with a
more pronounced negative emotional response. We
interpret this as a reflection of a higher "pain of
paying" associated with these warnings.
3) Self-reported financial capability appears to have
a correlation with the purchase ratio. People who
self-report to be less financially capable are more
likely to buy a product they cannot really afford.
They appear to be less impacted by the warning
messages. Further research is needed to see how we
can most effectively trigger this group.
4) Income appears to influence the effect of
warnings: low-income participants were more
convinced in our study by short-term consequences
even when they were less concrete, high-income
participants were more affected by long-term
concrete consequences. Because the longer-term
messages were also higher in absolute impact,
further research is needed to better interpret these
results.
4.2 Future work
While our base hypothesis that warnings lower the
purchase ratio, and our first two hypotheses
concerning the impact of the severity and
concreteness of the warnings on the purchase ratio
received support, we do identify several areas where
further research is needed. Short-term
consequences in warnings were found to vary in
effectiveness with different results depending on
warning concreteness and income. Presenting users
with warning messages tailored to their income
group could be the subject of a further investigation.
Our results support the idea that people who
consider themselves to be less financially capable
appear less affected by the warnings, and more
research should be done to confirm better strategies
for influencing this group towards more responsible
behaviour.
We would like to experiment with “reward
substitution,” using messages highlighting a positive
consequence of cancelling the payment, such as
“Congratulations, you just saved another 50 euros
for your vacation,” or a third button next to “pay”
and “cancel” allowing you to deposit unspent
money directly into your savings account. We
expect this reward substitution could be a further
nudge to strengthen the self-control mechanisms of
online buyers.
To be impactful, the current results will need to be
replicated in actual rather than fictitious payment
situations, where the warnings are presented after
the buying journey has actually been completed,
and the payment will be real rather than simulated.
The expressed desire for the functionality by the
participants provides a positive reinforcement to
take the results forward to real-life payments. One
application area we envisage is to built-in warning
mechanisms in the iDeal-functionality of banks.
4. Conclusions
19
Since we would expect similar effectiveness for
credit card and mobile payments, these would also
be a potential application areas. Clearly, regulatory
and other stakeholder concerns, such as retailers’,
will need to be considered, so a focus on higher-risk
groups, where any improvement in financially
responsible behaviour is a common interest, would
be a good starting point for implementation.
To further improve the effectiveness of the warnings,
it would be helpful to improve the predictive model
for cancelling the payment. In addition to the
severity, timing and concreteness of warning,
elements such as buyer demographics including
age, their current financial situation across different
banks, a more encompassing financial capability
score, buyer’s current emotional state and other
factors could be tested to improve the current
model. The model would also benefit from
incorporation of psychological factors. Shephard et.
al. (2017) find that psychological variations such as
in optimism, impulsiveness, goal orientation and
locus of control are predictors of financially capable
behaviour.
Further optimalisation of the warning will then be
possible, through increased relevance to the
personal situation of the buyer. Enriched in this way,
any implementations based on this model are likely
to require buyer opt-in and stringent privacy
safeguards. It remains to be tested if with such
increased personal relevance the high level of
appreciation for the functionality is retained, or
whether this starts to tap into the annoyance factor
for over-reaching advisory bots.
To fine-tune this individual line between welcome
support to improve responsible behaviour, while
preserving the sense of autonomy and freedom of
choice, is the next step. But the "last chance-
moment" between purchase decision and definitive
payment clearly offers many opportunities for
helping buyers act more responsibly online.

20
1. U.S. credit card debt figures from: https://www.experian.com/blogs/ask-experian/state-of-credit/
2. U.K. household debt quotes from Guardian article:
https://www.theguardian.com/money/2017/dec/27/uk-household-debt-john-mcdonnell-warns-
alarming-increase
3. Online buying statistics from: https://www.statista.com/topics/871/online-shopping/
4. Retail statistics from: https://www.statista.com/statistics/534123/e-commerce-share-of-retail-sales-
worldwide/
5. Maatwerk Bestedingen Huishoudens, Central Bureau of Statistics. https://www.cbs.nl/nl-
nl/maatwerk/2017/07/bestedingen-huishoudens-2015
6. U.S. income ranges from: https://dqydj.com/united-states-income-brackets-percentiles/
7. Our crowdsourcing platform: https://www.crowdflower.com/
8. The dataset and code used to filter and aggregate the data can be downloaded from
https://github.com/bouncer/financial-responsibility.
5. Notes

21
Ariely, D. (2008). Predictably irrational. The hidden
forces that shape our decisions. New York, NY:
HarperCollins Publishers.
Ariely, D. (2002). Payment method design:
psychological and economic aspects of payments.
Center for ebusiness@mit. Presented November 13
2002, Weekly Research Lunch Seminar.
Ariely, D. & Kreisler, J. (2017). Dollars and Sense:
Money mishaps and how to avoid them. Bluebird.
Atkinson. 2016. OECD/INFE International Survey of
Adult Financial Literacy Competencies. edited by O. I.
N. o. F. Education. Paris: OECD.
Chatterjee, P. & Rose, R.L. (2012). Do payment
mechanisms change the way consumers perceive
products? Journal of Consumer Research, 38, 1129-
1139.
Harari, D. (2017). Household debt: statistics and
impact on economy. House of Commons Library
Briefing paper nr. 7584.
Horst, F. van der, & Matthijsen, E. (2013). The
irrationality of payment behaviour. DNB Occasional
Studies, 11 (4).
Richard, R., van der Pligt, J., & de Vries, N. K. (1996).
Anticipated regret and time perspective: Changing
sexual risk-taking behavior. Journal of Behavioral
Decision Making 9, 185- 199.
Richins, M. L. (1997). Measuring emotions in the
consumption experience. Journal of Consumer
Research, 24(2), 127-146.
Richins, M. L. (2007). Consumption Emotions, in
Product Experience: Perspectives on Human-Product
Interaction,Eds. H. N. J. Schifferstein.
Schors, A., van der Werf, M., & van der Schonewille,
G. (2015). Geldzaken in de praktijk. Nibud study.
Shephard, D. D. (2017). Beyond Financial Literacy:
the psychological dimensions of financial literacy.
Think Forward Initiative Technical Report.
Sobol, A. (3013). Short-Term Versus Long-term
Consequences: Changing Exercise Behavior among
Young People with Different Levels of Consideration
of Future Consequences. Master’s Thesis University of
Amsterdam Persuasive Communication.
Startceva, M. (2017). Is time money? Inattention to
the opportunity cost and its effect on individual’s
spending decisions. Master Thesis Utrecht University
School of Economics.
Strathman, A., Gleicher, F., Boninger, D. S., &
Edwards, C. S. (1994). The consideration of future
consequences: Weighing immediate and distant
outcomes of behavior. Journal of Personality and
Social Psychology, 66, 742–752.
Thaler, R.H. & Sunstein, C.R. (2008). Nudge: Improving
Decisions about Health, Wealth, and Happiness. New
Haven, CT: Yale University Press.
6. References

22
Timmermans, B., Aroyo, L., & Welty, C. (2015).
Crowdsourcing ground truth for question answering
using crowdtruth. In Proceedings of the ACM Web
Science Conference (p. 61). ACM.
Weinmann, M., Schneider, C. & Brocke, J (2016).
Digital Nudging. Business & Information Systems
Engineering, 58 (6), 433-436.
Zellermayer, O. (1996). The Pain of Paying.
Pittsburgh, PA: Carnegie Mellon University.

23
The authors
Benjamin Timmermans is a
Reseracher at IBM
E-mail: [email protected]
Monique van Maare is a Social Business
Expert at IBM
E-mail: [email protected]
Eva Zinger-Mityok is a Project
Manager – Innovation Engine at IBM
E-mail: [email protected]
Disclaimer
The views and opinions expressed in this report are solely those of the
author(s) and do not necessarily reflect the official policy or position of
the Think Forward Initiative - TFI - or any of its partners. This report has
been prepared by the author(s) for the TFI Research Challenge.
Responsibility for the information, data and content in this report lies
entirely with the author(s). The primary purpose of the TFI Research
Challenge is to inspire practical research insights in the financial
decision-making domain. It does not constitute any financial advice or
service offer.