the effect of temperature and relative humidity on …
TRANSCRIPT

THE EFFECT OF TEMPERATURE AND RELATIVE HUMIDITY ON THE CORROSION
RATES OF COPPER AND SILVER IN ELECTRONIC EQUIPMENT
IN THE PRESENCE OF SULFUR ENVIRONMENT
By
KANAN PUJARA
Presented to the Faculty of the Graduate School of
The University of Texas at Arlington in Partial Fulfillment
of the Requirements
for the Degree of
MASTER OF SCIENCE IN MECHANICAL ENGINEERING
THE UNIVERSITY OF TEXAS AT ARLINGTON
December 2015

ii
Copyright © by Kanan Pujara 2015
All Rights Reserved

iii
Acknowledgements
I would like to take this opportunity to thank my thesis guide Dr. Dereje Agonafer,
who was a source of inspiration to me throughout my work. The experimental work
presented here was performed at IBM facility, Poughkeepsie and it was because of Dr.
Agonafer that I could get such an opportunity and his encouragement to help me cross all
the obstacles.
I would also like to thank Dr. Parabjit Singh, IBM who was my mentor and torch
bearer for me in this project related to contamination in data centers. I got to learn many
technical and non-technical skills from him during my tenure at IBM for a period of 2
months. I would also like to thank the lab employees at IBM who helped me for my
experiments.
I would also like to thank Dr. Haji-Sheikh and Dr. Kent Lawrence for being on my
thesis committee and helping me whenever I need a helping hand. A special thanks to
Ms. Sally Thompson for her immense help throughout my stay at UT Arlington. I would
also like to thank my friends at the EMNSPC who were as good as my family across
seas. My special thanks to my friend Devi Prasad, who was there to support and help me
during my tough times.
Finally I would like to dedicate my thesis to my grandparents Late Mr.
Premchand S. Pujara and Late Mrs. Sharda P. Pujara who made me what I am today
and giving me the strength to prove myself, my parents Mr. Dinesh Pujara and Mrs.
Sudha Pujara have always been my source of motivation, my brother Mr. Jay Pujara, my
sister-in-law Mrs Bhumika Pujara, my nephews Yash Pujara and Rushi Pujara and my
friend Tushar Saini for being with me and holding me in all the tough times and having
faith in me and my work.
November 24, 2015

iv
Abstract
THE EFFECT OF TEMPERATURE AND RELATIVE HUMIDITY ON THE CORROSION
RATES OF COPPER AND SILVER IN ELECTRONIC EQUIPMENT
IN THE PRESENCE OF SULFUR ENVIRONMENT
Kanan Pujara, MS
The University of Texas at Arlington, 2015
Supervising Professor: Dereje Agonafer
Data centers consume a significant amount of energy for the continuous air-
conditioning of the servers with high internal heat loads and to maintain the indoor
temperatures within recommended operating levels as recommended by ASHRAE. As an
alternate source to air-conditioning, air-side economizers are used to reduce power
consumption. Air-side economizers bring in large amounts of the outside free air to cool
internal loads, when weather conditions are favorable, saving a considerable amount of
energy by reducing chiller operation. However, there is a reluctance in using this
technique due to undetermined equipment reliability by introducing outside air pollutants
which over time could cause failures.
The ASHRAE TC 9.9 committee of IT equipment manufacturers published the
2008 ASHRAE Environmental Guidelines for Datacom Equipment extending the
temperature-humidity envelope providing greater flexibility in data center facility
operations with the goal of reducing energy consumption. There is a need to know the
degree of reliability degradation when the equipment is operated, outside the
recommended range, in the allowable temperature-humidity range in geographies with
high levels of gaseous and particulate contamination. This research restricts itself to the
effect of temperature and humidity on corrosion-related hardware failures, in sulfur-

v
bearing gaseous contaminated environments, by studying copper and silver corrosion
rates as a function of temperature and humidity; the assumption being that the frequency
of occurrence of corrosion-related hardware failures is proportional to the copper and
silver corrosion rates.
The research presented here uses a technique of measuring the corrosion of a
metal by the virtue of its electrical resistance. As the metal corrodes, its cross-sectional
area reduces, hence increasing its electrical resistance. By continuously monitoring
resistance, corrosion can be monitored in the controlled atmosphere where the wire is
exposed. Though the technique is simple in principle, there are a number of practical
problems to be considered while using it in electronic equipment when applied to
atmospheric corrosion tests.
An ASHRAE survey of data centers has shown that there is a strong relationship
of corrosion-related hardware failure frequency to copper and silver corrosion rates under
various temperature and relative humidity ranges. The gaseous contamination is
provided in the form of approximately 70 ppb free sulfur in a flowers of sulfur (FOS)
chamber maintained at 30̊C constant temperature. The humidity in the FOS chamber is
maintained at various levels by using saturated salt solutions and the thin film
temperature is maintained at various levels between 30 and 50˚C by the joule heating of
the films. The corrosion rates of copper and silver, in a 30̊C ambient with ~70 ppb free
sulfur, are plotted in the upper right corner of the ASHRAE A1-A4 allowable temperature-
humidity ranges. For the first time, corrosion data are provided on the psychrometric
chart in a form convenient for obtaining the x-factors for temperature and humidity for
corrosion-related hardware failures.

vi
Table of Contents
Acknowledgements .............................................................................................................iii
Abstract .............................................................................................................................. iv
List of Illustrations ............................................................................................................. viii
List of Tables ...................................................................................................................... xi
Chapter 1 Introduction......................................................................................................... 1
Chapter 2 Experimental Set-up ......................................................................................... 16
Chapter 3 Corrosion Rate Measurement .......................................................................... 23
Chapter 4 Experiment ....................................................................................................... 33
Chapter 5 Results ............................................................................................................. 38
vii
5.1.1 Relative Humidity 33% .................................................................................... 38
5.1.2 Relative Humidity: 52% ................................................................................... 41
5.1.3 Relative Humidity: 59% ................................................................................... 44
5.1.4 Relative Humidity: 75% ................................................................................... 47
5.1.5 Relative Humidity: 84% ................................................................................... 50
5.1.6 Relative Humidity: 91% ................................................................................... 53
5.2.1 Coulometric Reduction .................................................................................... 56
5.2.2 A graph of Corrosion rate at various relative humidity values for
Copper and Silver ..................................................................................................... 59
5.2.3 Comparison between results of Thin Films and Coupons............................... 60
Chapter 6 Conclusion and Future work ............................................................................ 65
References ........................................................................................................................ 67
Biographical Information ................................................................................................... 70

viii
List of Illustrations
Figure 1-1 Air-side Economizer .......................................................................................... 4
Figure 1-2 Working of an air-side economizer .................................................................... 4
Figure 1-3 Hours with ideal conditions for an air-side economizer ..................................... 5
Figure 1-4 Corrosion of a plated through hole because of wetted ionic dust ..................... 7
Figure 1-5 Example of copper creep corrosion on a lead-free circuit board ..................... 10
Figure 1-6 Short in adjacent solder hole and bus line as a result of surface deposition .. 11
Figure 1-7 Short Due to the Mixture of Gaseous Contaminants ....................................... 11
Figure 1-8 Recommended and allowable environmental conditions for electronic
equipment ......................................................................................................................... 15
Figure 2-1 Silver Thin Film ................................................................................................ 17
Figure 2-2 Single pin Berg connector (Male part) ............................................................. 20
Figure 2-3 Berg connector (Female part) .......................................................................... 20
Figure 2-4 Copper and Silver thin film specimen .............................................................. 22
Figure 2-5 Schematics of thin film specimen .................................................................... 22
Figure 3-1 Schematics of the thin film when placed inside the environmental chamber .. 24
Figure 3-2 Environmental Test Chamber .......................................................................... 25
Figure 3-3 Paddle wheel Test set-up ................................................................................ 26
Figure 3-4 Opening for Motor Wiring ................................................................................ 26
Figure 3-5 Carousel .......................................................................................................... 27
Figure 3-6 Concentration of sulfur vapor (S8) by volume vs. Temperature ...................... 30
Figure 3-7 Flowers of Sulfur chamber with paddle wheel test set-up along with sulfur and
saturated salt solutions ..................................................................................................... 31
Figure 4-1 Digital Thermometer (Z190A) .......................................................................... 33
Figure 4-2 Connections to the digital thermometer (a) without wiring and (b) with wiring 34

ix
Figure 5-1 Thermal Coefficient of Resistivity for Copper .................................................. 38
Figure 5-2 Thermal Coefficient of Resistivity for Silver ..................................................... 39
Figure 5-3 Copper Corrosion Rate .................................................................................... 39
Figure 5-4 Silver Corrosion Rate ...................................................................................... 40
Figure 5-5 Combined Corrosion Rate for Copper and Silver ............................................ 40
Figure 5-6 Thermal Coefficient of Resistivity for Copper .................................................. 41
Figure 5-7 Thermal Coefficient of Resistivity for Silver ..................................................... 42
Figure 5-8 Copper Corrosion Rate .................................................................................... 42
Figure 5-9 Silver Corrosion Rate ...................................................................................... 43
Figure 5-10 Combined Corrosion Rate for Copper and Silver .......................................... 43
Figure 5-11 Thermal Coefficient of Resistivity for Copper ................................................ 44
Figure 5-12 Thermal Coefficient of Resistivity for Silver ................................................... 45
Figure 5-13 Copper Corrosion Rate .................................................................................. 45
Figure 5-14 Silver Corrosion Rate .................................................................................... 46
Figure 5-15 Combined Corrosion Rate for Copper and Silver .......................................... 46
Figure 5-16 Thermal Coefficient of Resistivity for Copper ................................................ 47
Figure 5-17 Thermal Coefficient of Resistivity for Silver ................................................... 48
Figure 5-18 Copper Corrosion Rate .................................................................................. 48
Figure 5-19 Silver Corrosion Rate .................................................................................... 49
Figure 5-20 Combined Corrosion Rate for Copper and Silver .......................................... 49
Figure 5-21 Thermal coefficient of resistivity of Copper ................................................... 50
Figure 5-22 Thermal coefficient of resistivity of Silver ...................................................... 51
Figure 5-23 Copper Corrosion Rate .................................................................................. 51
Figure 5-24 Silver Corrosion Rate .................................................................................... 52
Figure 5-25 Combined Corrosion Rate for Copper and Silver .......................................... 52

x
Figure 5-26 Thermal coefficient of resistivity of Copper ................................................... 53
Figure 5-27 Thermal coefficient of resistivity of Silver ...................................................... 54
Figure 5-28 Copper Corrosion Rate .................................................................................. 54
Figure 5-29 Silver Corrosion Rate .................................................................................... 55
Figure 5-30 Combined Corrosion Rate for Copper and Silver .......................................... 55
Figure 5-31 Reduction behavior of simple films on copper ............................................... 57
Figure 5-32 Corrosion of Coupons with respect to RH ..................................................... 59
Figure 5-33 Psychrometric chart with Copper Corrosion Rate ......................................... 61
Figure 5-34 Psychrometric chart with Silver Corrosion Rate ............................................ 62
Figure 5-35 3-D Graph of Copper Corrosion Rate ............................................................ 63
Figure 5-36 3-D Graph of Silver Corrosion Rate .............................................................. 63

xi
List of Tables
Table 3-1 Relative humidity at different temperatures ...................................................... 29
Table 5-1 Factors for calculating mass or thickness of known films ................................. 58
Table 5-2 Comparison between Thin Films and Coupons ................................................ 60

1
Introduction
A Data Center is a central repository of an IT Equipment used for processing,
storing and exchanging digital information. The brain of data center is the server where
the processes takes place. These servers are mounted in a standardized cabinets called
rack. These racks of servers constitute the IT equipment and the main frame of data
center. The neural system of the data center is the supporting equipment providing
uninterrupted power and cooling. The Heating, Ventilation and Air Conditioning (HVAC)
provides the necessary cooling to maintain the required temperatures. Thus, power
consumptions by the data center for its continuous operation is very high.
With the intention to foster a better alignment between equipment manufacturers
and facility operations, the American Society for Heating Refrigeration and Air
Conditioning Engineers (ASHRAE) TC 9.9 Committee has developed certain guidelines
for design, operation, maintenance, and efficient energy usage of modern data centers.
The objective is to identify and spread best practices to data center administrators. The
recommended temperature limits are from 18°C (64.4°F) to 27°C (80.6°F). The humidity
is limited to less than 60% with the lower and upper dew point temperatures of 5.5°C
(41.9°F) and 15°C (59°F) [1]. The ASHRAE TC 9.9 committee of IT equipment
manufacturers published the 2008 ASHRAE Environmental Guidelines for Datacom
Equipment extending the temperature-humidity envelope providing greater flexibility in
data center facility operations with the goal of reducing energy consumption. A downside
of expanding the temperature-humidity envelope is the reliability risk from higher levels of
gaseous and particulate contamination entering the data center.

2
Energy usage and cooling alternatives
Increasing dependence on computer based application has led to the demand for
faster and improved communication. Humans have a never-ending desire to store the
data in multiple forms and possess copies, no matter where they are, whether in offices,
or travelling, has given rise to the use of microelectronic devices (MCD) integrated with
microelectromechanical systems (MEMS). Throughout global demand and tough
competition between competitors, these products needs to be produced at decreasing
costs and improved reliability. According to the Moore’s law, the processor speed, or the
overall processing power doubles every two years. In order to match with the rising
demands, better and efficient computing devices are needed for information processing
which has eventually led to the growth of datacenters. A significant amount of energy is
utilized for the continuous air-conditioning of the servers with high internal heat loads and
to maintain the indoor temperatures within recommended operating. Rising energy costs
and ever growing needs for power supplies worldwide has led to increasing efficient use
of energy. Due to the recent climatic changes and the greenhouse effect has generated
focus on energy savings and use of alternate sources of energy.
The data reported by Koomey mentions that the server electrical use alone
represents 1.2% of U.S. electrical use and close 2% for overall electrical use of data
center in US [2]. His study stated that the server electrical use has doubled from 2000 to
2005 and will grow by 15% annually from 2006 to 2010. Other articles and references
have detailed similar growth rates at individual firms. This rapid increase in energy usage
has attracted the attention of environmental agencies in the U.S., European Union, China
and other countries. In order to meet with the rising computing costs for the data centers,
practices are implementing for cost-cutting measures like operating slightly above the
recommended envelope and using the outside ambient air.

3
The ASHRAE TC9.9 subcommittee, on Mission Critical Facilities, Data Centers,
Technology Spaces, and Electronic Equipment, has accommodated the data center
administrators by allowing short period excursions outside the recommended
temperature-humidity range, into allowable classes A1-A4. Under worst case conditions,
the ASHRAE A3 envelope allows electronic equipment to operate at temperature and
humidity as high as 24˚C and 85% relative humidity for short, but undefined periods of
time [3]. Any choice outside of the recommended region will be a balance between the
additional energy savings of the cooling system versus the deleterious effects that may
be created in reliability, acoustics, or performance [4]. Various cost-cutting alternatives
such as not tightly controlling the temperature and relative humidity levels or using an Air-
Side Economizers are implemented, keeping in mind the associated risk of allowing the
particulate and gaseous contaminants into their data centers.
Power usage effectiveness (PUE) has become the new metric to measure data
center efficiency which creates a measurable way to see the effect of data center design
and operation on data center efficiency. To improve PUE, air- and water-side
economization have become more commonplace with a drive to use them year round. To
enable improved PUE capability, TC 9.9 has created additional environmental classes
along with guidance on the usage of the existing and new classes. Expanding the
capability of IT equipment to meet wider environmental requirements can change
reliability, power consumption and performance capabilities of the IT equipment and
guidelines are provided herein on how these aspects are affected [5].
Alternate sources to air-conditioning, air-side economizers are used to reduce
power consumption. The air-side economizers work on the principle of free air cooling
which implements outside ambient air as the working fluid. Figure 1-1 shows the

4
schematics of an air-side economizer while Figure 1-2 shows the working of an air-side
economizer.
Figure 1-1 Air-side Economizer
Figure 1-2 Working of an air-side economizer

5
Air-side economizers bring in large amounts of the outside free air to cool internal
loads, when weather conditions are favorable, saving a considerable amount of energy
by reducing chiller operation [6]. Instead of cooling the recirculated, the hot (exhaust) air
from the servers is simply directed to the atmosphere. When the outside air is at a lower
temperature then the recirculated inside air, the economizer mixes it with the hot
(exhaust) air to achieve the desired range of temperature and humidity. With proper
filtration and conditioning, the mixed air is then supplied to the datacenter. But when the
outside air is both sufficiently cool and dry (depending on the climate) the amount of
enthalpy in the air is acceptable and no additional conditioning of it is needed; this portion
of the air-side economizer control scheme is called free cooling [7].
Figure 1-3 Hours with ideal conditions for an air-side economizer
(Image source: [7])

6
The air-side economizer is introjected into the central air handling system for
intake and exhaust air, with suitable filters to reduce the particulate matter or
contaminants entering the data center. Many datacenters across the U.S. take the benefit
of this free cooling. Figure 1-3 shows the usage of air-side economizers in hours per
year. The associated risk of impurities entering the datacenter is discussed in next
chapter.
Contamination in Datacenters
Datacenters are well designed and are placed in a suitable and relatively clean
environments. Hence they do not experience any particulate and gaseous contamination,
and if experienced, it is relatively benign. The work presented here is focused on those
small fraction of datacenters which have harsh and harmful environmental conditions that
is mainly due to particulate and/or gaseous contaminants. Intel IT conducted a proof-of-
concept test that used an air-side economizer to cool servers with 100% outside air at
temperatures of up to 90°F. A survey conducted by them estimates that a 500kW facility
will save $144,000 annually and that a 10MW facility will save $2.87 million annually [8].
However, this technology is not widely adopted because of many factors like the class of
environment (temperature variations) in which economizers are placed, climatic
conditions (exg. humid to dry air conditions). The reluctance in using this technique is due
to the undetermined equipment reliability due to introduction of outside air pollutants
which over time could cause failures. It should also be noted that the reduction of circuit
board feature sizes and the miniaturization of components, necessary to improve
hardware performance, also makes the hardware more prone to attack by the corrosive
particles and gases in the data center environment. This develops the need to study the
detrimental effects of using free cooling on the IT equipment reliability.

7
Figure 1-4 Corrosion of a plated through hole because of wetted ionic dust
(Image Source: [4])
Expansion in the ASHRAE’s guidelines for data center safe operating
temperature-humidity envelopes generates the need to know the potential risk or
predicting the failure rates of hardware that is involved in operating outside the
envelopes. The recommended range for temperature as given by ASHRAE is 18ºC to
27ºC and for humidity is up to 60%. These conditions are conducive enough for corrosion
to occur on the IT equipment. Thus, the air entering the datacenter via the economizers
pose a potential threat to electronics of the IT equipment. Hence, any choice outside of
the recommended region should be a balance between the additional energy savings of
the cooling system versus the deleterious effects that may be created in reliability,
acoustics, or performance [4].

8
Various particulate matters like pollen, dust, debris, automobile emission, carbon
dust, smoke, etc. are known to enter the datacenter. Specially designed MERV filters are
used to filter the particulates but the ones with diameter < 2.5µm are reported to be
unfiltered. These particulate matter (PM) is known to become wet under the influence of
moisture present and therefore becomes conductive. When the deliquescence relative
humidity (DRH) of the particulate matter is lower than that of the relative humidity of
datacenter, the PM gets wet by absorbing water and becomes corrosive in nature [9].
Figure 1-4 is an example of copper corrosion caused by dust settled on a printed circuit
board.
While the PM is wet results in electrically bridging closely spaced features on
printed circuit boards, resulting in current leakage eventually leading to their electrical
failure [3]. According to ISA-71.04-1985, “Failures attributed to particulate matter have
even been observed in data centers where the gaseous contamination levels are low
enough to meet the ANSI/ISA-71.04-2013 G1 severity level” [10] . Thus with the
miniaturization of electronic components, the reduction of feature spacing on PCBs along
with the loosening of the data center temperature and humidity envelope to save energy
is making electronic hardware more prone to failure due to particulate matter [3]. The role
of gaseous contamination is discussed in next chapter.

9
Gaseous Contamination
With the increase in the rate of hardware failures in data centers high in sulfur-
bearing gases, led to the study of dust and gaseous contamination. Corrosion induced
failures is common in electronics due to higher levels of gaseous contaminations.
Common modes of corrosion failures due to gaseous contamination is are the corrosion
of silver terminated surface mount resistors and the creep corrosion on printed circuit
boards (PCBs) [11]. The corrosion of silver terminations in the Surface Mount Technology
(SMT) resistors has been brought largely under control by improving the packaging of the
resistors. The creep corrosion of PCBs is believed to be more susceptible to RoHS
complaint circuit boards [12] [13]. RoHS is the European Union of Restriction of
Hazardous Substance (RoHS) directive issued in February 2003 that took effect on 1 July
2006, banning the use of lead in solder joints [14].
According to ASHRAE TC 9.9, “the silver and copper solder contained the lead
tin (PbSn) solder has two shortcomings: One is its higher melting range that necessitates
the change of PCB laminate epoxies to ones with higher glass transition temperatures;
the second is the poor wetting of the copper metallization on the PCBs by the lead-free
solder, necessitating the use of various surface finishes on the copper metallization to
enhance wetting by the lead-free solder”. The net result is that the RoHS compliant PCBs
are more prone to creep corrosion as shown in Figure 1-5 [11]. Picture courtesy 2011
“Gaseous and Particulate Contamination Guidelines for Data Centers”.

10
Figure 1-5 Example of copper creep corrosion on a lead-free circuit board
(Image source: [4])
Creep corrosion is the corrosion of copper (and sometimes silver) metallization
on PCB and creeping the corrosion product, mainly the sulfides, resulting in the electrical
shorting of PCBs. From the survey by Fu, H., Zhou, Y. et al, the challenge still remains to
develop a reliable qualification test for creep corrosion, though progress has been made
developing the mixed flowing gas (MFG), the Chavant clay and the flowers of sulfur tests
[12] [13] [15]. The gaseous contaminants when enters the datacenter, under the influence
of temperature and humidity, undergo a chemical reaction with the elements of PCB
resulting in the surface deposition of products like oxides, sulfides or chlorides. These
products gradually increase and short circuit the adjacent buses or solder joints as shown
in Figure 1-6 and Figure 1-7

11
Figure 1-6 Short in adjacent solder hole and bus line as a result of surface deposition
(Image source: [16])
Figure 1-7 Short Due to the Mixture of Gaseous Contaminants
(Image source: [12])

12
Sulfur bearing gases, such as Sulfur dioxide (SO2) and Hydrogen sulfide (H2S),
are the most common gases in the datacenter causing hardware corrosion [17]. Other
harmful gases like, Nitrogen dioxide (NO2) and Chlorine (Cl2) are also considered to
have the most influence on the corrosion of copper and silver. Gaseous composition
environmental limits have been published in ANSI/ISA-71.04-1985 [18]. Determination of
gaseous composition is not trivial. The gaseous composition present in the air can be
determined using a gas analyzer. Predicting the rate of corrosion from the synergy of
various gases becomes a complicated task. A low-cost, simple approach to monitoring
the air quality in a data center is to expose copper and silver foil coupons in the data
center for 30 days followed by coulometric reduction analysis in a laboratory to determine
the thickness of the corrosion products on the metal coupons [19]. From a survey of
ASHRAE literatures and whitepaper, it is observed that a very strong relationship for the
frequency of corrosion related hardware failures to the copper and silver corrosion rates
[18].
Copper and Silver Corrosion
Copper and silver are important functional metals used widely in electronics
industry worldwide. Copper and its alloys are widely applied in the electric energy,
electronics, and semiconductor industries because of its properties of high electrical and
thermal conductivity, ductility, and malleability. Corrosion of both copper and silver is a
common problem and has been studied extensively. The atmospheric corrosion process
is more complex than oxidation at high temperatures [20]. There is no such theory that
exists for atmospheric corrosion, although attempts have been made to correlate
observed outdoor rates to sulfate and relative humidity levels [21]. Water vapor, sulfur
dioxide, and hydrogen sulfide have been shown to influence the rate of copper corrosion

13
[22] [23]. Silver has been cited as a classical example of a material that decays by a
diffusion-controlled process at either the atmosphere-product interface or in the corrosion
product itself [24]. Sulfur gases are the dominant reactive pollutants [25] [26]; however,
some reference is given to humidity and chlorine-containing gases as accelerators of
corrosion [27] [28].
Corrosion is a complex process that changes the surface properties, even at
ambient temperature, forming a thin layer having completely different properties
compared with the pure metal surface. This layer lowers catastrophically the adhesion of
the soldering alloy or conductive resins and paste, provoking failures of the printed circuit
board (PCB) of the microelectronic devices. The formation of tarnish films on a copper
surface exposed to environments containing atmospheric pollutants and high humidity
involves the movement of metallic ions over the surface, away from the metal generating
a creep process that increases the contact resistance, leading to electric failures of the
electronic devices [29]. Copper sulphidation is a fast process occurring on the metal-gas
phase interface impairing the copper corrosion resistance [30] [31]. It is important to add
to the understanding the complex chemistry of copper and silver corrosion under varied
conditions of temperature and humidity. We develop the quantitative rate dependence on
relative humidity and pollutant concentrations in laboratory.
Motivation
As discussed earlier in Ch.1.3, changes to electronic equipment due to the RoHS
compliance required the elimination of lead in electronic equipment. Due to this, the
PCBs which are lead-free are now more susceptible to corrosion related failures then
their tin/lead counterparts. This means that the environment previously considered to be
benign for electronics corrosion are now experiencing serious corrosion related failure of

14
IT equipment [32] . With the introduction of a number of regulations by RoHS and the
switch to lead-free finishes, there is a need to develop a monitoring technique for this
type of environment. Reactive monitoring now needs to provide a complete and a better
assessment for the changing environmental conditions rather than the monitoring
techniques described in ISA implementations of RoHS.
Also, due to the expansion in the ASHRAE’s recommended envelope to
allowable envelopes A1 to A4 as shown inFigure 1-8, there is a need to know the
reliability degradation when the equipment operates outside the recommended range in
the allowable temperature-humidity range in geographies with high levels of gaseous and
particulate contamination. Understanding the corrosion chemistry using only copper
would give insufficient information. Copper has two limitations, one is its insensitivity to
chlorine, a contaminant particularly corrosive to many metals, and another is that copper
corrosion is highly sensitive to relative humidity. The inclusion of a silver coupon helps
contributions of gaseous contaminations and relative humidity.
A very common practice now is to include silver coupons along with copper
coupons to gain greater insight into the chemistry of the corrosive gases in the
environment. This work restricts itself to the effect of temperature and humidity on
corrosion-related hardware failures, in sulfur-bearing gaseous contaminated
environments, by studying copper and silver corrosion rates as a function of temperature
and humidity; the assumption being that the frequency of occurrence of corrosion-related
hardware failures is proportional to the copper and silver corrosion rates.

15
Figure 1-8 Recommended and allowable environmental conditions for electronic
equipment
(Image source: ASHRAE, 2012 3rd edition)
The scope of this work is to find the effect of temperature and relative humidity
on the Corrosion rate of Copper and Silver outside the recommended range (i. e. in the
allowable range). This main objective of this research is to develop a test to predict the
reliability of the hardware while operating outside the recommended range in
geographies with high levels of contamination. This research will benefit industry with a
reliable, low-cost corrosion qualification test which could be used to find the impact of
various test conditions to predict the product reliability under harsh environments and
various geographies contaminated with sulfur-bearing gases. Datacenter administrators
can now make calculated risqué as when to operate outside the recommended zone and
use free-cooling for additional energy savings and yet not degrade the equipment
reliability and electrical performance. As a result of this research, for the first time ever,
corrosion rates of copper and silver would be provided on the psychrometric chart.

16
Experimental Set-up
The main idea for this experiment is to simulate the real world data center
conditions, i.e. the physical environment surrounding the IT equipment like temperature
and relative humidity and the gaseous and airborne impurities, inside the laboratory.
Environmental durability must be designed into the electronics which is often exposed to
harsh and extreme weather conditions. To observe and quantify the effect of the
environmental pollutants on the printed circuit boards (PCB) i.e. predominantly on the
copper and silver metal, it is placed in a chamber and exposed to a pollutant containing
environment and allowed to corrode under various temperature and relative humidity
conditions.
Approach
To obtain reproducible and meaningful test results for the components under
tests in laboratory require careful calibration and monitoring is very crucial. Ideally, a
calibration and monitoring technique should be simple, accurate and continuous in order
to provide useful information promptly, efficiently. The experiment should be easily
reproducible. Changes in resistance of metallic conductors has been used especially
when the conductors are copper paths on printed circuit boards [33]. These monitors are
relatively easy to handle. The technique used here is by measuring the corrosion of a
metal wire by the virtue of its electrical resistance. As the metal wire corrodes, its cross-
sectional area reduces, hence increasing its electrical resistance. By continuously
monitoring resistance, corrosion can be monitored in the controlled atmosphere where
the wire is exposed. Though the technique is simple in principle, there are a number of
practical problems to be considered while using it in electronic equipment when applied

17
to atmospheric corrosion tests. These problems include (a) the need to use very small
diameter wire which are quite fragile, (b) the need to clean the wire in a reproducible and
effective initialization process; and (3) the need to hold the wire in a resistance-
measuring fixture without using solder and solder flux [34].
Figure 2-1 Silver Thin Film
To overcome this drawback, we have used the thin films of copper and silver as
shown in chapter 2.2. These thin films are strong enough and satisfies the necessary
properties for being used as a corrosion monitor. The advantage of using a thin film over
a “reactive monitoring technique” by using a coupon is that the thin films can be
calibrated in such a way that constant current can be supplied to it to undergo Joule’s
heating or self-heating. The Joule’s Law of Heating (also referred as resistive or ohmic
heating) is the energy produced is converted into heat as the current flowing through the
conductor encounters resistance against it. The heat produced is proportional to the
square of the amount of current flowing through the circuit, with constant electrical
resistance and time of current flow. In particular, when the current flows through the solid
with finite conductivity, electrical energy is converted to thermal energy through resistive
losses in the material. The heat generated on the microscale when the conduction
electrons transfer energy to the conductor’s atoms by way of collisions. The phenomenon
of Joule’s heating a common problem in electronics industry.

18
Thin Films
In this experiment, thin films (thickness of the order in nanometers) of copper and
silver metal is used as shown in Figure 2-1. The thickness of the copper and silver thin
film is 1004.0 nm and 772.3 nm respectively as measured using KLA Tencor’s ® step
profile-o-meter at IBM York Town facility, NY. The copper and silver pattern is
compressed on silicon layer of 0.5 mm thick. The length and width of the silicon vase is
15mm and corresponding surface area of the thin film is 225 mm2. The thin films are
stored in an air-tight container and stored in a dry space so that it is not exposed to
slightest level of contamination. A series of process is being performed before the thin
film is being used for the experiment. The serpentine profile of the copper and silver film
was observed under microscope and the thickness and overall length of the profile was
noted. The width of the film is 0.6572 mm while the equivalent length was 70.0 mm.
These values are useful for the calculation of electrical resistivity of the metal.
Specimen Preparation
The corrosion of the metal is measured by the changes in the resistance when
the metal is allowed to degrade under certain conditions, hence it is very necessary to
make an accurate resistance measuring technique for this purpose. The most accurate
way of resistance measurement is using a wheat-stone bridge. A wheat-stone bridge is
the most accurate way of measuring the resistance across any electrical circuit. A 4-point
Potentiostat is set by connecting four copper wires to the thin films. Current is supplied
across the terminals and voltage at each levels is measured under different temperature
and relative humidity. Resistance is calculated at each stage and corrosion rate is
derived from it.

19
To ensure that no contamination occurs via human interface and human safety,
eye-glasses, gloves, and lab-coat should be worn while performing the experiment. Care
should be taken that no contaminants are introduced while handling it. To set-up a 4-
point potentiostat, a glass slide is initially cleaned with Iso-Propane Alcohol (IPA) and
distilled water to ensure that it is dust free. Once cleaned, it is dried using dry Nitrogen
gas (N2). Now the glass slide is clean enough for further use. Thereafter, a thermocouple
is placed on the glass slide using a scotch tape. The thermocouple should be tested for
its functionality before the wire is taped to the glass slide. The Epoxy-patch adhesive
mixture is then placed uniformly around the periphery of thermocouple bead. The Epoxy-
patch is prepared by mixing thoroughly equal quantities of Hardener and Resin paste.
Thin films should be examined carefully under the electron microscope for the dust
particles or any sort of damage before using it any further. Selected thin film is then
bonded to the thermocouple and glass slide using the tweezer using epoxy. The epoxy-
patch glued to the glass slide by keeping some weight initially like a spring loaded weight,
taking care that the film doesn’t break, and then allowed to set for 6-7 hours.
Next is to connect the copper wires to the thin films. Firstly, the current carrying
capacity of the copper wire should be checked before using it. Also, the maximum
temperature capacity of the copper-silver thin film should also be known to sustain and
function properly. Two pairs of four copper wires each of equal length (equivalent to the
half the chamber door size, i.e. 4 inches) should be connected with the single pin Berg
connector. Each of these copper wires are fixed to single pin Berg connector and locked
into its female 4-pin Berg connectors which will hold the four copper wires from thin film.
Figure 2-2 and Figure 2-3 shows the various berg connectors used.
20
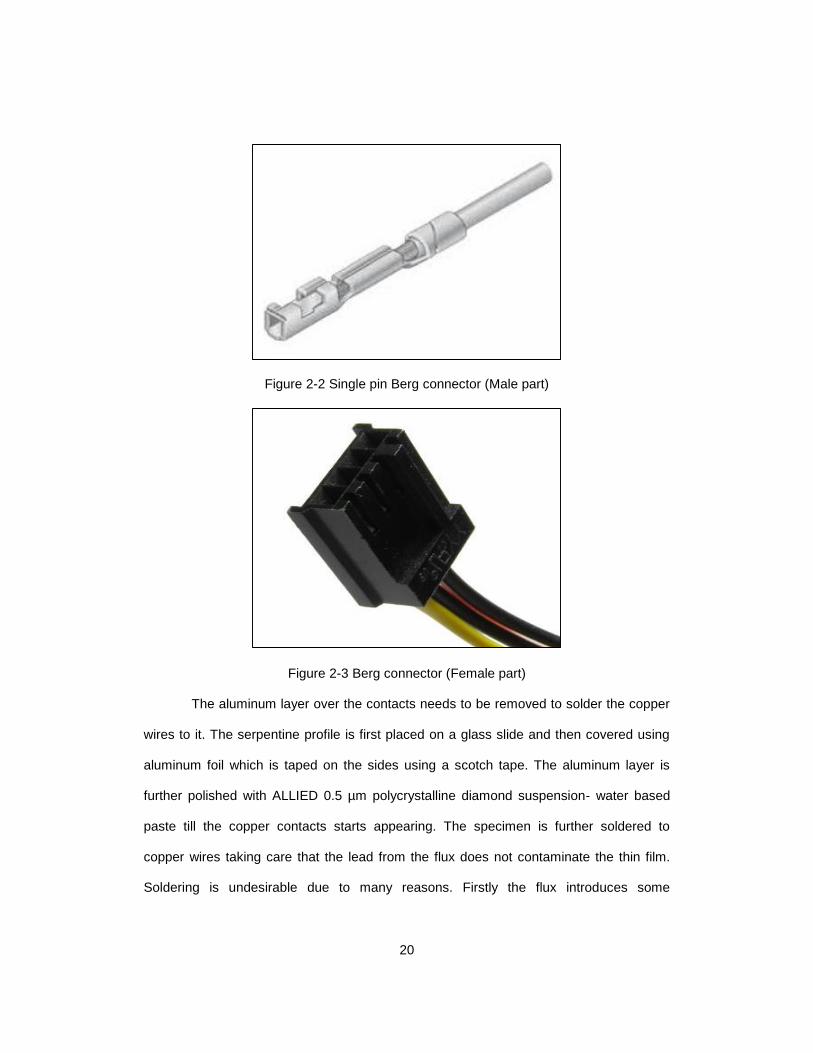
Figure 2-2 Single pin Berg connector (Male part)
Figure 2-3 Berg connector (Female part)
The aluminum layer over the contacts needs to be removed to solder the copper
wires to it. The serpentine profile is first placed on a glass slide and then covered using
aluminum foil which is taped on the sides using a scotch tape. The aluminum layer is
further polished with ALLIED 0.5 µm polycrystalline diamond suspension- water based
paste till the copper contacts starts appearing. The specimen is further soldered to
copper wires taking care that the lead from the flux does not contaminate the thin film.
Soldering is undesirable due to many reasons. Firstly the flux introduces some

21
contamination to thin films, secondly it dissolves enough copper due to high temperature
and reduces the wire cross section in the termination area and finally it sets up an
undesirable electrochemical couple [34]. To avoid contamination due to soldering, copper
wires were then bonded using diamond epoxy and cured in an oven at 100˚C for 5
minutes. The use of diamond paste also avoids the removal of aluminum layer from thin
films and hence further avoids any entry of contamination. Figure 2-4 and Figure 2-5
shows the specimen prepared from the above procedure.
The specimen is now placed in an over inside the desiccator with dry Nitrogen
gas flowing, pre-set at room temperature. The thin films are now annealed at 100˚C and
then is allowed cooled slowly to room temperature. Annealing is the heating of the
material above the crystallization temperature and thereafter cooling it to room
temperature. It induces ductility, softens the material, relieves internal stresses, refines
the structure by making it homogeneous and improves the cold working properties.
Resistance measured at this point is marked as the initial resistance of the specimen.
The specimen is then de-greased ALLIED® 1 µm polycrystalline diamond suspension-
water based paste, IPA, deionized water and dried with dry nitrogen gas. Note the
increase in resistance at this stage due to the cleaning of the specimen due to loss of
metal thickness (approx. a few nm).

22
Figure 2-4 Copper and Silver thin film specimen
Figure 2-5 Schematics of thin film specimen
23
Corrosion Rate Measurement
Once the copper and silver specimen is ready, similar samples are prepared for
each pair of copper-silver metals for further experiments.
The Thermal Coefficient of Resistance
A temperature coefficient is the relative change of a physical property that is
associated with a given change in temperature, the temperature coefficient α is defined
by,
∆𝑅
𝑅= 𝛼∆𝑇
The thermal coefficient of resistance ‘α’ is calculated for the thin film by varying
the temperature of the oven and corresponding measuring the voltage and resistance of
the thin film due to the change in temperature. The thin film is placed inside the oven and
the resistance at the room temperature is noted. Thereafter, the oven is heated gradually
at different temperatures which would heat up the thin film and its corresponding
resistance is measured. Hence temperature coefficient of resistivity (α) is calculated from
the following equation,
RT = Ro [1 + α(T – To)],
where, RT and Ro are the values of the resistance at temperature T and To, respectively.
To is taken at room temperature. ‘α’ is the temperature coefficient of resistivity. Based on
the above formula, α for the copper and silver thin film is value is supplied to vary the
temperature of the thin film is FoS. calculated. From the value of α, the current
requirement for the copper and silver thin film is calculated before placing it in the
Flowers of Sulfur (FoS) chamber. Figure 3-1 shows the schematics of the thin film when
placed inside the oven or environmental chamber.

24
Figure 3-1 Schematics of the thin film when placed inside the environmental chamber
Environmental Test Chamber
To maintain a constant temperature throughout the experiment, the
environmental chamber commonly known as oven is used. The environmental chamber
has a feedback system that if the temperature inside rises beyond the set value, it stops
heating. A constant value of temperature can be maintained easily and uniformly inside
the chamber. This is to ensure that the sulfur will not sublimate due to non-uniform
heating. The oven that was used for the experiment was not exposed to sulfur earlier.
Hence it can be assured that there was no sulfur deposition on the walls of the oven. The
size of the oven should be sufficient enough to accommodate the paddle wheel set-up.
The oven used in this experiment was 2 feet X 2 feet X 2 feet. The oven also has a small
circular opening on the top to hose the wires. Figure 3-2 shows the environmental
chamber used for the experiment.

25
Figure 3-2 Environmental Test Chamber
Paddle Wheel set-up or The Flowers of Sulfur Chamber
Extensive research is being done in the field of corrosion to develop a test setup
which can be used for testing the rate of corrosion on IT equipment. One of them is a
Paddle wheel Test setup (also called as Flowers of Sulfur Chamber). A Paddle wheel or
the Flowers of Sulfur Chamber is a test setup used to measure the rate of contamination
in PCBs ensuring uniform air-flow distribution across it, without disturbing the operating
machinery of any data center. It is an accelerated test setup of studying the effects of
sulfur [11].
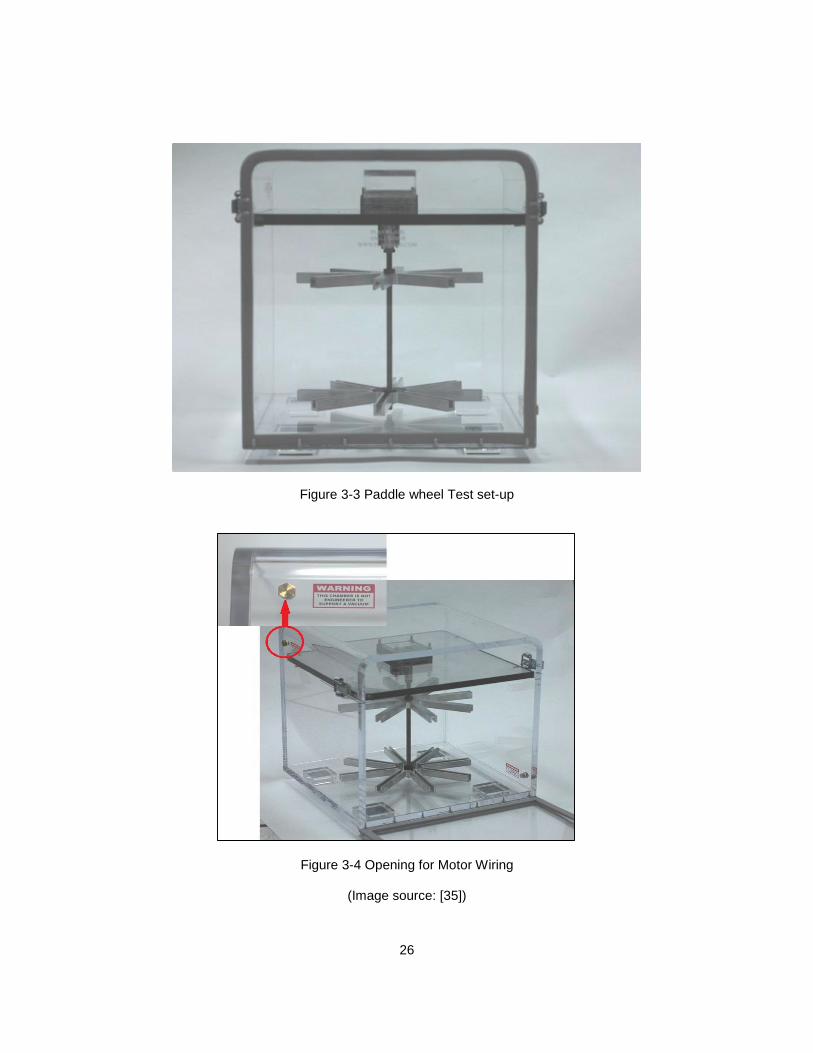
Paddle wheel (shown in Figure 3-3) is 1 foot x1 foot x1 foot structure. The front
side of the Paddle Wheel Test Setup’s has a door. The entire setup is made of acrylic
and maintained air-tight using metallic frame. There is one opening which is facilitated for
the motor wiring as seen in Figure 3-4 [11].
26
Figure 3-3 Paddle wheel Test set-up
Figure 3-4 Opening for Motor Wiring
(Image source: [35])

27
The gear train works on a DC gear-motor. The motor has a maximum speed of
50 RPM. The shaft of the motor is connected to the central shaft through a coupling
mechanism. The central shaft is runs from the coupling to the end (it does not touch the
bottom). The central shaft is a solid shaft made out of steel. Its diameter is 1 centimeter
and the length of the shaft is 9 inches [12].
Two aluminum carousels are mounted on the central shaft. Thus the rotary
motion of the motor is transferred from the shaft to the carousels. The carousels are
machined to fit test specimen into them. The diameter of the carousel is 8 inches as seen
in Figure 3-5. A total of eight test specimen can be mounted between the carousels. In
the actual test four copper and four silver foils were mounted on alternate carousels.
These foils were used as elemental representation of the copper and silver on the Printed
Circuit Boards [12].
Figure 3-5 Carousel

28
The experiment used the sulfur powder in elemental form (S8). The sulfur powder
is placed below the carousels inside the test set-up. Two petri dishes containing
saturated salt solution were also kept along with the S8 dishes. The whole set-up is
placed is then kept in an environmental test chamber to maintain the temperatures of the
test set at 30˚C. As the motor was switched on the S8 in the petri dishes is displaced due
to the motion of the foils placed between the carousels. This S8 diffuses in the air in the
test setup. With the increase in time the foils start absorbing the S8. Thus, layers of
reaction products are formed on the foils. The after products of the reaction were found
out to be Copper Sulfide (Cu2S) in this case from the coulometric reduction tests.
Relative Humidity
The humidity in the FoS chamber is maintained at various levels by using
saturated salt solutions and the thin film temperature is maintained at various levels
between 30˚C and 50˚C by the joule heating of the films. Two petri dishes containing
saturated salt solutions is used to introduce relative humidity in the test setup. The petri
dishes are first cleaned with deionized water and placed in aluminum foils to avoid any
contamination. Then salt solution is added to the petri-dishes. It is mixed thoroughly using
a stirrer and more salt solution is added until it gets saturated and doesn’t dissolve any
more of salt in it.
Different salt solutions give different levels of relative humidity at different
temperatures. The detailed information can be obtained from Table 3-1.

29
Table 3-1 Relative humidity at different temperatures
The experiment is maintained at 30˚C and hence the relative humidity at 30˚C is
of our interest. Relative humidity sensors are placed right in front of the petri-dishes
containing saturated salt solutions, inside the paddle wheel test set-up to monitor the
value.

30
Gaseous Contaminant
The gaseous contamination is provided in the form of free sulfur powder. The
amount of sulfur to be considered is based on the chart provided by Battelle as shown
inFigure 3-6. Based on the graph, approximately 70 ppb free sulfur needs to be
considered at 30oC. The free sulfur is placed in a dish and is kept below the paddle wheel
in the chamber. The oven is set to 30oC and the sulfur is baked for an hour to ensure that
it is moisture-free. Care has to be taken to avoid direct contact of sulfur with eyes and
skin as it can be harmful and can produce irritation. The main challenge in using sulfur is
to maintain a constant temperature within the chamber as the sulfur would sublimate.
Figure 3-7 shows the set-up once the sulfur and saturated salt solutions are placed inside
the FoS chamber.
Figure 3-6 Concentration of sulfur vapor (S8) by volume vs. Temperature

31
Figure 3-7 Flowers of Sulfur chamber with paddle wheel test set-up along with sulfur and
saturated salt solutions
The corrosion rates of copper and silver, in a 30oC ambient with ~70 ppb free
sulfur, are plotted in the upper right corner of the ASHRAE A1-A4 allowable temperature-
humidity ranges.
Corrosion Coupons
The use of copper–silver coupons as a reactive monitoring technique has been
used widely to find the amount of corrosion occurring in datacenters. The purity of these
coupons is 99.9%. Rectangular strips with area of 1935.5 mm2 are cut. Sand paper of
very fine grain size is used to rub against the smooth side of the film using acetone. This
process will ensure that there are no particulate and gaseous contaminants present over
the surface of the thin film. It is further cleaned with acetone, deionized water and dried

32
with dry Nitrogen gas. Once the samples are ready, the copper- silver coupons are
placed on two opposite sides in a small plastic box using a sticker tape. These boxes are
then placed in a chamber with dry nitrogen gas flowing through it.

33
Experiment
Once the specimen is prepared and annealed, the experiment follows the
following procedure.
1. The initial resistance of the copper silver thin film is calculated by supplying a
5mA of current. Small amount of current will not lead to any joules heating and
the voltage across it is measured. The thickness corresponding to the resistance
is the initial thickness, i.e t1.
2. The thermal coefficient of resistance for thin films is now calculated by heating
the environmental chamber at various temperatures and measuring the
corresponding temperature of the thin films. The temperature is measured using
a digital thermometer (Z190A) shown inFigure 4-1. The wires from the male berg
connector is connected with the female connector which is eventually connected
with the power source to supply different levels of current. The thermocouple is
connected with the FLUKE® Selector Thermocouple to read the temperature
readings with its corresponding wire codes as shown in Figure 4-2.
Figure 4-1 Digital Thermometer (Z190A)

34
(a) (b)
Figure 4-2 Connections to the digital thermometer (a) without wiring and (b) with wiring
Once the value of thermal coefficient of resistance is calculated, the power
requirements, i.e. the current required to attain different levels of thin film
temperature is to be found out using hit and trial method.
3. The environmental chamber is pre-set to 30̊ C and the sulfur is allowed to baked
for half an hour. Saturated salt solutions is prepared and is placed inside the
paddle wheel test set-up and the motor is turned on for uniform distribution of air
within the chamber.
4. The thin films are cleaned at this point before placing it inside the chamber for
the corrosion test. It is de-greased with ALLIED® 1 µm polycrystalline diamond
suspension-water based paste, IPA, deionized water and dried with dry nitrogen
gas. Note the change in resistance and its corresponding thickness.
5. The cleaned specimen is now placed on the spare front door of the paddle wheel
chamber or the FoS chamber. Provisions has been made by using a wooden ply
to position the thin film specimen. Copper and silver coupons are also taped on

35
the lateral sides of the thin film. This ensures that the specimen and coupons are
at same height.
6. The oven is opened and the existing front door of the FoS chamber is replaced
with the spare door and is latched quickly so that the set-up is not disturbed.
7. One additional thermocouple is also placed inside the FoS chamber to monitor
the temperature within the chamber.
8. Different values of current that are to be applied are stored as an input to
VersaSTAT software ® and which initiates the experiment.
9. The temperature values can be updated at different intervals on the FLUKE®
Selector Thermocouple instrument. In this experiment, the temperature was
measured at every 10 minutes.
10. The voltage across the resistance is updated by the VersaSTAT software.
11. Relative humidity is monitored manually every 2 hours during the experiment.
12. After the experiment is completed, the thin film and coupons are stored in a CD
drive box in a cool and dry place. Details like specimen number, relative humidity
value, run time for the experiment, etc is mentioned on the CD cover for future
reference.
13. The values of current, voltage and temperature of the chamber and thin film is
plotted on excel sheet. Resistance of the thin film is calculated and this is the
uncompensated resistance. The uncompensated resistance is the resistance of
the pure metal and the corroded metal. The uncompensated resistance is
calculated using the equation of thermal coefficient of resistance. The values of α
calculated for each case would be used in this calculation.

36
14. From the uncompensated resistance, the remaining thickness of pure metal is
found and based on the amount of metal that is corroded, the corrosion rate is
calculated.
15. The corrosion rate is calculated by subtracting the difference of two consecutive
thickness over a constant period of time.
Concept of Compensated Resistance
Let us consider a thin film with known thickness to and resistance Ro at room
temperature To. The film is installed in a flowers of sulfur chamber maintained at
temperature T. The film corrodes in the flowers of sulfur chamber. With time in the
chamber, corrosion decreases the film thickness and increases its resistance. The
thickness of the film tT at any temperature T can be calculated if its resistance RT is
known at temperature T:
1oo
o
oo o
lR
w t
lR t
w
If the film with resistance RT at temperature T is cooled to room temperature To,
its resistance at room temperature RT0 can be calculated as follows. RT0 is the
temperature compensated resistance of the film.
0 0
0
0
1
1
T T
TT
R R T T
RR
T T
The thickness of the corroded film will be

37
0 00 0 0 0 0
0
0 0
0
11
1
TTT T T
R tl R t R tt T T
Rw R R R
T T
In the above calculation we are neglecting the thermal expansion of the film.

38
Results
Thin Films Corrosion Rate
5.1.1 Relative Humidity 33%
a) Thermal coefficient of resistivity of Copper (After Annealing)
From the experiment, the value of Thermal coefficient of resistivity, α for copper
is 0.0037369/ ˚C against the standard value of 0.0039/ ˚C.
Figure 5-1 Thermal Coefficient of Resistivity for Copper
b) Thermal coefficient of resistivity of Silver (After Annealing)
From the experiment, the value of Thermal coefficient of resistivity, α for
silver is 0.0028 / ˚C against the standard value of 0.004/ ˚C
3.25
3.30
3.35
3.40
3.45
3.50
3.55
3.60
3.65
20 25 30 35 40 45 50
Res
ista
nce
(O
hm
s)
Oven Temperature (C )
Thermal coefficient of Resistivity

39
Figure 5-2 Thermal Coefficient of Resistivity for Silver
c) Copper Corrosion Rate
Figure 5-3 Copper Corrosion Rate
5.35
5.40
5.45
5.50
5.55
5.60
5.65
5.70
5.75R
esis
tan
ce (
Oh
ms)
Oven Temperature (C )
Thermal coef of Resistivity

40
d) Silver Corrosion Rate
Figure 5-4 Silver Corrosion Rate
e) Combined Copper- Silver Corrosion Rate
Figure 5-5 Combined Corrosion Rate for Copper and Silver

41
5.1.2 Relative Humidity: 52%
a) Thermal coefficient of resistivity of Copper (After Annealing)
From the experiment, the value of Thermal coefficient of resistivity, α for copper
is 0.00375/ ˚C against the standard value of 0.0039/ ˚C.
Figure 5-6 Thermal Coefficient of Resistivity for Copper
b) Thermal coefficient of resistivity of Silver (After Annealing)
From the experiment, the value of Thermal coefficient of resistivity, α for silver is
0.00304 / ˚C against the standard value of 0.004/ ˚C
3.25
3.30
3.35
3.40
3.45
3.50
3.55
3.60
3.65
20 25 30 35 40 45 50
Res
ista
nce
(O
hm
s)
Oven Temperature (C )
Thermal coefficient of Resistivity

42
Figure 5-7 Thermal Coefficient of Resistivity for Silver
c) Copper Corrosion Rate
Figure 5-8 Copper Corrosion Rate
5.35
5.40
5.45
5.50
5.55
5.60
5.65
5.70
5.75R
esis
tan
ce (
Oh
ms)
Oven Temperature (C )
Thermal coef of Resistivity

43
d) Silver Corrosion Rate
Figure 5-9 Silver Corrosion Rate
e) Combined Copper-Silver Corrosion Rate
Figure 5-10 Combined Corrosion Rate for Copper and Silver
1.0
1.5
2.0
2.5
3.0
3.5
4.0
4.5
5.0
30 35 40 45 50 55 60 65
Co
rro
sio
n R
ate,
nm
/hr
Temperature, C
Corrosion Rate at 52% RH Copper
Silver
44
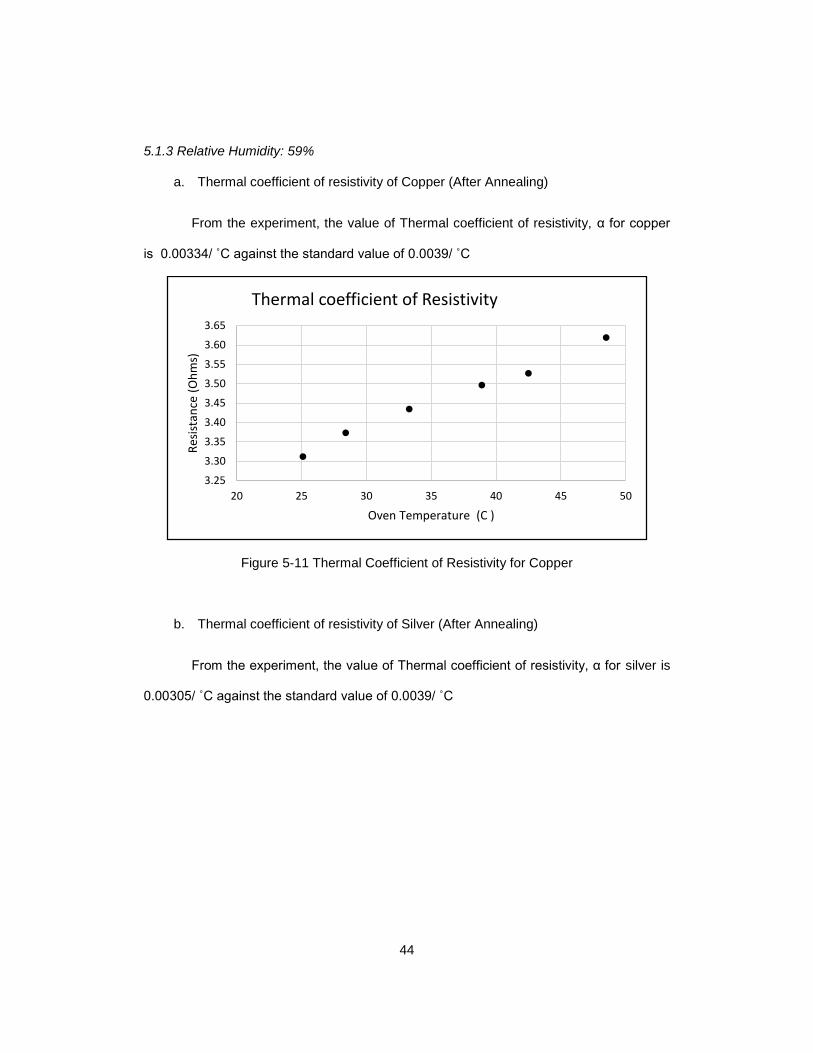
5.1.3 Relative Humidity: 59%
a. Thermal coefficient of resistivity of Copper (After Annealing)
From the experiment, the value of Thermal coefficient of resistivity, α for copper
is 0.00334/ ˚C against the standard value of 0.0039/ ˚C
Figure 5-11 Thermal Coefficient of Resistivity for Copper
b. Thermal coefficient of resistivity of Silver (After Annealing)
From the experiment, the value of Thermal coefficient of resistivity, α for silver is
0.00305/ ˚C against the standard value of 0.0039/ ˚C
3.25
3.30
3.35
3.40
3.45
3.50
3.55
3.60
3.65
20 25 30 35 40 45 50
Res
ista
nce
(O
hm
s)
Oven Temperature (C )
Thermal coefficient of Resistivity

45
Figure 5-12 Thermal Coefficient of Resistivity for Silver
c) Copper Corrosion Rate
Figure 5-13 Copper Corrosion Rate
5.35
5.40
5.45
5.50
5.55
5.60
5.65
5.70
5.75R
esis
tan
ce (
Oh
ms)
Oven Temperature (C )
Thermal coef of Resistivity

46
c) Silver Corrosion Rate
Figure 5-14 Silver Corrosion Rate
d) Combined Copper-Silver Corrosion Rate
Figure 5-15 Combined Corrosion Rate for Copper and Silver

47
5.1.4 Relative Humidity: 75%
a) Thermal coefficient of resistivity of Copper (After Annealing)
From the experiment, the value of Thermal coefficient of resistivity, α for copper
is 0.00337/ ˚C against the standard value of 0.0039/ ˚C
Figure 5-16 Thermal Coefficient of Resistivity for Copper
b) Thermal coefficient of resistivity of Silver (After Annealing)
From the experiment, the value of Thermal coefficient of resistivity, α for silver is
0.00327/ ˚C against the standard value of 0.0039/ ˚C
3.25
3.30
3.35
3.40
3.45
3.50
3.55
3.60
3.65
20 25 30 35 40 45 50
Res
ista
nce
(O
hm
s)
Oven Temperature (C )
Thermal coefficient of Resistivity

48
Figure 5-17 Thermal Coefficient of Resistivity for Silver
c) Copper Corrosion Rate
Figure 5-18 Copper Corrosion Rate
5.35
5.40
5.45
5.50
5.55
5.60
5.65
5.70
5.75R
esis
tan
ce (
Oh
ms)
Oven Temperature (C )
Thermal coef of Resistivity

49
d) Silver Corrosion Rate
Figure 5-19 Silver Corrosion Rate
e) Combined Copper-Silver Corrosion Rate
Figure 5-20 Combined Corrosion Rate for Copper and Silver
0.0
0.5
1.0
1.5
2.0
2.5
3.0
3.5
4.0
4.5
5.0
30 35 40 45 50 55 60 65
Co
rro
sio
n R
ate,
nm
/hr
Temperature, C
Corrosion Rate at 75% RH Copper
Silver

50
5.1.5 Relative Humidity: 84%
a) Thermal coefficient of resistivity of Copper (After Annealing)
From the experiment, the value of Thermal coefficient of resistivity, α for copper
is 0.00306/ ˚C against the standard value of 0.0039/ ˚C
Figure 5-21 Thermal coefficient of resistivity of Copper
b) Thermal coefficient of resistivity of Silver (After Annealing)
From the experiment, the value of Thermal coefficient of resistivity, α for silver is
0.00264/ ˚C against the standard value of 0.0039/ ˚C
3.25
3.30
3.35
3.40
3.45
3.50
3.55
3.60
3.65
20 25 30 35 40 45 50
Res
ista
nce
(O
hm
s)
Oven Temperature (C )
Thermal coefficient of Resistivity

51
Figure 5-22 Thermal coefficient of resistivity of Silver
c) Copper Corrosion Rate
Figure 5-23 Copper Corrosion Rate
4.70
4.80
4.90
5.00
5.10
5.20
5.30
20.0 25.0 30.0 35.0 40.0 45.0 50.0 55.0Res
ista
nce
of
film
(O
hm
s)
Oven Temperature (C )
Thermal coefficient of Resistance

52
d) Silver Corrosion Rate
Figure 5-24 Silver Corrosion Rate
e) Combined Copper-Silver Corrosion Rate
Figure 5-25 Combined Corrosion Rate for Copper and Silver

53
5.1.6 Relative Humidity: 91%
1. Thermal coefficient of resistivity of Copper (After Annealing)
From the experiment, the value of Thermal coefficient of resistivity, α for copper
is 0.00379/ ˚C against the standard value of 0.0039/ ˚C
Figure 5-26 Thermal coefficient of resistivity of Copper
2. Thermal coefficient of resistivity of Silver (After Annealing)
From the experiment, the value of Thermal coefficient of resistivity, α for silver is
0.00337/ ˚C against the standard value of 0.0039/ ˚C
3.25
3.30
3.35
3.40
3.45
3.50
3.55
3.60
3.65
20 25 30 35 40 45 50
Res
ista
nce
(O
hm
s)
Oven Temperature (C )
Thermal coefficient of Resistivity

54
Figure 5-27 Thermal coefficient of resistivity of Silver
3. Copper Corrosion Rate
Figure 5-28 Copper Corrosion Rate
4.70
4.80
4.90
5.00
5.10
5.20
5.30
20.0 25.0 30.0 35.0 40.0 45.0 50.0 55.0Res
ista
nce
of
film
(O
hm
s)
Oven Temperature (C )
Thermal coefficient of Resistance

55
4. Silver Corrosion Rate
Figure 5-29 Silver Corrosion Rate
5. Combined Copper-Silver Corrosion Rate
Figure 5-30 Combined Corrosion Rate for Copper and Silver

56
Corrosion Coupons
5.2.1 Coulometric Reduction
To determine the amount of corrosion that has occurred on the coupon,
Coulometric reduction technique is used. “A Coulometric reduction or a constant-current
electrolytic reduction is a standard procedure used for determining the relative build-up of
corrosion and tarnish films on the control coupons from environmental tests, and discuss
the types of results and correlations that may be expected” as sited by Krumbein, S. J, et
al [36]. There are various techniques to determine the relative built up of corrosion such
as the weight gain method, coulometric test, etc. The weight gain method is a non-
destructive process and can be used only for finding out the total amount of excess mass
a metal has gained due to the environmental attack. Any information related to the
products of the reaction is not obtained from this method. On the other side, Coulometric
reduction technique, it is possible to resolve the reaction products into its major individual
chemical constituents. A detailed understanding of the results can be made eventually.
In this technique, a constant current density is applied to the sample placed in an
electrolytically conductive solution which results in variation in potential, measured
against the standard reference electrode in the same solution, as a function of time. A
Voltage-time plot of the experiment would show a number of horizontal steps for a well-
behaved surface. Each potential step would have its corresponding constituent formed.
The final potential step for all substances corresponds to the reduction reaction and
hydrogen ions are formed in the solution representing an end to the reaction beyond
which no higher potential reduction process can occur. From the elapsed times at the
various potential steps, information regarding the corrosion and tarnishing processes
occurred in the environmental chamber could be deducted. The time taken for each
voltage step and the number of coulombs of electrical charge required to complete the

57
reduction process at that particular voltage. The reduction voltage (at which the reduction
of a particular chemical compound has occurred) can also be used to identify a
compound whose characteristics reduction potential has already been established under
the conditions of the test [36]. The graph of Voltage-time is shown in Figure 5-31.
Figure 5-31 Reduction behavior of simple films on copper
(Image source: [36])
A current density of 0.05 milli-amperes per square centimeter of immersed metal
is applied and the same current density is used to analyze the tarnished films. The
current density may vary for thick films. The explanation of the procedure isn’t covered
here. The results of the coulometric reduction procedure can be expressed directly in
terms of time (in seconds) required for the complete reduction process to occur at its
particular voltage. The number of coulombs of electrical charge can be obtained by
multiplying this time to the calculated current applied.
𝑞 = 𝑖𝑡
q= charge, mC,
i= current applied, mA and
t= time, s

58
For equivalent film thickness known,
𝑇 = 𝑖𝑡𝐾
𝑎
T=thickness, nm
i = current, mA;
t = time, s; a= area, cm2
K= conversion factor
𝐾 =𝑀 ∗ 104
𝑁𝐹𝑑
where d = density of the substance being reduced, g/cm2
Values of d, M and K for some common film constituents are listed in Table 5-1
[36]
Table 5-1 Factors for calculating mass or thickness of known films
Component Density Gram-
Molecular Weight
Reduction Potential
K- Factor
Cu2O 6 143.1 0.55-0.75 12.4
CuO 6.4 79.54 0.7-0.9 6.43
Cu2S 5.6 159.1 1.0-1.15 14.7
Ag2S 5.56 143.3 0 17.5
AgCl 7.32 247.8 0.82 26.7
59
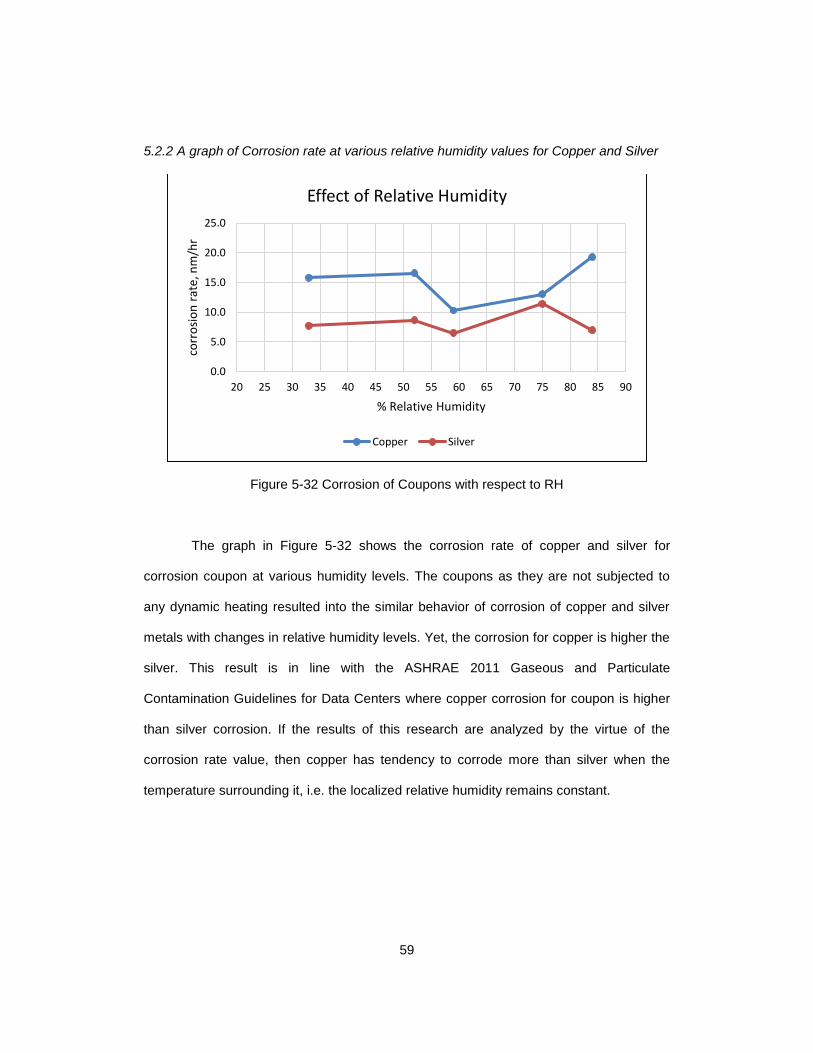
5.2.2 A graph of Corrosion rate at various relative humidity values for Copper and Silver
Figure 5-32 Corrosion of Coupons with respect to RH
The graph in Figure 5-32 shows the corrosion rate of copper and silver for
corrosion coupon at various humidity levels. The coupons as they are not subjected to
any dynamic heating resulted into the similar behavior of corrosion of copper and silver
metals with changes in relative humidity levels. Yet, the corrosion for copper is higher the
silver. This result is in line with the ASHRAE 2011 Gaseous and Particulate
Contamination Guidelines for Data Centers where copper corrosion for coupon is higher
than silver corrosion. If the results of this research are analyzed by the virtue of the
corrosion rate value, then copper has tendency to corrode more than silver when the
temperature surrounding it, i.e. the localized relative humidity remains constant.
0.0
5.0
10.0
15.0
20.0
25.0
20 25 30 35 40 45 50 55 60 65 70 75 80 85 90
corr
osi
on
rat
e, n
m/h
r
% Relative Humidity
Effect of Relative Humidity
Copper Silver

60
5.2.3 Comparison between results of Thin Films and Coupons
Table 5-2 Comparison between Thin Films and Coupons
Here, X is results that is not available. The first experiment was conducted for
91% RH and corrosion coupons were not placed in that experiment.
The results of coulometric reduction of thin films are shown in Table 5-2. Based
on the values of corrosion rates of thin films by the virtue of resistance, the results of
coulometric reduction is not very meaningful and hence can be overlooked at the
moment.
Coupon Thin Film
Cu 15.8 1.9
Ag 7.7 3.7
Cu 16.6 1.7
Ag 8.6 3.3
Cu 10.3 1.8
Ag 6.5 3.1
Cu 13.1 1.4
Ag 11.4 2.4
Cu 19.3 1.4
Ag 7.0 3.5
Cu X 1.9
Ag X 3.7
Corrosion Rate, nm/hr
#3
MgCl233
#5
MgNO352
%RH
#2
KNO391
#8
NH4NO359
#4
NaCl75
#9
KCl84

61
Psychrometric Chart
1. Copper Corrosion Rate
Figure 5-33 Psychrometric chart with Copper Corrosion Rate
From the results of plotted on psychrometric chart for the copper thin films, it is
observed that the copper corrosion value increases with increasing in the dry bulb
temperature till the relative humidity is 59%. At each temperature value, a constant
current is supplied for 5 hours. At 75% and 84% RH, the copper corrosion rate increases
from 30̊ C to 40̊ C and then reduces.
All values are in nm/hr

62
2. Silver Corrosion Rate
Figure 5-34 Psychrometric chart with Silver Corrosion Rate
From the results of plotted on psychrometric chart for the silver thin films, it is
observed that the silver corrosion rate is almost 2.5 times higher than copper corrosion
rate. The corrosion rate increases with increasing in the dry bulb temperature till the
relative humidity is 59%. At 75% and 84% RH, the copper corrosion rate increases from
30 C to 40 C and then reduces.
All values are in nm/hr

63
3-Dimensional Corrosion Graphs
a. Copper Corrosion Rate
Figure 5-35 3-D Graph of Copper Corrosion Rate
b. Silver Corrosion Rate
Figure 5-36 3-D Graph of Silver Corrosion Rate

64
The 3-dimensional graph of variation of corrosion rate with respect to
temperature and relative humidity is shown in Figure 5-35 and Figure 5-36. The X-axis is
the temperature and Y-axis is the relative humidity. Corrosion rate is the z-axis which
comes out of the plane.
Conditions for Safe Operation
ASHRAE 2011 Gaseous and Particulate Contamination Guidelines For Data
Centers recommending that gaseous contamination should be within the modified
severity level G1 which meets are:
i. A copper reactivity rate of less than 300 Å/month and
ii. A silver reactivity rate of less than 200 Å/month
Any corrosion within this range is considered to be not prone to hardware failure
but not safe. Care has to be taken to regularly clean and filter the server room and take
precautionary measures to avoid further contamination.

65
Conclusion and Future work
Conclusions
The corrosion rate for copper and silver has shown a regular behavior in most of
the cases as we increase the temperature or relative humidity whereas for some data
points it does not follow this trend. For thin films it is observed that silver corrosion rate is
almost 2.5 times higher than copper corrosion rate in the field and the same behavior is
seen from the experiments conducted in laboratory under continuous heating. The
copper corrosion rate is observed to be very sensitive with changes in relative humidity.
The behavior of silver was almost same in all conditions.
Silver corrosion is observed to be lesser than the copper corrosion for corrosion
coupons under same conditions and this is very similar to the ASHRAE guidelines where
the copper tends to corrode higher then silver. An analogy was derived from the results of
thin films and corrosion coupons. For copper, the coupon gives higher corrosion when
subjected to static heating as compared to dynamic heating. This means that the coupon
showing higher corrosion has a tendency to corrode less when subjected to dynamic
heating. Similarly, silver tends to corrode less when a constant temperature is maintained
but corrodes more and faster when it has dynamic heating.
Also the corrosion rate of copper and silver is more sensitive due to Joule’s
heating or self-heating. The difference in the corrosion rate of thin film and coupon is due
to different microstructure properties and surface finish.

66
Future Work
To understand the functional dependence of silver corrosion rate as it is believed
to be affected by the synergy of different gases. To understand the chemistry of silver
metal reacting in various conditions is important to have the clarity for silver corrosion
rate. As the corrosion rate is believed to be affected by the synergy of gases, predicting
the gaseous composition of the air using Gas Analyzers and simulating the same
conditions in laboratory to understand the parameters affecting the corrosion rate in
depth.
Validation of the experimental results for the corrosion rate can be done by
performing CFD simulations to get a deeper insight. Also the gaseous contamination
levels in a data center are a function of location and time of year. So to procure the real
world data for corrosion from three different locations to find the levels of severity of the
ambient air from different geographical locations can give an apple to apple comparision.

67
References
[1] "2008 ASHRAE Environmental Guidelines for Datacom Equipment," ASHRAE TC 9.9
committee, 2008.
[2] "http://www.koomey.com/post/8323374335".
[3] Prabjit, Singh; Levente, Klein; Dereje, Agonafer; Kanan, Pujara;, "Effect of Relative
Humidity, Temperature and Gaseous and Particulate Contaminations on Information
Technology Equipment Reliability," in InterPACK/ICNMM, San Francisco, 2015.
[4] Thermal Guidelines for Data Processing Environments– Expanded Data Center Classes
and Usage Guidance Whitepaper prepared by ASHRAE Technical Committee (TC) 9.9
Mission Critical Facilities, Technology Spaces, and Electronic Equipment, 2011.
[5] Thermal Guidelines for Data Processing Environments – Expanded Data Center Classes
and Usage Guidance, ASHRAE TC 9.9, 2011.
[6] "Impact of Air Filtration on the Energy and Indoor Air Quality of Economizer-based Data
Centers in the PG&E Territory," Lawrence Berkeley National Laboratory, 2009.
[7] "Air-Side Economizer," Energy Star, [Online]. Available:
www.energystar.gov/index.cfm?c=power_mgt.datacenter_efficiency_economizer_airside.
[8] "Reducing datacenter cost with an air economizer," Intel.
[9] P. Singh, P. Ruch, S. Saliba and C. Muller, "Characterization, Prevention and Removal
of Particulate Matter on Printed Circuit Boards," IPC APEX, San Diego, Feb 2015.
[10] "Environmental conditions for process measurement and control systems: Airborne
contamination," ISA-The Instrumentation Systems, and Automation Society, 3 Feb 1986.
[11] F. Haley, S. Prabjit, C. Levi, Z. Jing, A. Wallace, L. Dem, L. Jeffrey, L. Jane, Z. Solomon
and L. Simon, "Testing Printed Circuit Boards for Creep Corrosion in Flowers of Sulfur
Chamber".
[12] H. Fu, C. C., P. Singh, J. Zhang., A. Kurella, X. Chen, X. Jiang, J. Burlingame and S.
Lee, "Investigation of Factors that Influence Creep Corrosion on Printed Circuit Boards,"
in SMTA Pan Pacific Microelectronics Symposium, Kauai, 14-16 Feb 2012.
[13] H. Fu, C. Chen, P. Singh, J. Zhang, A. Kurella, X. Chen, X. Jiang, J. Burlingame and S.
Lee., "Investigation of Factors that Influence Creep Corrosion on Printed Circuit Boards
Part 2,," in SMTAI, 2012.
[14] "Directive 2002/95/EC of the European Parliament and of the council of 27 Jan 2003 on
the restriction of the," 2003.

68
[15] Y. Zhou and M. Pecht, "Reliability Assessment of Immersion Silver Finished Circuit
Board Assemblies Using Clay Tests," in Int’l Conf, on Reliability, Maintainability and
Safety, ICRMC, 2009.
[16] "Case Study of Printed Circuit Board Corrosion and Countermeasures”," in NTT EAST
Ota-ku, 144-0053 , Japan.
[17] D. W. Rice, P. Peterson, E. B. Rigby, P. B. P. Phipps, R. J. Cappell and Tremoureux,
"Atmospheric Corrosion of Copper and Silver," J. Electrochem. Soc.,, pp. pg. 275-284,
1981.
[18] ASHRAE , "Contamination Whitepaper," ASHRAE , July 2009.
[19] "Particulate and Gaseous Contaminants in Datacom Environments (ASHRAE 2009b),"
ASHRAE whitepaper.
[20] C. W. Grunewald, "Z. Phys. Chem., B40, 455," 1938.
[21] H. Sereda and G. P. J., "Metal Corrosion in the Atmosphere," ASTM Stp. No. 435, 326-
59, 1968.
[22] W. H. J. Vernon, Trans. Faraday Soc.,, 23, 113 (1921); 23, 162 (1927); 27, 264 (1931);
29, 35 (1933) ; 31, 1668 (1935).
[23] W. E. Thomas and H. P. Campbelt, Holm Conference Proceedings, pp. 233-265, 1968.
[24] S. Mrowec and F. Z. A., "High Temperature Metallic Corrosion of Sulfur and its
Compounds," The Electrochemical Society Softbound Proceedings Series,, Princeton,
N.J., 1970.
[25] W. E. C. a. H. P. Thomas, in Holm Conference Proceedings, pp. 233-265, 1968.
[26] W. H. Abbott, in IEEE Trans. Parts, Hybrids, Packag.,, 1974.
[27] J. A. Lorenzen, in Institute of Environmental Sciences Proceedings, pp. 110-114, 1971.
[28] S. P. Sharma, in This Journal, 125, 2005 , 1978.
[29] V. S. Benjamin, S. Michael, Z. K. Roumen, L. B. Gustavo, R. I. Rogelio, B. Monica
Carrillo, N. Nicola Radnev, A. Mario Curiel, G. Navor Rosas and R. JoseMaría Bastidas,
Copper Corrosion by Atmospheric Pollutants in the Electronics Industry, Hindawi
Publishing Corporation, 2013.
[30] L. Veleva, B. Valdez, G. Lopez, L. Vargas and J. Flores, Atmospheric corrosion of
electro-electronics metals in urban desert simulated indoor environment, 2008: Corrosion
Engineering Science and Technology.

69
[31] J. F. Valdez and S. B. Flores, Cabina de simulaci´on de corrosion para la industria
electr´onica en interior, Ingenieros, vol. 6, no 21,, 2003.
[32] M. Chris and C. Grant, "Changes Required for Protection of Today's Process Control
Equipment," ISA Standard 71.04.
[33] R. Allen and M. Trzeciak, "Measuring Environmental Corrosivity," in 25th Holm
Conference, Illinios Institute of Technology, Chicago, 1979.
[34] P. J. Peterson, "Corrosion of Materials and Magnets," in ASTM STP 1148.
[35] T. V. Bagul, "Computational study of behavior of gas absorption in data ceter equipment
and its effects on the rate of corrosion/contamination," UTA, Alington, 2014.
[36] S. J. Krumbein, B. Newell and V. Pascucci, "Monitoring Environmental Tests by
Coulometric Reduction of Metallic Control Samples," Journal of Testing and Evaluation,
1989.
[37] H. H. Uhlig, The Corrosion Handbook, New York: John Wiley & Sons, Inc, 1948.
70
Biographical Information
Kanan Dinesh Pujara, has received her Bachelors of Engineering degree in
Mechatronics Engineering from the Sardar Patel University, Gujarat, India. She has
completed her Masters in Mechanical Engineering from the University of Texas at
Arlington, US in December 2015.
Kanan’s interest has always been in the field of Computational Fluid Dynamics,
HVAC systems and Machine design. Her interest in this field got her the opportunity to
work with one of the engineering giant, Larsen and Toubro, Bangalore-Baroda, India for 5
years working in the field of Computational Fluid Dynamics (CFD). Her research interests
has always been into Fluid flow and Heat Transfer, Thermal Sciences and Design.
Coming from a business background, Kanan is always interested to be an
entrepreneur. She would like to use her knowledge of the field of medical devices for the
good of technology and to help mankind.