effects of temperature and relative humidity on filter
TRANSCRIPT

Effects of Temperature and Relative Humidity on Filter Loading
by Simulated Atmospheric Aerosols
&
COVID-19 Related Mask and Respirator Filtration Study
A DISSERTATION
SUBMITTED TO THE FACULTY OF THE
UNIVERSITY OF MINNESOTA
BY
Chenxing Pei
IN PARTIAL FULFILLMENT OF THE REQUIREMENTS
FOR THE DEGREE OF
DOCTOR OF PHILOSOPHY
Dr. David Y.H. Pui, Advisor
August 2020

© Chenxing Pei 2020

i
Acknowledgments
First and foremost, I am deeply indebted to my advisor, Professor David Y. H. Pui,
for his continuous guidance, mentoring, and inspiration throughout my undergraduate and
graduate studies. He provided me with the encouragement and freedom to work on any
filtration related studies that interested me. His support, patience, and trust have made my
years spent in the Particle Technology Laboratory an enjoyable, enriching, and memorable
experience in my life.
I would like to express my deepest appreciation to my committee members: Prof.
Thomas Kuehn, Prof. David Kittelson, and Prof. Kevin Janni for reviewing my dissertation,
offering insightful comments and suggestions, and serving on my Ph. D. exam committees.
I am extremely grateful to my committee members not only for their time and extreme
patience, but for their intellectual contributions to my development as a scientist.
I would also like to thank Dr. Qisheng Ou, whose help cannot be overestimated. Dr.
Ou provided me with the tools that I needed to choose the right direction and successfully
complete my dissertation. Special thanks to Dr. Young H. Chung, who led to many
interesting and motivating discussions. His help and advice were invaluable for my
research and life. Thanks also to Weiqi Chen, who collaborated with me on the smart sensor
project. I am also grateful to Kai Xiao for enlightening me the first glance of research.
I would also like to extend my deepest gratitude to my current and former
colleagues in the Particle Technology Laboratory: Dr. Young H. Chung, Dr. Lin Li, Dr.
Sheng-Chieh Chen, Dr. Qisheng Ou, Dr. Shigeru Kimoto, Dr. Min Tang, Dr. Yan Ye, Dr.

ii
Seong Chan Kim, Dr. Qingfeng Cao, Dr. Handol Lee, Dr. Ziyi Li, Dr. Tsz Yan Ling, Dr.
Zhili Zuo, Dr. Chang Hyuk Kim, Dr. Drew Thompson, Dr. Nanying Cao, Dr. Seungkoo
Kang, Dr. Lipeng Su, Dr. Xinjiao Tian, Dr. Qiang Lyu, Kai Xiao, Gustaf Lindquist, Swathi
Satish, Weiqi Chen, Dongbin Kwak, Tao Song, Jihe Chen, Ren Jeik Ong, Qi Heng Lee,
Jonathon Anderson, Kaushik Kanna, Dr. Mamoru Yamada, Dr. Dongbin Kim, Dr. Yun
Liang, Dr. Deqiang Chang, Dr. Cheng Chang, and Dr. Ningning Zhang. Their company,
discussion, and assistance have been invaluable.
I would like to express my gratefulness to ME Connect Seminar Series committee
members and our mentor Prof. Suhasa Kodandaramaiah. It was rewarding and interesting
to work with all of them to organize seminars every week and learn others’ research in the
Department of Mechanical Engineering.
I would like to acknowledge members of the Center for Filtration Research for their
financial support, comments and interests in my studies: 3M Company, Applied Materials,
Inc., BASF Corporation, Boeing Company, Corning Incorporated, Cummins Filtration Inc.,
Donaldson Company, Inc., Entegris, Inc., Ford Motor Company, LG Electronics Inc.,
Parker Hannifin, Samsung Electronics Co., Ltd., Shengda Filtration Technology Co., Ltd.,
Shigematsu Works Co., Ltd., TSI Inc., W. L. Gore & Associates, Inc., WatYuan Filtration
System Co., Ltd, Yancheng Environmental Protection Science and Technology City, and
the affiliate member National Institute for Occupational Safety and Health (NIOSH). Parts
of this work were carried out in the Characterization Facility, University of Minnesota,
which receives partial support from NSF through the MRSEC program.
Last but not least, my deep and sincere gratitude to my wife, Kunlin Wang.
Understanding me best as a Ph.D. herself, Kunlin has been my best friend and terrific

iii
companion, who gives me continuous, unparalleled, unconditional love and support. I am
also extremely grateful to my parents and parents-in-law, who give me opportunity to
explore my new possibilities and support me emotionally and financially. It is their
unreserved love, unbounded trust, endless patience, and timely encouragement make me
who I am today. Thanks also to my other family members and friends along my way, who
bring me love and support. In addition, My thanks go to my 5-year-old twin cats, Laobing
and Bantang, who have grown up as the best ‘coworkers’ during my Ph.D. study.

iv
To my parents, my love, and my future children

v
Abstract
This dissertation focuses on the effects of temperature and relative humidity on
filter loading by simulated atmospheric aerosols and COVID-19 related mask and
respirator filtration study. There are two objectives of this dissertation: the first one is to
fill the gap between lab filter testing and actual filter operation, and the second one is to
help curb the COVID-19 spreading from filtration perspective.
Filter life is an important criterion to evaluate air filters, and longer life is preferred
before reaching the replacing pressure. Filter life could be evaluated in the laboratory by
loading lab-generated contaminants on the test filter sample, typically at high
concentrations to accelerate the testing process. However, the current filter loading testing
protocols and standards use the non-hygroscopic micron dust or less-hygroscopic lab salt
particles (NaCl, KCl) as challenging particles. Meanwhile, the testing environment,
especially relative humidity, have not been strictly controlled. With increasingly more
stringent pollution control requirement in place in past decades, sub-micron particles are
becoming more important, such as inorganic salts ((NH4)2SO4, NH4NO3), soot, organic
compounds, which are more hygroscopic than lab salts. Therefore, there have been
discrepancies between lab filter testing and actual filter operation, including challenging
particle species, testing relative humidity and temperature. It is vital to understand how air
filters perform in the actual environment so that both filter recommendations and
optimization could be done confidently and wisely.
This dissertation thrives on the effects of temperature and relative humidity on filter
loading by simulated atmospheric aerosols. A Lab-simulated Ambient Environment Air

vi
Filter Test Rig was firstly built with controlled temperature and relative humidity testing
environment, simulated atmospheric aerosols generation, and advanced filter testing
capability. The testing temperature and relative humidity are well controlled to simulate
different filter operating conditions. The techniques to generate atmospheric aerosols were
developed, including inorganic salt generation and dry/wet state control at various testing
relative humidities, fresh soot and aged soot by organic compounds coating. The versatile
atmospheric aerosols generation techniques enable filter loading tests with “real”
atmospheric aerosols rather than lab salts.
The temperature effect on filter loading was studied, and it is found that temperature
is a minor factor affecting filter life, compared to relative humidity. The relative humidity
effect on filter loading was then investigated with conventional cellulose filter and
nanofiber coated cellulose filter. The testing relative humidity covered from below salts’
efflorescence relative humidity to above their deliquescence relative humidity, and both
dry and wet particles at different relative humidities were loaded on test filters. It is found
that, in general, the higher the loading relative humidity, the longer the filter life. But the
filter life also depends on the filter structure and challenging particle state. Filtration
efficiency evolution was also studied.
To better simulate atmospheric aerosols, test filters were loaded with (NH4)2SO4
and NH4NO3 mixture particles and soot aged by organic compounds coating separately at
various relative humidities. It is found that relative humidity is a very strong factor
affecting filter life, particularly for salt mixtures. There is a discrepancy between fresh soot
and aged soot, and aged soot should be used in filter loading since it can represent
atmospheric soot more realistically. These studies reveal that actual filter operation with

vii
atmospheric aerosols is complex, and the filter recommendation should be carefully made,
and the actual operating conditions should be considered as much as possible.
The above research was conducted at constant loading relative humidity, which is
not possible in actual filter operation. Hence the effect of relative humidity change on
hygroscopic salt loaded filters was studied. This study broadens the understanding of the
loaded filter behavior in varying relative humidity which could benefit potential techniques
to prolong filter life or to clean filters by reverse pulsing.
The ultimate goal of the first objective is to recommend filters based on operating
locations. Whereas it is still challenging to achieve filter selection and optimization based
on all research mentioned above. We developed and established a Global Air
Pollutant/Meteorological Condition Database and a Smart Sensor for Filter Performance
Monitoring System. For a city of interest, this Database can report historical pollutants
speciation and concentration, historical monthly average temperature and RH, and
pollutant concentration trend in past years. The Smart Sensor could monitor filtration
efficiency, the differential pressure across the filter, and operating temperature, RH in real-
time. With millions of the Smart sensor installations, massive filter operation data could be
received for machine learning and big data analysis. With the aid of the Database and Smart
Sensor, the above experiment conclusions could be utilized to better test and recommend
filters based on operating locations.
COVID-19 becomes a global challenge in 2020. Two mask and respirator studies
were carried out to help curb the spread of COVID-19 and relieve the severe shortage of
masks and respirators. The first one compared common materials that have the potential to
be used as alternative masks for the public in daily protection. The second one aimed to

viii
evaluate the effect of decontamination of the commercial and alternative mask and
respirator materials from the filtration perspective.
These seven studies below constitute the main body of this dissertation and have
been published, currently under review, or in preparation.
Chapter 5: Pei, C., Ou, Q. and Pui, D. Y. H. (2020). Effects of Temperature and
Relative Humidity on Laboratory Air Filter Loading Test by Hygroscopic Salts Separation
and Purification Technology 255: 117679. doi:10.1016/j.seppur.2020.117679
Chapter 6: Pei, C., Ou, Q., and Pui, D. Y. H. (2019). Effect of relative humidity
on loading characteristics of cellulose filter media by submicrometer potassium chloride,
ammonium sulfate, and ammonium nitrate particles Separation and Purification
Technology 212: 75-83. doi:10.1016/j.seppur.2018.11.009
Pei, C., Ou, Q., Yu, T. and Pui, D. Y. H. (2019). Loading
characteristics of nanofiber coated air intake filter media by potassium chloride,
ammonium sulfate, and ammonium nitrate fine particles and the comparison with
conventional cellulose filter media Separation and Purification Technology 228: 115734.
doi:10.1016/j.seppur.2019.115734
Chapter 7: Pei, C., Ou, Q., Wang, K., Sun, C.C., and Pui, D. Y. H., Effect of
different ammonium salt mixing ratios on the loading performances of two nanofiber
coated cellulose filters In preparation
Chapter 8: Pei, C., Ou, Q., and Pui, D. Y. H., Effect of relative humidity change
on pressure drop of loaded cellulose filter media with hygroscopic deposits In preparation
Chapter 9: Pei, C.1, Ou, Q.1, Kim, S. C., Chen, S-C., and Pui, D. Y. H. (2020).
Alternative Face Masks Made of Common Materials for General Public: Fractional
Filtration Efficiency and Breathability Perspective Aerosol and Air Quality Research 20
doi:10.4209/aaqr.2020.07.0423
Chapter 10: Ou, Q.1, Pei, C.1, Kim, S. C., Abell, E. and Pui, D. Y. H. (2020).
Evaluation of decontamination methods for commercial and alternative respirator and
mask materials – view from filtration aspect Journal of Aerosol Science 150: 105609.
doi:10.1016/j.jaerosci.2020.105609
ix
Table of Contents Acknowledgments .............................................................................................................. i
Abstract .............................................................................................................................. v
Table of Contents ............................................................................................................. ix
List of Tables .................................................................................................................. xiii
List of Figures ................................................................................................................. xiv
Part 1: Methodology Development .................................................................................. 1
Chapter 1: Lab-simulated Ambient Environment Air Filter Test Rig ........................ 3
1.1 Introduction .......................................................................................................... 3
1.2 Temperature Control ............................................................................................ 8
1.3 Air Flow Control and RH Control ..................................................................... 10
1.4 Salt Dry/Wet State Control ................................................................................ 13
1.5 Electric Control System and LabVIEW Program .............................................. 17
1.6 Filter Sample Preparation .................................................................................. 19
Chapter 2: Soot Generation and Organic Compounds Soot Coating ........................ 22
2.1 Soot Generation ................................................................................................. 22
2.2 Organic Compounds Coating Method ............................................................... 25
Chapter 3: Smart Sensor for Filter Performance Monitoring System ...................... 27
3.1 Background ........................................................................................................ 27
3.2 System Description ............................................................................................ 30
3.3 Case study 1: Indoor Air Purifier ....................................................................... 33
3.4 Case study 2: Delhi SALSCS Operating Monitoring ........................................ 38
3.5 Conclusion ......................................................................................................... 41
Chapter 4: Global Air Pollutant/Meteorological Condition Database ...................... 43
Part 2: Temperature and RH Effect on Filter Performance ...................................... 48
Chapter 5: Effects of Temperature on Filter Loading by Hygroscopic Salts at
Different RH .................................................................................................................... 50
5.1 Introduction ........................................................................................................ 50
5.2 Experimental Method and Material ................................................................... 52
5.3 Results ................................................................................................................ 55
5.3.1 Dry KCl ..................................................................................................... 55
5.3.2 Dry (NH4)2SO4 .......................................................................................... 57

x
5.3.3 Wet NH4NO3 ............................................................................................. 60
5.4 Discussion .......................................................................................................... 63
5.4.1 DRH Temperature Dependence ................................................................ 63
5.4.2 Capillary Condensation ............................................................................. 65
5.4.3 Suggestions to Atmospheric Particulate Pollutants Control Technology . 67
5.5 Conclusion ......................................................................................................... 68
Chapter 6: RH Effect on Filter Loading by Single Species ......................................... 70
6.1 Conventional Cellulose Filter Media ................................................................. 70
6.1.1 Introduction ............................................................................................... 70
6.1.2 Experimental Method and Material .......................................................... 72
6.1.3 Results and Discussion ............................................................................. 75
6.1.3.1 RH Effect of Deposited Hygroscopic Particles .................................... 75
6.1.3.2 Loading Curves ..................................................................................... 77
6.1.3.3 Efficiency Curves .................................................................................. 81
6.1.3.4 Volume Loadings .................................................................................. 83
6.1.3.5 Microscopic Observation ...................................................................... 85
6.1.4 Conclusions ............................................................................................... 88
6.2 Nano-Fiber Coated Cellulose Filter Media ........................................................ 90
6.2.1 Introduction ............................................................................................... 90
6.2.2 Experimental Method and Material .......................................................... 94
6.2.3 Results and Discussion ............................................................................. 98
6.2.3.1 Particle State Effect on Filter Deposition ............................................. 98
6.2.3.2 RH Effect on Filter Deposition ........................................................... 100
6.2.3.3 Loading Curves ................................................................................... 101
6.2.3.4 Volume Loading ................................................................................. 105
6.2.3.4.1 Dry Particles Volume Loading ...................................................... 105
6.2.3.4.2 Wet Particles Volume Loading ...................................................... 106
6.2.3.5 Comparison with Conventional Cellulose Filter Media ..................... 109
6.2.3.6 Microscopic Observation .................................................................... 111
6.2.4 Conclusions ............................................................................................. 114
Chapter 7: RH Effect on Filter Loading by Multiple Species .................................. 118
7.1 (NH4)2SO4 and NH4NO3 Mixture .................................................................... 118
7.1.1 Introduction ............................................................................................. 118
7.1.2 Experimental Method and Material ........................................................ 120

xi
7.1.3 Results and Discussion ........................................................................... 123
7.1.3.1 Dry Mixture Particles Loading ........................................................... 123
7.1.3.2 Wet Mixture Particles Loading ........................................................... 129
7.1.4 Conclusions ............................................................................................. 131
7.2 Soot with Organic Compounds Coating .......................................................... 132
7.2.1 Introduction ............................................................................................. 132
7.2.2 Experimental Method and Material ........................................................ 134
7.2.3 Results and Discussion ........................................................................... 135
7.2.4 Conclusions ............................................................................................. 139
Chapter 8: Effect of RH Change on Pressure Drop of Hygroscopic Particles Loaded
Cellulose Filter Media ................................................................................................... 141
8.1 Introduction ...................................................................................................... 141
8.2 Experimental Method and Material ................................................................. 143
8.3 Results and Discussion .................................................................................... 147
8.3.1 KCl Loaded Filter Sample ...................................................................... 147
8.3.2 (NH4)2SO4 Loaded Filter Sample ........................................................... 150
8.3.3 NH4NO3 Loaded Filter Sample ............................................................... 153
8.4 Conclusions ...................................................................................................... 155
Part 3: COVID-19 Related Study: Mask and Respirator Filtration Study ............. 157
Chapter 9: Alternative Face Masks Made of Common Materials for General Public:
Fractional Filtration Efficiency and Breathability Perspective ................................ 159
9.1 Introduction ...................................................................................................... 159
9.2 Experimental Method and Material ................................................................. 162
9.3 Results And Discussion ................................................................................... 167
9.3.1 Commercial Respirators and Masks ....................................................... 167
9.3.2 Furnace Filters ........................................................................................ 170
9.3.3 Vacuum Cleaner Filters .......................................................................... 171
9.3.4 Common Household Materials ............................................................... 172
9.3.5 Discussion of The Figure of Merit .......................................................... 175
9.3.6 Some Discussions ................................................................................... 177
9.4 Conclusions ...................................................................................................... 180
Chapter 10: Evaluation of Decontamination Methods for Commercial and
Alternative Respirator and Mask Materials – View from Filtration Aspect .......... 181
10.1 Introduction ...................................................................................................... 181

xii
10.2 Experimental Method and Material ................................................................. 185
10.2.1 Decontamination Methods ...................................................................... 185
10.2.2 Filtration Performance Testing ............................................................... 185
10.3 Results and Discussion .................................................................................... 187
10.3.1 Base Performance Before Decontamination ........................................... 188
10.3.2 Decontamination by Isopropanol Alcohol .............................................. 190
10.3.3 Decontamination by UVGI ..................................................................... 193
10.3.4 Decontamination by Thermal Treatments .............................................. 195
10.3.5 Autoclave Treatment on Masks Made of Sterilization Wrap ................. 202
10.4 Conclusions ...................................................................................................... 204
Chapter 11: Summary and Future Work ................................................................... 207
11.1 Effects of Temperature and RH on Filter Loading by Simulated Atmospheric
Aerosols ...................................................................................................................... 207
11.2 COVID-19 Related Mask and Respirator Filtration Study .............................. 212
11.3 Future Work ..................................................................................................... 213
Bibliography .................................................................................................................. 216
Appendix ........................................................................................................................ 236

xiii
List of Tables Table 1–1. Testing conditions of several filter testing standards ........................................ 4 Table 1–2. Deliquescence and efflorescence relative humidity of potassium chloride,
ammonium sulfate, and ammonium nitrate from literature .............................................. 15 Table 3–1. Comparison of current commercially available products ............................... 29 Table 3–2. Bill of material of the current prototype ......................................................... 33 Table 3–3. Sample readings of the filter performance monitoring system at medium fan
speed ................................................................................................................................. 35 Table 5–1. Analysis of Variance Table of KCl ................................................................. 57 Table 5–2. Analysis of Variance Table (Type II test) of dry (NH4)2SO4 ......................... 60 Table 5–3. Analysis of Variance Table (Type II test) of wet NH4NO3 ............................ 62 Table 6–1. Test matrix of this study ................................................................................. 97 Table 7–1. Chemical and Physical Properties of glutaric acid and oleic acid ................ 134 Table 7–2. Mass fractal dimensions of pure soot and glutaric acid coated soot at different
RHs ................................................................................................................................. 137 Table 8–1. All possible process from loading RH to Conditioning RH ......................... 146 Table 10–1. Quantitative fit testing results of the new N95 respirator and after oven and
steam heat treatment cycles. ........................................................................................... 199

xiv
List of Figures Figure 1–1. Schematic diagram of the Lab-simulated Ambient Environment Air Filter
Test Rig ............................................................................................................................... 7 Figure 1–2. Photo of the Lab-simulated Ambient Environment Air Filter Test Rig .......... 7 Figure 1–3. Photos of the temperature-controlled chamber and details inside ................... 9 Figure 1–4. Detailed schematic diagram of the Lab-simulated Ambient Environment Air
Filter Test Rig (only one filter holder is depicted here for simplicity) ............................. 10 Figure 1–5. Demonstration of the hydration and dehydration process of a salt particle .. 14 Figure 1–6. Schematic diagram of the LAEAF Test Rig control system ......................... 18 Figure 1–7. Filter sample preparing process ..................................................................... 21 Figure 2–1. Cross section drawing of the homemade soot generator ............................... 23 Figure 2–2. Photo of the homemade soot generator ......................................................... 24 Figure 2–3. Sample of soot particles generated by the homemade soot generator ........... 24 Figure 2–4. Soot organic compound coating apparatus .................................................... 26 Figure 3–1. Schematic of the filter performance monitoring system ............................... 30 Figure 3–2. Photo of the filter performance monitoring prototype .................................. 32 Figure 3–3. The filter performance monitoring system on an indoor air purifier (HEPA
filter is not in place to show the downstream module) ..................................................... 34 Figure 3–4. Differential pressures of the HEPA filter at different fan speeds .................. 36 Figure 3–5. Filtration efficiencies of the HEPA filter at different fan speeds .................. 37 Figure 3–6. Schematic diagram of the Delhi SALSCS and filter performance monitoring
system (modified from Dr. Sheng-Chieh Chen’s diagram) .............................................. 39 Figure 3–7. Locations of filter performance monitoring system sensors and other
measurement equipment in the Delhi SALSCS ................................................................ 40 Figure 3–8. Sensing and control system diagram of the Delhi SALSCS ......................... 41 Figure 4–1. Monthly average PM2.5 concentration of Beijing, Shanghai, and Guangzhou
from 2014. ......................................................................................................................... 44 Figure 4–2. Yearly average PM2.5 concentration of Beijing, Shanghai, and Guangzhou
from 2014 .......................................................................................................................... 45 Figure 4–3. Sample data extracted from the global air pollutant meteorological condition
database ............................................................................................................................. 47 Figure 5–1. (NH4)2SO4, NH4NO3 testing points and corresponding AHs. Testing
temperatures are carefully picked so that the AH of low temperature high RH is close to
the high temperature low RH (two dotted lines indicate two similar AHs). ..................... 54 Figure 5–2. SEM image of a clean filter sample. Thin fibers are synthetic nanofibers
(Nylon), and thick fibers beneath the nanofibers are cellulose fibers ............................... 55 Figure 5–3. Volume loading of dry KCl at different loading AHs ................................... 56 Figure 5–4. Volume loading of dry (NH4)2SO4 at different loading temperatures and RHs
........................................................................................................................................... 58 Figure 5–5. Volume loading of dry (NH4)2SO4 at different loading AHs ........................ 59 Figure 5–6. Volume loading of wet NH4NO3 at different loading temperatures and RH 61 Figure 5–7. Volume loading of wet NH4NO3 at different loading AHs ........................... 62 Figure 5–8. The plot of Mean Curvature of the Meniscus as a function of RH and
temperature ....................................................................................................................... 67

xv
Figure 6–1. SEM image of a test filter media sample. It is a conventional cellulose filter
media with an efficiency rating of F8 according to EN779 .............................................. 73 Figure 6–2. Salt particle size distribution ......................................................................... 74 Figure 6–3. Dendrites restructuring with capillary condensed water ............................... 76 Figure 6–4. Selected loading curves under different RHs. ............................................... 80 Figure 6–5. Efficiency curve as a function of volume loading. ........................................ 82 Figure 6–6. Volume loadings of KCl, (NH4)2SO4, and NH4NO3 at different RH ............ 84 Figure 6–7. SEM images of the KCl and (NH4)2SO4 under 30% and 75% RHs, NH4NO3
under 15% and 30% RHs. ................................................................................................. 86 Figure 6–8. Higher magnification (10000X) of the SEM images of the KCl and
(NH4)2SO4 under 30% and 75% RHs, lower magnification (5000X) of the NH4NO3 under
15% and 30% RHs. ........................................................................................................... 88 Figure 6–9. Number-based and mass-based size distributions of three salts. This is the
averaged size distribution of all samples in this study for each salt. ................................ 96 Figure 6–10. KCl, (NH4)2SO4, and NH4NO3 sample loading curves under different RH
and different particle states ............................................................................................. 104 Figure 6–11. Volume loadings of KCl, (NH4)2SO4, and NH4NO3 at different RH on
nanofiber coated cellulose filter (the present study) ....................................................... 107 Figure 6–12. SEM image of (NH4)2SO4 at 90% RH ...................................................... 109 Figure 6–13. Volume loadings of KCl, (NH4)2SO4, and NH4NO3 at different RH on
conventional cellulose filter (Adopted from Pei et al. (2019a)) ..................................... 110 Figure 6–14. SEM images of test filter media loaded with dry KCl and (NH4)2SO4 at
different RH. ................................................................................................................... 112 Figure 6–15. SEM images of test filter media loaded with dry (NH4)2SO4 at 30% and
75% RH ........................................................................................................................... 113 Figure 6–16. SEM images of test filter media loaded with wet KCl, (NH4)2SO4 and
NH4NO3 at different RH. ................................................................................................ 114 Figure 7–1. SEM image of a clean nanofiber coated cellulose filter with thicker and
denser nanofibers. ........................................................................................................... 122 Figure 7–2. Mass gains of dry (NH4)2SO4 and NH4NO3 mixture particles on filter
samples at different loading RHs .................................................................................... 124 Figure 7–3. Mass gains and sample loading curves close to the MDRH of salt mixture
when m((NH4)2SO4):m(NH4NO3)=80%:20% ................................................................ 125 Figure 7–4. SEM images and particle deposition illustrations at different loading RH . 126 Figure 7–5. Small cavities on m((NH4)2SO4):m(NH4NO3)=50%:50% mixture dry
particles at 30% loading RH. .......................................................................................... 127 Figure 7–6. Mass gains and loading curves close to the MDRH of salt mixture when
m((NH4)2SO4):m(NH4NO3)=50%:50% .......................................................................... 128 Figure 7–7. Mass gains of wet (NH4)2SO4 and NH4NO3 mixture particles on filter
samples at different loading RHs .................................................................................... 129 Figure 7–8. SEM images of filter samples loaded with pure NH4NO3 wet particles (left)
and wet m((NH4)2SO4):m(NH4NO3)=20%:80% mixture particles (right) at 60% RH... 130 Figure 7–9. Effective densities of pure soot and glutaric acid coated soot particles with
different mobility diameters ............................................................................................ 136

xvi
Figure 7–10. SEM images of a filter sample loaded with pure soot in the bottom and
glutaric coated soot on the top ........................................................................................ 138 Figure 7–11. Mass Gains of pure soot and glutaric coated soot at different loading RH 139 Figure 8–1. Loading and conditioning processes of the test filter sample ...................... 144 Figure 8–2. Illustration of possible states of loading and conditioning processes (KCl and
(NH4)2SO4) ...................................................................................................................... 146 Figure 8–3. KCl loaded filter samples pressure stabilization during the RH conditioning
process............................................................................................................................. 148 Figure 8–4. KCl terminal pressures of different loading and conditioning RHs ............ 149 Figure 8–5. SEM images of KCl loaded filter sample that was loaded at 30% RH and
conditioned at 90% RH. Left: 1000X; Right: 5000X. .................................................... 150 Figure 8–6. (NH4)2SO4 terminal pressures of different loading and conditioning RHs . 151 Figure 8–7. SEM images of (NH4)2SO4 loaded filter sample that was loaded at 90% RH
and conditioning at 30% RH ........................................................................................... 152 Figure 8–8. SEM images of (NH4)2SO4 loaded filter sample that was loaded at 45% RH
and conditioning at 100% RH. Left: dry particle loading; Right: wet particle loading .. 153 Figure 8–9. NH4NO3 terminal pressures of different loading and conditioning RH ...... 154 Figure 8–10. SEM images of NH4NO3 loaded filter sample that was loading at 60% and
conditioning at 30% RH.................................................................................................. 154 Figure 9–1. Schematic of the fractional efficiency measurement setup ......................... 167 Figure 9–2. Fractional filtration efficiency and breathing resistance of commercial
respirators and masks ...................................................................................................... 169 Figure 9–3. Fractional filtration efficiency and breathing resistance of furnace filters .. 171 Figure 9–4. Fractional filtration efficiency and breathing resistance of vacuum cleaner
filters ............................................................................................................................... 172 Figure 9–5. Fractional filtration efficiency and breathing resistance of common fabrics
......................................................................................................................................... 175 Figure 9–6. The figure of merit of common materials .................................................... 177 Figure 10–1. Fractional efficiency (a), breathing resistance, and quality factor (b) of 3M
8210 respirator, Halyard 48207 surgical mask, 3M 1820 procedure mask, Halyard H600
sterilization wrap, and Cummins EX101 material, before any decontamination treatments
......................................................................................................................................... 190 Figure 10–2. Fractional efficiency and breathing resistance of the 5 filter materials before
and after IPA treatments (soaking or spraying) .............................................................. 193 Figure 10–3. Fractional efficiency (a-c) and breathing resistance (d) of N95 respirator,
surgical mask, and procedure mask after multiple UVGI treatment cycles ................... 195 Figure 10–4. Fractional efficiency and breathing resistance of all five filter materials after
dry (a) and steam (b) heat treatments. ............................................................................. 201 Figure 10–5. Filtration performance of unworn and worn H600 sterilization wrap masks
after one or multiple cycle(s) of autoclave treatment. IPA soaked same material is
included for reference purpose ........................................................................................ 204 Figure 11–1. Structure of the first objective of this dissertation ..................................... 208

Part 1:
Methodology
Development

2
In Part 1, the methodologies used in this dissertation are introduced. Chapter 1
introduces the Lab-simulated Ambient Environment Filter Test Rig, which can test filters
under specified temperature, relative humidity, particle compositions and states (dry/wet),
etc. Chapter 2 presents the soot generation and organic compound soot coating method.
Chapter 3 introduces a novel filter performance monitoring system, which can monitor air
filter efficiency and pressure drop in real-time. Chapter 4 covers the Global Air Pollutant
Meteorological Condition Database, which has the potential to recommend filters with the
aid of the filter performance monitoring system.

3
Chapter 1: Lab-simulated Ambient Environment Air
Filter Test Rig
1.1 Introduction
Air filters are designed to remove particulate air pollutants to provide cleaner air.
It is a particularly important protection for the equipment or people behind the filter. The
best air filter should have low pressure drop, high efficiency, and long filter life. It is
essential to understand how the pressure drop and efficiency of an air filter evolution during
the air filter operation, and how long it takes before the air filter reaches a target pressure
drop. The characterization of an air filter could be achieved with a filter test rig, which can
control the flowrate through the filter media, measure the pressure drop across the filter
media, and measure the filter media efficiency.
To simulate the aging process of an air filter, filter loading could be performed on
a filter test rig. The loading process is to load the air filter with high concentration of
challenging particles. Some filter test standards, such as ASHRAE 52.2, ISO 5011, ISO
16890, and EN 779, use the synthetic loading dust as the filter loading particles, which
consists of fine dust, powdered carbon, and cotton linter (ASHRAE 2017, European
Committee for Standardization 2012, ISO 2014, 2016). Some respirator loading testing
protocols, such as 42 CFR Part 84, use sodium chloride (NaCl) or dioctyl phthalate (DOP)
as the filter loading particles (42 C.F.R. § 84, Office of the Federal Register 1995).
However, there are several shortcomings of the current testing methods. The first one is
that the synthetic loading dust and NaCl particle could not well represent the real particles

4
during the operation. The second one is that the relative humidity (RH) and temperature
are also not carefully controlled and cannot represent the operating conditions. The testing
particles, RH and temperatures of several filter testing standards are shown in Table 1–1.
Table 1–1. Testing conditions of several filter testing standards
Standard Testing Particles Relative
Humidity Temperature
ASHRAE 52.2-2017 KCl / Synthetic Loading Dust 45 ± 10% 10 ⁓ 38℃
ISO 5011:2014 ISO A2 & A4 Dust 55 ± 15% 23 ± 5℃
ISO 16890:2016 Synthetic Loading Dust 45 ± 10% 23 ± 5℃
EN 779:2012 DEHS / Synthetic Loading Dust < 75% Room or
outdoor air
42 CFR Part 84 NaCl(N-series)/DOP(R,P-series) 30 ± 10% 25±5℃
For the first shortcoming, in laboratory studies, sodium chloride (NaCl) and
potassium chloride (KCl) are used as the testing particles for the filter loading research,
because they are inexpensive, widely available, and non-toxic. The most common method
of generating salt particles is by atomizing a salt solution and dry atomized droplets to yield
dry salt particles. According to the ASHRAE standard 52.2-2017, to dry droplets, the RH
of the particle-laden air must be controlled less than 55% for NaCl, and 70% for KCl, which
is feasible to achieve in the laboratory by diffusion drying and mixing with dry air
(ASHRAE 2017).
On the other hand, the global population-weighted PM2.5 composition study by
Philip et al. (2014) shows that mineral dust is about 30% in PM2.5 composition. In another
study, a Surface Particulate Matter Network (SPARTAN) measures particulate matter
concentrations, speciation of 21 cities around the world, and the average crustal material
percentage in PM2.5 is 13.4 % ± 9.9 % (Snider et al. 2015, Snider et al. 2016). With more
stringent pollution control in past decades, sub-micron particles are concerned, such as
5
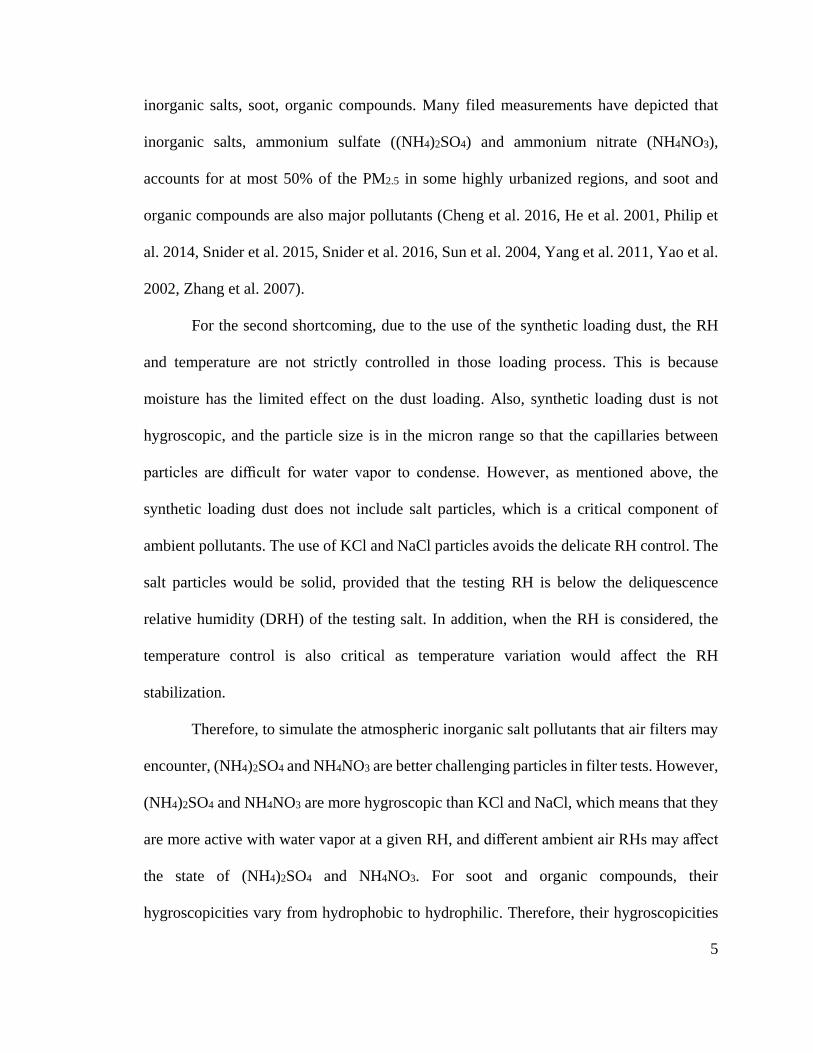
inorganic salts, soot, organic compounds. Many filed measurements have depicted that
inorganic salts, ammonium sulfate ((NH4)2SO4) and ammonium nitrate (NH4NO3),
accounts for at most 50% of the PM2.5 in some highly urbanized regions, and soot and
organic compounds are also major pollutants (Cheng et al. 2016, He et al. 2001, Philip et
al. 2014, Snider et al. 2015, Snider et al. 2016, Sun et al. 2004, Yang et al. 2011, Yao et al.
2002, Zhang et al. 2007).
For the second shortcoming, due to the use of the synthetic loading dust, the RH
and temperature are not strictly controlled in those loading process. This is because
moisture has the limited effect on the dust loading. Also, synthetic loading dust is not
hygroscopic, and the particle size is in the micron range so that the capillaries between
particles are difficult for water vapor to condense. However, as mentioned above, the
synthetic loading dust does not include salt particles, which is a critical component of
ambient pollutants. The use of KCl and NaCl particles avoids the delicate RH control. The
salt particles would be solid, provided that the testing RH is below the deliquescence
relative humidity (DRH) of the testing salt. In addition, when the RH is considered, the
temperature control is also critical as temperature variation would affect the RH
stabilization.
Therefore, to simulate the atmospheric inorganic salt pollutants that air filters may
encounter, (NH4)2SO4 and NH4NO3 are better challenging particles in filter tests. However,
(NH4)2SO4 and NH4NO3 are more hygroscopic than KCl and NaCl, which means that they
are more active with water vapor at a given RH, and different ambient air RHs may affect
the state of (NH4)2SO4 and NH4NO3. For soot and organic compounds, their
hygroscopicities vary from hydrophobic to hydrophilic. Therefore, their hygroscopicities

6
will potentially affect soot deposition on air filters and further affecting the air filters
performance.
The existing filter test apparatus are not capable to achieve a better control of the
testing conditions mentioned above. To understand the effect of different particulate
pollutants and operating conditions on filter performance, a Lab-simulated Ambient
Environment Air Filter Test Rig (LAEAF Test Rig) was built in the Particle Technology
Laboratory. The LAEAF Test Rig could test air filter samples under controlled RH and
temperature, with various simulated pollutants ((NH4)2SO4, NH4NO3, soot, and organic
compounds). It can perform both filter loading test and filter efficiency test.
The schematic diagram of the LAEAF Test Rig is shown in Figure 1–1, and the
photo of the LAEAF Test Rig is shown in Figure 1–2. The LAEAF Test rig consists of
pollutants generation, temperature-controlled environment, moisture generation, and filter
monitoring. With different generation methods, salt particles, soot, and organic compounds
can be generated and introduced to the LAEAF Test Rig, which will be described in detail
later. The temperature-controlled environment encloses the test filter holders, electric
heating elements, a circulating cooling coil, and other necessary parts, which can achieve
filter testing at different temperatures. Details will be described in Section 1.2 Temperature
Control. To study the RH effect on the filter performance with different challenging
particles, the testing RH can also be actively controlled. The details about the moisture
generation and RH control together with the air flow control will be described in Section
1.3 Air Flow Control and RH Control. The electric control and testing automation will be
covered in Section 1.5 Electric Control System and LabVIEW Program.

7
Figure 1–1. Schematic diagram of the Lab-simulated Ambient Environment Air Filter Test
Rig
Figure 1–2. Photo of the Lab-simulated Ambient Environment Air Filter Test Rig

8
1.2 Temperature Control
To study the temperature effect on the filter performance, essential components of
the LAEAF Test Rig are enclosed in a temperature-controlled chamber. The chamber is
built with 80/20® T-slot construction system (Columbia City, IN), and covered with 1-inch
thick polystyrene foam insulation boards, including the bottom. To increase the overall
insulation performance, all exposed aluminum frames are covered with insulation boards
as the aluminum is the thermal bridge in the system (see Figure 1–2). The front door is
covered with two acrylic sheets, which are mounted on the outside and inside of the frame,
separately. This double-panel design ensures the insulation and visibility of the front door.
An extra 1-inch thick polystyrene foam insulation board can be mounted when handling
temperature around 0 ℃ (not shown in Figure 1–2).
Electric heating elements and a circulating cooling coil connected to a chiller are
installed in the enclosure to control the testing temperature. Currently, the testing
temperature ranges from 0 ℃ to 50 ℃. To efficiently cool the chamber near 0 ℃, ethylene
glycol and water 1:1 liquid is used so that the cooling liquid would not freeze in the
circulating tubes. When testing temperature is below room temperature, the temperature
control is achieved by both cooling and heating since the electric heating elements could
be controlled with a quicker response so that a more stable temperature could be achieved.
Consequently, chiller temperature is set to several degrees below the desired testing
temperature, and the temperature inside the chamber is maintained to the desired testing
temperature by PID controlled electric heating elements. When the testing temperature is
above room temperature, only electric heating elements are employed to reach the desired
9
temperature. Two pairs of fans are installed below the cooling coil and electric heating
elements, and the third pair of circulating fans are installed on the top portion of the
chamber. The air inside the chamber circulates to reach homogenous desired temperature.
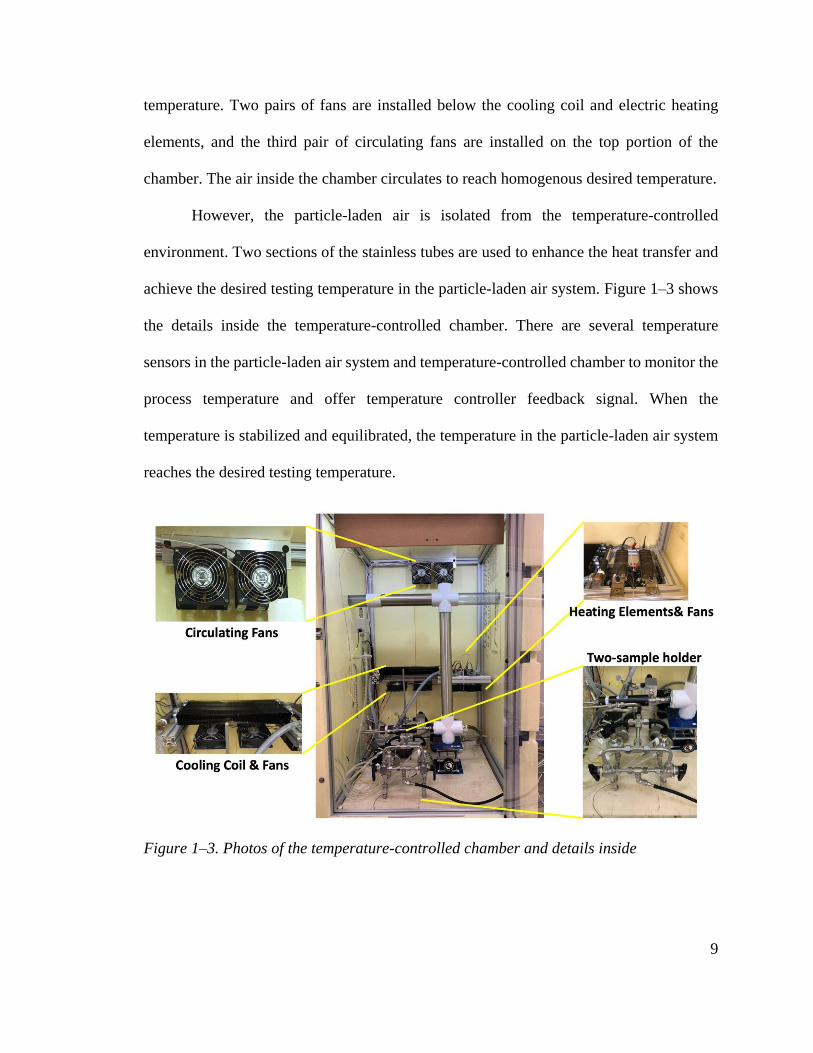
However, the particle-laden air is isolated from the temperature-controlled
environment. Two sections of the stainless tubes are used to enhance the heat transfer and
achieve the desired testing temperature in the particle-laden air system. Figure 1–3 shows
the details inside the temperature-controlled chamber. There are several temperature
sensors in the particle-laden air system and temperature-controlled chamber to monitor the
process temperature and offer temperature controller feedback signal. When the
temperature is stabilized and equilibrated, the temperature in the particle-laden air system
reaches the desired testing temperature.
Figure 1–3. Photos of the temperature-controlled chamber and details inside

10
Only essential components are installed in the temperature-controlled chamber, so
that unnecessary heat loads could be reduced, such as the hotplate for moisture generation
and soot generator. Meanwhile, the components that can be affected by the temperature are
also placed outside of the chamber, such as mass flow controllers (MFC) and differential
pressure sensors (See Figure 1–4).
Figure 1–4. Detailed schematic diagram of the Lab-simulated Ambient Environment Air
Filter Test Rig (only one filter holder is depicted here for simplicity)
1.3 Air Flow Control and RH Control
The air flow in the LAEAF Test Rig is labeled with color arrow in Figure 1–4. As
shown on the left, salt particles are generated by a homemade Collision-type pneumatic
atomizer, and soot particles are generated by a homemade diffusion flame soot generator,
which will be described in detail in Section 2.1 Soot Generation. Salt and soot particles can
be generated separately or simultaneously according to the needs. Dry filtered compressed
air could be added to desiccate salt or soot particles based on needs. A chilled mirror

11
hygrometer (System 1100DP, GE General Eastern Instruments, Wilmington, MA) is
installed to sample the particle-laden air in order to measure the RH. The reason why a RH
sensor is installed at this location will be discussed in Section 1.4 Salt Dry/Wet State
Control. A capacitive RH and temperature sensor (AM2302, ASAIR, Guangzhou,
Guangdong, China) is also installed in series to measure the RH and temperature as a
reference. Moisture generation is on the right side, and the moisture is generated by
sparging the filtered air into warm water bath at a controlled temperature. There are two
proportional valves in the moisture generation part. One controls the flow rate of dry
compressed air through the distilled water (wet air) and the other one controls the bypass
flow rate (dry air). The total flow rate through two proportional valves is about a constant,
and the amount of the moisture introduced into the LAEAF Test Rig depends on opening
percentages of two proportional valves. The opening percentage is PID controlled by a
LabVIEW program, which will be covered in Section 1.5 Electric Control System and
LabVIEW Program. The purpose of moisture generation is to increase the RH but only
water vapor is preferred. To avoid introducing water droplets, the dry and wet combined
air is connected vertically to a reservoir cup so that no water droplets could reach the main
flow that would interfere the humidity measurement and filter testing.
When the particle-laden air meets the generated moisture, they would mix in the
stainless tube. The mixed air is drawn to the test filter holder. The RH of test filter upstream
air is sampled to the second chilled mirror hygrometer (DewMaster, Edgetech Instruments
Inc. Hudson, MA) and the second AM2302 RH/Temp sensor, where the testing RH is
measured. Before the test particles reach the test filter, a Po-210 Staticmaster® Alpha
Ionizer (NRD, LLC. Grand Island, NY) neutralizer brought the charge level of challenging

12
particles to Boltzmann equilibrium charge distribution. The test filter is placed on a 47mm
filter holder (Gelman Science 2220, Pall Corporation, Port Washington, NY), which has
the pressure ports on both upstream and downstream. The third AM2302 sensor is installed
at the downstream of the filter holder. The pressure drop across the test filter media was
measured by a differential pressure sensor (Setra M267, Setra Systems, Inc. Boxborough,
MA). To measure the challenging particle size distribution and filter efficiency during the
testing, a scanning mobility particle sizer (SMPS, TSI 3938L56(3082, 3081A, 3756)
Shoreview, MN) is connected to the upstream and downstream of the test filter by a 3-way
ball valve. Since different RHs are used in testing, and the hygroscopic particle size is
sensitive to RH, a silica gel dryer column is added in the differential mobility analyzer
(DMA) sheath flow to maintain a low RH in the DMA. As shown in Figure 1–3, there are
two sample holders installed in parallel, which can test two test filters in parallel to achieve
the efficient testing. Part of the mixed air is exhausted to satisfy the flow equilibrium, and
the typical flow rate is about 30 liter per minute (LPM). The pressure in the LAEAF Test
Rig is slightly below the ambient pressure, the pressure is balanced by the pressure balance
HEPA filter near the moisture generation.
The sample flow rate of two chilled mirror hygrometers are controlled by critical
orifices. When the downstream of the critical orifice is connected to the house vacuum, the
pressure ratio of the upstream and downstream of the critical orifice is greater than the
minimum pressure ratio for the chocked flow and the flowrate is limited to a constant value
for a given orifice size. The flow rates of two test filters are controlled by two separate
MFCs, which could maintain a constant face velocity of test filters and accommodate the
filter pressure increasing. Since the specific heat of the moist air varies slightly at different

13
RH (Boukhriss et al. 2013), a desiccant column is used before MFCs to remove water vapor
in the stream. To accommodate the different air flow configurations, the main exhaust flow
rate is also modulated by an MFC. Similarly, a desiccant column is connected to remove
moisture. To protect critical orifices and MFCs from challenging particles, HEPA filters
are installed before them.
There are six RH sensors in the LAEAF Test Rig: two chilled mirror hygrometers
and four AM2302 sensors. In Figure 1–4 there are three RH sensor locations. Chilled
mirror hygrometers and AM2302 sensors are installed in series after the particle generation
and at the upstream of the test filter. The other two AM2302 sensors are installed at the
downstream of each test filter. The chilled mirror RH sensors measure RH accurately and
the one at the upstream of the test filter is used as the feedback signal of the PID RH control.
Other AM2302 sensors offer temperature measurements and reference RH measurements.
1.4 Salt Dry/Wet State Control
One of the important properties of hygroscopic salts (e.g., NaCl, KCl, (NH4)2SO4,
NH4NO3) is the hysteresis of the hydration and dehydration behavior. Salt particles are dry
at low environment RH. If the environment RH increases then, salt particles does not
absorb water until the environment RH reaches its deliquescence RH (DRH). At the DRH,
salt particle abruptly absorbs water and undergoes a phase change from solid to its aqueous
solution, i.e. a droplet. If the environment RH keeps increasing above the DRH, the salt
droplet size grows by absorbing more water. If the environment RH decreases from a point
above the DRH, salt droplet loses water with decreasing RH. The salt droplet does not lose

14
all the water it carries at the DRH, whereas loses all the water at its efflorescence RH (ERH)
instead. Salt particle stays dry when the environment RH is below the ERH. The hydration
and dehydration processes are demonstrated in Figure 1–5. The growth factor is the ratio
of the particle size at different RH to its dry state size, indicating the salt particle size
change. The hydration path and dehydration path are labeled in the figure with arrows. The
salt particle dry and wet states are also labeled with wide black and red lines.
Figure 1–5. Demonstration of the hydration and dehydration process of a salt particle
The ERH of certain salt, when it exists, is always lower than its DRH. When the
environment RH is between the ERH and DRH of a certain salt, the salt particle can be in
either solid or droplet state, depending on its hydration-dehydration history. When the
environment RH is above the DRH of a certain salt, it is in wet state; when the environment
RH is below the its ERH, it is in dry state (3 regions in Figure 1–5). Table 1–2 lists the
DRHs and ERHs of the three salts used. It is worth to note that the ERH of NH4NO3 is hard
to determine and could be considered to not exist. Therefore, NH4NO3 particles remain
droplet state while smaller in size than droplet generated from atomizer.

15
Table 1–2. Deliquescence and efflorescence relative humidity of potassium chloride,
ammonium sulfate, and ammonium nitrate from literature
Salt DRH ERH Sources
Potassium
chloride
KCl
84.60.3% 58.70.7% (Ahn et al. 2010)
84.70.2% 57.70.5% (Li et al. 2014)
851% 561% (Freney et al. 2009)
83-86% 59% (Cohen et al. 1987a, c)
Ammonium
sulfate
(NH4)2SO4
79.5% ~36% (Tang 1980)
80.6-81.3% 48% (Cohen et al. 1987a, c)
80% 37~40% (Tang and Munkelwitz
1994b)
791 332 (Cziczo et al. 1997)
80% 42% (Dougle et al. 1998)
75% 33% (Liu et al. 2008)
79.90.3% 37.90.5% (Ahn et al. 2010)
80.40.6% 37.74.1% (Laskina et al. 2015)
HTDMA
82.32.5% 43.52.1% (Laskina et al. 2015)
m-Raman
Ammonium
nitrate
NH4NO3
60% <10% (ten Brink and
Veefkind 1995)
62% 25~32% (Tang 1996)
60% <8% (Dougle et al. 1998)
61.80.3% N/A (Lightstone et al. 2000)
63% 32% (Lee and Hsu 2000)
When salt particles are dry, they are solid particles; while they are in paste or liquid
states when salt particles absorb some water. Consequently, the salt particle dry and wet
states can dramatically affect the filter performance. To better understand the filter
performance under different RHs, dry and wet salt particle should be researched separately.
Two distinct techniques were performed to generate dry and wet salt particles before
humidifying to the desired testing RH.

16
As aforementioned, salt particles are generated by a homemade Collision-type
pneumatic atomizer from salt aqueous solution. To generate dry salt particles, salt droplets
generated from the atomizer must be dried below the salt’s ERH before conditioning to the
desired testing RH. Salt droplets were firstly dried by a diffusion dryer filled with silica gel
desiccant, and dry clean air was supplied around the aerosol stream to desiccate particles
and achieve the RH below its ERH. Conversely, to generate wet salt particles, the
environment RH must be maintained above its ERH before conditioning to the desired
testing RH. Hence, silica gel desiccant in diffusion dryer was removed, and dry clean air
was reduced to maintain the RH above its ERH. Then, Salt particles were conditioned to
desired testing RH by the introduced moisture mentioned in Section 1.3 Air Flow Control
and RH Control.
The particle state control technique mentioned above relies on the accurate RH
measurement and control before salt particles meet the generated moisture. The System
1100DP chilled mirror hygrometer (System 1100DP, GE General Eastern Instruments,
Wilmington, MA) can offer such precise RH measurement. According to Gao (2006), who
reported that the ERH of (NH4)2SO4 depends on particle size, and ERH of the particles
with diameter less than 100 nm could be as low as 29.7% RH. To generate dry salt particles,
this effect should be considered. The RH before conditioning was controlled below 25%
to prompt (NH4)2SO4 particles drying. The ERH of KCl is about 58%, and the RH before
humidifying was controlled below 35%. Assuming KCl has the similar size effect on the
ERH decreasing, 35% is sufficient to dry KCl particles.
For NH4NO3, it is impossible to generate dry NH4NO3 particles from its aqueous
solution since it doesn’t have ERH. However, to compare the effect of the RH history on

17
the filter performance of NH4NO3, two methods are applied, that is, keeping the RH as low
as possible after particle generation and then conditioning to the desired RH (dry particle
generation method); or directly conditioning to the desired loading RH (wet particle
generation method). It is worth noting that the dry particle generation method cannot
generate dry NH4NO3 particle.
1.5 Electric Control System and LabVIEW Program
The LAEAF Test Rig is automatic controlled by a customized LabVIEW program.
The customized LabVIEW program is the brain of the LAEAF Test Rig. It analyzes all
input signals and transmits the output signals. The schematic diagram of the control system
is demonstrated in Figure 1–6, the NI Data Acquisition chassis (cDAQ-9172, NI, Austin,
TX) connects most of the sensors and actuators, which is the bridge between the
customized LabVIEW program and the computer. Two pressure sensors measure two test
filter holders separately, and both transmit voltage signal to the NI-DAQ. Similarly, two
chilled mirror hygrometers also transmit voltage signals to the NI-DAQ. Precise flow
control is critical on the LAEAF Test Rig, and 3 MFCs adjust air flows of two test filters
and the main exhaust accurately. The soot generator, which will be introduced detailly in
Section 2.1 Soot Generation, has 6 MFCs controlling propane, air, and nitrogen flows,
which are all controlled by the NI-DAQ. The testing RH in the LAEAF Test Rig is PID
controlled, and, as mentioned above, two proportional valves are voltage controlled by the
NI-DAQ. A solenoid valve that can shut-off the compressed air to the atomizer is also
connected to the NI-DAQ. So that salt particles generation can halt when the testing filter

18
reaches preset pressure drop, which is useful in the study of Chapter 8. Since the AM2302
communicates in digital signal, an Arduino microcontroller is employed to modulate
AM2302 signals. The Arduino microcontroller communicates with the customized
LabVIEW program by serial communication.
Figure 1–6. Schematic diagram of the LAEAF Test Rig control system
To measure the challenging particle size distribution and filter efficiency during the
testing, a SMPS is also connected to the computer. The SMPS communication is
accomplished by the Aerosol Instrument Manager® from TSI. To measure the soot particle
mass and mass fractal dimension, an Aerosol Particle Mass Analyzer (APM, Kanomax Inc.,

19
Andover, NJ, USA) is also employed, which is used in combination with the modified
SMPS system.
The electric heating elements are controlled with two temperature controllers in
series. The first temperature controller is set to heating on-off control mode with the preset
of 50 ℃, and it will cut off the power once the temperature inside the temperature-
controlled chamber is above 50 ℃. The second temperature controller is set to heating PID
mode so that the temperature inside the chamber could be precisely controlled.
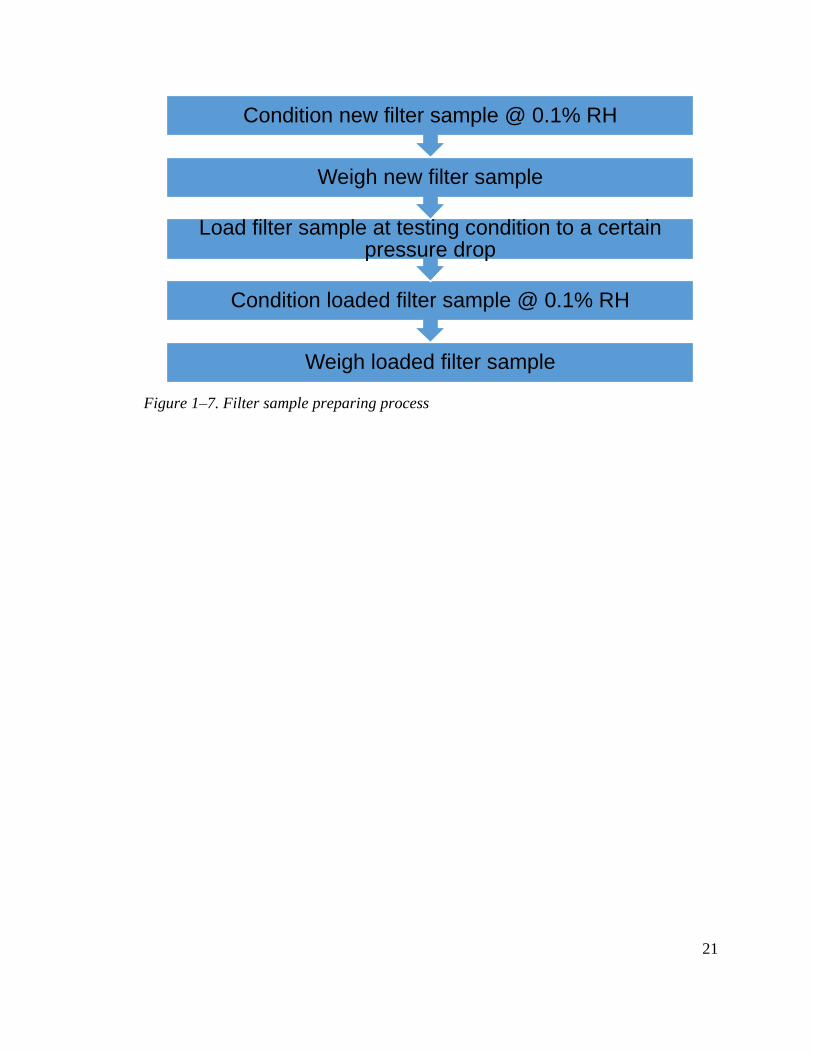
1.6 Filter Sample Preparation
In this study, test filter media sheets are cut with a 47 mm circular cutter to fit in
the test filter holders. The filter life could be indicated by the weight of deposited particles
on the test filter when the test filter is loaded to a certain pressure drop. By weighing the
test filter media sample before and after the loading, mass of salt loaded on test filter media
can be calculated. However, it was observed that cellulose filter media could absorb
moisture during storing or loading, and the amount of water absorbed could be even
comparable to the weight of the salt loaded on the filter. The deposited hygroscopic salt
particles can also absorb different amounts of moisture depending on surrounding RH
levels. Therefore, to accurately measure the weight of the deposited salt on the test filter,
it is critical to maintain the RH stable during the filter storing and weighing. According to
EPA PM 2.5 mass weighing SOP (EPA 1998), mean RH conditioning filters should be
between 30% and 40%. Whereas, it is not applicable to this study because of the salts’
hygroscopicity may lead to inaccurate mass measurements. For example, when the

20
conditioning RH is between 30% and 40%, it is possible that (NH4)2SO4 loaded on test
filter media is not completely dried. This is because the ERH of (NH4)2SO4 is about 37%,
which is in between the 30% and 40%, not to mention the ERH lowering for nanoparticles.
To solve this problem, a dry storing and weighing chamber was built, in which the RH is
close to 0%. The low RH inside the chamber is achieved by charging the chamber with
dried compressed air. All pre-cut test filters are stored in the chamber for at least 48 hours
before weighing and loading. The post-loading weighing is conducted 24 hours after
loading, which is sufficient to remove the water absorbed during the loading process. The
filter sample preparation process is shown in Figure 1–7. A Cahn C-31 micro-balance
(Thermo Fisher Scientific Inc. Waltham, MA) is used to weigh test filters. One of the
reasons that EPA regulates conditioning RH between 30% and 40% is that static electricity
affects the weighing accuracy. In order to avoid the effect of the static electricity, 2 Po-210
Staticmaster® Nuclespot™ Alpha Ionizers (NRD, LLC. Grand Island, NY) were placed
inside the balance chamber to eliminate the static electricity. There is a concern that
NH4NO3 would evaporate faster at the very low RH (Lightstone et al. 2000) An NH4NO3
loaded test filter was weighed one week after loading; no significant mass loss was
observed compared to the mass measured 24 hours after loading. This results consistent
with the conclusion of Lee and Hsu (2000), no significant evaporation loss of NH4NO3was
found.
21
Figure 1–7. Filter sample preparing process
Weigh loaded filter sample
Condition loaded filter sample @ 0.1% RH
Load filter sample at testing condition to a certain pressure drop
Weigh new filter sample
Condition new filter sample @ 0.1% RH

22
Chapter 2: Soot Generation and Organic Compounds
Soot Coating
2.1 Soot Generation
As mentioned in Section 1.3 Air Flow Control and RH Control, a homemade
diffusion flame soot generator was design and constructed. The design of this soot
generator was modified from a commercially available soot generator called Standard
Combustion Aerosol generator (Jing 1999). It has a closed combustion chamber with
controlled propane, air, and nitrogen supply. The cross section drawing of the soot
generator is shown in Figure 2–1. Propane is supplied to the center tube of the combustion
chamber; air is delivered from the outside annular gap in the combustion chamber after a
laminar flow screen. Since the combustion chamber is closed, a pair of the spark igniter is
installed to ignite the flame.
One of the advantages is the fuel/air ratio could be changed to control the
concentration of the generated soot. When it is the lean burn, the soot concentration is low,
which could be used to warm-up the soot generator before filter tests, while the rich burn
can be used to generate high concentration of soot particles for filter tests. Another
advantage is that, comparing to the open flame design mentioned in Kim et al. (2009b), the
soot generator can deliver the generated soot to the LAEAF Test Rig with an air-tight
connection, with more flexibility in flow rates settings. Besides the closed combustion
chamber, another advanced design is the transverse quench flow. A horizontal nitrogen
flow is introduced to quench the freshly generated soot particles. The transverse quench

23
flow can cool down the stream temperature and bring soot particles away from the high-
temperature zone above the flame. Since the pure nitrogen is used, it can prevent further
oxidation and stabilize the morphology of soot particles. The extra dilution air can be added
to reduce the soot concentration (top of Figure 2–1).
Figure 2–1. Cross section drawing of the homemade soot generator
The gas flows of the soot generator are all controlled by MFCs (see Figure 2–2),
and the flow rates can be precisely controlled. As mentioned above, the soot concentration
could be adjusted by changing propane/air ratio, as well as the dilution air flow rate. The

24
soot particle peak size depends on the flow rate of the nitrogen quench flow. The higher
the quench flow, the smaller soot particle peak size due to reduced agglomeration time.
Samples of the soot particles collected is shown in Figure 2–3.
Figure 2–2. Photo of the homemade soot generator
Figure 2–3. Sample of soot particles generated by the homemade soot generator

25
2.2 Organic Compounds Coating Method
Soot generated from this soot generator could be regarded as the fresh soot when
the oxidation gas flowrate is higher than a certain point (Barthazy et al. 2006). In the
atmosphere, soot could be coated by various species, and the secondary organic aerosol is
a very representative one. The aging of soot in laboratory could be achieved by coating
fresh soot with organic compounds. A controlled amount of filtered compressed air will be
used to bubble selected organic liquid and bring a certain amount of organic vapor to coat
the freshly generated soot.
Similar to the soot coating process apparatus in Xue et al. (2009), Dalirian et al.
(2018), and Wang et al. (2018), a vaporization-condensation apparatus is design as Figure
2–4. The selected organic compound (e.g. glutaric acid) is placed in the mineral oil bath at
150 ℃. Filtered air flows into the organic compound bottle with constant flow rate to carry
organic vapor to the outlet of the soot generator. A cooling fan is installed on the upper
portion of the stainless tube to cool down the organic compound vapor and soot stream so
that the organic compound vapor will condense on the soot particles, which is similar to
the working principle of condensation particle counter. The coated soot particles will then
be introduced to the LAEAF Test Rig.

26
Figure 2–4. Soot organic compound coating apparatus

27
Chapter 3: Smart Sensor for Filter Performance
Monitoring System
3.1 Background
Currently, air filters are installed and operated with limited performance monitoring
system, such as pressure drop. Meanwhile, criteria of filter replacements are mainly based
on the installed time or mileage, for example, 3 months for residential HVAC filters,
~12000 miles for vehicle cabin air filters. However, the actual filter operating time and
pollutant concentration are not considered. It is quite common that air filters are used with
prolonged time or cleaned with compressed air and then reused. However, the performance
of air filters is not closely monitored, especially the efficiency.
HVAC Air filters are designed to protect people staying indoor, and occupants’
health is invaluable. It has been a rising concern that the HVAC system may transmit
COVID-19, and ASHRAE recommends that MERV-13 or above level filtration should be
used when it is achievable (ASHRAE 2020). The purpose of using high-level filters is to
capture virus aerosol in room air, whereas some HVAC engineers worry the improper
installation of air filters or the leaks around filter edges may jeopardize the overall filtration
efficacy. Improper installation or defective filters can give people false sense of safety,
which is not desired. Therefore, it is critical to ensure the HVAC filtration system is
operating as designed.
Gas turbines, internal combustion engines, and dust collection systems are all using
air filters. Comparing to the equipment behind air filters, the price of air filters is minimal,

28
not to mention the repair cost if the equipment is damaged due to defective air filters or
improper installations.
Without sufficient air filter performance information, it is unclear whether air filters
are functioning as designed. When switching to a new filter brand, it is unrealistic for end-
users to judge the quality of the new filters. The uncertainties of air filters performance
make people or equipment behind the air filters more vulnerable. On the other hand, the
lack of information could cause early or prolonged filter replacements. When air filters are
not replaced confidently, it could be either a waste of filters or loss of protections or waste
of energy to overcome extra filter resistance.
Concluded from examples above, filter performance monitoring system is highly
demanded. Currently, there are several commercially available filter monitoring sensors.
Table 3–1 lists four sensors that can monitor air filters. In fact, all four sensors are based
on the pressure difference measurements, and none of them could measure filter
efficiencies, temperature and RH. 3M smart filter and Clean Alert filter monitor are
designed for residential HVAC applications. 3M smart filter uses Bluetooth to connect with
customer’s cell phone and it will alert when it is time to replace the filter. However, the
smart sensor is glued on the HVAC filter and cannot be reused, therefore its cost is higher
than conventional HVAC filters. The Clean Alert filter monitor can only send a message
to customers when it is time to replace the HVAC filters. The other two industrial filter
monitoring sensors have the online monitoring functions, with paid subscription. The
Donaldson iCue is designed for dust collectors, which gives the differential pressure
measurement to monitor and predict filter’s life. Mann+Hummel Senzit is designed for the
truck intake air filter monitoring. It is installed at the downstream of the intake air filter.

29
The data is transmitted through the cellular network and the location of the truck is also
reported. It is designed for fleet managers to arrange the maintenance in fleet base to reduce
the fleet operation cost.
Table 3–1. Comparison of current commercially available products
Product Application Pressure
transducer
Online
Monitoring
RH, T
Monitoring
Filter
Efficiency
Monitoring
3M smart filter Residential
HVAC Single
No
Bluetooth
only
No No
Clean Alert
filter monitor
Residential
HVAC
Single or
Differential No No No
Donaldson iCue
Industrial
dust
collector
Differential Yes Paid
Subscription No No
Mann+Hummel
Senzit
Industrial
Fleet Single
Yes Paid
Subscription No No
The current available commercially available sensors are not capable in RH and
temperature measurements. In addition, filter efficiency is also not reported. The actual
protections that filters can offer is unclear. With the current monitoring methods, It is
highly unlikely to detect the improper filter installation and defective filters. Therefore, it
is vital to design a filter monitoring system with filter efficiency measurement capability.
With that, filter operation will not be a “black box”, and the protections that filters can
offer can be reported. At the same time, the comprehensive filter operation condition could
be recorded, which could be used to predict the filter life more accurate. For example, the
temperature and RH effect on the filter life will be discussed in Part 2 later.

30
3.2 System Description
To measure the filter efficiency, the particle concentrations at the upstream and
downstream of the filter are needed. Similarly, the differential pressure can be measured
by a pair of pressure sensors. Figure 3–1 shows the schematic of the filter performance
monitoring system. Upstream and downstream measurement signals are processed by an
Arduino microcontroller, and an I2C multiplexer is employed to switching the I2C
addresses of each sensor. Currently, the filter operating parameters are uploaded to the
thingspeak.com via Wi-Fi, which is an open platform for IoT devices. Thingspeak.com can
be accessed from a computer, a laptop, a tablet, or a cellphone, therefore, the filter operating
parameters are available wherever there is internet access.
Figure 3–1. Schematic of the filter performance monitoring system
The microcontroller used in this system is Arduino Uno Wi-Fi R2, the most
common microcontroller for electronic prototyping. The Arduino Uno Wi-Fi R2 has the
31
built-in Wi-Fi module so it can connect to the internet. The communications between the
microcontroller and sensors are accomplished by I2C protocol. Each of the sensor has a
fixed I2C address. Since particle sensors and environmental sensors are used in pairs, the
I2C addresses will be duplicated. A I2C multiplexer is employed to switch the
communications between sensors, so that the data transmission is achieved sequentially.
The particle sensor used in this system is Sensirion SPS30, which is a commercially
available optical particulate matter sensor. According to the manufacture, the innovative
contaminant-resistant technology can keep the detection chamber clean to report accurate
concentration throughout its life for at least 8 years continuous operation. The mass
concentration limit is up to 1000 µg/m3, that is high enough for the ambient pollutant
application. Another advantage of the SPS30 is that it can offer 4-channel particle size
concentrations, PM1.0, PM2.5, PM4.0, PM10. The particle size information is particularly
important to characterize the particulate pollutants and monitor the filter performance.
The environmental sensor used in this system is Bosch BME680, which is a
multifunction sensor. It can measure temperature, RH, pressure, and breathable VOC. The
RH detection range is 0 ~ 100 %; The temperature detection range is -25 °C ~ 85 °C; The
pressure range is 300 hPa ~ 1100 hPa. All three parameter’s operating ranges are suitable
for the ambient air measurement. At the downstream of the filter, the pressure is lower than
the ambient pressure, so this sensor is suitable for the absolute pressure measurements.
This sensor has a small footprint of 3.0mm × 3.0mm and it is a surface-mount device that
can be mounted on a customized printed circuit board in later design. In the current design
a sensor module with larger footprint is used for prototyping purpose.

32
A photo of the filter performance monitoring system is shown in Figure 3–2. An
additional display is installed to show the operating status. The one shown in the photo is
made to compare the sensor readings parallelly. All readings are within 2.5% error and
hence sensors are interchangeable as claimed.
Figure 3–2. Photo of the filter performance monitoring prototype
The cost of the filter monitoring system is another aspect worth considering. The
bill of material of the current prototype is listed in Table 3–2, and the total cost is about
$190. Unlike some sensors that are attached to air filters, this filter performance monitoring
system doesn’t need extra replacement except battery. The total cost can be regarded as the
initial investment, which can be averaged for the life of the system. It should be noticed
that the Arduino is used here since it is a common platform for prototyping conveniently,
and the BME680 used here is also mounted on a prototype circuit board. The actual cost
of the filter performance monitoring could be reduced if Arduino is replaced with ESP32

33
and a customized printed circuit board is design for ESP32 and BME680. In that way the
total cost could be below $120.
Table 3–2. Bill of material of the current prototype
Item Price/unit Quantity Notes
Arduino Uno WiFi R2 $44.95 1 Microcontroller
Sensirion SPS30 $46.95 2 Particle sensor
Bosch BME680 $19.95 2 Environmental sensor
TCA9548A I2C Multiplexer $6.95 1 Communication component
Other (wires, breadboard) $5
Total Cost $190.7
Two case studies will be covered here to project potential applications of this smart
sensor for filter performance monitoring system.
3.3 Case study 1: Indoor Air Purifier
Indoor air purifiers are common residential air cleaning devices. This prototype is
installed on an indoor air purifier (Oreck Air Instinct 200, Cookeville, TN) to monitor the
HEPA filter performance. Figure 3–3 shows how the filter performance monitoring system
is installed on the air purifier. The Arduino and other circuit boards are enclosed in an
acrylic box, which is mounted on the front panel of the indoor air purifier. The upstream
module is mounted on the inside of the front panel to measure operating parameters of the
HEPA filter, which is measuring the indoor air quality, absolute pressure, temperature, and
RH. Behind the HEPA filter, the downstream module is installed, to detect the air quality,
temperature, and RH after HEPA filtration. In Figure 3–3, the HEPA filter is not in place
so that the downstream module can be seen. It was found that the HEPA filter paper frame

34
doesn’t seal tightly, and thus extra foam weather-strip is applied around the HEPA paper
frame to improve the sealing between the HEPA filter and the air purifier.
Figure 3–3. The filter performance monitoring system on an indoor air purifier (HEPA
filter is not in place to show the downstream module)
The sample readings of this system are listed in Table 3–3, where the air purifier is
set at medium fan speed. Both mass and number concentrations of PM1.0, PM2.5, PM4.0,
PM10 are reported. It can be found that for the sample readings showing below that
overwhelming particles are PM1.0, with limited PM2.5 particles, as the readings of PM2.5,
PM4.0, PM10 are the same. Since PM10 concentrations representing all detected particles,
both PM10 mass and number efficiencies are calculated at the bottom of Table 3–3. The
mass and number efficiencies are slightly less than the nominal HEPA efficiency of
99.97%. which might be due to leaks around the HEPA filter, though weather-strip is
applied. This is a good example that even with careful sealing, the overall filtration efficacy
is less than the designed filtration efficiency. The non-sealed filtration efficiency will be

35
discussed later in this section. In addition, the SPS30 sensor can also report the average
particle size, which is 0.47 µm and 0.39 µm at upstream and downstream, respectively.
Thus, a slight particle size distribution shift occurred during filtration. The indoor air PM2.5
mass concentration is 1.94 µg/m3, which is far below the EPA annual PM2.5 standard, 12
µg/m3. Whereas the PM2.5 mass concentration at the downstream of the air purifier is only
0.04 µg/m3. This indicates the effectiveness of an air purifier in removing indoor particulate
matters. At the meantime, the absolute pressures, temperatures, and RHs are also reported.
The HEPA filter differential pressure could be calculated based on the pressure data, which
is 44 Pa.
Table 3–3. Sample readings of the filter performance monitoring system at medium fan
speed
Upstream
Number Concentration / #/cm3 Average
Particle Size 0.47 µm
PM1.0 PM2.5 PM4.0 PM10
14.51 14.61 14.61 14.61 Pressure 97878 Pa
Mass Concentration / µg/m3 Temperature 25.63 ℃
PM1.0 PM2.5 PM4.0 PM10 Relative
Humidity 64.09 %
1.83 1.94 1.94 1.94
Downstream
Number Concentration / #/cm3 Average
Particle Size 0.39 µm
PM1.0 PM2.5 PM4.0 PM10
0.28 0.28 0.28 0.28 Pressure 97834 Pa
Mass Concentration / µg/m3 Temperature 25.9 ℃
PM1.0 PM2.5 PM4.0 PM10 Relative
Humidity 63.2 %
0.03 0.04 0.04 0.04
PM10 Number Efficiency PM10 Mass Efficiency Differential Pressure
98.08% 97.94% 44 Pa
The air purifier used here has four fan speeds, low (100 CFM), medium (180 CFM),
high (240 CFM), and turbo (350 CFM). With the same filtration area, the higher the fan

36
speed, the higher the differential pressure. A comparison of differential pressures at
different fan speeds is shown in Figure 3–4. The average differential pressures for each fan
speed are calculated from 75 sample points, when the fan speed is stable. It could be found
a very clear differential pressure raise with increasing fan speed. As mentioned before, the
HEPA filter does not fit the air purifier tightly, non-sealed differential pressures at various
fan speeds are also shown in Figure 3–4. It is reasonable that differential pressures of non-
sealed are lower than the sealed conditions due to leaking points. However, differential
pressure can only be used to verify the installation when the leak is significant enough. It
is impossible to tell whether the HEPA filter is sealed and whether the HEPA filter is
performing as expected only by comparing the differential pressures information.
Figure 3–4. Differential pressures of the HEPA filter at different fan speeds
To verify that the HEPA filter is performing as expected, the filtration efficiency is
the only criterion. Figure 3–5 shows the comparison of mass and number efficiencies of
PM10 at various fan speeds. Significant efficiency discrepancies show that the non-sealed
HEPA filter in the air purifier can only achieve about 70% ~ 80% overall filtration efficacy.
25.7
34
42.6
58.5
23.4
29.6
37.2
51
Sealed
Non-Sealed
Diffe
ren
tia
l P
ressure
(P
a)
0
20
40
60
Fan SpeedLow Medium High Turbo

37
The clean air delivery rate is overestimated when the actual filtration efficacy is below the
designed. This condition may also happen to the residential HVAC furnace filters, whose
frames are also made of cardboard without sealing foam around them. Hence the protection
HVAC furnace filters can offer is also overestimated due to the imperfect installation.
Since indoor air purifiers and residential HVAC furnace filters are circulating indoor air in
a room which can be regarded as a closed space, the deficient clean air delivery capability
can be mitigated by extra circulation and longer operating time. However, when air filters
are handling air with the “single pass” application, such as engine intake air filter, the
deficient filtration capability can result in severe damage to the engine.
Figure 3–5. Filtration efficiencies of the HEPA filter at different fan speeds
From the case study of the indoor air purifier, it can be found that the differential
pressure measurement cannot offer sufficient information to verify that filters are
performing as designed and there are potential hazards to occupants or equipment behind
air filters. A pair of particle sensors across the air filter can support a confident operation
Sealed, PM10, Number-based
Sealed, PM10, Mass-based
Non-Sealed, PM10, Number-based
Non-Sealed, PM10, Mass-based
98% 97% 98%95%98% 97% 98%
95%
74%72%
71%80%
75%73%
73%81%
Filt
ratio
n E
ffic
ien
cy (
%)
0%
50%
100%
150%
Fan SpeedLow Medium High Turbo

38
with filtration efficiency reported. Or at least a single particle sensor at the downstream of
air filters can offer clean air delivery capability when the absolute cleanness is required.
3.4 Case study 2: Delhi SALSCS Operating Monitoring
A solar-assisted large-scale cleaning system (SALSCS) was designed to handle the
regional air pollutions (Cao et al. 2015, Cao et al. 2018a, Cao et al. 2018b). The first
generation of SALSCS works based on the stack effect, that the heated ground air under
the transparent solar collector can flow to the chimney by passing the air filter bank. The
ambient air can be cleaned in this way to mitigate regional air pollutions. In the second
generation SALSCS, the air flow is reversed, a fan is installed in the chimney to push the
ambient air to the air filter bank and supply the clean air to the ground level. A
demonstration system of SALSCS has been built in Xi’an, China.
The India air quality is a concern for the public health. According to the data
compiled by IQAir, among the 30 cities with worst air pollution globally, 21 cities are from
India (IQAir 2020). Many urban area in India are experiencing air pollutions far higher
than EPA standards (Guttikunda and Calori 2013). To reduce the air pollution burden, India
government plans to reduce the PM2.5 by 30% in 5 years. The SALSCS demonstration
system in Xi’an proves that the SALSCS is a useful tool to improve regional air quality,
hence Delhi is planning to build multiple second generation SALSCS to be compliant with
the 5-year air quality target. The filter performance monitoring system can be installed on
the SALSCS to offer filter and system operating monitoring. The schematic diagram of the
Delhi SALSCS and filter performance monitoring system is shown in Figure 3–6.

39
Figure 3–6. Schematic diagram of the Delhi SALSCS and filter performance monitoring
system (modified from Dr. Sheng-Chieh Chen’s diagram)
The filter monitoring system is mainly shown on the right side of Figure 3–6, and
a detailed sensor location diagram is shown in Figure 3–7. 16 yellow circles representing
the sensor module (particle sensor SPS30+ environmental sensor BME680) are installed at
the upstream and downstream of the air filter bank (green zigzag). There are two pairs of
sensor modules on each side of the filter bank to monitor the filter performance (efficiency,
differential pressure). Because the filter wall has a large area, two sensor modules are used
to sensing more points. Besides the filter performance monitoring system, 5 TSI DustTrak
(8543, Shoreview, MN) are also installed around the SALSCS. There is one DustTrak
inside the chimney to sample the inlet ambient air, and the other four are placed on each
downstream side to sample the filtered air. The cost advantage of the described filter
performance monitoring system can be found here. 16 sensor modules can be deployed
while only 5 DustTrak is planned due to the cost consideration. The more the sample points,
the more accurate the system operating information can be collected. In addition to the
filter efficiency monitoring, the fan speed control is also integrated here. 9 TSI
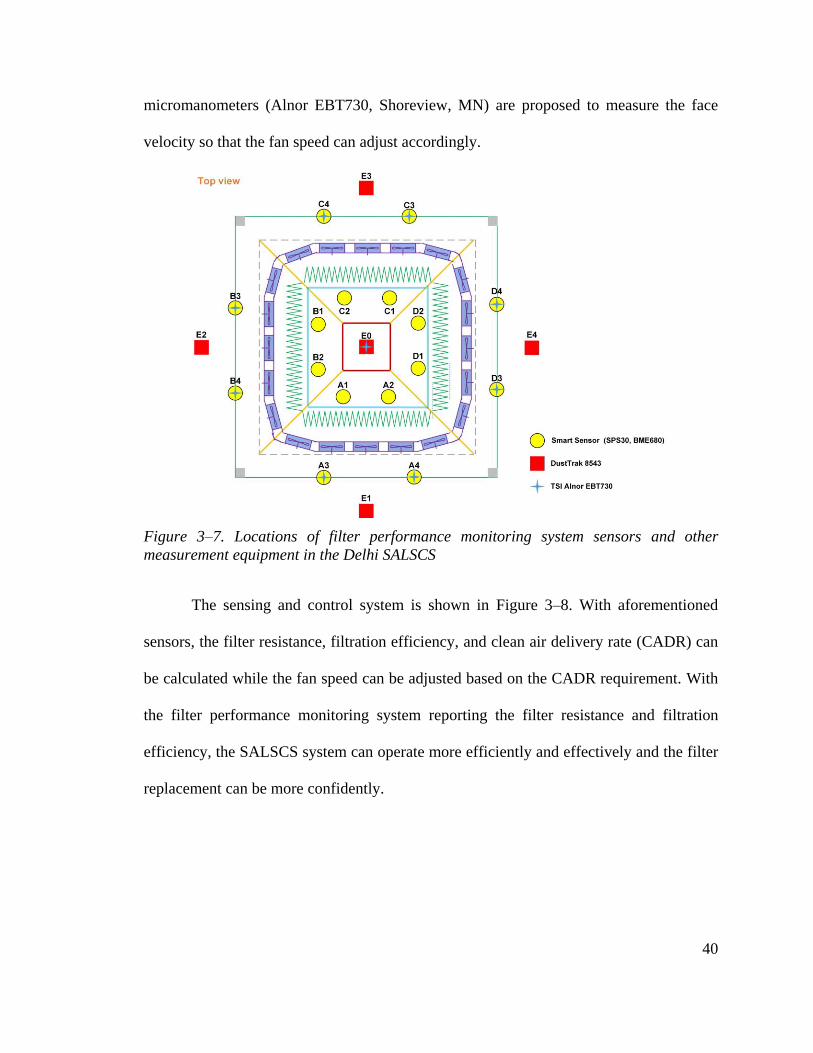
40
micromanometers (Alnor EBT730, Shoreview, MN) are proposed to measure the face
velocity so that the fan speed can adjust accordingly.
Figure 3–7. Locations of filter performance monitoring system sensors and other
measurement equipment in the Delhi SALSCS
The sensing and control system is shown in Figure 3–8. With aforementioned
sensors, the filter resistance, filtration efficiency, and clean air delivery rate (CADR) can
be calculated while the fan speed can be adjusted based on the CADR requirement. With
the filter performance monitoring system reporting the filter resistance and filtration
efficiency, the SALSCS system can operate more efficiently and effectively and the filter
replacement can be more confidently.

41
Figure 3–8. Sensing and control system diagram of the Delhi SALSCS
3.5 Conclusion
With case studies described above, it could be concluded that the filter performance
monitoring system can offer the filtration efficiency of air cleaning devices together with
the differential pressure, temperature, and RH. This improvement of the filter monitoring
enables direct reading of the filtration efficiency, which is the critical parameter to the air
cleaning devices. The filter will not be a black box with the aid of this system, and the
protections an air cleaning device offers can be quantified. Residential customers can rest
assured with their air purifiers or HVAC furnace filter; industrial customers can monitor
the filtered air cleanness that will enter their internal combustion engines or gas turbines;

42
filters or air cleaning devices manufactures can utilize the collected operating parameters
to better design and improve their products or to recommend proper products to their
customers.

43
Chapter 4: Global Air Pollutant/Meteorological
Condition Database
With the understanding of the effect of the different particulate pollutants and
operating conditions on the filter performance, which will be discussed in Part 2, the filter
selection can be decided based on the location to gain a longer filter life. In addition, the
atmosphere pollution trend is also important information to estimate the filter life. Some
international organizations (World Health Organization, World Bank) and air pollution
protection agencies (United States Environmental Protection Agency (EPA), Ministry of
Ecology and Environment of China (MEE), and European Environment Agency (EEA))
have air pollution database. Their data has a very wide coverage, whereas some data is not
up to date. For some locations, only annual average data is available. Meanwhile,
meteorological data is not included in the database.
Considering the insufficient information current databases can offer, a global air
pollutant/meteorological condition database is built on the Center for Filtration Research
website. It is designed to offer monthly average temperature, RH, criteria air pollutant
concentration of the city of interest for past 5 years. It can also show the current weather
conditions and air quality index (AQI) of the city of interest. The current weather is
retrieved from the OpenWeather, a platform that provides weather data through application
programming interface (API). An inquiry will be sent to the OpenWeather when a city of
interest is input, and the requested weather data will be returned within a second. The
current AQI data is retrieved in the same method as the weather data from aqicn.org, who
has a World Air Quality Index project, by its API.

44
Currently, historical air pollution data cover the US cities and Chinese cities. The
data source of the US cities is the US EPA, and EPA has the API available to access its Air
Quality System (AQS). The AQS can offer ambient air sample data across the country, and
it also includes the meteorological data and PM2.5 speciation data. Similarly, MEE of China
announces its ambient air monitoring data of more than three hundred Chinese cities hourly,
and a website (www.aqistudy.cn) recorded the published data. The China data used in the
database here are retrieved from the aqistudy.cn. Both data collected are raw data and they
are processed to the monthly average to show the pollution trend in a year. Figure 4–1 is
an example of monthly average PM2.5 of Beijing, Shanghai, and Guangzhou from 2014. It
could be found that the PM2.5 concentration shows a seasonal variation. The standard
deviation of Beijing’s data is very high, which is due to PM2.5 declining in recent years.
Figure 4–1. Monthly average PM2.5 concentration of Beijing, Shanghai, and Guangzhou
from 2014.
Beijing
Shanghai
Guangzhou
PM
2.5
(µ
g/m
3)
0
20
40
60
80
100
120
140
Jan Feb Mar Apr May Jun Jul Aug Sep Oct Nov Dec

45
Figure 4–2 is the yearly average PM2.5 concentrations of Beijing, Shanghai, and
Guangzhou from 2014. It could be found that there is a significant decay of Beijing’s PM2.5
concentration. The decay partially explains the high standard deviation of Beijing in Figure
4–1. The similar plots could be generated on the Center for Filtration Research website for
any city of interest.
Figure 4–2. Yearly average PM2.5 concentration of Beijing, Shanghai, and Guangzhou
from 2014
Meteorological data are also included so that the historical ambient temperature and
RH could be used as references to select air filters. There are several data sources for the
historical meteorological data, including EPA, weather-and-climate.com, and weather-
atlas.com. Their data are all included in the database as references.
All processed data are visualized on the CFR website for quick review. Figure 4–3
is the sample data replotted from the processed data, and Phoenix and Minneapolis are
Beijing
Shanghai
Guangzhou
PM
2.5
(µ
g/m
3)
0
20
40
60
80
100
120
2014 2015 2016 2017 2018 2019 2020

46
example cities. It can be found that the temperature band of Phoenix is above 0 ℃ all year
around, while the temperature band of Minneapolis is shifted to below 0 ℃ in winter.
Ambient air filter may encounter different RHs in Phoenix and Minneapolis. The RH in
Minneapolis is relatively stable, fluctuating around 70%, whereas the RH in Phoenix can
be as low as 20% in June and the highest RH is below 60%. The RH is an important factor
that may affect filter life, which will be covered in Part 2.
The fine particle and coarse particle ratio may also affect the filter life according to
the previous study (Ou et al. 2014). More importantly, the PM2.5 composition can also
affect the filter life, such as the percentage of the hygroscopic particles. It has been found
that non-hygroscopic particles, such as aluminum oxide and fine dust, are not sensitive to
the RH during filter loading (Gupta et al. 1993, Ou et al. 2015); while hygroscopic salt
particles filter loading can be affected at different RHs (Gupta et al. 1993, Joubert et al.
2010, Montgomery et al. 2015b, Pei et al. 2019a, Pei et al. 2019b, Ribeyre et al. 2017). The
filter selection could be done with the supportive information from the database. The
sulfate and nitrate in Phoenix PM2.5 are only 24%, while they account for more than a half
in the Minneapolis PM2.5. The PM2.5/PM10 ratio can be used to infer the fine and coarse
particle ratio. The PM2.5/PM10 ratio of Minneapolis is about 13% higher than that of
Phoenix. Both the particulate pollutant composition and fine/coarse particle ratio can be
used to recommend appropriate air filters so that longer filter life could be achieved.

47
Figure 4–3. Sample data extracted from the global air pollutant meteorological condition
database

Part 2:
Temperature and
RH Effect on Filter
Performance
49
In Part 2, temperature and RH effect on filter performance will be discussed. Since
RH is temperature dependent, the temperature effect on the filter performance will be
discussed in Chapter 5 in the first place. It was found that temperature effect on the filter
loading is minor, comparing to the RH effect. So that the rest of studies were conducted at
room temperature. There are two conditions to study RH effect during filter operating:
constant RH and varying RH. Chapter 6 and 7 studied the constant RH filter loading with
single species and multiple species, accordingly. Chapter 6 covers the hygroscopic salt
filter loading on conventional cellulose filter media, nano-fiber coated filter, and the
efficiency evolution for different salt states. Chapter 7 covers the (NH4)2SO4 and NH4NO3
mixture filter loading study, and organic compounds coated soot filter loading study. Lastly,
the varying RH condition was studied on the single species salt loaded air filters in Chapter
8.

50
Chapter 5: Effects of Temperature on Filter Loading by
Hygroscopic Salts at Different RH
This section has been published: Pei, C., Ou, Q. and Pui, D. Y. H. (2020). Effects
of Temperature and Relative Humidity on Laboratory Air Filter Loading Test by
Hygroscopic Salts Separation and Purification Technology 255: 117679.
doi:10.1016/j.seppur.2020.117679
5.1 Introduction
Air filters are designed to remove particulate pollutants from ambient air. Once they
are installed, they could operate in various climates, including tropical wet, arid,
Mediterranean, humid continental, tundra, highland climate, etc. However, as mentioned
in Section 1.1, the filter testing standards only specify a testing temperature range close to
room temperature or the testing temperature is not mentioned (see Table 1–1); the RH
range is broad in an uncontrolled fashion as well. One of the important composition of the
ambient air particulate pollutants is the hygroscopic portions, including sulfate, nitrate,
ammonium, etc. (Cheng et al. 2016, He et al. 2001, Philip et al. 2014, Snider et al. 2015,
Snider et al. 2016, Sun et al. 2004, Yang et al. 2011, Yao et al. 2002, Zhang et al. 2007).
The hygroscopic pollutant is sensitive to the surrounding temperature and RH, which are
very important factors affecting the particulate pollutants properties, such as morphology.
Therefore, the performance of air filters removing the ambient particulate pollutants could
be also affected by operating temperature and RH due to existence of the hygroscopic
pollutant.
The air filter performance under the effect of operating temperature has been
studied little. Most of the studies of air filter performance were conducted at room
temperature. Several temperature effects on the coalescence filter have been discussed by

51
Hajra et al. (2003), and they found that the higher the temperature, the higher the filter
performance. It is worth noting that RH depends on temperature. Therefore, it is important
to study that whether the RH effect is valid only at room temperature or it is valid in a
broader temperature range. To describe the RH at a certain temperature, absolute humidity
(AH) could be used, which is independent to the temperature. Hence, the question of
whether the temperature affects filter performance at a given RH could be understood as
the effect of AH on filter performance. For a given AH, different temperatures will lead to
different RHs, such as AH of 75% RH at 5℃ and 30% RH at 19℃ are very close. By
combining the temperature and RH to AH, not only the filter performance of the same RH
at different temperatures could be compared, but that of the same AH at different
temperatures could also be compared (see Figure 5–1).
The focus of this study is the temperature effect on filter performance, and the RH
effect will be covered in detail in Chapter 6, which has been studied a little previously. In
general, the operating RH is positively correlated with the filter holding capacity, that is,
the higher the operating RH, the greater the holding capacity at a given terminal pressure,
which indicates a longer filter life (Gupta et al. 1993, Joubert et al. 2010, Joubert et al.
2011, Miguel 2003, Montgomery et al. 2015a, Montgomery et al. 2015b, Pei et al. 2019a,
Pei et al. 2019b). Greater holding capacity at a given terminal pressure reveals a slower
pressure increasing rate at higher operating RH. Among all the mentioned studies, different
filter structures and different hygroscopic salt particles have been studied. It is agreed that
the filter structure is a minor factor regarding the slower pressure increasing rate. The
particle to particle interaction plays an important role in reducing the pressure increasing
rate. Deposited hygroscopic particles stick to each other to form the dendrite on the filter

52
with small capillaries between each other. The capillary condensation introduces surface
water into small gaps between hygroscopic particles even when the surrounding RH is
below salt’s DRH. Hygroscopic particles can coalesce or pack themselves denser, which
reduces the specific surface area, therefore less resistance to the incoming airflow. The
higher the surrounding RH, the more water can condense, consequently the greater the
mass loading.
The filter life is a very important factor affecting filter operation, hence it is
worthwhile to pay attention to the temperature and RH effect on the filter holding capacity.
To better simulate ambient particulate pollutants, (NH4)2SO4 and NH4NO3 were selected,
as ammonium, nitrate, and sulfate are the most abundant inorganic ionic components in
ambient aerosols and PM2.5(Cheng et al. 2016, He et al. 2001, Philip et al. 2014, Snider et
al. 2015, Snider et al. 2016, Sun et al. 2004, Yang et al. 2011, Yao et al. 2002, Zhang et al.
2007). As mentioned in Section 1.4, NH4NO3 cannot be dried and remain in wet state, so
it is used to represent wet ambient salt particles; (NH4)2SO4 represents dry hygroscopic
ambient salt particles. In addition, a common lab salt, KCl was also studied. In this study,
three salts were studied individually under different operating conditions (temperature, RH
and dry/wet particle state). The holding capacities of each operating condition were
compared to verify the primary factor affecting filter performance.
5.2 Experimental Method and Material
This study was conducted with the LAEAF Test Rig described in Chapter 1. The
testing temperature and RH were well controlled.

53
As aforementioned, (NH4)2SO4, NH4NO3 and KCl were selected to represent dry
and wet ambient hygroscopic salt particles and common lab filter test salt particles,
respectively. The salt particle dry/wet state control technique has been discussed in Section
1.4. For each salt, three temperatures were selected. (NH4)2SO4, NH4NO3, and KCl were
tested at two, three and one RHs at each temperature, respectively. 1 % volume
concentration salt solutions were atomized by the homemade pneumatic atomizer and
droplets are dried by a diffusional dryer (see Figure 1–4). The count median diameter is
about 100 nm and the geometric standard deviation is about 1.8.
For simplicity, the testing matrix can be several testing RH at different testing
temperatures. However, as mentioned in Section 5.1, AH can represent the combination of
RH and temperature. To better compare the effect of AH on filter holding capacity, testing
temperatures are carefully picked so that the AH of low temperature high RH is comparable
to that of high temperature low RH. For example in Figure 5–1, the AH of 5℃ 75% RH is
5.09 g/m3, and the AH of 19℃ 30% RH is 4.89 g/m3; similarly, the AH of 19℃ 75% RH
is 12.23 g/m3, and the AH of 35℃ 30% RH is 11.88 g/m3. In Figure 5–1, testing
temperatures and RHs of NH4NO3 were selected in the same fashion. Since the 75% RH
NH4NO3 filter loading is unstable due to its wet particle state. 45% RH was selected to
compare the filter mass loading. In addition to 45% RH, 60% RH loading was also
performed for 9℃ and 16℃ to compare the AH and RH effect. KCl was only tested at 30%
RH for 10℃, 30℃, and 50℃. At each of the testing condition mentioned above, at least
three samples were repeated.

54
Figure 5–1. (NH4)2SO4, NH4NO3 testing points and corresponding AHs. Testing
temperatures are carefully picked so that the AH of low temperature high RH is close to
the high temperature low RH (two dotted lines indicate two similar AHs).
The test filter media used in this study is a composite of a synthetic nanofiber layer
and conventional cellulose fiber filter media. It is used in the application of air intake
particle removal. Figure 5–2 is the scanning electron microscope (SEM) image of a clean
test filter sample used in this study. Thin fibers are synthetic nanofibers (nylon). Larger
cellulose fiber is beneath the synthetic nanofiber layer, which is much thicker than the
synthetic nanofibers. Though filters were tested under different conditions, all filters were
prepared and weighed according to Section 1.6. Since the densities of three salts used in
the study are different, we used the volume loading to represent the amount of the material
deposited on filters. The volume loading could be calculated by dividing mass loadings
with corresponding salt densities.
2.04
4.89
11.88
5.09
12.23
29.6930% RH
75% RH
Ab
solu
te H
um
idity (
g/m
3)
0
10
20
30
Testing Temperature (°C)
0 10 20 30 40
30% RH
45% RH
60% RH
2.65
4.09
6.17
3.97
6.13
9.26
5.29
8.18
Ab
solu
te H
um
idity (
g/m
3)
0
2
4
6
8
10
Testing Temperature (°C)
0 5 10 15 20 25
(NH4)2SO4 NH4NO3

55
Figure 5–2. SEM image of a clean filter sample. Thin fibers are synthetic nanofibers
(Nylon), and thick fibers beneath the nanofibers are cellulose fibers
5.3 Results
5.3.1 Dry KCl
KCl was only tested at 30% RH for 10℃, 30℃, and 50℃, since KCl effloresces
around 59% RH (Ahn et al. 2010, Cohen et al. 1987a, c, Freney et al. 2009, Li et al. 2014),
KCl particles are at solid state at 30% RH. The KCl volume loading at 4 inches of water is
plotted as a function of loading AH in Figure 5–3. It could be found that at the same RH
30%, the AH of 50℃ is about eight times of that of 10℃, and the AH of 30℃ is about
three times of that of 10℃. However, the KCl volume loadings are essentially 0.3 mm3/cm2
for all three temperatures.

56
Figure 5–3. Volume loading of dry KCl at different loading AHs
The comparison between three different loading temperatures could be achieved by
the analysis of variance (ANOVA) test to check whether any significant difference between
them. In the KCl loading test, the temperature is the only independent variable, which
affects filter loading results. One-way ANOVA was used to analyze data sets.
In this ANOVA test, the null hypothesis is that all volume loadings of three
temperatures are the same, and the alternative hypothesis is that at least one volume loading
is different from that of other temperatures. The ANOVA test was processed with R and
RStudio (R Core Team 2019, RStudio Team 2019). The ANOVA test result is shown in
Table 5–1. The Sum Sq column is a measurement of the variation, which is the sum of
squares of the difference between samples and corresponding means. The Df column is
degrees of freedom. The Mean Sq is Sum Sq/Df, which is similar to standard deviation. The
Temperature row lists the above results between different temperatures; the Residuals row
lists the above results of each sample inside its testing temperature. The F value is the ratio
of Mean Sq of Temperature and Residuals. The Pr(>F) is the probability that is larger than
30%
RH
10°C 30°C 50°C
Volu
me L
oa
din
g @
4 in H
2O
(mm
3/c
m2)
0
0.1
0.2
0.3
0.4
Loading Absolute Humidity (g/m3)
0 5 10 15 20 25 30

57
the F value given the null hypothesis is true. Generally, if the Pr(>F) is less than 0.05, one
could reject the null hypothesis and accept the alternative hypothesis. In the ANOVA test
for KCl, the Pr(>F) is 0.8254 which is much greater than 0.05, indicating that it is highly
likely that the null hypothesis is true. Hence, the temperature effect of the volume loading
is insignificant, in another word, the AH doesn’t affect the volume loading substantially.
Table 5–1. Analysis of Variance Table of KCl
Sum sq Df Mean sq F value Pr(>f)
Temperature 0.001022 2 0.0005108 0.1972 0.8254
Residuals 0.01813 7 0.002590
5.3.2 Dry (NH4)2SO4
(NH4)2SO4 was also tested in their dry state, while under two RHs (30% and 75%)
and three temperatures (5℃, 19℃ and 35℃). The reason for RH and temperature selection
has been stated in Section 5.2. The volume loading of (NH4)2SO4 was depicted in Figure
5–4. The volume loadings of each loading RH are grouped. The average volume loading
of 30% loading RH is less than that of 75% loading RH, while the volume loading varies
among the loading temperatures.

58
Figure 5–4. Volume loading of dry (NH4)2SO4 at different loading temperatures and RHs
When volume loadings are plotted as a function of loading AH (Figure 5–5), it is
much clear that RH is a more significant factor compared to AH, in another word,
temperature. Two pairs of the volume loadings of AH 5 g/m3 and 12 g/m3 are nice examples.
The volume loadings are comparable for the same loading RH, and no significant change
for the loading AH increases. However, it is a substantial difference between different
loading RHs while loading AH remains the same. It is important to note that for 75% RH
cases, the volume loadings are comparable when the loading AHs are about 5 g/m3 and 30
g/m3, which is 6 times increase.
5°C
19°C
35°C
Loading Temperature
Volu
me L
oa
din
g @
4 in H
2O
(mm
3/c
m2)
0
0.1
0.2
0.3
0.4
0.5
0.6
0.7
Loading Relative Humidity (%)
30% 75%

59
Figure 5–5. Volume loading of dry (NH4)2SO4 at different loading AHs
Similarly, the results of (NH4)2SO4 are analyzed by ANOVA. For KCl, only a
single factor, loading temperature, is considered. Hence one-way ANOVA was used for
KCl. For (NH4)2SO4, two-way ANOVA is used, since both loading RH and temperature
are considered. When there are two factors, the interactions between two factors may also
affect outputs. In Table 5–2, three rows of temperature, RH, and their interactions
Temp:RH are listed. In the Pr(>F) column, both Pr(>F) of the Temperature and RH are
less than 0.05, and Temp:RH is greater than 0.05. From the ANOVA table, both
Temperature and RH are significant factors affecting the volume loadings by 0.05 criteria.
However, the Pr(>F) of RH is much less than that of Temperature (1.977e-11 vs.
0.000672). These results could be interpreted as that both temperature and RH affect the
volume loading, whereas the loading RH effect is much more significant compared to the
temperature. This is consistent with the KCl results, that the loading RH plays a dominant
role in volume loadings.
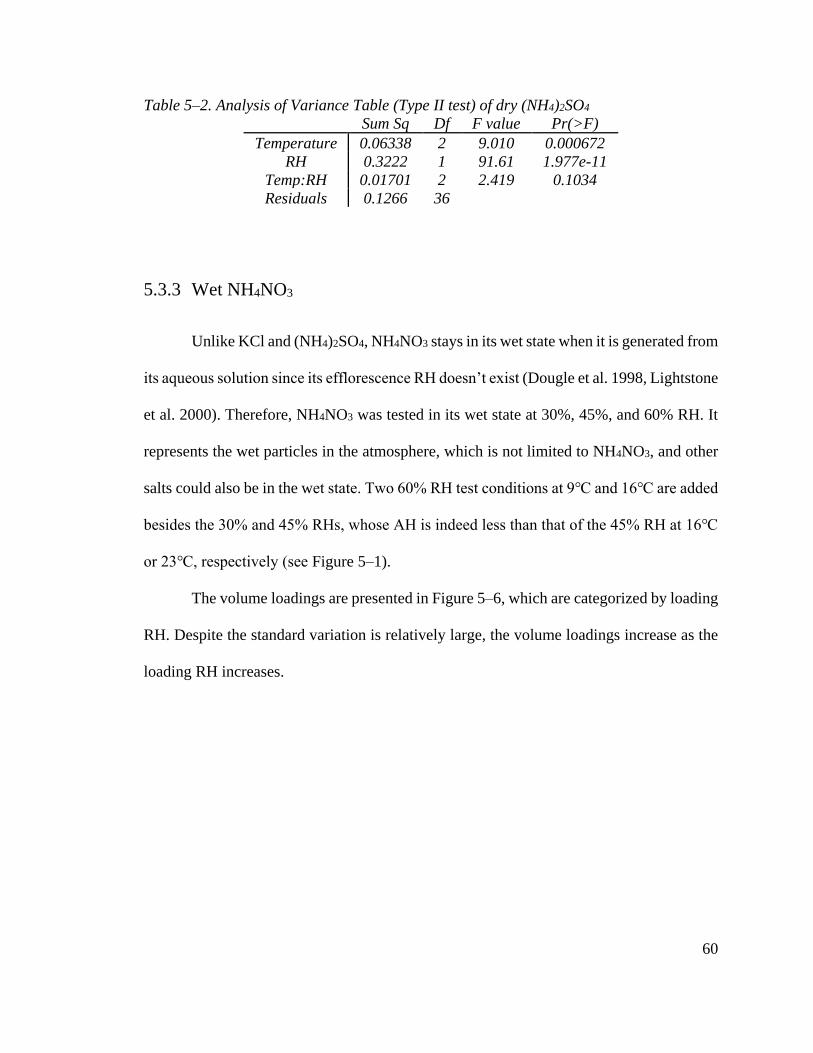
60
Table 5–2. Analysis of Variance Table (Type II test) of dry (NH4)2SO4
Sum Sq Df F value Pr(>F)
Temperature 0.06338 2 9.010 0.000672
RH 0.3222 1 91.61 1.977e-11
Temp:RH 0.01701 2 2.419 0.1034
Residuals 0.1266 36
5.3.3 Wet NH4NO3
Unlike KCl and (NH4)2SO4, NH4NO3 stays in its wet state when it is generated from
its aqueous solution since its efflorescence RH doesn’t exist (Dougle et al. 1998, Lightstone
et al. 2000). Therefore, NH4NO3 was tested in its wet state at 30%, 45%, and 60% RH. It
represents the wet particles in the atmosphere, which is not limited to NH4NO3, and other
salts could also be in the wet state. Two 60% RH test conditions at 9℃ and 16℃ are added
besides the 30% and 45% RHs, whose AH is indeed less than that of the 45% RH at 16℃
or 23℃, respectively (see Figure 5–1).
The volume loadings are presented in Figure 5–6, which are categorized by loading
RH. Despite the standard variation is relatively large, the volume loadings increase as the
loading RH increases.

61
Figure 5–6. Volume loading of wet NH4NO3 at different loading temperatures and RH
In Figure 5–7, volume loadings are plotted as the function of loading AH. Similar
to (NH4)2SO4 results, volume loadings strongly depend on the loading RH rather than the
loading AH. For example, the AH of 30% and 45% RH at 23℃ are about two times of
those at 9℃ (9.26 g/m3 to 3.97 g/m3 and 6.17 g/m3 to 2.65 g/m3), whereas the volume
loadings are comparable. When the loading AH are the same, volume loadings depend on
the loading RHs.
9°C
16°C
23°C
Loading Temperature
Volu
me L
oa
din
g @
4 in H
2O
(mm
3/c
m2)
0
0.1
0.2
0.3
0.4
Loading Relative Humidity (%)
30% 45% 60%

62
Figure 5–7. Volume loading of wet NH4NO3 at different loading AHs
The two-way ANOVA test is also used to analyze the NH4NO3 results. In Table 5–
3, the Pr(>F) of the Temperature is 0.9403, which is far more than 0.05, indicating that the
temperature effect on the volume loadings is insignificant. In contrast, the Pr(>F) of the
RH is 0.0002172, which is less than 0.05. Therefore, the RH effect on the volume loadings
is significant. Meanwhile, the Pr(>F) of interactions between the Temperature and RH is
about 0.6652, showing a small influence on the volume loadings.
Table 5–3. Analysis of Variance Table (Type II test) of wet NH4NO3
Sum Sq Df F value Pr(>F)
Temperature 0.000419 2 0.0616 0.9403
RH 0.07061 2 10.38 0.0002172
Temp:RH 0.005391 3 0.5284 0.6652
Residuals 0.1428 42

63
5.4 Discussion
The root cause of the filter volume loading variation at different RHs and
temperatures is the capillary condensation of moisture below the DRH of salts. The
dendrite restructuring occurs when water condenses between hygroscopic particles, which
reduce the overall cake resistance and lead to a greater holding capacity for given terminal
pressure. The details about the RH effect on the dendrite structure and filter holding
capacity will be discussed in Chapter 6. In this study, the temperature dependence of both
the DRH and capillary condensation should be considered.
5.4.1 DRH Temperature Dependence
For a given loading RH, if the DRH of salts is dependent on the temperature, the
relative extent from loading RH to the DRH will also change. The closer the loading RH
to the DRH, the more water could be condensed due to some larger capillary can satisfy
the Kelvin equation. Therefore, the DRH temperature dependence can affect filter holding
capacities.
The temperature dependence of salt DRH has been extensively studied by many
scientists and researchers, including Wexler and Hasegawa (1954), Rockland (1960),
Greenspan (1977), Wexler and Seinfeld Wexler and Seinfeld (1991), Tang and Munkelwitz
(1993), Tang and Munkelwitz (1994a), Xu et al. (1998), Onasch et al. (1999), Gysel et al.
(2002), and Ebert et al. (2002). The experimental techniques employed include saturated
solution saturation RH measurement, single-particle levitation observation, FTIR particle
measurement, and modeling, and studied temperatures cover from -15℃ to 50℃.

64
According to studies mentioned, the temperature dependence of salt DRH is not strong in
this temperature range. Although the salt DRH is lightly negative proportional to the
temperature, some researchers claimed this could be neglected.
In Wexler and Hasegawa’s study (1954), they used saturated salt solutions at a
controlled temperature to measure the steady-state saturation RH. The results covered three
older literature results(Adams and Merz 1929, Edgar and Swan 1922, O'Brien 1948) and
their measurements were from 0℃ to 50℃ with an increment of 5℃. Their results show
that the DRH of (NH4)2SO4 at 0℃ is 83.7% and 50℃ is 79.1%. Rockland (1960) used a
similar method and found that the DRH of (NH4)2SO4 at 5℃ is 81 % and that at 40℃ is
79%, which is consistent with the Wexler and Hasegawa’s study (1954). The single-
particle levitation method was carried out by Tang and Munkelwitz (1993, 1994a), Xu et
al. (1998). The experiment temperature covers from -9.4℃ to 50℃. Their shared
conclusion is that the DRH of (NH4)2SO4 decreases as the temperature increases, while Xu
et al. (1998) pointed out that the DRH of (NH4)2SO4 variation is only 2.2 percentage points
from -9.4℃ to 25℃. Onasch et al. (1999) utilized FTIR to measure the DRH variation
from -10℃ to 20℃, and their results agree with some of the studies mentioned above.
Although a slight decrease of the DRH of (NH4)2SO4 with temperature increase was
observed, the authors stated: “both the deliquescence and efflorescence relative humidities
of (NH4)2SO4 are not strongly dependent on the ambient temperature”(Onasch et al. 1999).
Gysel et al. (2002) utilized the HTDMA developed by Weingartner et al. (2002) to measure
the RH and temperature dependence of the (NH4)2SO4 particles. Gysel et al. (2002) claimed
that the temperature dependence could be neglected in the temperature range -10℃ < T <
25℃. Similar to (NH4)2SO4 results, Ebert et al. (2002) used environmental scanning

65
electron microscopy (ESEM) to determine the temperature dependence of NH4NO3 DRH
in the temperature range 5℃ < T < 15℃; Tang and Munkelwitz (1993) measured the DRH
of KCl in the temperature range 0℃ < T < 50℃. Both DRHs of NH4NO3 and KCl decrease
with temperature increases, whereas the temperature dependence is not strong enough in
the testing temperature range. In addition, NH4NO3 was tested in its wet state, the DRH is
not observable, and the DRH doesn’t affect the amount of water absorbed by a wet NH4NO3
particle. This will be discussed in Section 6.2 in detail. From the thermodynamic property
modeling perspective, Wexler and Seinfeld’s model (1991), Tang and Munkelwitz’s model
(1993), and Greenspan’s review (1977) agree with the results of the experiments.
In conclusion, the DRH temperature dependence is not strong and can be regarded
as unchanged in the temperature range of 5 ℃ ~ 50 ℃. Therefore, the temperature change
will not affect the DRH of salts. So that filter holding capacities will not be affected from
the DRH perspective.
5.4.2 Capillary Condensation
The capillary condensation is governed by the Kelvin equation below, which
correlates the equilibrium vapor pressure, saturation vapor pressure with the mean
curvature of the meniscus, liquid/vapor surface tension, and temperature.
𝑙𝑛𝑃𝑣
𝑃𝑠𝑎𝑡= −
2𝐻𝛾𝑉𝑙
𝑅𝑇
Where the ratio of equilibrium vapor pressure and saturation vapor pressure on the
left-hand side of the equation is the RH. Therefore, the mean curvature of the meniscus H
could be expressed as a function of the RH, temperature T, surface tension γ and molar

66
volume Vl within the temperature range (273.15 K ~ 323.15 K). Since the surface tension
γ and molar volume Vl are dependent on the temperature. The mean curvature of the
meniscus H, which is an indication of how much water is condensed in the capillaries
between particles, could be plotted as a function of the RH and temperature T as Figure 5–
8. It should be noted that the mean curvature of the meniscus H is reverse proportional to
the capillary dimensions, which depend on the particle diameters and particle gaps. The
smaller the H, the larger the capillary that water can condense. For a given capillary site at
a certain temperature and RH, if the H is above the surface, there will be capillary
condensations.
In the surface plot below, the mean curvature of the meniscus H strongly depends
on the RH. However, the temperature effect on the mean curvature of the meniscus H is
not strong. It is clear that the RH is the major factor affecting the mean curvature of the
meniscus H, and the temperature in the plotted range is a minor factor. This would reflect
on the macro filter loading behavior at different RH and temperature. Filter volume loading
is mainly loading RH dependent and the loading temperature plays a weaker role in volume
loading.

67
Figure 5–8. The plot of Mean Curvature of the Meniscus as a function of RH and
temperature
5.4.3 Suggestions to Atmospheric Particulate Pollutants Control
Technology
As an effective atmospheric particulate pollutants mitigation technology, air filters
are widely used in various scenarios. For example, air filters could be installed on gas
turbines, internal combustion engines, and any equipment that requires clean air. Air filters
could also be installed on indoor air purifiers. The operating conditions are based on
locations of the equipment. Therefore, it is important to understand the effect of operating
conditions on the filter’s performance, particularly the filter life. Both the experiment and
theory studies imply that the RH is a major factor affecting the filter loading while the
temperature is only a minor factor when the hygroscopic particles are involved. In fact, not
only the inorganic salt particles are hygroscopic, but some other pollutants in the

68
atmosphere are also hygroscopic, such as aged soot, hydrophilic organics. The RH could
change the morphology or the state, which may affect the filter life significantly, of the
atmospheric particulate particles based on their hygroscopicities. Therefore, the RH is a
critical parameter affecting the filter life when it is used to remove atmospheric particulate
pollutants, and it should be well controlled during the filter loading test, which is ignored
nowadays. This study suggests the current filter testing standards may be revised by
considering the air filter operating RH and temperature. In addition, the particle state may
be distinct from the RH variation due to the hysteresis of the hygroscopic particles. Hence,
the filter design should be carefully considered based on the application scenarios and the
possible particle states, rather than assuming all particles are dry. This study also offers an
insight into the link between the atmospheric particles hygroscopicity and the ambient
particulate matter mitigation technologies.
5.5 Conclusion
In order to understand temperature and RH effect on filter loading to better predict
the filter life, this study was performed by loading air filter samples with KCl, (NH4)2SO4,
and NH4NO3 at different temperatures and RHs. A LAEAF Test Rig was employed to
achieve a temperature and RH controlled filter sample loading process. The testing
temperature covers from 5 ℃ to 50 ℃ and the testing RH covers from 30% to 75%. KCl
and (NH4)2SO4 particles were tested in dry state, and NH4NO3 is in its wet state, which
represent the different particle states in the atmosphere. From experiment results, RH plays
a significant role in affecting the filter life. In contrast, temperature is a minor factor. By
analyzing the possible reasons that affect the filter life, including DRH temperature

69
dependence, capillary condensation, they also support the experiment results. This study
suggests that RH should be considered for the filter testing methods and standards, whereas
the temperature could be controlled in a relatively wide range. For the atmospheric
particulate pollutants mitigation applications, the operating location, i.e. filter operating
environment, local pollution particle hygroscopicity, should be considered as a factor when
choosing air filters to optimize the filter life.

70
Chapter 6: RH Effect on Filter Loading by Single
Species
6.1 Conventional Cellulose Filter Media
This section has been published: Pei, C., Ou, Q., and Pui, D. Y. H. (2019). Effect
of relative humidity on loading characteristics of cellulose filter media by submicrometer
potassium chloride, ammonium sulfate, and ammonium nitrate particles Separation and
Purification Technology 212: 75-83. doi:10.1016/j.seppur.2018.11.009
6.1.1 Introduction
Cellulose filter media is commonly used to make air intake filters because of their
low cost and easiness of production. Air intake filters are often used at air inlet of internal
combustion engines or gas turbines to clean ambient air prior to entering combustion
chamber. In the use of air intake filters, the holding capacity of filters is an important
measure of how much contaminant the filter could hold at a given pressure drop. For
mechanical filter media, the pressure drop across the media gradually increases as the
deposited particles accumulate. The holding capacity of a filter media can be characterized
as the amount (usually mass) of particles deposited when the media pressure drop reaches
a specified value. A greater holding capacity media, which is desired, means it holds more
particles than media with less holding capacities at the same terminal pressure. Air intake
filters require replacement at a certain terminal pressure to maintain the desired intake
airflow and power output level; thus, intake filters with greater mass loading capacity,
which have longer service time between replacements, are desired. Although it may or may
not represent the real application well enough, this filter loading process is often evaluated

71
in the laboratory, and the filter holding capacity is often determined by challenging filters
or filter media with laboratory-generated contaminants, typically at high concentration to
accelerate the testing process. Besides test dusts (e.g., Arizona Road Dust), often used in
various industrial filter test standards (e.g., ISO 5011, ISO 16890, etc.), which represent
the coarse fraction of ambient contaminants, NaCl and KCl are the most commonly used
model test particles in the laboratory to simulate the finer fraction. As mentioned in Section
1.1, these two salts are non-toxic, inexpensive, and have relatively high ERH (~47% for
NaCl and ~57% for KCl), which ease the drying process of salt droplets after being
generated from an atomizer. In the past, mass loading capacity tests in the lab often ignored
the RH effect due to the experiment complexity.
Gupta et al. (1993) studied the sub-micron NaCl and Al2O3 loading characteristics
on HEPA filter. It was found the specific cake resistance of NaCl decreases with increasing
RH when it is below the deliquescence relative humidity of NaCl. A nonlinear increasing
pressure drop and low mass loading capacity were found for RH above the DRH of NaCl.
Joubert et al. (2010) did a similar research on flat and pleated filters using NaCl and Al2O3,
in which similar results were found and the hygroscopic particles loading above its DRH
was characterized as liquid aerosol filtration. In addition to the experiment, a semi-
empirical model was established to predict the pressure drop across a HEPA filter in the
cake filtration regime when the loading RH is below the DRH. Miguel (2003) also found
that the performance of the filter was affected by particle hygroscopicity and RH. These
results suggest that the RH plays an important role on filter loading by hygroscopic salt
particles.

72
Nevertheless, as mentioned in Section 1.1, neither NaCl nor KCl is a major
composition of ambient PM2.5 that one of major contaminates for air intake filters. Previous
studies on PM2.5 chemical speciation show that the most abundant inorganic ionic
components in PM2.5 are ammonium, nitrate, and sulfate. In terms of the salt compounds,
NH4NO3 and (NH4)2SO4 are the most common forms (Cheng et al. 2016, He et al. 2001,
Philip et al. 2014, Snider et al. 2015, Snider et al. 2016, Sun et al. 2004, Yang et al. 2011,
Yao et al. 2002, Zhang et al. 2007). Thus, (NH4)2SO4 and NH4NO3 could be better
representative particles to mimic the hygroscopic behavior of ambient aerosols
encountered in air intake filtration applications. (NH4)2SO4 and NH4NO3 are much more
hygroscopic than NaCl and KCl, which means that they are more active with water vapor
at higher RH. Also, (NH4)2SO4 and NH4NO3 represent realistic air pollutants.
6.1.2 Experimental Method and Material
This study was conducted with early version of the LAEAF Test Rig described in
Chapter 1, which didn’t have the temperature control function. Therefore, experiments
were carried-out at room temperature. The testing RH control was the same as the LAEAF
Test Rig. The hygroscopic salt properties and the dry/wet state control technique have been
explained thoroughly in Section 1.4. In this study, dry KCl, (NH4)2SO4 and wet NH4NO3
were used as challenging particles. Cellulose air intake filter media were loaded with sub-
micron KCl, (NH4)2SO4, or NH4NO3 particles at different RHs below their DRHs. This
study simulated the ambient salt particle loading on the cellulose filter media by using more
realistic ambient salt particles rather than laboratory model salts. The effect of RH on the

73
salt particle loading behaviors was also considered and studied. The terminal pressure was
10 inches of water (≈2500Pa) when the filter face velocity is 5.3 cm/s.
The filter media tested in this study is designed for filters that removing ambient
air pollution particles. The test filter media, which is made of cellulose, has an efficiency
rating of F8 according to EN779. An example of the SEM image of the test filter media is
shown in Figure 6–1. The amount of salts loaded on the filter media at different testing RH
were compared. The test filter media sample was prepared according to Section 1.6. The
mass gain is the dry salt mass deposited on the test filter media. Since the densities of three
salts used in the study are different, again, we used the volume loading to represent the
amount of the salt deposited on filters. The volume loading could be calculated by dividing
mass loadings with corresponding salt densities.
Figure 6–1. SEM image of a test filter media sample. It is a conventional cellulose filter
media with an efficiency rating of F8 according to EN779
The test matrix was determined according to the hygroscopic properties (ERH and
DRH) of three salts. For KCl and (NH4)2SO4, test filters were loaded at RH levels of 30%,
45%, 60%, and 75%. As mentioned above, all salt particles were assumed to release all
water content before being conditioned to desired loading RH. While for NH4NO3, RH

74
levels of 15%, 30%, and 45% were selected. Considering ERH of NH4NO3 doesn’t exist,
NH4NO3 particles employed in this study were in wet state, which has been verified by Li
et al. (2016b). For each test condition, at least two repeats were conducted. Some cases
were repeated for three times.
Previous studies suggests filter holding capacity is very sensitive to the size of
particles being collected (Cheng and Tsai 1998). Therefore, it is very important to keep a
consistent particle size distribution among different test runs, especially when different
salts were tested, in order to make the mass loadings comparisons meaningful among tests
runs. 1% volume concentration solutions of three salts were prepared to generate salt
particles with similar size distributions. In addition, the atomizer was operated at a constant
pressure (40 psi 275.79 kPa) and other flow rates in the test system were kept unchanged
to maintain repeatable particle size distributions and concentration. Figure 6–2 is the
number-based and mass-based size distribution of three salts. The mean value and error
bar in Figure 6–2 represent the mean and standard deviation of distributions from all valid
runs.
Figure 6–2. Salt particle size distribution
KCl Number
(NH4)2SO4 Number
NH4NO3 Number
KCl Mass
(NH4)2SO4 Mass
NH4NO3 Mass
dN
/dlo
gD
p (
#/c
m3)
0
1×10⁶
2×10⁶
3×10⁶
4×10⁶
5×10⁶
dW
/dlo
gD
p (µ
g/m
3)
0
104
2×10⁴
3×10⁴
Mobility Diameter (nm)
10 100 1000

75
6.1.3 Results and Discussion
6.1.3.1 RH Effect of Deposited Hygroscopic Particles
Filter loading at elevated RHs has been studied by many researchers as mentioned
in the introduction. Some assumptions have been given to explain the reduction of filter
flow resistance at elevated RHs. Gupta et al. (1993) proposed that inter-particle adhesive
force is higher at elevated RHs, and particles would stick to deposited particles rather than
fill the interstitial spaces during filter loading. This could construct more open cake
structure, yielding lower cake resistance. Miguel (2003) advised that the stronger adhesion
between particle at higher RH cause higher compact arrangement of deposited particles.
Joubert et al. (2010) emphasized the bonding forces between particles caused by liquid
water could generate a cake with higher porosity. Butt and Kappl (2009) mentioned that
the water vapor could condense into capillaries or pores of deposited particles when the
temperature is far above the dew point of surrounding environment. Joubert et al. (2011)
explained the pressure drop change of a hygroscopic salt loaded filter at elevated RHs as
the water vapor in the air was absorbed by deposited particles causing a restructuring of
the deposit. Montgomery et al. (2015a, 2015b) observed both aggregate and dendrite
morphology change at elevated RHs, with the explanation of absorbing moisture on
deposited hygroscopic particles impose the restructuring.
In this study, we propose that when the KCl and (NH4)2SO4 particles are loaded on
the test filter media, the gaps formed among adjacent deposited particles are the ideal places
for water vapor to condense at even when RH is less than their DRH (Thomson 1871). The
water condensed in the gaps among particles could lead to necking which reduces the total
surface area of the dendrite structure. With more water absorbed, particles could coalesce,

76
the dendrite structure could shrink and open the air passageway therefore further reduce
the resistance to the air (Figure 6–3). Montgomery et al. (2015b) depicts the process of salt
dendrites restructuring with capillary condensed water. Besides salt particles, Weingartner
et al. (1997) studies soot morphology change with RH and finds capillary condensed water
could cause soot aggregates collapse. According to their study, the restructuring process
could happen as low as 30% RH, which is far below the DRH of corresponding salt. The
filter resistance could be reduced if the total surface area of the loaded particles decreases
and the air passageways are more open at elevated RH.
It should be noted that the morphology change of the salt dendrites on the filter
fiber at elevated RH is independent of filter media. The similar phenomena have been
observed on different filter media (Gupta et al. 1993, Joubert et al. 2011, Miguel 2003,
Montgomery et al. 2015b). However, this kind of morphology change may help increase
holding capacity of filters, like cellulose filter in this study; it may have the negative impact
on the holding capacity in certain circumstance, which will be discussed in Section 6.2.
Figure 6–3. Dendrites restructuring with capillary condensed water

77
6.1.3.2 Loading Curves
Loading curve represents the pressure drop across the test filter media as the
particles loading on the test filter media. In this study, as aforementioned, the pressure
drops as a function of the volume loading of three salts at different RHs will be presented
and compared.
Figure 6–4 shows the selected loading curves of the test filter media as a function
of the volume loading under different RHs for all three salts. The volume loadings were
compared because the densities of three salts are different. Densities of KCl, (NH4)2SO4,
and NH4NO3 are 1.99, 1.77, and 1.72 g/cm3, respectively (Haynes 2014, Lide 2005). The
test filter media has a relatively low initial efficiency which gradually improves over time
as loading proceeds, so that the pressure drop dependent on the loading time (which is raw
data recorded by the LabVIEW program) cannot be directly converted as the function of
the volume loading. Instead, these raw data were converted by considering the filter
efficiency evolution during the loading. At initial stage of the loading, the actual mass
loaded on the filter was factored by the efficiency at that time, until the efficiency reached
nearly 100% at later stage of loading. The final volume loading at the end of each test was
determined from the dry mass gain from sample weighing, with known density of each salt.
In Figure 6–4, the loading curves of KCl, (NH4)2SO4 at all RHs and NH4NO3 at 15%
RH have similar shapes, which share a typical pattern for cellulose media loaded with dry
submicron particles. It starts from depth filtration at the beginning of the loading, during
which particles were captured inside the filter and the slope of the pressure drop increasing
was high. While it proceeds into the transition regime at later loading stage, the increase of
pressure drop slowed down, asymptotic to pure surface filtration when the slope of pressure

78
drop remains constant. In this study, all loadings stopped at transitional stage (not yet
reaching pure surface loading) when reaching 10 inches of water (2500Pa) terminal
pressure. As presented in Figure 6–4, rates of the pressure drop increasing were different
at each RH. Especially at the later filtration stage, when the particles accumulated near the
surface of the filter, the pressure drop increased faster when the loading RH were lower.
The differences in pressure drop increasing rates resulted in the variations in the final
volume loading on the filter at the same terminal pressure.
The NH4NO3 loading condition was different from KCl or (NH4)2SO4, considering
its state is different from the other two, which can be the reason for different shapes of the
loading curves in Figure 6–4. Interestingly, the NH4NO3 loading curve at 15% RH shared
the same shape of the loading curve as the other two salts. Although NH4NO3 particles
absorb moisture they remain in wet state and do not lose water under test environment in
this study. The water carried by NH4NO3 droplet is limited at 15% RH, thus NH4NO3
droplets have high viscosity and therefore behave similarly to solid particle loading.
Whereas 15% RH NH4NO3 loading is slower compared to the other two salts. As for higher
loading RHs, the pressure drop increasing much slower at 30% and 45% loading RH than
15% loading RH case at the beginning of loading. Even though the loaded droplets could
coalesce to reduce the overall resistance, with more and more droplets loaded into the test
filter, air passageways in the test filter are less and smaller. Eventually, air passageways
are reduced both in numbers and size, so that the pressure drop increasing dramatically.
Similar trend was observed by Gupta et al. (1993) and Joubert et al. (2010), it was classified
as liquid aerosol filtration. According to Contal et al. (2004), droplets fill the interstitial
spaces at initial stage and the abrupt increasing of the pressure drop is caused by a liquid

79
film forming on top of the filter media with more droplets accumulated. In this study, liquid
film may not be able to form on top of the test filter media as a cake layer but inside the
test filter media instead, which will be discussed later in Section 6.1.3.5. It should be
noticed that the pressure increase of the 30% and 45% loading RHs are abrupt at the end
of the loading and if the same media was tested until a higher terminal pressure than 10
inches of water(2500Pa, although rare in practice), their volume loading could become
close to or even lower than those loaded with KCl or (NH4)2SO4. Because the pressure
curves of KCl and (NH4)2SO4 is a relatively steady increasing process, and more salt can
be deposited if a higher terminal pressure is preferred. Whereas for NH4NO3, the pressure
curve is nearly vertical, a higher terminal pressure will not allow too much salt to be
deposited.

80
Figure 6–4. Selected loading curves under different RHs.
Note: The NH4NO3 at 30% and 45% RH loadings have the different shapes of loading
curves than all other cases, they behave close to liquid aerosol filtration; all other cases
share the similar shape of loading curves from the depth filtration to the transition to the
surface filtration.
KCl
(NH4)2SO4
NH4NO3
30%
45%
60%
75%
RH
30%
45%
60%
75%
RH
15%
30%
45%
RH
Pre
ssu
re D
rop
(in
H2O
)
0
2
4
6
8
10
Pre
ssu
re D
rop
(in
H2O
)
0
2
4
6
8
10
Pre
ssure
Dro
p (
in H
2O
)
0
2
4
6
8
10
Volume Loading (mm3/cm2)0 0.5 1.0

81
6.1.3.3 Efficiency Curves
As aforementioned, efficiency curves are not only important to factorize the loading
curves, they are also beneficial in determining the loading process and state. Efficiency of
the test filter media could be calculated by alternating particle size distribution
measurements of upstream and downstream.
Figure 6–5 depicts the efficiency curves as a function of volume loading for
different salts under various loading RHs. Similar to loading curves, except for NH4NO3
at 30% and 45% RH, all other cases reach 100% efficiency before reaching terminal
pressure. However, for 75% RH of KCl and (NH4)2SO4, the volumes needed to reach 100%
efficiency are greater than the other low RH cases. Because the efficiency increasing is
mainly due to the growth of dendrite sticking out from fiber surface, high RH negatively
affects the dendrite morphology and the speed of its growing. When curves in Figure 6–4
and Figure 6–5 are matched together, it could be found that at lower RH, both pressure
drop increasing and the efficiency increasing are faster, which is a mutual effect. For
NH4NO3 at 30% and 45% RH, the growth of the dendrite is even slower because of their
hygroscopic properties discussed in previous sections, so that the efficiency could not reach
100% even at the end of the loading. It was interesting that for 45% loading RH case, the
efficiency was fluctuating over loading, suggesting an unstable state of the loaded particles
on the test filter media.

82
Figure 6–5. Efficiency curve as a function of volume loading.
Note: All efficiency curves except NH4NO3 at 30% and 45% RH loadings achieve 100%
efficiency during the loading process; NH4NO3 at 30% and 45% RH loadings’ efficiencies
increase with fluctuation indicating an unstable state of the loaded particles on the filter
media.
KCl
(NH4)2SO4
NH4NO3
30%
45%
60%
75%
RH
30%
45%
60%
75%
RH
15%
30%
45%
RH
Effic
ien
cy
0.4
0.6
0.8
1.0
Effic
iency
0.5
0.6
0.7
0.8
0.9
1.0
Effic
iency
0.5
0.6
0.7
0.8
0.9
1.0
Volume Loading (mm3/cm2)0 0.5 1.0

83
6.1.3.4 Volume Loadings
Figure 6–6 is the volume loadings of the KCl, (NH4)2SO4, and NH4NO3 at different
loading RHs when the pressure drops of 10 inches of water (2500Pa) were reached. As
shown in Figure 6–6, in general, the higher the loading RH, the greater the volume loading
for same pressure drop. KCl and (NH4)2SO4 have the similar volume loading for all loading
cases except 75% RH, at which RH (NH4)2SO4 has greater volume loading than KCl. These
indicate that both salts particles clogged the filter with the similar mechanism given the
comparable size distribution at the same loading RH. NH4NO3 has the much greater
volume loading at each test RH than the other two salts due to it is in droplet state.
Besides the capillary condensation mentioned above, the size dependence of DRH
plays a role in the volume loading deviation at 75% RH between KCl and (NH4)2SO4.
Reported DRHs of KCl and (NH4)2SO4 are about 84% and 80%, respectively. Thus, 75%
is below their DRHs, and theoretically volume loading should be comparable as other
lower RH conditions. The 75% RH volume loading of (NH4)2SO4 is about 60% more than
that of the KCl. This indicates that the particle states of the KCl and (NH4)2SO4 are different
compare to their states at lower RHs. According to Orr et al. (1958), the DRH is size
dependent. For 100 nm diameter (NH4)2SO4 particle, the DRH is a little below 80%; while
the DRH of 50 nm diameter particle and 20 nm diameter particle are about 75% and 63%,
respectively. In contrast, the DRH of KCl particles for 106nm, 56nm, and 26nm diameter
particles are about 84%, 82%, and 77%, respectively. KCl particles nearly don’t absorb
water at 75% RH, while (NH4)2SO4 particles whose diameter were less than 50 nm absorb
water when the loading RH was at 75%. Those particles would introduce liquid water on
the dendrites and test filter media. Therefore, 75% is low enough for (NH4)2SO4 particles

84
to absorb more water than KCl particles, which affected the dendrite morphology and
further volume loading results.
Figure 6–6. Volume loadings of KCl, (NH4)2SO4, and NH4NO3 at different RH
Considering the water absorption behaviors of the particles at 75% RH, (NH4)2SO4
had more chance to absorb water from surrounding environment than KCl to change
dendrite morphology. Thus, greater volume loading would be loaded when test filter media
were stopped loading at same terminal pressure. While at the 30%, 45%, and 60% RHs,
the dominant mechanism absorbing water both were capillary condensation. In this study,
the particle size of the KCl and (NH4)2SO4 were comparable. Therefore, the amount of the
water absorbed were close, which could lead to a similar volume loading.
In Figure 6–6, volume loadings of the NH4NO3 are much greater than the other two
salts. As explained before, NH4NO3 droplets coalesce into larger particles much easier than
the solid state during the loading process. Therefore, more volume of particles could be
KCl
(NH4)2SO4
NH4NO3
Vo
lum
e L
oa
din
g @
10
in
H2O
(mm
3/c
m2)
0
0.2
0.4
0.6
0.8
1.0
Relative Humidity (%)0 20 40 60 80 100
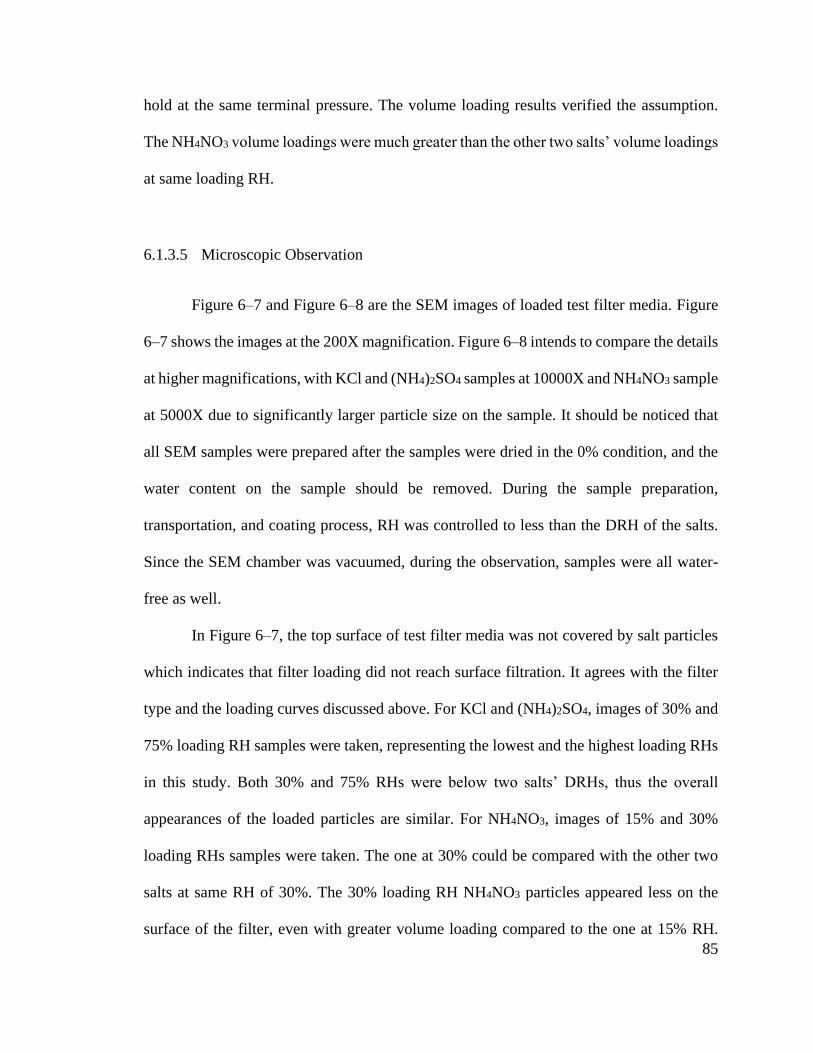
85
hold at the same terminal pressure. The volume loading results verified the assumption.
The NH4NO3 volume loadings were much greater than the other two salts’ volume loadings
at same loading RH.
6.1.3.5 Microscopic Observation
Figure 6–7 and Figure 6–8 are the SEM images of loaded test filter media. Figure
6–7 shows the images at the 200X magnification. Figure 6–8 intends to compare the details
at higher magnifications, with KCl and (NH4)2SO4 samples at 10000X and NH4NO3 sample
at 5000X due to significantly larger particle size on the sample. It should be noticed that
all SEM samples were prepared after the samples were dried in the 0% condition, and the
water content on the sample should be removed. During the sample preparation,
transportation, and coating process, RH was controlled to less than the DRH of the salts.
Since the SEM chamber was vacuumed, during the observation, samples were all water-
free as well.
In Figure 6–7, the top surface of test filter media was not covered by salt particles
which indicates that filter loading did not reach surface filtration. It agrees with the filter
type and the loading curves discussed above. For KCl and (NH4)2SO4, images of 30% and
75% loading RH samples were taken, representing the lowest and the highest loading RHs
in this study. Both 30% and 75% RHs were below two salts’ DRHs, thus the overall
appearances of the loaded particles are similar. For NH4NO3, images of 15% and 30%
loading RHs samples were taken. The one at 30% could be compared with the other two
salts at same RH of 30%. The 30% loading RH NH4NO3 particles appeared less on the
surface of the filter, even with greater volume loading compared to the one at 15% RH.

86
However, the appearance of 15% one is comparable to the other two salts. This is consistent
with Figure 6–4, that NH4NO3 loading curves are significantly different between 15% and
30% loading RHs. As mentioned in Section 6.1.3.2, NH4NO3 at 30% RH does not appear
covered by a liquid film. Gupta et al. (1993) and Joubert et al. (2010) used HEPA filter,
which is surface loading dominant. This study used cellulose filter, where particle
accumulation starts from inside of the filter. Droplets would fill interior of the filter and
clog the test filter media from inside. Hence the liquid film is not observed here.
Figure 6–7. SEM images of the KCl and (NH4)2SO4 under 30% and 75% RHs, NH4NO3
under 15% and 30% RHs.
Note: The test filter media were not fully covered by salt particles indicating the surface
filtration did not reach, which agrees with the filter type and the loading curves. Note that
the NH4NO3 under 30% RH appearance is different from the other two salts at 30% RH,
whereas the NH4NO3 under 15% RH is relatively close to that of the other two salts at 30%
RH.
Figure 6–8 is a closer look of the same samples shown in Figure 6–7. It could be
found that particles in the nanometer range are missing. There are two reasons explaining
30% KCl
75% KCl
30% (NH4)2SO4
75% (NH4)2SO4
15% NH4NO3
30% NH4NO3

87
the missing of small particles. The first one is the particle size measurement limitation.
Only particle size less than 1m could be measured by the SMPS system. In fact, the
particles larger than 1m exist in the loading particles. The second reason is that very small
particles could coalesce with large particles, which verifies the assumption in this study.
For KCl at 30% and 75% loading RHs, the edges of the particles did not exhibit
much differences. However, the particle size increase is very significant from 30% to 75%.
As for (NH4)2SO4, as described above, the size dependence of DRH promoted more water
to be absorbed by particles. Necking happened on the boundaries between loaded particles.
Necks between particles were larger than that of KCl. The comparison in this micro level
image between KCl and (NH4)2SO4 particles at the same RH could explain that the volume
loadings at 30% loading RH were close; while at 75% loading RH, different degrees of the
necking caused the different volume loading results.
It should be noticed that NH4NO3 particles in Figure 6–8 has a different
magnification level comparing to the other two salts. Although it is at lower magnification,
the particle size still appears larger than the KCl and (NH4)2SO4 particles. At the same time,
given the similar size distribution, smaller particles are deficient. It is because that NH4NO3
droplets were loaded on the test filter media during loading, and smaller droplets coalesced
with larger droplets. The fact that overall surface area of the loaded NH4NO3 droplets was
less than the other two salts could be verified by the microstructure of dendrite. The reduced
overall surface area helped holding more volume loading. The sublimation of ammonium
nitrate at low RH was another concern. As mentioned by Lightstone et al. (2000), the
sublimation rate of the ammonium at low RH is faster than at high RH. However, Lee and
Hsu (2000) observed insignificant NH4NO3 mass change at around 15% RH for 10 hours.

88
In this study, samples were stored in the 0% RH environment continuously before being
prepared for the SEM observation. The cracks on particles might be the marks of the quick
evaporation of water content, due to the extreme RH change between loading and storage
(0% RH).
Figure 6–8. Higher magnification (10000X) of the SEM images of the KCl and (NH4)2SO4
under 30% and 75% RHs, lower magnification (5000X) of the NH4NO3 under 15% and 30%
RHs.
Note: In general, the higher the loading RH, the more necking happened on the loaded salt
particles. Due to the size effect on the DRH, (NH4)2SO4 necking larger than the KCl by
absorbing more water at 75% RH. The absence of the small NH4NO3 particles indirectly
indicates that the small particle may be admitted by the larger particles due to the existence
of the water absorbed by the salt particles.
6.1.4 Conclusions
In this study, we tested loading characteristics of conventional cellulose filter media
that is used for intake air filtration by KCl, (NH4)2SO4, and NH4NO3 sub-micron particles
under the RH that are below their DRH. Three salts with comparable size distributions
were loaded separately onto the test filter media until the pressure drop of the test filter
30% KCl
75% KCl
30% (NH4)2SO4
75% (NH4)2SO4
15% NH4NO3
30% NH4NO3

89
media reaches 10 inches of water (2500Pa). During the loading, pressure drop was
monitored and recorded; The mass gain on the test filter media was weighed. The loading
curves of KCl, (NH4)2SO4 at all test RHs and that of NH4NO3 at 15% loading RH presented
dry particle loading curves as expected, while the loading curves of NH4NO3 at 30% and
45% loading RHs exhibited droplet loading curves due to incomplete drying of NH4NO3
droplets. The efficiency curves of KCl, (NH4)2SO4 at all test RHs and that of NH4NO3 at
15% loading RH reached 100% before the end of the loadings, while efficiency curves of
NH4NO3 at 30% and 45% loading RHs never reached 100% even at the end of loadings.
For all three salts, the higher the loading RH, the greater the volume loading, when loading
RH were below their DRH. However, the volume loadings of NH4NO3 were much greater
than the other two salts given the same loading RH. The volume loadings of KCl and
(NH4)2SO4 were comparable, and those of (NH4)2SO4 were slightly greater than KCl with
the increasing loading RH. This study implies that the service life of filters designed for
ambient particles will be longer when the RH during service was higher especially when
high hygroscopic content exists. It also implies that the service life of an ambient filter will
be longer when the percentage of NH4NO3 is dominant. This study proposed a new method
to prolong the filter service life by increasing the RH when the hygroscopic particles are
being filtered. However, this study only tested particle loading when the loading RH is
below the DRH of the salts. Whereas the loading characteristics of the cellulose filter media
when the salt particle in droplet state while below their DRHs or the loading RH above
their DRH still unclear and more tests should be conducted to reveal the loading behaviors
under those conditions.

90
6.2 Nano-Fiber Coated Cellulose Filter Media
This section has been published: Pei, C., Ou, Q., Yu, T. and Pui, D. Y. H. (2019).
Loading characteristics of nanofiber coated air intake filter media by potassium chloride,
ammonium sulfate, and ammonium nitrate fine particles and the comparison with
conventional cellulose filter media Separation and Purification Technology 228: 115734.
doi:10.1016/j.seppur.2019.115734
6.2.1 Introduction
Air intake filter media are commonly made of cellulose, because cellulose is cheap
and easy to process. However, there are some disadvantages of cellulose filters, such as the
low initial efficiency, relatively high pressure drops across the filter media, and concerns
on the filter life. To solve these problems, filter media manufacturers found that a new
media structure, which is the composite of a synthetic nanofiber layer and conventional
cellulose filter media, can achieve high initial efficiency, low pressure drop, and longer
filter service life. A longer filter service life indicates that the holding capacity, typically
in mass, of the filter is greater, at the same terminal pressure across the filter. The holding
capacity is an important measure of the filter media service life. The holding capacity can
be measured in the lab by loading the sample filter media with lab-generated high
concentration particles. It is an important research topic how to maintaining the low
pressure drop across the filter while holding more mass, which could reduce costs of the
filter itself and maintenance costs of the air cleaning equipment.
As aforementioned, some filter test standards, such as ASHRAE 52.2, ISO 5011,
ISO 16890, and EN 779, emphasize on the efficiency measurements after filter loading.
Synthetic loading dust, which consists of fine dust, powdered carbon, and cotton linter, is
used as the filter loading particles. Relative humidity (RH) is not strictly controlled in those

91
loading process because there is limited moisture involved in the process. Also, synthetic
loading dust is not hygroscopic, and the particle size is in the micron level so that the
capillaries between particles are difficult for water vapor to condense. However, the
synthetic loading dust does not include salt particles, which is an important component of
ambient pollutants.
In laboratory studies, NaCl and KCl are used as the testing particles for the filter
loading research, because they are cheap, widely available, and non-toxic. The most
common method of generating salt particles is by atomizing the salt solution and dry the
droplets to yield the dry salt particle. According to the ASHRAE standards 52.2:2017, to
dry droplets of its solution, the RH of the particle-laden air must be controlled less than 55%
for NaCl, and 70% for KCl, which is feasible to achieve in the laboratory by diffusion
drying and mixing with dry air (ASHRAE 2017). Once the particles are dried, NaCl
remains dry state when the loading RH is less than its DRH of 75~76% (Hu et al. 2010,
Langlet et al. 2011), and KCl could achieve that when the loading RH is below its DRH
83~86% (Ahn et al. 2010, Cohen et al. 1987a, c, Freney et al. 2009, Li et al. 2014). RH
below those DRH is achievable in the laboratory without additional delicate RH monitoring
and controlling design.
Gupta et al., Joubert et al., and Miguel studied NaCl loading characteristics of the
HEPA filter, at different loading RHs. They all found that RH plays an important role in
filter loading by hygroscopic particles (Gupta et al. 1993, Joubert et al. 2010, Joubert et al.
2011, Miguel 2003). Montgomery et al. also studied hygroscopic deposit structure change
with elevated RH and confirmed with fluorescent microscopy (Montgomery et al. 2015a,
Montgomery et al. 2015b). Besides, Ribeyre et al. studied the effect of RH on the non-

92
hygroscopic particles nanostructure deposit on a filter, which showed nanostructure might
be altered when the deposit is non-hygroscopic (Ribeyre et al. 2017).Their researches are
fundamental in the RH effect of filter loading.
However, air intake filters are not designed to remove laboratory generated NaCl
or KCl particles but to remove particulate pollutants in ambient air to protect equipment,
such as vehicles, gas turbines. Previous research found that the most abundant inorganic
compositions of ambient air pollutants are ammonium, sulfate, and nitrate ions (Cheng et
al. 2016, He et al. 2001, Philip et al. 2014, Snider et al. 2015, Snider et al. 2016, Sun et al.
2004, Yang et al. 2011, Yao et al. 2002, Zhang et al. 2007). Therefore, the possible salts
air intake filters may meet are (NH4)2SO4 and NH4NO3. Whereas, (NH4)2SO4 and NH4NO3
are more hygroscopic than NaCl and KCl. It means different ambient air RHs may affect
the state of (NH4)2SO4 and NH4NO3 and further affect the filter loading behavior of those
particles; therefore, (NH4)2SO4 and NH4NO3 are more suitable in filter loading test than
the NaCl and KCl to simulate ambient pollutants filter loading in laboratories.
Due to hygroscopicity differences, additional considerations should be taken into
the RH monitoring and controlling. As introduced in Section 1.4, the ERH of (NH4)2SO4
is 36%~43% (Ahn et al. 2010, Cohen et al. 1987a, c, Cziczo et al. 1997, Dougle et al. 1998,
Laskina et al. 2015, Liu et al. 2008, Tang 1980, Tang and Munkelwitz 1994b), which is
less than that of NaCl and KCl, 45%~48% and 56%~59%, respectively (Ahn et al. 2010,
Cohen et al. 1987a, c, Freney et al. 2009, Lee and Hsu 2000, Li et al. 2014, Liu et al. 2008,
Tang et al. 1997), and NH4NO3 doesn’t have an ERH (Dougle et al. 1998, Lightstone et al.
2000). Therefore, additional dryer or dry gas is required to generate solid state (NH4)2SO4
particles, and it is impossible to generate solid state NH4NO3 particles from its aqueous

93
solution. DRH of (NH4)2SO4 is 75%~82% RH (Ahn et al. 2010, Cziczo et al. 1997, Tang
and Munkelwitz 1994b). If the loading RH is not carefully controlled, it may be over
75%~82%, which will change the state of (NH4)2SO4 particles, from dry to wet. Because
(NH4)2SO4 and NH4NO3 are more hygroscopic, which means they are more sensitive to
loading RH than NaCl and KCl, loading RH is critical to them. In addition, the RH in the
ambient varies seasonally, even diurnally. It is even possible to filter salt particles with
absorbed water in some operation scenarios; therefore, if (NH4)2SO4 and NH4NO3 are
selected to load air intake filter media, the loading RH and the state of salt particles must
be carefully controlled. The control technique has been thoroughly introduced in Section
1.4.
In Section 6.1, KCl, (NH4)2SO4, and NH4NO3 sub-micron particles were used to
load conventional cellulose air intake filter under different loading RH (Pei et al. 2019a).
The results show that when loading RH is below salts’ DRH, the higher the loading RH,
the greater the holding capacity of the filter. In that study, we used dry KCl and (NH4)2SO4
particles, wet NH4NO3 particles due to its hygroscopicity. The holding capacity
comparisons among salts show that the filter media holding capacities of KCl and
(NH4)2SO4 are comparable when the loading RH is much less than their DRH; When the
loading RH is 75%, which is close to their DRH (KCl at 84%, (NH4)2SO4 at 80%), the
holding capacity of (NH4)2SO4 is higher than that of KCl. The holding capacity of NH4NO3
is much greater than that of the other two salts. It is possible that the difference in the state
of particles causes the holding capacity differences. However, only dry KCl and (NH4)2SO4
particles were used to load conventional cellulose filter media, but wet KCl and (NH4)2SO4
particles were not tested. It is not clear that if the volume loadings of the wet KCl and

94
(NH4)2SO4 will be greater than that of the dry KCl and (NH4)2SO4 while it is clear that the
differences in the hygroscopicity do lead to different results in the holding capacities of the
same filter media.
In this study, synthetic nanofiber coated cellulose filter media was loaded by KCl,
(NH4)2SO4, and NH4NO3 sub-micron particles at a certain constant loading RH. The
loading RH cover from below their ERH, to above their DRH. When the loading RH was
between the ERH and DRH, particles may have two possible states, dry (solid state) or wet
(possessing water). This study evaluated dry and wet particle filter loading separately.
6.2.2 Experimental Method and Material
Generally, filter loading tests in the laboratory simulate filter operation in real
conditions. The filter loading test measures two aspects of the filter performance. The first
one is the amount of the particles gained on the filter at a given pressure drop; the second
one is the pressure drop curve as a function of the mass loaded on the filter. As mentioned
above, this study chose three different salts and loaded test filter media at different RHs.
Those two aspects of filter loading performance would be measured and compared.
The test filter media used in this study is a composite of a synthetic nanofiber layer
and conventional cellulose fiber filter media, which is the same at the media used in
Chapter 5. The SEM image of clean test filter media used in this study is shown in Figure
5–2. Similar to the previous chapters, the test filter samples were prepared and weighed
according to Section 1.6 sample preparation to yield the dry mass gain under different
testing conditions.

95
This study was conducted on the LAEAF Test Rig at room temperature. The RH
control function was used to maintain a stable filter loading RH. Filters’ holding capacity
at the same pressure drop would be compared in this study. The terminal pressure was 4
inches of water (≈1000Pa) when the operating face velocity is 5.3 cm/s.
The size distribution deviation affects the holding capacity given the same pressure
drop (Cheng and Tsai 1998). Thus, it is important to keep the size distribution consistent
for all loadings of all three salts. Firstly, the pressure drove the homemade pneumatic
atomizer was controlled by a regulator and kept the same for all tests. Secondly, the volume
concentration of the three salts solutions were all 1%. These two methods could assure the
size distribution consistency. Considering the difference in the density of three salts
(KCl:1.99 g/cm3; (NH4)2SO4:1.77g/cm3; NH4NO3:1.72 g/cm3 (Haynes 2014, Lide 2005)),
volume loading will be compared in this study, which is obtained by dividing mass loading
with corresponding salt density.
In this study, challenging particles of the test filter media could be either dry or wet.
For dry particles, the particle size will not change when the loading RH is below the DRH
of the salt. For wet particles, the particle size distribution shifts to a larger size compared
to the dry particle size distribution due to the absorption of water. The extent of the size
distribution shift depends on the loading RH. Therefore, it is difficult to ensure and
compare the particle size distribution consistency. In this study, we installed a silica gel
desiccant dryer column in the sheath flow of the DMA to keep the DMA sheath flow dry.
When wet particles enter the DMA, the low RH sheath flow will dry wet particles and
revert them to their dry state (minimal water for NH4NO3). For all loading cases, we

96
maintain the dry particle size distribution consistency for convenience. Figure 6–9 is the
averaged size distribution of all samples in this study for each salt.
Figure 6–9. Number-based and mass-based size distributions of three salts. This is the
averaged size distribution of all samples in this study for each salt.
As aforementioned, the particle state is critical in filter loading test, the salt particle
state was carefully controlled according to the method described in Section 1.4. In this
study, dry and wet salt particle loadings were researched separately, two distinct techniques
were performed to generate dry and wet salt particles before humidifying to the desired
loading RH. Briefly, to generate dry salt particles, droplet generated from atomizer must
be dried below the salt’s ERH before humidifying to the desired loading RH. Salt droplets
were firstly dried by the diffusion dryer filled with silica gel desiccant, and dry clean air
was supplied around the aerosol stream to dry particles and achieve the RH below its ERH.
Conversely, to generate wet salt particles, the environment RH must be above its ERH
before humidifying to the desired loading RH. Silica gel desiccant in the diffusion dryer
was removed, and dry clean air was reduced to maintain the RH above its ERH. Then, Salt
particles were humidified to the desired loading RH directly.
KCl Number
(NH4)2SO4 Number
NH4NO3 Number
KCl Mass
(NH4)2SO4 Mass
NH4NO3 Mass
dN
/dlo
gD
p (
#/c
m3)
0
1×10⁶
2×10⁶
3×10⁶
4×10⁶
5×10⁶
6×10⁶d
W/d
log
Dp (µ
g/m
3)
0
104
2×10⁴
3×10⁴
Mobility Diameter (nm)
10 100 1000

97
Both dry and wet particles will be tested in this study. By referring to the ERH and
DRH of KCl, (NH4)2SO4, and NH4NO3 in Table 1–2, and salt states illustration in Figure
1–5, the test matrix of this study could be concluded as Table 6–1.
Table 6–1. Test matrix of this study
Salt State
Dry Wet
KCl 30%, 45%, 60%, 75% 75%, 90%, 95%
(NH4)2SO4 30%, 45%, 60%, 75% 45%, 60%, 75%, 85%, 90%
NH4NO3 30%*, 45%*, 60%* 30%, 45%, 60%
*NH4NO3 particles undergo the dry particle generation method (keep the RH as low as
possible after particle generation and humidified to the desired loading RH).
To compare the volume loadings of the wet and dry salt particle, the same RH is
selected. For example, the ERH of KCl is 56%~59%; the wet RH could start from 60%
with an increment of 15%. Whereas due to the sensor accuracy, 60% RH was marginal,
and only 75% RH condition was applied to compare volume loadings of dry and wet KCl
salt particles under the same RH. 90% and 95% RH represent the loading RH above the
DRH and near the saturation. As for the (NH4)2SO4, it is compared at 45%, 60%, and 75%
RH between the dry and wet states. 85% and 90% RH represent the loading RH above the
DRH and near the saturation. NH4NO3 doesn’t have an ERH (Dougle et al. 1998,
Lightstone et al. 2000), and 30%, 45%, and 60% RH are tested. It is impossible to generate
dry NH4NO3 particles from its aqueous solution due to the non-existence of its ERH.
However, to compare the effect of the RH history on the loading curves and volume
loadings of NH4NO3, two methods were applied, that is, keep the RH as low as possible
after particle generation and then humidified to the desired RH (dry particle generation
method); or directly humidified to the desired loading RH (wet particle generation method).

98
The dry particle generation method cannot generate dry NH4NO3 particle, but it is listed in
Table 6–1 under the dry state.
6.2.3 Results and Discussion
Loading curves as a function of particle loading under various loading RHs and
particle states are discussed here. These loading curves are useful in characterizing the
loading process. Besides the loading curves, volume loadings of the different loading RHs
and particle states would also be presented to compare their effects on volume loadings.
SEM images of selected samples would be shown at the end of this section. Before
discussing the loading curves and the volume loadings, the particle state effect and RH
effect on the filter deposition will be discussed first to understand the loading curves and
the volume loadings better.
6.2.3.1 Particle State Effect on Filter Deposition
When dry KCl particles are loaded on the test filter media, the dendrites could grow
in the direction of air flow that comes from, perpendicular to the filter media, to form a
cake. The particles accumulate in a 3-dimensional space. It can be found in Figure 6–10
that dry particle loading curves increase gradually with greater volume loading. Whereas
the wet particles could not build up as easy as dry particles due to their fluidity. Wet salt
particles can hardly accumulate in the direction perpendicular to the filter media, which
yields a low porosity and high resistance deposition layer on the top of the nanofiber layer.
In this scenario, particles accumulate nearly in a 2-dimensional surface. When the test filter

99
media is clean, the resistance growing is not significant. However, the available open area
is finite on the test filter media. With the deposition of the wet particles of given
concentration, the possible open area on the test filter media is reducing. The same
concentration of the wet particles could only flow through the reducing open area, which
accelerates the clogging of the air passageways. As in Figure 6–10, the slopes of the wet
particles loading curves increase with the loading. Once all available open area is covered
by the low porosity and high resistance layer, the pressure drop across the test filter media
increases abruptly. Besides this, according to Ahn et al. (2010) when the surrounding RH
is about 75%, the diameter of a wet KCl particle is about 1.7 times of its dry state. The
increase in the particle size by absorbing water could also contribute to the resistance
developing due to the total surface area increases.
Moreover, wet particles may fully block the space in between particles because they
could coalesce with each other when loading RH is close to saturation, and particle growth
is significant. Wet particles, or more accurately salt droplets, block possible air
passageways on the test filter media as they are being loaded on it. Eventually, salt droplets
form a continuous film on the top of the nanofiber layer of test filter media (see Figure 6–
16 NH4NO3 at 75% RH). Gupta et al. (1993) reported a similar phenomenon. When HEPA
filter (similar surface loading mechanism as nanofiber coated cellulose filter media) was
loaded at RH close to the DRH of NaCl (80% and 90% RH), NaCl droplet could percolate
into the filter fibers and eventually form a continuous liquid film causing pressure
drastically increasing. Liew and Conder (1985) proposed liquid aerosol deposited on the
filter could either locate at the fiber intersections or form liquid bridges between fibers
depending on the filter packing density. Both Walsh et al. (1996) and Contal et al. (2004)

100
found that there is a redistribution during the filter loading. Contal et al. (2004) found a
formation of a liquid film on the top of the filter, causing an exponential increase in
pressure drop.
6.2.3.2 RH Effect on Filter Deposition
For the constant loading RH, as researched by Gupta et al. (1993), Joubert et al.
(2010, 2011), and Miguel (2003), increasing of the loading RH could reduce the
hygroscopic particle specific resistance, which is due to water vapor capillary condensation
between particles. Montgomery et al. (2015a) found that when loading RH is below the
ERH of hygroscopic particles, an increase of the loading RH could result in deposit
restructuring and pressure drop decrease; deposit restructuring is caused by water
absorption. Montgomery et al. (2015b) verified that deposit restructuring during
hygroscopic particles are in the dry state. In this study, loading RH is controlled as a
constant. The higher the loading RH, the slower the pressure drop increases. A similar
phenomenon has been explained by Pei et al. (2019a) with conventional cellulose filter
media. Briefly, water could condense in the gaps formed between dry salt particles even
the surrounding RH is below DRH of corresponding salt. The resistance of the deposited
particles reducing at higher loading RH by changing of the dendrite morphology and
expanding of the air passageways. Eventually, at the same terminal pressure, greater
volume loading was yield at higher loading RH.
The wet particles loading curves presented distinct shape from the dry particles,
which has been discussed in previous Section 6.2.3.1. Generally, for wet particle loading,
the higher the loading RH, the greater the volume loading. Although wet particle size

101
increases with loading RH, which causes surface area of individual particle increasing, wet
particles could coalesce with each other to reduce the overall surface area. The overall
resistance from the deposited particle will decrease with the overall surface area reduction.
Therefore, volume loading is greater at higher loading RH at a given terminal pressure,
although confined by the wet particle size growth effect. Besides this, Gupta et al. (1993)
explained the loading RH effect on the surface tension of a droplet on the percolating of
the test filter media. In this case, for a given wet particle, salt concentration in the droplet
is higher at lower loading RH due to less water absorbed. Moreover, it is believed that the
surface tension of a droplet is positively correlated with its concentration. It is more
difficult for a droplet to percolate the test filter media when its surface tension is higher
and easier to form the continuous liquid film. Subsequently, less volume loading at lower
loading RH.
6.2.3.3 Loading Curves
Figure 6–10 shows the typical loading curves of the KCl, (NH4)2SO4 and NH4NO3
under different RHs and particle states. In each panel, loading curves of different states are
labeled in different colors. Loading curves of the dry state KCl and (NH4)2SO4 are plotted
in black, and that of the wet state KCl and (NH4)2SO4 are plotted in red. For NH4NO3,
methods of generating dry and wet particles are labeled as method I and method II. Since
the ERH of NH4NO3 does not exist, both methods should generate the same state of testing
particles. Both methods were performed to verify the effect of the RH history on the
NH4NO3 loading curves and volume loadings. It should be noted that all loading curves

102
are originally recorded as a function of loading time, and they are all transferred as a
function of volume loadings for convenient comparison.
It is obvious that different particle accumulation mechanism causes distinct shapes
of dry and wet particles. For all dry KCl and (NH4)2SO4 particles loading, the more the
particles deposited, the slower the pressure drop increase. All loading curves showed the
transition from steep to gradual, which indicated particle deposition from the initial stage
to cake formation on the test filter media. It enters the surface filtration stage when the
particle accumulation reaches a certain level. The final deposition conditions could be
verified by SEM images of loaded test filter media, which will be discussed in Section
6.2.3.6. During the entire loading process, it is clear that the slopes of the loading curves
decrease with the loading RH increasing, as discussed in previous Section 6.2.3.2.
For wet KCl, (NH4)2SO4, and NH4NO3 particle loading, the abrupt pressure drop
increasing could be found. As discussed in Section 6.2.3.1, the initial pressure drop change
is not significant when the amount of the particles loaded is small. Whereas the pressure
drop increases abruptly when all available open area is covered by the wet particle layer.
Moreover, under high RH loading conditions, the pressure drops did not show steady
growths as the lower loading RH, such as KCl at 95% RH and (NH4)2SO4 at 90% RH. In
contrast, the loading curve of KCl at 90% is relatively steadier than that of (NH4)2SO4 at
90%. The difference reflects the distinct hygroscopic properties, considering the DRH of
KCl is about 4% higher than that of the (NH4)2SO4. The reason for loading curves
fluctuating will be discussed later with the aid of the SEM images of (NH4)2SO4 loaded
test filter media at 90% RH.

103
As for NH4NO3, both method I and II generate the wet particles according to that
ERH of NH4NO3 does not exist. Loading curves of method I and II are comparable at the
same loading RH, indicating both methods produced wet NH4NO3 particles and the RH
history does not affect the filter loading. The method I and II converge to a single condition
of the wet NH4NO3 particle. In Figure 6–10, all six selected loading curves of NH4NO3
exhibit a similar shape to those of wet KCl and (NH4)2SO4 particles and follow the trend
that greater volume loading at higher loading RH.

104
Figure 6–10. KCl, (NH4)2SO4, and NH4NO3 sample loading curves under different RH and
different particle states
Note: Black curves represent the dry KCl and (NH4)2SO4 particle loading, and red curves
represent the wet KCl and (NH4)2SO4 particle loading; for NH4NO3, black curves represent
the dry particle generation method (I), and red curves represent the wet particle generation
method (II).
Dry 30%
Dry 45%
Dry 60%
Dry 75%
Wet 75%
Wet 90%
Wet 95%
KCl
Dry 30%
Dry 45%
Dry 60%
Dry 75%
Wet 45%
Wet 60%
Wet 75%
Wet 85%
Wet 90%
(NH4)2SO4
Method I 30%
Method I 45%
Method I 60%
Method II 30%
Method II 45%
Method II 60%
NH4NO3
Pre
ssu
re D
rop
(in
H2O
)
0
1
2
3
4
Pre
ssu
re D
rop
(in
H2O
)
0
1
2
3
4
Pre
ssure
Dro
p (
in H
2O
)
0
1
2
3
4
Volume Loading (mm3/cm2)0 0.5 1.0 1.5

105
6.2.3.4 Volume Loading
Figure 6–11 shows volume loadings of test filter media when the pressure drop
across the test filter media is 4 inches of water at different loading RHs and particle states.
Analog to the loading curves figure, volume loadings of dry particles are labeled in black,
and that of wet particles are labeled in red. For each point, at least three repeated tests were
done to receive reliable results. Error bars show how spread the volume loadings for a
given condition. It is worth to point out that since both method I and II produced wet
NH4NO3 particles, the results of method I and II at the same loading RH are combined in
the volume loading results.
6.2.3.4.1 Dry Particles Volume Loading
For dry KCl and (NH4)2SO4 particle loadings, the higher the loading RH, the greater
the volume loading. The effect of the loading RH has been explained in Section 6.2.3.2.
From 30% RH to 75% RH, the volume loading increases for 2-3 times, which is very
significant.
When it is compared salt-wise, volume loadings of (NH4)2SO4 are all greater than
that of KCl at the same loading RH. In the previous study on conventional cellulose filter
media (Section 6.1), volume loadings of (NH4)2SO4 were also greater than that of KCl but
not as much as the present study. One possible explanation is that the structure of the filter
media can affect the volume loading. When particles are deposited on conventional
cellulose filter media at the early stage, particles will enter the filter media initially, known
as depth filtration. Whereas for the nanofiber coated cellulose filter media, particles
directly start with the surface filtration on top of the nanofiber layer. In the latter case,

106
particles are abundant on the top surface of the filter media to form salt particle cake, which
contains more gaps between particles than that of dendrites in the depth filtration. When
(NH4)2SO4 and KCl form cake, (NH4)2SO4 could absorb more moisture and neck between
each other due to its hygroscopicities than KCl. Therefore, the resistance of (NH4)2SO4
particles would reduce. Eventually, it could cause greater deposition than KCl. The cake
filtration is more sensitive to the salt hygroscopicity than depth filtration due to more
particle contacting could occur in particle cake, which increases the amount of the capillary
condensed water. In addition to that, the depth filtration of cellulose could be affected by
more factors, such as cellulose and binder hygroscopicity, pore size and fiber morphology,
while surface filtration could be affected by fewer factors.
6.2.3.4.2 Wet Particles Volume Loading
As explained in Section 6.2.3.2, all wet particles follow the trend that volume
loadings are increasing with the loading RH.
Volume loadings between dry and wet particles of KCl and (NH4)2SO4 at the same
loading RH could be compared. For KCl at 75% RH, the average volume loading of dry
particles is 0.8523 mm3/cm2, and that of wet particles is 0.2899 mm3/cm2. The average
volume loading of dry particles is about three times of that of wet particles. For (NH4)2SO4,
volume loadings between dry and wet particles also show large discrepancies. The average
volume loading of dry particles is about 3 to 4 times of that of wet particles. As explained
in Section 6.2.3.1, dry particles can accumulate in a 3-dimensional space, while wet
particles only accumulate in a nearly 2-dimensional surface. The accumulation mechanism
differences cause large discrepancies in volume loading.

107
Figure 6–11. Volume loadings of KCl, (NH4)2SO4, and NH4NO3 at different RH on
nanofiber coated cellulose filter (the present study)
When the loading RH is higher than the salts’ DRH, the volume loading is greater
than that of the lower loading RH. For example, volume loading of KCl at 90% RH is
greater than its volume loading at 75% RH and volume loading of (NH4)2SO4 at 85% RH
is greater than its volume loading of 75% RH loading as well. When wet particles are
loaded, DRH is meaningless to wet particles. The increase of the volume loading is roughly
linear as a function of the loading RH until the loading RH is above a certain level, for
example, the volume loading of KCl at 95% RH, the volume loading of (NH4)2SO4 at 90%
RH and that of NH4NO3 at 75% RH are extremely great. In terms of wet KCl, volume
loading at 95% RH is about 2 times of volume loading at 90% RH; In terms of wet
(NH4)2SO4, volume loading at 90% RH is about 3 times of volume loading at 85% RH; in
Dry KCl
Dry (NH4)2SO4
Wet KCl
Wet (NH4)2SO4
Wet NH4NO3
Volu
me L
oa
din
g @
4 in H
2O
(mm
3/c
m2)
0
0.5
1.0
1.5
Relative Humidity (%)
0 20 40 60 80 100
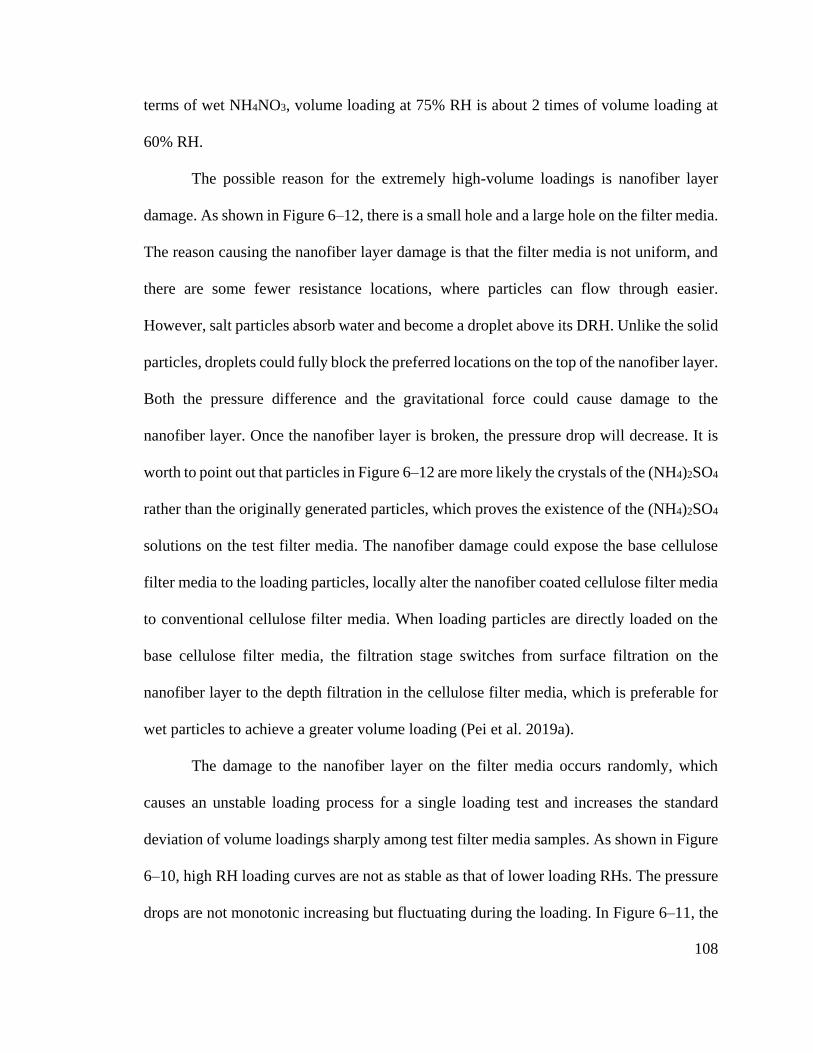
108
terms of wet NH4NO3, volume loading at 75% RH is about 2 times of volume loading at
60% RH.
The possible reason for the extremely high-volume loadings is nanofiber layer
damage. As shown in Figure 6–12, there is a small hole and a large hole on the filter media.
The reason causing the nanofiber layer damage is that the filter media is not uniform, and
there are some fewer resistance locations, where particles can flow through easier.
However, salt particles absorb water and become a droplet above its DRH. Unlike the solid
particles, droplets could fully block the preferred locations on the top of the nanofiber layer.
Both the pressure difference and the gravitational force could cause damage to the
nanofiber layer. Once the nanofiber layer is broken, the pressure drop will decrease. It is
worth to point out that particles in Figure 6–12 are more likely the crystals of the (NH4)2SO4
rather than the originally generated particles, which proves the existence of the (NH4)2SO4
solutions on the test filter media. The nanofiber damage could expose the base cellulose
filter media to the loading particles, locally alter the nanofiber coated cellulose filter media
to conventional cellulose filter media. When loading particles are directly loaded on the
base cellulose filter media, the filtration stage switches from surface filtration on the
nanofiber layer to the depth filtration in the cellulose filter media, which is preferable for
wet particles to achieve a greater volume loading (Pei et al. 2019a).
The damage to the nanofiber layer on the filter media occurs randomly, which
causes an unstable loading process for a single loading test and increases the standard
deviation of volume loadings sharply among test filter media samples. As shown in Figure
6–10, high RH loading curves are not as stable as that of lower loading RHs. The pressure
drops are not monotonic increasing but fluctuating during the loading. In Figure 6–11, the

109
standard deviation of volume loading of KCl at 95% RH and that of (NH4)2SO4 at 90% RH
are significantly greater than the standard deviations of other cases. Especially the test filter
media sample used in this study is not large enough (=47mm) and the nanofiber coating
conditions (stiffness, density, cellulose fiber distance, etc.) may vary among samples, the
occurrence of nanofiber damage on each test filter media sample differs. On the macro
scale, this difference will lead to variations in volume loadings.
Figure 6–12. SEM image of (NH4)2SO4 at 90% RH
6.2.3.5 Comparison with Conventional Cellulose Filter Media
It is worthwhile to compare the volume loading of dry and wet particles on different
filter media. Section 6.1 used conventional cellulose filter media to perform filter loading
with dry particles (similar size distribution). In that study, conventional cellulose filter was
loaded to 10 inches of water (2500Pa), while the terminal pressure in the present study is
4 inches of water (1000Pa). To better compare the volume loadings with this study, Figure
6–13 shows the adopted volume loading at 4 inches of water on conventional cellulose

110
filter. Compared to conventional cellulose filter media, it is clear that the volume loading
of dry particles on nanofiber coated cellulose filter media increased from around 0.1
mm3/cm2 to at least 0.3 mm3/cm2 and at most 1.1 mm3/cm2, which is a very significant
increase. Nanofiber layer on conventional cellulose filter can considerably improve the
filter holding capacity. However, it may reduce the holding capacity when the challenging
particles are wet. For example, volume loading of wet NH4NO3 particle at 30% RH on
conventional cellulose filter media in Figure 6–13 is about 0.5 mm3/cm2; the volume
loading of wet NH4NO3 particle at same 30% RH on nanofiber coated cellulose filter media
in Figure 6–11 is only 0.25 mm3/cm2, which is only a half of that of conventional cellulose
filter media.
Figure 6–13. Volume loadings of KCl, (NH4)2SO4, and NH4NO3 at different RH on
conventional cellulose filter (Adopted from Pei et al. (2019a))
Dry KCl
Dry (NH4)2SO4
Wet NH4NO3
Volu
me L
oa
din
g @
4 in H
2O
(mm
3/c
m2)
0
0.5
1.0
1.5
Relative Humidity (%)
0 20 40 60 80 100
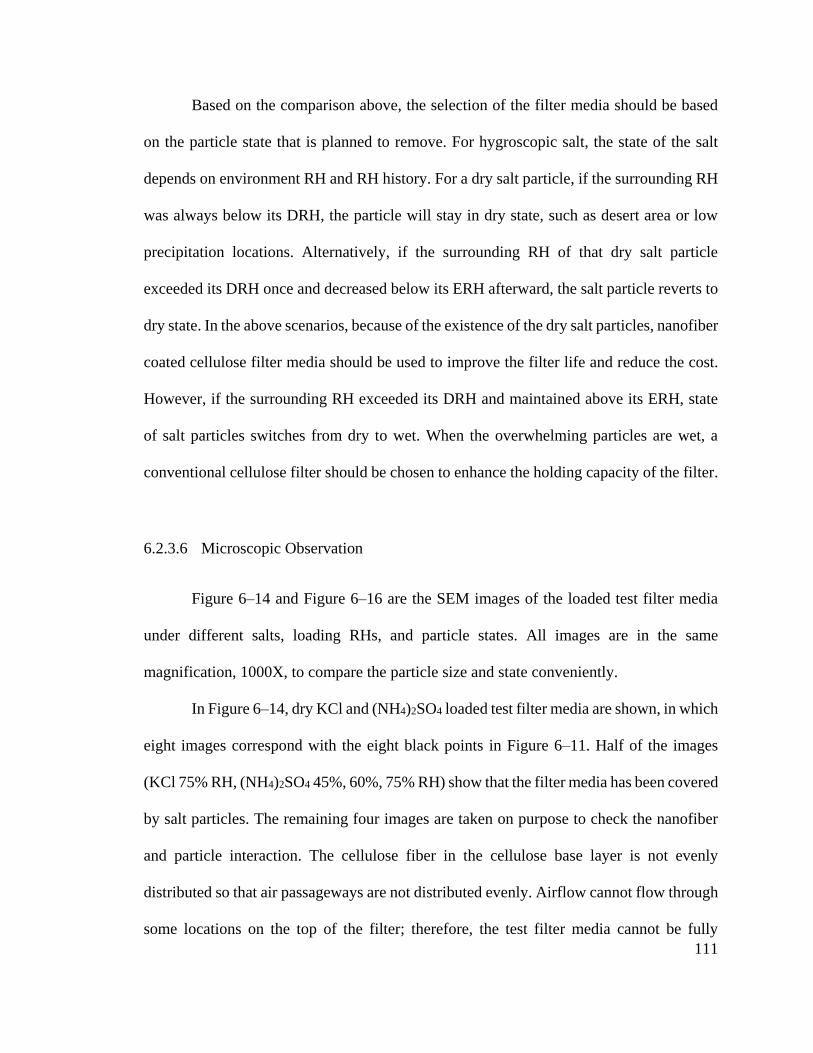
111
Based on the comparison above, the selection of the filter media should be based
on the particle state that is planned to remove. For hygroscopic salt, the state of the salt
depends on environment RH and RH history. For a dry salt particle, if the surrounding RH
was always below its DRH, the particle will stay in dry state, such as desert area or low
precipitation locations. Alternatively, if the surrounding RH of that dry salt particle
exceeded its DRH once and decreased below its ERH afterward, the salt particle reverts to
dry state. In the above scenarios, because of the existence of the dry salt particles, nanofiber
coated cellulose filter media should be used to improve the filter life and reduce the cost.
However, if the surrounding RH exceeded its DRH and maintained above its ERH, state
of salt particles switches from dry to wet. When the overwhelming particles are wet, a
conventional cellulose filter should be chosen to enhance the holding capacity of the filter.
6.2.3.6 Microscopic Observation
Figure 6–14 and Figure 6–16 are the SEM images of the loaded test filter media
under different salts, loading RHs, and particle states. All images are in the same
magnification, 1000X, to compare the particle size and state conveniently.
In Figure 6–14, dry KCl and (NH4)2SO4 loaded test filter media are shown, in which
eight images correspond with the eight black points in Figure 6–11. Half of the images
(KCl 75% RH, (NH4)2SO4 45%, 60%, 75% RH) show that the filter media has been covered
by salt particles. The remaining four images are taken on purpose to check the nanofiber
and particle interaction. The cellulose fiber in the cellulose base layer is not evenly
distributed so that air passageways are not distributed evenly. Airflow cannot flow through
some locations on the top of the filter; therefore, the test filter media cannot be fully

112
covered by salt particles. For the four images below (KCl 30%, 45%, 60% RH, (NH4)2SO4
30% RH), salt particles cover other open air passageways on the test filter media.
Figure 6–14. SEM images of test filter media loaded with dry KCl and (NH4)2SO4 at
different RH.
Note: Image size is about 120 μm in width, 96 μm in height. Scale bars in images are 10
μm.
Figure 6–14 offers an overview of the loaded test filter media while it is not
magnified enough to compare the morphology difference between loading RHs. Figure 6–
15 is an example of the magnified salt dendrites of (NH4)2SO4 at 30% and 75% RH. As
mentioned in section 6.2.3.2, capillary condensation occurs between particles. It could be
found that particle coalescence occurs at both RHs while it is significant at 75% RH. At
30% RH, salt particles connect to each other while it shows a clear boundary between
particles. At 75% RH, salt particles coalesce with adjacent particles with an unidentified
boundary. Such microscopic observation of the dendrites’ morphology change supports the
macroscope observation of the volume loading increase with loading RH increase.
30% 45% 60% 75%
KCl
(NH4)2SO4

113
Figure 6–15. SEM images of test filter media loaded with dry (NH4)2SO4 at 30% and 75%
RH
Figure 6–16 is the SEM images of test filter media loaded with wet salt particles at
different loading RHs, which correspond with the red points in Figure 6–11. Comparing to
dry particle loading in Figure 6–14, deposited particles cover the filter media with a
relatively thin layer. Volume loadings of wet salt particles are much less than that of the
dry particles. As introduced in Section 6.2.3.1, wet particles can merely build upon a 2-
dimensional surface. This is verified on their microscopic observation. KCl is the least
hygroscopic salt among three salts in this study, and it could be found that wet particle at
75%, 90% RH images still look similar to the dry particle deposition. (NH4)2SO4 is the
intermediate hygroscopic salt. 45%, 60%, and 75% RH conditions show an almost single
layer of the wet particles deposited on the test filter media. Loaded test filter at 90% RH is
also shown in Figure 6–12. It is clear that (NH4)2SO4 recrystallized on the test filter media,
providing the size and the shape of the particles on the test filter media. NH4NO3 is the
most hygroscopic salt, and all 4 SEM images show distinct appearances from the other two
salts. NH4NO3 are all dried after loading while remaining in a much larger size and droplet
(NH4)2SO4 30% RH (NH4)2SO4 75% RH

114
morphology. It is worth noting that there are two holes on the nanofiber layer in the image
of NH4NO3 at 45% RH. The nanofiber layer damage most likely occurs when the
challenging particles are wet. As explained aforementioned in section 6.2.3.4.2.
Figure 6–16. SEM images of test filter media loaded with wet KCl, (NH4)2SO4 and NH4NO3
at different RH.
Note: Image size is about 120 μm in width, 96 μm in height. Scale bars in images are 10
μm.
6.2.4 Conclusions
In this study, the loading characterization of the nanofiber coated cellulose filter
media was tested with KCl, (NH4)2SO4, and NH4NO3 separately at different loading RHs.
The loading RHs covered from below the ERH of salts to above the DRH of salts, which
meant that challenging particle states covered both dry solid particles and wet droplet
particles. Salt particles had similar dry particle size distribution. All test filter media were
loaded to 4 inches of water (1000 Pa). The test filter media were weighed in a dry chamber
30% 45% 60% 75% 90%
KCl
(NH4)2SO4
NH4NO3

115
before and after the loading to eliminate the effect of the moisture absorbed in both test
filter media and loaded salt.
For dry salt particles, the higher the loading RH, the slower the pressure drop
increase and the greater the volume loading, which is consistent with conventional
cellulose filter media results. However, conventional cellulose filter media starts with depth
filtration followed by surface filtration, but nanofiber coated cellulose filter media starts
with surface filtration directly. The differences in filtration mechanism cause a subtle
loading curve shape deviation while do not affect the overall loading behavior. The surface
filtration is more sensitive to salt hygroscopicity and loading RH than the depth filtration.
The volume loadings of nanofiber coated cellulose filter media are greater than that of
conventional cellulose filter media for all RH conditions due to the coating of nanofiber.
The capillary condensed water between deposited particles contribute to the dendrite
morphology change and possible air passageway opening, furthermore, reduce the overall
resistance and improve the volume loading at elevated loading RH.
As for wet salt particles, it also follows the trend that the higher the loading RH,
the slower the pressure drop increase and the greater the volume loading. The wet particles
exhibit a distinct loading curve shape from that of dry particles. The pressure drop
increased much slower than that of the dry particles initially, whereas the pressure increases
abruptly at a certain time and reach the terminal pressure in a short time. When the loading
RH is close to the saturation, the pressure drop fluctuates during the loading process, which
leads to an unstable loading curve. The loading curves’ shape of the wet particles loading
on nanofiber coated cellulose filter media is comparable to that of the wet particles loading
on conventional cellulose filter media. However, the volume loadings of the nanofiber

116
coated cellulose filter media reduced about 50% than that of conventional cellulose filter
media. It is because that wet particles can only deposit in a nearly 2-dimensional surface
on the nanofiber layer coating due to their wet state. The wet particle coalescence and the
surface tension variation at different loading RH affect the volume loadings at different
loading RHs.
This study mainly investigated the RH effect on the nanofiber coated cellulose filter
media, which is mainly used in the application of the ambient air particulate pollutant
removal. Filter manufactures claim that the nanofiber coating layer could effectively
improve the service life of the filter. However, this study reveals that the improvement of
the filter holding capacity depends on the operation RH and the state of the challenging
particles. When the particles are dry, the higher the loading RH, the longer the service life.
The switch from conventional cellulose filter media to the nanofiber coated filter media
could improve the filter service life for at least three times based on the media used in this
study. However, when the particles are wet, the nanofiber layer reduces the volume loading
to about 50% based on the media used in this study. In this scenario, volume loading still
correlates with loading RH positively.
From the results of this study, we learned that the selection of the filter media should
be cautious. Nanofiber coated cellulose filter media is not always an upgrade in terms of
improving the filter life. When the operation RH is low enough to maintain most of the
challenging particles in dry conditions, nanofiber coated cellulose filter will be a good
option to switch to. Whereas conventional cellulose filter media should be chosen when
the operating RH is relatively high, at which most of hygroscopic salt particles absorb water

117
and transform to wet state. For a specific filter, increase the operating RH to a moderate
level could improve filter life when hygroscopic particles are being removed.

118
Chapter 7: RH Effect on Filter Loading by Multiple
Species
7.1 (NH4)2SO4 and NH4NO3 Mixture
This section is in preparation: Pei, C., Ou, Q., Wang, K., Sun, C.C., and Pui, D. Y.
H., Effect of different ammonium salt mixing ratios on the loading performances of two
nanofiber coated cellulose filters
7.1.1 Introduction
As described in Chapter 1, many filed measurements have depicted that inorganic
salt, (NH4)2SO4 and NH4NO3 accounts for at most 50% of the PM2.5 in some highly
urbanized regions, and soot and organic compounds are also major pollutants (Cheng et al.
2016, He et al. 2001, Philip et al. 2014, Snider et al. 2015, Snider et al. 2016, Sun et al.
2004, Yang et al. 2011, Yao et al. 2002, Zhang et al. 2007). For example, sulfate and nitrate
account for 25% and 30% mass of PM2.5 in Minneapolis, respectively (Figure 4–3). The
hygroscopicity of pollutant particles depends on the inorganic particles components, even
when they are mixture of organic and inorganic particles (Jing et al. 2016, Peckhaus et al.
2012). It was also found that internally mixed (NH4)2SO4 and NH4NO3 particles could be
a vital surface provider in the severe haze episodes (Li et al. 2016a). Therefore, the RH
effect of salt mixture particles on filter loading could provide insight of the ambient particle
loading on filters.
The single species constant RH filter loading was studied in Chapter 6 on two types
of filter media. It was found that both salt species and particle state can affect filter loading

119
performance at different loading RHs. However, the test conditions in Chapter 6 is not
close to the ambient condition as it is impossible that the ambient pollutant consists of
single salt species. To better understand how the hygroscopicity of salt mixture can affect
filter loading, different mixing ratios of (NH4)2SO4 and NH4NO3 particles were tested at
different loading RHs in this study. Both dry and wet particles were tested to simulate
different ambient particle states.
Two-component inorganic salt mixture hygroscopicity studies depicted that
stepwise phase change may occur during hydration and dehydration processes (Chang and
Lee 2002, Cohen et al. 1987b, Ge et al. 1996, 1998, Tang 1976, Tang and Munkelwitz
1993, Tang and Munkelwitz 1994a, Wexler and Seinfeld 1991). Similar to the single-
component salt, two-component salt can deliquesce and effloresce at different RH with
stepwise change. For a solid mixture particle under increasing environmental RH, the first
step of water uptake occurs at its mutual deliquescence relative humidity (MDRH), at
which both salts dissolved in the absorbed water with eutonic composition. With further
RH increasing, partially dissolved salt keeps absorbing water until reaching DRH of the
mixture, which depends on the original mixture composition (Ge et al. 1998, Gupta et al.
2015, Wexler and Seinfeld 1991, Yang et al. 2006). The MDRH is normally below the
DRH of salt mixture. When the RH is lowered, one of the salts starts crystallization as the
pure salt core in a salt solution droplet when environmental RH reaches its ERH. With
further RH decreasing, eutonic composition salt solution effloresce around the pure salt
core at its mutual efflorescence relative humidity (MERH) to form a heterogenous core-
shell particle (Ge et al. 1996, Gupta et al. 2015, Wexler and Seinfeld 1991). In this study,
MDRH will be used as the reference RH, which is analog to the DRH of a single-

120
component salt. At or below MDRH, absorbed or capillary condensed water may alter the
morphology of dendrites and further affect the filter loading performance.
Hygroscopicity of (NH4)2SO4 and NH4NO3 mixtures were studied extensively.
Dougle et al. (1998) and ten Brink and Veefkind (1995) studied hygroscopicities of both
lab-generated (NH4)2SO4 and NH4NO3 and ambient particles of Netherlands. By
comparing particles hydration and dehydration processes of particles generated in the lab
and collected from atmosphere, they found that ambient (NH4)2SO4 and NH4NO3 mixtures
are internally mixed with different mixing ratios. In this study, internal mixture of
(NH4)2SO4 and NH4NO3 with different mixing ratios will also be employed. Sun et al.
(2018) and Wu et al. (2019) conducted similar studies of (NH4)2SO4 and NH4NO3 mixture
particles of different mixing ratios with individual particle hygroscopicity system and in-
situ Raman microspectrometry, respectively. They found the MDRH of (NH4)2SO4 and
NH4NO3 mixture particles varies with composition, which is due to different initial crystal
structures for various composition. The MDRH is in the range of 63% ~ 68% for
(NH4)2SO4 and NH4NO3 mixture.
7.1.2 Experimental Method and Material
This experiment was conducted at constant RH and at room temperature on the
LAEAF Test Rig introduced in Chapter 1. The RH control function was used to maintain
a constant loading RH, while the temperature was left at room temperature. As described
in the introduction, internally mixed (NH4)2SO4 and NH4NO3 particles were generated.
They were dissolved into a single solution and the solution was then atomized with the
121
homemade atomizer in the LAEAF Test Rig, so that internally mixed salt particles could
be generated. Since both dry and wet mixture particles were planned to be loaded, two
methods introduced in Section 6.2.2 were used. Briefly, to generate dry salt particles,
atomizer generated droplets were first dry to below the ERH and then humidified to the
loading RH; to generate wet particles, atomizer generated droplets were conditioned to the
loading RH while maintaining RH above the ERH. According to Wu et al. (2019), ERH of
the mixture particles is in the range of 20% ~ 40% depending on the composition. Sun et
al. (2018) reported that ERH of the mixture particles is in the range of 38% ~ 45% when
the molar mixing percentage of (NH4)2SO4 is more than 30%, and when NH4NO3 is
dominant ( >70%) no crystallization was observed. The similar phenomenon was also
reported by Dougle et al. (1998) when NH4NO3 is more than 68.3%. In this study, when
dry particles were being generated, regenerated silica gel desiccant were used in every run
to treat mixture particles as dry as possible.
From the PM2.5 speciation data of selected US cities in the database introduced in
Chapter 4, it was found that (NH4)2SO4 and NH4NO3 ratios vary from 81%:19% (Orlando)
to 38%:62% (Los Angeles). To represent different scenarios, the following (NH4)2SO4 and
NH4NO3 mass ratios were used: 100%:0% (pure (NH4)2SO4), 80%:20%, 50%:50%,
20%:80%, 0%:100% (pure NH4NO3). Since the MDRH is around 60%, three testing RH
were picked in this study, 30%, 45%, and 60%. The volume concentration was about 1%
so that the salt mixture particle count median diameter is about 100 nm and the geometric
standard deviation is about 1.8.
Another kind of nanofiber coated cellulose filter media were used in this study.
Comparing to the one used in Chapter 5 and Section 6.2, it is with thicker and denser

122
nanofiber layer (Figure 7–1). All filter samples were treated following the process in
Section 1.6. Briefly, all filter samples were conditioned in 0% RH environment before and
after loading. The dry mass gain was yielded by comparing the filter dry mass before and
after loading. Since densities of (NH4)2SO4 and NH4NO3 are close to each other (1.77 and
1.72 g/cm3, respectively (Haynes 2014, Lide 2005)), mass gain was used instead of volume
loadings. All filter samples were loaded to 4 inches of water (≈1000 Pa). Multiple samples
were tested at the same test conditions, and the averages and standard deviations were
calculated to have the statistically meaningful results.
Figure 7–1. SEM image of a clean nanofiber coated cellulose filter with thicker and denser
nanofibers.

123
7.1.3 Results and Discussion
7.1.3.1 Dry Mixture Particles Loading
Mass gains of dry mixture particles on filter samples are shown in Figure 7–2. It
should be noticed that pure NH4NO3 particles could be considered as wet particles from
the findings of Section 6.2. By checking the pure (NH4)2SO4 and pure NH4NO3 mass gain,
it agrees with the conclusions drawn from Section 6.2 that mass loading of (NH4)2SO4 dry
particles is greater than that of NH4NO3 wet particles. According to Ge et al. (1996) and
Wu et al. (2019), the eutonic composition of (NH4)2SO4 and NH4NO3 is about 5.6%:94.4%,
which means all mixtures tested in this study is (NH4)2SO4-rich particles. Wu et al. (2019)
reported ERH of mixtures with different compositions. The ERH is in the range of 25.8%
~ 19%, when m((NH4)2SO4):m(NH4NO3) = 20%:80%. This RH was reached during testing.
In Sun et al. (2018), the particles with this composition were reported behaving like pure
NH4NO3 particles, that is, particles remained wet even at 5% RH. The contradiction
between two studies may be used to explain the mass gains of m((NH4)2SO4):m(NH4NO3)
= 20%:80%, which is close pure NH4NO3 in Figure 7–2 at 30% and 45%.

124
Figure 7–2. Mass gains of dry (NH4)2SO4 and NH4NO3 mixture particles on filter samples
at different loading RHs
For the other two compositions, more RH were tested when it is close to the MDRH.
Mass gains of m((NH4)2SO4):m(NH4NO3) = 80%:20% mixture particles were loaded at
55%, 58%, and 62% in addition to 30% and 45% loading RH. Figure 7–3 shows mass gains
and sample loading curves of five loading RHs. From mass gain results, it could be found
that the mass gain of 45% loading RH is about 50% greater than that of 30% loading RH.
Mixture particles were in dry state when loading RH were 30% and 45%, which can be
found from the loading curves. When loading particles are dry, the increasing rate slows
down after the initial stage (30% and 45% in Figure 7–3). Whereas, the loading curve of
55% RH is slightly different from that of 45% RH, and the mass loading of 55% RH is
slightly less than that of 45% RH. By comparing the mass gains and loading curves of 58%
and 62% RH, it is clear that 55% is a transition RH between dry and wet particles, though
it is below the MDRH. The MDRH of this composition is about 68.7% RH, which was
AS:AN=100%:0%
AS:AN=80%:20%
AS:AN=50%:50%
AS:AN=20%:80%
AS:AN=0%:100%
Mass G
ain
@ 4
in
H2O
(mg)
0
5
10
15
20
25
Loading Relative Humidity (%)
30 45 60

125
measured from a single salt mixture measurement (Sun et al. 2018, Wu et al. 2019).
However, in the filter loading scenario, sub-micron size salt particles accumulated on the
filter sample at elevated RH, which is close to the MDRH. As described in Section 6.1.3.1,
capillary condensation could prompt water condensation on salt particles especially when
the surrounding RH is very close to the MDRH.
Figure 7–3. Mass gains and sample loading curves close to the MDRH of salt mixture
when m((NH4)2SO4):m(NH4NO3)=80%:20%
SEM images (Figure 7–4) of filter samples at 30%, 55% and 62% demonstrate the
deposition conditions on filter samples. In Figure 7–4, filter samples were artificially
bended before preparing SEM samples, so that salt cake would break, and the cross-section
can be seen. By comparing SEM images of 30% RH and 55% RH, salt particles coalesce
more at 55% RH, and a similar phenomenon was observed in previous chapters. However,
the particle deposition at 62% RH was distinct from the other two RHs, and a thin layer of
wet mixture particles cover the filter media. Figure 7–4 is a good example of salt particle
deposition arrangements at different loading RH.
Mass G
ain
@ 4
in
H2O
(mg)
0
5
10
15
20
25
Loading Relative Humidity (%)
30 45 55 58 62
Dry 30%
Dry 45%
Dry 55%
Dry 58%
Dry 62%
Pre
ssu
re D
rop
(in H
2O
)
0
1
2
3
4
Mass Loading (mg)
0 5 10 15 20

126
Figure 7–4. SEM images and particle deposition illustrations at different loading RH
It should be recalled that in single species loading studies, particle state conversion
below its DRH was not observed. Whereas it was found here, even with 20% NH4NO3 in
mass. Ge et al. (1998) observed water absorption below MDRH for various (NH4)2SO4 and
NH4NO3 composition. The absorption lowering depends on the composition, the higher the

127
NH4NO3 percentage, the lower the RH water absorption starts. Authors explained that
cracks formed on the surface of dry particles may cause this phenomenon. Small cavities
were also observed in this study (Figure 7–5), which could have the similar effect as the
cracks mentioned in Ge et al. (1998).
Figure 7–5. Small cavities on m((NH4)2SO4):m(NH4NO3)=50%:50% mixture dry particles
at 30% loading RH.
Based on the discussion above, mass gains of m((NH4)2SO4):m(NH4NO3)=50%:50%
could be explained that mass gain starts declining at 50% loading RH. With 50% NH4NO3
in the mixture, the particle state conversion started at 50% RH, which was 58% when
NH4NO3 is only 20%. This trend agrees with findings of Ge et al. (1998). Single particle
analysis was studied in Ge et al. (1998), while capillary condensation plays a role in this
study, which prompts more water absorption. Loading curves of 50%, 55%, and 60% RH
in Figure 7–6 exhibit the shape of wet particle loading, which indicating the particle state
conversion as well.

128
Figure 7–6. Mass gains and loading curves close to the MDRH of salt mixture when
m((NH4)2SO4):m(NH4NO3)=50%:50%
The unusual deliquescence process of (NH4)2SO4 and NH4NO3 was also discussed
in earlier publications (Ge et al. 1998, Wu et al. 2019). As described in previous study, the
low ERH of NH4NO3 may lead to some metastable droplets at very low RH, where particle
should be completely dry per thermodynamic prediction (Ge et al. 1998). The ERH of the
mixture particles were found lower than that of the pure (NH4)2SO4, which may cause
incomplete efflorescence and maintain aqueous state over a wide RH range (Wu et al.
2019). Ge et al. (1998) also claimed that the (NH4)2SO4 and NH4NO3 results were difficult
to explain, and it is not sufficient to use thermodynamics and surface morphology of
mixture particles. Therefore, the filter loading behavior of the salt mixture particles will
also be difficult to predict with other particles attached on salt mixture particles in the
atmosphere. The (NH4)2SO4 and NH4NO3 mixture particle composition, loading RH, and
particle dehydration history could affect the final loading results, which is a complex
process needing more research.
Mass G
ain
@ 4
in
H2O
(mg)
0
5
10
15
20
25
Loading Relative Humidity (%)
30 45 50 55 60
Dry 30%
Dry 45%
Dry 50%
Dry 55%
Dry 60%
Pre
ssu
re D
rop
(in H
2O
)
0
1
2
3
4
Mass Loading (mg)
0 5 10 15 20

129
7.1.3.2 Wet Mixture Particles Loading
As mentioned in the introduction, various composition wet mixture particles were
also used for filter loading tests. Based on the previous studies mentioned in Section 7.1.2,
ERH of the mixture particle is generally below 45%, hence 45% and 60% RH were tested
for wet mixture particle loading. Figure 7–7 shows mass loadings of various composition
wet mixture particle loading. It could be found that most of mass gains are comparable
except mass gains of pure NH4NO3 at 60% RH.
Figure 7–7. Mass gains of wet (NH4)2SO4 and NH4NO3 mixture particles on filter samples
at different loading RHs
Wet salt particles remain wet until surrounding RH is below its ERH. The amount
of water particles carrying depends on the surrounding RH. As described in Section 6.2.3.1,
wet particles form a liquid film on the top of the nanofiber layer, which cause lower mass
gains than dry particles. SEM images of all conditions in Figure 7–7 show the similar
AS:AN=100%:0%
AS:AN=80%:20%
AS:AN=50%:50%
AS:AN=20%:80%
AS:AN=0%:100%
Mass G
ain
@ 4
in
H2O
(mg)
0
5
10
15
Loading Relative Humidity (%)
45 60

130
deposition patterns as well. While the mass gain of pure NH4NO3 wet particles is about
double of the other mass gains. SEM images of filter samples loaded with pure NH4NO3
wet particles and wet m((NH4)2SO4):m(NH4NO3)=20%:80% mixture particles at 60% RH
are showing in Figure 7–8. Again, filter samples were artificially bended before preparing
SEM samples, so that salt cake would break. For pure NH4NO3 wet particles loaded filter
sample, wet particles percolate through the nanofiber layer without damaging it. For salt
mixture wet particles loaded filter sample, wet particle film formed on the nanofiber layer
without percolating it. From hydration and dehydration curves in Wu et al. (2019) at 60%
RH, the pure NH4NO3 wet particle growth factor is about 2.8 times in volume than its dry
state; while it is no more than 1.8 times for other salt mixture wet particles. The extra water
absorbed by NH4NO3 wet particles made the percolation through nanofiber layer easier, so
that mass gain would be greater.
Figure 7–8. SEM images of filter samples loaded with pure NH4NO3 wet particles (left)
and wet m((NH4)2SO4):m(NH4NO3)=20%:80% mixture particles (right) at 60% RH

131
7.1.4 Conclusions
To better understand ambient hygroscopic salt particles on air filters loading
performance, (NH4)2SO4 and NH4NO3 mixture particles with various mixing ratios were
used to simulate ambient hygroscopic salt particles. A nanofiber layer coated cellulose
filter was used as the test filter, which has the similar structure as the one used in the single
species salt particle loading (Section 6.2). It was found that mass gains of dry salt mixture
particles were complex and depend on mixture particle composition, loading RH, and
particle dehydration history. The mass gain complexity is caused by the salt mixture
hygroscopicity, which is proven complicated and unpredictable. As aforementioned, ERH
of NH4NO3 is very low or doesn’t exist, and metastable droplets caused by incomplete
efflorescence may bring uncertainties in the salt mixture states. Results of wet salt mixture
particles is a little simpler and they are comparable and less composition, RH dependent.
This study reveals the complexity of the (NH4)2SO4 and NH4NO3 mixture on filter
loading at different RH, and it offers insight of lab-simulated ambient particles filter
loading performance. Based on current experiment results, wet salt mixture particles could
offer a conservative filter holding capacities estimation, while it cannot represent dry
particles filter loading pressure evolution curves. With the aid of the Global Air
Pollutant/Meteorological Condition Database introduced in Chapter 4, a location specified
(NH4)2SO4 and NH4NO3 mixing ratio could be found, and the location specified filter
loading tests could be achieved to better predict the holding capacities of candidate filters.

132
7.2 Soot with Organic Compounds Coating
7.2.1 Introduction
Soot is a major constituent of ambient air pollutants. It accounts for higher
percentage in urban area, as it is generated from combustions. Transportation, industry,
biomass burning, and other combustion processes could generate soot particles. Soot
consists mainly of solid carbonaceous particles with small amount of other organic
compounds from incomplete combustion. For example, diesel soot exhaust consists of
solid carbon particles and volatile or soluble organic compounds (Kittelson 1998). Soot
particles could act as cloud condensation nuclei (CCN) and ice nuclei (IN), and they may
also have adverse effect on people’s health as they are in inhalable size range. For ambient
air filters, soot removal performance and filter loading has been studied with lab-generated
soot particles (Godoy and Thomas 2020, Kim et al. 2009b, Sun et al. 2019). It was found
that pressure curves of the pure soot loading has a linear relationship with mass loading on
HEPA filters, and Godoy and Thomas (2020) studied the RH effect during soot particles
loading and on soot loaded filter samples. It was found that the loading RH does not affect
soot loading as soot particles are non-hygroscopic, while the pressure of loaded soot
particles declines at lower RH restructure when it undergoes a higher conditioning RH.
The aforementioned two studies were carried out with fresh lab-generated soot,
which is considered as hydrophobic (Kireeva et al. 2010, Popovicheva et al. 2008a,
Popovicheva et al. 2008b, Tritscher et al. 2011, Weingartner et al. 1995). It has been studied
extensively that sulfuric acid and some organic compounds can alter the hygroscopicity of
soot particles in both laboratory and field studies. (Dalirian et al. 2018, Ebert et al. 2002,
Huang et al. 1994, Kireeva et al. 2010, Köllensperger et al. 1999, Leung et al. 2017, Li et

133
al. 2017, Liu et al. 2020, Mikhailov et al. 1996, Popovicheva et al. 2008a, Popovicheva et
al. 2008b, Saathoff et al. 2003, Schnitzler et al. 2014, Tritscher et al. 2011, Weingartner et
al. 1995, Weingartner et al. 1997, Wu et al. 2018, Yuan et al. 2019, Zhang and Zhang 2005,
Zhang et al. 2008) It was reported that aging process of soot particles could improve
hygroscopicity (Li et al. 2017, Liu et al. 2020, Weingartner et al. 1995). In the meantime,
soot particles shrinkage at elevated RH was also reported for both with and without organic
compounds coating (Ebert et al. 2002, Huang et al. 1994, Ma et al. 2013, Tritscher et al.
2011, Weingartner et al. 1995, Zhang et al. 2008). Both the hygroscopicity and morphology
change of soot particles with RH would affect ambient air filters performance. It would be
worthwhile to study filter loading performance with aged soot particles at different RH,
which is close to the actual working conditions of ambient air filters.
The most common aging method for soot particle study is utilizing a smog chamber,
whereas it is not a continuous flow system. It is good for soot particle study, while does
not fit filter loading study. For example, in Leung et al. (2017), it took more than 1h to
activate the aging process, which cannot be applied to filter loading testing experiments.
Another soot particle coating method was described with continuous flow coating process
without aging chamber (Dalirian et al. 2018, Xue et al. 2009). Lab-generated soot particles
would be introduced into a heated organic compounds reservoir where organic compounds
were vaporized. Organic compounds vapor would condense on the soot particles upon
cooling to room temperature. This aging method fits filter loading experiments and would
be used here with some modifications.

134
7.2.2 Experimental Method and Material
Similar to other filter loading tests introduced before, LAEAF Test Rig was used
in this study with RH control function at room temperature. Atomizer was not used in this
study, and the homemade soot generator (Section 2.1) was used together with the organic
compounds coating apparatus introduced in Section 2.2. Two organic compound carrying
flow rates were used in this study to compare the effect of the amount of the organic
compounds on filter loadings. The amount of the organic compounds was controlled so
that homogenous condensation would not happen. Two organic compounds, glutaric acid
and oleic acid, were planned to be coated on soot particles separately. Table 7–1 lists the
chemical and physical properties of glutaric acid and oleic acid.
Table 7–1. Chemical and Physical Properties of glutaric acid and oleic acid
Molar
mass
(g/mol)
Density
Melt
point
(℃)
Boiling
point
(℃)
Water
solubility
DRH
Glutaric
acid 132.11a
1.429 g/cm3
at 15 ℃ a 95 ~ 98 a 200 a
639 g/L at
23.9 ℃ a
85%
~90% b
Oleic
acid 282.46c
0.895 g/cm3
at 25 ℃ c 13 ~ 14 c 360 c Insoluble c
a: (National Center for Biotechnology Information 2020b), b: (Parsons et al. 2004), c:(National Center for
Biotechnology Information 2020a)
It could be found that glutaric acid is hydrophilic while oleic acid is hydrophobic.
Glutaric is a byproduct of the fossil fuel or biomass burning. It was also produced from
unsaturated hydrocarbons and fatty acids (Kawamura and Yasui 2005, Li et al. 2013). Oleic
acid is generated from cooking, especially meat cooking (He et al. 2004, Rogge et al. 1991).
The selection of organic compounds is mainly based on their hygroscopicity and
atmospheric relevance. The coated soot particles could represent hydrophobic or
hydrophilic coated soot pollutant in the atmosphere.

135
In this study, uncoated and coated soot particles were loaded on filter samples at
30%, 60%, 90%, and 95% RH. Based on previous studies, soot shrinkage happens when
surrounding RH is close to saturation, so that 90% and 95% were selected. The air filter
used in this study is the same as the one used in Section 7.1. And it was also loaded to 4
inches of water at 5.3 cm/s face velocity. The filter handling process was same as
descriptions in Section 1.6, so that moisture absorbed in filter samples could be eliminated.
It should be noticed that mass loading includes organic compounds coated on soot particles.
Soot particle morphology can be described by mass fractal dimension. McMurry et
al. (2002) and Park et al. (2003) developed DMA-APM-CPC technique to characterize soot
structure and density by particle mass m and mobility diameter dm.
𝜌𝑒𝑓𝑓 =6𝑚
𝜋𝑑𝑚3 =
6𝐴𝑑𝑚𝐷𝑓𝑚
𝜋𝑑𝑚3 =
6𝐴
𝜋𝑑𝑚
(𝐷𝑓𝑚−3)
ρeff is the effective density and Dfm is mass fractal dimension. Mass fractal
dimension could be used to describe soot structure. In this study, the soot particle
morphology would be characterized by mass fractal dimension.
7.2.3 Results and Discussion
Due to COVID-19 university closure, this study was not completed as planned.
Only glutaric acid coated soot particles loading was studied with few data points unfinished.
However existing results can provide some understandings for current filter testing and
suggestion for future study.
Mass of pure soot and coated soot particles with DMA selected mobility diameter
was measured by aerosol particle mass analyzer (APM). Effective density of given particle

136
mobility diameter could be calculated according to the equation above. Figure 7–9 lists
existing effective densities of pure soot and glutaric acid coated soot. There were two air
flow rates to bring glutaric acid vapor into the system, 2 LPM and 4 LPM, which could
adjust the amount of the glutaric acid coating. Since fresh soot particles are fractal-like
shape, their effective densities declining with larger particle mobility diameter. The power-
law fitting could be used to infer mass fractal dimensions accordingly.
Figure 7–9. Effective densities of pure soot and glutaric acid coated soot particles with
different mobility diameters
Table 7–2 lists mass fractal dimensions of all cases in Figure 7–9. It could be found
that mass fractal dimension is positively correlated with amount of the glutaric acid coating
and RH. The glutaric acid coating results agrees with Xue et al. (2009), and authors found
that soot particles shrank when glutaric acid coating was applied and this restructuring
30% RH Soot
30% RH Soot + GA@2LPM
30% RH Soot + GA@4LPM
90% RH Soot
90% RH Soot + GA@2LPM
90% RH Soot + GA@4LPM
95% RH Soot + GA@4LPM
Effective
Den
sity (
g/c
m3)
0
0.1
0.2
0.3
0.4
0.5
0.6
Mobility Diameter (nm)
50 100 200

137
could be boosted by elevated RH (90%). The pure soot restructuring was not significant.
There are several possible reasons: as mentioned in the introduction, pure soot is
hydrophobic and not sensitive to the RH change; pure soot restructuring was insignificant
and only local compaction could happen when condensed water is limited (Ma et al. 2013).
These finding indicating a saturation and oversaturation should be tested to in the future to
achieve more compacted soot particles. However, the compaction induced by glutaric acid
coating is significant enough. The amount of the glutaric acid and the coated particle
EC/OC ratio was not tested due to time constrain, which should be quantified in the future.
Table 7–2. Mass fractal dimensions of pure soot and glutaric acid coated soot at different
RHs
RH Pure soot Soot+GA@2LPM Soot+GA@4LPM
30% 2.137 2.193 2.575
90% 2.198 2.173 2.734
95% / / 2.851
To compare pure soot particles and coated soot particles visually, a filter sample
was firstly loaded with pure soot particles and followed by glutaric acid coated soot
particles. The filter sample was bent to damage the soot layer before SEM image was taken.
Figure 7–10 shows clear differences between pure soot particles and glutaric acid coated
soot particles. Pure soot particles are fractal-like structure while the glutaric acid coated
soot particles are more compact clump-like structures. The restructuring induced by
coating process could improve filter holding capacity by reducing the total area. The
structure change occurred before soot particles deposited on the filter, which is different
from the effect of RH on deposited salt particles mentioned in previous chapters.

138
Figure 7–10. SEM images of a filter sample loaded with pure soot in the bottom and
glutaric coated soot on the top
Mass Gains of pure soot particles and glutaric acid coated soot particles at different
loading RHs are shown in Figure 7–11. It could be found that the RH effect on mass gain
is not significant. These results agree with mass fractal dimension findings that soot
restructuring is insignificant when condensed water is limited. It should be noticed that the
mass gain in Figure 7–11 is the total mass of the soot and glutaric acid coating. As
mentioned above, the amount of the glutaric acid coating was not measured. However, the
mass gains of 4LPM glutaric acid flow is much more than that of 2LPM one. With the aid
of the mass fractal dimension and SEM images above, it could be inferred that glutaric
coating could improve filter holding capacity when the coating amount reach a certain level.
According to filed measurements, the aged soot in the atmosphere is covered with various
pollutant to restructured to embedded soot (Li et al. 2017, Wu et al. 2018, Yuan et al. 2019).
Therefore, the glutaric acid coated soot particles could simulate the aged soot in the

139
atmosphere to a certain extent. Further particle analysis should be conducted so that the
percentages of the soot particles and coating could be identified.
Figure 7–11. Mass Gains of pure soot and glutaric coated soot at different loading RH
7.2.4 Conclusions
This study used soot particles coated with lab-generated common atmospheric
organic compound to simulate the aged soot in ambient air. Effective densities and mass
fractal dimensions of pure soot particles and glutaric acid coated soot particles were
characterized with DMA-APM-CPC technique. Glutaric acid coating and elevated RH can
restructure pure soot particles to a more compact structure. The simulated aged soot
particles were loaded to nanofiber coated filter media to 4 inches of water. Mass gains of
organic compounds coated soot particles is higher than that of pure soot particles.
According to field studies, ambient aged soot particles are more compact than fresh soot,
which were simulated in this study. Previous filter loading testing used fresh lab-generated
Soot
Soot + GA@2LPM
Soot + GA@4LPM
Ma
ss G
ain
@ 4
in. H
2O
(mg
)
0
0.5
1.0
1.5
2.0
Loading RH
30% 60% 90% 95%

140
soot particles to represent ambient soot. However, the ambient soot aging process
restructures soot particles, which could result in a higher mass loading. Though only
glutaric acid coating was tested, this study implies that to better simulate ambient soot
particles in labs, aging process should be considered. RH effect on the aged soot particles
is worthwhile to study, with both hydrophobic and hydrophilic organic compounds. Some
other treatments that may prompt the hygroscopicity, such as UV and Ozone, could be
added in the future to better simulate aging process in a continuous flow system to test air
filters.

141
Chapter 8: Effect of RH Change on Pressure Drop of
Hygroscopic Particles Loaded Cellulose Filter Media
This chapter is in preparation: Pei, C., Ou, Q., and Pui, D. Y. H., Effect of relative
humidity change on pressure drop of loaded cellulose filter media with hygroscopic
deposits
8.1 Introduction
Cellulose media is a common material for air filters, because it is inexpensive and
easy to process. It is commonly used in many air-cleaning applications, including gas
turbine filters, engine intake filters, HVAC system filters. Whereas there are some
shortcomings that hinder the use of cellulose filter media, such as low initial efficiency,
relatively high differential pressure, and limited holding capacity. Nanofiber technology
development highlights the potential of improving air filters with sub-micron fibers, whose
diameter is normally less than 1 µm. When nanofibers are coated on the cellulose substrate,
the performance of overall cellulose air filters could be improved. The filter initial
differential pressure is reduced due to thin fibers and less drag force. The dense nanofiber
coating layer improves the initial filtration efficiency significantly. The smaller pore size
and greater fiber surface area contribute to the efficiency improvement. In addition, the
holding capacity is also improved. With the aid of the nanofiber layer, surface filtration is
achieved, which forms a high-efficiency particle cake and linear pressure drop. In this study,
the nanofiber coated cellulose filter will be studied.
In Chapter 5, 6, and 7, temperature and RH effect on air filter performance were
studied, however they were all conducted at a constant RH, which is not realistic in actual
filter operation. Based on the conclusion of Chapter 5, air filters operating RH is dominant

142
in air filter performance comparing to the operating temperature. The RH effect on air filter
performance should be studied in a more realistic way other than a constant RH. From
Chapter 4, Global Air Pollutant/Meteorological Condition Database, it can be found that
RH seasonal variation is significant in some places. Whereas the seasonal variation is a
gradual process that RH will not change abruptly. Air filter operating RH can be regarded
as relatively stable in the time scale of one month or one season. However, there are some
scenarios that the RH will change rapidly. For example, thunderstorms can raise the
ambient RH to 100%, and the RH will revert to close to previous level afterwards.
Commercial aircraft cabin is normally conditioned to 20% RH to prevent metal from
rusting, which is less than the comfortable RH of a person. When the aircraft is parked on
the ground with the outside hot and humid air entering the cabin, the powerful cooling
system will cool the outside air down, so that condensation could happen and cause fogging
in the cabin, which can bring cabin RH to 100%. The effect of this kind of RH spike on air
filters should be studied to better understand the filter performance change after such RH
spike.
The study of effect of the RH variation on the filter performance is limited.
Montgomery et al. (2015a) studied the impact of the relative humidity on the loaded HVAC
filter with hygroscopic (NaCl) and non-hygroscopic (Al2O3) particles. It was found that the
elevated RH could cause the irreversible pressure reduction and efficiency drop when the
HVAC filter is loaded with hygroscopic particle. When the HVAC filter is loaded with
non-hygroscopic particles, the similar phenomenon was not observed. Authors speculated
the small growth factor increase could change the dendrite morphology when the RH is
below its DRH. Joubert et al. (2011) performed similar experiments and explained as the

143
absorption of moisture from the high RH air by cake particles, which could restructure the
dendrites and create preferential air passageways. However, their studies limited elevated
RH to below DRH of NaCl. The filter performance of elevated RH above the DRH was
not covered. Wang et al. (2020) studied electret filter under the RH varying condition with
KCl deposition. It was found that the differential pressure of electret filter drops when the
filter is treated at the RH higher than the loading RH, which agrees with conclusions of
Montgomery et al. and Joubert et al. Wang et al. also treated the loaded filter sample with
lower RH than the loading RH and found the differential pressure stayed unchanged. Both
of studies loaded and treated filters below the DRH of testing salts, which cannot apply to
the scenarios mentioned before. In addition, as emphasized previously, the challenging salt
species and states are critical when the test filter is designed to remove ambient particles.
In this study, KCl, (NH4)2SO4 and NH4NO3 are used to load nanofiber coated
cellulose filters in their wet or dry states. Both conditioning RH below and above the
loading RH are tested so that different scenarios are simulated. The loading and
conditioning RH cover from below the ERH to above the DRH of challenging salts, which
is a comprehensive test matrix to simulate the actual operation conditions.
8.2 Experimental Method and Material
This study was carried out on the LAEAF Test Rig. The test temperature was at the
room temperature, and the RH control function was employed. The test system was
described in detail in Chapter 1. A solenoid valve is added on the compressed air line as
the shut-off valve to atomization (Figure 1–6). The atomization will stop when test filters

144
reach preset pressure. This study used the same filter media as Chapter 5 and Section 6.2
(Figure 5–2). The filter substrate is cellulose media and the nanofiber coating is made of
nylon.
In this study, filter samples were firstly loaded to 4 inches of water (≈1000 Pa) at
the loading RH (X %) and the face velocity is 5.3 cm/s. Atomizer shut-off valve would
stop the compressed air and salt particle generation was halted. The system RH would
automatically switch to the conditioning RH (Y %) and the test filter flow rate remain the
same. Since two filter samples cannot reach 4 inches of water at the same time, only one
sample holder on the LAEAF Test Rig was used in this study. The criterion of conditioning
termination is the differential pressure change rate is less than 0.1 inches of water/hour.
Figure 8–1 is the flowchart of the loading and conditioning processes. Only one-step RH
change was performed in this study.
Figure 8–1. Loading and conditioning processes of the test filter sample
Stop until Pressure Drop (Terminal Pressure) instantaneous decreasing rate less than 0.1in. H2O/hr
Condition test filter at Y% RH
Shut down atomizer while keep the test filter flow
Load test filter at X% RH until 4 in. H2O Pressure Drop

145
According to Section 1.4, the state of a hygroscopic salt particle depends on the
surrounding RH and hydration history. Figure 8–2 shows four possible states A-D of a salt
particle. For any given loading RH, there are two possible conditioning RH. For example,
when the filter sample is loaded at A, it could be conditioned at B or D. This RH variation
may or may not cause the salt particles state change. From A to B, salt particles remain in
dry state, but with higher chance to absorb more moisture; whereas from A to D, dry salt
particles will absorb moistures from surrounding air and become salt droplets. The possible
loading and conditioning RH process is listed in Table 8–1. It should be noticed that A, B,
C, D represent salt states rather than exact RH. A could be any RH below the ERH, B and
C could be any RH below the DRH while above the ERH, and D could be any RH above
the DRH. In this study, all the possible processes were studied with KCl, (NH4)2SO4, and
NH4NO3, when it is feasible. As discussed in Section 1.4 and Section 6.2, only wet state pf
NH4NO3 can be achieved with the current system (Dougle et al. 1998, Lightstone et al.
2000). Therefore, only C and D are available for NH4NO3 and the processes can only
happen between C and D, both in wet states.

146
Figure 8–2. Illustration of possible states of loading and conditioning processes (KCl and
(NH4)2SO4)
Table 8–1. All possible process from loading RH to Conditioning RH
Loading RH Conditioning RH State Change
A
A Dry => Dry
B Dry => Dry
D Dry => Wet
B
B Dry => Dry
A Dry => Dry
D Dry => Wet
C
C Wet => Wet
A Wet => Dry
D Wet => Wet
D
D Wet => Wet
C Wet => Wet
A Wet => Dry
Efflorescence RH Deliquescence RH
Dry State
Wet State
A B
C
D
Gro
wth
Facto
r
0
1
2
3
4
5
6
Relative Humidity (%)
0 20 40 60 80 100

147
8.3 Results and Discussion
8.3.1 KCl Loaded Filter Sample
According to the conclusions from Chapter 6 and previous studies, for hygroscopic
salts filter loading, the higher the loading RH, the less resistance of the salt cake. For a
given amount of the deposited salt, the surrounding RH growth can lead to a differential
pressure reducing. Figure 8–3 is the differential pressure curve during conditioning. It only
shows the conditioning curves of KCl loaded filter samples at 30% loading RH. The
horizontal axis is the time after salt particle generation was halted. The RH of air flow
through the filter sample started to switch to the conditioning RH and stabilize quickly. It
can be found that the time took for reaching a stabilized pressure drop for different
conditioning RH varies from 2000 seconds to 12000 seconds. The larger the difference
between loading and conditioning RH, the shorter the time needed for stabilization. This
phenomenon was also observed in Montgomery et al. (2015a) and Wang et al. (2020). The
possible explanation is the higher the conditioning RH, the more moisture can be absorbed,
so that dendrite restructuring is easier to take place with more condensed water.
It should be noted that the differential pressure also declined when the conditioning
RH is the same as the loading RH. This was also observed by Montgomery et al. (2015a),
when NaCl was loaded on the HVAC filters. During the filter loading, there could be two
competing mechanism in the pressure increasing. The first one is the particle deposition
process that can cause pressure growth. While the deposition structure may not be the most
stable structure under the influence of the RH, and the particle cake may restructure
afterwards. However, the pressure reduction was not observed in Wang et al. (2020). It is
because the amount of salt particles deposited on the electret media was limited, and

148
dendrites were not formed on filter fibers. So that dendrite restructuring could not take
place. Joubert et al. (2011) found the pressure unchanged when NaCl was loaded and
conditioned at 5% RH, which is very low, and the influence of moisture is very limited.
Figure 8–3. KCl loaded filter samples pressure stabilization during the RH conditioning
process
The terminal pressures of other loading RH and conditioning RHs are shown in
Figure 8–4. Solid points represent dry salt particle loadings and open points represent wet
salt particle loadings. When filter samples were loaded with dry KCl particles at 75% RH,
the terminal pressure of 30% conditioning RH is very close to 4 inches of water. While the
terminal pressure of 90% conditioning RH dropped to about 2 inches of water. The overall
trend of dry particle loading is the higher the conditioning RH, the lower the terminal
pressure.
30%=>30%
30%=>60%
30%=>75%
30%=>90%
0.75
3.40
2.15
1.56
Pre
ssu
re D
rop
(in H
2O
)
0
1
2
3
4
Time after loading (s)
0 5,000 10,000

149
Figure 8–4. KCl terminal pressures of different loading and conditioning RHs
To understand the salt cake structure changes when dry salt particles loaded filter
samples are conditioned at higher RH, SEM images were taken. Figure 8–5 is the SEM
images of KCl loaded filter sample that was loaded at 30% RH and conditioned at 90%
RH. It could be found that the salt cake is a very open structure comparing to the filter
sample without conditioning (Figure 6–14). Nanofiber coating layer can be observed on
the right-side magnified image. The differential pressure reduction to almost clean filter
pressure drop can be explained by this SEM image and dendrite restructuring shown in
Figure 6–3. 90% RH is above the DRH of KCl, the salt particles exhibit a coalesced state,
that nano particles are dissolved and combined to micrometer size salt particles. When the
conditioning RH is lower than 90%, capillary condensation can also introduce water
between salt particles, which would help dentrite restructuring (Figure 6–3). However, the
cake structure was retained in Figure 8–5, which may be due to the limited amount of the
water absorbed at 90%. The conditioning at 100% RH will be discussed in Section 8.3.2
for (NH4)2SO4 loaded filter sample.
Dry
Particle
Region
Multi-state
Region
Wet
Particle
Region
30%
75%-Dry
75%-Wet
90%
Loading RHTe
rmin
al P
ressu
re (
in H
2O
)
0
1
2
3
4
Conditioning RH (%)
0 20 40 60 80 100

150
For wet particle loading, the differential pressure reduction is not significant as dry
particle. The 75% wet KCl loaded filter samples holded 4 inches of water when they were
conditioned at 30% and 75%. The terminal pressure reduction was observed at 90%
conditioning RH. The wet particle loaded filter sample conditioning will be discussed in
Section 8.3.2 as well.
Figure 8–5. SEM images of KCl loaded filter sample that was loaded at 30% RH and
conditioned at 90% RH. Left: 1000X; Right: 5000X.
8.3.2 (NH4)2SO4 Loaded Filter Sample
The terminal pressures of (NH4)2SO4 loaded filter samples at different loading and
conditioning RHs are shown in Figure 8–6. In general, the trend is similar to the KCl case.
Two processes will be discussed. The first one is filter samples that were loaded with wet
particles and conditioned at lower RH. The second process is filter samples that were
conditioned at 100% RH. For the second process, both dry and wet salt particle loaded
filter samples will be discussed.

151
Figure 8–6. (NH4)2SO4 terminal pressures of different loading and conditioning RHs
As described in Section 6.2.3.1, wet particle deposition on nanofiber coated
cellulose filter media can hardly accumulate in the direction perpendicular to the filter
media and a film will be form on the top of nanofiber layer. When it was conditioned at
the same RH as the loading RH, there are possibility that salt can percolate through the
nanofiber layer or even damage the nanofiber layer. When these conditions happened, the
terminal pressure would drop. When the conditioning RH is below the loading RH, the
terminal pressure could hold at 4 inches of water. As shown in Figure 8–7, water in the
film evaporated at 30% conditioning RH, while retain the film structure so that the
differential pressure held at 4 inches of water. The same condition can also be seen when
the conditioning RH is 45% RH.
Dry
Particle
Region
Multi-state
Region
Wet
Particle
Region
30%
45%-Dry
45%-Wet
75%
90%
Loading RH
Te
rmin
al P
ressu
re (
in H
2O
)
0
1
2
3
4
Conditioning RH (%)
0 20 40 60 80 100

152
Figure 8–7. SEM images of (NH4)2SO4 loaded filter sample that was loaded at 90% RH
and conditioning at 30% RH
Figure 8–8 shows the process that filter samples were conditioned at 100% RH. It
is clear that there is limited amount of salt particles on the nanofiber layer on both dry and
wet particle loaded filter samples. The terminal pressures in Figure 8–6 is close to a new
filter sample. It is highly possible that deposited particles absorb water at 100% RH. The
amount of water absorbed at 100% RH can dissolve salt particles so that salt solutions can
percolate into filter sample to reduce the flow resistance.

153
Figure 8–8. SEM images of (NH4)2SO4 loaded filter sample that was loaded at 45% RH
and conditioning at 100% RH. Left: dry particle loading; Right: wet particle loading
8.3.3 NH4NO3 Loaded Filter Sample
NH4NO3 loaded filter sample was also studied. NH4NO3 is the wet particle loading
condition. The overall trend that the higher the conditioning RH, the lower the terminal
pressure still holds. There is a terminal pressure discrepancy when the conditioning RH is
60%. The terminal pressure of 30% loading RH is only about a half of 60% loading RH.
One of the possible reasons is that the amount of salt deposited on filter media can also
affect the terminal pressure. In Figure 6–11, the volume loading of 60% RH NH4NO3 is
about twice of that of 30% RH. Though salt deposition film can percolate into the filter,
the extent is limited by the amount of the water absorbed. When the conditioning RH is
100% (Figure 8–8), almost all salt can percolate into the filter; while when the conditioning
RH is 60%, the absorbed water is limited.

154
Figure 8–9. NH4NO3 terminal pressures of different loading and conditioning RH
Similar to other wet particles, when NH4NO3 was loaded at 60% RH, and
conditioned at 30% RH, the film could also form as seen in Figure 8–10. Comparing to wet
(NH4)2SO4 particles, NH4NO3 particles coalescence more, but droplets boundaries are still
distinct. Even without ERH, the RH drop can cause water evaporation so that the salt
deposition retains its shape and maintain the pressure drop across the filter media.
Figure 8–10. SEM images of NH4NO3 loaded filter sample that was loading at 60% and
conditioning at 30% RH
30%
60%
Loading RH
Te
rmin
al P
ressu
re (
in H
2O
)
0
1
2
3
4
Conditioning RH (%)
0 20 40 60 80 100

155
8.4 Conclusions
This study focused on the pressure variation of hygroscopic salt particles loaded
filter samples when the surrounding RH changes. KCl, (NH4)2SO4, and NH4NO3 dry and
wet particles were loaded on the nanofiber coated cellulose filter media at the loading RH
to 4 inches of water. The filter media was then conditioned at conditioning RH. The
terminal pressure curves and terminal pressure were recorded.
It was found that for dry particle deposition, the higher the conditioning RH, the
lower the terminal pressure. When the conditioning RH is below salt’s DRH, the reduction
of differential pressure is mainly caused by the capillary condensation discussed in Section
6.1.3.1, and the condensed water prompts dendrite restructuring. The overall pressure of
loaded filter sample reduced after dendrite restructuring. When the conditioning RH is
above salt’s DRH, the deliquescence water could prompt a further differential pressure
reduction. When the conditioning RH is 100%, dissolved salt can percolate through the
nanofiber layer which would cause a significant pressure reduction, to where the filter
pressure is close to a new filter. The conditioning at higher RH process could reduce
hygroscopic particle loaded filter pressure, whereas it is not clear whether this process can
be used to prolong the filter life or a method to “recover” used air filters. The second round
loading at lower RH should be done to further investigate the possibility of extending the
filter life.
For wet particles, the elevated conditioning RH can prompt pressure reduction by
introducing more water to salt deposit. However, the lowered conditioning RH would not
cause a pressure reduction. The reason is that the water in the liquid film evaporated at

156
lower RH while the film structure was retained so that differential pressure remained
unchanged. This finding is important to alert users that dry air blowing may “freeze” wet
salt deposit on the filter media so that the pressure will stay unchanged. The results can
also be used to explain the filter pressure change after a RH spike mentioned in the
introduction. However, this phenomenon may help in reverse pulse cleaning application,
where the solidified particle deposition can be peeled off easily.
This study broadens understandings of RH change effect on the hygroscopic
particles loaded filters. It covers the condition that RH is above the DRH of salts and the
condition of wet particle loaded filters. The next step would be cycling RH effect on the
filter loading, which is closer to the actual conditions. Also, the possibility of utilizing the
hygroscopic particle to prolong filter life or clean filters could be considered. Since only
pressure change was studied here, the efficiency variation should also be studied in the
future.

Part 3:
COVID-19 Related
Study: Mask and
Respirator Filtration
Study

158
COVID-19 was characterized as a pandemic by WHO on March 11, 2020, and it is
a global challenge for the world since then. Center for Filtration Research is one of the
leading filtration research centers in the world, and several COVID-19 related mask and
respirator filtration studies were conducted at the Center for Filtration Research. Chapter 9
compared common materials that have the potential to be used as alternative masks for the
public in daily protection. Chapter 10 aimed to evaluate the effect of decontamination of
the commercial and alternative respirator and mask materials from the filtration perspective.
Both two chapters were collaborated with Dr. Qisheng Ou and share the first authorship of
the published or submitted papers.

159
Chapter 9: Alternative Face Masks Made of Common
Materials for General Public: Fractional Filtration
Efficiency and Breathability Perspective
This section has been published: Pei, C.1, Ou, Q.1, Kim, S. C., Chen, S-C., and Pui,
D. Y. H. (2020). Alternative Face Masks Made of Common Materials for General Public:
Fractional Filtration Efficiency and Breathability Perspective Aerosol and Air Quality
Research 20 doi:10.4209/aaqr.2020.07.0423
9.1 Introduction
COVID-19 was characterized as a pandemic by World Health Organization (WHO)
on March 11, 2020, and it is a global challenge. As an infectious disease that is mainly
transmitted through droplets, the appropriate respiratory protection could protect the
healthy population from infection (National Academies of Sciences Engineering Medicine
2020, WHO 2020a). Respiratory protection is especially critical for frontline healthcare
workers, who have to contact COVID-19 patients directly. When one wears a mask, the
mask can help reducing virus spreading by capturing most of emitted droplets during
speaking, sneezing, and coughing (Anfinrud et al. 2020, Davies et al. 2013, Greenhalgh et
al. 2020, Rengasamy et al. 2010, van der Sande et al. 2008); on the other hand, the mask
can offer effective protections by filtering virus-laden particles in the air (Johnson et al.
2009, Lai et al. 2012, Leung et al. 2020b, Wang and Yu 2020, Zuo et al. 2013). Therefore,
the priority is to ensure that frontline healthcare workers are well protected. However, the
COVID-19 pandemic has led to the personal protective equipment (PPE) shortage,
especially respirators and masks. Therefore, various efforts have been paid to allocate
available respirators and masks inventory for frontline healthcare workers, including
decontamination (Liao et al. 2020, Ou et al. 2020).

160
As COVID-19 is infectious, it is critical to curb the spread the virus to protect the
healthcare system from overload, so-called flattening the curve. It has been found that
asymptomatic infected people and pre-symptomatic infected people could be potentially
infectious sources (CDC 2020b, National Health Commission and State Administration of
Traditional Chinese Medicine 2020). On the other hand, it is equally important for the
general public to wear masks or equivalent face coverings to slow down the spread of the
virus (CDC 2020c, National Health Commission 2020). As many states are re-starting and
social activities are recovering in the United States, many governors across the country
issued orders requiring face coverings when social distancing is unable to maintain
(Mendelson 2020). WHO updated its advice on the masks use on June 5, which encourages
the general public masking when physical distancing cannot be maintained (WHO 2020b).
However, it has been an ongoing debate about whether universal masking is
necessary. As early as Mar 2nd, 2020, there is a correspondence on the Lancet, discussing
the necessity of wearing masks in community settings and mentioning that WHO was not
recommending it due to lack of evidence. Authors emphasized that “absence of evidence
of effectiveness should not be equated to evidence of ineffectiveness, especially when
facing a novel situation with limited alternative options” (Leung et al. 2020a). A similar
concern was also raised by Morawska and Cao (2020) where authors called on considering
the possible airborne transmission. On July 6th, 239 scientists signed an open letter to the
WHO to address the airborne transmission of COVID-19, which is published in Clinical
Infectious Diseases (Morawska and Milton 2020). Later, WHO announced in a press
conference that WHO plans to update its guidelines. This discussion brings up the question

161
that how respirators and masks can protect wearers from the possible airborne transmission
of COVID-19.
Whereas, considering the current desperate shortage of commercially available
masks and respirators, the use of the common materials to substitute masks for the general
public can be the only option, such as scarves and bandanas. Also, the Centers for Disease
Control and Prevention (CDC) offers the tutorial for homemade masks (CDC 2020c). It
has been studied that homemade masks could not only protect the others from the wearer
by reducing the amount of the respiratory droplets exhaled from the wearer but also offer
protection to the wearer from inhaling virus attached particles (Anfinrud et al. 2020, Bae
et al. 2020, Davies et al. 2013, Howard et al. 2020, Konda et al. 2020, Leung et al. 2020a,
MacIntyre et al. 2015, Mueller et al. 2020, Prather et al. 2020, Rengasamy et al. 2010, van
der Sande et al. 2008, Zhao et al. 2020). However, common fabrics, such as T-shirts, cotton
cloth, were the most often used materials, which is not as good as commercial masks (CDC
2020d). How the general public could make good use of common materials to improve
their homemade masks? In this work, we tested several common materials besides common
fabrics to help the general public to protect themselves and people they interact with. It is
worth noting that conclusions drawn from this study can offer guidance for the general
public under the current pandemic. They can also be generalized to do-it-yourself (DIY)
the alternative air pollution protection gears when a commercial respiratory protection
equipment is not available.

162
9.2 Experimental Method and Material
Respirators and masks efficiency and breathability are key performance factors,
associated with the filtering effectiveness and the breathing resistance of a respirator or a
mask. In this study, the fractional filtration efficiency and the pressure drop across the filter
media were measured.
Air filtration is not as simple as sieving, and there are several filtering mechanisms,
including inertial impaction, interception, diffusion, electrostatic deposition, etc. With
different filtration mechanisms particle size less than 0.1 µm or particle size in the range
of 0.3 - 1 µm particles, overall fractional filtration efficiency curve will be a U-shape (Ou
et al. 2017, Spurny 1986, Yang 2012). The particle filtration efficiency strongly depends
on the particle size(Ou et al. 2017, Spurny 1986). The fractional filtration efficiency is
defined as the number of particles of a given size penetrating the filter medium, divided by
the total number of particles challenged on it.
The fractional filtration efficiency was reported in this study for comparing the
performance of common materials with commercial respirators/masks and to screen
potential candidate materials. The particle size with the least efficiency of the filter is the
most penetrating particle size (MPPS), which depends on filter material itself as well its
operating conditions. For the filter without electrical charges (so-called the mechanical
filter, e.g., glassfiber HEPA media, engine intake filter media), the MPPS is about 0.1 - 0.3
µm. For the filter with electrical charges (so-called the electret filter, e.g., some furnace
filters, N95) the MPPS is around 0.1 µm or less. Common household materials that are not
designed for filtration can have MPPS larger than 0.3 µm. Fractional filtration efficiency

163
reported in this study was from 0.03 µm to 1 µm, which covers possible MPPS of most of
materials tested and offers the size-resolved material efficiency.
The pressure drop of filter media is a measure of the breathing resistance. The
pressure drop across a filter media is proportional to the face velocity with which the
fractional filtration efficiency is also correlated. Hence, to compare common materials
fairly, the same face velocity should be used. In this study, we tested all materials at 10.5
cm/s. This face velocity is calculated from 85 LPM flow rate and 135 cm2 filtration area.
The flow rate of 85 ± 4 LPM is used by the National Institute for Occupational Safety and
Health (NIOSH) to certify N95. The filtration area of 135 cm2 is the lower end filtration
area of commercial N95s. The lower filtration area results in a higher face velocity, which
adversely affects the filtration efficiency. Hence, efficiency measurements in this study are
conservative, representing the worst conditions that may occur. In this study, we used a
differential pressure gauge (Dwyer, Michigan City, IN) to measure the pressure drop across
the testing filter media. To ensure the stable and accurate filter face velocity and flowrate,
several mass flow controllers (MKS Instruments, Inc. Andover, MA) controlled the flow
in the fractional filtration efficiency measuring system.
There are different test standards for respirators and masks. NIOSH tests respirators
according to 42 CFR part 84 (Office of the Federal Register 1995). The challenging particle
is neutralized NaCl, whose count median diameter is 0.075 ± 0.020 µm and the geometric
standard deviation is less than 1.86. The testing flow rate is regulated to 85 ± 4 LPM for
one respirator. For the surgical mask, ASTM and FDA have different testing protocols for
particle filtration efficiency and bacterial filtration efficiency. In general, the challenging
particle of particle filtration efficiency is latex spheres, and the face velocity is defined in

164
a broad range from 0.5 cm/s to 25 cm/s. FDA guidance document for surgical mask 510(k)
calculates the particle efficiency by 0.1 µm latex spheres (FDA), while ASTM F2299
claimed a particle size range from 0.1 to 5.0 µm (testing by monodisperse particles) (ASTM
International. 2017). As for bacterial filtration efficiency, the FDA follows ASTM F2101
to test surgical masks(ASTM International. 2019). Staphylococcus aureus bacteria are used
with the mean particle size at 3.0 ± 0.3 µm. The testing flow rate is 28.3 LPM. This study
used the NIOSH protocol as a reference.
Electron micrographs of SARS-CoV-2 particles show that they are generally
spherical, and their diameter is around 0.06 to 0.14 µm (Zhu et al. 2020). The respiratory
generated droplets could be several micrometers or larger, which will then evaporate to a
smaller nucleus (Anfinrud et al. 2020, Bourouiba et al. 2014, Bourouiba 2020, Gralton et
al. 2011, Morawska 2006, Morawska et al. 2009, Morawska and Cao 2020, Scharfman et
al. 2016). Therefore, the fractional filtration efficiency in this study (0.03 µm - 1 µm)
covered the size range for both the MPPS of common filter media and the SARS-CoV-2
particle cluster size range. The material filtration efficiency at its MPPS or SARS-CoV-2
size could offer a conservative evaluation of the material used. It is worth noting that as
aforementioned, the fractional filtration efficiency curve is a U-shape, even the largest
particle size used in this study is only 1 µm, the fractional filtration efficiency of several
micrometers’ particle could be inferred to be higher than the efficiency at 1 µm. Therefore,
if the MPPS is confirmed, the lowest efficiency is found.
This study did not test whole respirators/masks due to limited resources. Common
materials tested in this study were not sewn, so all testing samples are cut to a 40 mm
diameter disc to fit the filter holder. As aforementioned, the testing face velocity was kept

165
the same as the whole respirators/masks testing, so that the efficiency and pressure drop
measurement are kept consistent. The filter holder used in this study hold the media by
tightening the outside mounting nut, so it could adapt different material thickness and seal
around the sample.
NaCl particles were selected as the challenging particle to align with the NIOSH
testing protocols. NaCl submicron particles were generated by atomizing its solutions and
then dried by a diffusion dryer. In this study, we measured the fractional efficiency with
monodisperse NaCl particles, hence it is important to keep the particle number
concentration high enough to get statistically meaningful efficiency measurement in the
size range in this study (0.03 µm - 1 µm). A pneumatic atomizer (TSI 3076, Shoreview,
MN) was used in this study, with 0.4 % volume concentration NaCl solution and 30 PSI
filtered compressed air.
The efficiency of filter media may change after challenging particles loaded on it,
which could be mitigated by reducing the amount of the particles deposited on the filter
media. However, the number concentration at the upstream should be high enough so that
the efficiency measurement is statistically meaningful. Since we are measuring the
fractional filtration efficiency, which allows us to measure the efficiency of a certain
particle size at one time. By allowing only monodisperse particles with the size being
measured to reach the filter, the loading effect could be mitigated, and the number
concentration is high enough at the same time. An Electrostatic Classifier (TSI 3080,
Shoreview, MN) with a long Differential Mobility Analyzer (TSI 3081, Shoreview, MN)
classified the NaCl particle to the desired size. A Po-210 Staticmaster® Alpha Ionizer
(NRD, LLC. Grand Island, NY) neutralizer brought the challenging particles to the

166
Boltzmann charge equilibrium. The test filter was then challenged by neutralized
monodisperse NaCl particles with a certain amount of dilution air to meet the face velocity
requirement. An Ultrafine Condensation Particle Counter (UCPC, TSI 3776, Shoreview,
MN) was connected to the upstream and downstream of the filter holder by a pneumatic
switching three-way valve to measure corresponding concentrations. Testing apparatus is
shown in Figure 9–1 The fractional filtration efficiency is calculated by the formula below.
𝐹𝑟𝑎𝑐𝑡𝑖𝑜𝑛𝑎𝑙 𝐹𝑖𝑙𝑡𝑟𝑎𝑡𝑖𝑜𝑛 𝐸𝑓𝑓𝑖𝑐𝑖𝑒𝑛𝑐𝑦 = 1 −𝐶𝑑𝑜𝑤𝑛
𝐶𝑢𝑝/
𝐶𝑏𝑙𝑎𝑛𝑘,𝑑𝑜𝑤𝑛
𝐶𝑏𝑙𝑎𝑛𝑘,𝑢𝑝
𝐶𝑑𝑜𝑤𝑛 and 𝐶𝑢𝑝 are the UCPC concentration measurement at the upstream and downstream
of the filter holder, respectively. 𝐶𝑏𝑙𝑎𝑛𝑘,𝑑𝑜𝑤𝑛 and 𝐶𝑏𝑙𝑎𝑛𝑘,𝑢𝑝 are concentration
measurements without the test material in the filter holder, accounting for the system
particle loss. Theoretically, Filter penetration could be calculated from the ratio of the
downstream particle concentration and the upstream concentration. Hence the filtration
efficiency is calculated from one minus the penetration. However, in practice, there are
some system loss in measurement. When filter sample is not in place, the system loss could
be measured. The upstream and downstream sampling length, geometry, and port location
could cause slight difference in 𝐶𝑏𝑙𝑎𝑛𝑘,𝑑𝑜𝑤𝑛 and 𝐶𝑏𝑙𝑎𝑛𝑘,𝑢𝑝 concentration readings. This
formula is incorporated with system loss.

167
Figure 9–1. Schematic of the fractional efficiency measurement setup
Due to the time and resources constraint, all results reported in this article were the
results from a single measurement. The standard deviation showing on fractional filtration
efficiency plots are calculated from the particle concentration variation at the upstream and
downstream based on error propagation. The purpose of this study is to offer a reference
for the general public to select better alternative mask material. The sample-to-sample
variation will not jeopardize final recommendations, besides, variations between the
material the general public used, and the material tested cannot be compensated by more
replicates.
9.3 Results And Discussion
9.3.1 Commercial Respirators and Masks
To study the efficacy of common materials filtering out the particles and droplets
carrying SARS-CoV-2, available commercial respirators and masks were tested as the
references in this study. As one of the best filtration research centers in the world, the
Center for Filtration Research at the University of Minnesota received many test requests,

168
and we also collected available masks and other common materials to screen potential face-
covering candidates. Some masks received were not in its original package, so their
information was insufficient, such as brands, efficiency ratings, etc. For simplicity, we
named 10 masks with letters (Mask A to K). Besides 10 flat masks, a shaped KN95
respirator was received. 3M™ 8210 N95, 3M™ 1820 procedure mask, and Kimberly-
Clark™ 47090 procedure mask were tested from the lab PPE stockpile. This makes a total
of 14 respirators/masks tested as the reference, which is representative of commercial
respirators and masks.
The fractional filtration efficiency and breathing resistance of 14 respirators/masks
are shown in Figure 9–2. Fractional filtration efficiency curves could be categorized into
two groups, electret media (blue shade) and non-electret media (orange shade). The lowest
efficiency of the electret media mask is about 60% at 0.03 µm. The 3M™ 8210 N95, KN95,
and Mask A are all above 90% efficient. The overwhelming majority of electret masks
fractional efficiencies fall in 70% ~ 85%. The MPPSs of all electret media are below 0.1
µm. It could be found the fractional filtration efficiency of all electret media increases with
greater particle size. The Mask F has the poorest performance among all electret, while the
fractional filtration efficiency of the Mask F at 1 µm reaches around 85% and will continue
to increase beyond 1 µm. The non-electret media masks fractional efficiencies are
significantly lower than that of the electret media mask and their MPPSs are about 0.3 -
0.4 µm. The fractional filtration efficiency at MPPS is as low as 20%, while the fractional
filtration efficiency increases towards both smaller and larger particles, showing a U-shape.
The fractional filtration efficiency of the Mask K increases to 40% at 1 µm particle size
and it will continue to grow at larger sizes. The overwhelming breathing resistance of

169
respirators and masks are in the 30 Pa to 100 Pa range, and Mask H is extremely low with
only 5.4 Pa. The breathing resistance of all tested respirators and masks are in the
acceptable range for normal breath.
To compare the common material to the commercial respirators and masks, the
3M™ 8210 N95, 3M™ 1820 procedure mask, and Mask J will be plotted as references in
common material fractional filtration efficiency and breathing resistance figures (Figures
9–3 to 9–5 shown below). They represent the N95 level respirators, electret media masks,
and non-electret media masks.
Figure 9–2. Fractional filtration efficiency and breathing resistance of commercial
respirators and masks

170
9.3.2 Furnace Filters
Furnace filters are common material that are designed to filtering the dust, pet
dander, allergen, bacteria, and even virus in the room air. In this study, we collected four
types of furnace filter: Filtrete™ MPR 1900, 2200, and 2800, and Arm & Hammer™ Air
Filter. All four furnace filters are pleated and marketed as electret media filter. Filtrete™
MPR 1900 and 2200 are rated as MERV 13, this could be confirmed from their fractional
filtration efficiency curves in Figure 9–3. Filtrete™ MPR 2800 is rated as MERV 14 and
has the highest efficiency (ASHRAE 2017). For both Filtrete™ MPR 1900, 2200, and 2800,
their fractional efficiencies are higher than that of the 3M™ 1820 procedure mask, a mask
that is commonly used in hospital settings. As designed for handling a large amount of air
circulation in residential or commercial buildings, the breathing resistances of single layer
Filtrete™ MPR 1900, 2200, and 2800 are significantly lower than the reference
respirator/mask as shown in the bar chart in Figure 9–3. Multiple-layer performance of
collected furnace filters was also evaluated besides the single-layer measurements. The 5-
layer Filtrete™ MPR 1900, 2200, and 2800 perform comparably to 3M™ 8210 N95
respirators in terms of efficiency and breathing resistance. It can be found that the pressure
drop of 5-layer media is about 10 times of the single layer media, with the reason being the
thickness of the stacked multi-layer filter media is reduced due to the pressing seal nature
of the filter holder. The stacked fluffy media is compressed so that its permeability is
reduced. The fractional filtration efficiency curve of 2-layer Arm & Hammer™ Air Filter
is slightly lower than that of the 3M™ 1820 procedure mask, while much better than that
of the Mask J. Its 1 µm particle efficiency is above 80% and the efficiency could be higher

171
for even larger particle size. Its breathing resistance is only 10.3 Pa, about 1/6 of the 3M™
1820 procedure mask.
Figure 9–3. Fractional filtration efficiency and breathing resistance of furnace filters
9.3.3 Vacuum Cleaner Filters
Vacuum cleaner filters are another common air filter. We tested three grades of
pleated vacuum cleaner filters and one vacuum cleaner filter bag. The fractional efficiency
and breathing resistance are shown in Figure 9–4. The Ridgid® 5-Layer Allergen Vacuum
Cleaner Filter could offer protection even better than N95 respirator. However, its
breathing resistance is about 10 times of the N95, which is impractical to be used as an
alternative respirator/mask material. If it was molded as a tight-fitting respirator, just like
the commercial N95 mask, the breathing resistance would be twice of the breathing
resistance requirement (343 Pa) indicated in 42 CFR Part 84. On the other hand, if this
Filtrete™ MPR 1900 - 5 layers
Filtrete™ MPR 2200 - 5 layers
Filtrete™ MPR 2800 - 5 layers
Filtrete™ MPR 1900
Filtrete™ MPR 2200
Filtrete™ MPR 2800
ARM & HAMMER™ Air Filter - 2 layers
3M™ 8210 N95
3M™ 1820 Procedure Mask
Mask J
4.5 5.09.8
50.2
56.9
75.7
10.3
73.1
61.3
68.7
Diffe
rentia
l P
ressu
re @
10.5
cm
/s (
Pa
)
0
20
40
60
80
100
Filtre
te™
MPR 1
900
Filtre
te™
MPR 2
200
Filtre
te™
MPR 2
800
Filtre
te™
MPR 1
900
× 5
Filtre
te™
MPR 2
200
× 5
Filtre
te™
MPR 2
800
× 5
ARM
& H
AM
MER™
Air
Filter
× 2
3M™
821
0 N95
3M™
182
0 M
ask
Mas
k J
Breathing Resistance
3M™
N95
3M™
1820
P-Mask
Mask J
Effic
ien
cy
0%
10%
20%
30%
40%
50%
60%
70%
80%
90%
100%
Particle Mobility Diameter (µm)
0.02 0.05 0.1 0.2 0.5 1

172
material was used to make a loose-fitting mask, the overall efficacy of the mask will be
largely jeopardized since a large portion of the inhaled air would leak through the non-
sealed edge rather than flow through the media because of differential pressure balancing.
With a similar fractional filtration efficiency as the procedure mask, the breathing
resistance of the Ridgid® Fine Dust Vacuum Cleaner Filter and the Ridgid® High-
efficiency Dust Bag is about triple and double of the procedure mask. However, the
efficiency of Ridgid® 1-Layer Pleated Paper Filter is even worse than the Mask J, although
breathing resistance is slightly lower than that of Mask J.
Figure 9–4. Fractional filtration efficiency and breathing resistance of vacuum cleaner
filters
9.3.4 Common Household Materials
We also tested some common household materials to assess their potential as
alternative respirator/mask materials. The comparison could offer a filtration efficiency
RIDGID® 5-Layer Allergen Filter
RIDGID® 3-Layer Fine Dust Filter
RIDGID® High-Efficiency Dust Bag
RIDGID® 1-Layer Pleated Paper Filter
3M™ 8210 N95
3M™ 1820 Procedure Mask
Mask J
651.8
210.3
149.3
57.7 73.1 61.3 68.7
Diffe
ren
tial P
ressu
re @
10
.5 c
m/s
(P
a)
0
100
200
300
400
500
600
700
RID
GID® 5
-Lay
er
RID
GID® 3
-Lay
er
RID
GID® D
ust B
ag
RID
GID® 1
-Lay
er
3M™
821
0 N95
3M™
182
0 M
ask
Mas
k J
Breathing Resistance
3M™
N95
3M™
1820
P-Mask
Mask J
Effic
ien
cy
0%
10%
20%
30%
40%
50%
60%
70%
80%
90%
100%
Particle Mobility Diameter (µm)
0.02 0.05 0.1 0.2 0.5 1

173
and breathing resistance perspective on candidate common material of homemade masks.
We tested several kinds of material, including sterilization wrap, household fabrics, paper
products, which are representatives of materials that have been widely mentioned recently
as DIY mask materials. The results are shown in Figure 9–5.
We tested two sterilization wraps that are designed for sterilized instrument
wrapping, Halyard H600 and CardinalHealth™ CH600. The sterilization wraps were
designed for blocking bacteria while allowing gas penetration. They are composed of
multiple layers of spunbond and meltblown materials; both are widely used as air filtration
media. Therefore, they share a similar structure with air filters, which helps in particle
filtration. Electric charges were applied on Halyard H600 to enhance particle capture
capabilities, according to the manufacturer, which is one of the reasons that the fractional
filtration efficiency of Halyard H600 is higher than that of CardinalHealth™ CH600 which
does not have electric charges according to our tests. The breathing resistance of Halyard
H600 and CardinalHealth™ CH600 are about 2 and 3 times of that for 3M™ 1820
procedure mask, respectively.
Four common fabrics were tested to offer the scientific support in material
selections: 2-layer Thinsulate™, and 5-layer bed sheets, T-shirts, and Swiffer® Sweeper®.
Their fractional filtration efficiency curves are comparable, and MPPSs are around 0.3 µm
with 50% efficiency at MPPSs. Thinsulate™ is intended to offer insulation while keeping
the moisture penetration, which is achieved by highly porous microfibers, an essential
microstructure of air filters. The efficiency of 2-layer Thinsulate™, therefore, could be
comparable to that of 5-layer the other three materials. Swiffer® Sweeper® is
electrostatically charged so that it can pick up and retain small dust and debris when used

174
to swipe off household surfaces. It filters out particles like an electret media, but the charge
level on it is not as strong as commercial electret filters (e.g., respirators, face masks,
furnace filters, etc.) so that its MPPS is still 0.3 µm, which is also partially attributed to its
larger fiber size than most commercial electret filtration materials. 5-layer bedsheets and
T-shirts tested in this study have similar efficiencies, which are ~ 50% efficient at 300 nm,
suggesting that stacking sufficient layers of similar fabric materials are necessary to ensure
desired respiratory protection to the wearer, while simply pulling the collar band above the
nose is not recommended. From the breathing resistance perspective, the breathing
resistance of Thinsulate™ and Swiffer® Sweeper® is only about 75% and 50% of that for
3M™ 1820 procedure mask, respectively. Their efficiency could be further improved by
adding more layers, where the increased material thickness can be a concern. Additionally,
known as an excellent thermal insulator, the advantage of Thinsulate™ in its original duty
now pose a disadvantage for it being used as a face mask material. Exhaling through mouth
and nose is one of the major routes for the human to expel the body heat, where good
thermal insulation is not welcome. As the easiest accessible materials in a household, 5-
layer bedsheets and T-shirts tested in this study have significantly higher breathing
resistance than their procedure mask reference, making them less recommended from
breathability and facial-leak points of view. Paper products are also discussed widely as
the candidates for alternative masks. The efficiencies of a 5-layer shop towel and kitchen
towel are in between of the 3M™ 1820 procedure mask and Mask J. Again, the multiple-
layered configuration is the key for adequate self-protection. One of the concerns of using
paper products is their breathing resistance, which is high from the measurement and may
increase further after gradually picking up moisture from human exhalation. Coffee filters,

175
though the only material in this group with a “filter” in its name, is the last material to be
considered as an air-filtering face mask, owing to its combination of exceptionally low
efficiency and higher-than-average breathing resistance.
Figure 9–5. Fractional filtration efficiency and breathing resistance of common fabrics
9.3.5 Discussion of The Figure of Merit
The above discussions about fractional filtration efficiency and breathing resistance
of common materials recommended the candidates for the alternative mask materials.
However, it is still hard to compare two materials if one has high efficiency, high breathing
resistance, and the other one has low efficiency and low breathing resistance. The figure of
merit is therefore introduced to compare two materials under the same standards. The
figure of merit (Brown 1993) of filter material can be calculated as
Halyard H600 Sterilization Wrap
Shop Towel - 5 layers
Thinsulate™ - 2 layers
T-Shirt - 5 layers
Swiffer® Sweeper® - 5 layers
Bedsheet - 5 layers
Kitchen Towel - 5 layers
CardinalHealth™ CH600
Sterilization Wrap
Coffee Filter - 2 layers
3M™ 8210 N95
3M™ 1820 Procedure Mask
Mask J
151.3
185.8
48.2
231.1
27.4
433.9
158.9187.9
153.4
73.161.368.7
Diffe
rential P
ressu
re @
10
.5 c
m/s
(P
a)
0
100
200
300
400
500
Halya
rd H
600
Sho
p To
wel ×
5
Thins
ulat
e™ ×
2
T-sh
irt ×
5
Swiffer® S
wee
per® ×
5
Bed
shee
t × 5
Kitc
hen
Towel ×
5
Car
dina
lHea
lth™
CH60
0
Cof
fee
Filter
× 2
3M™
821
0 N95
3M™
182
0 M
ask
Mas
k J
Breathing Resistance
3M™
N95
3M™
1820
P-Mask
Mask J
Effic
ien
cy
0%
10%
20%
30%
40%
50%
60%
70%
80%
90%
100%
Particle Mobility Diameter (µm)
0.02 0.05 0.1 0.2 0.5 1

176
𝐹𝑂𝑀 = − ln(1 − 𝐸)
∆𝑃
where E is the filter efficiency and ΔP is the differential pressure. The figure of
merit represents the level of particle capturing a filter media can achieve per unit of flow
resistance penalty, which accounts for the efficiency and breathing resistance (differential
pressure) concurrently, so that it can be used to compare the efficiency-resistance tradeoff
among all the materials tested. Figure 9–6 shows the figure of merit of the selected
materials.
The first tier consists of four materials carrying electrostatic charges. The figure of
merit of Filtrete™ MPR2200 and MPR 2800 are even higher than 3M™8210 N95. It
should be noticed that Filtrete™ MPR2800 ranked higher than Filtrete™ MPR2200 in
terms of efficiency, but its figure of merit is slightly lower than that of Filtrete™ MPR2200
due to its higher breathing resistance. The other two materials, Swiffer® Sweeper® (5 layers)
and Thinsulate™ (2 layers), have a similar figure of merit as 3M™ 1820 procedure mask.
All four first-tier materials are the most-recommended candidates from the filtration point
of view. The second tier includes another four materials: Halyard H600 sterilization wrap,
RIDGID® 3-layer Fine Dust Filter, and T-Shirt (5 layers) have a similar figure of merit,
which is comparable to that of the Mask J, a non-electret commercial mask. These results
show that the quality of those three common materials as good as the Mask J. It could be
found that the efficiencies of the above three materials are much higher than that of the
Mask J, at least 30 percentage points (5-layer T-shirt) at MPPS. Therefore, the comparable
figure of merit to Mask J is mainly because of the high breathing resistance of three
common materials. The figure of merit of 5-layer bedsheet is lower than the other three,

177
the likely reason is that the breathing resistance of the bedsheet we tested was about double
that of the T-shirt. The inadvisable material is coffee filters, which is ranked lowest in both
efficiency plot and figure of merit plot. Even it is called coffee filter, it is designed to
separate the ground coffee from water, having hundreds of times larger size than the SARS-
CoV-2 virus or other air-borne pathogens a mask needs to filter out. Although counter-
intuitive at first glance, it needs to be recognized that furnace filters and vacuum filters
may work well as alternative mask materials, but coffee filters do not work well.
Figure 9–6. The figure of merit of common materials
9.3.6 Some Discussions
Some of the recommended materials can be cut and sewn to a mask, such as T-
shirts, bedsheets. However, some material is hard to be processed in the same way, such as
Filtrete™ MPR 2200
Filtrete™ MPR 2800
Swiffer® Sweeper® - 5 layers
Thinsulate™ - 2 layers
Halyard H600 Sterilization Wrap
RIDGID® 3-Layer Fine Dust Filter
T-Shirt - 5 layers
Bedsheet - 5 layers
Coffee Filter - 2 layers
3M™ 8210 N95
3M™ 1820 Procedure Mask
Mask J
3M™
N95
3M™
1820
P-Mask
Mask J
Fig
ure
of M
erit
(Pa
-1)
10−3
10−2
10−1
Particle Mobility Diameter (µm)
0.02 0.05 0.1 0.2 0.5 1

178
furnace filters, Swiffer® Sweeper®. A combination of a cloth mask and a filter material
insert is therefore recommended. A cloth mask could be made following various
instructions online (CDC 2020d). The face-covering part can be made into a double-layer
design with a slit on the inner side, where a filter material can be cut and inserted to boost
the filtration efficiency. This makes the use of those difficult-to-sew materials, such as
furnace filters, possible and it can also reduce the material consumption by using small
pieces only covering the size of the insert pocket.
This study evaluated common materials that have the potential to be made into
alternative masks for the general public under the current COVID-19 pandemic as an
emergency option. It should be noticed that this study does not endorse the safety of using
the studied material as an alternative mask. For example, fiber shedding could be potential
harm to wearer, especially people who have underlying respiratory conditions. Many of
the tested materials in this study were not intended for respiratory protection so that
potential fiber shedding was not tested by their manufacturers or certification agencies.
With the tide of DIY masks using alternative materials, some manufacturers announced the
notice regarding altering their products to mask use. For example, 3M does not recommend
altering the furnace filter to other usages (3M 2020); Halyard claims that they cannot
recommend the off-label use of the sterilization wrap (Halyard 2020); Ridgid has a similar
notice that their vacuum filter and vacuum filter bag is not designed as a respiratory
protection material (RIDGID 2020).
In this study, different commercial respirators, masks, and common materials were
all tested with a sealed filter holder and the same face velocity, to ensure a fair performance
comparison of the materials themselves. When a filter material is made into a respirator or

179
mask, even the tight-fitting respirator design experiences various degrees of a facial leak,
due to design faults, the variation of wear’s facial profiles, and improper use. Such leak is
more substantial on loose-fitting face mask designs, which most DIY masks are. Face leak
causes a certain portion of air inhaled not filtered by mask materials, resulting in lower
overall efficacy than the material efficiency as reported in this study, the degree of which
varies largely among mask shape/style designs and material’s breathing resistance For
similar mask designs, the pressure-driven face leak is severer on masks made of materials
with higher resistance, which emphasizes another reason why breathing resistance is
treated equally important to filtration efficiency in this study, other than the consideration
of breathability and wearer’s comfort. The figure of merit is a well-accepted indicator of
efficiency-resistance balance in filtration society, but its correlation with the overall
efficacy of a face mask (with face leak counted) is not fundamentally or experimentally
studied. Although a comprehensive assessment of overall protection efficacy of various
mask materials and designs is not an easy task, given the large variations from various
factors, not to mention the fit of a respirator/mask itself is subject dependent, a case study
showing the comparison of material efficiency and overall efficacy, and its association with
breathing resistance and other factors, it is urgently needed under current pandemic.
Since the particles used in this study can not only represent the virus-laden particles
but also, more importantly, the particulate air pollutant. The most concerning particulate
pollutant is PM2.5 whose aerodynamic particle size is less than 2.5 µm. The particle size
studied in this study falls into this size range. Hence, the conclusion of particle filtration
efficiency and breathability of different common materials could also be applied when the
general public DIY their masks to prevent particulate air pollutants. This is valuable for

180
the countries suffering from air pollutions, especially developing countries with limited
access to commercial masks. Under the current pandemic, the SARS-CoV-2 laden particle
could cause acute respiratory disease, while the particulate air pollutant can also cause
chronic respiratory diseases. According to many epidemiologic studies, the positive
association between respiratory diseases and atmospheric pollutants has been proven. It is
equally important for the general public to be protected from both the pathogens and
ambient pollutants. The conclusions of this study can guide the general public when the
commercial respiratory protection equipment is unavailable under a pandemic or a heavy
air pollution episode.
9.4 Conclusions
In this study, we tested commercial respirators and masks, furnace filters, vacuum
cleaner filters, and common household materials. We evaluated the materials’ fractional
filtration efficiency and breathing resistance, which are primary factors affecting
respiratory protection. Neutralized monodisperse NaCl particles were used to measure the
fractional efficiency. Breathing resistances were also compared at the same face velocity.
To compare the efficiency-resistance tradeoff, the figure of merit of each tested common
material was also calculated. Filter media with electrostatic charges (electret) is
recommended due to its high efficiency with low flow resistance; multiple-layer household
fabrics and sterilization wraps are acceptable materials; a coffee filter is inadvisable due to
its low efficiency. The outcome of this study can not only offer guidance for the general
public under the current pandemic but also suggest the appropriate alternative respiratory
protection materials under heavy air pollution episodes.

181
Chapter 10: Evaluation of Decontamination Methods
for Commercial and Alternative Respirator and Mask
Materials – View from Filtration Aspect
This chapter has been published: Ou, Q.1, Pei, C.1, Kim, S. C., Abell, E. and Pui,
D. Y. H. (2020). Evaluation of decontamination methods for commercial and alternative
respirator and mask materials – view from filtration aspect Journal of Aerosol Science 150:
105609. doi:10.1016/j.jaerosci.2020.105609
10.1 Introduction
The COVID-19 pandemic has led to a severe shortage of personal protection
equipment (PPE) worldwide (WHO 2020e). According to World Health
Organization(2020c), the novel coronavirus (SARS-CoV-2) is transmitted primarily
through human respiratory droplets generated by coughing or sneezing(Leung et al. 2020b,
National Academies of Sciences Engineering Medicine 2020), either through direct contact
when virus-containing droplets reach the nose, mouth, eyes of a person, or indirectly when
a person touches virus-contaminated objects or surfaces and then touches his/her eyes, nose,
or mouth. A respiratory protection equipment is therefore essential for frontline healthcare
workers who may have direct contact with patients carrying COVID-19 virus. Nevertheless,
the scarce inventory of N95 respirators and surgical masks in hospitals has been reported
(Klompas et al. 2020). In light of the urgent needs and the exhausted national stockpile of
PPEs, although not designed for, the possible decontamination and reuse of disposable
filtering facepiece respirators (FFRs) becomes necessary (CDC 2020a).
While tight-fitting respirators provide better protection against airborne sub-micron
particles (Ollier et al. 2019, Zhou and Cheng 2017), they are generally recommended to be
reserved for healthcare workers during current pandemic (WHO 2020d). Loose-fitting

182
masks, such as surgical masks and procedure masks, are designed mainly to be used as
one-way protection, capturing large particles or droplets exiting from the wearer and
preventing them from being spread to the environment. Surgical masks often have a fluid-
resistant outer layer, which also protect the wearer against large droplets, splashes, or spray
of bodily or other hazardous fluids. While being reported effective in preventing spread of
influenza virus (Johnson et al. 2009), these loose-fitting masks are not typically considered
as proper respiratory protection, since they do not provide the wearer with a reliable level
of protection from inhaling small airborne particles, which can either penetrate through
mask materials (insufficient capturing efficiency) (Chen and Willeke 1992) or leak through
the gap between mask perimeter and wearer’s face (loose-fitting) (Oberg and Brosseau
2008). Nonetheless, due to the severe shortage of FFRs and the recommendations of
general publics to wear face-coverings when other social distancing measures are difficult
to maintain (Feng et al. 2020, WHO 2020d), loose-fitting face masks now become a major
measure of respiratory protection for general publics, first responder workers, and even
some frontline healthcare workers (mainly surgical masks in some low risk settings). While
performance of respirators are well evaluated and many studies on respirator
decontamination methods are reported (CDC 2020a, N95DECON 2020), the information
of filtration performance and possible decontamination and reuse strategy for face masks
is scarce.
SARS-CoV-2 is a large size virus with a total size of ~ 0.06 to 0.14 µm (Lim et al.
2016, Zhu et al. 2020). Human exhalation droplets can be several micrometers or larger
(Anfinrud et al. 2020), but shrink while traveling in air due to water evaporation. Dried
droplet nuclei are usually less than 5 µm in diameter (Hsiao et al. 2020), and therefore can

183
remain suspended in air for a longer period of time, and travel a further distance away (Yu
et al. 2004). Efficiency of filter media is a strong function of particle size and filtration
velocity, as various filtration mechanisms (e.g. diffusion, interception, impaction,
electrostatic capturing, etc.) work effectively at different size and velocity (Brown 1993,
Hinds 2012, Ou et al. 2017), which yields a least efficient size, namely most-penetrating
particle size (MPPS). Under the range of normal operation conditions, most mechanical
filters have a MPPS between 100 and 300 nm, while electret filters, which most
commercial respirators and face masks are made of, have smaller MPPS typically below
80 nm. In United States, respirators are approved by National Institute for Occupational
Safety and Health (NIOSH), by testing well-sealed respirator at a flowrate of 85 L/min
using charge neutralized polydisperse sodium chloride (NaCl) particles with a count
median diameter (CMD) of 0.075 ± 0.02 μm and a geometric standard deviation (GSD) of
less than 1.86 (NIOSH 2019). A mass integrated efficiency is then determined by a light
scattering based photometer. Surgical masks, differently, are cleared by the Food and Drug
Administration (FDA), by reviewing data supplied by the manufacturers that is collected
from third-part independent testing laboratories. A wide range of testing flowrate or face
velocity is implemented for testing face masks, and different sometimes confusing
efficiencies (e.g., PFE, BFE, VFE, etc.) are reported (Rengasamy et al. 2017). In view of
the lack of a universal standard for testing respirators and various face masks side-by-side,
in our work, fractional efficiency measurement was conducted which provides efficiency
at a series of particle sizes from 30 to 400 nm, covering the MPPSs of all samples tested.
Various disinfection methods have been tested for decontaminating filtering
facepiece respirators, and a comprehensive review of these studies is available at

184
N95DECON website, a scientific consortium for data-driven study of N95 filtering
facepiece respirator decontamination (N95DECON 2020). Among all these methods, US
Center for Disease Control and Prevention (CDC) (2020a) has identified three most
promising ones: vaporous hydrogen peroxide (VHP) (Battelle 2016, Bergman et al. 2018),
ultraviolet germicidal irradiation (UVGI) (Lindsley et al. 2015, Viscusi et al. 2009), and
moist heat (Bergman et al. 2018). Steam treatment (Fisher et al. 2011, Heimbuch et al.
2011) and liquid hydrogen peroxide (Bergman et al. 2018) are listed as promising methods
with some limitations. All these methods are evaluated for respirators only and are mainly
targeted for reuse by healthcare workers. In our study, we attempted to extend the scope a
little further to include the decontamination of loose-fitting face masks and some
alternative materials that have been used for making respirators/masks under this crisis,
and the reuse purpose for both healthcare workers and general publics. Because of that,
among all applicable decontamination methods being reported to be efficient in
deactivating COVID-19 and other pathogens, we excluded methods that require
sophisticated equipment and professions (e.g. VHP), and chose UVGI in view of its wide
availability in hospitals and small clinics and the heat treatments (both dry oven heat and
water steaming) for simple household applications. Filtration performance were evaluated
to assess if these decontamination methods can be implemented without compromising the
function of respirators/masks. Although it has been well reported that isopropanol (IPA)
cannot be used to disinfect respirators as it removes charges so that lead to filtration
deterioration, its possible application for disinfecting non-electret alternative respirator
material was evaluated in this study.

185
10.2 Experimental Method and Material
10.2.1 Decontamination Methods
For the ultraviolet germicidal irradiation (UVGI) method, the respirator/mask
samples were hung between a Xenex LightStrike Germ-Zapping Robots and a UV
reflective wall, both < 1m away from the samples. The UV-C light from the source machine
and the reflected illumination irradiated the samples for 5 minutes. For the oven heating
method, 77oC (170oF) was chosen because it is the lowest temperature setting for most
household ovens, and Covid-19 virus is reported deactivated at 70oC (Chin et al. 2020). At
the target temperature, the respirators/masks were placed on a stack of coffee filters inside
the oven without touching any metal surfaces to prevent thermal damage and heated for 30
minutes. For the steam heat treatment method, the respirators/masks were placed on the
rack of a steamer with boiling water for 30 minutes. For isopropanol (IPA) soaking, test
samples were soaked in 75% IPA-water solution for 10 min and let dry overnight.
10.2.2 Filtration Performance Testing
A round piece of filtration materials with 40 mm diameter was cut from each
sample and secured in a stainless-steel filter holder with gaskets sealing around the edge
on both sides to prevent air leakage. The breathing resistance of the materials was
determined by measuring the differential pressure drop across test samples under testing
filtration velocity of 10.5 cm/s, which is equivalent to 85 L/min across a filtration area of
135 cm2. 85 L/min is the standard flowrate at which NIOSH certifies N95s, and 135 cm2
is the lower end of filtration surface area of typical commercial N95 respirators. The choice
of lower end value is to ensure our measurement represents the worst scenario, as filtration

186
performance deteriorates with increasing filtration velocity. As a reference, 3M 8210 N95
respirator has an effective surface area of 150 to 170 cm2, depending on how it is sealed
for standard NIOSH N95 certification test.
For particle filtering efficiency, a method called fractional efficiency measurement
was used. As depicted in Figure 9–1, NaCl nanoparticles generated from a Collision-type
atomizer (TSI 3076, Shoreview, MN) were employed as challenging aerosol for fractional
efficiency measurement. The test particles were first passed through a diffusion dryer to
remove excess moisture from atomizer solution and bring the humidity level of the aerosol
below deliquescence relative humidity of NaCl. They were then sent into a Po-210
Staticmaster® Alpha Ionizer (0.5 mCi, NRD, LLC. Grand Island, NY) neutralizer and a
DMA, which act as a size selector and only allow NaCl particles with a narrow mobility
range to exit. To save time, the NaCl solution concentration was not changed during the
measurement, but the number mode was kept at slightly below 65 nm to minimize the
multiple charge effect in mobility classification for large particles. The size-selected
particles were then passed through another Po-210 neutralizer (0.5 mCi) to bring the charge
level of these charged particles to a Boltzmann equilibrium charge distribution (Liu and
Pui 1974, Wiedensohler 1988), a steady state distribution best representing the charge level
of ambient aerosols. This second neutralizer is particularly important for testing respirators
and masks, as most commercial units employ electret media which show much higher
efficiency on small (<100 nm) charged particles. The importance of testing with neutralized
(Boltzmann equilibrium) aerosol was overlooked by a recent publication with similar
topics (Konda et al. 2020), in which un-conditioned aerosols from a mechanical nebulizer
was employed, whose inherent high charge level would cause overestimation of filtration

187
efficiency. The neutralized test particles were then mixed with dilution air and sent into
filter holder, whose number concentrations upstream and downstream of test sample were
measured by a Condensation Particle Counter (TSI 3776, Shoreview, MN) with the
assistance of a pneumatic three-way switching valve. The fractional efficiency (FE) of the
sample was determined as 𝐹𝐸 = 1 −𝐶𝑑𝑛
𝐶𝑢𝑝/
𝐶𝑏𝑙𝑎𝑛𝑘,𝑑𝑛
𝐶𝑏𝑙𝑎𝑛𝑘,𝑢𝑝, where 𝐶𝑢𝑝 and 𝐶𝑑𝑛 are the number
concentrations of NaCl particles at upstream and downstream of the sample, and 𝐶𝑏𝑙𝑎𝑛𝑘,𝑢𝑝
and 𝐶𝑏𝑙𝑎𝑛𝑘,𝑑𝑛 are the number concentrations of NaCl particles at upstream and downstream
of the filter holder when no sample presents. The calculated FE accounts for particle
transportation loss in the test system. FE was determined for 8 sizes spanning from 30 to
400 nm, which covers the MPPS of both electret and mechanical filtration materials.
10.3 Results and Discussion
Three commercially available respirator and mask samples were selected as the
major data set of this study, namely 3M 8210 N95 respirator, Halyard 48207 surgical mask,
and 3M 1820 procedure mask. Additionally, 2 other materials that are reported being used
for making respirators/masks under Covid-19 pandemic were selected. One is Halyard
H600 one-step fabric sterilization wrap, which was first proposed as alternative mask
material by a team at University of Florida who has a pending patent on this (University of
Florida 2020). The other material, named as EX101, was donated by Cummins Inc. to
University of Minnesota as part of a project to supply masks to Minnesota’s M Health
Fairview network (Businesswire 2020, University of Minnesota 2020).

188
All the 3 commercial respirator and masks and Halyard H600 fabrics have
electrostatic charges on their fiber surface, which help to boost filtration efficiency without
causing extra breathing resistance. However, these charges may be completely or partially
removed by some sterilization methods, which could negatively impact the selection of
decontamination and reuse strategy for these materials. EX101 is a pure mechanical
filtration material with no electric charge on it. It was made of polymer fibers: PBT
polyester, Nylon 6-6, and PET polyester in different layers.
10.3.1 Base Performance Before Decontamination
Filtration efficiency and breathing resistance of all the five materials are measured
first without any decontamination treatment was conducted, which is summarized in Figure
10–1(a). Among all five materials, N95 respirator material and EX101 media have the
highest level of efficiency, greater than 95% over the entire size range between 0.03 to 1.0
µm. All three commercial respirator and masks show similar trends of increasing efficiency
with particle size, suggesting they all possess high level of electrical charge on their fiber
surface. Unlike N95 respirator having efficiency greater than 95%, surgical mask and
procedure mask tested have efficiency around 80-90% and 70-80% respectively in the
range of 0.03 to 0.4 µm. Their efficiency increased sharply after 0.4 µm, to greater than
95% at 1.0 µm, attributed to the improved capture by interception and inertia impaction.
Since the efficiency keeps increasing and stays high after 0.4 µm for all 5 materials, only
the results between 0.03 and 0.4 µm are reported in the rest part of the paper. EX101 has a
MPPS at ~ 0.1 µm, which is typical for pure mechanical filter with small fiber diameter at

189
this face velocity (10.5 cm/s). The shortcoming of achieving N95 level of efficiency
without an assistance from electrostatic charge is the highest breathing resistance (323 Pa
@ 10.5 cm/s) among all, which though is still below NIOSH’s limit of 343 Pa for an N95
respirator. This breathing resistance can be further reduced by making masks with larger
effective filtration area. H600 sterilization wrap has the lowest efficiency and the second
highest breathing resistance among all. It is a surprise that its efficiency is only marginally
lower than 3M procedure mask, given that this material is not originally designed as a
filtration material, which is mainly because it has certain level of electrical charge on its
fibers. This is known by comparing its filtration with that of a 75% isopropanol-soaked
sample as discussed later. It is worth mentioning that the sterilization wrap is more plastic
than most non-woven face masks, potentially providing better facial fit than loose-fitting
masks, although this advantage is partially offset by its higher breathing resistance (causing
more pressure driven facial leak). All the three commercial respirator and masks have flow
resistance around 50-75 Pa, which agrees with previous measurement (Kim et al. 2015). A
recent study (Konda et al. 2020) measured significantly lower flow resistance at as low as
10-15 Pa may suggest leaks in their test apparatus.
For a better comparison among all the five materials, their quality factor (Q) is
determined by
Q = −ln (1−𝐸𝑓𝑓)
∆𝑃,
where Eff is the fractional efficiency at certain size, while ΔP is the differential pressure
drop (breathing resistance). Quality factor represents a tradeoff between efficiency and
resistance of a filtration material under a specified operating condition (e.g., face velocity,
temperature, etc.), with a higher value preferable. It is clearly seen from Figure 10–1(b),

190
that 3M 8210 respirator has much higher quality factor than the other materials as it is one
of the highest efficient and the least resistant material among all five tested. With the
assistance of electrostatic capturing, both surgical mask and procedure mask have decent
quality factor that is higher than typical filtration materials at this face velocity. As a pure
mechanical material, the quality factor of EX101 media is among the top tier and is even
slightly higher than H600 sterilization wrap which has electrical charge on it. The non-
electret nature of EX101 makes it more tolerant to various decontamination methods,
which will be demonstrated later.
Figure 10–1. Fractional efficiency (a), breathing resistance, and quality factor (b) of 3M
8210 respirator, Halyard 48207 surgical mask, 3M 1820 procedure mask, Halyard H600
sterilization wrap, and Cummins EX101 material, before any decontamination treatments
10.3.2 Decontamination by Isopropanol Alcohol
It is well reported that isopropanol alcohol and soap can cause filtration degradation
of N95 respirators (Viscusi et al. 2009), and the purpose of this set of test is mainly to
confirm if similar degradations can be found on other face mask materials and alternative
respirator/mask materials. As shown in Figure 10–2, after only one treatment, significant
3M™ 8210
Halyard 48207
Surgical Mask
3M™ 1820
Procedure Mask
Halyard H600
Sterilization Wrap
EX101
(a)
Effic
iency [
--]
65%
70%
75%
80%
85%
90%
95%
100%
Particle Mobility Diameter [µm]
0.1 1
73.0 72.751.2
159.0
323.0
Diffe
ren
tial P
ressure
@ 1
0.5
cm
/s [
Pa]
0
50
100
150
200
250
300
350
400
3M™
821
0
Halya
rd 4
8207
Sur
gica
l Mas
k
3M™
182
0
Pro
cedu
re M
ask
Halya
rd H
600
Ste
rilizat
ion
Wra
pEX10
1
Breathing Resistance
(b)
Fig
ure
of M
eri
t [P
a-1
]
0.01
0.02
0.05
0.1
Particle Mobility Diameter [µm]
0.1 1

191
decay in efficiency was found in all the materials except for EX101 which is a non-electret
media. For all four electret media, the degree of efficiency degradation increases with
particle size, resulting in MPPS shift towards larger size from below 30 nm (except for
sterilization wrap at 100 nm) before the treatment to 150-300 nm afterwards. The shift of
MPPS towards larger size is a strong indication that the drop in efficiency level is due to
charge loss rather than structural change or integrity degradation. Another evidence of this
conclusion is the unchanged breathing resistance level, which is also shown in Figure 10–
2. Exposure to organic solvents such as isopropanol, acetone, xylene, toluene, and benzene
has been reported to increase charge mobility in polypropylene fibers, subsequently
reducing the electrostatic charge on the fibers and their ability of capturing particles (Jasper
et al. 2006, Kim et al. 2009a).
Although not as significant as others, EX101 also shows a slight drop in efficiency
with an unchanged MPPS at 100 nm. At this size, it is 90.5% efficient after treatment
comparing to 95.7% of untreated media. The change is likely from the loss of small fibers
when IPA soaks into the material’s micro-structures or evaporates from its fiber surface. It
is worth noting that although the IPA soaked EX101 sample has an efficiency below 95%
at MPPS (100 nm), it may still pass N95 certification for two reasons: (1) photometer based
NIOSH N95 certification test puts more weight on the efficiency at ~ 300 nm; and (2) the
sample would have been tested under a low face velocity if a respirator was made with
greater than 135 cm2 effective filtration area, which is the case for most commercial
respirators. For further justification, an integrated mass efficiency was calculated by
assuming a lognormal test aerosol distribution with a count median diameter at 75 nm and

192
a geometric standard deviation of 1.86. The calculated mass weighted efficiency was
95.18%.
Instead of soaking, a gentler treatment was then implemented by spraying 75%
isopropanol-water solution onto media surface using a small garden sprayer. Almost
identical level of efficiency degradations was found on all four electret materials,
suggesting that the small amount of IPA droplets generated is sufficient to almost fully
discharge all electrical charges on electret fiber surface. This result suggests that attentions
should be paid to avoid direct contact of alcohol liquid or vapor with respirators and face
masks, especially in hospitals and clinics where alcohol or other disinfection agents are
used routinely. One example of that is adjusting/touching respirators/masks immediately
after using hand sanitizer. Unlike IPA soaked case, no efficiency degradation was observed
on IPA sprayed EX101 sample, indicating the nanofibers are strong enough to retain their
structure when contacting with small amount of IPA droplets.
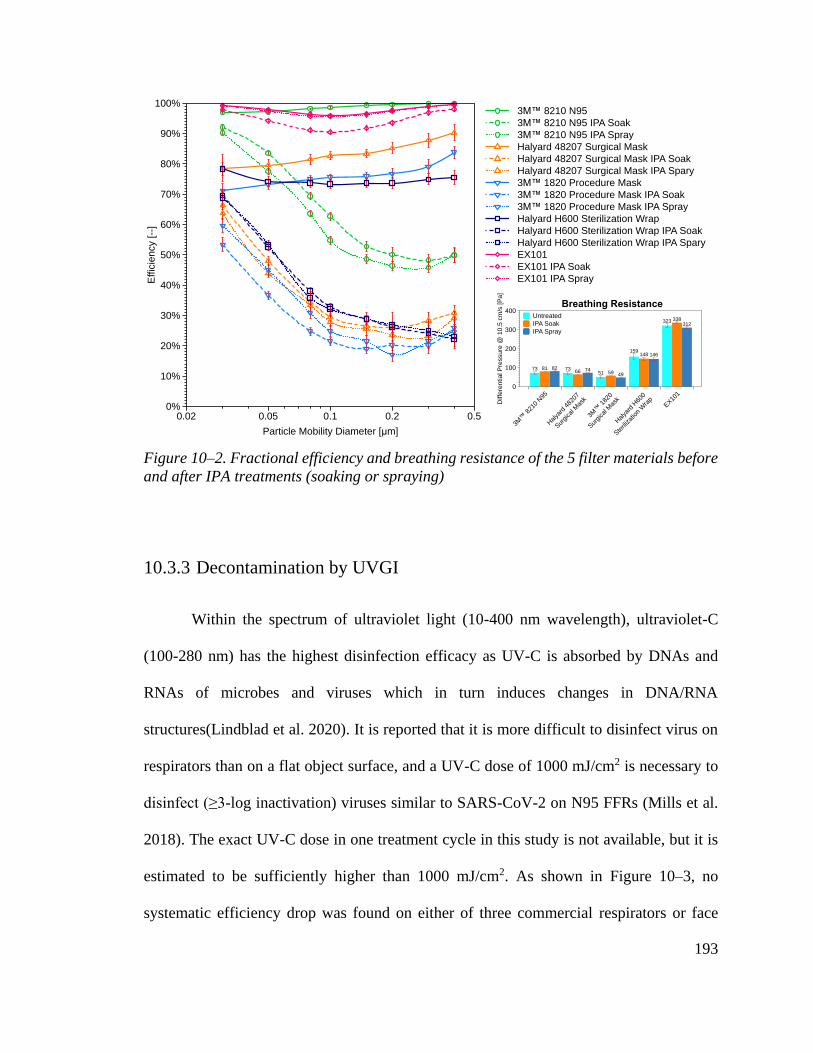
193
Figure 10–2. Fractional efficiency and breathing resistance of the 5 filter materials before
and after IPA treatments (soaking or spraying)
10.3.3 Decontamination by UVGI
Within the spectrum of ultraviolet light (10-400 nm wavelength), ultraviolet-C
(100-280 nm) has the highest disinfection efficacy as UV-C is absorbed by DNAs and
RNAs of microbes and viruses which in turn induces changes in DNA/RNA
structures(Lindblad et al. 2020). It is reported that it is more difficult to disinfect virus on
respirators than on a flat object surface, and a UV-C dose of 1000 mJ/cm2 is necessary to
disinfect (≥3-log inactivation) viruses similar to SARS-CoV-2 on N95 FFRs (Mills et al.
2018). The exact UV-C dose in one treatment cycle in this study is not available, but it is
estimated to be sufficiently higher than 1000 mJ/cm2. As shown in Figure 10–3, no
systematic efficiency drop was found on either of three commercial respirators or face
3M™ 8210 N95
3M™ 8210 N95 IPA Soak
3M™ 8210 N95 IPA Spray
Halyard 48207 Surgical Mask
Halyard 48207 Surgical Mask IPA Soak
Halyard 48207 Surgical Mask IPA Spary
3M™ 1820 Procedure Mask
3M™ 1820 Procedure Mask IPA Soak
3M™ 1820 Procedure Mask IPA Spray
Halyard H600 Sterilization Wrap
Halyard H600 Sterilization Wrap IPA Soak
Halyard H600 Sterilization Wrap IPA Spary
EX101
EX101 IPA Soak
EX101 IPA SprayEffic
iency [
--]
0%
10%
20%
30%
40%
50%
60%
70%
80%
90%
100%
Particle Mobility Diameter [µm]
0.02 0.05 0.1 0.2 0.5
73 7351
159
323
8166 59
148
338
82 7449
146
312
Untreated
IPA Soak
IPA Spray
Diffe
rential P
ressure
@ 1
0.5
cm
/s [
Pa
]
0
100
200
300
400
3M™
821
0 N95
Halya
rd 4
8207
Sur
gica
l Mas
k
3M™
182
0
Sur
gica
l Mas
k
Halya
rd H
600
Ste
rilizat
ion
Wra
pEX10
1
Breathing Resistance

194
masks after up to 10 cycles. Since the filtration performance testing in this study is a
destructive method, to save precious PPEs, only one sample was prepared for each
decontamination method and treatment cycle combination. The small fluctuations (within
2% for N95s, 11% for surgical mask, and 8% for procedure mask) observed can be mainly
attributed to variation among different pieces of samples. N95s were reported to keep
integrity and fit at higher dose of UV-C light (Heimbuch et al. 2011, Lindsley et al. 2015).
Despite of sample variation, which is shown as efficiency fluctuation evenly over size
range of 30-400 nm, no efficiency decay associated with charge loss can be identified,
which would otherwise show higher efficiency reduction in larger sizes. This results are in
agreement with previous experiments (Bergman et al. 2018, Viscusi et al. 2009, Viscusi et
al. 2011), suggesting UVGI can be an option to decontaminate respirators and face masks
under the shortage caused by Covid-19 without causing degradation in filtration.
As one of the standard disinfection methods used in hospitals, UVGI generally has
larger availability than other recommended respirator decontamination options (e.g., VHP)
for hospitals. Question however remains open about UV-C’s ability of penetrating deeply
into melt-blown materials, which is made of polypropylene, a UV absorber. The amount
of penetration was found to vary largely among N95 models (Fisher and Shaffer 2011).
Higher UV-C dose may be necessary to disinfect other pathogens that are less susceptible.
Both concerns require higher UV-C dose, leading to longer irradiation period. Some studies
(Heimbuch and Harnish 2019, Mills et al. 2018) demonstrated residual virus on respirator
straps after UVGI treatment (likely due to the factor that the straps twist so as be shielded
from UV-C irradiation), suggesting a subsequent disinfection of straps are necessary. The

195
consideration of UV shading also requires that respirators and masks cannot be stacked
during the treatment, which further limits the decontamination throughput of this method.
Figure 10–3. Fractional efficiency (a-c) and breathing resistance (d) of N95 respirator,
surgical mask, and procedure mask after multiple UVGI treatment cycles
10.3.4 Decontamination by Thermal Treatments
Among all potential decontamination methods, thermal treatment is the most
applicable one for the general public to implement in household setting, because of its
simple procedure and the high availability of various ways of heat generation at home. For
the same reason, methods requiring sophisticated humidity control are not evaluated due
3M™ 8210 N95 Untreated
3M™ 8210 N95 1 cycle
3M™ 8210 N95 3 cycles
3M™ 8210 N95 5 cycles
3M™ 8210 N95 10 cycles
UVGI Treatment
(a)
Effic
ien
cy [--
]
90%
92%
94%
96%
98%
100%
Particle Mobility Diameter [µm]
0.02 0.05 0.1 0.2 0.5
Halyard 48207 Surgical Mask Untreated
Halyard 48207 Surgical Mask 1 cycle
Halyard 48207 Surgical Mask 3 cycles
Halyard 48207 Surgical Mask 5 cycles
Halyard 48207 Surgical Mask 10 cycles
UVGI Treatment
(b)
Effic
ien
cy [--
]
60%
65%
70%
75%
80%
85%
90%
95%
100%
Particle Mobility Diameter [µm]
0.02 0.05 0.1 0.2 0.5
3M™ 1820 Procedure Mask Untreated
3M™ 1820 Procedure Mask 1 cycle
3M™ 1820 Procedure Mask 3 cycle
3M™ 1820 Procedure Mask 5 cycle
3M™ 1820 Procedure Mask 10 cycle
UVGI Treatment(c)
Effic
ien
cy [--
]
60%
65%
70%
75%
80%
85%
90%
95%
100%
Particle Mobility Diameter [µm]
0.02 0.05 0.1 0.2 0.5
Untreated
1 cycle
3 cycles
5 cycles
10 cycles
(d)
Diffe
ren
tia
l P
ressure
@ 1
0.5
cm
/s [
Pa
]
0
20
40
60
80
100
120
3M™ 8210 N95 Halyard 48207
Surgical Mask
3M™ 1820
Surgical Mask

196
to its relatively low feasibility at home, although there is evidence showing that higher
humidity will better inactivate viruses similar to SARS-CoV-2 (McDevitt et al. 2010). A
dry heat temperature of 77oC (170oF) was chosen as it is the lowest temperature setting of
most household ovens, and a recent evidence showed that dry heat at 70oC for 30 min can
achieve 1.9-log activity reduction, which further increased to 3.3-log if the treatment
duration was extended to 60 min (Fischer et al. 2020). Each treatment cycle was chosen to
be 30 min in this study considering a slightly higher temperature was used and the relatively
low exposure risk for general publics. As shown in Figure 10–4 (a1-a6), dry heat at 77oC
did not cause any observable efficiency degradation of the 3 commercial respirator/mask
materials after 10 cycles. Similar to UVGI method, small fluctuations were observed which
can be attributed to sample variation rather than any systematic efficiency deterioration for
the reason explained above already. A slight change of MPPS from below 30 nm to 50 nm
was found on 3M 8210 N95 respirators, implying a subtle loss on charge level which is not
sufficient to yield any practically meaningful performance degradation. For sterilization
wrap, after the first treatment, ~10-15% of reduction was observed at sizes greater than 100
nm, suggesting certain degree of charge loss occurred at high temperature. Further dry heat
treatment for multiple cycles (up to 10 cycles) did not seem to cause further filtration
degradation. Similar to sterilization wrap, EX101 experienced slight (<5%) efficiency drop
after first dry heat treatment, but further reduction was not observed after multiple cycles
(up to 10). No MPPS change was observed on EX101, indicating the efficiency drop is
likely due to small amount of structure change (likely loss of nanofiber).
Although a precise control of humidity in thermal treatment is not an easy
implementation in household, steam heat treatment can be a feasible alternative high

197
humidity option which keeps the moisture level near or above saturation. Recent studies
demonstrated SARS-CoV-2 (Kumar et al. 2020) and bacteriophage MS2 (Massey et al.
2020) viruses can be deactivated by autoclave or microwave generated steam in shorter
treatment time (≤ 15 min). As illustrated in Figure 10–4 (b1-b6), although 3M 8210 N95
respirator retained its efficiency after 10 cycles, efficiency decay was observed on surgical
mask (after 5 cycles), procedure mask (after 10 cycles), and sterilization wrap (after 1
cycle). The efficiency reduction is more pronounced at larger sizes, causing shift of MPPSs
from below 30 nm to ~ 200 nm, which is a strong indication of charge loss during the
treatments. The almost unchanged breathing resistance provided further evidence that
change of material integrity or micro-structure is not the major source of efficiency
degradation. Polypropylene is hydrophobic, but water can condense on polypropylene fiber
surface under super-saturation, which could potentially deteriorate surface charge by an
unknown mechanism that requires more study. Accelerated charge degradation on corona-
charged polypropylene fibers has been reported when conditioned at higher humidity levels
(Motyl and Łowkis 2006). Similar to dry heat case, steam heat induced small (<5%)
efficiency drop on EX101 samples, which is likely attributed to loss of nanofibers.
Besides the filtration efficiency of the material, another important property of a
respirator or mask is the fit, which measures the seal between the respirator/mask and the
wearer’s face. An annual fit test is required when a healthcare worker needs to wear a tight-
fitting respirator, such as a 3M 8210 N95 respirator. The quantitative fit tests were
performed using a TSI PortaCount® Pro+ 8038 by a specific researcher in this study. The
fit factor, defined as the ratio of ambient particle concentration to the particle concentration
inside the respirator, should be equal to or above 100 to pass the test. The fit tests were first

198
performed with a new 3M 8210 N95 respirator and then performed after 1, 3, 5, and 10
cycles of 77oC dry heat treatments with the same respirator. A second 3M 8210 N95
respirator was fit tested after 0, 1, 3, 5, and 10 cycles of steam heat treatment. As shown in
Table 10–1, dry heat treatment deemed safe for the integrity and the fit of the respirator,
while the steam heat treatment caused the respirator fail in fit test after 5 treatment cycles.
It is worth noting that although all the fit tests were performed with the same person
wearing the respirator in order to minimize variation of wearers, the results reported here
should be considered as subject-dependent. Different fit factors should be expected if the
tests were performed on a different wearer, even if with the same respirator. The impact of
thermal treatment on respirator fit also varies by respirator model (Anderegg et al. 2020,
Bergman et al. 2018, Fischer et al. 2020, Kumar et al. 2020). Loose-fitting face masks were
not fit tested in current study. Although a fit test is not required, the overall efficacy of a
face mask’s respiratory protection is strongly affected by its ability to minimize facial leak
around edges. With more loose-fitting masks are used by frontline healthcare workers as
(sometimes the only) respiratory protection PPE, more study is urgently needed to quantify
the fit factor of these face masks over a wide particle size range in order to provide a
comprehensive assessment of their respiratory protection efficacy.
In summary, in terms of retaining both filtration efficiency and fit (tested for
respirators only), dry heat seems to be a better option over steam heat treatment, while
evidences (Fischer et al. 2020, Fisher et al. 2011, Heimbuch and Harnish 2019, Kumar et
al. 2020, Lore et al. 2012, McDevitt et al. 2010) suggested steam heat or moist heat (50-
85% RH) disinfect SARS-CoV-2 or similar viruses at shorter exposure time. Respirators
and masks can be heat treated in an enclosed rigid heat compatible container with small

199
amount of water added (less than 1 ml for 1.25 quart container size) to help maintain a
favorable 60-85% RH (Anderegg et al. 2020). It is suggested to keep the water amount low
to avoid steam generation which may negatively impact efficiency and fit. The authors
claim this method is scalable, so it can also be potential decontamination options at medium
or large quantities after the viral inactivation of SARS-CoV-2 on FFRs under the given
conditions can be confirmed.
Table 10–1. Quantitative fit testing results of the new N95 respirator and after oven and
steam heat treatment cycles.
Oven Treatment
Exercise New Cycles
1 3 5 10
Normal Breathing 200+ 200+ 200+ 200+ 200+
Deep Breathing 200+ 200+ 200+ 200+ 200+
Head Side to Side 200+ 200+ 200+ 200+ 200+
Head Up and Down 200+ 200+ 200+ 200+ 200+
Talking 135 134 124 170 125
Grimace Excl. Excl. Excl. Excl. Excl.
Bending Over 200+ 200+ 151 197 200+
Normal Breathing 200+ 200+ 200+ 200+ 200+
Overall Fit Factor 188 188 177 195 185
Moist Heat Treatment
Exercise New Cycles
1 3 5 10
Normal Breathing 200+ 200+ 191 109 141
Deep Breathing 200+ 200+ 200+ 184 179
Head Side to Side 200+ 200+ 92 43 51
Head Up and Down 200+ 165 101 72 99
Talking 135 86 80 56 58
Grimace Excl. Excl. Excl. Excl. Excl.
Bending Over 200+ 144 136 47 37
Normal Breathing 200+ 157 180 112 50
Overall Fit Factor 188 152 124 70 66
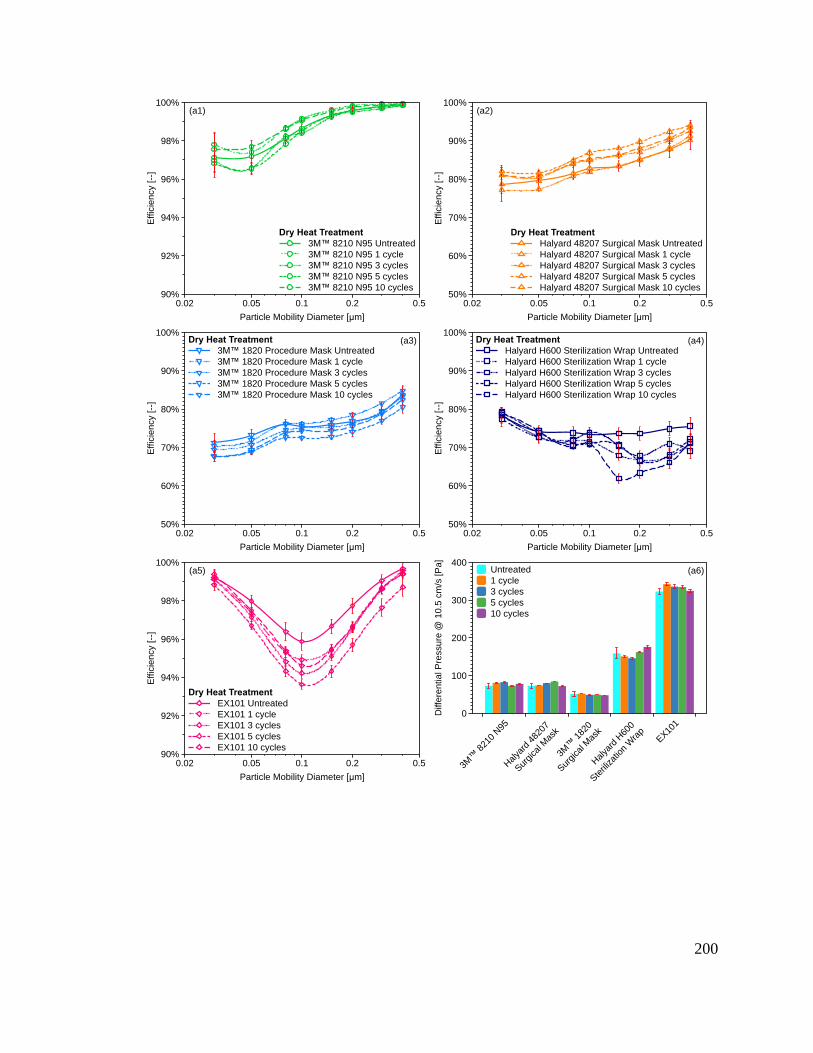
200
3M™ 8210 N95 Untreated
3M™ 8210 N95 1 cycle
3M™ 8210 N95 3 cycles
3M™ 8210 N95 5 cycles
3M™ 8210 N95 10 cycles
Dry Heat Treatment
(a1)
Effic
ien
cy [--
]
90%
92%
94%
96%
98%
100%
Particle Mobility Diameter [µm]
0.02 0.05 0.1 0.2 0.5
Halyard 48207 Surgical Mask Untreated
Halyard 48207 Surgical Mask 1 cycle
Halyard 48207 Surgical Mask 3 cycles
Halyard 48207 Surgical Mask 5 cycles
Halyard 48207 Surgical Mask 10 cycles
Dry Heat Treatment
(a2)
Effic
ien
cy [--
]
50%
60%
70%
80%
90%
100%
Particle Mobility Diameter [µm]
0.02 0.05 0.1 0.2 0.5
3M™ 1820 Procedure Mask Untreated
3M™ 1820 Procedure Mask 1 cycle
3M™ 1820 Procedure Mask 3 cycles
3M™ 1820 Procedure Mask 5 cycles
3M™ 1820 Procedure Mask 10 cycles
Dry Heat Treatment (a3)
Effic
ien
cy [--
]
50%
60%
70%
80%
90%
100%
Particle Mobility Diameter [µm]
0.02 0.05 0.1 0.2 0.5
Halyard H600 Sterilization Wrap Untreated
Halyard H600 Sterilization Wrap 1 cycle
Halyard H600 Sterilization Wrap 3 cycles
Halyard H600 Sterilization Wrap 5 cycles
Halyard H600 Sterilization Wrap 10 cycles
Dry Heat Treatment (a4)
Effic
ien
cy [--
]
50%
60%
70%
80%
90%
100%
Particle Mobility Diameter [µm]
0.02 0.05 0.1 0.2 0.5
EX101 Untreated
EX101 1 cycle
EX101 3 cycles
EX101 5 cycles
EX101 10 cycles
Dry Heat Treatment
(a5)
Effic
ien
cy [--
]
90%
92%
94%
96%
98%
100%
Particle Mobility Diameter [µm]
0.02 0.05 0.1 0.2 0.5
Untreated
1 cycle
3 cycles
5 cycles
10 cycles
(a6)
Diffe
rentia
l P
ressu
re @
10.5
cm
/s [P
a]
0
100
200
300
400
3M™
821
0 N95
Halya
rd 4
8207
Sur
gica
l Mas
k
3M™
182
0
Sur
gica
l Mas
k
Halya
rd H
600
Ste
rilizat
ion
Wra
pEX10
1

201
Figure 10–4. Fractional efficiency and breathing resistance of all five filter materials after
dry (a) and steam (b) heat treatments.
3M™ 8210 N95 Untreated
3M™ 8210 N95 1 cycle
3M™ 8210 N95 3 cycles
3M™ 8210 N95 5 cycles
3M™ 8210 N95 10 cycles
Steam Heat Treatment
(b1)
Effic
ien
cy [--
]
90%
92%
94%
96%
98%
100%
Particle Mobility Diameter [µm]
0.02 0.05 0.1 0.2 0.5
Halyard 48207 Surgical Mask Untreated
Halyard 48207 Surgical Mask 1 cycle
Halyard 48207 Sursgical Mask 3 cycles
Halyard 48207 Sursgical Mask 5 cycles
Halyard 48207 Sursgical Mask 10 cycles
Steam Heat Treatment
(b2)
Effic
ien
cy [--
]
50%
60%
70%
80%
90%
100%
Particle Mobility Diameter [µm]
0.02 0.05 0.1 0.2 0.5
3M™ 1820 Procedure Mask Untreated
3M™ 1820 Procedure Mask 1 cycle
3M™ 1820 Procedure Mask 3 cycles
3M™ 1820 Procedure Mask 5 cycles
3M™ 1820 Procedure Mask 10 cycles
Steam Heat Treatment (b3)
Effic
ien
cy [--
]
50%
60%
70%
80%
90%
100%
Particle Mobility Diameter [µm]
0.02 0.05 0.1 0.2 0.5
Halyard H600 Sterilization Wrap Untreated
Halyard H600 Sterilization Wrap 1 cycle
Halyard H600 Sterilization Wrap 3 cycles
Halyard H600 Sterilization Wrap 5 cycles
Halyard H600 Sterilization Wrap 10 cycles
Steam Heat Treatment (b4)
Effic
ien
cy [--
]
50%
60%
70%
80%
90%
100%
Particle Mobility Diameter [µm]
0.02 0.05 0.1 0.2 0.5
EX101 Untreated
EX101 1 cycle
EX101 3 cycles
EX101 5 cycles
EX101 10 cycles
Steam Heat Treatment
(b5)
Effic
ien
cy [--
]
90%
92%
94%
96%
98%
100%
Particle Mobility Diameter [µm]
0.02 0.05 0.1 0.2 0.5
Untreated
1 cycle
3 cycles
5 cycles
10 cycles
(b6)
Diffe
rentia
l P
ressu
re @
10.5
cm
/s [P
a]
0
100
200
300
400
3M™
821
0 N95
Halya
rd 4
8207
Sur
gica
l Mas
k
3M™
182
0
Sur
gica
l Mas
k
Halya
rd H
600
Ste
rilizat
ion
Wra
pEX10
1

202
10.3.5 Autoclave Treatment on Masks Made of Sterilization Wrap
Since first introduced as a N95 alternatives, the blue sterilization wrap has been
well adopted to make face masks over many hospitals and clinics in United States. As
discussed above, although not really N95 grade, this material does provide good protection
with efficiency similar to 3M procedure masks at about doubled breathing resistance.
Unused and worn masks made of this sterilization wrap were provided by a local clinic,
with all samples underwent an autoclave treatment at 132oC for 30 min after the last use
(if any) to minimize possible transmission of SARS-CoV-2 virus. Worn masks were used
in real clinic activities and were treated with autoclave after each work shift and were then
reused by the same person. 3 masks each were randomly selected after being wore and
autoclaved for 1 or 2 times. Selected unworn masks were autoclaved up to 4 times as
control groups. As can be seen in Figure 10–5, autoclaved unworn masks had slight
efficiency deterioration after only 1 treatment, mainly in large sizes, due to charge loss.
Multiple treatments caused further degradation, but the impact seemed to fade out after 2
treatments, with very similar efficiencies observed for samples with 2, 3, and 4 autoclave
treatments. The largest efficiency reduction after 4 treatments were within 20%.
On the other hand, worn masks showed much severer efficiency degradation even
after only one worn-autoclave cycle. The fact of no significant change in breathing
resistance and the shift of MPPS towards larger size both suggested the filtration
deterioration was from charge loss. The efficiency of the 3 masks worn by 1 shift reduced
by 18, 19, and 35% respectively at 300 nm. After 2 shifts, the reductions further developed
to 23, 36, and 43% respectively. The worst sample of 2-shift cases (#1) showed similar
efficiency to the IPA-soaked sterilization wrap (the same material the mask is made of),

203
indicating this sample lost almost all the electric charge on it. Respirators/masks used in
real world may be contaminated by saliva and mucus from human body or chemicals and
particles from ambient environment. These foreign objects may negatively impact the
efficiency of electret media by neutralizing or shading their electrical charges (Ji et al. 2003,
Mahdavi et al. 2015, Raynor and Chae 2004), which cannot be recovered by
decontamination. Another possible mechanism causing charge loss is the moisture (from
human exhalation) condensation on filter fibers. The subsequent water molecule
evaporation from fiber surface could potentially lead to electron exchange, which
neutralizes the electric dipoles gradually over repetitive exhalation (condensation) and
inhalation (evaporation) cycles. This hypothesis may also help to explain the mild filtration
degradation after multiple steaming treatment cycles. Although testing of more field-used
respirators/masks is needed to confirm this observation and further investigation is
necessary to validate our hypothesis or any other potential mechanisms, the result from
limited field-used samples here rises a question that if decontamination tests conducted on
unworn respirators and masks are sufficient to provide appropriate representation of their
real-world counterparts being worn and subsequently decontaminated for multiple times.
Various decontamination methods may be proven to not cause filtration degradation by
themselves even after 10-20 cycles. The normal human wearing activities, however, may
cause irreversible filtration deterioration that cannot be recovered by these
decontamination methods. If this is proven true, it will negatively impact the current
decontamination and reuse strategy of respirators and masks and may largely limit the
number of times a respirator or mask can be reused.

204
Figure 10–5. Filtration performance of unworn and worn H600 sterilization wrap masks
after one or multiple cycle(s) of autoclave treatment. IPA soaked same material is included
for reference purpose
10.4 Conclusions
This research studied the effect of various decontamination methods on the
filtration performance of five selected commercial and alternative respirator/mask
materials. Both UVGI for 5 min and dry heat at 77oC for 30 min were found not to cause
observable performance degradation after up to 10 cycles on commercial respirators/masks
tested. Steam heat treatment for 30 min was found to cause charge loss on 3M 1820
procedure mask and Halyard 48207 surgical masks, which led to efficiency deterioration
after 5 or 10 cycles. Although similar efficiency decay was not observed on 3M 8210 N95
respirators, the respirators’ fit factor decreased with steam heat treatment cycles and
Unworn + N Autoclave Treatment(s)
0 Treatment
1 Treatment
2 Treatments
3 Treatments
4 Treatments
Worn 1 shift + 1 Autoclave Treatment
#1
#2
#3
Worn 2 shifts + 2 Autoclave Treatments
#1
#2
#3
IPA Soaked
IPA Soaked
159168177
139141 141
129
148150157
163
146
Diffe
rentia
l P
ressure
@ 1
0.5
cm
/s [P
a]
0
50
100
150
200
Unworn +
N Autoclave
Treatment(s)
Worn 1 shift +
1 Autoclave
Treatment
Worn 2 shifts +
2 Autoclave
Treatments
IPA Soaked
Breathing Resistance
Effic
ien
cy [--
]
20%
30%
40%
50%
60%
70%
80%
90%
100%
Particle Mobility Diameter [µm]
0.02 0.05 0.1 0.2 0.5

205
dropped below 100 (fail) after 5 cycles. As an easily accessible method, heat treatment can
be implemented by general publics in household setting, but our results suggested to keep
the moisture level below saturation if masks made of electret materials are decontaminated.
Both IPA soaking and spraying caused significant performance deterioration of all
electrically charged materials, including the three commercial respirators/masks and
Halyard H600 sterilization wrap, by largely removing charges from material surface. No
change of material integrity or structure was observed on any combination of filter
materials and decontamination methods tested, suggesting the stability of electrical charge
is the major factor (together with facial fit) that limits the ability of a material being
decontaminated and reused for multiple times. Non-electret filter materials (e.g. EX101),
therefore, pose their advantages of wider compatibility with a variety of decontamination
methods so more attention can be put on retaining the fit and the functionality of other
auxiliary components (e.g., straps, nose piece, etc.).
Fractional efficiency measurement approved to be a better method for
respirator/mask performance evaluation than any size integrated methods (e.g. NIOSH N95
certification test), by providing size-resolved efficiency information (Rengasamy and
Eimer 2012). When used for evaluating decontaminated respirators/masks, this method is
capable of distinguishing efficiency degradation due to charge loss from that caused by
structure or integrity deterioration, which is not otherwise possible by a size integrated
method.
The current study focused on the filtration performance of the filter materials, with
fit testing conducted only on N95 respirators with selected decontamination methods. With
more loose-fitting masks being used by frontline healthcare workers, assessing the facial

206
fit performance of these face masks, which is equally important to material filtration testing,
has become urgently needed and requires more immediate efforts. Moreover, the limited
results on sterilization wraps in this study implied that normal human wearing activity
could potentially cause irreversible charge loss and performance deterioration of electret
materials, which has been overlooked by most respirator/mask decontamination and reuse
studies. Decontamination tests on real-world used samples, together with the material
durability evaluation especially after extended reuse and multiple donning/doffing cycles,
are necessary to fully assess current decontamination and reuse strategy of respirators and
face masks.

207
Chapter 11: Summary and Future Work
This dissertation focuses on the effects of temperature and RH on filter loading by
simulated atmospheric aerosols and COVID-19 related mask and respirator filtration study.
There are two objectives of this dissertation: the first one is to fill the gap between lab filter
testing and actual filter operation; the second one is to help curb the COVID-19 spreading
from filtration perspective. Part 1 and Part 2 focus on the first objective, Part 3 covers the
second objective.
11.1 Effects of Temperature and RH on Filter Loading by Simulated
Atmospheric Aerosols
The structure of the first objective of this dissertation is shown in Figure 11–1. It is
aimed to study the discrepancy between lab filter testing and real filter operation and select
better filters.
Part 1 and Part 2 cover the methodology development, and research experiments,
respectively. Chapter 1 and Chapter 2 introduce the experimental apparatus used in this
dissertation. Chapter 3 is about a novel filter performance monitoring system, which can
report filter performance in real-time. Chapter 4 covers a database that can provide both
historical pollution and meteorological information of the city of interest so that air filters
can be recommended accordingly with the knowledge gained from this dissertation.

208
Figure 11–1. Structure of the first objective of this dissertation
Chapter 1 and 2 set the experimental apparatus foundation of this dissertation. To
study the effects of temperature and RH on filter loading, a Lab-simulated Ambient
Environment Air Filter Test Rig was built so that both temperature and RH could be well
controlled for filter testing in the laboratory. To simulate atmospheric aerosols, inorganic
hygroscopic salts ((NH4)2SO4, NH4NO3), soot and organic compounds coated soot were
employed. The techniques to generate atmospheric aerosols were established, including
dry and wet salt particles, fresh and aged soot, and mixture particles. In previous studies,
dry NaCl or KCl salt particles were used in filter testing. However, hygroscopic (NH4)2SO4
and NH4NO3 salt particles response at different RHs was carefully considered here so that
both dry and wet salt particles were employed for filter testing at various RHs. In previous

209
studies, only fresh soot was used in filter testing. Whereas, aged soot filter testing was
performed here, which can simulate ambient filtration scenario better.
Chapter 5 focuses on the temperature effect on filter loading. The testing
temperature covers from 5 ℃ to 50 ℃ and the testing RH covers from 30% to 75%. It is
found that temperature is a minor factor affecting the filter life. KCl and (NH4)2SO4
particles were tested in their dry state, and NH4NO3 was in its wet state, which represented
the different particle states in the atmosphere. From experiment results, RH plays a
significant role in affecting the filter life. In contrast, the temperature is a minor factor.
This confirms that filter testing RH should be well controlled while filters can be tested at
room temperature. Consequently, the following studies were performed at room
temperature.
Chapter 6 covers filter loading of the single-species particle at constant RH. In this
chapter, conventional cellulose filter media and nano-fiber coated cellulose filter media
were studied. It is found that in general, the higher the loading RH, the longer the filter life.
While the filter life of dry and wet particles is reversed on two types of filter media due to
the formation of the liquid film on the nanofiber layer. When the majority of challenging
particles are dry, the nano-fiber coated filter can last longer; while the conventional filter
can hold more wet particles. It is learned that filter selection should be cautious, and the
operating RH and challenging particles’ state should be considered.
Chapter 7 studied filter loading of the multiple-species particles at constant RH. In
Chapter 7, (NH4)2SO4-NH4NO3 mixture and organic compounds coated soot were studied
at constant loading RH. It is found that mass gains of salt mixture particles were complex
and depend on mixture particle composition and states, loading RH, and particle

210
dehydration history. The mass gain complexity is caused by the salt mixture hygroscopicity,
which has been proven complicated and unpredictable. This result suggests that filter
loading test should consider filter operating locations so that (NH4)2SO4-NH4NO3 mixing
ratio can change accordingly to better simulate filter operation. According to field study,
aged soot in the atmosphere is more compact than fresh soot. It is found that the test filter
can last longer when it is challenged by organic compounds coated soot, which is lab
simulated aged soot. This study implies that to better simulate ambient soot in lab filter
testing, the aging process should be considered. Chapter 7 reveals the complexity of filter
loading with particles that are similar to the ambient particulate pollutants at different
loading RHs and suggests the necessity of testing filters based on their operating conditions.
Chapter 8 investigated the effect of RH change on the hygroscopic loaded filters,
which is similar to the actual operating conditions since it is not realistic to have a constant
RH during ambient filter operation. It is found that for dry particle deposition, the higher
the conditioning RH, the lower the terminal pressure due to moisture absorption induced
restructuring. For wet particles, the elevated conditioning RH can prompt pressure
reduction by introducing more water to salt deposits. However, the lowered conditioning
RH would not cause a pressure reduction. This study broadens the understandings of RH
change effect on the hygroscopic particles loaded filters. Also, the possibility of utilizing
the hygroscopic particle to prolong filter life or clean filters could be considered.
The ultimate goal of this objective is to recommend filters based on operating
locations. Whereas it is still challenging to achieve filter selection and optimization based
on all research mentioned above. Therefore, in Chapter 4, a Global Air
Pollutant/Meteorological Condition Database was established. For a city of interest, this

211
database can report historical pollutants speciation and concentration, historical monthly
average temperature and RH, and pollutants concentration trend in past years. Before
making decisions, the local filter operation conditions could support filter selection and
optimization. Air filters can be customized in the future to accommodate different needs.
Meanwhile, even with the customized filter for different locations, the actual filter
performance is still not well known. Chapter 3 solves this problem by prototyping a Smart
Sensor for Filter Performance Monitoring System. With such a system, real-time filtration
efficiency, differential pressure across the filter, and operating temperature, RH are all
available to closely monitor the filter performance. This system was tested on an indoor air
purifier to validate the concept and it was justified that such a filter performance monitoring
system is effective and convenient. This system could be customized to fit all air filter
applications, which can open the black box of air filter operation. With millions of system
installations, massive filter operation data could be received. With the advantage machine
learning tool and big data analysis, filter manufactures could understand the direction of
the optimization clearly. End-users can stay assured that filtered air qualifies for their needs,
and occupants’ health and equipment are well protected as desired.
Both the Global Air Pollutant/Meteorological Condition Database and Smart
Sensor for Filter Performance Monitoring System could help close the loop of this study
(Figure 11–1). The discrepancy between the conventional filter testing and the actual filter
operation is minimized by studies in this dissertation. With more stringent pollution control
in past decades, sub-micron particulate pollutants are concerned. This dissertation extends
the understandings of filter testing and operating with sub-micron particulate pollutants at

212
different operating conditions, which will benefit both the scientific research and the
filtration industry.
11.2 COVID-19 Related Mask and Respirator Filtration Study
COVID-19 was characterized as a pandemic by WHO on March 11, 2020, and it is
a global challenge for the world since then. Center for Filtration Research is one of the
leading filtration research centers in the world, and several COVID-19 related mask and
respirator filtration studies were conducted at the Center for Filtration Research. Two of
them are included in this dissertation.
Chapter 9 compared common materials that have the potential to be used as
alternative masks for the public in daily protection to slow down COVID-19 spread. Both
commercially available respirators and masks were evaluated to establish references for
fractional efficiency and breathability. Furnace filters, vacuum cleaner filters, common
household materials were tested in the same method. It is found that electret media has a
good balance between filtration efficiency and breathability, which could be an emergency
option at the current COVID-19 pandemic. Besides, stacking several layers of fabrics could
also offer protections while maintaining reasonable breathing resistance. The conclusions
of this study are not only useful during the current pandemic, but also applicable to severe
pollution episodes while respirators or masks are not available.
Chapter 10 aimed to evaluate the effect of decontamination of the commercial and
alternative mask and respirator materials from the filtration perspective. This study was
initiated by the desperate shortage of PPE of health care workers, and there were

213
suggestions of reusing respirators after decontamination. But there were also concerns that
decontamination may jeopardize the filtration capability of respirators or masks. In this
study, commercial and alternative mask and respirator materials underwent several
common decontaminations, including isopropanol alcohol, ultraviolet germicidal
irradiation, thermal treatment, and autoclave treatment, were tested for their fractional
efficiencies and breathabilities. It is found that ultraviolet germicidal irradiation and dry
heat treatment cannot cause observable efficiency decay for 10 cycles. However,
isopropanol alcohol and wet heat (steaming) could lead to efficiency deterioration. The
possible reason is the loss of charge on electret media since the similar efficiency decay
was not observed on a mechanical filter media. An N95 respirator fit factors evolution after
treatment cycles was also studied, which agrees with the media study that dry heat can
maintain efficiency while moist heat may lead to efficiency deterioration. It is also found
that normal breathing may lead to charge loss and subsequently efficiency decay, but
further investigation is needed.
11.3 Future Work
Though this dissertation drives the lab filter testing closer to the actual filter
operating condition, it could be improved in the following aspects:
1. This dissertation only tested conventional cellulose filter and nanofiber coated
cellulose filter. Another popular filter media, electret filter media, was not
tested. Luckily, several researchers are working on the electret media (Li et al.
2020, Wang et al. 2020). While the salt they chose was still limited to KCl and

214
NaCl. Different particle states and RH with (NH4)2SO4 and NH4NO3 should be
tested on the electret media to achieve a filter testing closer to the actual filter
operating. From the experience in the Part 3, moisture variation may lead to
charge loss on electret media, therefore such phenomenon should be considered
when electret media is tested at different RHs.
2. Limited efficiency measurements were achieved in this dissertation. Efficiency
evolution during the loading process at different RHs is also worthwhile to
study. For example, the wet NH4NO3 efficiency curve never reached 100% in
Section 6.1. Hence the extra caution is needed in the efficiency change during
the loading process.
3. In Chapter 7, soot was only coated with hydrophilic glutaric acid due to
university closure due to COVID-19 pandemic. The hydrophobic oleic acid
coating should be also conducted to compare the effect of coating
hygroscopicity on the filter performance. The testing RH close or above 100%
with both hydrophilic and hydrophobic coating should also be included. And
some other treatments that may prompt the hygroscopicity, such as UV, Ozone,
could be added in the future to better simulate the aging process in a continuous
flow system to test air filters.
4. In Chapter 8, only a single step RH change was performed. It is worthwhile to
study the filter efficiency and loading after the RH change, especially when
pressure drop declines. RH change could be a potential method to prolong the
filter life. Another future work that could be tested is the reverse pulse cleaning
process on filters that were loaded at high RH but conditioned at lower RH. The

215
solidified salt layer on the top of the filter may be peeled off easier than the high
RH salt paste.
For the COVID-19 related study, there are several studies worth studying:
1. The overall efficacy of masks when it is worn on a person. All studies presented
in this dissertation only tested the filtration efficiency of mask and respirator
materials. For tight-fitting respirators, the overall efficacy could be estimated
from media efficiencies when the wearer passed the fit testing. While it is
impossible to estimate the overall efficacy of the loose-fitting masks due to
leaks between the mask and wearer’s face. It is unclear that which one of the
two is more important to provide respiratory protection: the media efficiency or
the seal around wearer’s face. The answer is vital for loose-fitting masks
development.
2. The effect of the normal breathing on the electret media in mask and respirator.
The RH of the exhaled air is very high, while the inhalation process draws
ambient air, normally a lower RH air, through respirators or masks. The
alternation of the RH may cause water vapor condensation and evaporation on
the electret media. The cycling process may cause charge loss on the electret
media, which leads to efficiency deterioration. If normal breathing could cause
the efficiency decay, the reuse of respirators and masks should be reconsidered,
since the decontamination process cannot recover the filtration efficiency.
Therefore, it is worthwhile to study this topic.

216
Bibliography
3M (2020). "Coronavirus and Important Things to Know About Airborne Particles."
Retrieved Jun 2, 2020, from https://www.filtrete.com/3M/en_US/filtrete/home-
tips/full-story/~/coronavirus-and-important-things-to-know-about-airborne-
particles/?storyid=d69e7735-c02c-46d2-9c8a-ae23372934ac.
Adams, J. R. and Merz, A. R. (1929). "Hygroscopicity of Fertilizer Materials and Mixtures"
Industrial & Engineering Chemistry 21(4): 305-307. doi:10.1021/ie50232a003
Ahn, K. H., Kim, S. M., Jung, H. J., Lee, M. J., Eom, H. J., Maskey, S. and Ro, C. U.
(2010). "Combined use of optical and electron microscopic techniques for the
measurement of hygroscopic property, chemical composition, and morphology of
individual aerosol particles" Anal Chem 82(19): 7999-8009.
doi:10.1021/ac101432y
Anderegg, L., Meisenhelder, C., Ngooi, C. O., Liao, L., Xiao, W., Chu, S., Cui, Y. and
Doyle, J. M. (2020). "A scalable method of applying heat and humidity for
decontamination of N95 respirators during the COVID-19 crisis" PLoS One 15(7):
e0234851. doi:10.1371/journal.pone.0234851
Anfinrud, P., Stadnytskyi, V., Bax, C. E. and Bax, A. (2020). "Visualizing Speech-
Generated Oral Fluid Droplets with Laser Light Scattering" N Engl J Med 382(21):
2061-2063. doi:10.1056/NEJMc2007800
ASHRAE (2017). ASHRAE 52.2-2017 Method of Testing General Ventilation Air-
cleaning Devices for Removal Efficiency by Particle Size. Atlanta, GA.
ASHRAE (2020). "ASHRAE Position Document on Infectious Aerosols",
ASTM International. (2017). F2299/F2299M-03(2017) Standard Test Method for
Determining the Initial Efficiency of Materials Used in Medical Face Masks to
Penetration by Particulates Using Latex Spheres. West Conshohocken, PA;, ASTM
International.,.
ASTM International. (2019). F2101 − 19 Standard Test Method for Evaluating the
Bacterial Filtration Efficiency (BFE) of Medical Face Mask Materials, Using a
Biological Aerosol of Staphylococcus aureus, ASTM International.,.
Bae, S., Kim, M. C., Kim, J. Y., Cha, H. H., Lim, J. S., Jung, J., Kim, M. J., Oh, D. K.,
Lee, M. K., Choi, S. H., Sung, M., Hong, S. B., Chung, J. W. and Kim, S. H. (2020).
"Effectiveness of Surgical and Cotton Masks in Blocking SARS-CoV-2: A
Controlled Comparison in 4 Patients" Ann Intern Med 173(1): W22-W23.
doi:10.7326/M20-1342
Barthazy, E., Stetzer, O., Derungs, C., Saathoff, H. and Lohmann, U. (2006). Water uptake
of soot particles emitted from a Jing-CAST soot generator. 12th Conference on
Cloud Physics.
Battelle (2016). "Final report for the bioquell hydrogen peroxide vapor (HPV)
decontamination for reuse of N95 respirators.",

217
Bergman, M. S., Viscusi, D. J., Heimbuch, B. K., Wander, J. D., Sambol, A. R. and Shaffer,
R. E. (2018). "Evaluation of Multiple (3-Cycle) Decontamination Processing for
Filtering Facepiece Respirators" Journal of Engineered Fibers and Fabrics 5(4): 33-
41. doi:10.1177/155892501000500405
Boukhriss, M., Zhani, K. and Ghribi, R. (2013). "Study of thermophysical properties of a
solar desalination system using solar energy" Desalination and Water Treatment
51(4-6): 1290-1295. doi:10.1080/19443994.2012.714925
Bourouiba, L., Dehandschoewercker, E. and Bush, John W. M. (2014). "Violent expiratory
events: on coughing and sneezing" Journal of Fluid Mechanics 745: 537-563.
doi:10.1017/jfm.2014.88
Bourouiba, L. (2020). "Turbulent Gas Clouds and Respiratory Pathogen Emissions:
Potential Implications for Reducing Transmission of COVID-19" JAMA 323(18):
1837-1838. doi:10.1001/jama.2020.4756
Brown, R. C. (1993). Air Filtration: An Integrated Approach to the Theory and
Applications of Fibrous Filters, Elsevier Science. ISBN:9780080412740
Businesswire (2020). "Cummins and DuPont Partner to Use Filter Technology to Supply
Critical Material for N95 Respirator Masks." from
https://www.businesswire.com/news/home/20200406005502/en/Cummins-
DuPont-Partner-Filter-Technology-Supply-Critical.
Butt, H. J. and Kappl, M. (2009). "Normal capillary forces" Adv Colloid Interface Sci
146(1-2): 48-60. doi:10.1016/j.cis.2008.10.002
Cao, Q., Pui, D. Y. H. and Lipiński, W. (2015). "A Concept of a Novel Solar-Assisted
Large-Scale Cleaning System (SALSCS) for Urban Air Remediation" Aerosol and
Air Quality Research 15(1): 1-10. doi:10.4209/aaqr.2014.10.0246
Cao, Q., Huang, M., Kuehn, T. H., Shen, L., Tao, W.-Q., Cao, J. and Pui, D. Y. H. (2018a).
"Urban-scale SALSCS, Part II: A Parametric Study of System Performance"
Aerosol and Air Quality Research 18(11): 2879-2894.
doi:10.4209/aaqr.2018.06.0239
Cao, Q., Kuehn, T. H., Shen, L., Chen, S.-C., Zhang, N., Huang, Y., Cao, J. and Pui, D. Y.
H. (2018b). "Urban-scale SALSCS, Part I: Experimental Evaluation and Numerical
Modeling of a Demonstration Unit" Aerosol and Air Quality Research 18(11):
2865-2878. doi:10.4209/aaqr.2018.06.0238
CDC (2020a). "Decontamination and Reuse of Filtering Facepiece Respirators." Retrieved
Aug 1, 2020, from https://www.cdc.gov/coronavirus/2019-ncov/hcp/ppe-
strategy/decontamination-reuse-respirators.html.
CDC (2020b). "Clinical Questions about COVID-19: Questions and Answers." Retrieved
May 26, 2020, from https://www.cdc.gov/coronavirus/2019-
ncov/hcp/faq.html#Transmission.

218
CDC (2020c). "Use of Cloth Face Coverings to Help Slow the Spread of COVID-19."
Retrieved May 26, 2020, from https://www.cdc.gov/coronavirus/2019-
ncov/prevent-getting-sick/diy-cloth-face-coverings.html.
CDC (2020d). "How to Make Cloth Face Coverings." Retrieved May 31, 2020, from
https://www.cdc.gov/coronavirus/2019-ncov/prevent-getting-sick/how-to-make-
cloth-face-covering.html.
Chang, S.-Y. and Lee, C.-T. (2002). "Applying GC-TCD to investigate the hygroscopic
characteristics of mixed aerosols" Atmospheric Environment 36(9): 1521-1530.
doi:10.1016/s1352-2310(01)00546-5
Chen, C.-C. and Willeke, K. (1992). "Aerosol penetration through surgical masks"
American Journal of Infection Control 20(4): 177-184. doi:10.1016/s0196-
6553(05)80143-9
Cheng, Y.-H. and Tsai, C.-J. (1998). "Factors Influencing Pressure Drop through a Dust
Cake during Filtration" Aerosol Science and Technology 29(4): 315-328.
doi:10.1080/02786829808965572
Cheng, Z., Luo, L., Wang, S., Wang, Y., Sharma, S., Shimadera, H., Wang, X., Bressi, M.,
de Miranda, R. M., Jiang, J., Zhou, W., Fajardo, O., Yan, N. and Hao, J. (2016).
"Status and characteristics of ambient PM2.5 pollution in global megacities"
Environment International 89-90: 212-221. doi:10.1016/j.envint.2016.02.003
Chin, A. W. H., Chu, J. T. S., Perera, M. R. A., Hui, K. P. Y., Yen, H.-L., Chan, M. C. W.,
Peiris, M. and Poon, L. L. M. (2020). "Stability of SARS-CoV-2 in different
environmental conditions" The Lancet Microbe 1(1): e10. doi:10.1016/s2666-
5247(20)30003-3
Cohen, M. D., Flagan, R. C. and Seinfeld, J. H. (1987a). "Studies of concentrated
electrolyte solutions using the electrodynamic balance. 1. Water activities for
single-electrolyte solutions" The Journal of Physical Chemistry 91(17): 4563-4574.
doi:10.1021/j100301a029
Cohen, M. D., Flagan, R. C. and Seinfeld, J. H. (1987b). "Studies of concentrated
electrolyte solutions using the electrodynamic balance. 2. Water activities for
mixed-electrolyte solutions" The Journal of Physical Chemistry 91(17): 4575-4582.
doi:10.1021/j100301a030
Cohen, M. D., Flagan, R. C. and Seinfeld, J. H. (1987c). "Studies of concentrated
electrolyte solutions using the electrodynamic balance. 3. Solute nucleation" The
Journal of Physical Chemistry 91(17): 4583-4590. doi:10.1021/j100301a031
Contal, P., Simao, J., Thomas, D., Frising, T., Callé, S., Appert-Collin, J. C. and Bémer,
D. (2004). "Clogging of fibre filters by submicron droplets. Phenomena and
influence of operating conditions" Journal of Aerosol Science 35(2): 263-278.
doi:10.1016/j.jaerosci.2003.07.003
Cziczo, D. J., Nowak, J. B., Hu, J. H. and Abbatt, J. P. D. (1997). "Infrared spectroscopy
of model tropospheric aerosols as a function of relative humidity: Observation of

219
deliquescence and crystallization" Journal of Geophysical Research: Atmospheres
102(D15): 18843-18850. doi:10.1029/97jd01361
Dalirian, M., Ylisirniö, A., Buchholz, A., Schlesinger, D., Ström, J., Virtanen, A. and
Riipinen, I. (2018). "Cloud droplet activation of black carbon particles coated with
organic compounds of varying solubility" Atmospheric Chemistry and Physics
18(16): 12477-12489. doi:10.5194/acp-18-12477-2018
Davies, A., Thompson, K.-A., Giri, K., Kafatos, G., Walker, J. and Bennett, A. (2013).
"Testing the efficacy of homemade masks: would they protect in an influenza
pandemic?" Disaster medicine and public health preparedness 7(4): 413-418.
doi:10.1017/dmp.2013.43
Dougle, P. G., Veefkind, J. P. and ten Brink, H. M. (1998). "Crystallisation of mixtures of
ammonium nitrate, ammonium sulphate and soot" Journal of Aerosol Science
29(3): 375-386. doi:10.1016/s0021-8502(97)10003-9
Ebert, M., Inerle-Hof, M. and Weinbruch, S. (2002). "Environmental scanning electron
microscopy as a new technique to determine the hygroscopic behaviour of
individual aerosol particles" Atmospheric Environment 36(39-40): 5909-5916.
doi:10.1016/s1352-2310(02)00774-4
Edgar, G. and Swan, W. O. (1922). "The Factors Determining the Hygroscopic Properties
of Soluble Substances. I. The Vapor Pressures of Saturated Solutions" Journal of
the American Chemical Society 44(3): 570-577. doi:10.1021/ja01424a014
EPA (1998). PM2.5 Mass Weighing Laboratory Standard Operating Procedures for the
Performance Evaluation Program,
European Committee for Standardization (2012). EN 779:2012 Particulate air filters for
general ventilation. Determination of the filtration performance.
FDA (2004). "Guidance for Industry and FDA Staff. Surgical Masks - Premarket
Notification [510(K)] Submissions; Guidance for Industry and FDA." Retrieved
May 26,2020, from https://www.fda.gov/regulatory-information/search-fda-
guidance-documents/surgical-masks-premarket-notification-510k-submissions.
Feng, S., Shen, C., Xia, N., Song, W., Fan, M. and Cowling, B. J. (2020). "Rational use of
face masks in the COVID-19 pandemic" The Lancet Respiratory Medicine 8(5):
434-436. doi:10.1016/S2213-2600(20)30134-X
Fischer, R. J., Morris, D. H., van Doremalen, N., Sarchette, S., Matson, M. J., Bushmaker,
T., Yinda, C. K., Seifert, S. N., Gamble, A., Williamson, B. N., Judson, S. D., de
Wit, E., Lloyd-Smith, J. O. and Munster, V. J. (2020). "Assessment of N95
respirator decontamination and re-use for SARS-CoV-2" medRxiv
2020.04.11.20062018 doi:10.1101/2020.04.11.20062018
Fisher, E. M. and Shaffer, R. E. (2011). "A method to determine the available UV-C dose
for the decontamination of filtering facepiece respirators" J Appl Microbiol 110(1):
287-295. doi:10.1111/j.1365-2672.2010.04881.x

220
Fisher, E. M., Williams, J. L. and Shaffer, R. E. (2011). "Evaluation of microwave steam
bags for the decontamination of filtering facepiece respirators" PLoS One 6(4):
e18585. doi:10.1371/journal.pone.0018585
Freney, E. J., Martin, S. T. and Buseck, P. R. (2009). "Deliquescence and Efflorescence of
Potassium Salts Relevant to Biomass-Burning Aerosol Particles" Aerosol Science
and Technology 43(8): 799-807. doi:10.1080/02786820902946620
Gao, Y., Chen, S. B. and Yu, L. E. (2006). "Efflorescence relative humidity for ammonium
sulfate particles" J Phys Chem A 110(24): 7602-7608. doi:10.1021/jp057574g
Ge, Z., Wexler, A. S. and Johnston, M. V. (1996). "Multicomponent Aerosol
Crystallization" Journal of Colloid and Interface Science 183(1): 68-77.
doi:10.1006/jcis.1996.0519
Ge, Z., Wexler, A. S. and Johnston, M. V. (1998). "Deliquescence Behavior of
Multicomponent Aerosols" The Journal of Physical Chemistry A 102(1): 173-180.
doi:10.1021/jp972396f
Godoy, C. and Thomas, D. (2020). "Influence of relative humidity on HEPA filters during
and after loading with soot particles" Aerosol Science and Technology 54(7): 790-
801. doi:10.1080/02786826.2020.1726278
Gralton, J., Tovey, E., McLaws, M. L. and Rawlinson, W. D. (2011). "The role of particle
size in aerosolised pathogen transmission: a review" J Infect 62(1): 1-13.
doi:10.1016/j.jinf.2010.11.010
Greenhalgh, T., Schmid, M. B., Czypionka, T., Bassler, D. and Gruer, L. (2020). "Face
masks for the public during the covid-19 crisis" BMJ 369: m1435.
doi:10.1136/bmj.m1435
Greenspan, L. (1977). "Humidity fixed points of binary saturated aqueous solutions"
Journal of Research of the National Bureau of Standards Section A: Physics and
Chemistry 81A(1): 89-96. doi:10.6028/jres.081A.011
Gupta, A., Novick, V. J., Biswas, P. and Monson, P. R. (1993). "Effect of Humidity and
Particle Hygroscopicity on the Mass Loading Capacity of High Efficiency
Particulate Air (HEPA) Filters" Aerosol Science and Technology 19(1): 94-107.
doi:10.1080/02786829308959624
Gupta, D., Kim, H., Park, G., Li, X., Eom, H. J. and Ro, C. U. (2015). "Hygroscopic
properties of NaCl and NaNO<sub>3</sub> mixture particles as reacted inorganic
sea-salt aerosol surrogates" Atmos. Chem. Phys. 15(6): 3379-3393.
doi:10.5194/acp-15-3379-2015
Guttikunda, S. K. and Calori, G. (2013). "A GIS based emissions inventory at 1 km × 1 km
spatial resolution for air pollution analysis in Delhi, India" Atmospheric
Environment 67: 101-111. doi:10.1016/j.atmosenv.2012.10.040
Gysel, M., Weingartner, E. and Baltensperger, U. (2002). "Hygroscopicity of aerosol
particles at low temperatures. 2. Theoretical and experimental hygroscopic
221
properties of laboratory generated aerosols" Environ Sci Technol 36(1): 63-68.
doi:10.1021/es010055g
Hajra, M. G., Mehta, K. and Chase, G. G. (2003). "Effects of humidity, temperature, and
nanofibers on drop coalescence in glass fiber media" Separation and Purification
Technology 30(1): 79-88. doi:10.1016/s1383-5866(02)00134-x
Halyard (2020). "Can I Use Halyard Sterilization Wrap for DIY Masks?" Retrieved Jun 2,
2020, from https://www.halyardhealth.com/covid-19/diy-masks.aspx.
Haynes, W. M. (2014). CRC Handbook of Chemistry and Physics, 95th Edition.
ISBN:9781482208689
He, K., Yang, F., Ma, Y., Zhang, Q., Yao, X., Chan, C. K., Cadle, S., Chan, T. and Mulawa,
P. (2001). "The characteristics of PM2.5 in Beijing, China" Atmospheric
Environment 35(29): 4959-4970. doi:10.1016/s1352-2310(01)00301-6
He, L.-Y., Hu, M., Huang, X.-F., Yu, B.-D., Zhang, Y.-H. and Liu, D.-Q. (2004).
"Measurement of emissions of fine particulate organic matter from Chinese
cooking" Atmospheric Environment 38(38): 6557-6564.
doi:10.1016/j.atmosenv.2004.08.034
Heimbuch, B. and Harnish, D. (2019). Research to Mitigate a Shortage of Respiratory
Protection Devices During Public Health Emergencies.
Heimbuch, B. K., Wallace, W. H., Kinney, K., Lumley, A. E., Wu, C. Y., Woo, M. H. and
Wander, J. D. (2011). "A pandemic influenza preparedness study: use of energetic
methods to decontaminate filtering facepiece respirators contaminated with H1N1
aerosols and droplets" Am J Infect Control 39(1): e1-9.
doi:10.1016/j.ajic.2010.07.004
Hinds, W. C. (2012). Aerosol Technology: Properties, Behavior, and Measurement of
Airborne Particles, Wiley. ISBN:9781118591970
Howard, J., Huang, A., Li, Z., Tufekci, Z., Zdimal, V., van der Westhuizen, H.-M., von
Delft, A., Price, A., Fridman, L., Tang, L.-H., Tang, V., Watson, G. L., Bax, C. E.,
Shaikh, R., Questier, F., Hernandez, D., Chu, L. F., Ramirez, C. M. and Rimoin, A.
W. (2020). "Face Masks Against COVID-19: An Evidence Review" Preprints
2020: 2020040203. doi:10.20944/preprints202004.0203.v2
Hsiao, T.-C., Chuang, H.-C., Griffith, S. M., Chen, S.-J. and Young, L.-H. (2020).
"COVID-19: An Aerosol’s Point of View from Expiration to Transmission to Viral-
mechanism" Aerosol and Air Quality Research: 905-910.
doi:10.4209/aaqr.2020.04.0154
Hu, D., Qiao, L., Chen, J., Ye, X., Yang, X., Cheng, T. and Fang, W. (2010).
"Hygroscopicity of Inorganic Aerosols: Size and Relative Humidity Effects on the
Growth Factor" Aerosol and Air Quality Research 10(3): 255-264.
doi:10.4209/aaqr.2009.12.0076
Huang, P.-F., Turpin, B. J., Pipho, M. J., Kittelson, D. B. and McMurry, P. H. (1994).
"Effects of water condensation and evaporation on diesel chain-agglomerate

222
morphology" Journal of Aerosol Science 25(3): 447-459. doi:10.1016/0021-
8502(94)90063-9
IQAir (2020). "World's most polluted cities 2019 (PM2.5)." from
https://www.iqair.com/world-most-polluted-cities.
ISO (2014). ISO 5011:2014 Inlet air cleaning equipment for internal combustion engines
and compressors — Performance testing.
ISO (2016). ISO 16890:2016 Air filters for general ventilation.
Jasper, W., Hinestroza, J., Mohan, A., Kim, J., Shiels, B., Gunay, M., Thompson, D. and
Barker, R. (2006). "Effect of xylene exposure on the performance of electret filter
media" Journal of Aerosol Science 37(7): 903-911.
doi:10.1016/j.jaerosci.2005.06.008
Ji, J. H., Bae, G. N., Kang, S. H. and Hwang, J. (2003). "Effect of particle loading on the
collection performance of an electret cabin air filter for submicron aerosols" Journal
of Aerosol Science 34(11): 1493-1504. doi:10.1016/s0021-8502(03)00103-4
Jing, B., Tong, S., Liu, Q., Li, K., Wang, W., Zhang, Y. and Ge, M. (2016). "Hygroscopic
behavior of multicomponent organic aerosols and their internal mixtures with
ammonium sulfate" Atmos. Chem. Phys. 16(6): 4101-4118. doi:10.5194/acp-16-
4101-2016
Jing, L. (1999). Standard combustion aerosol generator (SCAG) for calibration purposes.
3rd ETH Workshop “Nanoparticle Measurement”, ETH Honggerberg Zurich.
Johnson, D. F., Druce, J. D., Birch, C. and Grayson, M. L. (2009). "A Quantitative
Assessment of the Efficacy of Surgical and N95 Masks to Filter Influenza Virus in
Patients with Acute Influenza Infection" Clinical Infectious Diseases 49(2): 275-
277. doi:10.1086/600041
Joubert, A., Laborde, J. C., Bouilloux, L., Callé-Chazelet, S. and Thomas, D. (2010).
"Influence of Humidity on Clogging of Flat and Pleated HEPA Filters" Aerosol
Science and Technology 44(12): 1065-1076. doi:10.1080/02786826.2010.510154
Joubert, A., Laborde, J. C., Bouilloux, L., Chazelet, S. and Thomas, D. (2011). "Modelling
the pressure drop across HEPA filters during cake filtration in the presence of
humidity" Chemical Engineering Journal 166(2): 616-623.
doi:10.1016/j.cej.2010.11.033
Kawamura, K. and Yasui, O. (2005). "Diurnal changes in the distribution of dicarboxylic
acids, ketocarboxylic acids and dicarbonyls in the urban Tokyo atmosphere"
Atmospheric Environment 39(10): 1945-1960.
doi:10.1016/j.atmosenv.2004.12.014
Kim, J., Hinestroza, J. P., Jasper, W. and Barker, R. L. (2009a). "Effect of Solvent
Exposure on the Filtration Performance of Electrostatically Charged Polypropylene
Filter Media" Textile Research Journal 79(4): 343-350.
doi:10.1177/0040517508090887

223
Kim, J. H., Roberge, R. J., Powell, J. B., Shaffer, R. E., Ylitalo, C. M. and Sebastian, J. M.
(2015). "Pressure drop of filtering facepiece respirators: How low should we go?"
Int J Occup Med Environ Health 28(1): 71-80. doi:10.13075/ijomeh.1896.00153
Kim, S. C., Wang, J., Shin, W. G., Scheckman, J. H. and Pui, D. Y. H. (2009b). "Structural
Properties and Filter Loading Characteristics of Soot Agglomerates" Aerosol
Science and Technology 43(10): 1033-1041. doi:10.1080/02786820903131081
Kireeva, E. D., Popovicheva, O. B., Khokhlova, T. D. and Shoniya, N. K. (2010).
"Laboratory simulation of the interaction of water molecules with carbonaceous
aerosols in the atmosphere" Moscow University Physics Bulletin 65(6): 510-515.
doi:10.3103/s0027134910060159
Kittelson, D. B. (1998). "Engines and Nanoparticles: A Review" Journal of Aerosol
Science 29(5-6): 575-588. doi:10.1016/s0021-8502(97)10037-4
Klompas, M., Morris, C. A., Sinclair, J., Pearson, M. and Shenoy, E. S. (2020). "Universal
Masking in Hospitals in the Covid-19 Era" N Engl J Med 382(21): e63.
doi:10.1056/NEJMp2006372
Köllensperger, G., Friedbacher, G., Kotzick, R., Niessner, R. and Grasserbauer, M. (1999).
"In-situ atomic force microscopy investigation of aerosols exposed to different
humidities" Fresenius' Journal of Analytical Chemistry 364(4): 296-304.
doi:10.1007/s002160051340
Konda, A., Prakash, A., Moss, G. A., Schmoldt, M., Grant, G. D. and Guha, S. (2020).
"Aerosol Filtration Efficiency of Common Fabrics Used in Respiratory Cloth
Masks" ACS Nano 14(5): 6339-6347. doi:10.1021/acsnano.0c03252
Kumar, A., Kasloff, S. B., Leung, A., Cutts, T., Strong, J. E., Hills, K., Vazquez-Grande,
G., Rush, B., Lother, S., Zarychanski, R. and Krishnan, J. (2020). "N95 Mask
Decontamination using Standard Hospital Sterilization Technologies" medRxiv:
2020.2004.2005.20049346. doi:10.1101/2020.04.05.20049346
Lai, A. C., Poon, C. K. and Cheung, A. C. (2012). "Effectiveness of facemasks to reduce
exposure hazards for airborne infections among general populations" J R Soc
Interface 9(70): 938-948. doi:10.1098/rsif.2011.0537
Langlet, M., Nadaud, F., Benali, M., Pezron, I., Saleh, K., Guigon, P. and Metlas-
Komunjer, L. (2011). "Kinetics of Dissolution and Recrystallization of Sodium
Chloride at Controlled Relative Humidity" KONA Powder and Particle Journal
29(0): 168-179. doi:10.14356/kona.2011019
Laskina, O., Morris, H. S., Grandquist, J. R., Qin, Z., Stone, E. A., Tivanski, A. V. and
Grassian, V. H. (2015). "Size matters in the water uptake and hygroscopic growth
of atmospherically relevant multicomponent aerosol particles" J Phys Chem A
119(19): 4489-4497. doi:10.1021/jp510268p
Lee, C.-T. and Hsu, W.-C. (2000). "The Measurement of Liquid Water Mass Associated
with Collected Hygroscopic Particles" Journal of Aerosol Science 31(2): 189-197.
doi:10.1016/s0021-8502(99)00048-8

224
Leung, C. C., Lam, T. H. and Cheng, K. K. (2020a). "Mass masking in the COVID-19
epidemic: people need guidance" Lancet 395(10228): 945. doi:10.1016/S0140-
6736(20)30520-1
Leung, K. K., Schnitzler, E. G., Jäger, W. and Olfert, J. S. (2017). "Relative Humidity
Dependence of Soot Aggregate Restructuring Induced by Secondary Organic
Aerosol: Effects of Water on Coating Viscosity and Surface Tension"
Environmental Science & Technology Letters 4(9): 386-390.
doi:10.1021/acs.estlett.7b00298
Leung, N. H. L., Chu, D. K. W., Shiu, E. Y. C., Chan, K.-H., McDevitt, J. J., Hau, B. J. P.,
Yen, H.-L., Li, Y., Ip, D. K. M., Peiris, J. S. M., Seto, W.-H., Leung, G. M., Milton,
D. K. and Cowling, B. J. (2020b). "Respiratory virus shedding in exhaled breath
and efficacy of face masks" Nature Medicine 26(5): 676-680. doi:10.1038/s41591-
020-0843-2
Li, J. J., Wang, G. H., Cao, J. J., Wang, X. M. and Zhang, R. J. (2013). "Observation of
biogenic secondary organic aerosols in the atmosphere of a mountain site in central
China: temperature and relative humidity effects" Atmos. Chem. Phys. 13(22):
11535-11549. doi:10.5194/acp-13-11535-2013
Li, K. W., Chen, L. H., Han, K., Lv, B. A., Bao, K. J., Wu, X. C., Gao, X. and Cen, K. F.
(2017). "Smog chamber study on aging of combustion soot in isoprene/SO2/NOx
system: Changes of mass, size, effective density, morphology and mixing state"
Atmospheric Research 184: 139-148. doi:10.1016/j.atmosres.2016.10.011
Li, S., Chen, D.-R., Zhou, F. and Chen, S.-C. (2020). "Effects of relative humidity and
particle hygroscopicity on the initial efficiency and aging characteristics of electret
HVAC filter media" Building and Environment 171: 106669.
doi:10.1016/j.buildenv.2020.106669
Li, W., Sun, J., Xu, L., Shi, Z., Riemer, N., Sun, Y., Fu, P., Zhang, J., Lin, Y., Wang, X.,
Shao, L., Chen, J., Zhang, X., Wang, Z. and Wang, W. (2016a). "A conceptual
framework for mixing structures in individual aerosol particles" Journal of
Geophysical Research: Atmospheres 121(22): 13,784-713,798.
doi:10.1002/2016JD025252
Li, X., Gupta, D., Eom, H.-J., Kim, H. and Ro, C.-U. (2014). "Deliquescence and
efflorescence behavior of individual NaCl and KCl mixture aerosol particles"
Atmospheric Environment 82: 36-43. doi:10.1016/j.atmosenv.2013.10.011
Li, Y. J., Liu, P. F., Bergoend, C., Bateman, A. P. and Martin, S. T. (2016b). "Rebounding
hygroscopic inorganic aerosol particles: Liquids, gels, and hydrates" Aerosol
Science and Technology 51(3): 388-396. doi:10.1080/02786826.2016.1263384
Liao, L., Xiao, W., Zhao, M., Yu, X., Wang, H., Wang, Q., Chu, S. and Cui, Y. (2020).
"Can N95 Respirators Be Reused after Disinfection? How Many Times?" ACS
Nano 14(5): 6348-6356. doi:10.1021/acsnano.0c03597
Lide, D. R. (2005). CRC Handbook of Chemistry and Physics, 86th Edition, Taylor &
Francis. ISBN:9780849304866

225
Liew, T. P. and Conder, J. R. (1985). "Fine mist filtration by wet filters—I. Liquid
saturation and flow resistance of fibrous filters" Journal of Aerosol Science 16(6):
497-509. doi:10.1016/0021-8502(85)90002-3
Lightstone, J. M., Onasch, T. B., Imre, D. and Oatis, S. (2000). "Deliquescence,
Efflorescence, and Water Activity in Ammonium Nitrate and Mixed Ammonium
Nitrate/Succinic Acid Microparticles" The Journal of Physical Chemistry A
104(41): 9337-9346. doi:10.1021/jp002137h
Lim, Y. X., Ng, Y. L., Tam, J. P. and Liu, D. X. (2016). "Human Coronaviruses: A Review
of Virus-Host Interactions" Diseases 4(3): 26. doi:10.3390/diseases4030026
Lindblad, M., Tano, E., Lindahl, C. and Huss, F. (2020). "Ultraviolet-C decontamination
of a hospital room: Amount of UV light needed" Burns 46(4): 842-849.
doi:10.1016/j.burns.2019.10.004
Lindsley, W. G., Martin, S. B., Jr., Thewlis, R. E., Sarkisian, K., Nwoko, J. O., Mead, K.
R. and Noti, J. D. (2015). "Effects of Ultraviolet Germicidal Irradiation (UVGI) on
N95 Respirator Filtration Performance and Structural Integrity" J Occup Environ
Hyg 12(8): 509-517. doi:10.1080/15459624.2015.1018518
Liu, B. Y. H. and Pui, D. Y. H. (1974). "Equilibrium bipolar charge distribution of
aerosols" Journal of Colloid and Interface Science 49(2): 305-312.
doi:10.1016/0021-9797(74)90366-x
Liu, H., Qi, L., Liang, C., Deng, F., Man, H. and He, K. (2020). "How aging process
changes characteristics of vehicle emissions? A review" Critical Reviews in
Environmental Science and Technology 50(17): 1796-1828.
doi:10.1080/10643389.2019.1669402
Liu, Y., Yang, Z., Desyaterik, Y., Gassman, P. L., Wang, H. and Laskin, A. (2008).
"Hygroscopic behavior of substrate-deposited particles studied by micro-FT-IR
spectroscopy and complementary methods of particle analysis" Anal Chem 80(3):
633-642. doi:10.1021/ac701638r
Lore, M. B., Heimbuch, B. K., Brown, T. L., Wander, J. D. and Hinrichs, S. H. (2012).
"Effectiveness of three decontamination treatments against influenza virus applied
to filtering facepiece respirators" Ann Occup Hyg 56(1): 92-101.
doi:10.1093/annhyg/mer054
Ma, X., Zangmeister, C. D., Gigault, J., Mulholland, G. W. and Zachariah, M. R. (2013).
"Soot aggregate restructuring during water processing" Journal of Aerosol Science
66: 209-219. doi:10.1016/j.jaerosci.2013.08.001
MacIntyre, C. R., Seale, H., Dung, T. C., Hien, N. T., Nga, P. T., Chughtai, A. A., Rahman,
B., Dwyer, D. E. and Wang, Q. (2015). "A cluster randomised trial of cloth masks
compared with medical masks in healthcare workers" BMJ Open 5(4): e006577.
doi:10.1136/bmjopen-2014-006577
Mahdavi, A., Haghighat, F., Bahloul, A., Brochot, C. and Ostiguy, C. (2015). "Particle
loading time and humidity effects on the efficiency of an N95 filtering facepiece

226
respirator model under constant and inhalation cyclic flows" Ann Occup Hyg 59(5):
629-640. doi:10.1093/annhyg/mev005
Massey, T., Borucki, M., Paik, S., Fuhrer, K., Bora, M., Kane, S., Haque, R. and Baxamusa,
S. H. (2020). "Quantitative form and fit of N95 filtering facepiece respirators are
retained and coronavirus surrogate is inactivated after heat treatments" medRxiv:
2020.2004.2015.20065755. doi:10.1101/2020.04.15.20065755
McDevitt, J., Rudnick, S., First, M. and Spengler, J. (2010). "Role of absolute humidity in
the inactivation of influenza viruses on stainless steel surfaces at elevated
temperatures" Appl Environ Microbiol 76(12): 3943-3947.
doi:10.1128/AEM.02674-09
McMurry, P. H., Wang, X., Park, K. and Ehara, K. (2002). "The Relationship between
Mass and Mobility for Atmospheric Particles: A New Technique for Measuring
Particle Density" Aerosol Science and Technology 36(2): 227-238.
doi:10.1080/027868202753504083
Mendelson, L. (2020). "Facing Your Face Mask Duties – A List of Statewide Orders, as of
May 26, 2020." Retrieved May 26, 2020, May 26, 2020, from
https://www.littler.com/publication-press/publication/facing-your-face-mask-
duties-list-statewide-orders.
Miguel, A. F. (2003). "Effect of air humidity on the evolution of permeability and
performance of a fibrous filter during loading with hygroscopic and non-
hygroscopic particles" Journal of Aerosol Science 34(6): 783-799.
doi:10.1016/s0021-8502(03)00027-2
Mikhailov, E. F., Vlasenko, S. S., Kiselev, A. A. and Ryshkevitch, T. I. (1996).
"Restructuring of soot particles: Experimental study" Journal of Aerosol Science
27: S711-S712. doi:10.1016/0021-8502(96)00428-4
Mills, D., Harnish, D. A., Lawrence, C., Sandoval-Powers, M. and Heimbuch, B. K.
(2018). "Ultraviolet germicidal irradiation of influenza-contaminated N95 filtering
facepiece respirators" Am J Infect Control 46(7): e49-e55.
doi:10.1016/j.ajic.2018.02.018
Montgomery, J. F., Green, S. I. and Rogak, S. N. (2015a). "Impact of Relative Humidity
on HVAC Filters Loaded with Hygroscopic and Non-Hygroscopic Particles"
Aerosol Science and Technology 49(5): 322-331.
doi:10.1080/02786826.2015.1026433
Montgomery, J. F., Rogak, S. N., Green, S. I., You, Y. and Bertram, A. K. (2015b).
"Structural Change of Aerosol Particle Aggregates with Exposure to Elevated
Relative Humidity" Environ Sci Technol 49(20): 12054-12061.
doi:10.1021/acs.est.5b03157
Morawska, L. (2006). "Droplet fate in indoor environments, or can we prevent the spread
of infection?" Indoor Air 16(5): 335-347. doi:10.1111/j.1600-0668.2006.00432.x
Morawska, L., Johnson, G. R., Ristovski, Z. D., Hargreaves, M., Mengersen, K., Corbett,
S., Chao, C. Y. H., Li, Y. and Katoshevski, D. (2009). "Size distribution and sites

227
of origin of droplets expelled from the human respiratory tract during expiratory
activities" Journal of Aerosol Science 40(3): 256-269.
doi:10.1016/j.jaerosci.2008.11.002
Morawska, L. and Cao, J. (2020). "Airborne transmission of SARS-CoV-2: The world
should face the reality" Environ Int 139: 105730. doi:10.1016/j.envint.2020.105730
Morawska, L. and Milton, D. K. (2020). "It is Time to Address Airborne Transmission of
COVID-19" Clin Infect Dis doi:10.1093/cid/ciaa939
Motyl, E. and Łowkis, B. (2006). "Effect of air humidity on charge decay and lifetime of
PP electret nonwovens" Fibres and Textiles in Eastern Europe 14(5): 39-42.
Mueller, A. V., Eden, M. J., Oakes, J. J., Bellini, C. and Fernandez, L. A. (2020).
"Quantitative Method for Comparative Assessment of Particle Filtration Efficiency
of Fabric Masks as Alternatives to Standard Surgical Masks for PPE"
doi:10.1101/2020.04.17.20069567
N95DECON (2020). "A scientific consortium for data-driven study of N95 filtering
facepiece respirator decontamination." from https://www.n95decon.org.
National Academies of Sciences Engineering Medicine (2020). Rapid Expert Consultation
on the Effectiveness of Fabric Masks for the COVID-19 Pandemic (April 8, 2020).
Washington, DC, The National Academies Press.
National Center for Biotechnology Information (2020a). "PubChem Compound Summary
for CID 445639, Oleic acid." Retrieved Aug 14, 2020, from
https://pubchem.ncbi.nlm.nih.gov/compound/Oleic-acid.
National Center for Biotechnology Information (2020b). "PubChem Compound Summary
for CID 743, Glutaric acid." Retrieved August 14, 2020, from
https://pubchem.ncbi.nlm.nih.gov/compound/Glutaric-acid.
National Health Commission (2020). "Guidelines for wearing masks for public." Retrieved
May 26, 2020, from
http://www.nhc.gov.cn/jkj/s3577/202003/0a472cc09e744144883db6a74fe6e760.s
html.
National Health Commission and State Administration of Traditional Chinese Medicine
(2020). “Diagnosis and Treatment Protocol for Novel Coronavirus Pneumonia”
NIOSH (2019). "Determination of particulate filter efficiency level for n95 series filters
against solid particulates for non-powered, air- purifying respirators standard
testing procedure (STP) Procedure No. TEB-APR-STP-0059",
https://www.cdc.gov/niosh/npptl/stps/pdfs/TEB-APR-STP-0059-508.pdf
O'Brien, F. E. M. (1948). "The Control of Humidity by Saturated Salt Solutions" Journal
of Scientific Instruments 25(3): 73-76. doi:10.1088/0950-7671/25/3/305
Oberg, T. and Brosseau, L. M. (2008). "Surgical mask filter and fit performance" American
Journal of Infection Control 36(4): 276-282. doi:10.1016/j.ajic.2007.07.008

228
Office of the Federal Register (1995). Approval of Respiratory Protective Devices, Code
of Federal Regulations, Part 84, Title 42
Ollier, K., Leppänen, M., Wu, B., Yermakov, M., Newman, N. C., Reponen, T. and
Grinshpun, S. A. (2019). "Inhalation Exposure and Respiratory Protection of Home
Healthcare Workers Administering Aerosolized Medications (Simulation Study)"
Aerosol and Air Quality Research 19(5): 937-944. doi:10.4209/aaqr.2018.10.0366
Onasch, T. B., Siefert, R. L., Brooks, S. D., Prenni, A. J., Murray, B., Wilson, M. A. and
Tolbert, M. A. (1999). "Infrared spectroscopic study of the deliquescence and
efflorescence of ammonium sulfate aerosol as a function of temperature" Journal
of Geophysical Research: Atmospheres 104(D17): 21317-21326.
doi:10.1029/1999jd900384
Orr, C., Hurd, F. K. and Corbett, W. J. (1958). "Aerosol size and relative humidity" Journal
of Colloid Science 13(5): 472-482. doi:10.1016/0095-8522(58)90055-2
Ou, Q., Pei, C., Chen, S.-C. and Pui, D. Y. H. (2014). “HVAC and Engine In-take Filter
Loading by Bimodal Aerosols” CFR Meeting
Ou, Q., Stanley, N. and Pui, D. Y. H. (2015). “Effect of Relative Humidity on Filter
Loading with ISO fine test dust” CFR Meeting
Ou, Q., Maricq, M. M. and Pui, D. Y. H. (2017). "Evaluation of metallic filter media for
sub-micrometer soot particle removal at elevated temperature" Aerosol Science and
Technology 51(11): 1303-1312. doi:10.1080/02786826.2017.1349871
Ou, Q., Pei, C., Kim, S. C., Abell, E. and Pui, D. Y. H. (2020). "Evaluation of
decontamination methods for commercial and alternative respirator and mask
materials – view from filtration aspect" Journal of Aerosol Science 150: 105609.
doi:10.1016/j.jaerosci.2020.105609
Park, K., Cao, F., Kittelson, D. B. and McMurry, P. H. (2003). "Relationship between
Particle Mass and Mobility for Diesel Exhaust Particles" Environmental Science &
Technology 37(3): 577-583. doi:10.1021/es025960v
Parsons, M. T., Mak, J., Lipetz, S. R. and Bertram, A. K. (2004). "Deliquescence of
malonic, succinic, glutaric, and adipic acid particles" Journal of Geophysical
Research: Atmospheres 109(D06212): n/a-n/a. doi:10.1029/2003jd004075
Peckhaus, A., Grass, S., Treuel, L. and Zellner, R. (2012). "Deliquescence and
efflorescence behavior of ternary inorganic/organic/water aerosol particles" J Phys
Chem A 116(24): 6199-6210. doi:10.1021/jp211522t
Pei, C., Ou, Q. and Pui, D. Y. H. (2019a). "Effect of relative humidity on loading
characteristics of cellulose filter media by submicrometer potassium chloride,
ammonium sulfate, and ammonium nitrate particles" Separation and Purification
Technology 212: 75-83. doi:10.1016/j.seppur.2018.11.009
Pei, C., Ou, Q., Yu, T. and Pui, D. Y. H. (2019b). "Loading characteristics of nanofiber
coated air intake filter media by potassium chloride, ammonium sulfate, and
ammonium nitrate fine particles and the comparison with conventional cellulose

229
filter media" Separation and Purification Technology 228: 115734.
doi:10.1016/j.seppur.2019.115734
Pei, C., Ou, Q., Kim, S. C., Chen, S.-C. and Pui, D. Y. H. (2020). "Alternative Face Masks
Made of Common Materials for General Public: Fractional Filtration Efficiency
and Breathability Perspective" Aerosol and Air Quality Research 20
doi:10.4209/aaqr.2020.07.0423
Pei, C., Ou, Q. and Pui, D. Y. H. (2021). "Effects of temperature and relative humidity on
laboratory air filter loading test by hygroscopic salts" Separation and Purification
Technology 255: 117679. doi:10.1016/j.seppur.2020.117679
Philip, S., Martin, R. V., van Donkelaar, A., Lo, J. W.-H., Wang, Y., Chen, D., Zhang, L.,
Kasibhatla, P. S., Wang, S., Zhang, Q., Lu, Z., Streets, D. G., Bittman, S. and
Macdonald, D. J. (2014). "Global chemical composition of ambient fine particulate
matter for exposure assessment" Environmental Science & Technology 48(22):
13060-13068. doi:10.1021/es502965b
Popovicheva, O., Persiantseva, N. M., Shonija, N. K., DeMott, P., Koehler, K., Petters, M.,
Kreidenweis, S., Tishkova, V., Demirdjian, B. and Suzanne, J. (2008a). "Water
interaction with hydrophobic and hydrophilic soot particles" Phys Chem Chem
Phys 10(17): 2332-2344. doi:10.1039/b718944n
Popovicheva, O. B., Persiantseva, N. M., Tishkova, V., Shonija, N. K. and Zubareva, N.
A. (2008b). "Quantification of water uptake by soot particles" Environmental
Research Letters 3(2): 025009. doi:10.1088/1748-9326/3/2/025009
Prather, K. A., Wang, C. C. and Schooley, R. T. (2020). "Reducing transmission of SARS-
CoV-2" Science 368(6498): 1422-1424. doi:10.1126/science.abc6197
R Core Team (2019). R: A Language and Environment for Statistical Computing, R
Foundation for Statistical Computing. Vienna, Austria. http://www.R-project.org/.
Raynor, P. C. and Chae, S. J. (2004). "The long-term performance of electrically charged
filters in a ventilation system" J Occup Environ Hyg 1(7): 463-471.
doi:10.1080/15459620490467783
Rengasamy, S., Eimer, B. and Shaffer, R. E. (2010). "Simple Respiratory Protection—
Evaluation of the Filtration Performance of Cloth Masks and Common Fabric
Materials Against 20–1000 nm Size Particles" The Annals of Occupational
Hygiene 54(7): 789-798. doi:10.1093/annhyg/meq044
Rengasamy, S. and Eimer, B. C. (2012). "Nanoparticle penetration through filter media
and leakage through face seal interface of N95 filtering facepiece respirators" Ann
Occup Hyg 56(5): 568-580. doi:10.1093/annhyg/mer122
Rengasamy, S., Shaffer, R., Williams, B. and Smit, S. (2017). "A comparison of facemask
and respirator filtration test methods" J Occup Environ Hyg 14(2): 92-103.
doi:10.1080/15459624.2016.1225157

230
Ribeyre, Q., Charvet, A., Vallières, C. and Thomas, D. (2017). "Impact of relative humidity
on a nanostructured filter cake – Experimental and modelling approaches"
Chemical Engineering Science 161: 109-116. doi:10.1016/j.ces.2016.12.013
RIDGID (2020). "RIDGID’s important notice." Retrieved Jun 2, 2020, from
https://www.ridgid.com/us/en/vacuum-filters.
Rockland, L. B. (1960). "Saturated Salt Solutions for Static Control of Relative Humidity
between 5° and 40° C" Analytical Chemistry 32(10): 1375-1376.
doi:10.1021/ac60166a055
Rogge, W. F., Hildemann, L. M., Mazurek, M. A., Cass, G. R. and Simoneit, B. R. T.
(1991). "Sources of fine organic aerosol. 1. Charbroilers and meat cooking
operations" Environmental Science & Technology 25(6): 1112-1125.
doi:10.1021/es00018a015
RStudio Team (2019). RStudio: Integrated Development Environment for R, RStudio,
PBC. Boston, MA URL http://www.rstudio.com/.
Saathoff, H., Naumann, K. H., Schnaiter, M., Schöck, W., Möhler, O., Schurath, U.,
Weingartner, E., Gysel, M. and Baltensperger, U. (2003). "Coating of soot and
(NH4)2SO4 particles by ozonolysis products of α-pinene" Journal of Aerosol
Science 34(10): 1297-1321. doi:10.1016/s0021-8502(03)00364-1
Scharfman, B. E., Techet, A. H., Bush, J. W. M. and Bourouiba, L. (2016). "Visualization
of sneeze ejecta: steps of fluid fragmentation leading to respiratory droplets" Exp
Fluids 57(2): 24. doi:10.1007/s00348-015-2078-4
Schnitzler, E. G., Dutt, A., Charbonneau, A. M., Olfert, J. S. and Jager, W. (2014). "Soot
aggregate restructuring due to coatings of secondary organic aerosol derived from
aromatic precursors" Environ Sci Technol 48(24): 14309-14316.
doi:10.1021/es503699b
Snider, G., Weagle, C. L., Martin, R. V., van Donkelaar, A., Conrad, K., Cunningham, D.,
Gordon, C., Zwicker, M., Akoshile, C., Artaxo, P., Anh, N. X., Brook, J., Dong, J.,
Garland, R. M., Greenwald, R., Griffith, D., He, K., Holben, B. N., Kahn, R.,
Koren, I., Lagrosas, N., Lestari, P., Ma, Z., Vanderlei Martins, J., Quel, E. J.,
Rudich, Y., Salam, A., Tripathi, S. N., Yu, C., Zhang, Q., Zhang, Y., Brauer, M.,
Cohen, A., Gibson, M. D. and Liu, Y. (2015). "SPARTAN: a global network to
evaluate and enhance satellite-based estimates of ground-level particulate matter
for global health applications" Atmospheric Measurement Techniques 8(1): 505-
521. doi:10.5194/amt-8-505-2015
Snider, G., Weagle, C. L., Murdymootoo, K. K., Ring, A., Ritchie, Y., Stone, E., Walsh,
A., Akoshile, C., Anh, N. X., Balasubramanian, R., Brook, J., Qonitan, F. D., Dong,
J., Griffith, D., He, K., Holben, B. N., Kahn, R., Lagrosas, N., Lestari, P., Ma, Z.,
Misra, A., Norford, L. K., Quel, E. J., Salam, A., Schichtel, B., Segev, L., Tripathi,
S., Wang, C., Yu, C., Zhang, Q., Zhang, Y., Brauer, M., Cohen, A., Gibson, M. D.,
Liu, Y., Martins, J. V., Rudich, Y. and Martin, R. V. (2016). "Variation in global
chemical composition of PM2.5: emerging results from SPARTAN" Atmospheric
Chemistry and Physics 16(15): 9629-9653. doi:10.5194/acp-16-9629-2016

231
Spurny, K. R. (1986). "On the filtration of fibrous aerosols" Science of the Total
Environment 52(3): 189-199. doi:10.1016/0048-9697(86)90119-1
Sun, J., Liu, L., Xu, L., Wang, Y., Wu, Z., Hu, M., Shi, Z., Li, Y., Zhang, X., Chen, J. and
Li, W. (2018). "Key Role of Nitrate in Phase Transitions of Urban Particles:
Implications of Important Reactive Surfaces for Secondary Aerosol Formation"
Journal of Geophysical Research: Atmospheres 123(2): 1234-1243.
doi:10.1002/2017jd027264
Sun, Y., Zhuang, G., Wang, Y., Han, L., Guo, J., Dan, M., Zhang, W., Wang, Z. and Hao,
Z. (2004). "The air-borne particulate pollution in Beijing—concentration,
composition, distribution and sources" Atmospheric Environment 38(35): 5991-
6004. doi:10.1016/j.atmosenv.2004.07.009
Sun, Z., Liang, Y., He, W., Jiang, F., Song, Q., Tang, M. and Wang, J. (2019). "Filtration
performance and loading capacity of nano-structured composite filter media for
applications with high soot concentrations" Separation and Purification
Technology 221: 175-182. doi:10.1016/j.seppur.2019.03.087
Tang, I. N. (1976). "Phase transformation and growth of aerosol particles composed of
mixed salts" Journal of Aerosol Science 7(5): 361-371. doi:10.1016/0021-
8502(76)90022-7
Tang, I. N. (1980). Deliquescence properties and particle size change of hygroscopic
aerosols In: Generation of aerosols and facilities for exposure experiments. K.
Willeke and N. Kagakkai, Ann Arbor Science.
Tang, I. N. and Munkelwitz, H. R. (1993). "Composition and temperature dependence of
the deliquescence properties of hygroscopic aerosols" Atmospheric Environment.
Part A. General Topics 27(4): 467-473. doi:10.1016/0960-1686(93)90204-c
Tang, I. N. and Munkelwitz, H. R. (1994a). "Aerosol Phase Transformation and Growth in
the Atmosphere" Journal of Applied Meteorology 33(7): 791-796.
doi:10.1175/1520-0450(1994)033<0791:Aptagi>2.0.Co;2
Tang, I. N. and Munkelwitz, H. R. (1994b). "Water activities, densities, and refractive
indices of aqueous sulfates and sodium nitrate droplets of atmospheric importance"
Journal of Geophysical Research 99(D9): 18801-18808. doi:10.1029/94jd01345
Tang, I. N. (1996). "Chemical and size effects of hygroscopic aerosols on light scattering
coefficients" Journal of Geophysical Research: Atmospheres 101(D14): 19245-
19250. doi:10.1029/96jd03003
Tang, I. N., Tridico, A. C. and Fung, K. H. (1997). "Thermodynamic and optical properties
of sea salt aerosols" Journal of Geophysical Research: Atmospheres 102(D19):
23269-23275. doi:10.1029/97jd01806
ten Brink, H. M. and Veefkind, J. P. (1995). "Humidity dependence of the light-scattering
by ammonium nitrate" Journal of Aerosol Science 26: S553-S554.
doi:10.1016/0021-8502(95)97184-g

232
Thomson, W. (1871). "LX. On the equilibrium of vapour at a curved surface of liquid" The
London, Edinburgh, and Dublin Philosophical Magazine and Journal of Science
42(282): 448-452. doi:10.1080/14786447108640606
Tritscher, T., Jurányi, Z., Martin, M., Chirico, R., Gysel, M., Heringa, M. F., DeCarlo, P.
F., Sierau, B., Prévôt, A. S. H., Weingartner, E. and Baltensperger, U. (2011).
"Changes of hygroscopicity and morphology during ageing of diesel soot"
Environmental Research Letters 6(3): 034026. doi:10.1088/1748-9326/6/3/034026
University of Florida, Department of Anesthesiology (2020). "Mask alternative." from
https://anest.ufl.edu/clinical-divisions/mask-alternative/.
University of Minnesota, College of Science & Engineering. (2020). "U of M researchers
design respirator mask prototypes from filter technology." from
https://cse.umn.edu/college/news/u-m-researchers-design-respirator-mask-
prototypes-filter-technology.
van der Sande, M., Teunis, P. and Sabel, R. (2008). "Professional and home-made face
masks reduce exposure to respiratory infections among the general population"
PLoS One 3(7): e2618. doi:10.1371/journal.pone.0002618
Viscusi, D. J., Bergman, M. S., Eimer, B. C. and Shaffer, R. E. (2009). "Evaluation of five
decontamination methods for filtering facepiece respirators" Ann Occup Hyg
53(8): 815-827. doi:10.1093/annhyg/mep070
Viscusi, D. J., Bergman, M. S., Novak, D. A., Faulkner, K. A., Palmiero, A., Powell, J. and
Shaffer, R. E. (2011). "Impact of three biological decontamination methods on
filtering facepiece respirator fit, odor, comfort, and donning ease" J Occup Environ
Hyg 8(7): 426-436. doi:10.1080/15459624.2011.585927
Walsh, D. C., Stenhouse, J. I. T., Scurrah, K. L. and Graef, A. (1996). "The effect of solid
and liquid aerosol particle loading on fibrous filter material performance" Journal
of Aerosol Science 27: S617-S618. doi:10.1016/0021-8502(96)00381-3
Wang, M., Zhu, T., Zhao, D., Rubach, F., Wahner, A., Kiendler-Scharr, A. and Mentel, T.
F. (2018). "Cloud condensation nuclei activity of CaCO3 particles with oleic acid
and malonic acid coatings" Atmospheric Chemistry and Physics 18(10): 7345-
7359. doi:10.5194/acp-18-7345-2018
Wang, Q. and Yu, C. (2020). "The role of masks and respirator protection against SARS-
CoV-2" Infection control and hospital epidemiology 41(6): 746-747.
doi:10.1017/ice.2020.83
Wang, Y., Lin, Z. and Zhang, W. (2020). "Interaction between high humidity and
hygroscopic aerosol on the filtration performance of electret media" Particulate
Science and Technology: 1-13. doi:10.1080/02726351.2020.1799125
Weingartner, E., Baltensperger, U. and Burtscher, H. (1995). "Growth and structural
change of combustion aerosols at high relative humidity" Environ Sci Technol
29(12): 2982-2986. doi:10.1021/es00012a014

233
Weingartner, E., Burtscher, H. and Baltensperger, U. (1997). "Hygroscopic properties of
carbon and diesel soot particles" Atmospheric Environment 31(15): 2311-2327.
doi:10.1016/s1352-2310(97)00023-x
Weingartner, E., Gysel, M. and Baltensperger, U. (2002). "Hygroscopicity of aerosol
particles at low temperatures. 1. New low-temperature H-TDMA instrument: setup
and first applications" Environ Sci Technol 36(1): 55-62. doi:10.1021/es010054o
Wexler, A. and Hasegawa, S. (1954). "Relative humidity-temperature relationships of
some saturated salt solutions in the temperature range 0 degree to 50 degrees C"
Journal of Research of the National Bureau of Standards 53(1): 19-26.
doi:10.6028/jres.053.003
Wexler, A. S. and Seinfeld, J. H. (1991). "Second-generation inorganic aerosol model"
Atmospheric Environment. Part A. General Topics 25(12): 2731-2748.
doi:10.1016/0960-1686(91)90203-j
WHO (2020a). "Coronavirus disease (COVID-19) Pandemic." Retrieved May 26, 2020,
from https://www.who.int/emergencies/diseases/novel-coronavirus-2019.
WHO (2020b). "Coronavirus disease (COVID-19) advice for the public: When and how to
use masks." Retrieved Jun 10, 2020, from
https://www.who.int/emergencies/diseases/novel-coronavirus-2019/advice-for-
public/when-and-how-to-use-masks.
WHO (2020c). "Modes of transmission of virus causing COVID-19:implications for IPC
precaution recommendations." Retrieved May 26,2020, from
https://www.who.int/publications-detail/modes-of-transmission-of-virus-causing-
covid-19-implications-for-ipc-precaution-recommendations.
WHO (2020d). "Advice on the use of masks in the context of COVID-19 Interim
guidance." Retrieved 5 June, 2020, from
https://apps.who.int/iris/bitstream/handle/10665/332293/WHO-2019-nCov-
IPC_Masks-2020.4-eng.pdf.
WHO (2020e). "Shortage of personal protective equipment endangering health workers
worldwide." Retrieved Aug 1, 2020, from https://www.who.int/news-
room/detail/03-03-2020-shortage-of-personal-protective-equipment-endangering-
health-workers-worldwide.
Wiedensohler, A. (1988). "An approximation of the bipolar charge distribution for particles
in the submicron size range" Journal of Aerosol Science 19(3): 387-389.
doi:10.1016/0021-8502(88)90278-9
Wu, L., Li, X. and Ro, C. U. (2019). "Hygroscopic Behavior of Ammonium Sulfate,
Ammonium Nitrate, and their Mixture Particles" Asian Journal of Atmospheric
Environment 13(3): 196-211. doi:10.5572/ajae.2019.13.3.196
Wu, Y., Cheng, T., Liu, D., Allan, J. D., Zheng, L. and Chen, H. (2018). "Light Absorption
Enhancement of Black Carbon Aerosol Constrained by Particle Morphology"
Environmental Science & Technology 52(12): 6912-6919.
doi:10.1021/acs.est.8b00636

234
Xu, J., Imre, D., McGraw, R. and Tang, I. (1998). "Ammonium Sulfate: Equilibrium and
Metastability Phase Diagrams from 40 to −50 °C" The Journal of Physical
Chemistry B 102(38): 7462-7469. doi:10.1021/jp981929x
Xue, H., Khalizov, A. F., Wang, L., Zheng, J. and Zhang, R. (2009). "Effects of Coating
of Dicarboxylic Acids on the Mass−Mobility Relationship of Soot Particles"
Environmental Science & Technology 43(8): 2787-2792. doi:10.1021/es803287v
Yang, C. (2012). "Aerosol Filtration Application Using Fibrous Media—An Industrial
Perspective" Chinese Journal of Chemical Engineering 20(1): 1-9.
doi:10.1016/s1004-9541(12)60356-5
Yang, F., Tan, J., Zhao, Q., Du, Z., He, K., Ma, Y., Duan, F., Chen, G. and Zhao, Q. (2011).
"Characteristics of PM2.5 speciation in representative megacities and across
China" Atmospheric Chemistry and Physics 11(11): 5207-5219. doi:10.5194/acp-
11-5207-2011
Yang, L., Pabalan, R. T. and Juckett, M. R. (2006). "Deliquescence Relative Humidity
Measurements Using an Electrical Conductivity Method" Journal of Solution
Chemistry 35(4): 583-604. doi:10.1007/s10953-005-9015-8
Yao, X., Chan, C. K., Fang, M., Cadle, S., Chan, T., Mulawa, P., He, K. and Ye, B. (2002).
"The water-soluble ionic composition of PM2.5 in Shanghai and Beijing, China"
Atmospheric Environment 36(26): 4223-4234. doi:10.1016/s1352-2310(02)00342-
4
Yu, I. T., Li, Y., Wong, T. W., Tam, W., Chan, A. T., Lee, J. H., Leung, D. Y. and Ho, T.
(2004). "Evidence of airborne transmission of the severe acute respiratory
syndrome virus" N Engl J Med 350(17): 1731-1739. doi:10.1056/NEJMoa032867
Yuan, Q., Xu, J., Wang, Y., Zhang, X., Pang, Y., Liu, L., Bi, L., Kang, S. and Li, W. (2019).
"Mixing State and Fractal Dimension of Soot Particles at a Remote Site in the
Southeastern Tibetan Plateau" Environmental Science & Technology 53(14): 8227-
8234. doi:10.1021/acs.est.9b01917
Zhang, D. and Zhang, R. (2005). "Laboratory Investigation of Heterogeneous Interaction
of Sulfuric Acid with Soot" Environmental Science & Technology 39(15): 5722-
5728. doi:10.1021/es050372d
Zhang, Q., Jimenez, J. L., Canagaratna, M. R., Allan, J. D., Coe, H., Ulbrich, I., Alfarra,
M. R., Takami, A., Middlebrook, A. M., Sun, Y. L., Dzepina, K., Dunlea, E.,
Docherty, K., DeCarlo, P. F., Salcedo, D., Onasch, T., Jayne, J. T., Miyoshi, T.,
Shimono, A., Hatakeyama, S., Takegawa, N., Kondo, Y., Schneider, J., Drewnick,
F., Borrmann, S., Weimer, S., Demerjian, K., Williams, P., Bower, K., Bahreini,
R., Cottrell, L., Griffin, R. J., Rautiainen, J., Sun, J. Y., Zhang, Y. M. and Worsnop,
D. R. (2007). "Ubiquity and dominance of oxygenated species in organic aerosols
in anthropogenically-influenced Northern Hemisphere midlatitudes" Geophysical
Research Letters 34(13): L13801. doi:10.1029/2007gl029979
Zhang, R., Khalizov, A. F., Pagels, J., Zhang, D., Xue, H. and McMurry, P. H. (2008).
"Variability in morphology, hygroscopicity, and optical properties of soot aerosols

235
during atmospheric processing" Proceedings of the National Academy of Sciences
105(30): 10291. doi:10.1073/pnas.0804860105
Zhao, M., Liao, L., Xiao, W., Yu, X., Wang, H., Wang, Q., Lin, Y. L., Kilinc-Balci, F. S.,
Price, A., Chu, L., Chu, M. C., Chu, S. and Cui, Y. (2020). "Household Materials
Selection for Homemade Cloth Face Coverings and Their Filtration Efficiency
Enhancement with Triboelectric Charging" Nano Lett 20(7): 5544-5552.
doi:10.1021/acs.nanolett.0c02211
Zhou, Y. and Cheng, Y. S. (2017). "Evaluation of N95 Filtering Facepiece Respirators
Challenged with Engineered Nanoparticles" Aerosol and Air Quality Research
16(1): 212-220. doi:10.4209/aaqr.2015.06.0399
Zhu, N., Zhang, D., Wang, W., Li, X., Yang, B., Song, J., Zhao, X., Huang, B., Shi, W.,
Lu, R., Niu, P., Zhan, F., Ma, X., Wang, D., Xu, W., Wu, G., Gao, G. F., Tan, W.
and China Novel Coronavirus Investigating Research Team (2020). "A Novel
Coronavirus from Patients with Pneumonia in China, 2019" N Engl J Med 382(8):
727-733. doi:10.1056/NEJMoa2001017
Zuo, Z., Kuehn, T. H. and Pui, D. Y. H. (2013). "Performance evaluation of filtering
facepiece respirators using virus aerosols" American Journal of Infection Control
41(1): 80-82. doi:10.1016/j.ajic.2012.01.010

236
Appendix
This appendix contains copies of copyright permissions granted by the owners of
the journals where the work is published.

237

238