the effect of product diversification on the financial
TRANSCRIPT
THE EFFECT OF PRODUCT DIVERSIFICATION ON THE
FINANCIAL PERORMANCE OF MICROFINANCE
COMPANIES IN KENYA
BY
MAINA JOSEPH KIMARU
D61/67342/2011
A RESEARCH PROJECT SUBMITTED IN PARTIAL
FULFILMENT OF THE REQUIRMENTS FOR THE DEGREE
OF MASTER OF BUSINESS ADMNISTRATION OF THE
BUSSINESS UNIVERSITY OF NAIROBI
NOVEMBER, 2013

ii
DECLARATION
I declare that, this is my original work and has not been presented for a graduate
degree in any other university.
Signature___________________________________Date___________________
MAINA JOSEPH KIMARU
D61/67342/2011
This research Project has been submitted for examination with my approval as the
university supervisor.
Signature__________________________________Date_____________________
Supervisor
JOSEPH BARASA
DEPARTMENT OF FINANCE & ACCOUNTING
SCHOOL OF BUSINESS
UNIVERSITY OF NAIROBI

iii
ACKNOWLEDGEMENT
I am deeply grateful to the Almighty God who makes all things possible and for
giving me strength, good health and sound mind throughout the study period.
First, I would like to extend my appreciation to my supervisor, family, friends and
all the respondents who contributed tremendous inputs towards the successful
completion of this research project.
Special gratitude and appreciation go to my Supervisor, Mr. Joseph Barasa, for his
patience, guidance, support and dedication throughout the study. He was such an
inspiration! I truly feel indebted to him.
Secondly, I am grateful to my parents James and Martha , for foreseeing the future
and sacrificing so much to prepare and support me, the same extends to my entire
family, for cheering me up after every tough day of fieldwork.
Finally, I am grateful to all the respondents who provided invaluable data and
information. I couldn‟t have done it without them!

iv
DEDICATION
To
My loving mum
Martha Nyaguthi Theuri
(Your sacrifices never went unnoticed and are forever appreciated)
To
My dear father
James Theuri Kimaru
(You were there when I needed you and you made this possible, your support
Went a far way and I appreciate it)
To
My aunt
Helen Mureithi Gichuiya
(You were a source of inspiration, your faith moved mountains, without it I
couldn‟t be this far)
God bless your lives and may you live in His favour
v
ABSTRACT
The main objectives of this study were to identify the types of diversification in the
Kenyan microfinance market and how they relate to performance and to establish
the effect of non interest based diversification on the financial performance of
MFI‟s. These non interest based services include money transfer, saving products ,
deposit taking and micro insuarance. The study adopted a descriptive survey
design and relied on secondary data collected from the financial statements, news
bulletins and websites of Central Bank of Kenya (CBK) and Deposit Taking
Microfinance Institutions.
The collected data was cleaned and coded before being analyzed by use of the
Statistical Package for Social Sciences (SPSS). The data analysis techniques
included descriptive statistics like the mean, minimum, maximum and standard
deviation. In addition, inferential statistics like correlation analysis and regression
analysis were also used to establish relationships between the dependent and
independent variables. The findings were presented in tables and graphs.
Major research findings indicated that the diversification indicator, Return on
Assets (R.O.A) indicator and Return on Equity (R.O.E) indicator were on a
growth pace from 2008 to 2012. In addition, the findings indicated that
diversification of products and services at the DTMs explained 62.11% on the
financial performance of the DTMS. However, only the ROA had a significant
correlation at a level of significance of 0.01. The main conclusion was that the
diversification of products was an appropriate strategy to increase the profit
potential of DTMs. The researcher recommends improvement of the product
adoption and innovation policies to increase product diversification and hence
assure the DTMs of increased earnings. There is also need for the DTMs to recruit
product managers with specific product portfolios in order to ensure they are
responsible and continually drive the innovation agenda of the DTMs. The
researcher suggests that a similar study be carried out targeting all the MFIs in
Kenya with an aim of establishing the effect of product differentiation on the
profitability of the MFIs. This will inform the strategy of the MFIs and strengthen
their role in the economic development of the country.
vi
TABLE OF CONTENTS
DECLARATION ................................................................................................. ii
ACKNOWLEDGEMENT ................................................................................. iii
DEDICATION.................................................................................................... iv
ABSTRACT ......................................................................................................... v
LIST OF TABLES ........................................................................................... viii
LIST OF FIGURES ........................................................................................... ix
LIST OF ACRONYMS AND ABBREVIATIONS ............................................ x
CHAPTER ONE ................................................................................................. 1
INTRODUCTION ............................................................................................... 1
1.1Background of the Study ............................................................................... 1
1.1.1 Product Diversification .......................................................................... 1
1.1.2 Financial Performance ........................................................................... 2
1.1.3 Effect of Product Diversification on Financial Performance ................... 3
1.1.4 Microfinance Institutions in Kenya ........................................................ 4
1.2 Research Problem ........................................................................................ 8
1.3 Objectives of the Study .............................................................................. 10
1.4 Value of the Study ..................................................................................... 11
CHAPTER TWO .............................................................................................. 12
LITERATURE REVIEW ................................................................................. 12
2.1 Introduction ............................................................................................... 12
2.2 Theories on Product Diversification ........................................................... 12
2.2.2. Resource/Efficiency Based View (RBV) ............................................ 13
2.2.3. Internal Transaction Cost .................................................................... 13
2.2.4. Agency Theory ................................................................................... 14
2.3 Empirical Review ...................................................................................... 15
2.4 Summary ................................................................................................... 24
CHAPTER THREE .......................................................................................... 26
RESEARCH AND METHODOLOGY ............................................................ 26
3.1 Introduction ............................................................................................... 26
3.2 Research Design ........................................................................................ 26
3.3 Population .................................................................................................. 26
3.4 Sample ....................................................................................................... 27
vii
3.5 Data Collection .......................................................................................... 27
3.6 Data Analysis ............................................................................................. 27
CHAPTER FOUR ............................................................................................. 29
DATA ANALYSIS, RESULTS AND DISCUSSION ....................................... 29
4.1 Introduction ............................................................................................... 29
4.2 Descriptive Statistics .................................................................................. 29
4.2.1 Financial Performance of DTM for the Period 2008 to 2012 ................ 30
4.2.2 Product Diversification by DTM for the Period 2008-2012 .................. 30
4.3 Correlation Analysis .................................................................................. 31
4.4 Regression Analysis .............................................................................. 33
4.5 Coefficients of the Independent Variables .................................................. 34
4.6 Discussion of Findings ............................................................................... 36
CHAPTER FIVE ............................................................................................... 38
SUMMARY, CONCLUSION AND RECOMMENDATIONS........................ 38
5.1 Introduction ............................................................................................... 38
5.2 Summary of the Findings ........................................................................... 38
5.3 Conclusions ............................................................................................... 39
5.4 Recommendations for Policy and Practice .................................................. 40
5.5 Limitation of the Study .............................................................................. 40
5.6 Suggestion for Further Study...................................................................... 41
REFERENCES .................................................................................................. 43
APPENDIX 1: LIST OF REGISTERED MFI’S IN KENYA ......................... 46
APPENDIX II: DTM INDICATORS FOR DTM FOR THE PERIOD
BETWEEN 2008 – 2012 .................................................................................... 51
APPENDIX III: AVERAGE DTM INDICATORS FOR DTM FOR THE
PERIOD BETWEEN 2008 – 2012 .................................................................... 52
APPENDIX 4 ..................................................................................................... 53
RAW REGRESSION ANNALYSIS ................................................................. 53
viii
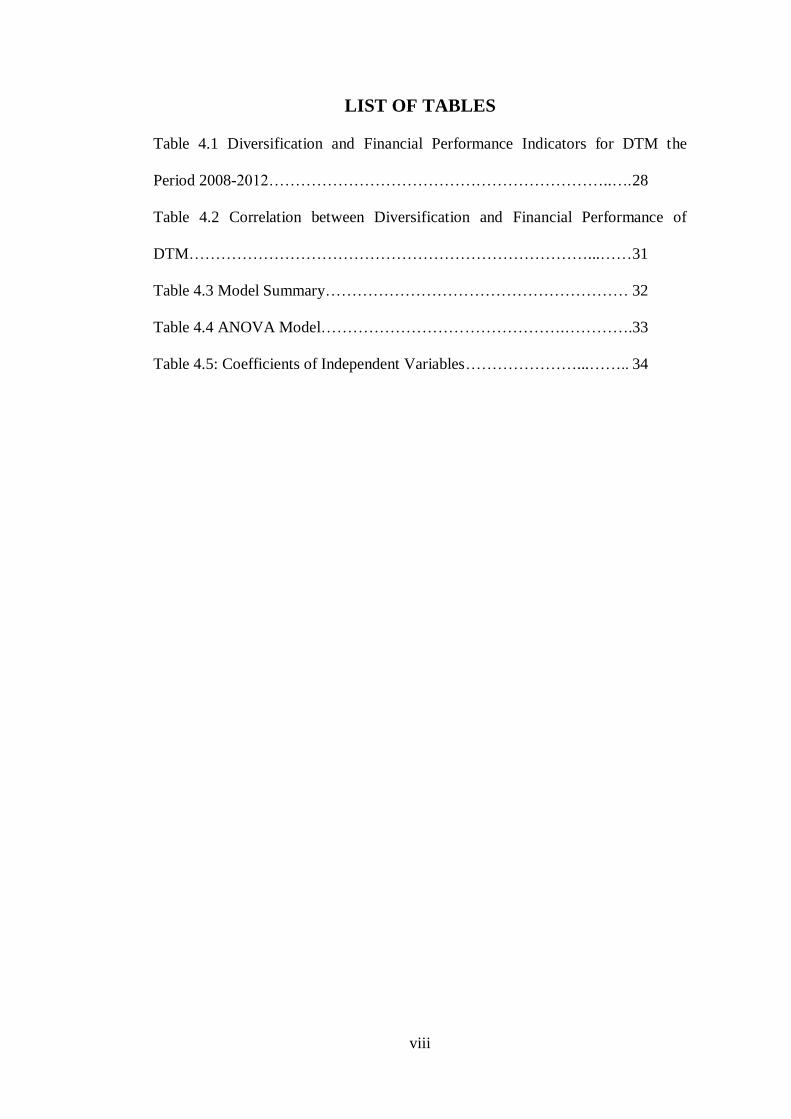
LIST OF TABLES
Table 4.1 Diversification and Financial Performance Indicators for DTM the
Period 2008-2012………………………………………………………..…. 28
Table 4.2 Correlation between Diversification and Financial Performance of
DTM…………………………………………………………………...…… 31
Table 4.3 Model Summary………………………………………………… 32
Table 4.4 ANOVA Model……………………………………….………….33
Table 4.5: Coefficients of Independent Variables…………………...…….. 34

ix
LIST OF FIGURES
Figure 4.1 Financial Performance of DTM for the Period 2008 – 2012….. 29
Figure 4.2 Diversification Indicator of DTM for the Period 2008 – 2012… 30
x
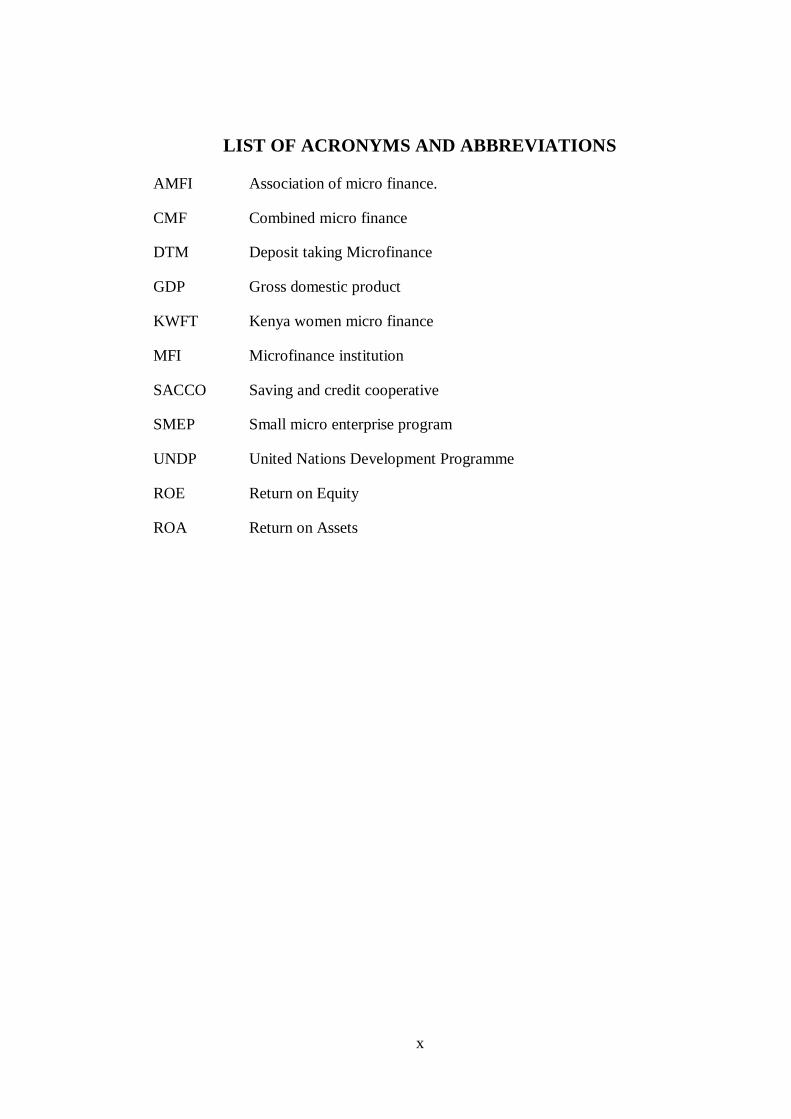
LIST OF ACRONYMS AND ABBREVIATIONS
AMFI Association of micro finance.
CMF Combined micro finance
DTM Deposit taking Microfinance
GDP Gross domestic product
KWFT Kenya women micro finance
MFI Microfinance institution
SACCO Saving and credit cooperative
SMEP Small micro enterprise program
UNDP United Nations Development Programme
ROE Return on Equity
ROA Return on Assets
1
CHAPTER ONE
INTRODUCTION
1.1Background of the Study
In Kenya, there has been a fluctuation of the interest rates since year 2011 and this has
led to people taking lesser credit and more defaulting in loans. This is according to the
central bank of Kenya. Financial institutions, which primarily depend on interest
income for their operations, have in that sense reduced their dependence on the
interest income by diversification. They have focused on other non interest income.
The Micro finance institutions have not been left behind on this. Does this always
lead to better performance? Kenya being a developing economy, it has many micro
finance institutions and they have also been affected by the interest rates vitality.
Below are introduction to the concepts of product diversification and performance
followed by the problem statement.
1.1.1 Product Diversification
Diversification is a concept of reducing risk in finance. It is a fundamental concept of
portfolio theory. It can simply be defined as a way of not putting all eggs in the same
basket derived from Markowitz portfolio theory (Marling and Emanuelson 2012). The
risk taken care of here is the unsystematic risk. In financial services providence, it
refers to development, marketing and delivery of one or more financial services that
expand an institutions existing product offering. The application of the theory depends
on the risk component of every stock systematic and unsystematic risk. Its purpose is
to dilute the unsystematic risk of the portfolio by selecting products with low
coleration to each other (Hu 2012).
2
The concept of risk management is hence very important. Risk is the probability of
loss inherent in an organisations operations and environment such as competition and
adverse economic conditions (Orina 2011). Risk can either be financial risk due to use
of debt or business risk. Business risk is divided into systemic risk that occurs to the
whole industry hence affection everyone and unsystemic risk that occurs only to a
particular firm. Only unsystemic risk can reduced by diversification. Other
approaches to reducing risk are using insuarance, government programs weather
modification among others. What diversification does is to lower the variance of a
portfolio if the product are not in the same line (Orina 2011).
Beside the risk reduction, there are other benefits of diversification. According to
Orina (2011), diversification enhances growth. It provides a base for increase in
market share. Diversification also helps in survival of firms by increasing customer
base for the firm. Hence the firm can depend on more than one product to increase
and maintain their customer base. Diversification also, in cyclical businesses, helps in
regulation of cash flows throughout the year. Ann example would be those who deal
with winter products, can diversify to summer products to make sure they have
sufficient cash flows throughout the year. In a financial institution, more sources of
income would ensure there are sufficient cash flows for loans and other operating
expenses.
1.1.2 Financial Performance
Performance can be defined as meeting a goal (Boru 2011). It is the accomplishment
of a given task measured against present known standards. Its measure is used to
evaluate the relative success of a firm. There have been various methods of measuring
3
the performance of a firm as explained by Block and Hirt (1992). There are those that
measure profitability, others liquidity, asset utilization and debt utilization. In the
setting of a microfinance institution, Rosenberg (2009) gives five basis of evaluating
micro finance institution. This is breadth of outreach, depth of outreach, loan
repayment, financial sustainability and efficiency. The reason why outreach is very
important is that MFI‟s institutions target the poor. It‟s very important to keep
evaluating performance to make sure that the institution remains viable and achieves
both short term and long term goals.
There are many recorded drivers of performance of financial institutions. Harker and
Zenios (1998) list the following as the main drivers. One of them is strategy. Strategy
is a key driver for success. Strategy should be in the areas of product mix, client mix ,
geographical locations and distribution channels. Other drivers are flexibility and
responsiveness in operations, ability to understand time based competition in response
to customers‟ needs, diversification and organizational efficiency. They also list some
environmental drivers of performance which are innovation, regulation and
technology. Innovation enables a firm to produce new products, produce former
products but more efficiently among others. Regulation prevents unfair competition
for firms hence enhancing performance. Technology as a driver of performance
enables efficient production, new product production among others.
1.1.3 Effect of Product Diversification on Financial Performance
This has been an area of much debate on the effects product diversification but what
is agreed is that product diversification has an effect on performance. One argument is
that diversification has no significant impact on performance though it has an impact
on risk adjusted performance (Chang and Elyasiani 2008). Another view is that
4
diversification has had significant effect on performance of financial institutions
especially during economic crisis (Kuppuswany and Villalonga 2010). Among the
effects on performance is that it increases efficiency (Rotich 2011). With those of the
argument that diversification is inefficient saying that additional product come with
additional cost hence they do not increase on performance.
The motives of diversification can be classified under marketing power, agency and
resources. Market power is where organisations indulge in various forms of anti
competitive behavior or in reaction to other competitors. Agency is where managers
may wish to pursue growth through diversification. Resources refer to specific assets,
core competencies or distinctive capabilities of the firms that can potentially be
exploited in new markets. The extent to which diversification increases or decreases
shareholders value in profit oriented firms is still unclear. This clings on performance
(Goddard et al 2008).
1.1.4 Microfinance Institutions in Kenya
Microfinance refers to small-scale financial services for both credit and deposits that
are provided to people who farm, fish or herd, operate small or microenterprises
where goods are produced, recycled, repaired or traded, provide services, work for
wages or commissions, gain incomes from renting out small amounts of land,
vehicles, draft animals, or machinery and tools and to other individuals and local
groups in developing countries, in both rural and urban areas (Marguerite 1998).It is
the provision of financial services to low income and poor individuals and households
that do not have access to formal financial services. Microfinance is a way to extend
same rights and services to low income households that are available to everyone else.
It protects people against shocks and allows the majority of the population to become
5
part of country‟s economic activity. It can help to build markets and show that profits
and principles can reinforce each other (Kofi Anann, UN Secretary General, 10
October 2005).
A microfinance institution (MFI) is an organization that provides financial services
targeted to the poors. While every MFI is different, they all share the common
characteristic of providing financial services to a clientele poorer and more vulnerable
than traditional bank clients. A microfinance institution may be a bank, cooperative,
credit union, non-governmental organization (NGO), or a non-bank financial
intermediary. MFI‟s provide clients from poor households with a range of money
management and banking services, which include credit services, deposit services,
insurance products and financial advisory services. MFIs can be profitable in
providing services to the poor only if costs are contained, risks are managed, and the
clients are treated as active partners.
The clients of microfinance are generally poor and low-income people. They may be
female heads of households, pensioners, artisans or small farmers. The client group
for a given financial organization depends on that organisation‟s mission and goals.
Though the clients are poor the microfinance needs to be sustainable. Microfinance
institutions need to be profitable in order to cover the costs of reaching out and
meeting the demand of underserved segments of the population over a sustained
period of time. Additionally, after a series of very small loans, a micro entrepreneur
often wants to expand her business; a microfinance institution must keep up with the
demand for larger loan amounts so businesses can grow into small enterprises (Kabir
2002).
6
Kenya is a developing country. It has an estimated 41.61 million according to World
Bank. According to UNDP report, poverty level in 2006 was 45.9% which is very
high for a country. This are those classified to be earning less than $2.00 per day. The
main economic activities are agriculture, manufacturing, fishing, mining and
transport. Agriculture has the highest GDP of about 24% according to Kenya bureau
of statistics (2012) report. Financial intermediation had GDP of 6.4% in 2011.
According to central bank of Kenya website by 2012 December, the financial sector
was made up of 43 commercial banks, 1 mortgaging finance corporation, 8 deposit
taking micro finance institutions, about 3500 Saccos, one post office saving bank, and
109 foreign exchange banks. There has been asset and profit increase in the
commercial banking sector. The number of deposit taking microfinance has been
increasing over time since the act that formed them was passed. The Kenyan
microfinance sector is made up of both formal and informal institutions.
The microfinance sector has grown tremendously over the years. In 2012, Kenya was
ranked 5th in the economic intelligence unit global microfinance 2012. This was the
highest in Africa. This shows that the sectors has grown compared to other countries.
The ranking was done based on regulatory framework and practices, supporting
institutional framework and adjustable factors. This was notable in Kenya because of
the implementation of the microfinance act 2006 and SACCO societies act 2008
especially the licensing of DTM‟s. Mobile banking also played a big part in
improving the sector which also has played a big part in the overall banking industry
improvement. Stability due to negative political climate scored the worst for Kenya.
7
Since 1980s, the landmark in Kenyans microfinance history is the intermediary
microfinance act of 2006. This is because before there was no specific laws regulating
the sector. However since that law , those that keep deposits have to be regulated by
the central bank of Kenya.
According to the Microfinance Act 2006 , one of the major issues is licensing of
deposit taking microfinance institution . This involves a process of transformation for
the current MFI that involves various institutional changes. It is much easier for a new
MFI to be registered as a DTM than for an old one to be transformed. The process for
licensing a DTM has the following process. First the name should be approved by the
register of companies and names. If approved the name should be forwarded to the
CBK in order of priority with words deposit taking microfinance or its acronym
DTM. Secondly apply for a license by completing and submitting a certified
application form to the CBK accompanied with all supporting documents prescribed
in the regulation. This includes documents supporting the minimum core capital
provision. Also complete and submitted are the “fit and proper forms” for all
significant shareholders and proposed director with accompanying supporting
documents. The third step is assessment by CBK and issuance of letter of intent. Upon
meeting the requirements for licensing, the CBK advises the applicant on the next step
of payment of the licensee fees, preparation of business premises, instillation of
Management information systems and completing the remaining documents. The final
step is where the CBK issues the license upon satisfaction.
DTM business is on the increase in Kenya and better regulated (Ndulu 2010). But
there are factors that affect the transformation of MFIs. This includes governance and
8
ownership challenges. This occurs because the MFI are transmitting from ownerless
to owned and getting people who are willing to invest is a challenge. Another
challenge would be the transition process to a limited liability company which comes
with stiffer regulations. The capital challenge cannot go unnoticed since the basic
minimum capital is 60 million for national wide DTM and 20 million for a
community based DTM. Strong leadership is required and also staff must be involved
in the transition process sometimes it requires staff upgrade. Acquiring management
information system is expensive.
1.2 Research Problem
Product Diversification can occur due to various reasons. Palmer (1998) lists some of
the causes as follows. When a product has reached its maturity phase of its lifecycle
and it is heading to decline, a new product may be sought to maintain the sales level.
This occurs to make the organisation remain relevant. Secondly a new product may
be developed as a way of maximizing on the available capacity. Institutions may also
develop a new product to balance the existing portfolio, reducing the risk of
depending on few products hence reducing risk. It also reaches a point where clients
need to be kept and make them obtain loyalty. Introducing a new product would lead
to this. All this factors are some of the causes of product diversification in micro
finance institutions.
There is a consensus that most MFI‟s have moved from a single product which was
loans to multiple array of products (cambier 2010, Aghion and Morduch 2005, Dupas
and Robison 2009). These products are diverse, while some may be documented,
others are not. Actually, according to Aghion and Morduch (2005), there has been
9
microfinance revolution form micro credit to „microfinance‟. This includes collecting
savings from the low income households, to provide micro insuarance. The change of
name has come with a change in orientation towards less poor households and
towards the establishment of commercially oriented fully regulated financial entities.
But it is also agreed that microfinance institutions are to serve the poor (cambier
2010, Aghion and morduch 2005, Kabir 2002). The problem arises when the various
factors make them unsustainable. With the emergence of multiple products, the big
question has been whether they are reaching the poor or they are aimed at alienating
the poor (cambier 2008).
There are various aspects of MFI. This includes viability, sustainability, outreach and
development goals. Viability is how an institution covers its cost. Sustainability is
how an institution mobilizes internal funding. Outreach is on how the institution is
able to reach out to its target population and how accessible it is. The development
goals define why an organisation exists. For successful existence of an MFI, it should
be able to manage both the income and expenses in a way that it is profitable hence
sustainable without keeping aside its developmental goals. The performance of an
MFI should enable it to serve both the short term and long-term goals. This is what
leads to diversification of product to offer more avenues of income. However this
income may come attached to an extra cost. When this cost outnumbers the income,
then the MFI will run at a loss. MFI are also faced with competition from commercial
banks and their fellow microfinance institutions. McIntosh et al (2004) notes that
there before MFI‟s were established as regional monopolies but that has changed.
There has been rising lenders as the industry expands. He notes that entrant of
competition induces a deterioration in repayment performance and a decrease in
10
savings among borrowers. Is then diversification the solution to this? Does
diversification open ways for MFI‟S to find new market segments? Does it in any way
enhance performance in the MFI?
Given the recent focus on non interest income for financial institutions there is need
for the effects of this shift to be identified for financial institutions. In the same time
there has been more fluctuations in the interest rates in the Kenyan market posing risk
on financial institutions. Micro finance institutions in Kenya have been on the
increase according to the central bank of Kenya. Most have followed the path of
commercial banks and diversified from interest income. To bridge that gap various
research have been done on the effect of diversification to financial institutions
performance. this has been done for various financial institutions like U.S.A by
Gordan, McKillop and Wilson (2008) doing „diversification and financial
performance of US credit unions. In Kenya it has been done by Kimeu (2012) and
Rotich et al (2011) focusing on commercial banks. However none has been done on
the microfinance institutions in Kenya leaving a gap. It is in this regard this I have
decided to take on this research. The main questions being what are the types of
diversification and what are their effects on the financial performance of the Deposit
Taking Micro finance institutions in Kenya.
1.3 Objectives of the Study
The objectives of the study were:
i. To identify the types of diversification in the Kenyan microfinance market.
ii. To establish the effect of diversification on the financial performance of
Deposit Taking Microfinance Institutions in Kenya.

11
1.4 Value of the Study
With the findings, the micro finance institutions can get to know whether the current
diversification mechanisms are beneficial or detrimental to them achieving their goals
and after that enable them to plan and improve on their diversification.
To prospective investors in the area of micro finance, they can have ideas on
diversification of microfinance products and the effect of diversification to their
institutions.
To scholars and future researchers the study will increase the field of knowledge and
will give them an opportunity to reexamine the area of study and use the findings as a
source of reference. The study will be used as a stepping stone to studying
diversification of product.
12
CHAPTER TWO
LITERATURE REVIEW
2.1 Introduction
This chapter looks at relevant literature in the background of diversification and
microfinance. It looks at the theories that relate to diversification of products, then
goes forward to look at the empirical evidence in product diversification in
microfinance. It then looks at the Kenyan case of microfinance and Faulu DTM.
Lastly it looks at the methodological issues that have arisen.
2.2 Theories on Product Diversification
Diversification can be defined as the development, marketing and delivery of one or
more products that expand an institutions existing product offering (Frankiewicz and
Churchill 2011). There are various theories that try to explain diversification. Among
them are market based theory, Resource Based View, Internal Transaction Cost
theory and Agency Theory. These are explained below.
2.2.1 Market Based View
This theory states that firms will diversify in order to enhance corporate strategic
competiveness. If this is achieved the firm value will increase. The first argument
refers to Porter (1980) opinion. He noted that competition was vital for survival in a
corporate environment. He defined a corporate environment as the industry the firm
is. The corporate environment is full of competition. Barney (2002) explains that
diversification is one strategy to overcome the competition. By diversifying,
companies can build market power. Market-based view approach explains that
13
companies diversify with motivation to overcome the competition complexity, to
build financial strength and cost efficiency.
2.2.2. Resource/Efficiency Based View (RBV)
This theory has been derived from Penrose (1959) (as quoted by Kor and Mahoney
2004) stating that diversification is driven by the exploitation of some firm specific
resources that have been accumulated in the past. He says that performance to that
company is a set of combination of resources, so there is the growth of the firm
theory. This theory explains that company‟s growth is limited by opportunities that
exist as a function of a set of the company's earning power source. Penrose's theory
gave birth to RBV. RBV basic reason was the guide, type, amount and nature of
enterprise resources should be considered first in selecting, establishing strategies that
can lead to sustainable competition in order to achieve competition advantage.
2.2.3. Internal Transaction Cost
In diversification context, internal cost efficiency is possible if the company develops
diversification through vertical integration between complementary businesses.
Development of vertical integration and complementary businesses are done to meet
assumptions of Transaction Cost. There is a relationship between the frequency the
business unit intensity to cope uncertainty and a prioritized on specific business
transactions. Porter (1980) explains that vertical integration is a combination of
production processes, distribution, sale and/or other economic processes, which are
different technologies within the boundaries of a single firm. This reflects that
company decision was to use internal transactions rather than market transactions in
order to achieve economic goals. According to Porter, one benefits of vertical
14
integration is that companies improve the company's ability to offer a value added
differentiation and more under management control.
2.2.4. Agency Theory
Agency theory (Jensen & Meckling, 1976) explains that separation between the owner
and manager of company will always followed by emergence of cost because the lack
of interests alignment between owners and managers. These costs are called agency
costs and this include expenditure to monitor the managers activities, expenditure to
create an organizational structure to minimizes the unwanted managers actions, as
well as the opportunity cost arising from the condition in which the manager cannot
make decisions immediately without shareholder approval. One important implication
of the agency problem is related to the company's investment policy. Investors would
prefer high risky high returns profiles while managers prefer low risky low return
profiles. This is so since they have a personal fear of losing their jobs. Diversification
can provide incentives for managers through investment and ownership. Therefore,
the emphasis is not only based on performance evaluation of financial outcomes, but
more emphasis on optimize behavior (Jensen & Meckling, 1976; Jensen, 1986).
Hermalin and Katz (2000) states that risk averse managers would like to diversify
away risks associated with their firms. On the other hand, in evaluating corporate
investments, the owners of the firm care about the expected level of returns, the
riskiness of returns and the informativeness of returns as a signal of managerial
effortability. This brings out the agency conflict.
15
2.3 Empirical Review
The number of non interest income for the financial institutions has been on the
increase. Goddard, McKillop and Wilson (2007), conclude that in 1993 to 2004 there
was a steady increase in the share of non interest income in the operating income of
the US credit union as a whole. The growth of non interest income was made possible
by technological progress and deregulation. They also note that large credit unions are
the ones that benefited most from diversification unlike small unions which lack
expertise and have less capital. They argue that big financial institutions have capacity
to expand by diversification unlike small institutions which are sometimes run by
unqualified personnel and may not have adequate technology.
Chang and Elyasiani (2008), doing their research in 510 Financial holding companies
in USA on relationship of financial performance and insuarance as an additional
product , using quaternary panel observations of year 2003-2005, find out that bank
expansion into non interest activities can improve risk adjusted performance.
Insuarance activities according to them can help small sized financial holding
companies improve on risk adjusted returns but do not have consistent significant
impact on performance of very large financial companies.
While doing a research on the effects of rising competition on the incumbent lenders,
Craig et al (2004), come up with various conclusions on MFI competition. The
research done in the years 1998 to 2002 in Uganda aimed at analysing the behavior of
borrowers in case of competition of MFI‟s particular entry of a new MFI. Data was
collected from individuals, groups and district information centers on microfinance.
16
The number of MFI‟s has been on the increase and that has finished the monopoly
initially in the market. They also noted that credit saturation was lower in the rural
areas though there was more entrance of MFI‟s there than in the urban centers.
Competition brings about deterioration in performance of loans and a decrease in
saving deposits among incumbent MFI. This is because clients take up multiple loans
thus damaging the repayment rate of the incumbent MFI. The MFI does also have to
share on the deposits hence lesser deposits per MFI. They found out that loan volumes
in the market don‟t change hence entrants of new MFI just brings more sharing of
current loans volumes. All this shows that we cannot avoid competition and ways
have to be made to stay competitive. This is where diversification comes in handy.
For sustainability the income avenues have to be increase in a competitive market
hence increase in performance.
There is other research that has been done on the relationship between performance
and diversification in banks. Souza and Lai (2003) dealing with diversification of loan
portfolio with respect to region in Canada and efficiency of big five chartered banks,
found that the banks were systematically underperforming hence no sufficient
efficiency diversification. However a merger between banks with different business
lines but similarities in the region composition can result to more efficient entity.
Turkmen and Yigit (2012) assessing the relationship between sectoral diversification
and bank performance in 40 banks in turkey find that diversification had a negative
effect on performance. They argue that diversification brings about increased cost
hence lesser profit.
17
Zohra and Pandey (2011) took a study to compare the financial performance of
microfinance institutions with that of commercial banks in India. They conclude form
their findings that there is no significant difference in return on equity, return on
assets, debt equity ratio and net profit margin. However there is a significant
difference in operating expenses to total assets of commercial banks to microfinance
institutions on the advantage of commercial banks. The conclusion is that MFI‟s incur
high operating costs because of their business model which is a door step delivery
model. Banks on the other side incur lower cost because the customers mostly come
to be served.
Huang and Chen (2008) on their research based in Taiwan on commercial banks for
year 1992 to 2004 note that banks with high interest income and low noninterest
income operate more cost effectively. This is because diversification causes an
additional cost. Those that had diversified were less cost effective. They also note
there is a growing percentage of a non interest income in the operating incomes in
Taiwan.
One of the arguments is that diversification is brought up to increase organisational
competitiveness. Jensen (1986) states that competition in the product and factor
market drive prices towards average cost hence reduce the marginal revenue.
Managers must therefore increase efficiency for survival of the organisation. There
are many ways of dealing with competition which includes takeovers, mergers,
diversification and expansion in the same line of business.
18
Risk management is also another argument that brings up diversification.
Diversification is one tactic that firms use to manage risk. Pyle (1997) defines risk
management as process by which manager satisfy the needs of potential risk
measuring by identifying the key risks, obtaining constant, understandable ,
Operational risk measures, choosing which risk to reduce and which to increase and
by what means , establishing to monitor the results risk position. The main risk that
can be reduced by diversification is called the unsystemic risk. Firms undertake a
variety of actions to reduce risks through diversification, including entering diverse
business lines, taking on project partners and maintaining portifolios of risky projects
such as research and development of natural resource exploration (Hermalin and Kutz
2004). Diversification aims at reducing the overall risk.
There are several relationships that have been researched on with diversification. One
of them that has been brought to light is the relationship between diversification and
informativeness. There is a positive coleration between diversification and
informativeness hence risk reduction according to Hermalin and Kutz (2004). By
informativeness we mean the owners (shareholders), who are the principals in the
agency theory, having information about agents (in these case managers). The owners
prefer a return structure that entails a high degree of risk but is highly informative to
one that has low risk and lowly informative. This is where the agency conflict
originates. Diversification enables the owners to get more information on the
managers and hence reduce the risk that the owners have set on their investment. But
this depends largely on the managers where the manager can choose to follow the
owners preferred diversification conditions or take the whole responsibility of
diversifying. This latter, which is known as delegation can sometimes prove costly for
19
the owner hence more risky. In this case the manger will have increased risk. So in
essence the coleration between risk and diversification lies heavily on the manager. If
he follows the owners preferred diversification, then the risk is reduced.
Another relationship that has been compared with diversification is with firms‟
performance (Marinell 2011). The main question He asks is whether the relationship
is causal. He concludes by saying there is a relationship between diversification and
performance but it is not causal , it is attributable to factors other than the degree of
relatedness among business units and the degree of internal efficiency of the market
which has a statistical significance contribution but a marginal explanatory power to
explain the persistence of positive and negative return. That is positive relationship
between performance and diversification goes beyond the simple explanation of an
efficient internal capital market or a certain degree of relatedness among business
segments.
In a Kenyan case, Kimeu (2012) evaluates the effects of income diversity to
performance of commercial banks. In the study period 2000-2010, he concludes that
there are a few benefits expected in income diversification from traditional banking
although there was a growing importance of non interest income. He notes that
noninterest income is more volatile and with increased volatility, there are fewer
benefits from diversification. A higher diversification is associated with low lending
rates according to central bank of Kenya, being a benefit to the banks by avoiding
over reliance on interest income. Rotich et al (2011) on their case on Kenyan
commercial banks find out that there is a linear relationship between diversification
and financial performance. In their research of 44 banks in Kenya year 2005-2009
20
concludes that financial diversification leads to improved performance. Larger banks
have a greater ability to expand. They also note that non interest based income has
been on the increase. Finally interest and non interest incomes are found to be
correlated.
In some studies diversification has proved helpful in times of economic crisis.
Kuppuswany and Villalonga (2010) note that diversification increased in the 2007-
2009 financial crisis in U.S.A. They note that diversification gave firms both
financing and investment advantages. The value of diversified firms increased relative
to single segment firms during the same crisis and that the value of diversification has
increased beyond the crisis. Another study was done by Herimo and Mekonnen
(2012) this time on MFI in Ethiopia for year 2004 to 2009. In this institution, there
was no diversification during the year. The MFI was on the increase until 2009 when
the effects of economic crisis were experienced. It went to a decline in 2009.
However there have been various studies that have not very much approved the use of
diversification for competition. Jensen (1986) one of his conclusions is that
diversification programs are more likely to generate losses than takeovers or
expansion in the same line of business or liquidated motivated takeovers. This is to
mean they are a bit more risky than other forms of dealing with risk.
Product diversification in the financial sector came up as a result of structural forces
of change. Gamra and Plihon (2011) results support that this is what led to banks
diversifying to new business strategies incase of this forces of change. In a sample of
Asian and Latin America countries banking institutions, they note that diversification
has more gains that offset the cost of increased exposure to the noninterest income.
21
They note that there has been that diversion lately and in the firms side it means
increased cost. The returns however are able to cover the cost especially during crisis.
However the is the probability that there will be diseconomies of scale in some cases
of diversification. This occurs due to the poor monitoring, incentives that induce risk
of default and decrease return when a bank expands into the industry where it faces
lack of skills and expertise. In essence you don‟t just diverse, proper planning and
implementation is necessary.
One interesting field has been diversification in the micro finance sector. This has
often been referred to as combined microfinance (CMF). Microfinance refers to loans,
savings, insurance, transfer services and other financial products targeted at low-
income clients. A combination of this three or any two bring about combined
microfinance. Rossel (2008) defines combined microfinance as the delivery of at least
two financial product categories. Microfinance thinking has changed from focus on a
credit mono product to a full array of financial services and from a target of
microenterprises to the broader marketing low income households including both
business and family needs (Rhyne and Otero, 2006). The ideal array of services is a
basic core package savings, credit, insurance and payments. There are also special
financial products for growing microenterprises or agricultural businesses e.g. bill
payments, pension which target different segments for the clients (Rhyne and Otero,
2006).
Rossel (2012) on his research on 250 MFI‟s in Latin America and Caribbean conclude
that there is increased efficiency in MFI‟s after diversifying. This efficiency does not
lead to overall sustainability. Since MFI‟s are aimed at social impact, financial
22
performance comes second though it is very important for sustainability. This is
because most MFI‟s rely on grants to evade collapse.
While offering loans has been the primary activity of MFI‟s, there have been several
diversifications in it. Dallien et al (2005) discuss on the loan lending has been
diversified. Before group lending was the mode of lending that was used by
microfinance organisations to do the lending. The screening of the loanee, following
up the loanee, monitoring and enforcing of issues lied on the group. This has been
diversified by offering loans to individuals. When lending is done to an individual, a
lot of responsibility lies on the MFI since the manager and the lending institution are
the ones responsible for screening and following up. These loans are tailor made
based on specific needs of each applicant.
Another service that has been introduced that is close to loans is leasing. Since MFI
target the poor the leasing for small equipment, the difference of leasing and loans is
that in leasing, the equipment is given to the client and has to make periodical
payments until it is fully paid. Until then the equipment remains the property of the
institution. It is usually a contract between the MFI (leaser) and the lessee (the
borrower). At the completion of regular payments the ownership of the equipment is
transferred to the lessee. This provides an increased customer base for the institution
besides the profit gained from this. The main challenge with this is that it is the
responsibility of the leaser to ensure that the equipment remains in a good order until
all the payments are made hence extra work for the MFI. Also the separation between
ownership and usage is an increased in liability and litigation risk ( Frankiewicz and
Churchill 2011).
23
Frankiewicz and Churchill (2011) also look at the way MFI‟s are drifting to offering
SME services. They give some guidelines that must be followed. The reason for this
up scaling has been the potential demand that has arisen from the SME sector. When
the poor are educated and form SME, they are most likely to need financing.
Previously approaching commercial banks was hard, although these days they are
downscaling to the SME segment. This market segment has been because of potential
demand caused by SME‟s, potential for growth, potential for profit and potential for
innovation. However financing SME sometimes can be very risk especially where
there have no collateral. For MFI‟s to diversify to SME‟s , it means that they have to
be prepared to offer business advice hence have to train their staff and acquire new
staff with higher knowledge.
Taking deposits has also been one form of diversification in MFI‟s. This has increased
the efficiency of MFI‟s. The deposits are used for lending reasons hence achieving
cost efficiency in their operation (Cambier 2011).This is very key to growth of an
MFI. They also help increase the client base and improve borrower‟s capacity to
repay. This has included the savings which can be either compulsory or voluntary.
Compulsory are those funds that must be deposited by borrower in order to be eligible
for a loan or sometimes to be eligible for membership. Voluntary savings can be
regular savings or contractual saving or time deposits. All this will call for
management increase in human resource, technology and hence more investment.
(Kabir 2002, Frankiewicz and Churchill 2011). Long term saving has also been
another form of saving which includes periodical saving for a long time like 10 years.
The product must be well designed to fit the customer (Frankiewicz and Churchill
24
2011). Savings products and technologies must be designed appropriately to respond
to the characteristics of different market segment as the motives of each particular
saver are very complex and the advantages and disadvantages of several different
savings forms are compared in order to define the best savings portfolio mix, savings
products and technologies can only be successful when they suit to the needs of the
savers (Wisniwski 1998).
Another service that has been has been introduced is the money transfer. In carrying
out its social responsibility, an MFI can channel remittances and government transfer
payments to the poor households living in isolated areas that are not served by other
providers. This was before a reserve of the commercial banks. Some services under
this are the money orders, cheques, electronic funds transfer and mobile money
transfer. They can offer internal money transfer or partner with other organisations
(Frankiewicz and Churchill 2011). Frankiewicz and Churchill (2011) also note that
this can take time before they are profitable.
2.4 Summary
There is consensus that non interest diversification is taking place in the MFI‟s and
that there is also growth of noninterest income in financial institution. This has been
brought about by need to keep on with competition from others. This diversification
in MFI‟s has often be referred to as combined microfinance. MFI‟s have a social role
in poverty alleviation and to get this they have to remain viable in the long run. this
has made them to diversify. The literature reviewed suggests that there is a conflicting
agreement on regards to the effect of diversification on performance. However there

25
are listed benefits of diversification. In this research, I will identify the diversification
in the MFI‟s and also calculate its level and also find out its effect on performance.
26
CHAPTER THREE
RESEARCH AND METHODOLOGY
3.1 Introduction
The research aimed at identifying the type of diversification services that micro
finance institutions offer and how they affect their performance. It tried to explore
deeper on the issue of profitability and social action of the microfinance sector. The
subsequent sections describe the research design, the population, sample, data
collection and analysis.
3.2 Research Design
The research design was informed by the research objectives and the kind of research
questions asked. The research objectives were derived for the purpose of research
(Saunders et al 2009). The questions were what are the types of diversification of
products in an MFI‟s and what their effects are. The research questions could lead to
descriptive and explanatory answer (Saunders, Lewis and Thornhill 2009). The data
collected was quantitative data and was from secondary sources. The research strategy
was a survey of microfinance institutions on product diversification and performance.
So the study focused on registered microfinance institutions. The reason is that this
registered MFI‟s have to produce their financial statements as required by the law.
This secondary data was gotten from daily newspapers, websites and from the
financial offices.
3.3 Population
The population for this study were all the MFIs in Kenya registered under AMFI in
2012 as Deposit Taking Microfinance institutions. There are fifty non deposit taking
27
MFI‟s and eight Deposit taking microfinance. AMFI registers all institutions that offer
services of microfinance including commercial banks, insuarance companies,
development institutes and large to small MFI‟s.
3.4 Sample
The sample was taken randomly from the population. The target confidence interval
was 95%. So the target sample was seven and above DTM. This ensured that data was
highly representative of the population.
3.5 Data Collection
Secondary data was used this were the income statement and statement of financial
position. A letter of introduction detailing the objectives was used. Further secondary
data was used to for quantitative data from financial statements. These were the
balance sheet and the statement of income. These helped to get the quantitative data
needed for this research. The target period was 2008-2012.
3.6 Data Analysis
The data was analysed using the model below. Explanatory data analysis approach
was used as explained by Saunders et al (2009). This approach uses diagrams to
explore and understand data. This will also be used to present the data. Descriptive
statistics were also used to summarise the data. This included use of frequency,
percentages or proportions and means. The data from the financial statements was
analysed to give performance and diversity.
The procedure employed is built on Stiroh and Rumble (2006). Performance for a
financial organisation has the following model.
28
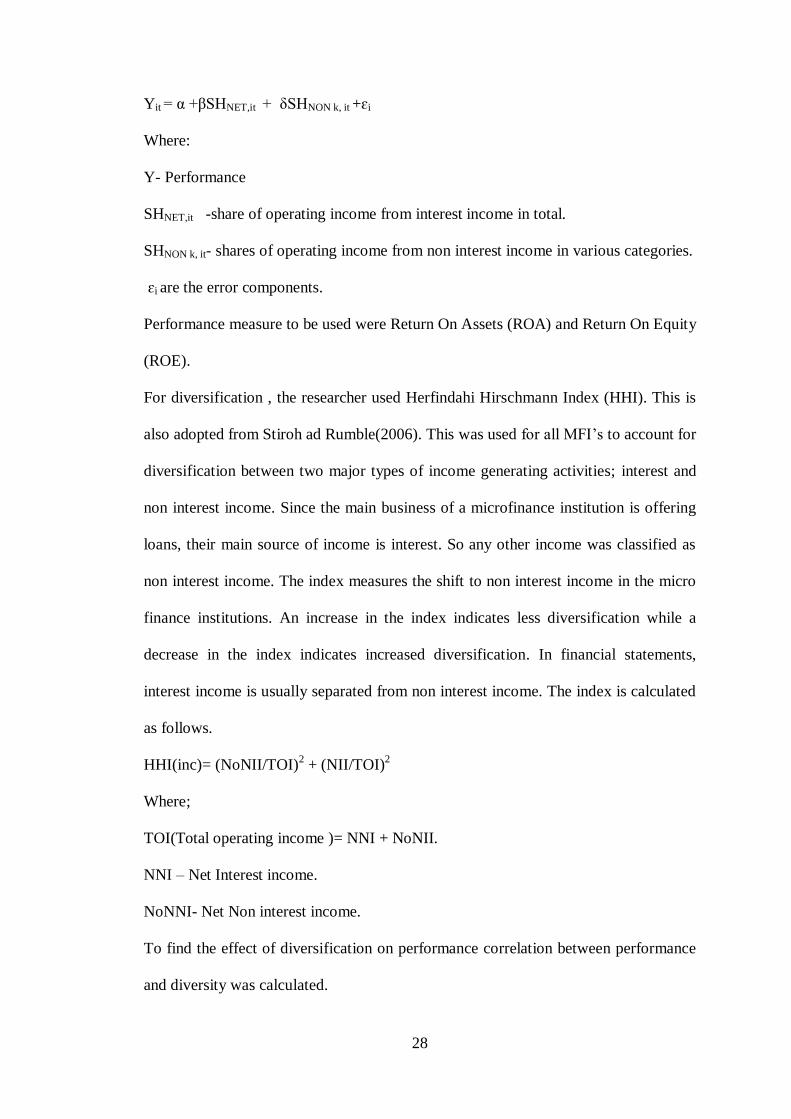
Yit = α +βSHNET,it + δSHNON k, it +ɛi
Where:
Y- Performance
SHNET,it -share of operating income from interest income in total.
SHNON k, it- shares of operating income from non interest income in various categories.
ɛi are the error components.
Performance measure to be used were Return On Assets (ROA) and Return On Equity
(ROE).
For diversification , the researcher used Herfindahi Hirschmann Index (HHI). This is
also adopted from Stiroh ad Rumble(2006). This was used for all MFI‟s to account for
diversification between two major types of income generating activities; interest and
non interest income. Since the main business of a microfinance institution is offering
loans, their main source of income is interest. So any other income was classified as
non interest income. The index measures the shift to non interest income in the micro
finance institutions. An increase in the index indicates less diversification while a
decrease in the index indicates increased diversification. In financial statements,
interest income is usually separated from non interest income. The index is calculated
as follows.
HHI(inc)= (NoNII/TOI)2 + (NII/TOI)
2
Where;
TOI(Total operating income )= NNI + NoNII.
NNI – Net Interest income.
NoNNI- Net Non interest income.
To find the effect of diversification on performance correlation between performance
and diversity was calculated.
29
CHAPTER FOUR
DATA ANALYSIS, RESULTS AND DISCUSSION
4.1 Introduction
This chapter presents analysis and findings of the study as set out in the research
methodology. The study findings are presented as an evaluation of the relationship
between product diversification and financial performance of Deposit Taking
Microfinance Institutions (DTM). The performance of the DTM is measured by
Return on Equity and Return on Assets. The data analysis techniques include
descriptive statistics, correlation analysis, regression analysis and coefficient of
determination.
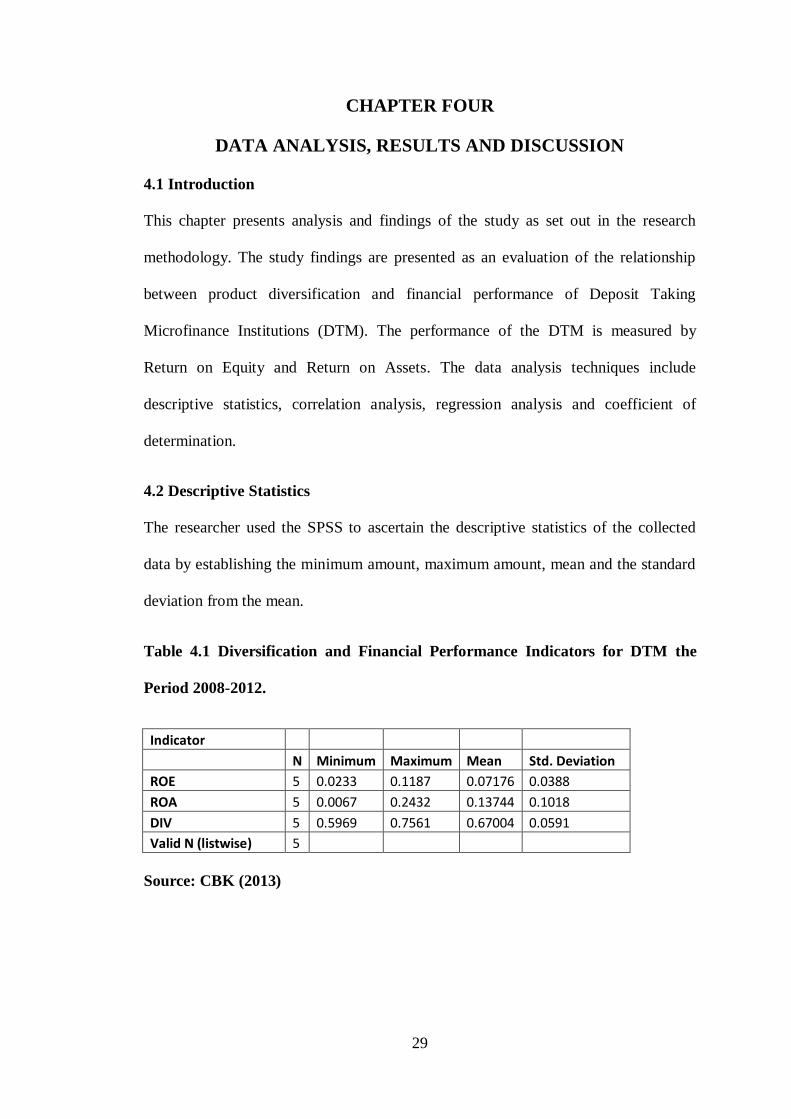
4.2 Descriptive Statistics
The researcher used the SPSS to ascertain the descriptive statistics of the collected
data by establishing the minimum amount, maximum amount, mean and the standard
deviation from the mean.
Table 4.1 Diversification and Financial Performance Indicators for DTM the
Period 2008-2012.
Indicator
N Minimum Maximum Mean Std. Deviation
ROE 5 0.0233 0.1187 0.07176 0.0388
ROA 5 0.0067 0.2432 0.13744 0.1018
DIV 5 0.5969 0.7561 0.67004 0.0591
Valid N (listwise) 5
Source: CBK (2013)
30
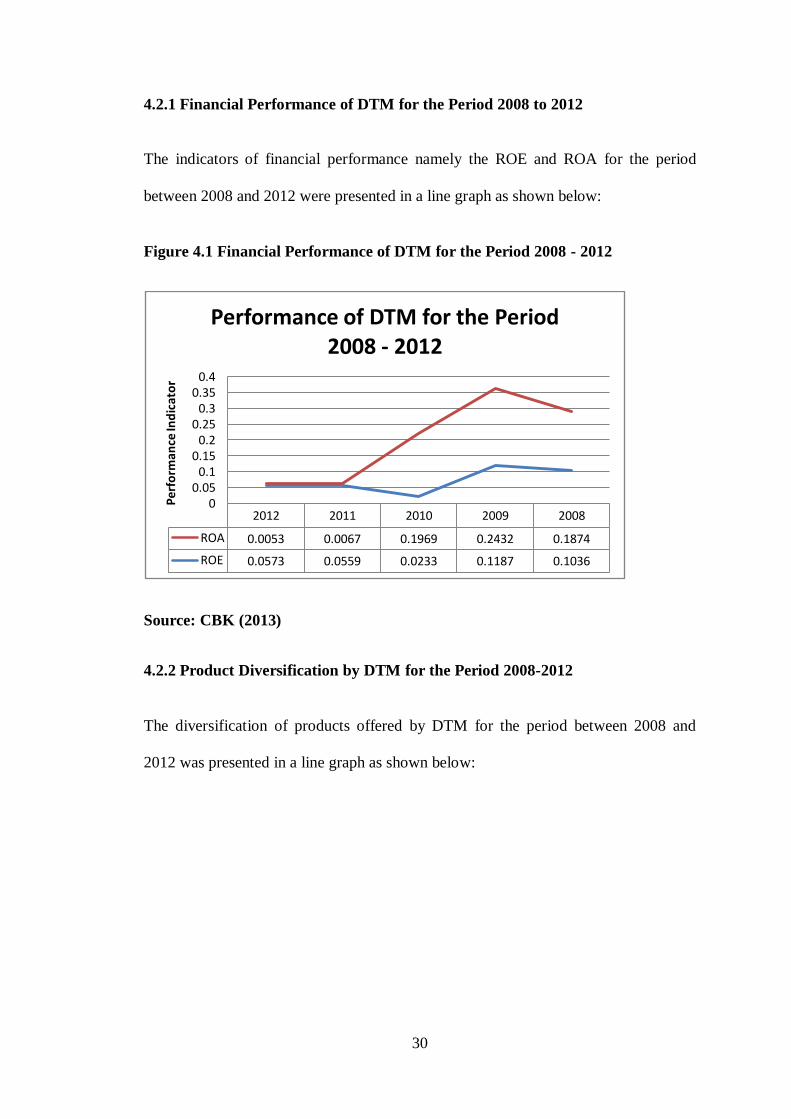
4.2.1 Financial Performance of DTM for the Period 2008 to 2012
The indicators of financial performance namely the ROE and ROA for the period
between 2008 and 2012 were presented in a line graph as shown below:
Figure 4.1 Financial Performance of DTM for the Period 2008 - 2012
Source: CBK (2013)
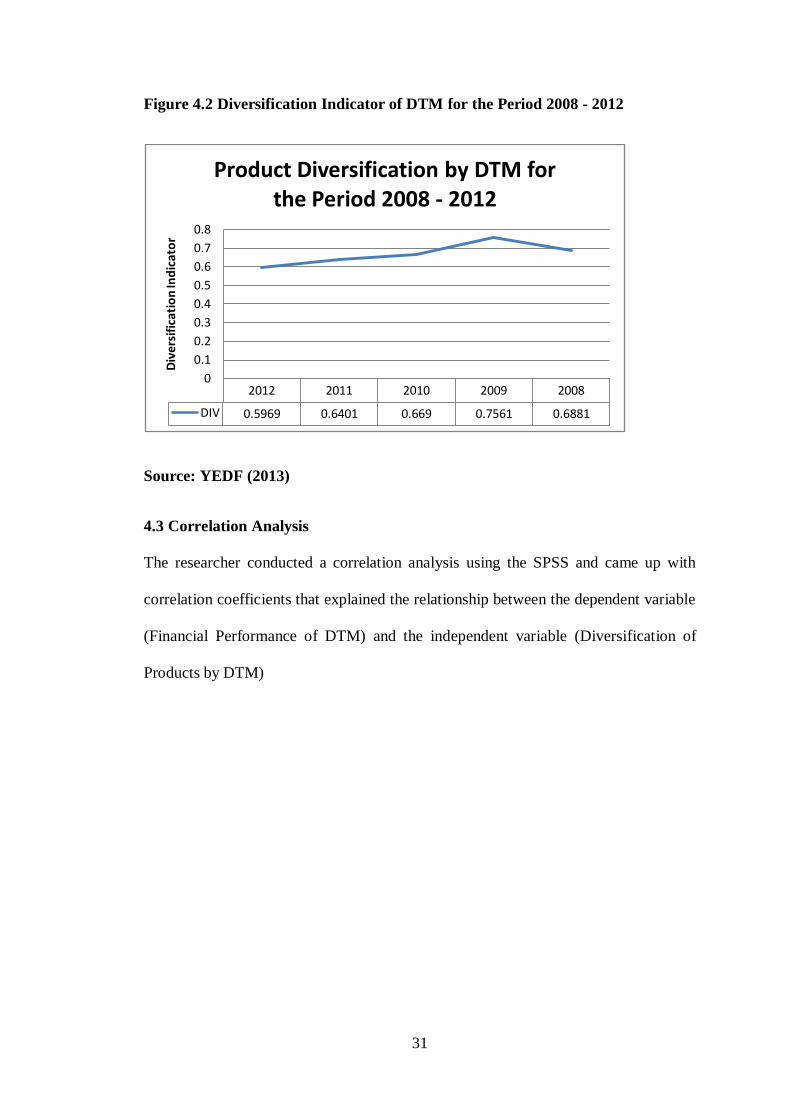
4.2.2 Product Diversification by DTM for the Period 2008-2012
The diversification of products offered by DTM for the period between 2008 and
2012 was presented in a line graph as shown below:
2012 2011 2010 2009 2008
ROA 0.0053 0.0067 0.1969 0.2432 0.1874
ROE 0.0573 0.0559 0.0233 0.1187 0.1036
00.05
0.10.15
0.20.25
0.30.35
0.4
Per
form
ance
Ind
icat
or
Performance of DTM for the Period 2008 - 2012
31
Figure 4.2 Diversification Indicator of DTM for the Period 2008 - 2012
Source: YEDF (2013)
4.3 Correlation Analysis
The researcher conducted a correlation analysis using the SPSS and came up with
correlation coefficients that explained the relationship between the dependent variable
(Financial Performance of DTM) and the independent variable (Diversification of
Products by DTM)
2012 2011 2010 2009 2008
DIV 0.5969 0.6401 0.669 0.7561 0.6881
0
0.1
0.2
0.3
0.4
0.5
0.6
0.7
0.8
Div
ers
ific
atio
n In
dic
ato
rProduct Diversification by DTM for
the Period 2008 - 2012
32
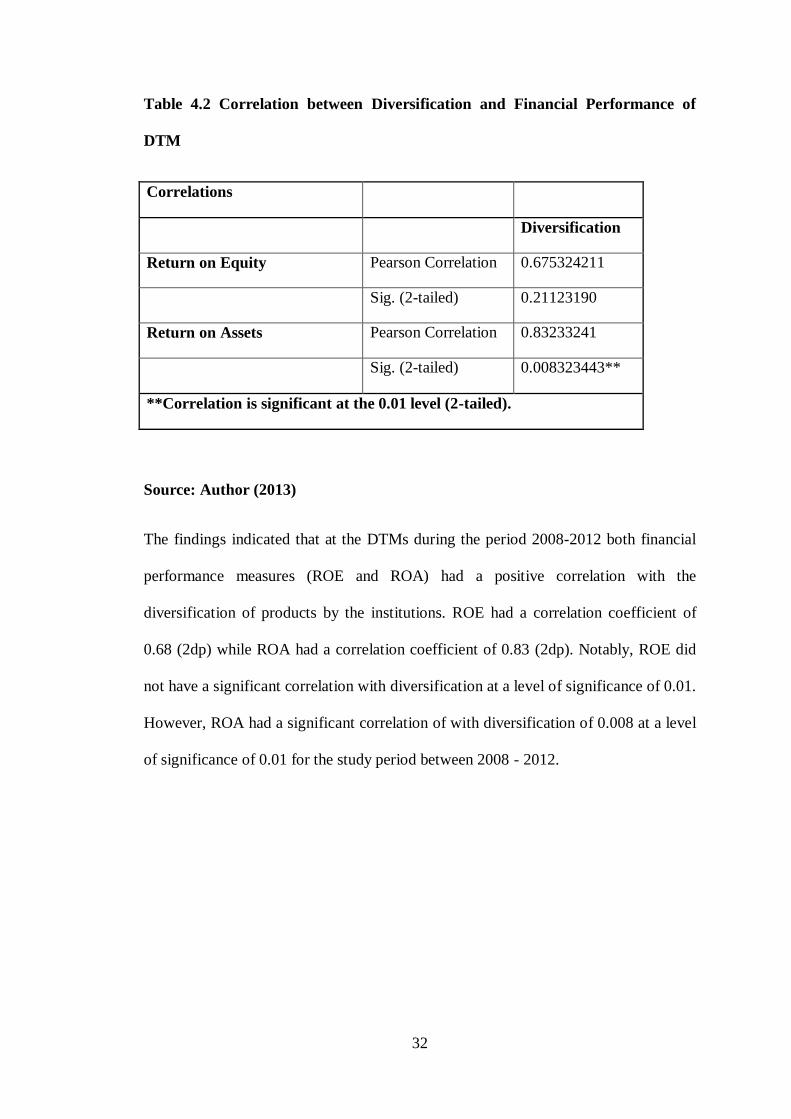
Table 4.2 Correlation between Diversification and Financial Performance of
DTM
Correlations
Diversification
Return on Equity Pearson Correlation 0.675324211
Sig. (2-tailed) 0.21123190
Return on Assets Pearson Correlation 0.83233241
Sig. (2-tailed) 0.008323443**
**Correlation is significant at the 0.01 level (2-tailed).
Source: Author (2013)
The findings indicated that at the DTMs during the period 2008-2012 both financial
performance measures (ROE and ROA) had a positive correlation with the
diversification of products by the institutions. ROE had a correlation coefficient of
0.68 (2dp) while ROA had a correlation coefficient of 0.83 (2dp). Notably, ROE did
not have a significant correlation with diversification at a level of significance of 0.01.
However, ROA had a significant correlation of with diversification of 0.008 at a level
of significance of 0.01 for the study period between 2008 - 2012.
33
4.4 Regression Analysis
In addition to the above analysis, the researcher conducted a multiple regression
analysis so as to test relationship among the independent variables. The researcher
applied the SPSS to aid in the computation of the measurements of the multiple
regressions for the study.
Table 4.3 Model Summary
Model
Summary
Model R R Square
Adjusted R
Square
Std. Error of the
Estimate
1 0.900066731 0.811034129 0.621171641 0.036378987
Source: Author (2013)
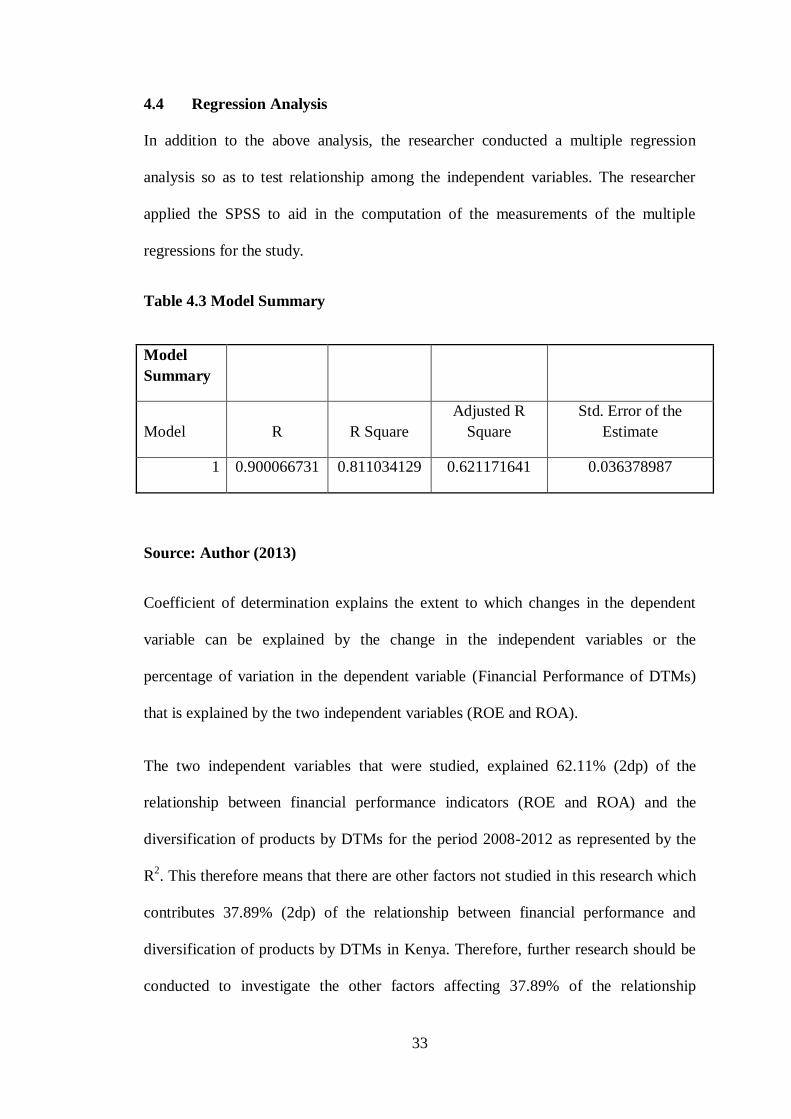
Coefficient of determination explains the extent to which changes in the dependent
variable can be explained by the change in the independent variables or the
percentage of variation in the dependent variable (Financial Performance of DTMs)
that is explained by the two independent variables (ROE and ROA).
The two independent variables that were studied, explained 62.11% (2dp) of the
relationship between financial performance indicators (ROE and ROA) and the
diversification of products by DTMs for the period 2008-2012 as represented by the
R2. This therefore means that there are other factors not studied in this research which
contributes 37.89% (2dp) of the relationship between financial performance and
diversification of products by DTMs in Kenya. Therefore, further research should be
conducted to investigate the other factors affecting 37.89% of the relationship
34
between financial performance and diversification of products offered by DTMs in
Kenya.
Table 4.4 ANOVA Model
Source: Author (2013)
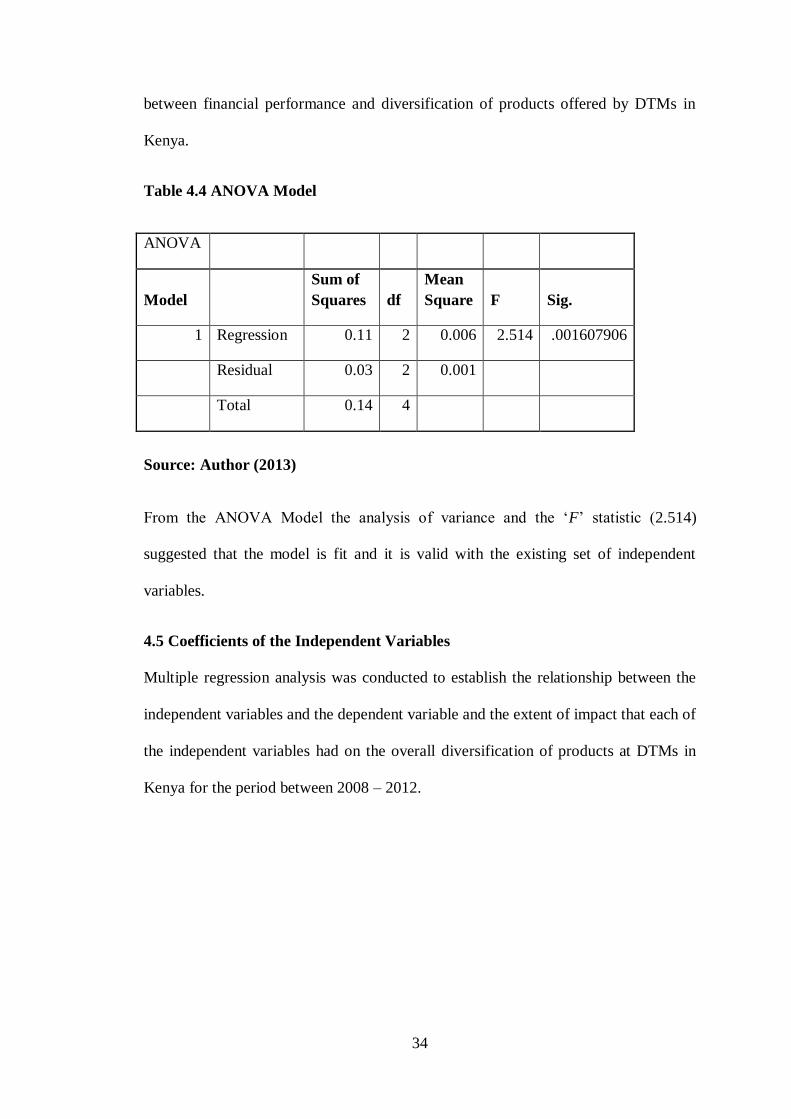
From the ANOVA Model the analysis of variance and the „F‟ statistic (2.514)
suggested that the model is fit and it is valid with the existing set of independent
variables.
4.5 Coefficients of the Independent Variables
Multiple regression analysis was conducted to establish the relationship between the
independent variables and the dependent variable and the extent of impact that each of
the independent variables had on the overall diversification of products at DTMs in
Kenya for the period between 2008 – 2012.
ANOVA
Model
Sum of
Squares df
Mean
Square F Sig.
1 Regression 0.11 2 0.006 2.514 .001607906
Residual 0.03 2 0.001
Total 0.14 4
35
Table 4.5: Coefficients of Independent Variables
Coefficients
Unstandardized
Coefficients
Standardized
Coefficients t Sig.
Model B
Std.
Error Beta
1 (Constant) 0.5752 0.0392 14.788 0.193
ROE 0.5833 0.5227 0.3836 1.116 0.380
ROA 0.3854 0.1994 0.6641 1.936 0.005**
Source: Author (2013)
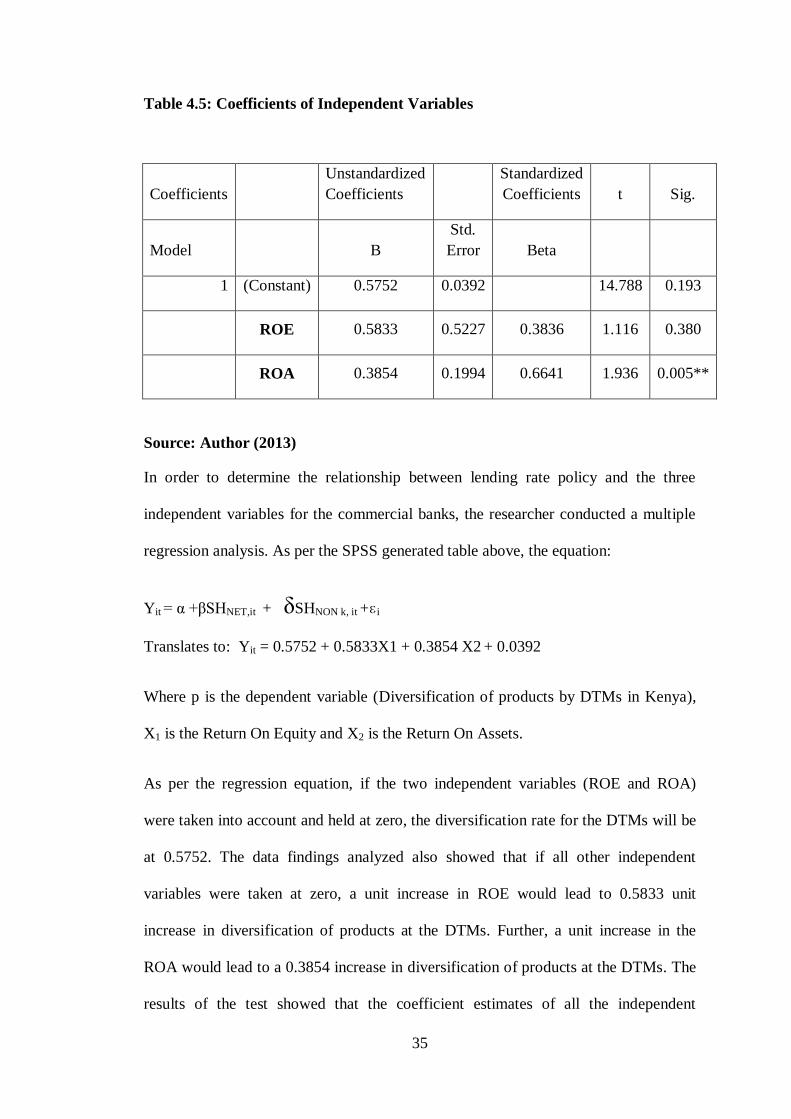
In order to determine the relationship between lending rate policy and the three
independent variables for the commercial banks, the researcher conducted a multiple
regression analysis. As per the SPSS generated table above, the equation:
Yit = α +βSHNET,it + δSHNON k, it +ɛi
Translates to: Yit = 0.5752 + 0.5833X1 + 0.3854 X2 + 0.0392
Where p is the dependent variable (Diversification of products by DTMs in Kenya),
X1 is the Return On Equity and X2 is the Return On Assets.
As per the regression equation, if the two independent variables (ROE and ROA)
were taken into account and held at zero, the diversification rate for the DTMs will be
at 0.5752. The data findings analyzed also showed that if all other independent
variables were taken at zero, a unit increase in ROE would lead to 0.5833 unit
increase in diversification of products at the DTMs. Further, a unit increase in the
ROA would lead to a 0.3854 increase in diversification of products at the DTMs. The
results of the test showed that the coefficient estimates of all the independent
36
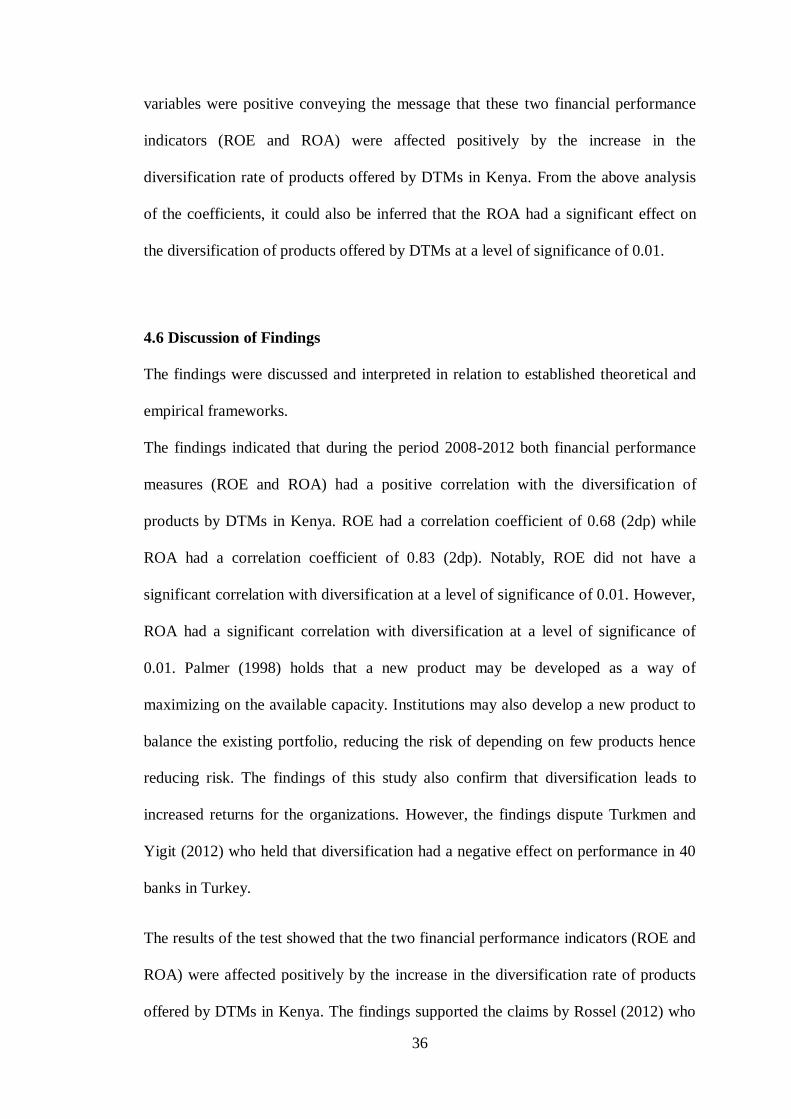
variables were positive conveying the message that these two financial performance
indicators (ROE and ROA) were affected positively by the increase in the
diversification rate of products offered by DTMs in Kenya. From the above analysis
of the coefficients, it could also be inferred that the ROA had a significant effect on
the diversification of products offered by DTMs at a level of significance of 0.01.
4.6 Discussion of Findings
The findings were discussed and interpreted in relation to established theoretical and
empirical frameworks.
The findings indicated that during the period 2008-2012 both financial performance
measures (ROE and ROA) had a positive correlation with the diversification of
products by DTMs in Kenya. ROE had a correlation coefficient of 0.68 (2dp) while
ROA had a correlation coefficient of 0.83 (2dp). Notably, ROE did not have a
significant correlation with diversification at a level of significance of 0.01. However,
ROA had a significant correlation with diversification at a level of significance of
0.01. Palmer (1998) holds that a new product may be developed as a way of
maximizing on the available capacity. Institutions may also develop a new product to
balance the existing portfolio, reducing the risk of depending on few products hence
reducing risk. The findings of this study also confirm that diversification leads to
increased returns for the organizations. However, the findings dispute Turkmen and
Yigit (2012) who held that diversification had a negative effect on performance in 40
banks in Turkey.
The results of the test showed that the two financial performance indicators (ROE and
ROA) were affected positively by the increase in the diversification rate of products
offered by DTMs in Kenya. The findings supported the claims by Rossel (2012) who
37
concluded that there is increased efficiency in MFI‟s upon diversifying after
conducting a research on 250 MFI‟s in Latin America and Caribbean. In addition, the
findings indicate that the DTMs use diversification as a risk management tool which
is also supported by Hermalin and Kutz (2004) who hold that firms undertake a
variety of actions to reduce risks through diversification, including entering diverse
business lines.
Jensen (1986) holds that diversification programs are more likely to generate losses
than takeovers or expansion in the same line of business or liquidated motivated
takeovers. In this research, two independent variables (ROE and ROA) explained
62.11% (2dp) of the relationship and this means that there are other factors not
studied in this research which contributes 37.89% (2dp) of the relationship between
financial performance and diversification of products by DTMs in Kenya. Therefore,
there is still need to reaffirm that diversification leads to improved financial
performance by conducting further research to close the gap of 37.89% that was
unexplained by this study.
38
CHAPTER FIVE
SUMMARY, CONCLUSION AND RECOMMENDATIONS
5.1 Introduction
This chapter provides the summary of the findings from chapter four and also gives
the conclusions and recommendations of the study based on the objective of the study
which were to identify the types of diversification in the Kenyan microfinance market
and how they relate to performance and to establish the effect of non interest based
diversification on the financial performance of MFI‟s. It also presents the conclusions
based on the findings and the recommendations for policy and practice. It ends with
the presentation of the limitations of the study and suggestion for further studies.
5.2 Summary of the Findings
The findings indicated that at the DTMs during the period 2008-2012 both financial
performance measures (ROE and ROA) had a positive correlation with the
diversification of products by the institutions. ROE had a correlation coefficient of
0.68 (2dp) while ROA had a correlation coefficient of 0.83 (2dp). Notably, ROE did
not have a significant correlation with diversification at a level of significance of 0.01.
However, ROA had a significant correlation with diversification at a level of
significance of 0.01 for the study period between 2008 - 2012.
The two independent variables that were studied, explained 62.11% (2dp) of the
relationship between financial performance indicators (ROE and ROA) and the
diversification of products by DTMs for the period 2008-2012 as represented by the
R2. This therefore means that there are other factors not studied in this research which
contributes 37.89% (2dp) of the relationship between financial performance and
diversification of products by DTMs in Kenya. Therefore, further research should be
39
conducted to investigate the other factors affecting 37.89% of the relationship
between financial performance and diversification of products offered by DTMs in
Kenya.
The results of the test showed that the coefficient estimates of all the independent
variables were positive conveying the message that these two financial performance
indicators (ROE and ROA) were affected positively by the increase in the
diversification rate of products offered by DTMs in Kenya. From the above analysis
of the coefficients, it could also be inferred that the ROA had a significant effect on
the diversification of products offered by DTMs at a level of significance of 0.01.
From the ANOVA Model the analysis of variance and the „F‟ statistic (2.514)
suggested that the model is fit and it is valid with the existing set of independent
variables.
5.3 Conclusions
The findings indicated that the financial measures under study, ROE and ROA, had a
positive correlation with the diversification of products at the DTMs. Therefore, it can
be concluded that the more the diversification of products increases the profit
potential of DTMs.
The results of the test showed that the coefficient estimates of all the independent
variables were positive conveying the message that these two financial performance
indicators (ROE and ROA) were affected positively by the increase in the
diversification rate of products offered by DTMs in Kenya. Therefore, it can be
concluded that diversification of products creates more returns for investors (ROE)
and increases effective utilization of assets (ROA).
40
The regression model explained 62.11% of the effects of diversification on financial
performance indicators (ROE and ROA). Therefore it can be concluded that
diversification of products is mostly driven by the profit motive of DTMs in Kenya.
From the ANOVA Model the analysis of variance and the „F‟ statistic (2.514)
suggested that the model is fit and it is valid with the existing set of independent
variables.
5.4 Recommendations for Policy and Practice
In terms of policy, the researcher recommends that the management of DTMs should
institute appropriate internal mechanisms to ensure that there is constant review of
existing products, development of new products and overall alignment of all product
decisions with the expected earnings and wealth maximization objectives of the
organizations.
In practice, the DTMs should come up with different product portfolios, client
segments and product managers who will be entrusted with the management of
specific product lines. By so doing, the DTMs will ensure maximization of benefits
from products and enhance their overall earnings.
5.5 Limitation of the Study
The study was based on the secondary data mainly collected from audited financial
statements and website of CBK and the DTMs for the period between 2008–2012.
Therefore, the integrity of the findings was as good as the integrity of the financial
statements and the information posted on the websites of the organizations. This
implies that if there were any material errors or misrepresentation of facts in the
41
financial statements or websites, then the findings of this study could also be limited
by those errors and misrepresentations. However, the researcher took due care of the
collected data and ensured proper storage and analysis which enhanced the integrity
of the findings.
The first DTM was in 2009 since the legislation was in 2006. There before they were
regular micro finance institutions. This means in the period before there was a
limitation of diversifying by the law in the period before 2009. This would be a
limitation in the sense that most data was in time of transition. This means that a lot of
expenses may have to transition hence affected the profits hence R.O.E and R.O.A.
Most of the DTM are based in Nairobi and some have only branches in Nairobi.
These causes a limitation in the fact that the data contains in the secondary data
source may not represent the whole country. Hence the results may be biased toward
urban population ignoring most the rural population.
5.6 Suggestion for Further Study
The researcher suggests a similar study be conducted through a survey of all the other
MFIs in Kenya. This is because the MFIs are quickly growing their loan portfolios
and therefore there is need to find out how the diversification of products relates to
the financial performance indicators.
Also , research should be done on why the R.O.E had no significant coleration with
diversification at a significant level of 0.01. Do the fact that they also depend on
grants affect the effect of R.O.E on diversification.
42
Through regression analysis, you notice that ROA and ROE variables explain
62.11%(2dp) of the relationship between financial performance indicators and
diversification of products by DTM‟s. Reseach should be done on the other factors ,
37.89%(2dp) , of the relationship between financial performance and diversification
of products offered by the DTM‟s in Kenya.
Previously, similar research has been done on commercial financial institutions. This
research can be compared with that of microfinance institutions and find out the
difference that diversification offers for both sectors.
Finally the researcher suggests that research should be done on the effects of
individual diversification product on performance. This would involve an individual
classification of income of microfinance. And this would lead to more specific effect
of micro finance activities like micro insuarance and others.
43
REFERENCES
Barney, J. (2002). Gaining and sustaining competition advantage (2nd
edition)
Prentice hall firm, Texas , U.S.A.
Benjamin, E. H., & Michael L.K. (2000). Corporate diversification & agency.
Working paper RTF-291. Retrieved at
http://haas/berketly.edu//finance//wp/rptflist.html.
Cambier, K. R. (2011). Is combining microfinance an instrument to enhance
sustainability; pro poor public policy outcomes. Working paper 2011/5.
Cambier, K.R (2012). Can combined microfinance boost economic results? An
empirical cross sectional analysis. Review of economics and finance
article 2012.
Chang, M. S., & Elyasiani, L. (2007). Product diversification and
performance in the financial industry: Financial Holding Company
expansion into insuarance activities. Presented at ARIA meeting in Portland
2008.
Central Bank of Kenya. A-Z of licensing deposit taking microfinance institution.
www.centralbank.go.ke. Accessed: 3 July 2013.
CGAP( 2013). Smart Aid index 2013 multilateral investment fund.
Churchill, C., & Frankiwiez, C. (2011). Making microfinance work: managing
product diversification. International training centre of the international
labour organisations publication.
Crag, M., Alaind J., & Elisabeth S. (2004). How rising competition among micro
finance institutions affects incumbent leaders. Department of
agricultural and resource economics. U.C Berkely.
David, H. P. (1997). Bank risk management: Theory. Conference on risk
management and regulations in banking. May 17-19 1997 Jerusalem .
Dellien, H., Burnelt, J., Gincherman A., & Elisabeth, L. (2005). Product
diversification in micro finance. Women world banking publication.
FinAcess national survey (2009): Dynamics of Kenya’s changing financial landscape.
Harker, P. T., & Zenions, S. A. (1998). What drives performance of financial
Institution. A Wharton financial institution center publication.
Hemiro, T., Mekonnen, D. (2012). The financial performance of microfinance
institution during current financial crisis; the case of Amhara credit and saving
institution Ethiopia. International journal of business and public
management, 2(2), 81-87.
44
Hu, J.M. (2012). Portfolio construction and utilizing concept of diversification.
University of Miami, school of business administration.
Huang, L. W., & Chen, Y. K (2006). Does bank performance benefit from
nontraditional activities ? A case of non interest income in Taiwan commercial
banks. Asian journal of management and humanity sciences, 1(3), 359-378 .
Jensen, M.C. (1986). Agency costs of free cash flows ,corporate finance and
takeovers. American economic review , 76(2),323-329.
Jensen, M.C, & Meckling, W.H (1976). The theory of the firm, managerial behavior,
agency cost and ownership. Journal of financial economics, 3 (4), 305-
600.
John O.S. (2007). The diversification and financial performance of U.S.A credit
unions. Journal of banking and finance, 32, 1836-1849.
Kabir, H. M. (2002). Microfinance revolution in grameen bank. Financial markets
institutions & instruments, 11,No. 3, august 2002 New York University
Salomon center.
Kenya microfinance act No 19 of 2006. Microfinance act 2006. Retrieved from
www.kenyalaw.org.
Kenya national bureau of statistics (2012): Kenya facts and figures.
Kenya Vision 2030: The popular version. Government of Kenya publication.
Kimeu, J.M (2012). Income diversification in the banking sector and earning ability:
evidence from Kenyan commercial banks. Kenyan bankers association
publication Kenya .
Kuppuswany, V., & Villalonga, B. (2010). Does diversification create value in the
presence of external financial constraints? Evidence from 2007 -2009
financial crisis. Harvard business school publication.
Marinell, F. (2011). Relationship between diversification and firms performance.
IESE Business School- University of Navarra.
Ndulu, J. K. ( 2010. Factors affecting institution transformation; a case study for
microfinance regulatory framework in Kenya. Research report in partial
fulfillment of Msc Development finance, University of Stellenbosch.
Orina, S. O. (2011). Advanced Financial Management. Mustard seed
Publications Nairobi Kenya .
Porter, M. E. (1980). Competitive strategy techniques for analyzing industry and
competitors. The free press New York.
45
Rhyne, E., & Otero, M. (2006): the changing face of Micro finance: closing the q
quality gap. Mix issue 13 .
Robinson, M. (1996). Strategic Issues in Microfinance. Journal of International
development, 8 (2), 153-161.
Rotich, P., Ochieng, D.O., & Away, S. (2011). Income source diversification and
financial performance of commercial banks in Kenya. International journal of
business and public management vol 1 (1), 26-35.
Rosenberg, R. (2009). Measuring results of microfinance institutions: minimum
indicators that donors and investors should track. A technical guide. CGAP
publication.
Saunders, M., Lewis P. & Thornhill, A. (2009). Research methods for business
students, Fifth edition. Pearson Education limited, Prentice Hall.
Souussen, B. G., & Dominique, P. (2011). Revenue diversification in emerging
markets: Implication for financial performance. CEPN high institution
management of Sousse Tunisia publication.
Souza, C. D., Lai, A. (2003). Does diversification improve bank efficiency? The
evolving financial system and public policy. Proceedings of a conference held
by bank of Canada Ottawa.
Stanley B. B., Geoffrey, A. H. (1992). Foundations of financial management. Von
Hoffmann press inc.
Turkmen, S.Y & Yigit (2012). Diversification in banking and its effects on banks
performance: Evidence from Turkey. American international journal of
contemporary research, 2 ,12.
UNDP Annual report 2009.
Wisniwski, S. (1998). Savings in the Context of Microfinance –Lessons Learned
from Six Deposit-Taking Institutions. Presented at Interamerican Forum on
microenterprise Mexico-City 26-28 March 1998.
World bank (2013).Doing business in Kenya, Smarter regulations for small and
medium size enterprises. Washington D.C World Bank Group publication.
Yasemin, Y. K, Joseph T. M. (2004). Edith Penrose‟s 1959 contribution to the
resource based view of strategic management. Journal of management
studies. 41.
Zohra. B., Pandey, S.L.D. (2011). Comparison of micro finance institutions
with commercial banks in India. Australian journal of business and
management research , 6, 110-120.
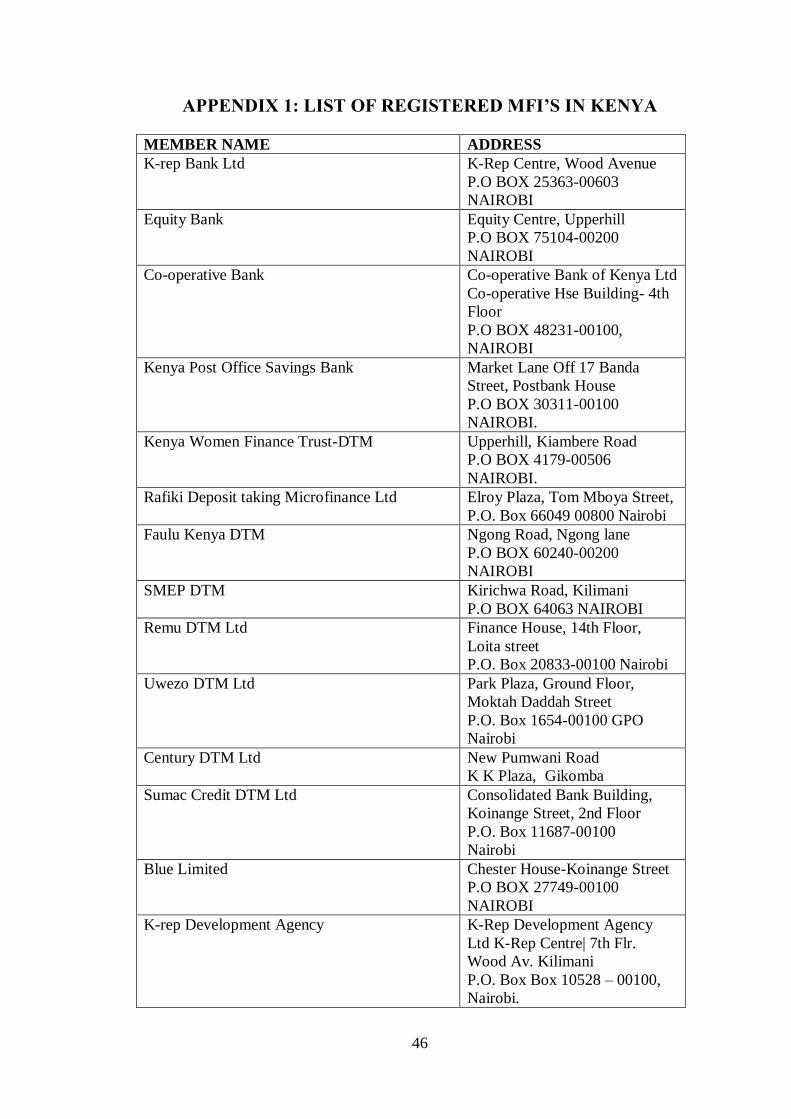
46
APPENDIX 1: LIST OF REGISTERED MFI’S IN KENYA
MEMBER NAME ADDRESS
K-rep Bank Ltd K-Rep Centre, Wood Avenue
P.O BOX 25363-00603
NAIROBI
Equity Bank Equity Centre, Upperhill
P.O BOX 75104-00200
NAIROBI
Co-operative Bank Co-operative Bank of Kenya Ltd
Co-operative Hse Building- 4th
Floor
P.O BOX 48231-00100,
NAIROBI
Kenya Post Office Savings Bank Market Lane Off 17 Banda
Street, Postbank House
P.O BOX 30311-00100
NAIROBI.
Kenya Women Finance Trust-DTM Upperhill, Kiambere Road
P.O BOX 4179-00506
NAIROBI.
Rafiki Deposit taking Microfinance Ltd Elroy Plaza, Tom Mboya Street,
P.O. Box 66049 00800 Nairobi
Faulu Kenya DTM Ngong Road, Ngong lane
P.O BOX 60240-00200
NAIROBI
SMEP DTM Kirichwa Road, Kilimani
P.O BOX 64063 NAIROBI
Remu DTM Ltd Finance House, 14th Floor,
Loita street
P.O. Box 20833-00100 Nairobi
Uwezo DTM Ltd Park Plaza, Ground Floor,
Moktah Daddah Street
P.O. Box 1654-00100 GPO
Nairobi
Century DTM Ltd New Pumwani Road
K K Plaza, Gikomba
Sumac Credit DTM Ltd Consolidated Bank Building,
Koinange Street, 2nd Floor
P.O. Box 11687-00100
Nairobi
Blue Limited Chester House-Koinange Street
P.O BOX 27749-00100
NAIROBI
K-rep Development Agency K-Rep Development Agency
Ltd K-Rep Centre| 7th Flr.
Wood Av. Kilimani
P.O. Box Box 10528 – 00100,
Nairobi.
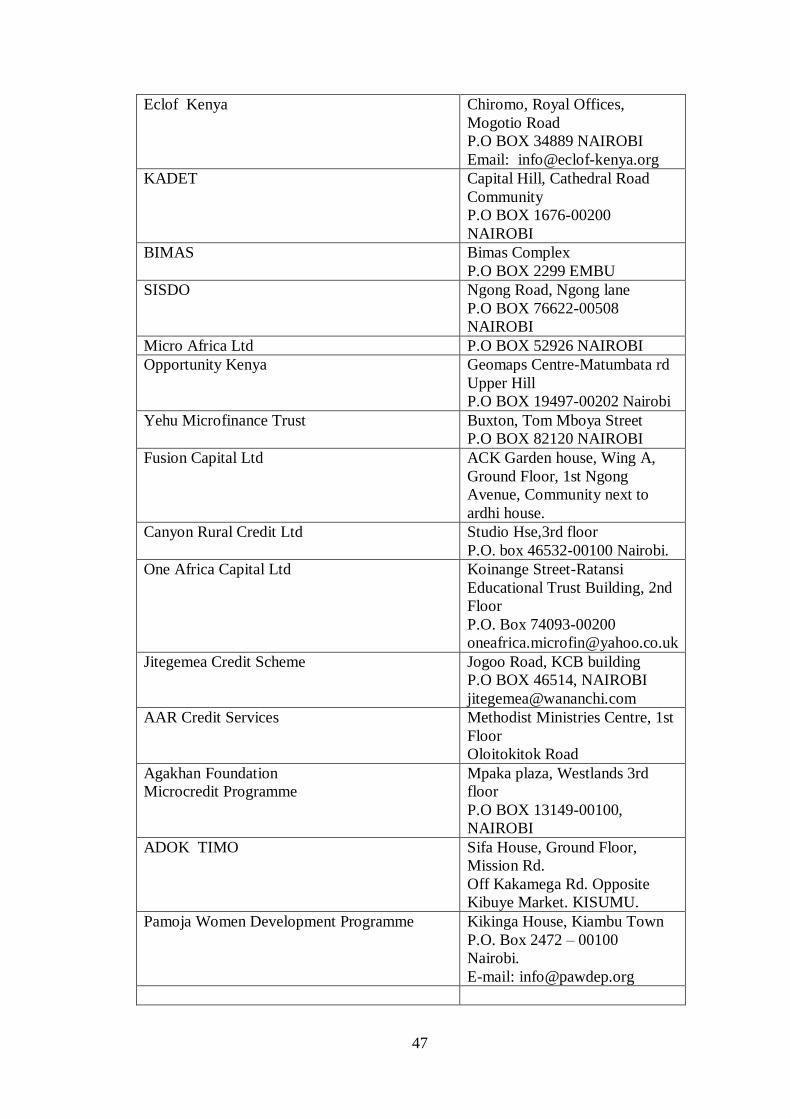
47
Eclof Kenya Chiromo, Royal Offices,
Mogotio Road
P.O BOX 34889 NAIROBI
Email: [email protected]
KADET Capital Hill, Cathedral Road
Community
P.O BOX 1676-00200
NAIROBI
BIMAS Bimas Complex
P.O BOX 2299 EMBU
SISDO Ngong Road, Ngong lane
P.O BOX 76622-00508
NAIROBI
Micro Africa Ltd P.O BOX 52926 NAIROBI
Opportunity Kenya Geomaps Centre-Matumbata rd
Upper Hill
P.O BOX 19497-00202 Nairobi
Yehu Microfinance Trust Buxton, Tom Mboya Street
P.O BOX 82120 NAIROBI
Fusion Capital Ltd ACK Garden house, Wing A,
Ground Floor, 1st Ngong
Avenue, Community next to
ardhi house.
Canyon Rural Credit Ltd Studio Hse,3rd floor
P.O. box 46532-00100 Nairobi.
One Africa Capital Ltd Koinange Street-Ratansi
Educational Trust Building, 2nd
Floor
P.O. Box 74093-00200
Jitegemea Credit Scheme Jogoo Road, KCB building
P.O BOX 46514, NAIROBI
AAR Credit Services Methodist Ministries Centre, 1st
Floor
Oloitokitok Road
Agakhan Foundation
Microcredit Programme
Mpaka plaza, Westlands 3rd
floor
P.O BOX 13149-00100,
NAIROBI
ADOK TIMO Sifa House, Ground Floor,
Mission Rd.
Off Kakamega Rd. Opposite
Kibuye Market. KISUMU.
Pamoja Women Development Programme Kikinga House, Kiambu Town
P.O. Box 2472 – 00100
Nairobi.
E-mail: [email protected]
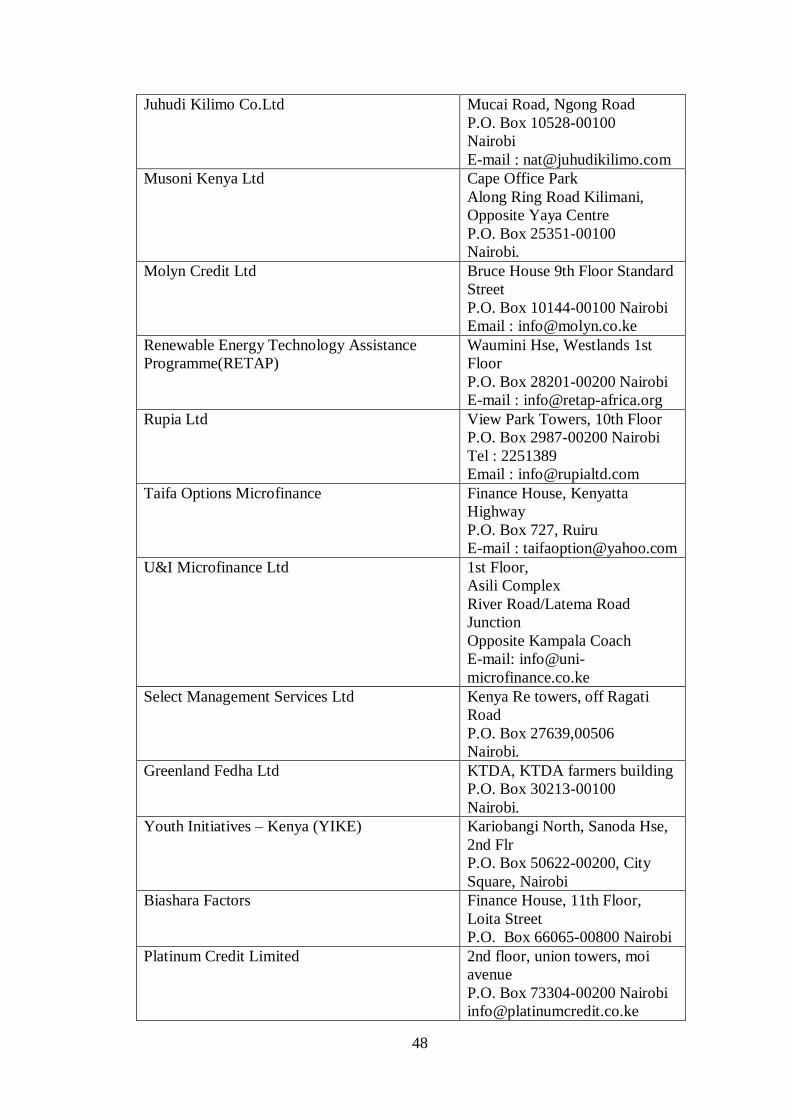
48
Juhudi Kilimo Co.Ltd Mucai Road, Ngong Road
P.O. Box 10528-00100
Nairobi
E-mail : [email protected]
Musoni Kenya Ltd Cape Office Park
Along Ring Road Kilimani,
Opposite Yaya Centre
P.O. Box 25351-00100
Nairobi.
Molyn Credit Ltd Bruce House 9th Floor Standard
Street
P.O. Box 10144-00100 Nairobi
Email : [email protected]
Renewable Energy Technology Assistance
Programme(RETAP)
Waumini Hse, Westlands 1st
Floor
P.O. Box 28201-00200 Nairobi
E-mail : [email protected]
Rupia Ltd View Park Towers, 10th Floor
P.O. Box 2987-00200 Nairobi
Tel : 2251389
Email : [email protected]
Taifa Options Microfinance Finance House, Kenyatta
Highway
P.O. Box 727, Ruiru
E-mail : [email protected]
U&I Microfinance Ltd 1st Floor,
Asili Complex
River Road/Latema Road
Junction
Opposite Kampala Coach
E-mail: info@uni-
microfinance.co.ke
Select Management Services Ltd Kenya Re towers, off Ragati
Road
P.O. Box 27639,00506
Nairobi.
Greenland Fedha Ltd KTDA, KTDA farmers building
P.O. Box 30213-00100
Nairobi.
Youth Initiatives – Kenya (YIKE) Kariobangi North, Sanoda Hse,
2nd Flr
P.O. Box 50622-00200, City
Square, Nairobi
Biashara Factors Finance House, 11th Floor,
Loita Street
P.O. Box 66065-00800 Nairobi
Platinum Credit Limited 2nd floor, union towers, moi
avenue
P.O. Box 73304-00200 Nairobi
49
Ngao Credit Ltd 2nd Floor NHIF Bldg.
Community
P.O. Box 60776-00200 Nairobi
Email: [email protected]
Indo Africa Finance Museum Hill Centre 3rd Floor,
Museum Hill Road
P.O. Box 39435-00623 Nairobi
– Kenya
Email:
Springboard Capital Kensia House along Muranga
road, Opposite Kobil Petrol
Station 1st Floor, suite no.12
P.O. Box 23720-00100, Nairobi.
Mini Savings & Loans Ltd Highway Building, Githunguri
Town (Near Githunguri Post
Office)
P.O. Box 874-00216,
Githunguri, Kiambu
Email: [email protected]
KEEF-Kenya Entrepreneurship Empowerment
Foundation
Mapa House 3rd Floor Kiambu
Road
P.O. Box 648 Kiambu
Women Enterprise Solutions Development House, Moi
Avenue
P.O. Box 4083-00200
Nairobi.
Focus Capital Limited Donholm Mina Centre
P.O. Box 2406-00202
Nairobi.
Samchi Credit Limited Parklands Plaza
P.O. Box 16982-00620
Nairobi.
Fountain Credit Services Ltd Ngong Road , near Kobil Petrol
Station
P.O. Box 72367-00200 Nairobi.
CIC Insurance CIC Plaza, Mara Road
P.O Box 59485-00200,
NAIROBI.
Chartis insurance Chartis Insurance Company Ltd.
Chartis House, Eden Square
Complex, Chiromo Road
P.O Box 49460-00100,
Nairobi.
www.chartisinsurance.com
50
Microensure Advisory Services Hughes building, Kenyatta
avenue, 8th floor
P.O. Box 13383-00100, Nairobi.
Jitegemee Trust K-Rep Centre, Wood Avenue
P.O BOX 21768-00505
NAIROBI
OIKOCREDIT Methodist Ministries Centre,
Olitokitok road
2nd Floor
P.O BOX 67181 NAIROBI
MESPT 2nd flr vision towers muthithi
rd, westland
P.O. Box 187 Sarit Centre
00606 Nairobi
Women Enterprise Fund NSSF Building, Eastern Wing,
Block A, 14th Floor
P.O. Box 17126-00100 Nairobi
Unaitas Sacco Society ltd. formerely
Muramati Sacco Society Ltd
Muramati Building, hospital
road, Muranga
P.O. Box 1145-10200, Muranga.
Swiss Contact Westlands,Vanguard House, 6th
Floor,
P.O Box 47996,00100,
Nairobi.
www.swisscontact.co.ke
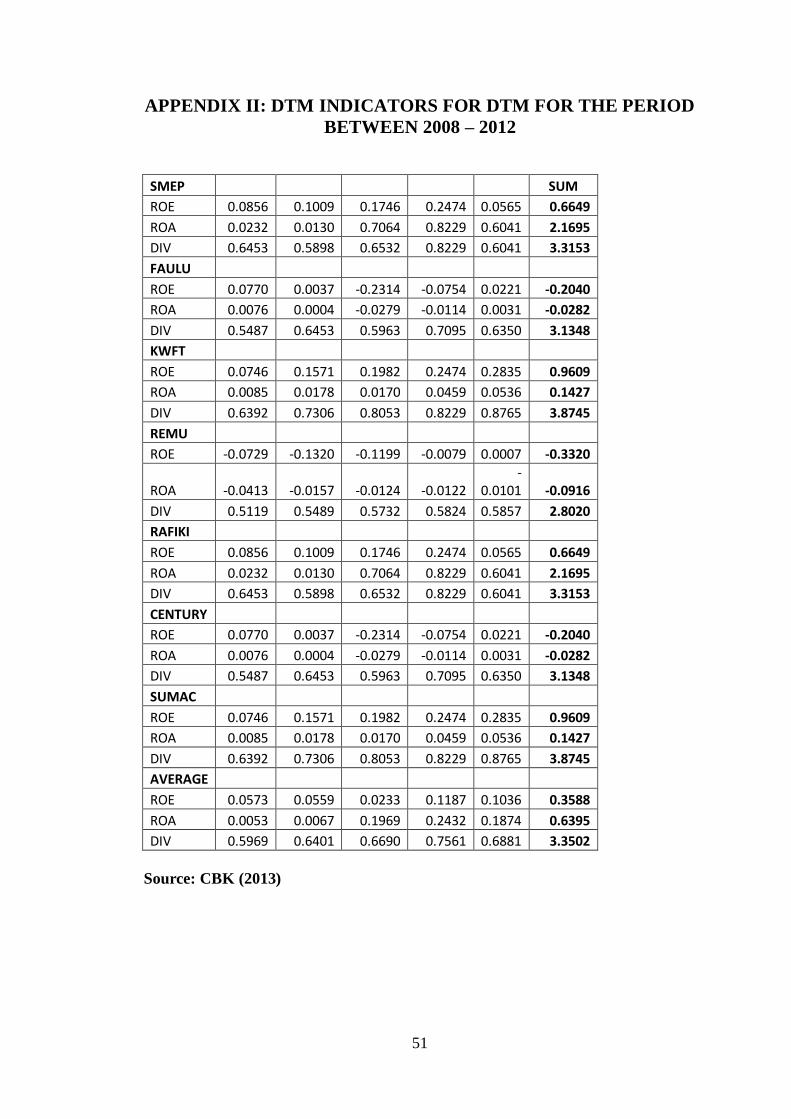
51
APPENDIX II: DTM INDICATORS FOR DTM FOR THE PERIOD
BETWEEN 2008 – 2012
SMEP SUM
ROE 0.0856 0.1009 0.1746 0.2474 0.0565 0.6649
ROA 0.0232 0.0130 0.7064 0.8229 0.6041 2.1695
DIV 0.6453 0.5898 0.6532 0.8229 0.6041 3.3153
FAULU
ROE 0.0770 0.0037 -0.2314 -0.0754 0.0221 -0.2040
ROA 0.0076 0.0004 -0.0279 -0.0114 0.0031 -0.0282
DIV 0.5487 0.6453 0.5963 0.7095 0.6350 3.1348
KWFT
ROE 0.0746 0.1571 0.1982 0.2474 0.2835 0.9609
ROA 0.0085 0.0178 0.0170 0.0459 0.0536 0.1427
DIV 0.6392 0.7306 0.8053 0.8229 0.8765 3.8745
REMU
ROE -0.0729 -0.1320 -0.1199 -0.0079 0.0007 -0.3320
ROA -0.0413 -0.0157 -0.0124 -0.0122 -
0.0101 -0.0916
DIV 0.5119 0.5489 0.5732 0.5824 0.5857 2.8020
RAFIKI
ROE 0.0856 0.1009 0.1746 0.2474 0.0565 0.6649
ROA 0.0232 0.0130 0.7064 0.8229 0.6041 2.1695
DIV 0.6453 0.5898 0.6532 0.8229 0.6041 3.3153
CENTURY
ROE 0.0770 0.0037 -0.2314 -0.0754 0.0221 -0.2040
ROA 0.0076 0.0004 -0.0279 -0.0114 0.0031 -0.0282
DIV 0.5487 0.6453 0.5963 0.7095 0.6350 3.1348
SUMAC
ROE 0.0746 0.1571 0.1982 0.2474 0.2835 0.9609
ROA 0.0085 0.0178 0.0170 0.0459 0.0536 0.1427
DIV 0.6392 0.7306 0.8053 0.8229 0.8765 3.8745
AVERAGE
ROE 0.0573 0.0559 0.0233 0.1187 0.1036 0.3588
ROA 0.0053 0.0067 0.1969 0.2432 0.1874 0.6395
DIV 0.5969 0.6401 0.6690 0.7561 0.6881 3.3502
Source: CBK (2013)

52
APPENDIX III: AVERAGE DTM INDICATORS FOR DTM FOR
THE PERIOD BETWEEN 2008 – 2012
2012 2011 2010 2009 2008
ROE 0.0573 0.0559 0.0233 0.1187 0.1036
ROA 0.0053 0.0067 0.1969 0.2432 0.1874
DIV 0.5969 0.6401 0.6690 0.7561 0.6881
Source: CBK (2013)
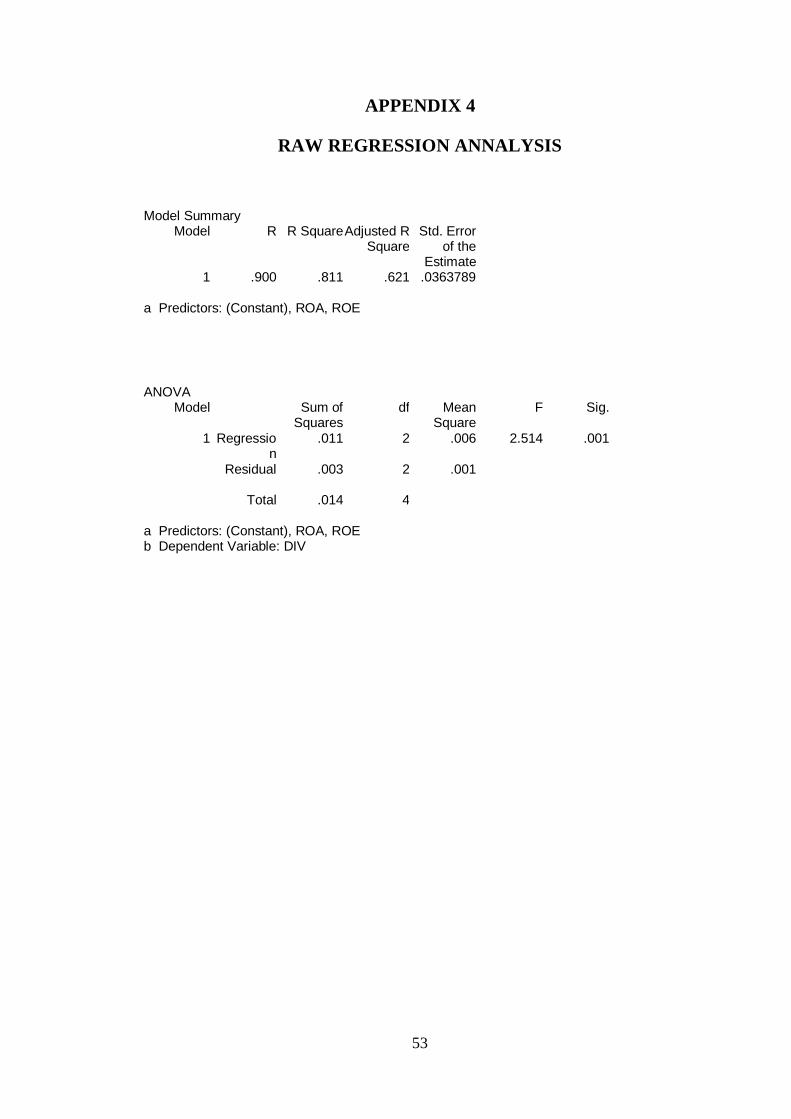
53
APPENDIX 4
RAW REGRESSION ANNALYSIS
Model Summary
Model R R Square Adjusted R Square
Std. Error of the
Estimate
1 .900 .811 .621 .0363789
a Predictors: (Constant), ROA, ROE
ANOVA Model Sum of
Squares df Mean
Square F Sig.
1 Regression
.011 2 .006 2.514 .001
Residual .003 2 .001
Total .014 4
a Predictors: (Constant), ROA, ROE b Dependent Variable: DIV