the effect of functional diversification on the credit
TRANSCRIPT

The Effect of Functional Diversification on the Credit Riskof Financial Institutions
Finance
Master's thesis
Jani Nurmi
2015
Department of FinanceAalto UniversitySchool of Business
Powered by TCPDF (www.tcpdf.org)

Aalto University, P.O. BOX 11000, 00076 AALTO
www.aalto.fi
Abstract of master’s thesis
Author Jani Nurmi
Title of thesis The Effect of Functional Diversification on the Credit Risk of Financial Institutions
Degree Master’s degree
Degree programme Finance
Thesis advisor(s) Matti Suominen
Year of approval 2015 Number of pages 72 Language English
Abstract
PURPOSE AND MOTIVATION:
The purpose of this study is to examine the effect functional diversification on the credit risk of
financial institutions. The focus is on whether financial institutions should be allowed to combine
commercial banking and investment banking functions under one financial conglomerate. Under
current regulators financial institutions are allowed to combine the functions, however regulators
are considering driving regulation towards separating commercial and investment banking. This
study sheds light on whether the contemplated separation of investment and commercial banking
increases or decreases the credit risk of financial institutions.
DATA AND METHODS:
The data sample of his study consists of 51 financial institutions from Europe and the US, with a
time span ranging from 2007 to 2014. Functional diversification is measured using income and asset
based measures, collected from the annual financial statements of the financial institutions. Credit
risk is measured with the financial institution level credit default swap (CDS) spreads and the CDS
spread difference with banking sector CDS index spreads. The impact of functional diversification
on credit risk is examined with multiple panel data regressions, where the credit risk of financial
institutions is explained with the functional diversification measures and a set of control variables.
Furthermore, multiple robustness checks are developed.
FINDINGS:
Based on the results, functional diversification decreases the credit risk of financial institutions at
the financial institution credit risk level and compared with the average credit risk in the banking
sector. The results are confirmed with multiple robustness checks. Based on the results the
contemplated separation of commercial and investment banking with new regulation can have grave
consequences. Separating the two functions would decrease functional diversification increasing the
credit risk of financial institutions and the probability of financial institution failures.
Keywords Financial institutions, functional diversification, credit risk, credit default swaps,
economies of scope, agency costs, conflicts of interest, regulation of financial institution

Aalto-yliopisto, PL 11000, 00076 AALTO
www.aalto.fi
Maisterintutkinnon tutkielman tiivistelmä
Tekijä Jani Nurmi
Työn nimi The Effect of Functional Diversification on the Credit Risk of Financial Institutions
Tutkinto Kauppatieteiden maisteri
Koulutusohjelma Finance
Työn ohjaaja(t) Matti Suominen
Hyväksymisvuosi 2015 Sivumäärä 72 Kieli Englanti
Tiivistelmä
TUTKIMUKSEN TARKOITUS:
Tämän tutkimuksen tarkoitus on tarkastella rahoituslaitosten funktionaalisen hajauttamisen
vaikutusta laitosten luottoriskiin. Fokuksena on tutkia, pitäisikö rahoituslaitoksille antaa
mahdollisuus yhdistää investointipankki- ja liikepankkifunktiot yhden rahoituslaitoksen yhteyteen.
Nykyisen regulaation mukaan rahoituslaitokset saavat yhdistää funktiot. Tästä huolimatta
rahoituslaitosten valvojat tällä hetkellä harkitsevat regulaation muuttamista suuntaan, jossa
investointipankki- ja liikepankkifunktiot erotetaan toisistaan. Tämä tutkimus analysoi, kasvattaako
vai laskeeko mahdollinen uusi regulaatio rahoituslaitosten luottoriskiä.
AINEISTO JA MENETELMÄT:
Tutkimuksessa käytetty dataotos koostuu 51 rahoituslaitoksesta Euroopasta ja Yhdysvalloista.
Otoksen aikajakso alkaa vuodesta 2007 ja loppuu vuoteen 2014. Funktionaalista hajautusta
mitataan käyttämällä liikevaihto- ja taseperusteisia mittareita, jotka on kerätty rahoituslaitosten
vuosittaisista tilinpäätöksistä. Luottoriskiä mitataan käyttämällä rahoituslaitosten
luottotappioriskin vaihtosopimusten (credit default swap, CDS) spredejä ja spredien eroa
pankkisektorin CDS-indekseihin. Funktionaalisen hajautuksen vaikutusta luottoriskiin tutkitaan
useilla paneelidataregressioilla, joissa rahoituslaitosten luottoriskiä selitetään funktionaalisen
hajautuksen mittareilla ja monilla kontrollimuuttujilla. Lisäksi useita lisätestejä käytetään tulosten
vahvistamiseksi.
TULOKSET:
Tulosten perusteella funktionaalinen hajautus vähentää rahoituslaitosten luottoriskiä
rahoituslaitostasolla sekä verrattuna keskimääräiseen pankkisektorin luottoriskitasoon. Tulokset
vahvistetaan useissa lisätesteissä. Tulosten mukaan suunnitteilla olevalla investointipankki- ja
liikepankkifunktioiden erottavalla uudella regulaatiolla voi olla merkittävä vaikutus
rahoituslaitosten luottoriskiin. Uusi regulaatio laskisi funktionaalisen hajautuksen tasoa, joka
puolestaan nostaisi rahoituslaitosten luottoriskiä ja niiden konkurssin todennäköisyyttä.
Avainsanat Rahoituslaitokset, funktionaalinen hajautus, luottoriski, luottotappioriskin
vaihtosopimukset, laajuuden ekonomia, agenttikustannukset, intressiristiriidat, rahoituslaitosten
regulaatio

I
Table of Contents
1. Introduction & Motivation ..................................................................................................... 1
2. Literary Review ...................................................................................................................... 5
2.1. The Overall Impact of Functional Diversification on the Riskiness and Value of
Financial Institutions .............................................................................................................. 5
2.2. Economies of Scope and Conflicts of Interest ................................................................ 9
2.3. Credit Default Swaps .................................................................................................... 13
3. Data and Methodology ......................................................................................................... 14
3.1. Selected Financial Institutions ...................................................................................... 14
3.2. Credit Default Swap Spreads ........................................................................................ 14
3.3. Functional Focus and Diversification Measures ........................................................... 17
3.4. Control Variables .......................................................................................................... 28
3.5. Summary Statistics ........................................................................................................ 33
4. Hypothesis ............................................................................................................................ 33
4.1. Research Question 1 ...................................................................................................... 34
4.2. Research Question 2 ...................................................................................................... 35
5. Results .................................................................................................................................. 37
5.1. Is Investment Banking More Risky Than Commercial Banking? ................................ 37
5.2. Are More Diversified Financial Institutions Less Risky? ............................................. 46
6. Robustness ............................................................................................................................ 53
6.1. Fixed Effects Panel Data Regressions ........................................................................... 53
6.2. Heteroscedasticity ......................................................................................................... 58
6.3. Results Using the Herfindahl-Hirschman Diversification Measures ............................ 60
6.4. Effect of the Financial Crisis ......................................................................................... 66
7. Limitations of the Study ....................................................................................................... 69
8. Conclusion ............................................................................................................................ 71
9. References ............................................................................................................................ 73
10. Appendix ............................................................................................................................ 76

II
List of Tables
Table I – Summary Statistics 2007-2014 .............................................................................................................. 33
Table II – Net Interest Income Share and Loan Share, Random Effects Regressions .......................................... 38
Table III – Net Interest Income Share and Loan Share with Quadric Terms, Random Effects Regressions ........ 41
Table IV – Banking Sector CDS Index Spread Differences, Random Effects Regressions.................................. 44
Table V – Income and Asset Diversification Measures, Random Effects Regressions ........................................ 47
Table VI – Income and Asset Diversification, Random Effects Regressions Using Quadric Terms .................... 49
Table VII – Income and Asset Diversification, Random Effects Regressions using banking Sector CDS Index
Spread Differences ................................................................................................................................................ 51
Table VIII – Net Interest Income Share and Loan Share, Financial Institution and Time Fixed Effects Regressions
.............................................................................................................................................................................. 54
Table IX – Income and Asset Diversification, Financial Institution and Time Fixed Effects Regressions .......... 57
Table X – GLS Heteroscedastic Robust Standard Error Regressions ................................................................... 59
Table XI – HH Income and Asset Diversification Measures, Random Effects Panel Data Regressions .............. 61
Table XII – HH Income and Asset Diversification Measures, Random Effects Panel Data Regressions Using
Quadric Terms ...................................................................................................................................................... 63
Table XIII – HH Income and Asset Diversification Measures, Random Effects Panel Data Regressions Using
Banking Sector CDS Index Spread Differences.................................................................................................... 65
Table XIV – OLS Random Effects Regressions without 2008 Data .................................................................... 67
Table XV – Net Interest Income Share and Loan Share, Financial Institution Fixed Effects Regressions ........... 76
Table XVI – Income and Asset Diversification, Financial Institution Fixed Effects Regressions ........................ 77
Table XVII – OLS Financial Institution and Year Fixed Effects Regressions Without 2008 Data ...................... 78
List of Figures
Figure 1 – CDS Spreads ........................................................................................................................................ 16
Figure 2 – CDS Difference ................................................................................................................................... 17
Figure 3 – Net Interest Income Share.................................................................................................................... 20
Figure 4 – Income Diversification ........................................................................................................................ 22
Figure 5 – HH Income Diversification .................................................................................................................. 23
Figure 6 – Loan Share ........................................................................................................................................... 25
Figure 7 – Asset Diversification ........................................................................................................................... 26
Figure 8 – HH Asset Diversification ..................................................................................................................... 27
Figure 9 – Tier 1 ................................................................................................................................................... 29
Figure 10 – Leverage Ratio ................................................................................................................................... 30
Figure 11 – Cost to Income Ratio ......................................................................................................................... 31
Figure 12 – Non-linear Relationship between CDS Spread and Net Interest Income Share Using 5-Year maturity
.............................................................................................................................................................................. 42
Figure 13 – Non-linear Relationship between CDS Spread and Net Interest Income Share Using 1-Year maturity
.............................................................................................................................................................................. 43
Figure 14 – Non-linear Relationship Between CDS Difference and Net Interest Income Share .......................... 45

1
1. Introduction & Motivation
The impact of functional diversification (i.e. combining commercial banking, investment
banking and other financial services under the same financial conglomerate) on the riskiness
and value of financial institutions has been subject to much debate among academics and
regulators. Current literature offers conflicting results on the impact of financial institution
functional diversification, some suggest higher diversification decreases the riskiness of
financial institutions and some the opposite. According to the standard portfolio theory
(Markowitz 1952) diversification reduces the volatility and riskiness of a portfolio of assets.
According to Demsetz & Trahan (1997) and Baele, De Jonghe & Vander Vennet (2007) when
applying the portfolio theory to banking and financial services, functional diversification should
decrease the probability of default and riskiness of the financial institution. However, some
suggest that the increasing amount of different financial services offered by the financial
institution increases agency costs and conflicts of interest inside the financial institution, and
thus its riskiness.
Regulation currently allows financial institutions to combine traditional commercial
banking with investment banking under one financial conglomerate. However, historically
commercial banking and investment banking has not been allowed to operate under the same
legal entity. In the US, the Glass Stegall act was introduced in 1933 as a response to the great
depression, prohibiting financial institutions to combine investments banking services with
commercial banking and limited the ability of commercial banks to offer securities activities,
such as securities underwriting. In 1999, the Gramm–Leach–Bliley Act was introduced,
allowing financial institutions to functionally diversify and combine commercial and
investment banking under Financial Holding Companies. In the European Union, the Second
Banking Directive of 1989 allowed European financial institutions to functionally diversify
across different financial services, allowing financial institutions to offer commercial banking,
investment banking, insurance and other financial services through the same legal entity. New
regulation in Europe and the US has allowed financial institutions to pursue a wide range of
diversification strategies, some financial institutions have remained focused on the traditional
commercial banking market or on investment banking, and others have pursued to offer a wide
range of financial services becoming large financial conglomerates.
2
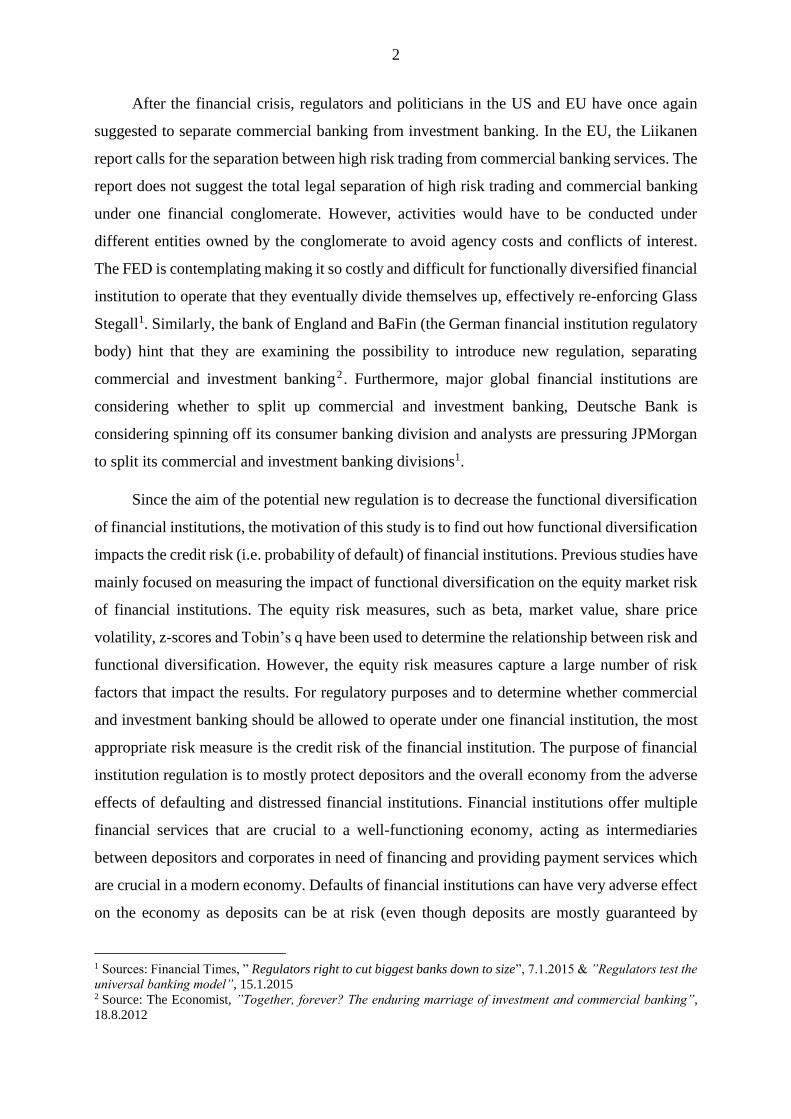
After the financial crisis, regulators and politicians in the US and EU have once again
suggested to separate commercial banking from investment banking. In the EU, the Liikanen
report calls for the separation between high risk trading from commercial banking services. The
report does not suggest the total legal separation of high risk trading and commercial banking
under one financial conglomerate. However, activities would have to be conducted under
different entities owned by the conglomerate to avoid agency costs and conflicts of interest.
The FED is contemplating making it so costly and difficult for functionally diversified financial
institution to operate that they eventually divide themselves up, effectively re-enforcing Glass
Stegall1. Similarly, the bank of England and BaFin (the German financial institution regulatory
body) hint that they are examining the possibility to introduce new regulation, separating
commercial and investment banking2 . Furthermore, major global financial institutions are
considering whether to split up commercial and investment banking, Deutsche Bank is
considering spinning off its consumer banking division and analysts are pressuring JPMorgan
to split its commercial and investment banking divisions1.
Since the aim of the potential new regulation is to decrease the functional diversification
of financial institutions, the motivation of this study is to find out how functional diversification
impacts the credit risk (i.e. probability of default) of financial institutions. Previous studies have
mainly focused on measuring the impact of functional diversification on the equity market risk
of financial institutions. The equity risk measures, such as beta, market value, share price
volatility, z-scores and Tobin’s q have been used to determine the relationship between risk and
functional diversification. However, the equity risk measures capture a large number of risk
factors that impact the results. For regulatory purposes and to determine whether commercial
and investment banking should be allowed to operate under one financial institution, the most
appropriate risk measure is the credit risk of the financial institution. The purpose of financial
institution regulation is to mostly protect depositors and the overall economy from the adverse
effects of defaulting and distressed financial institutions. Financial institutions offer multiple
financial services that are crucial to a well-functioning economy, acting as intermediaries
between depositors and corporates in need of financing and providing payment services which
are crucial in a modern economy. Defaults of financial institutions can have very adverse effect
on the economy as deposits can be at risk (even though deposits are mostly guaranteed by
1 Sources: Financial Times, ” Regulators right to cut biggest banks down to size”, 7.1.2015 & ”Regulators test the
universal banking model”, 15.1.2015 2 Source: The Economist, ”Together, forever? The enduring marriage of investment and commercial banking”,
18.8.2012

3
governments) and money transfers can slow down in the case of disturbance in the banking
sector. Financial institution regulation is mostly in place to avoid financial institution defaults
and the adverse effect resulting from the defaults, making credit risk a major point of interest
from the regulative perspective3. Thus in this study, instead of measuring financial institution
level risk using risk measures from the equity market, credit default swap (CDS) spreads of the
financial institutions are used. CDS yields directly measure the credit risk (i.e. probability of
default) of financial institutions. The results should provide insights from a regulatory
perspective on whether functional diversification increases or decreases the credit risk of
financial institutions and what is the impact of separating investment banking from commercial
banking on the credit risk of financial institutions.
The data sample used in this study consists of 51 financial institutions from the US and
Europe. The sample is Europe focused with 9 financial institutions from the US, since only 9
financial institutions from the US have liquid CDSs traded. The time span of the sample starts
from 2007 and ends at the end of 2014. The financial crisis started during the time span of the
sample and had a major effect on the 2008 observations. However, multiple robustness cheeks
have been performed in order to mitigate the effect of the financial crisis.
In this study functional diversification is measured with the income and asset
diversification of financial institutions. Income diversification measures the extent to which the
income mix between net interest income (generated by traditional commercial banking
activities) and non-interest income (mostly fee and trading related income generated from
investment banking) of the financial institution is diversified. Even though non-interest income
can include income from insurance and other financial services, the majority of non-interest
income is investment banking related. Thus financial institutions generating more non-interest
income (interest income) are referred as investment banks (commercial banks). Asset
diversification refers to the extent to which the mix between the loans (commercial banking
assets) and other earning assets (investment banking assets) in the balance sheet of the financial
institution is diversified.
The main focus of this study is to examine how functional diversification impacts the
credit risk of financial institutions. However, at first it is examined whether financial institutions
3 Information about the purpose of financial institution regulation has been obtained from Division of Supervision
and Risk Management of Federal Reserve Bank of Kansas City, ”Banking Regulation”, 2000

4
that focus more on investment banking4 have higher credit risk than those focusing more on
commercial banking. The impact of functional focus needs to be determined first since
diversification benefits could arise from less exposure to a riskier function and not functional
diversification itself. When actually examining the impact of functional diversification the
functional focus is controlled for. Based on the results, the functional focus of financial
institutions does not seem to impact their credit risk. Financial institutions focusing more on
investment banking do not differ in terms of credit risk from financial institutions focusing
more on commercial banking.
When examining functional diversification, it is found that financial institutions with
higher income diversification have lower CDS spreads at the financial institution level and
compared with the banking sector CDS index. The results suggest that benefits from functional
diversification decrease the credit risk of financial institutions and should make them less
probable to default. I find no evidence that asset based diversification impacts the credit risk
of financial institutions. However, income based measures are more appropriate, they better
describe the functional focus of the financial institution since asset diversification measures do
not fully capture the extent of investment banking services. Based on the results, the current
regulatory agenda to decrease the level of functional diversification of financial institutions,
seems counterintuitive. If new regulation is introduced, separating commercial and investment
banking would increase credit risk, making financial institutions more likely to default. The
motivation for the new regulation seems to stem from the desire to make monitoring of large
and complex functionally diversified financial institutions easier. However, the benefits from
easier regulation and monitoring should not overweigh the grave consequences of increased
probability for financial institution failures.
The rest of this study is constructed as follows. Chapter 2 describes previous literature
focusing on the functional diversification of financial institutions. Chapter 3 describes the data
and methods used in this study. Chapter 4 outlines the hypothesis. Chapter 5 describes the
results in detail. In Chapter 6 the robustness of the results is tested, chapter 7 discusses the
limitations of the study and chapter 8 concludes.
4 For the entirety of this study financial institution focus areas are divided into commercial banking and investment
banking. Even though when measuring the focus non-interest income can contain income from non-investment
banking functions (e.g. insurance or other financial services). However, since investment banking dominates the
non-interest income, only investment banking/commercial banking division is used.

5
2. Literary Review
More recent literature examining the functional diversification of financial institutions
does not focus on studying the economies of scope or conflicts of interest related to functional
diversification directly, but the overall impact of functional diversification on the riskiness and
value of financial institutions. A similar approach is used in this study and the aim of this study
is to contribute to the literature examining the overall impact of functional diversification. The
academic results vary between different academics, some papers finds that functional
diversification increases (decreases) risk (value) and others the opposite. Broadly research on
European financial institutions differs to the results found in the US and other developed
markets. Older research has tried to directly examine the impact of conflicts of interest or
economies of scope resulting from functional diversification, without achieving consensus. The
newer studies focusing on measuring the overall impact of functional diversification, directly
contribute to the older research. If financial institutions with high diversification are found to
have higher (lower) risk (value), the existence of conflicts of interest and agency costs could
explain the discount. Vice versa lower (higher) risk (value) could suggest the existence of
diversification benefits or economies of scope.
At first in the literature review, the more recent research focusing on the overall impact
of functional diversification is discussed. Secondly older research on conflicts of interest and
economies of scope is discussed. Finally research on why CDSs should be used to measure
credit risk is discussed.
2.1. The Overall Impact of Functional Diversification on the Riskiness and Value of
Financial Institutions
This section is divided into two sub-sections, first one describing studies that find
functional diversification increasing the riskiness of financial institutions and the second
detailing papers discovering the opposite.
6
2.1.1. Research Suggesting Functional Diversification Increases the Riskiness of Financial
Institutions
Based on US financial institutions Stiroh (2006) suggests that increased share of non-
interest income, income mostly from investment banking, raises the volatility of profits without
raising the average profit of the financial institutions. Moreover, Stiroh (2006) finds a positive
relationship between non-interest income and the volatility of total and idiosyncratic risk
components. He also finds a positive relationship between the market betas and a higher share
of non-interest income of financial institutions. Finally Stiroh (2006) suggests, that some US
financial institutions with high non-interest income shares have over diversified their activities,
since their riskiness have increased without increase in average profitability.
Using cross-sectional analysis Stiroh and Rumble (2006) find that more functionally
diversified financial institutions in the US have higher risk-adjusted profits, however the effect
of higher profits is offset by costs associated to higher exposure to more volatile non-interest
activates. They conclude that diversification benefits can be gained, but high volatility activities
like trading, diminish the diversification benefits on the risk adjusted basis. Furthermore, using
a panel data sample they confirm that higher share of non-interest activities is negatively
associated with risk-adjusted profits and find no evidence that diversification affects the
performance or profitability of US financial holding companies. They conclude that financial
holding companies have overestimated the benefits of functional diversification and argue that
even though functional diversification may generate new income opportunities for financial
institutions, the different income stream are subject to the same industry shocks and risks
reducing diversification benefits.
Using a sample of financial institutions from 43 developed countries Laeven and Levine
(2007) examine whether the Tobin’s q of financial institutions is higher than if the financial
institution were to be separated to single corporations, where each entity would specialize in
offering a specific financial service. According to them, the existence economies of scope
would result in higher valuations of diversified financial institutions compared with if the
financial institutions were broken into separated specialized entities. Vice versa the existence
of agency costs would result in a valuation discount on the diversified financial institutions.
They find that market values of diversified financial institutions are significantly lower than if
the financial institutions were to be broken into specialized independent entities. They argue

7
that diversification of financial institutions increases agency costs and has a higher impact than
any potential economies of scope. Thus, if financial conglomerates have lower valuations than
if the same conglomerate was operating as specialized individual entities, functional
diversification should increase the riskiness of financial institutions. Using a sample of US
financial institutions Schmid and Walter (2009) find similar results, diversified financial
conglomerates have lower market valuations. The lower market value is evident when financial
institutions diversify with commercial banking, insurance and securities services, no impact in
value is seen in financial institutions operating mainly in investment banking activities (Schmid,
Walter 2009). They speculate that the reduction in value of diversified financial institutions is
caused by the overestimations of the potential economies of scope related to diversification.
2.1.2. Research Suggesting Functional Diversification Decreases the Riskiness of
Financial Institutions
Examining listed financial institutions from 17 European countries with a panel data
sample covering 1989-2004, Baele, De Jonghe and Vander Vennet (2007) find a positive
relationship with functional diversification and the franchise value of financial institutions,
suggesting that the equity markets value functionally diversified financial institutions higher
that less diversified counterparts. They find that the more functionally diversified financial
institutions have higher market risk and lower idiosyncratic risk. Thus more functionally
diversified financial institutions have higher market betas and higher systematic risk and lower
financial institution specific risk. Financial institutions that diversify become more similar to
the average financial institution in the market, explaining the higher market betas. Lower
idiosyncratic risk suggests that functional diversification decreases the financial institution
specific risk, reducing their probability of default and thus credit risk.
Using a sample of financial institutions from 9 developed countries, including the US,
Elsas, Hackethal and Holzhäuser (2010) find that financial institutions diversification increases
profitability through higher margins from non-interest services and lower cost to income ratios.
According to them, higher profitability increases the market valuations of diversified financial
institutions. When, they control for profitability they find no impact of diversification on
valuations, implying limited evidence for the existence of conflicts of interest and that
economies of scope are evident in diversification. The authors suggest that previous results
finding a negative diversification impact on valuations are driven by the use of insufficient

8
measures for diversification and market valuations, and not using control variables for
profitability.
Demirgüç-Kunt and Huizinga (2010) examine the effect of diversification and short-term
funding strategies of financial institutions from 101 countries on their risk and return, mainly
the rate of return on assets and distance to default. They discover that expansion into non-
interest income generating services can offer some diversification benefits at low levels of non-
interest income. They conclude that financial institutions relying mostly on non-interest income
and on non-deposit funding (mostly specialized investments banks) are very risky. In their
opinion the downfall of the US investment banking sector during the financial crisis can be
explained on their over-reliance on risky non-interest income and non-deposit short term
funding. They conclude that evidence on diversification benefits is weak, there can be some
benefits on combining risky investment banking with traditional commercial banking. However,
financial institutions should not overly depend on non-interest income generating activities.
De Jonghe (2010) examines the relationship between financial institution diversification
and the ability of the financial institution to survive a banking sector crash. He finds that non-
interest income focus increases the tail-beta of financial institutions, reducing banking system
stability. He finds that smaller better capitalized banks focusing mainly on commercial banking,
are more likely to sustain difficult market conditions and improving the overall banking sector
stability. Wagner (2010) shows, using models, that diversification reduces the probability of
default of individual financial institutions. However, he finds that diversification reduces the
stability of the overall banking sector increasing the likelihood of systemic crises, since
diversification makes financial institutions more similar and more correlated.
The literature on the impact of functional diversification on the riskiness and value of
financial institutions is mixed. Broadly, European evidence suggests that diversification
decreases risk and evidence from US the opposite. However, even geographical consensus
cannot be established. This study aims to build on previous research, by introducing an
alternative perspective using credit risk as the explanatory variable. Credit risk is better suited
to determine whether functional diversification should be allowed from the regulatory point of
view. Previous studies have mainly examined the impact of functional diversification from the
shareholder perspective, using equity based measures for risk and value. Based on the
perspective different conclusions can be drawn. It can be possible to transfer value and risk
between the share- and debtholders. According to Green and Talmor (1986) and Jensen and

9
Meckling (1976) the asset substitution problem can cause value transfers between the share-
and debtholders of a corporation. According to them if a company is financed with high
amounts of debt, shareholders might increase the riskiness of the company’s projects in the
expense of the debtholders, transferring risk to and value from the debtholders. Thus results on
the impact of functional diversification on risk, can be different in the debt and equity markets.
Making regulatory decisions based on studies using the shareholder perspective can lead to
wrong conclusions, as the credit risk perspective is better suited for regulatory conclusions.
Since mixed results has been obtained using equity data, the credit risk perspective should shed
more light on whether functional diversification should be allowed and commercial banking
combined with investment banking. However, it can’t be said that result obtained from the CDS
market can be generalized to the equity market. Potential risk transfer in financial institution
diversification is not the focus of this study but should provide an interesting topic for further
research, as the results from the equity market seem inconclusive.
2.2. Economies of Scope and Conflicts of Interest
The older literature studying the impact of functional diversification aims to directly
identify and discover the potential economies of scope and conflicts of interest associated with
functional diversification. Unlike the more recent literature, the older studies do not directly
measure how functional diversification impacts the riskiness of the whole financial institution.
The older literature does not directly compare with this study, but provides the theoretical and
empirical backbone, on how functional diversification can create the economies of scope and
conflicts of interest and through them impact the riskiness of the financial institution.
According to Baele, De Jonghe and Vander Vennet (2007) the potential advantages of
functionally diversified financial institutions result from the potential enhanced revenue
generation ability of the financial conglomerate or potential synergies. They argue that the
potential synergies might result from the increased economies of scope through the sharing of
employees, information and technology between different services offered by the financial
conglomerate.
The potential economies of scope are argued to result from the sharing of information
within the financial conglomerate. Financial institutions benefit from the information acquired
from the customers they lend to in traditional commercial banking, they receive private
information from the lending relationship unavailable to the public. The information can be

10
utilized when offering other financial services, such as investment banking or insurance
services to the same customers, improving the provision of financial services (Diamond 1991,
Rajan 1992, Stein 2002). Vice versa, other financial services such as securities underwriting,
insurance, mutual fund and brokerage services generate information that can be used in the loan
origination in commercial banking and improve the way financial institutions originate loans
(Diamond 1991, Rajan 1992, Stein 2002). Since financial conglomerates can utilize the
information acquired from a single financial service in other services, financial conglomerates
should benefit from the economies of scope which should improve performance and reduce
credit risk.
According to Vander Vennet (2002) functionally diversified financial institutions are not
more cost efficient, compared with specialized financial institutions, in producing traditional
commercial banking services. However, Vander Vennet (2002) finds that diversified financial
institutions are more cost efficient when other investment banking services are taken into
account. They also discover that diversified financial institutions are more efficient in terms of
operational efficiency and profit efficiency.
Using a framework which takes into account the potential revenue and cost synergies,
DeYoung and Roland (2001) find when financial institutions move their service mix from
traditional commercial banking towards fee based investment banking, the revenue volatility
and leverage of the financial institution increases, suggesting an increase in overall earnings
volatility. Furthermore, they find that the overall earnings level also increases when the service
mix is moved towards investment banking, suggesting a risk premium on investment banking.
Stiroh (2004) finds similar evidence suggesting small or no diversification benefits from
shifting the service mix towards fee income generating services. Stiroh (2004) finds a negative
relationship between the non-interest income share and profit per unit of risk, especially trading
activities appear to decrease profit per unit of risk. Stiroh and Rumble (2006) conclude that
some diversification benefits exist for US financial holding companies, however these benefits
are offset by increases in more volatile investment banking which is not more profitable that
traditional interest generating commercial banking services.
Mercieca, Schaeck and Wolfe (2007) find that small European financial institutions do
not benefit from diversification. They find non-interest income services negatively related to
profitability and risk-adjusted performance. They conclude that small European financial
institutions do not show the existence of economies of scope through diversification.

11
Measuring the economies of scope related to the functional diversification of financial
institutions has proven difficult. According to Berger and Humphrey (1997) the identification
of cost functions in diversified financial conglomerates offering a wide range of financial
services, suffer from econometric challenges. Berger and Humphrey (1997) suggest that the
econometric difficulties explain to some extent why the existence of economies of scope has
not been confirmed or rejected in offering diversified financial services.
Overall, according to previous research it seems that offering investment banking together
with commercial banking does not seem to increase the profitability of financial institutions on
risk adjusted basis. Offering limited evidence on the existence of economies of scope in
financial services.
Functional diversification may create or intensify agency costs and conflicts of interest
inside the financial institution, between the insiders and outsiders and between customers and
the financial institution. The existence of conflicts of interest when a financial institution
originates loans in commercial banking and offers investment banking services, mostly
securities underwriting and distributing, to the same corporate customer has been extensively
examined. The literature examines whether financial institutions, which lend to a corporate
client and underwrite its securities, try to generate private benefits by selling the securities of
the client corporation to the public as higher quality assets than they actually are.
According to Kroszner and Rajan (1994) financial institutions lending to a corporate
client receive information about the client before the public, this may incline the financial
institution to underwrite the securities of the client to the unaware public at inflated prices. The
purpose is to subsidize the lending through underwriting inflated securities. They argue that
since financial institutions have access to a large number of unsophisticated depositors, the
financial institutions have the opportunity to distribute the inflated lower quality securities
without the public’s full understanding of the true quality of the securities. However, by
examining US financial institutions before the introduction of the commercial and investment
banking separating Glass-Stegall Act of 1933, Kroszner and Rajan (1994) find that investors
and rating agencies took into account the possibility of conflicts of interest when the same
financial institution both underwrote the securities and had a lending relationship with company
in question. They found that financial institutions with underwriting and lending relationships
were forced to mainly underwrite better quality securities, since the public took into account
the possible conflicts of interest in lower quality and more information sensitive securities.

12
Moreover, Puri (1996) finds that investors are willing to pay a higher price for securities
underwritten by financial institutions with lending relationships, since the financial institution
possesses private information. Gande et al. (1997) finds similar evidence; investors pay higher
prices (lower yields), for low grade debt securities underwritten by financial conglomerates that
have a lending relationship with the company in question. Gande et al. (1997) find no evidence
of conflicts of interest even when a debt issue (underwritten by a financial institution with debt
to the issuing company) is used to refinance the debt owed to the underwriting financial
institution, a situation where the potential for conflicts of interest is high.
More recent research find no evidence supporting that debt underwritten by a financial
institution with a lending relationship with the debt issuing corporation has lower yields (Sufi
2004), suggesting that financial institutions with lending relationships do not have an
information advantage over non lending relationship financial institutions. Furthermore, Sufi
(2004) finds that debt underwritten by lending relationship financial institutions has lower
underwriting fees and confirms that the lower fees are not offered to capture business in the
future. The lower underwriting fees are confirmed by Drucker and Puri (2005) and they find
lower yield spreads for corporations whose debt is underwritten by a financial institution with
a lending relationship to the same corporation, suggesting the existence of economies of scope
and that the customers of the financial institution also benefit from them.
Schenone (2004) examines whether a lending relationship with a financial institution
affects the underprizing of corporate IPO’s, when the same financial institution underwrites the
corporations securities. She finds that a pre-IPO lending relationship reduces underprizing.
When underwriting securities financial institutions can reduce the asymmetric information gap
between the public and the issuer, by utilizing the private information gained by the pre-IPO
lending relationship. However, Ber, Yafeh and Yosha (2001) find conflicting evidence from
the Israeli IPO market, they find that companies with IPO’s underwritten by a financial
institution with a large credit stake in the company, experience lower than average post-IPO
share price development. They discover that when investment funds affiliated to the
underwriting financial institution purchase the underwritten shares extensively, share price
development is even more negative, suggesting the existence of conflicts of interest.
Is seems that research focusing on directly finding economies of scope or conflicts of
interest is also mixed. However, based on the literature it can be concluded that evidence on the
existence of either one is limited.
13
2.3. Credit Default Swaps
Credit default swaps (CDSs) provide insurance against the default risk of the referred
financial institution. The buyer of the CDS insurance pays the seller periodic payments until a
credit risk event occurs or until the maturity of the CDS contract. The annual payment, referred
as the CDS spread, is expressed as basis points of the value of the CDS contract. If a credit even
occurs (i.e. the default of the underlying financial institution) the byer of the CDS is
compensated for the losses, equalling the difference between the par value of the underlying
bond and its market value after the credit event. The CDS spread provides a robust measure of
the default probability (credit risk) of the referred financial institution.
According to Jorion and Zhang (2007) using CDS spreads instead of the spread between
the corporate and Treasury bond yields is preferable to measure credit risk. They argue that
bond measures are sensitive to the choice of the risk-free rate and other risk factors not related
to credit risk. Chen, Lesmond and Wei (2007) find that bond yield spreads are strongly related
to liquidity measures, like bond bid-ask spreads. Longstaff, Mithal and Neis (2005) find that
corporate yield spreads have a credit risk and liquidity component. Moreover, Blanco, Brennan
and Marsh (2005) find that CDSs have a clear lead over bond yield spread in the price discovery
process. They also suggest that CDSs are cleaner indicators over bonds yield spreads on credit
risk, concluding that CDSs are more useful in analysing credit risk.
Equity based risk measures contain some credit risk information (Vassalou, Xing 2004).
However, when measuring credit risk CDSs are preferable over equity market measures, since
credit events can imply different results in CDS and equity markets (Jorion, Zhang 2007). As
an example, increases in leverage implies increases in credit risk and higher CDS spreads,
however increases in leverage can transform value from bond holders to equity holders
implying increases in equity value (Jorion, Zhang 2007). Furthermore, equity risk measures
capture multiple risk factors instead of only credit risk (Fama, French 1993). Thus using CDS
spread over equity measures is preferable to measure credit risk.

14
3. Data and Methodology
3.1. Selected Financial Institutions
In this study, the data sample consists of 51 financial institutions from Europe and the US,
42 from Europe and 9 from the US. The European financial institutions are selected from all of
the listed financial institutions from the EU 15 countries, Norway and Switzerland. From the
listed institutions, only the financial institutions with traded credit default swaps are included
in the sample. From the US only financial institutions with liquid credit default swaps are
included in the sample5. The time span of the data sample ranges from 2007 to 2014, because
most of the currently traded CDSs started trading during 2007 when new CDS restructuring
clauses were implemented. The data is in panel data form with 51 financial institutions during
2007-2014. However, the data is not fully balanced as 14 financial institution year observations
are excluded due to missing data points, reducing the financial institution year observations
from 408 to 394.
3.2. Credit Default Swap Spreads
3.2.1. Financial Institution level Credit Default Swap Spreads
The credit default swap spreads used in this study have been collected from Datastream
Advanced database. For each financial institution daily CDS spreads, expressed in basis points,
are collected from 2007 to 2014. To measure the yearly credit risk of the financial institutions
as the dependable variable, the average of the daily senior debt CDS spreads within each year
are used. CDS spread can be obtained in different maturities, in this study the most liquid6 5
year maturity is used. However, for the sake of robustness also 1 and 10 year maturities are
used. CDS spreads can also be obtained for the junior debt of the financial institutions. Junior
debt is considered as mezzanine capital and can have equity risk characteristics in addition to
credit risk. Because of this, only senior CDS spreads are used.
5 The liquid US financial institutions have been selected based on reports from the Kamakura Corporation and
iBanknet. 6 According to the Bank of Finland “The determinants of global bank credit-default-swap spreads“ the 5 year
CDS maturity is the most liquid maturity.

15
Different contractual restructuring clauses have been introduced to CDSs, which define
the credit events that trigger the CDS settlement. Overall, there are multiple credit events that
trigger payments from the seller of the CDS contract to the buyer; bankruptcy, failure to pay,
repudiation/moratorium, obligation acceleration, obligation default and restructuring. The
restructuring credit event is the most difficult credit event to contract. Major differences
between different CDS contract clauses arise from the contractual handling of the restructuring
credit event. The full-restructuring (CR) clause used to be the standard clause, under which any
debt restructuring event is considered as a credit event. Under the CR clause, debt restructurings
that did not cause losses to the bond holders could constitute as credit events and trigger
payments to the CDS protection byers. As a response to the issue, the modified restructuring
clause (MR) was introduced in 2001, to limit credit events that did not cause losses. Under the
MR clause restructuring agreements still constitute as credit events (excluding the restructuring
of bilateral loans), however the MR clause limited the obligations deliverable in restructuring
agreement credit events to maturity under 30 months. In 2003 the modified-modified (MM)
restructuring clause was introduced, which increased the maturity limit of the deliverable
obligations to 60 months. In this study the MM restructuring clause is primarily used, which is
common in Europe and was found for most of the financial institutions used in this study.7
However, for 3 European financial institutions the CR clause is used and for 2 US financial
institutions the MR restructuring clause is used8. It is not believed that the use of non-MM
clauses for 5 financial institutions impacts the results. The spread difference between clauses is
not economically different, on average CR clause is priced 3.4 basis points higher than MR and
MM clause trades between CR and MR.9
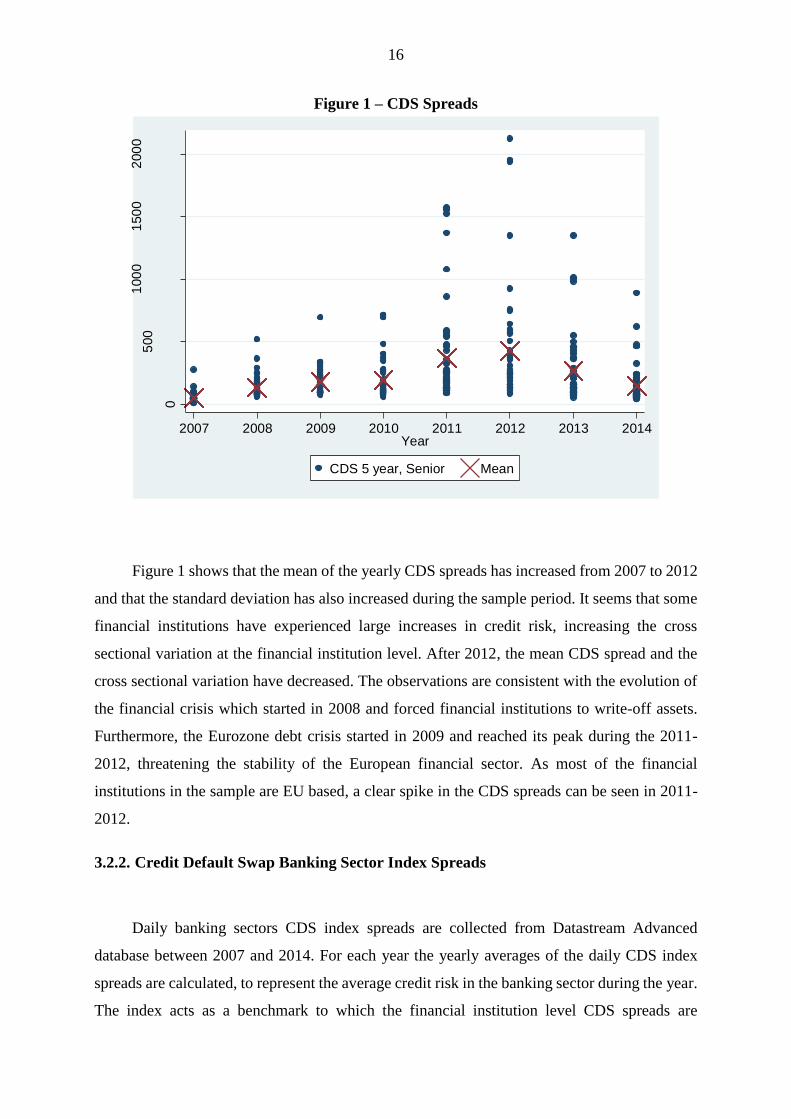
Figure 1 describes the yearly CDS spread observation for the 5-year maturity senior debt
CDS spreads used in the sample. Each yearly data point represents the yearly average of the
daily CDS spreads of a single financial institution within a specific year.
7 Information on credit default swap contractual terms and clauses has been obtained from the Bank of International
Settlements, Thompson Reuters and Markit. 8 The 5 financial institutions do not have MM clause CDSs 9 Bank of International Settlements was used as the source for the spread differences between restructuring clauses.
16
Figure 1 – CDS Spreads
Figure 1 shows that the mean of the yearly CDS spreads has increased from 2007 to 2012
and that the standard deviation has also increased during the sample period. It seems that some
financial institutions have experienced large increases in credit risk, increasing the cross
sectional variation at the financial institution level. After 2012, the mean CDS spread and the
cross sectional variation have decreased. The observations are consistent with the evolution of
the financial crisis which started in 2008 and forced financial institutions to write-off assets.
Furthermore, the Eurozone debt crisis started in 2009 and reached its peak during the 2011-
2012, threatening the stability of the European financial sector. As most of the financial
institutions in the sample are EU based, a clear spike in the CDS spreads can be seen in 2011-
2012.
3.2.2. Credit Default Swap Banking Sector Index Spreads
Daily banking sectors CDS index spreads are collected from Datastream Advanced
database between 2007 and 2014. For each year the yearly averages of the daily CDS index
spreads are calculated, to represent the average credit risk in the banking sector during the year.
The index acts as a benchmark to which the financial institution level CDS spreads are
0
500
100
01
50
02
00
0
CD
S s
pre
ad
, ba
sis
po
ints
2007 2008 2009 2010 2011 2012 2013 2014Year
CDS 5 year, Senior Mean

17
compared. The motivation is to also use the difference between the financial institution level
CDS spread and the banking index CDS spread in the regressions as the dependable variable.
For European financial institutions the ds europe banks 5y cds index is used and for US financial
institutions the ds na banks 5y cds index is used as the benchmark. As both CDS indexes have
5-year maturities also the financial institution level 5-year CDS spreads are used in the
difference. In order to calculate the difference the following method is used.
𝐶𝐷𝑆 𝐷𝐼𝐹𝐹.𝑛𝑡 = 𝐶𝐷𝑆𝑛𝑡 − 𝐶𝐷𝑆 𝑖𝑛𝑑𝑒𝑥𝑡
If the CDS spread of the financial institution is lower (higher) than the banking sector
CDS index spread, the difference is negative (positive). Meaning that negative (positive) CDS
difference values for a financial institution result in lower (higher) than the industry’s average
credit risk. Figure 2 demonstrates the annual financial institution level CDS spread differences.
Figure 2 – CDS Difference
3.3. Functional Focus and Diversification Measures
The explanatory and control variables used in this study are derived from the income
statement and balance sheet data of the financial institutions in the sample, the data has been
-500
0
500
100
01
50
02
00
0
CD
S s
pre
ad
, ba
sis
po
ints
2007 2008 2009 2010 2011 2012 2013 2014year
CDS Difference Mean

18
collected from the annual financial reports of the 51 financial institutions in the sample10. The
data ranges from 2007 to 2014 and includes only annual data.
The functional focus and diversification measurements used in this study follow methods
used in previous literature. Income and asset based methods are used to measure both functional
focus and diversification. Income based method of measuring functional focus measures which
income stream of the financial institution is larger, commercial banking or investment banking
income stream. Income based functional diversification measures how much the income
streams from commercial banking and investment banking are diversified. The asset based
functional focus method measures which commercial banking or investment banking assets are
larger and diversification how well the two asset categories are diversified in the balance sheet.
3.3.1. Income Based Measures for Functional Focus and Diversification
Measurements of income diversification and focus compare the proportion of net interest
income with the non-interest income of the financial institution. Net interest income is mostly
generated from the traditional commercial banking activities of the financial institution. Net
interest income is calculated by deducting interest expense (mostly the interest financial
institutions pay on the financing of their lending activities) from the interest income (interest
financial institutions receive from their lending activities), thus net interest income mostly
captures the extent of the financial institutions commercial banking activities. Non-interest
income captures income generated by investment banking11 activities of the financial institution,
which includes net fee income, net commission income, net trading income, net insurance
income and other income. Non-interest income is mostly generated from investment banking,
insurance, underwriting and distributing securities, securitizing assets, mutual fund services and
other financial services.
3.3.1.1. Net Interest Income Share
10 The annual statements have been obtained from the websites of the financial institutions and the data has been
collected by hand from the statements. 11 Even though referred to as investment banking, non-interest income can include income from other financial
services (e.g. insurance). The focus of the financial institutions is divided between commercial banking and
investment banking for the sake of clarity and since non-interest income mostly contains income from investment
banking.

19
Net interest income share, used by (Baele, De Jonghe & Vander Vennet 2007), simply
measures the share of net interest income to total operating income. Higher the ratio more the
financial institution generates its income from commercial banking. With a lower ratio, more
income is generated from investment banking activities. Thus the net interest income share
measures the functional focus of the financial institution.
𝑁𝑒𝑡 𝑖𝑛𝑡𝑒𝑟𝑒𝑠𝑡 𝐼𝑛𝑐𝑜𝑚𝑒 𝑆ℎ𝑎𝑟𝑒 = 𝐼𝑁𝑇
𝑇𝑂𝑅
Where:
INT = net interest income
TOR = total operating income = net interest income + non-interest income
The net interest income share does not properly capture functional diversification. The
method describes to which activity the financial institution is focusing on, not diversification.
The high (low) values of the measurement imply that the financial institution is focused on
commercial banking (investment banking). Only medium values imply that the financial
institution would be diversified. However, since commercial banking and investment banking
activities can have different risk profiles, the method is used to determine if there is a difference
in credit riskiness between commercial banking and investment banking. Furthermore, when
the functional diversification is examined, the net interest income share is used as a control
variable.
20
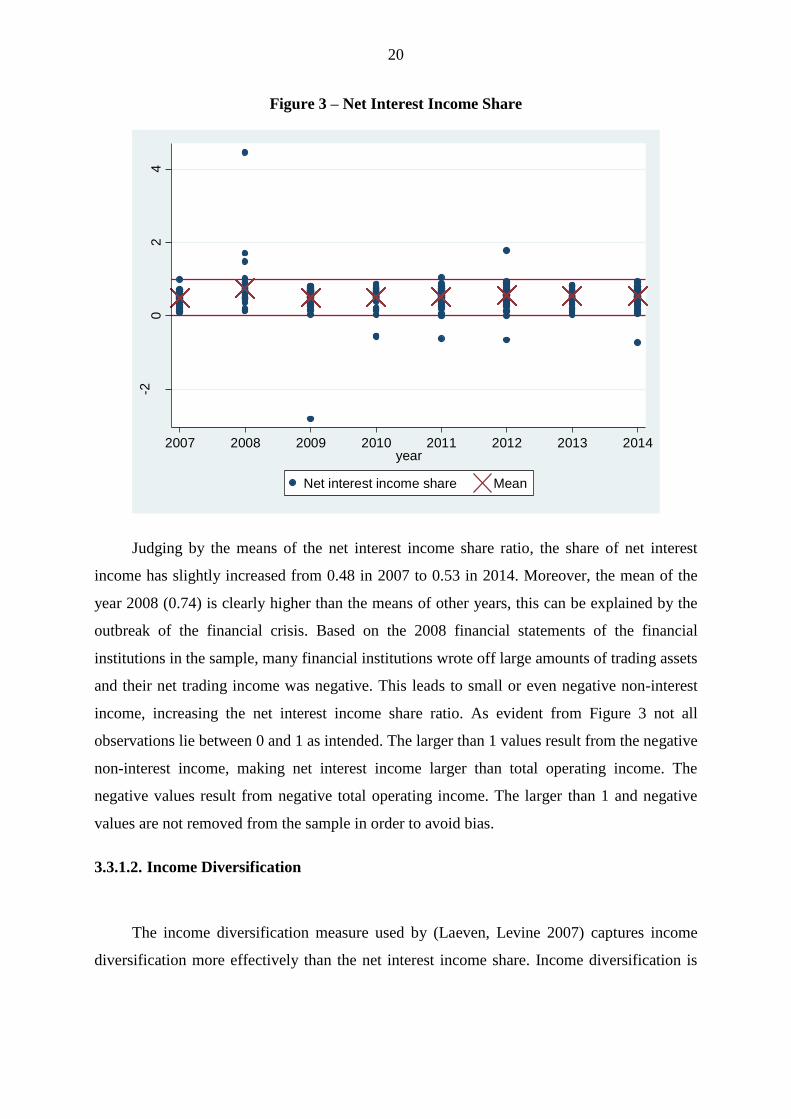
Figure 3 – Net Interest Income Share
Judging by the means of the net interest income share ratio, the share of net interest
income has slightly increased from 0.48 in 2007 to 0.53 in 2014. Moreover, the mean of the
year 2008 (0.74) is clearly higher than the means of other years, this can be explained by the
outbreak of the financial crisis. Based on the 2008 financial statements of the financial
institutions in the sample, many financial institutions wrote off large amounts of trading assets
and their net trading income was negative. This leads to small or even negative non-interest
income, increasing the net interest income share ratio. As evident from Figure 3 not all
observations lie between 0 and 1 as intended. The larger than 1 values result from the negative
non-interest income, making net interest income larger than total operating income. The
negative values result from negative total operating income. The larger than 1 and negative
values are not removed from the sample in order to avoid bias.
3.3.1.2. Income Diversification
The income diversification measure used by (Laeven, Levine 2007) captures income
diversification more effectively than the net interest income share. Income diversification is
-20
24
2007 2008 2009 2010 2011 2012 2013 2014year
Net interest income share Mean

21
calculated by taking the absolute value from, the difference between net interest income and
non-interest income divided by total operating income.
𝐼𝑁𝐶. 𝐷𝐼𝑉 = 1 − |𝐼𝑁𝑇 − 𝑁𝑂𝑁. 𝐼𝑁𝑇
𝑇𝑂𝑅|
Where:
INC.DIV = income diversification
INT = net interest income
NON.INT = non-interest income
TOR = total operating income
The income diversification measurement takes values between 1 and 0, where 0 implies
no diversification since income is generated exclusively from net interest income or non-
interest income, 1 implies high diversification since income is generated evenly from both net
interest income and non-interest income. The measure captures income diversification
effectively for regression purposes, since the relationship between high and low diversification
is linear. The measure returns the same values regardless which income stream is larger, thus
only focusing on diversification. Income diversification is the main explanatory variable used
in this study to measure the functional diversification.

22
Figure 4 – Income Diversification
The mean of the income diversification measure is the highest during 2007 at 0.71. During
2008, the mean income diversification decreased to 0.40, due to the decreases in non-interest
income. The mean of income diversification varies between 0.57 and 0.71 during 2009-2014.
Observations indicate a relatively high level of average diversification among the financial
institutions in the sample. Figure 4 shows that the financial institutions in the sample have wide
cross sectional variation in functional diversification, as the income diversification measures
are quite evenly distributed between 0 and 1. Again negative observations result from negative
non-interest income or total operating income.
3.3.1.3. Herfindahl-Hirschman Income Diversification
Second method used to measure functional diversification is the application of modified
Herfindahl-Hirschman index to income diversification, also used by (Elsas, Hackethal &
Holzhäuser 2010, Stiroh, Rumble 2006a). The HH income diversification is used in the
robustness section of this study.
-8-6
-4-2
02
2007 2008 2009 2010 2011 2012 2013 2014year
Income diversification Mean

23
𝐻𝐻 𝐼𝑁𝐶. 𝐷𝐼𝑉 = 1 − ((𝐼𝑁𝑇
𝑇𝑂𝑅)
2
+ (𝑁𝑂𝑁. 𝐼𝑁𝑇
𝑇𝑂𝑅)
2
)
Where:
HH INC.DIV = Herfindahl-Hirschman income diversification
INT = net interest income
NON.INT = non-interest income
TOR = total operating income
The HH income diversification measure can take values between 0 and 0.5, 0 implying
the financial institution is fully specializing in commercial banking or investment banking and
0.5 implying high diversification where income streams are evenly divided between the 2
income streams. The measure returns the same values regardless which income stream is larger,
only focusing on diversification.
Figure 5 – HH Income Diversification
-3-2
-10
1
2007 2008 2009 2010 2011 2012 2013 2014year
HH income diversification Mean

24
The HH income diversification measure tells the same story as the income diversification
measure, diversification among the financial institutions in the sample seems quite high based
on the means. The negative means of the 2008 and 2009 result from two highly negative
observations for one financial institution -30.80 in 2008 and -21.35 in 2009. The extreme values
have not been plotted in Figure 5, in order to increase readability. Negative non-interest income
and total operating income result in negative HH income diversification measures.
3.3.2. Asset Based Measures for Functional Diversification
Similar methods are used to measure the functional focus and functional diversification
based on the balance sheets of the financial institutions. The purpose of the asset measurements
is to measure the share and mix of commercial banking assets and investment banking assets in
the balance sheet of the financial institution. Since traditional commercial banking is mostly
lending based, loans in the balance sheet are categorised as commercial banking assets. Other
earning assets mostly include trading assets, derivatives, insurance assets, different investments
and other financial assets and are categorized as investment banking assets. Non-earning assets
such as cash, non-investment real-estate, equipment, intangible assets and tax assets are not
included in neither category nor total earning assets.
3.3.2.1. Loan Share
Loan share measures the share of loans to total earning assets and is used to measure the
functional focus of the financial institutions based on its balance sheet.
𝐿𝑜𝑎𝑛 𝑆ℎ𝑎𝑟𝑒 = 𝐿𝑂𝐴𝑁
𝑇𝐸𝐴
Where:
LOAN = net loans to customers
TEA = total earning assets (loans to customers + other earning assets)
Similarly to the net interest income share, high (low) values imply high focus on
commercial banking (investment banking) and mid values high diversification. The loan share
is used to determine if the credit risk between commercial banking and investment banking is
different and as a control variable.
25
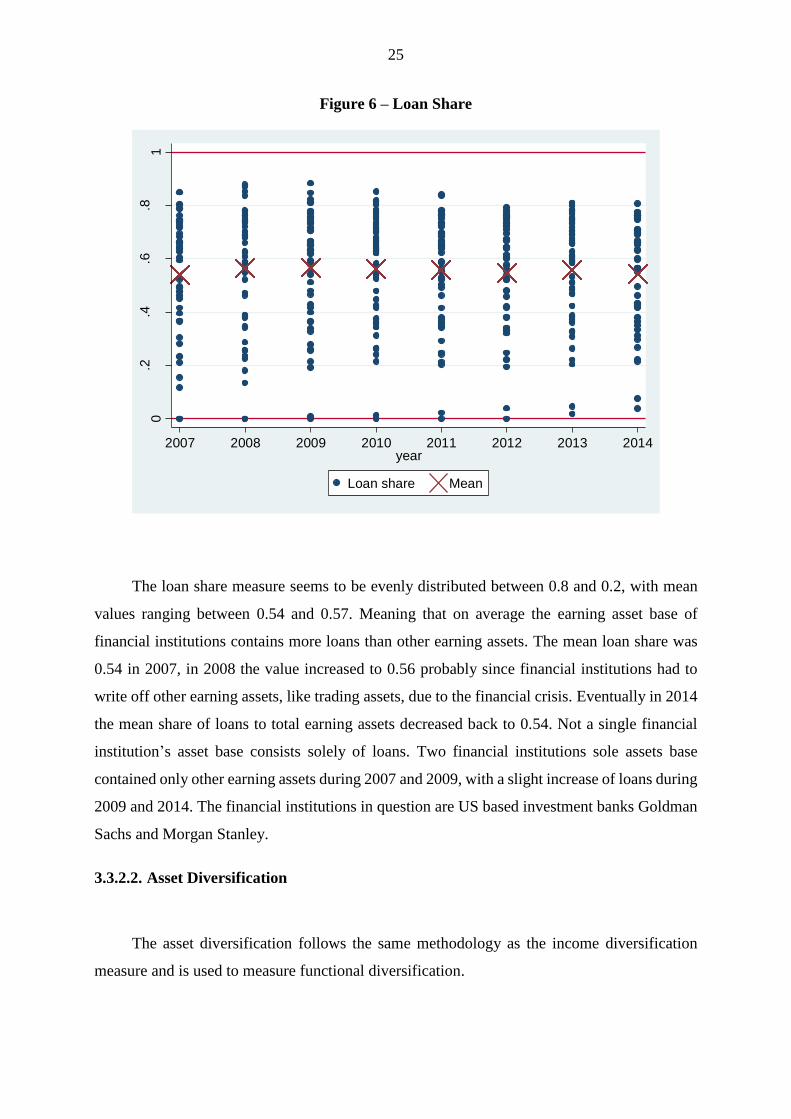
Figure 6 – Loan Share
The loan share measure seems to be evenly distributed between 0.8 and 0.2, with mean
values ranging between 0.54 and 0.57. Meaning that on average the earning asset base of
financial institutions contains more loans than other earning assets. The mean loan share was
0.54 in 2007, in 2008 the value increased to 0.56 probably since financial institutions had to
write off other earning assets, like trading assets, due to the financial crisis. Eventually in 2014
the mean share of loans to total earning assets decreased back to 0.54. Not a single financial
institution’s asset base consists solely of loans. Two financial institutions sole assets base
contained only other earning assets during 2007 and 2009, with a slight increase of loans during
2009 and 2014. The financial institutions in question are US based investment banks Goldman
Sachs and Morgan Stanley.
3.3.2.2. Asset Diversification
The asset diversification follows the same methodology as the income diversification
measure and is used to measure functional diversification.
0.2
.4.6
.81
2007 2008 2009 2010 2011 2012 2013 2014year
Loan share Mean
26
𝐴𝑆. 𝐷𝐼𝑉 = 1 − |𝐿𝑂𝐴𝑁 − 𝑂𝐸𝐴
𝑇𝐸𝐴|
Where:
AS.DIV = asset diversification
LOAN = net loans to customers
OEA = other earning assets
TEA = total earning assets (loans to customers + other earning assets)
The asset diversification measurement takes value between 1 and 0, where high (low)
values imply high (low) functional diversification.
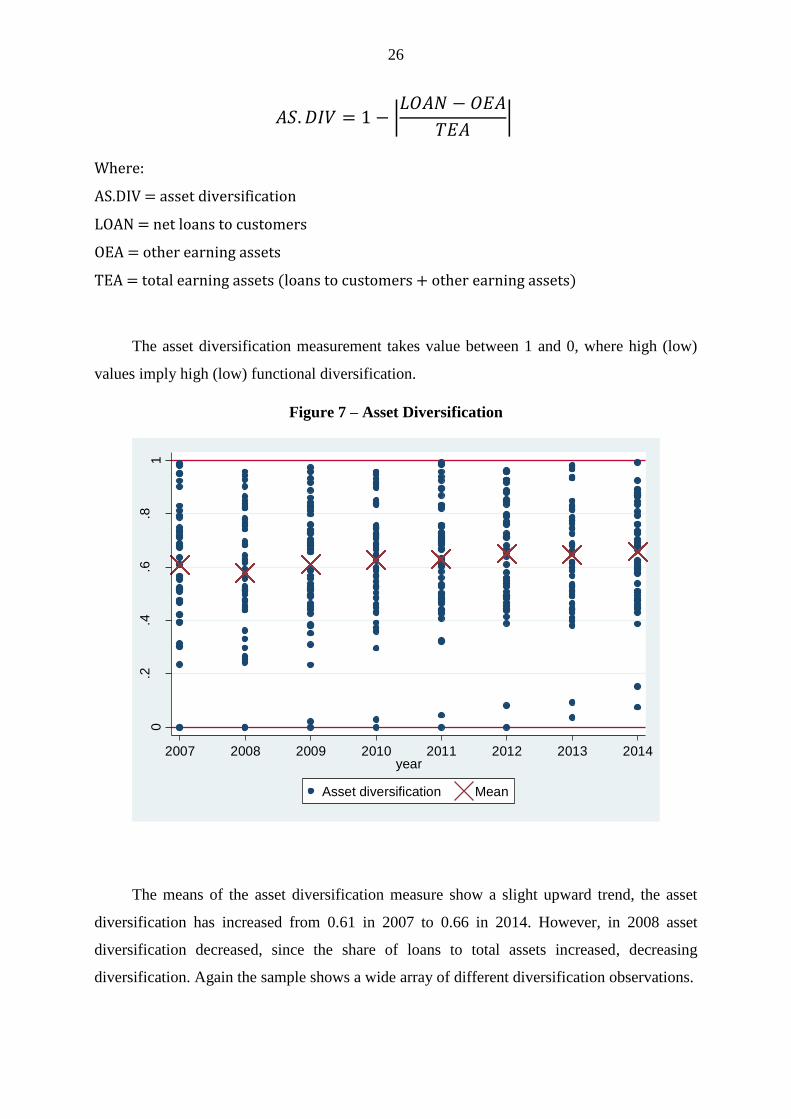
Figure 7 – Asset Diversification
The means of the asset diversification measure show a slight upward trend, the asset
diversification has increased from 0.61 in 2007 to 0.66 in 2014. However, in 2008 asset
diversification decreased, since the share of loans to total assets increased, decreasing
diversification. Again the sample shows a wide array of different diversification observations.
0.2
.4.6
.81
2007 2008 2009 2010 2011 2012 2013 2014year
Asset diversification Mean

27
3.3.2.3. Herfindahl-Hirschman Asset Diversification
The HH asset diversification measure uses the modified Herfindahl-Hirschman index
method. The HH asset diversification is used in the robustness section of this study to measure
functional diversification.
𝐻𝐻 𝐴𝑆. 𝐷𝐼𝑉 = 1 − ((𝐿𝑂𝐴𝑁
𝑇𝐸𝐴)
2
+ (𝑂𝐸𝐴
𝑇𝐸𝐴)
2
)
Where:
HH AS.DIV = Herfindahl-Hirschman asset diversification
LOAN = net loans to customers
OEA = other earning assets
TEA = total earning assets (loans to customers + other earning assets)
The HH asset diversification measure can take values between 0 and 0.5, high (low)
values implying high (low) diversification.
Figure 8 – HH Asset Diversification
0.1
.2.3
.4.5
2007 2008 2009 2010 2011 2012 2013 2014year
HH asset diversification Mean

28
3.4. Control Variables
In order to control for other potential explanatory factors for the credit risk of financial
institutions, I employ several control variables in the panel data regressions. The used control
variables follow previous literature12. The control variables have been obtained from the annual
financial statements of the financial institutions in the sample.
3.4.1. Tier 1 Capital Ratio
First major control variable is the tier 1 capital ratio of the financial institutions. The tier
1 capital ratio describes the financial strength and riskiness of the financial institution and is
similar with the traditional leverage ratio. Tier 1 is used for regulatory purposes. The tier 1
capital ratio is calculated by dividing the core equity capital (or tier 1 capital) with the risk
weighted assets of the financial institution. The risk weighted assets include all risky assets of
the financial institution with different credit risk weights for each asset class. Central banks or
national institutions in charge for regulating financial institutions develop the weights for
different asset classes, which often follow the international Basel regulatory guidelines.
Financial institutions with a tier 1 capital ratio under 6%13 are seen as undercapitalized and are
forbidden to pay out any dividend or management fees. High tier 1 ratio implies lower riskiness
and stronger capital structure of the financial institution. Thus the tier 1 ratio is expected to be
negatively related to CDS spreads and credit risk.
12 Some control variables follow methodology used in a study published by the Bank of Finland “The determinants
of global bank credit-default-swap spreads” 13 Different limits exists in different regulatory jurisdictions, 6% is the most commonly known.
29
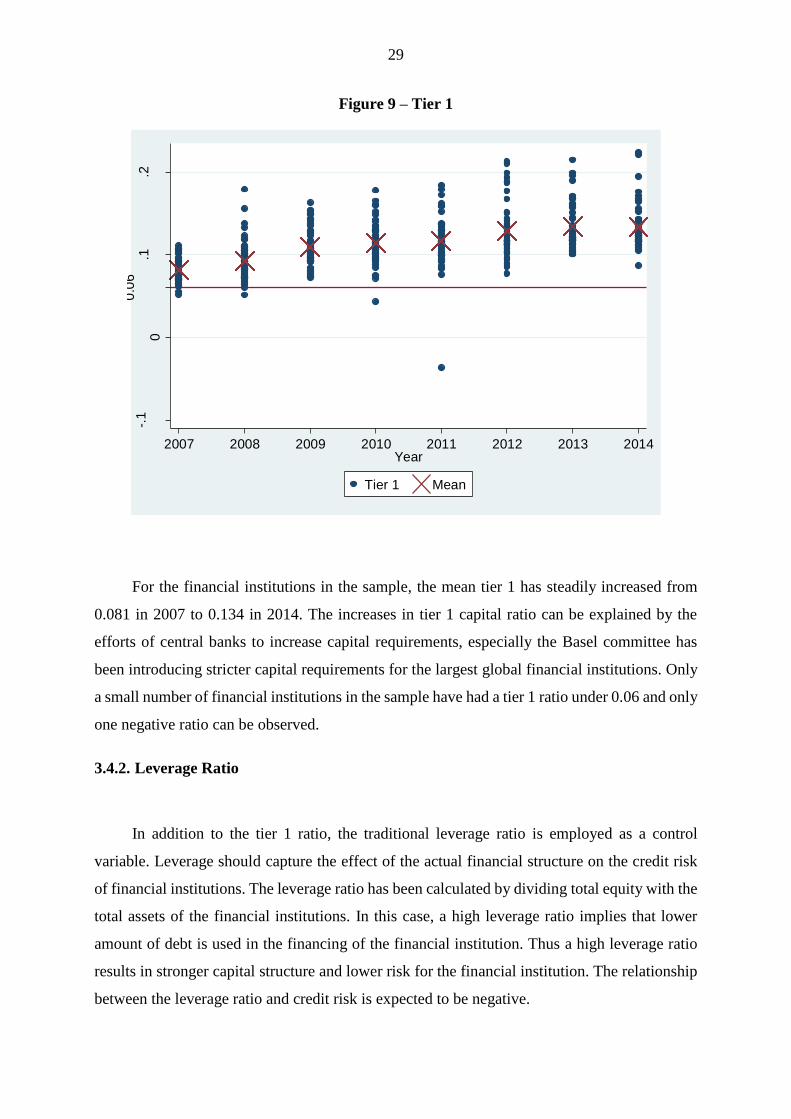
Figure 9 – Tier 1
For the financial institutions in the sample, the mean tier 1 has steadily increased from
0.081 in 2007 to 0.134 in 2014. The increases in tier 1 capital ratio can be explained by the
efforts of central banks to increase capital requirements, especially the Basel committee has
been introducing stricter capital requirements for the largest global financial institutions. Only
a small number of financial institutions in the sample have had a tier 1 ratio under 0.06 and only
one negative ratio can be observed.
3.4.2. Leverage Ratio
In addition to the tier 1 ratio, the traditional leverage ratio is employed as a control
variable. Leverage should capture the effect of the actual financial structure on the credit risk
of financial institutions. The leverage ratio has been calculated by dividing total equity with the
total assets of the financial institutions. In this case, a high leverage ratio implies that lower
amount of debt is used in the financing of the financial institution. Thus a high leverage ratio
results in stronger capital structure and lower risk for the financial institution. The relationship
between the leverage ratio and credit risk is expected to be negative.
-.1
0.1
.20
.06
2007 2008 2009 2010 2011 2012 2013 2014Year
Tier 1 Mean

30
Figure 10 – Leverage Ratio
The mean leverage ratio has also increased from 0,057 in 2007 to 0,069 in 2014. Negative
values in 2011 and 2012 are observed as the National Bank of Greece, Dexia and Eurobank
Ergasias had negative equity values during those years. The means of the leverage observations
increased by 21% between 2007 and 2014, as the tier 1 observations increased by 65%. Since
the increase in the leverage ratio is much smaller, it can be interpreted as an indication that
financial institutions have increased their tier 1 capital ratios by both increasing the relative
amount of equity and by shifting their asset base towards less risky assets (decreasing risk
weighted assets).
3.4.3. Cost to Income Ratio
The cost to income ratio is widely used to measure the profitability of financial
institutions. The ratio is calculated by dividing the operational costs (salaries, SQ&A, the
depreciation of non-financial assets and other costs) with the total net operating income (net
interest income and non-interest income). Provisions for credit losses (losses and expected
losses on loans) are not included in the ratio. Lower (higher) the ratio more (less) profitable the
0
.05
.1.1
5
2007 2008 2009 2010 2011 2012 2013 2014Year
Leverage Mean

31
financial institution is. If the ratio is one or higher, the operational costs of the financial
institution exceed the income and the financial institution is unprofitable.
Figure 11 – Cost to Income Ratio
During 2008, the profitability of financial institutions was low, potentially because many
financial institutions occurred losses in trading and wrote down financial assets. Negative
values indicate that the total operating income of the financial institution has been negative.
3.4.4. Size
The effect of the size of financial institutions on risk and the stability of the banking sector
(so called too big to fail doctrine) has been much debated. According to research, if large
financial institutions are at risk of default, governments might save the financial institution in
order to avoid the adverse impacts of defaulting financial institutions on the economy (O'Hara,
Shaw 1990). The size of the financial institutions is used as a control variable, measured by the
natural logarithm of the total assets of the financial institutions. The relationship between size
and credit risk is expected to be negative, as larger financial institution should have lower
probabilities of default as governments might save them from default.
-4-2
02
46
1
2007 2008 2009 2010 2011 2012 2013 2014Year
Cost to income Mean

32
3.4.5. Loan Loss Provisions to Net Loans
Financial institutions make credit loss provisions in the income statement, based on loan
losses and expected losses. Through the provisions, they write of assets (mostly loans) based
on expected defaults on customer loans. The ratio of credit loss provisions to net loans measures
the credit risk exposure of the loan portfolio of financial institutions and is included as a control
variable. A high ratio implies high credit risk in the loan portfolio. The loan loss provisions
ratio is expected to be positively related with CDS spreads and credits risk.
3.4.6. Interest Expense to Liabilities
The interest expense divided by the total liabilities ratio of the financial institution
measures the financing cost of the financial institution. Even though not a market based measure,
it can indicate the credit risk of the financial institution. Increased credit risk should in theory
increase the interest rate margin available for the financing of the financial institution, as
financiers demand compensation on the increased riskiness. Thus, the relationship between the
interest expense ratio and CDS spreads is expected to be positive.
3.4.7. Liquid Assets to Total Assets
A part of credit risk for financial institutions can result from liquidity risk. If the financial
institution does not have enough liquid assets, it may not be able to pay its payables in adverse
market conditions. In the case of a bank run, depositors and other financiers of the financial
institutions might withdraw larger than expected amounts of capital from the financial
institution. If the financial institution does not have enough liquid assets to fulfil the unexpected
withdrawals, it might face bankruptcy even if its operations were profitable. Thus in order to
control for liquidity risk the liquid assets to total assets ratio is used as a control variable. Only
the most liquid assets are included in the ratio, cash and deposits in central banks. A higher
ratio should indicate lower liquidity risk. A negative relationship between the liquidity ratio and
CDS spreads is expected.

33
3.5. Summary Statistics
Table I – Summary Statistics 2007-2014
Variable N Std.
Dev. Mean Min P25 P50 P75 Max
CDS 5y 397 280.39 223.49 14.79 87.08 129.40 243.77 2121.58
CDS 1y 393 349.02 186.71 3.16 39.33 83.61 173.27 3024.38
CDS 10y 393 235.05 217.52 4.77 96.81 145.37 247.44 1824.28
CDS difference 397 250.70 16.92 -294.17 -96.10 -36.73 28.84 1721.43
Income share 397 0.359 0.548 -2.81 0.47 0.57 0.68 4.46
Income
diversification 397 0.615 0.618 -6.91 0.53 0.73 0.89 1
HH Income div 397 1.94 0.238 -30.79 0.39 0.46 0.49 0.5
Loan share 397 0.209 0.556 0 0.41 0.62 0.72 0.884
Asset
diversification 397 0.216 0.626 0 0.49 0.65 0.78 0.993
HH Asset div. 397 0.101 0.407 0 0.37 0.44 0.48 0.5
Tier 1 394 0.032 0.114 -0.037 0.09 0.11 0.13 0.224
Leverage 397 0.029 0.062 -0.018 0.04 0.06 0.08 0.161
Cost/income 397 0.525 0.651 -3.47 0.53 0.62 0.72 6.80
Ln(size) 397 1.18 12.78 10.36 11.73 12.94 13.92 14.92
Provisions/loans 397 0.014 0.012 -0.004 0.003 0.009 0.016 0.095
Interest expense
/liabilities 397 0.017 0.022 0.003 0.012 0.017 0.029 0.163
Liquid assets
/assets 397 0.030 0.034 0.000 0.012 0.025 0.051 0.163
4. Hypothesis
Previous literature on the effect of functional diversification on the riskiness of financial
institutions has provided conflicting results. The results vary based on geographical scope, the
methods of measuring diversification and methods on measuring market valuations and risk.
Some studies find that diversification increases (decreases) riskiness (market values) of
financial institutions and other studies the opposite. These studies use equity based risk and
value measurements to determine the riskiness or value of the financial institutions and the
relationship between functional diversification. To determine whether financial institutions

34
should be allowed to functionally diversify (combine commercial banking with investment
banking) the most relevant risk factor from the regulatory perspective is credit risk. Using the
equity based risk and valuation methods multiple risk factors are captured, instead of only credit
risk. Regulation is mostly interested in to protect the economy from the negative impacts of
banking failures and defaults. This is why this study concentrates on measuring financial
institution level risk, using CDS spreads that directly capture the credit risk of financial
institutions.
Before determining whether functional diversification impacts the credit risk of financial
institutions, the impact of functional focus (commercial or investment banking) is examined.
Since diversification benefits can arise from lower exposure to a riskier function, not
diversification itself. Moreover, when examining functional diversification, the functional
focus of the financial institution is controlled for.
4.1. Research Question 1 – Are Financial Institutions Focusing More on Investment
Banking More Risky Than Those Focusing on Commercial Banking
Previous research has found that financial institutions focusing on fee generating
investment banking are riskier than those focusing on net interest income generating
commercial banking activities. No studies have used bond or CDS data to measure credit risk.
However, in light of previous research it is hypothesised that a lower share of net interest
income or loan share leads to higher credit risk, resulting in higher (lower) credit risk for
financial institutions focusing more on investment banking (commercial banking).
H1 – Financial institutions focusing on investment banking have higher credit risk.
In order to answer the first research question, the following OLS panel data regressions
are developed. At first random effects OLS panel data regressions will be used with the
following notation, to answer if financial institutions focusing more on investment banking
have higher credit risk.
𝐶𝐷𝑆𝑛𝑡 = 𝛽0 + 𝜷𝟏𝑰𝒏𝒕𝒆𝒓𝒆𝒔𝒕 𝒔𝒉𝒂𝒓𝒆 + 𝜷𝟐𝑳𝒐𝒂𝒏 𝒔𝒉𝒂𝒓𝒆𝒏𝒕 + 𝛽3𝑇𝑖𝑒𝑟1𝑛𝑡 +
𝛽4𝐿𝐸𝑉𝑛𝑡 + 𝛽5𝐶𝑜𝑠𝑡
𝐼𝑁𝐶 𝑛𝑡+ 𝛽6𝐿𝑁(𝑆𝑖𝑧𝑒)𝑛𝑡 + 𝛽7
𝑃𝑅𝑂𝑉
𝐿𝑜𝑎𝑛𝑠𝑛𝑡+ 𝛽8
𝐼𝑁𝑇.𝐸𝑋𝑃
𝐿𝑖𝑎𝑏𝑖𝑙𝑖𝑡𝑖𝑒𝑠𝑛𝑡+
𝛽9𝐿𝑖𝑞𝑢𝑖𝑑 𝐴𝑆.
𝐴𝑠𝑠𝑒𝑡𝑠 𝑛𝑡
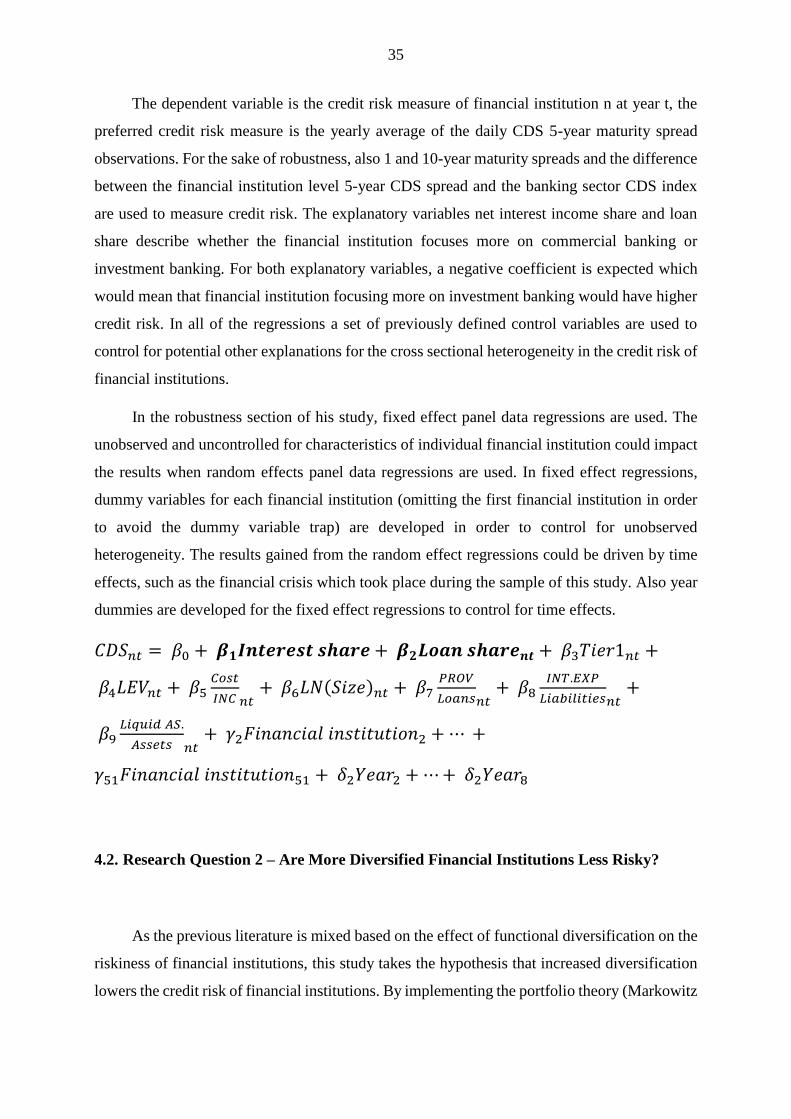
35
The dependent variable is the credit risk measure of financial institution n at year t, the
preferred credit risk measure is the yearly average of the daily CDS 5-year maturity spread
observations. For the sake of robustness, also 1 and 10-year maturity spreads and the difference
between the financial institution level 5-year CDS spread and the banking sector CDS index
are used to measure credit risk. The explanatory variables net interest income share and loan
share describe whether the financial institution focuses more on commercial banking or
investment banking. For both explanatory variables, a negative coefficient is expected which
would mean that financial institution focusing more on investment banking would have higher
credit risk. In all of the regressions a set of previously defined control variables are used to
control for potential other explanations for the cross sectional heterogeneity in the credit risk of
financial institutions.
In the robustness section of his study, fixed effect panel data regressions are used. The
unobserved and uncontrolled for characteristics of individual financial institution could impact
the results when random effects panel data regressions are used. In fixed effect regressions,
dummy variables for each financial institution (omitting the first financial institution in order
to avoid the dummy variable trap) are developed in order to control for unobserved
heterogeneity. The results gained from the random effect regressions could be driven by time
effects, such as the financial crisis which took place during the sample of this study. Also year
dummies are developed for the fixed effect regressions to control for time effects.
𝐶𝐷𝑆𝑛𝑡 = 𝛽0 + 𝜷𝟏𝑰𝒏𝒕𝒆𝒓𝒆𝒔𝒕 𝒔𝒉𝒂𝒓𝒆 + 𝜷𝟐𝑳𝒐𝒂𝒏 𝒔𝒉𝒂𝒓𝒆𝒏𝒕 + 𝛽3𝑇𝑖𝑒𝑟1𝑛𝑡 +
𝛽4𝐿𝐸𝑉𝑛𝑡 + 𝛽5𝐶𝑜𝑠𝑡
𝐼𝑁𝐶 𝑛𝑡+ 𝛽6𝐿𝑁(𝑆𝑖𝑧𝑒)𝑛𝑡 + 𝛽7
𝑃𝑅𝑂𝑉
𝐿𝑜𝑎𝑛𝑠𝑛𝑡+ 𝛽8
𝐼𝑁𝑇.𝐸𝑋𝑃
𝐿𝑖𝑎𝑏𝑖𝑙𝑖𝑡𝑖𝑒𝑠𝑛𝑡+
𝛽9𝐿𝑖𝑞𝑢𝑖𝑑 𝐴𝑆.
𝐴𝑠𝑠𝑒𝑡𝑠 𝑛𝑡+ 𝛾2𝐹𝑖𝑛𝑎𝑛𝑐𝑖𝑎𝑙 𝑖𝑛𝑠𝑡𝑖𝑡𝑢𝑡𝑖𝑜𝑛2 + ⋯ +
𝛾51𝐹𝑖𝑛𝑎𝑛𝑐𝑖𝑎𝑙 𝑖𝑛𝑠𝑡𝑖𝑡𝑢𝑡𝑖𝑜𝑛51 + 𝛿2𝑌𝑒𝑎𝑟2 + ⋯ + 𝛿2𝑌𝑒𝑎𝑟8
4.2. Research Question 2 – Are More Diversified Financial Institutions Less Risky?
As the previous literature is mixed based on the effect of functional diversification on the
riskiness of financial institutions, this study takes the hypothesis that increased diversification
lowers the credit risk of financial institutions. By implementing the portfolio theory (Markowitz

36
1952), different income sources which are not perfectly correlated, should decrease the default
probability of financial institutions.
H2 – Financial institutions with higher functional diversification have lower credit risk.
In order to answer if more functionally diversified financial institutions have lower credit
risk, income and asset diversification measures are used as the explanatory variables. For both
variables negative coefficients are expected since diversification is expected to decrease credit
risk. When the income and asset diversification measures are used in the regressions, the net
interest income and loan share ratios are used as control variables. The net interest income and
loan shares measures do not measure diversification, but the extent on which the financial
institution focusses on commercial banking or investment banking. The income and asset
diversification measures capture the level of diversification, since both methods give the same
values regardless which commercial banking or investment banking the financial institutions
focusses on. However, the credit risk levels of financial institutions focusing on commercial
banking or investment banking can differ. Thus when using the diversification measures as
explanatory variables, the net interest income and loan shares are used to control for the
potential differences in credit risk levels based on the functional focus of the institution with
the following notation.
𝐶𝐷𝑆𝑛𝑡 = 𝛽0 + 𝜷𝟏𝑰𝑵𝑪. 𝑫𝑰𝑽𝒏𝒕 + 𝜷𝟐𝑨𝑺. 𝑫𝑰𝑽𝒏𝒕 + 𝛽10𝐼𝑛𝑡𝑒𝑟𝑒𝑠𝑡 𝑠ℎ𝑎𝑟𝑒 𝑛𝑡 +
𝛽11𝐿𝑜𝑎𝑛 𝑠ℎ𝑎𝑟𝑒𝑛𝑡 𝛽3𝑇𝑖𝑒𝑟1𝑛𝑡 + 𝛽4𝐿𝐸𝑉𝑛𝑡 + 𝛽5𝐶𝑜𝑠𝑡
𝐼𝑁𝐶 𝑛𝑡+ 𝛽6𝐿𝑁(𝑆𝑖𝑧𝑒)𝑛𝑡 +
𝛽7𝑃𝑅𝑂𝑉
𝐿𝑜𝑎𝑛𝑠𝑛𝑡+ 𝛽8
𝐼𝑁𝑇.𝐸𝑋𝑃
𝐿𝑖𝑎𝑏𝑖𝑙𝑖𝑡𝑖𝑒𝑠𝑛𝑡+ 𝛽9
𝐿𝑖𝑞𝑢𝑖𝑑 𝐴𝑆.
𝐴𝑠𝑠𝑒𝑡𝑠 𝑛𝑡
Similarly to the first research question, fixed effects regressions are also used for the
second research question to increase robustness. The CDS spread difference, calculated as the
difference between the financial institution level CDS spread and the banking sector CDS sector
index, is used as the dependable variable for credit risk. The motivation is to further increase
the robustness of the results. By using the CDS difference as the dependable credit risk measure,
the regressions do not take into account the changes in the overall credit risk environment of
the banking sector. When, only using the financial institution level CDS spreads, the changes
in the overall credit risk environment are taken into account and may impact results. When the
difference is used, bank level changes in credit risk are more evident and should improve results.

37
The following notation is used for research question 2, moreover the same CDS difference
method is also used for the first research question.
𝐶𝐷𝑆𝑛𝑡 − 𝐶𝐷𝑆 𝑖𝑛𝑑𝑒𝑥𝑡 = 𝛽0 + 𝜷𝟏𝑰𝑵𝑪. 𝑫𝑰𝑽𝒏𝒕 + 𝜷𝟐𝑨𝑺. 𝑫𝑰𝑽𝒏𝒕 +
𝛽10𝐼𝑛𝑡𝑒𝑟𝑒𝑠𝑡 𝑠ℎ𝑎𝑟𝑒𝑛𝑡 + 𝛽11𝐿𝑜𝑎𝑛 𝑠ℎ𝑎𝑟𝑒 𝑛𝑡 𝛽3𝑇𝑖𝑒𝑟1𝑛𝑡 + 𝛽4𝐿𝐸𝑉𝑛𝑡 +
𝛽5𝐶𝑜𝑠𝑡
𝐼𝑁𝐶 𝑛𝑡+ 𝛽6𝐿𝑁(𝑆𝑖𝑧𝑒)𝑛𝑡 + 𝛽7
𝑃𝑅𝑂𝑉
𝐿𝑜𝑎𝑛𝑠𝑛𝑡+ 𝛽8
𝐼𝑁𝑇.𝐸𝑋𝑃
𝐿𝑖𝑎𝑏𝑖𝑙𝑖𝑡𝑖𝑒𝑠𝑛𝑡+ 𝛽9
𝐿𝑖𝑞𝑢𝑖𝑑 𝐴𝑆.
𝐴𝑠𝑠𝑒𝑡𝑠 𝑛𝑡
5. Results
The results of this study suggest that the credit risk of financial institutions focusing more
on investment banking does not differ from those focusing more on commercial banking.
Financial institutions with higher income diversification have lower CDS spreads, even when
the functional focus of the financial institution is controlled for. Functional diversification
reduces the credit risk of financial institutions and the reduction in credit risk is not created by
functional focus. I find no evidence that financial institution with less loans in their balance
sheet have higher credit risk or that asset diversification impacts the credit risk of financial
institutions. Thus only hypothesis 2 is accepted, but only with the income based measures for
the functional diversification of financial institution.
5.1. Is Investment Banking More Risky Than Commercial Banking?
At first it is studied whether financial institutions with higher focus on investment
banking have higher credit risk than those focusing on traditional commercial banking. Table
II contains the regression results using the net interest income to total income and loans to total
earning assets as explanatory variables to measure the functional focus of the financial
institutions. The dependable variable is the financial institution level CDS spreads as a measure
for credit risk.

38
Table II – Net Interest Income Share and Loan Share, Random Effects Regressions
𝑁𝑒𝑡 𝑖𝑛𝑡𝑒𝑟𝑒𝑠𝑡 𝑖𝑛𝑐𝑜𝑚𝑒 𝑠ℎ𝑎𝑟𝑒 = 𝐼𝑁𝑇
𝑇𝑂𝑅 and 𝐿𝑜𝑎𝑛 𝑠ℎ𝑎𝑟𝑒 =
𝐿𝑂𝐴𝑁
𝑇𝐸𝐴. Mainly 5 year maturity CDS spread is used
in the regressions as a dependable variable, for the sake of robustness also 1 and 10 year maturities are used.
CDS spreads are yearly averages of daily financial institution level CDS spread observations. In the table
columns represent individual regressions, with the coefficient of the corresponding variable presented first
in the variable cell. Below the coefficient the corresponding t-value is presented in brackets.
CDS 5y CDS 5y CDS 5y CDS 1y CDS 10y
Net interest income
share
-5.85 -4.31 12.43 -24.4
(-0.13) (-0.10) (0.2) (-0.59)
Loan share 10.45 5.31 -61.58 17.97
(0.09) (0.05) (-0.4) (0.17)
Tier 1 1600.39 1592.33 1591.80 1154.70 1537.24
(3.79)*** (3.89)*** (3.81)*** (2.03)** (4.07)***
Leverage -4091.24 -4078.08 -4073.15 -3925.70 -2833.91
(-7.70)*** (-7.80)*** (7.71)*** (-5.34)*** (5.73)***
Cost/income. 31.31 30.33 28.21 48.13 38.44
(0.99) (1.01) (1.38) (1.14) (1.37)
LN(Size) -108.54 -109.52 -108.64 -122.87 -88.44
(-5.69)*** (-7.24)*** (-5.76)*** (-4.78)*** (-5.09)***
Provisions/loans 7795.04 7805.79 7817.19 9460.24 6091.73
(9.00)*** (9.04)*** (9.05)*** (8.03)*** (7.78)***
Int. exp./liabilities -1491.76 -1488.38 -1489.82 -1002.32 -1513.22
(-1.75)* (1.75)* (-1.75)* (-0.88) (-1.98)**
Liquid/assets -407.03 -400.56 -403.35 -402.07 -356.49
(-0.89) (-0.9) (-0.89) (-0.66) (-0.87)
Constant 1609.89 1627.94 1612.23 1789.06 1303.24
(5.34)*** (7.64)*** (5.43)*** (4.41)*** (4.75)***
N 394 394 394 390 390
Prob>Chi2 0.00 0.00 0.00 0.00 0.00
R2 0.38 0.38 0.38 0.31 0.31
* p<0.1; ** p<0.05; *** p<0.01
Both net interest income and the loan share ratios are not significant and the null
hypothesis cannot be rejected. It seems that higher share of net interest income or loans does
not reduce the CDS spreads of financial institutions, when the linear specification is used.
Financial institutions that focus on offering commercial banking services are as risky as
financial institutions focusing on investment banking in credit risk terms. The coefficient of
both ratios change depending on which maturity of the CDS spreads is used, when using the 5

39
and 10-year maturities the coefficient for the net interest income share (loan share) ratio is
negative (positive) and when using the 1-year maturity the sign changes for both ratios.
Based on the Table II results, some control variables have coefficient signs than were not
expected and some as expected. The coefficient of the tier 1 ratio is positive and significant
with a p value lower than 0.01 in all of the regressions using different CDS maturities, with the
exception of the 1 year maturity where the coefficient is significant at 0.05 level. The positive
coefficient ranges between 1155 and 1600, meaning that financial institutions with higher tier
1 ratios (indicating lower risk) have higher CDS spreads and higher credit risk. Using the 1600
coefficient, an increase of tier 1 ratio from the sample’s first quartile tier 1 ratio of 0.094 to the
third quartile 0.130 observation, translates to an increase of 57.60 basis points in the 5-year
CDS spread. Compared with the mean value of the 5-year CDS spreads of 223.49 the change
is quite significant. However, the relationship between the tier 1 ratio and CDS spreads is
counterintuitive, increase in tier 1 should decrease risk and reduce CDS spreads. The result can
be explained by the financial crisis, from 2007 to 2012 CDS spreads in the sample increased as
the banking sector experienced a turbulent environment. In response to the banking crisis,
regulators demanded financial institutions to increase their capital buffers and increase tier 1
ratios, as a result tier 1 ratios in the sample increased from 2007 to 2014. It is speculated that
the positive coefficient of the tier 1 ratio is driven by the pressure from the regulators. Further
examination is called for.
The cost to income measure of the profitability of financial institutions has a positive
coefficient, meaning that a higher cost to income ratio, i.e. lower profitability, translates to
higher CDS spreads as expected. However, as the coefficients in the regressions are not
significant and the null hypothesis cannot be rejected.
The leverage ratio has negative coefficients ranging between -4091 and -3926 for the 5
and 1-year CDS maturities and -2834 for the 10-year maturity. All of the coefficients are
significant with p values below 0.01. The signs of the coefficients are negative as expected, as
a higher leverage ratio, i.e. more equity financing, reduces the CDS spreads and credit risk of
financial institutions.
The natural logarithm of the size of the financial institution is negatively related to the
CDS spread, larger financial institutions have lower CDS spreads and lower probability of
default. All of the coefficients are significant with p values lower than 0.01. The results provide
evidence supporting the too big to fail doctrine, as it seems that investors in the CDS market

40
price in the possibility that larger financial institutions are bailed out by the government or
regulators in the face of potential default. However, no strong conclusions can be made as the
too big to fail doctrine is not in the main focus of this study.
The loan loss provisions to net loans ratio has a positive coefficient as expected, a higher
share of loan losses realized in the income statement translates to higher CDS spreads and credit
risk for the financial institution. The results are significant with p values lower than 0.01.
The share of interest expense to total liabilities has negative coefficients, indicating that
financial institutions with higher relative interest expense have counterintuitively lower credit
risk. The results are not strongly significant as the p values for the 5-year maturity are
significant only at the p value level of below 0.10, not significant for 1-year maturity and 0.05
significant in 10-year maturity. As in the case of the tier 1 ratio, the relationship can be
potentially explained by the financial crisis. During the sample period of 2007-2014, the mean
interest expense to loans ratio has decreased for the financial institutions in the sample and CDS
spreads have increased. The decrease in interest expense can be explained by the decreasing
market interest rates and access to cheap central bank financing by the financial institutions.
The share of liquid assets to total assets has a negative coefficient as expected. A higher
share of liquid assets reduces credit risk as liquid assets protect financial institutions from
negative shocks. However, the results are not significant and the null hypothesis cannot be
rejected.
Table III presents results using the quadric and linear variables of the net interest income
share and loan share ratios. The purpose is to examine if the relationship between credit risk
and functional focus is non-linear.
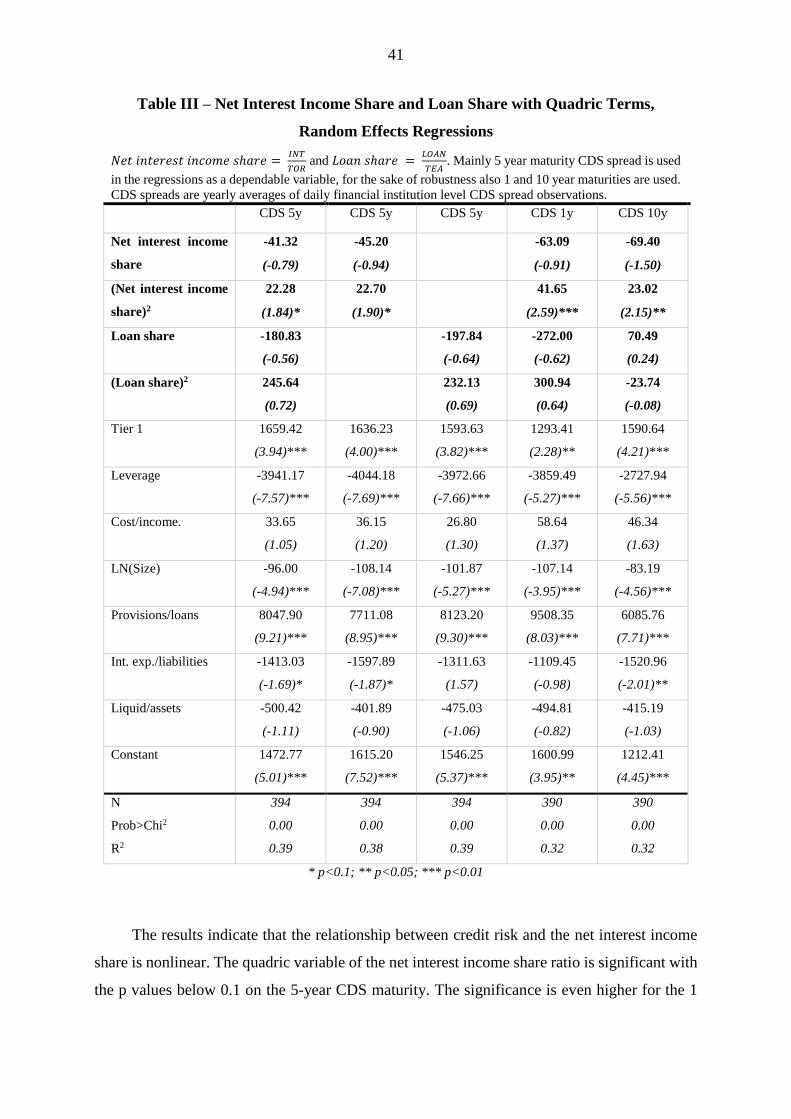
41
Table III – Net Interest Income Share and Loan Share with Quadric Terms,
Random Effects Regressions
𝑁𝑒𝑡 𝑖𝑛𝑡𝑒𝑟𝑒𝑠𝑡 𝑖𝑛𝑐𝑜𝑚𝑒 𝑠ℎ𝑎𝑟𝑒 = 𝐼𝑁𝑇
𝑇𝑂𝑅 and 𝐿𝑜𝑎𝑛 𝑠ℎ𝑎𝑟𝑒 =
𝐿𝑂𝐴𝑁
𝑇𝐸𝐴. Mainly 5 year maturity CDS spread is used
in the regressions as a dependable variable, for the sake of robustness also 1 and 10 year maturities are used.
CDS spreads are yearly averages of daily financial institution level CDS spread observations.
CDS 5y CDS 5y CDS 5y CDS 1y CDS 10y
Net interest income
share
-41.32 -45.20 -63.09 -69.40
(-0.79) (-0.94) (-0.91) (-1.50)
(Net interest income
share)2
22.28 22.70 41.65 23.02
(1.84)* (1.90)* (2.59)*** (2.15)**
Loan share -180.83 -197.84 -272.00 70.49
(-0.56) (-0.64) (-0.62) (0.24)
(Loan share)2 245.64 232.13 300.94 -23.74
(0.72) (0.69) (0.64) (-0.08)
Tier 1 1659.42 1636.23 1593.63 1293.41 1590.64
(3.94)*** (4.00)*** (3.82)*** (2.28)** (4.21)***
Leverage -3941.17 -4044.18 -3972.66 -3859.49 -2727.94
(-7.57)*** (-7.69)*** (-7.66)*** (-5.27)*** (-5.56)***
Cost/income. 33.65 36.15 26.80 58.64 46.34
(1.05) (1.20) (1.30) (1.37) (1.63)
LN(Size) -96.00 -108.14 -101.87 -107.14 -83.19
(-4.94)*** (-7.08)*** (-5.27)*** (-3.95)*** (-4.56)***
Provisions/loans 8047.90 7711.08 8123.20 9508.35 6085.76
(9.21)*** (8.95)*** (9.30)*** (8.03)*** (7.71)***
Int. exp./liabilities -1413.03 -1597.89 -1311.63 -1109.45 -1520.96
(-1.69)* (-1.87)* (1.57) (-0.98) (-2.01)**
Liquid/assets -500.42 -401.89 -475.03 -494.81 -415.19
(-1.11) (-0.90) (-1.06) (-0.82) (-1.03)
Constant 1472.77 1615.20 1546.25 1600.99 1212.41
(5.01)*** (7.52)*** (5.37)*** (3.95)** (4.45)***
N 394 394 394 390 390
Prob>Chi2 0.00 0.00 0.00 0.00 0.00
R2 0.39 0.38 0.39 0.32 0.32
* p<0.1; ** p<0.05; *** p<0.01
The results indicate that the relationship between credit risk and the net interest income
share is nonlinear. The quadric variable of the net interest income share ratio is significant with
the p values below 0.1 on the 5-year CDS maturity. The significance is even higher for the 1
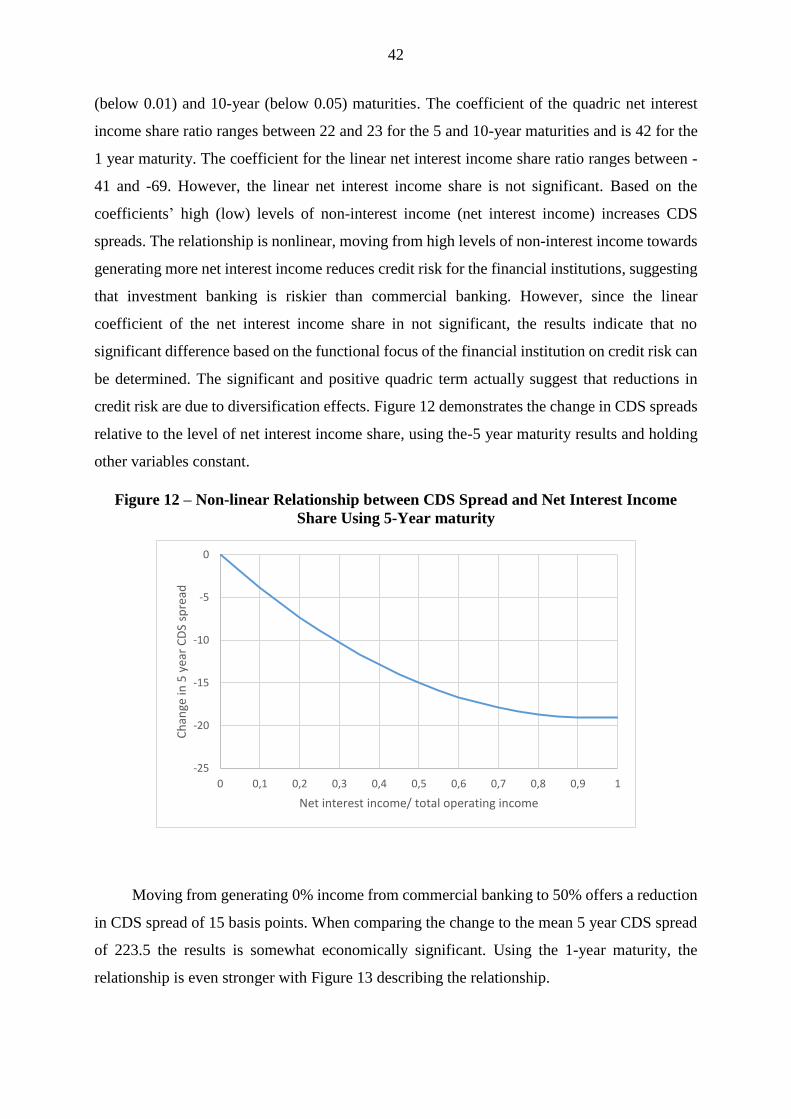
42
(below 0.01) and 10-year (below 0.05) maturities. The coefficient of the quadric net interest
income share ratio ranges between 22 and 23 for the 5 and 10-year maturities and is 42 for the
1 year maturity. The coefficient for the linear net interest income share ratio ranges between -
41 and -69. However, the linear net interest income share is not significant. Based on the
coefficients’ high (low) levels of non-interest income (net interest income) increases CDS
spreads. The relationship is nonlinear, moving from high levels of non-interest income towards
generating more net interest income reduces credit risk for the financial institutions, suggesting
that investment banking is riskier than commercial banking. However, since the linear
coefficient of the net interest income share in not significant, the results indicate that no
significant difference based on the functional focus of the financial institution on credit risk can
be determined. The significant and positive quadric term actually suggest that reductions in
credit risk are due to diversification effects. Figure 12 demonstrates the change in CDS spreads
relative to the level of net interest income share, using the-5 year maturity results and holding
other variables constant.
Figure 12 – Non-linear Relationship between CDS Spread and Net Interest Income
Share Using 5-Year maturity
Moving from generating 0% income from commercial banking to 50% offers a reduction
in CDS spread of 15 basis points. When comparing the change to the mean 5 year CDS spread
of 223.5 the results is somewhat economically significant. Using the 1-year maturity, the
relationship is even stronger with Figure 13 describing the relationship.
-25
-20
-15
-10
-5
0
0 0,1 0,2 0,3 0,4 0,5 0,6 0,7 0,8 0,9 1
Ch
ange
in 5
yea
r C
DS
spre
ad
Net interest income/ total operating income

43
Figure 13 – Non-linear Relationship between CDS Spread and Net Interest Income
Share Using 1-Year maturity
In the 1-year maturity moving from generating 0% income from commercial banking to
50% offers a reduction in CDS spread of 21 basis points. The spread continues to decrease until
75% of income is generated from commercial banking, after which spread starts to increase.
The increase in spread suggest that potential diversification benefits exist in the medium values
of net interest income to total operating income. The relationship further suggests that the
reductions in credit risk are driven by functional diversification not functional focus. Whether
diversification benefits exist is further examined later in this study.
Including the quadric variable of the loan share ratio does not improve the significance
of the measure, reinforcing the acceptance of the null hypothesis for the loan share.
To further examine the first research question, instead of using the financial institution
level CDS spreads as the dependable credit risk variable, the difference between the financial
institution level CDS spread and the banking industry CDS spread index is used. The difference
is used to neutralize the effect of changes in the level of credit risk in the banking industry
through time.
-25
-20
-15
-10
-5
0
0 0,1 0,2 0,3 0,4 0,5 0,6 0,7 0,8 0,9 1
Ch
ange
in 1
yea
r C
DS
spre
ad
Net interest income/ total operating income
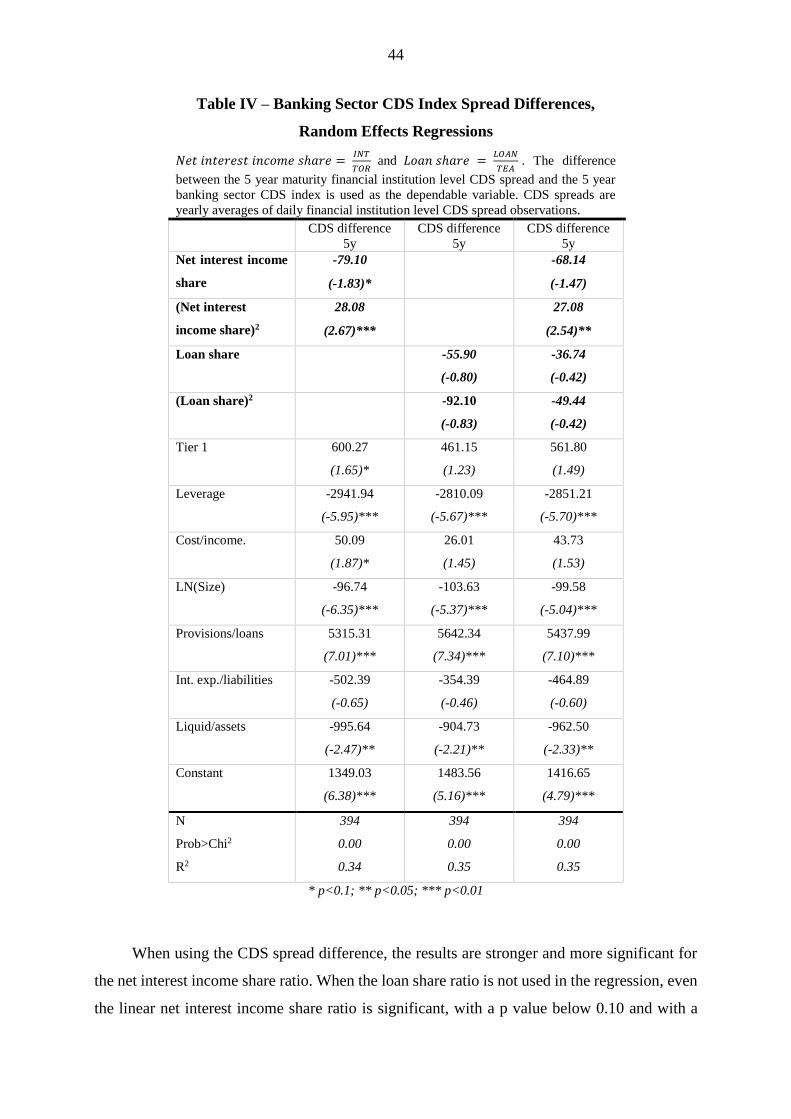
44
Table IV – Banking Sector CDS Index Spread Differences,
Random Effects Regressions
𝑁𝑒𝑡 𝑖𝑛𝑡𝑒𝑟𝑒𝑠𝑡 𝑖𝑛𝑐𝑜𝑚𝑒 𝑠ℎ𝑎𝑟𝑒 = 𝐼𝑁𝑇
𝑇𝑂𝑅 and 𝐿𝑜𝑎𝑛 𝑠ℎ𝑎𝑟𝑒 =
𝐿𝑂𝐴𝑁
𝑇𝐸𝐴. The difference
between the 5 year maturity financial institution level CDS spread and the 5 year
banking sector CDS index is used as the dependable variable. CDS spreads are
yearly averages of daily financial institution level CDS spread observations.
CDS difference
5y
CDS difference
5y
CDS difference
5y
Net interest income
share
-79.10 -68.14
(-1.83)* (-1.47)
(Net interest
income share)2
28.08 27.08
(2.67)*** (2.54)**
Loan share -55.90 -36.74
(-0.80) (-0.42)
(Loan share)2 -92.10 -49.44
(-0.83) (-0.42)
Tier 1 600.27 461.15 561.80
(1.65)* (1.23) (1.49)
Leverage -2941.94 -2810.09 -2851.21
(-5.95)*** (-5.67)*** (-5.70)***
Cost/income. 50.09 26.01 43.73
(1.87)* (1.45) (1.53)
LN(Size) -96.74 -103.63 -99.58
(-6.35)*** (-5.37)*** (-5.04)***
Provisions/loans 5315.31 5642.34 5437.99
(7.01)*** (7.34)*** (7.10)***
Int. exp./liabilities -502.39 -354.39 -464.89
(-0.65) (-0.46) (-0.60)
Liquid/assets -995.64 -904.73 -962.50
(-2.47)** (-2.21)** (-2.33)**
Constant 1349.03 1483.56 1416.65
(6.38)*** (5.16)*** (4.79)***
N 394 394 394
Prob>Chi2 0.00 0.00 0.00
R2 0.34 0.35 0.35
* p<0.1; ** p<0.05; *** p<0.01
When using the CDS spread difference, the results are stronger and more significant for
the net interest income share ratio. When the loan share ratio is not used in the regression, even
the linear net interest income share ratio is significant, with a p value below 0.10 and with a

45
coefficient of -79. Similarly the quadric net interest income share ratio is significant at below
0.01 level with a coefficient of 28. When the loan share ratio is added, the linear net interest
income share is no longer significant, the quadric term remains significant at 0.05 level. Figure
14 describes the relationship using the results without the loan share ratio, holding other
variables constant.
Figure 14 – Non-linear Relationship Between CDS Difference and Net Interest Income
Share
The relationship is still nonlinear, however less than in previous results due to the larger
linear coefficient. Moving from generating 0% income from commercial banking to 50% offers
a reduction in CDS spread of 32.5 basis points compared with the banking industry CDS index.
The coefficients suggest that financial institutions generating a larger share of net interest
income from commercial banking are less risky than those focusing on investment banking,
when comparing with the average credit risk in the banking industry. However since the
coefficient of the linear net interest income share is only moderately significant in one of the
regressions, the decrease in credit risk is more driven by functional diversification and no
conclusion on the impact of functional focus can be drawn.
When using the CDS difference as the dependable variable for credit risk, the impact of
control variables tier 1 and relative interest expense changes. As previously discussed, the
relationship between the bank level CDS spreads and the tier 1 or interest expense to liabilities
ratios was irrational, higher tier 1 (lower risk) and lower relative interest expense was associated
-60
-50
-40
-30
-20
-10
0
0 0,1 0,2 0,3 0,4 0,5 0,6 0,7 0,8 0,9 1
Ch
ange
in 5
yea
r C
DS
spre
ad r
elat
ive
to
the
CD
S in
dex
Net interest income/ total operating income

46
with higher financial institution level credit risk. It was previously speculated that the irrational
coefficients might result from the increased CDS spreads during the financial crisis and
regulatory measures in response to the crisis. When using the CDS spread difference, the impact
of both ratios is much lower and less significant. The coefficient of the tier 1 ratio is lower and
not significant in two of the regressions in Table IV, the coefficient remains positive. Similarly
the coefficient of the interest expense to liabilities ratio remains negative, however the
coefficient is much smaller and not significant in all three regressions in Table IV. Since the
impact of both ratios is diminished and the coefficients are mostly not significant, the results
hint that the irrational relationships with financial institution level CDS spreads were to some
extent resulting from the financial crisis. Using the CDS difference controls the results for the
impact of general increases in the CDS spreads in the banking sector. Thus, the effect of the
financial crisis is mitigated and the results better describe the bank level heterogeneity.
However, no final conclusion can be made on the impact of the two ratios and more research is
called for.
It cannot be concluded that financial institutions generating a larger share of income from
investment banking, are riskier in terms of credit risk than those focusing more on commercial
banking, because the linear term of the net interest income share is not significant throughout
the deployed regressions, with the exception of one regression. The first hypothesis of the first
research question can’t be accepted, the functional focus of financial institutions does not affect
the credit risk of financial institutions. The results seem to be more driven by functional
diversification since the quadric term of the net interest income share is significantly positive
in non-linear regressions.
5.2. Are More Diversified Financial Institutions Less Risky?
This section of this study concentrates on the main focus of this study, examining if
functional diversification impacts the credit risk of financial institutions. Table V presents the
results using income and asset diversification measurements as the explanatory variables.
Unlike the net interest income share and loan share ratios the income and asset diversification
measures do not differentiate between which, commercial banking or investment banking, the
financial institution focuses on. The income and asset diversification measures only measure
how functionally diversified the financial institution is. However, the net interest income share
and the loan share measures are used to control for the functional focus of the financial

47
institution, since the relationship between functional diversification and credit risk could be
affected by functional focus.
Table V – Income and Asset Diversification Measures, Random Effects Regressions
𝐼𝑁𝐶. 𝐷𝐼𝑉 = 1 − |𝐼𝑁𝑇−𝑁𝑂𝑁.𝐼𝑁𝑇
𝑇𝑂𝑅| and 𝐴𝑆. 𝐷𝐼𝑉 = 1 − |
𝐿𝑂𝐴𝑁−𝑂𝐸𝐴
𝑇𝐸𝐴|. Net interest income share and loan share
ratios are used as control variables. Mainly 5 year maturity CDS spread is used in the regressions as a
dependable variable, for the sake of robustness also 1 and 10 year maturities are used.
CDS 5y CDS 5 CDS 5y CDS 5y CDS 1y CDS 10y
Inc. div -52.78 -53.58 -55.36 -94.79 -55.03
(-2.59)*** (-2.63)*** (-2.66)*** (3.42)*** (-2.98)***
As. div -8.66 -25.77 -10.32 3.59 38.77
(-0.12) (-0.36) (-0.14) (0.03) (0.56)
Net interest income
share
-17.88 -12.45 -42.31
(-0.38) (-0.20) (-1.02)
Loan share 67.95 30.54 61.86
(0.58) (0.19) (0.58)
Tier 1 1587.90 1605.15 1577.66 1658.44 1270.65 1590.11
(3.93)*** (3.96)*** (3.88)*** (3.95)*** (2.25)** (4.23)***
Leverage -3794.14 -3884.15 -3974.13 -3863.20 -3628.36 -2528.64
(-7.30)*** (7.37)*** (-7.76)*** (-7.30)*** (-4.90)*** (-5.29)***
Cost/income. 23.19 23.61 26.65 33.30 54.34 44.56
(1.14) (1.17) (1.31) (1.04) (1.28) (1.57)
LN(Size) -102.78 -104.26 -106.70 -96.35 -105.20 -80.94
(-6.85)*** (-6.90)*** (-7.20)*** (-4.84)*** (-3.86)*** (-4.41)***
Provisions/loans 7748.43 7611.37 7996.00 7678.67 9069.59 5848.09
(8.96)*** (8.87)*** (9.22)*** (8.84)**** (7.72)*** (7.47)***
Int. exp./liabilities -1697.19 -1789.21 -1361.89 -1707.72 -1459.80 -1764.86
(-2.01)** (-2.11)** (-1.63) (-2.01)** (-1.28) (-2.32)**
Liquid/assets -461.38 -432.15 -437.22 -514.46 -546.51 -431.84
(-1.05) (-0.97) (-0.99) (1.13) (-0.90) (-1.06)
Constant 1571.94 1591.96 1598.98 1457.04 1565.67 1188.78
(7.66)*** (7.56)*** (7.85)*** (4.82)*** (3.79)*** (4.27)***
N 394 394 394 394 390 390
Prob>Chi2 0.00 0.00 0.00 0.00 0.00 0.00
R2 0.39 0.39 0.39 0.39 0.33 0.32
* p<0.1; ** p<0.05; *** p<0.01

48
The results for income diversification are promising. The coefficient for income
diversification is negative and significant with p values lower than 0.01, suggesting that more
income diversified financial institutions have lower CDS spreads and credit risk. The
coefficient ranges between -52 and -55 for the 5 and 10-year maturities, the coefficient for the
1-year maturity is -95 and even more significant. When controlling for the functional focus of
the financial institution, commercial banking or investment banking, the coefficient of income
diversification is not largely affected. Thus the results are driven by diversification and no
evidence can be obtained that functional focus impacts credit risk. Using the -55 coefficient of
5-year maturity, an increase of income diversification from the first quartile of 0.532 to the third
quartile of 0.891 decreases CDS spreads by 19.7 basis points. With the -95 coefficient of 1-year
maturity, the same effect corresponds to a decrease of 35.5 basis points. Compared with the
223.5 basis point mean of the 5-year CDS spreads and the 186.7 mean of the 1-year maturity,
both results are economically meaningful.
The results for the asset diversification measure are not significant across the different
regressions and the sign of the asset diversification changes for different maturities. Thus the
null hypothesis can’t be rejected and it is concluded that the asset diversification does not
impact the credit risk of financial institutions. The asset diversification is not a fully
representative measure for functional diversification, since especially investment banking is not
fully represented in the balance sheet. Services like investment banking do not require large
assets since income is mostly generated through fees from advisory and underwriting services.
Moreover, investment banking generates assets outside the balance sheet which are not captured
by the assets diversification measure. Income based diversification measures capture
diversification to a larger extent and the non-significant asset diversification results do not take
away or contradict the results gained by the income diversification.
Compared with the results using the net interest income and loan share ratios in tables II
and III, the control variables have the same signs and similar coefficients with mostly the same
significance.
In order to test if the relationship between the credit risk and functional diversification is
nonlinear, the linear and quadric income and asset diversification measures are used as
explanatory variables. Table VI presents results adding the quadric diversification variables and
the better fitting quadric control variable for the net interest income share.

49
Table VI – Income and Asset Diversification, Random Effects Regressions Using
Quadric Terms
Mainly 5 year maturity CDS spread is used in the regressions as a dependable variable, for the sale of
robustness also 1 and 10 year maturities are used.
CDS 5y CDS 5y CDS 5y CDS 5y CDS 1y CDS 10y
Inc. div -85.13 -85.21 2490.43 -105.55 -160.04 -98.76
(-2.40)** (-2.50)** (0.30) (-2.17)** (2.50)** (-2.30)**
(Inc. div)2 -7.90 -7.57 -1297.92
(-1.17) (-1.17) (-0.31)
As. div -64.30 -83.32 -86.50 20.98 56.23
(-0.24) (-0.30) (-0.32) (0.21) (0.82)
(As. div)2 61.44 73.13 73.71
(0.27) (0.32) (0.33)
Net interest income
share
-5139.17 53.23 58.68 11.02
(-0.31) (0.87) (0.71) (0.20)
(Net interest income
share)2
5156.55 -35.33 -42.67 -29.20
(0.31) (-1.25) (-1.14) (-1.17)
Tier 1 1514.42 1558.00 1494.42 1489.90 1177.61 1495.16
(3.73)*** (3.85)*** (3.66)*** (3.66)*** (2.16)** (4.10)***
Leverage -3616.01 -3725.59 -3579.93 -3563.33 -3428.29 -2475.77
(-6.91)*** (-7.07)*** (-6.86)*** (-6.87)*** (-4.67)*** (4.99)***
Cost/income. 24.19 24.10 15.25 15.07 40.89 32.45
(1.18) (1.19) (0.49) (0.48) (0.98) (1.17)
LN(Size) -101.83 -102.39 -100.02 -100.07 -105.95 -86.18
(-6.89)*** (-6.90)*** (-6.67)*** (-6.76)*** (-5.07)*** (-6.05)***
Provisions/loans 7796.48 7601.19 7863.42 7884.71 9029.89 5805.64
(8.79)*** (8.82)*** (8.83)*** (8.88)*** (7.67)*** (7.40)***
Int. exp./liabilities -1737.72 -1833.42 -1757.63 -1727.37 -1624.75 -1880.75
(-2.06)** (-2.16)** (-2.07)** (-2.04)** (-1.42) (-2.45)**
Liquid/assets -526.58 -491.38 -528.07 -534.77 -571.99 -415.61
(-1.20) (-1.11) (-1.20) (-1.22) (-0.97) (-1.05)
Constant 1593.07 1591.84 1575.65 1576.17 1613.30 1301.42
(7.15)*** (7.69)*** (7.06)*** (7.14)*** (5.68)*** (6.74)***
N 394 394 394 394 390 390
Prob>Chi2 0.00 0.00 0.00 0.00 0.00 0.00
R2 0.40 0.40 0.41 0.41 0.34 0.33
* p<0.1; ** p<0.05; *** p<0.01

50
When including the quadric term of the income diversification measure in the regressions,
the coefficient of the linear income diversification measure increases to -85. However, the
significance of the linear income diversification measure decreases, with the coefficient now
significant at the below 0.05 p value level. The coefficient of the quadric income diversification
measure is also negative, however not significant. Since the significance of the linear term
decreases and the quadric term is insignificant, it is concluded that the relationship between the
CDS spreads and the functional diversification is linear. The conclusion is further enhanced
when both the linear and quadric terms of the net interest income share are added to the
regressions, with the linear and quadric terms of the income diversification. Coefficients of the
income diversification increase dramatically and change to insignificant, since both the quadric
and linear net interest income shares capture parts of the diversification impact. Also since both
income diversification and net interest income share variables are derived from the same
income statement data, the results are subject to multicollinearity due to high correlation
between the variables. Multicollinearity can decrease the significance and cause erratic
coefficient estimates. Thus for the income diversification measure only the linear term is later
used. Furthermore, in regressions using the linear and quadric terms of the net interest income
share as control variables without the quadric income diversification term, the coefficient of the
linear income diversification measure increases.
The coefficient of income diversification for the 1 and 10-year maturities is -106 and -99
respectively, for the 1 year maturity the coefficient is -160. All of the coefficients are significant
at the below 0.05 levels. Functional diversification decreases the credit risk of financial
institutions, even when the nonlinear specification of the net interest income share is used as a
control variable to control for the functional focus of the financial institution. Using the -106
coefficient of the 5-year maturity, an increase of income diversification from the first quartile
of 0.532 to the third quartile of 0.891 decreases CDS spreads by 38.1 basis points. Using the 1-
year maturity coefficient of -160, the spread reduction of the same change in income
diversification amounts to -57.4 basis points.
The results further suggest that the significant quadric net interest income share results in
the first research question were driven by functional diversification, not functional focus. Since
in Table VI both the linear and quadric terms of the net interest income share are not significant
and income diversification captures the diversification impact.

51
To further test the impact of functional diversification, Table VII shows results using the
difference between the financial institution level CDS spreads and the banking industry CDS
index spread as the dependable variable for credit risk.
Table VII – Income and Asset Diversification, Random Effects Regressions using
banking Sector CDS Index Spread Differences
𝐼𝑁𝐶. 𝐷𝐼𝑉 = 1 − |𝐼𝑁𝑇−𝑁𝑂𝑁.𝐼𝑁𝑇
𝑇𝑂𝑅| and 𝐴𝑆. 𝐷𝐼𝑉 = 1 − |
𝐿𝑂𝐴𝑁−𝑂𝐸𝐴
𝑇𝐸𝐴|. The difference between the 5 year maturity
financial institution level CDS spread and the 5 year banking sector CDS index is used as the dependable
variable. CDS spreads are yearly averages of daily CDS spread observations.
CDS
difference 5y
CDS
difference 5y
CDS
difference 5y
CDS
difference 5y
CDS
difference 5y
Inc. div -59.64 -58.77 -93.38 -92.84
(-3.29)*** (-3.23)*** (2.18)** (-2.20)**
As. div -50.92 -30.03 -4.08
(-0.74) (-0.43) (-0.06)
Net interest income
share
-1.85 -3.49
(-0.03) (-0.06)
(Net interest income
share)2
-20.92 -20.42
(-0.85) (-0.84)
Tier 1 561.27 530.40 560.26 553.46 55.98
(1.55) (1.45) (1.55) (1.52) (1.53)
Leverage -2754.29 -2859.69 -2679.92 -2636.46 -2662.33
(-5.56)*** (-5.90)*** (-5.48)*** (-5.25)*** (-5.30)***
Cost/income. 22.69 27.01 22.13 34.83 35.48
(1.30) (1.51) (1.25) (1.25) (1.30)
LN(Size) -91.19 -92.95 -88.79 -90.57 -91.16
(-6.06)*** (-6.32)*** (-5.95)*** (-5.89)*** (-6.01)***
Provisions/loans 5266.10 5692.76 5414.60 5249.41 5211.04
(6.98)*** (-7.41)*** (7.11)*** (6.85)*** (6.88)***
Int. exp./liabilities -684.57 -331.82 -624.77 -682.92 -696.83
(-0.89) (-0.43) (-0.81) (-0.88) (-0.90)
Liquid/assets -1007.02 -965.15 -1010.55 -1045.39 -1045.08
(-2.51)** (-2.40)** (-2.53)** (-2.60)*** (-2.60)***
Constant 1296.26 1307.05 1276.88 1309.03 1315.82
(6.26)*** (6.53)*** (6.32)*** (6.33)*** (6.32)***
N 394 394 394 394 394
Prob>Chi2 0.00 0.00 0.00 0.00 0.00
R2 0.36 0.36 0.37 0.37 0.37
* p<0.1; ** p<0.05; *** p<0.01

52
When using the CDS difference as the dependable variable, the explanatory variable
income diversification remains negative and significant. The asset diversification remains
insignificant and the null hypothesis cannot be rejected for the asset diversification. The
coefficient of the income diversification measure ranges between -60 and -59 with p values
below 0.01, when the net interest income share is not used as a control variable. When the net
interest income share is added as a control variable, the coefficient of the income diversification
measure increases to -93, however the significance of the coefficient decreases with p values
below 0.05 level. Using the -60 coefficient, an increase of income diversification from the first
quartile of 0.532 to the third quartile of 0.891, decreases CDS spreads by 21.5 basis points. A
similar change in diversification decreases CDS spreads by 33.4 basis points when the -93
coefficient is used. Overall, better functionally diversified financial institutions have lower
credit risk when compared with the average credit risk in the banking industry.
The results in Table VII confirm that the irrational relationship between the credit risk of
financial institutions and the control variables tier 1 and interest expense share, could result
from the financial crisis. Again for both control variables the signs of the coefficients remain
irrational, high tier 1 (low risk) increases credit risk and high interest expense reduces credit
risk. However, the coefficients are insignificant when the CDS difference is used, suggesting
that both results are driven by the increased overall credit risk level in the banking industry
during the observation period.
In conclusion, income diversification is negatively associated with CDS spreads. The
results show that financial institutions with higher income diversification have lower CDS
spreads at the financial institution level and compared with the banking industry CDS index.
The relationship between income diversification and CDS spreads is linear. The negative
relationship between diversification and credit risk remains even when the functional focus of
the financial institution is controlled for. When using the 5 or 10-year CDS maturities the
coefficients of the income diversification measures are somewhat similar. With the 1-year
maturity the coefficient is almost twice as high, suggesting that diversification benefits decrease
the probability of default of financial institutions more in the short term.

53
6. Robustness
In order to confirm the gained results several robustness tests are conducted by controlling
for time effects, unobserved heterogeneity, endogeneity, heteroscedasticity and using
alternative functional diversification measures. Furthermore, results are confirmed by using
different data samples, excluding years affected by the financial crisis from the sample and
without US and Southern European financial institutions. The results remain robust, financial
institutions with higher functional diversification have lower credit risk and no difference in
credit risk is discovered based on functional focus.
6.1. Fixed Effects Panel Data Regressions
In order to control for unobserved financial institution level heterogeneity and potential
time effects, the financial institution and year effects has been fixed using dummy variables.
The fixed effect regressions should control for the possibility that the results are driven by the
financial crisis or other time effect or potential endogeneity and the unobserved characteristics
of financial institutions.
6.1.1. Is Investment Banking More Risky Than Commercial Banking

54
Table VIII – Net Interest Income Share and Loan Share, Financial Institution and
Time Fixed Effects Regressions
𝑁𝑒𝑡 𝑖𝑛𝑡𝑒𝑟𝑒𝑠𝑡 𝑖𝑛𝑐𝑜𝑚𝑒 𝑠ℎ𝑎𝑟𝑒 = 𝐼𝑁𝑇
𝑇𝑂𝑅 and 𝐿𝑜𝑎𝑛 𝑠ℎ𝑎𝑟𝑒 =
𝐿𝑂𝐴𝑁
𝑇𝐸𝐴. In the regressions the unobserved financial
institution level heterogeneity is controlled for by using dummy variables for the financial institutions. Also
time effect is controlled for by using year dummy variables. The results for the financial institution and
year dummy variables are omitted from the table. Mainly 5 year maturity CDS spread is used in the
regressions as a dependable variable, for the sake of robustness also 1 and 10 year maturities are used. CDS
spreads are yearly averages of daily CDS spread observations.
CDS 5y CDS 5y CDS 5y CDS 1y CDS 10y CDS diff.
Net interest income
share
-1.19 -87.45 -87.64 -95.62 -83.85 -98.55
(-0.03) (-1.95)* (-1.96)* (-1.41) (-2.17)** (-2.20)**
(Net interest income
share)2
41.67 41.47 61.92 35.33 43.46
(3.98)*** (3.98)*** (3.92)*** (3.91)*** (4.15)***
Loan share -33.14 -52.88 -243.13 -147.37 -154.70
(-0.15) (-0.08) (-0.73) (-0.77) (-0.70)
(Loan share)2 -26.31
(-0.05)
Tier 1 12.53 256.30 273.68 -112.98 -89.88 -123.16
(0.03) (0.55) (0.59) (-0.16) (-0.22) (-0.26)
Leverage -5482.17 -5613.28 -5635.70 -5623.27 -3426.56 -5081.18
(-7.59)*** (-7.89)*** (-8.02)*** (-4.87)*** (-5.19)*** (-7.18)***
Cost/income. 33.01 49.00 49.67 67.68 48.44 55.63
(1.18) (1.77)* (1.81)* (1.62) (2.03)** (2.01)**
LN(Size) -234.29 -245.69 -239.77 -351.27 -233.29 -214.94
(-4.37)*** (-4.66)*** (-4.81)*** (-4.42)*** (-5.14)*** (-4.09)***
Provisions/loans 5103.47 4859.61 4928.28 5538.59 4034.37 3551.16
(5.99)*** (5.73)*** (6.03)*** (4.30)*** (5.47)*** (4.25)***
Int. exp./liabilities 2234.93 2348.20 2371.41 4067.54 2561.15 1866.78
(1.96)* (2.10)** (2.13)** (2.37)** (2.61)*** (1.67)*
Liquid/assets -1579.83 -1598.35 -1654.84 -1604.76 -1336.15 -1821.76
(-3.23)*** (-3.33)*** (-3.64)*** (-2.21)** (-3.22)*** (-3.80)***
N 394 394 394 390 390 394
Prob>F 0.00 0.00 0.00 0.00 0.00 0.00
R2 0.76 0.77 0.77 0.66 0.76 0.71
* p<0.1; ** p<0.05; *** p<0.01
When using the fixed effects regressions the linear net interest income share increases in
significance and remains negative. The quadric term remains highly significant and positive.

55
Only when the 1-year CDS maturity is used, the linear net interest income share is insignificant.
Based on the results, financial institutions with a higher share of non-interest income have
higher credit risk when individual characteristics and time effects are controlled for. The
relationship is non-linear, reductions in credit risk are higher for financial institutions moving
from generating high amounts of non-interest income towards generating more net interest
income. The fixed effects regressions improve results for the first research question and suggest
that financial institutions focusing more on investment banking have higher credit risk.
However, the results are not particularly strong in significance and later in the robustness
section it is discovered that the functional diversification effect impacts the result to a higher
degree. Thus the first hypothesis of the first research question can’t be accepted and no
difference in credit risk is discovered between financial institutions focusing more on
commercial banking or investment banking.
The use of fixed effect regressions had an impact on the coefficients of the control
variables tier 1, cost to income, interest expense to liabilities and liquid assets to total assets. In
previous regressions, the coefficient of tier 1 was positive and significant, suggesting that higher
tier 1 ratio (lower risk) would result in higher credit risk. Also the coefficient of the interest
expense to total liabilities had an illogical relationship, higher relative interest expense
decreased CDS spreads. As previously hypothesized, the time effect caused by the financial
crisis could have impacted the results and created the illogical coefficients. When time effects
are controlled for, the coefficient for tier 1 is no longer significant and even negative when
using the 1 and 10-year maturity CDS spreads or the CDS difference. The coefficients for the
interest expense share are positive and significant, suggesting that higher relative interest
expense increases credit risk as expected when time effect is controlled for.
In previous regressions, the cost to income and liquid assets to total assets ratios were
insignificant in most of the regressions, some significance was gained when the CDS difference
was used as the dependable variable. However, when the fixed effects regressions are used,
both variables gained significance. Cost to income ratio is positive, suggesting that less
profitable financial institutions have higher credit risk, however the coefficient is only
significant in some of the regressions. The liquid assets to total assets ratio is highly significant
in all of the regressions at below 0.01 level. The coefficient is negative, suggesting that higher
relative amount of liquid assets reduces credit risk for financial institutions.

56
6.1.2. Are More Diversified Financial Institutions Less Risky?
When using the income and asset diversification measures in the financial institution and
year fixed effects regressions the results remain robust. The coefficients of the income
diversification remain negative and highly significant. Asset diversification on the other hand
remains insignificant. Even when controlling for the unobserved individual characteristics of
financial institutions and time effects, financial institutions with higher functional
diversification have lower credit risk. Table IX presents the results.

57
Table IX – Income and Asset Diversification, Financial Institution and Time Fixed
Effects Regressions
𝐼𝑁𝐶. 𝐷𝐼𝑉 = 1 − |𝐼𝑁𝑇−𝑁𝑂𝑁.𝐼𝑁𝑇
𝑇𝑂𝑅| and 𝐴𝑆. 𝐷𝐼𝑉 = 1 − |
𝐿𝑂𝐴𝑁−𝑂𝐸𝐴
𝑇𝐸𝐴|. In the regressions the unobserved financial
institution level heterogeneity is controlled for, by using dummy variables for the financial institutions. Also
time effect is controlled for by using year dummy variables. The results for the financial institution and year
dummy variables are omitted from the table. Mainly 5 year maturity CDS spread is used in the regressions
as a dependable variable, for the sake of robustness also 1 and 10 year maturities are used. CDS spreads are
yearly averages of daily CDS spread observations.
CDS 5y CDS 5y CDS 5y CDS 1y CDS 10y CDS diff.
Inc. div -73.56 -75.15 -30.81 -118.28 -65.90 -79.83
(-3.85)*** (-3.89)*** (-0.68) (-4.06)*** (-3.95)*** (-4.13)***
As. div 52.97 61.02 48.75 148.50 65.44 69.39
(0.46) (0.52) (0.42) (0.84) (0.65) (0.60)
Net interest income
share
-23.51 -66.56 -5.74 -31.54 -33.29
(-0.59) (1.19) (-0.10) (-0.92) (-0.84)
(Net interest income
share)2
26.57
(1.09)
Tier 1 302.60 336.17 313.35 72.23 10.27 -15.20
(0.65) (0.72) (0.67) (0.10) (0.03) (-0.03)
Leverage -5419.67 -5428.90 -5568.01 -5398.91 -3297.75 -4915.13
(-7.69)*** (-7.69)*** (-7.77)*** (-4.72)*** (-5.04)*** (-6.96)***
Cost/income. 25.02 37.75 46.09 53.81 40.16 44.88
(1.48) (1.38) (1.62) (1.30) (1.70)* (1.64)
LN(Size) -236.33 -236.15 -239.35 -329.35 -219.60 -199.92
(-4.72)*** (-4.72)*** (-4.77)*** (-4.36)*** (-5.07)*** (-3.99)***
Provisions/loans 4937.21 4872.09 4862.28 5565.17 4084.39 3598.30
(5.97)*** (5.84)*** (5.82)*** (4.33)*** (5.54)*** (4.31)***
Int. exp./liabilities 2352.12 2342.88 2373.93 4104.62 2577.56 1889.90
(2.11)** (2.10)** (2.13)** (2.40)** (2.63)*** (1.69)*
Liquid/assets -1616.33 1609.05 -1625.04 -1675l.68 -1392.71 -1876.26
(-3.52)*** (-3.50)*** (-3.53)*** (-2.41)** (-3.49)*** (-4.08)***
N 394 394 394 390 390 394
Prob>F 0.00 0.00 0.00 0.00 0.00 0.00
R2 0.77 0.77 0.77 0.66 0.76 0.71
* p<0.1; ** p<0.05; *** p<0.01
Controlling for financial institution fixed effects alleviates endogeneity concerns to some
extent. Financial institutions choose to functionally diversify based on unknown financial

58
institution level decision variables or characteristics. The same characteristics could drive the
CDS spreads determined by investors in the CDS market, instead of income diversification
itself as suggested by Laeven and Levine (2007). Without controlling for the unobserved
characteristics, biased results for the impact of income diversification could be obtained. By
controlling for the unobserved characteristics with financial institution dummies, the
endogeneity concerns should be alleviated. Also by controlling for financial institutions level
unobserved characteristics, the concern that the impact of income diversification is caused by
the difference in the prospects or abilities of financial institutions to expand into new activities
is alleviated.
The results further suggest that the significant linear and quadric net interest income share
results, in the fixed effects regressions for the first research question, were driven by functional
diversification, not functional focus. Since in table IX both the linear and quadric terms of the
net interest income share are not significant and income diversification captures the
diversification impact.
6.2. Heteroscedasticity
Heteroscedasticity (non-constant variance of the disturbance term) can cause bias in the
estimates for the standard errors of the regression coefficients, affecting the significance of the
coefficients. The actual coefficients are not biased by heteroscedasticity but since the
significance tests are, heteroscedasticity can lead to wrong interpretations of the coefficients
and the null hypothesis can be wrongly rejected. Using the modified Wald test for groupwise
heteroscedasticity for fixed effects regressions, heteroscedasticity between the financial
institution groups was found at below 0.00 F-test level. Heteroscedasticity was also detected
for the random effects regressions using the likelihood ratio test at below 0.00 F-test level. Since
heteroscedasticity is observed, the GLS heteroscedastic robust standard errors method is used.
The method adjusts the standard errors for all financial institution groups, to take
heteroscedasticity into account. GLS method adjusts the standard errors for heteroscedasticity
and should provide non-biased significance test results. However, only the use of linear
variables is allowed. The GLS method is only used for the income and asset diversification
regressions, since no significant results were obtained for the linear net interest income share
and loan share regressions.

59
Table X – GLS Heteroscedastic Robust Standard Error Regressions
Random Effects Financial Institution and Year Fixed
Effects
CDS 5y CDS 5y CDS diff. CDS 5y CDS 5y CDS diff.
Inc. div -52.79 -53.22 -60.34 -73.56 -75.15 -79.83
(-2.60)*** (-2.63)*** (-3.70)*** (-2.78)*** (-2.75)*** (-3.05)***
As. div -8.66 -3.94 -14.50 52.97 61.02 69.39
(-0.10) (-0.05) (-0.17) (0.49) (0.55) (0.62)
Net interest income
share
-8.63 -33.99 -23.51 -33.29
(-0.16) (-0.81) (-0.47) (-0.67)
Tier 1 1587.90 1594.19 576.99 302.60 336.17 -15.20
(1.98)** (2.00)** (0.82) (0.52) (0.59) (-0.03)
Leverage -3794.14 -3810.95 -2699.55 -5419.67 -5428.90 -4915.13
(-2.39)** (-2.38)** (-1.63) (-3.52)*** (-3.52)*** (-3.17)***
Cost/income. 23.19 27.69 39.95 25.02 37.75 44.88
(0.72) (0.62) (1.03) (1.05) (1.25) (1.47)
LN(Size) -102.78 -103.59 -91.35 -236.33 -236.15 -199.92
(-4.45)*** (-4.64)*** (-3.57)*** (-4.19)*** (-4.20)*** (-3.65)***
Provisions/loans 7748.43 7712.02 5330.43 4937.21 4872.09 3598.90
(4.34)*** (4.30)*** (3.51)*** (3.59)*** (3.61)*** (2.61)***
Int. exp./liabilities -1697.19 -1704.28 -601.74 2352.12 2342.88 1889.89
(-1.92)* (-1.91)* (-0.67) (1.94)* (1.93)* (1.65)*
Liquid/assets -461.38 -461.63 -1031.03 -1616.33 -1609.05 -1876.25
(-0.94) (-0.95) (-2.79)*** (-3.78)*** (-3.73)*** (-4.14)***
Constant 1571.94 1582.41 1308.33
(4.04)*** (4.13)*** (3.18)***
N 394 394 394 394 394 394
Prob>Chi2 / Prob>F 0.00 0.00 0.00 0.00 0.00 0.00
R2 0.39 0.39 0.36 0.77 0.77 0.71
* p<0.1; ** p<0.05; *** p<0.01
Based on the GLS results, the coefficients for the income diversification are negative and
highly significant with p values lower than 0.01 in all of the regressions using random and fixed
effects. The results indicate that previous results were not driven by heteroscedasticity, since
with robust standard errors the coefficients are highly significant. The results of the GLS
regressions further suggest that financial institutions with higher functional diversification have
lower CDS spreads.

60
6.3. Results Using the Herfindahl-Hirschman Diversification Measures
To further test the impact of functional diversification on the credit risk of financial
institutions, alternative income and asset diversification measures using the modified
Herfindahl-Hirschman index are employed. Table XI presents the results.
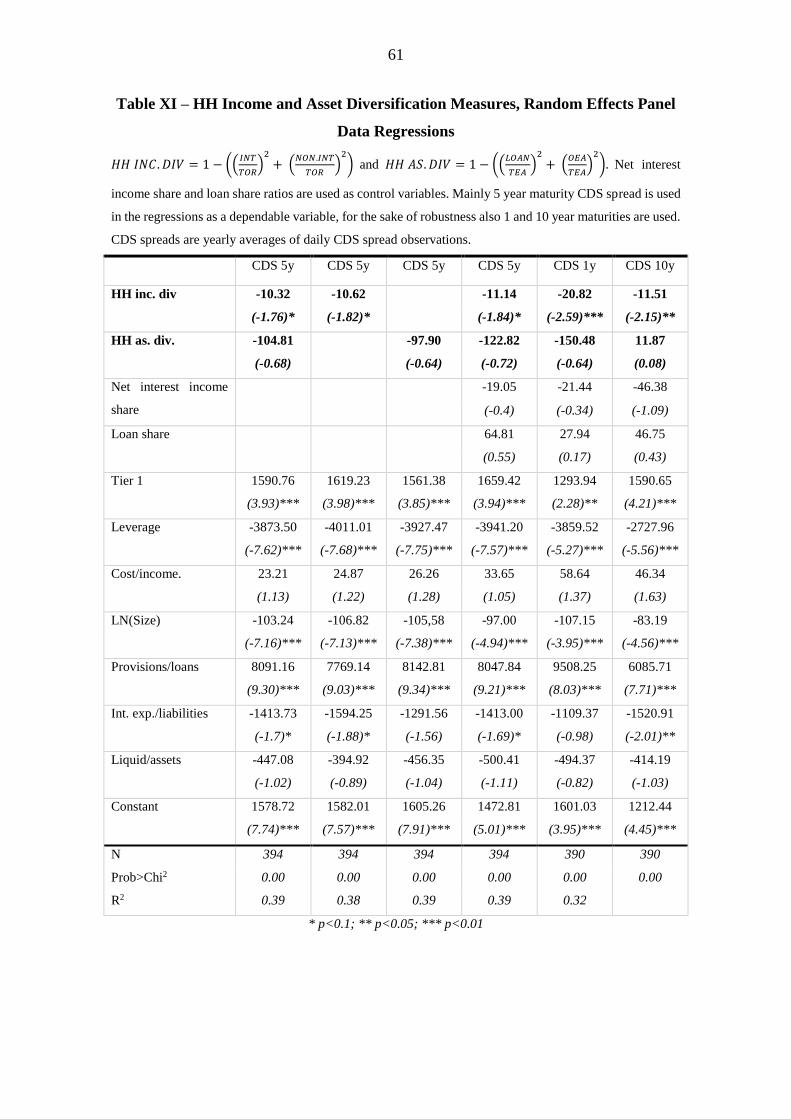
61
Table XI – HH Income and Asset Diversification Measures, Random Effects Panel
Data Regressions
𝐻𝐻 𝐼𝑁𝐶. 𝐷𝐼𝑉 = 1 − ((𝐼𝑁𝑇
𝑇𝑂𝑅)
2
+ (𝑁𝑂𝑁.𝐼𝑁𝑇
𝑇𝑂𝑅)
2
) and 𝐻𝐻 𝐴𝑆. 𝐷𝐼𝑉 = 1 − ((𝐿𝑂𝐴𝑁
𝑇𝐸𝐴)
2
+ (𝑂𝐸𝐴
𝑇𝐸𝐴)
2
). Net interest
income share and loan share ratios are used as control variables. Mainly 5 year maturity CDS spread is used
in the regressions as a dependable variable, for the sake of robustness also 1 and 10 year maturities are used.
CDS spreads are yearly averages of daily CDS spread observations.
CDS 5y CDS 5y CDS 5y CDS 5y CDS 1y CDS 10y
HH inc. div -10.32 -10.62 -11.14 -20.82 -11.51
(-1.76)* (-1.82)* (-1.84)* (-2.59)*** (-2.15)**
HH as. div. -104.81 -97.90 -122.82 -150.48 11.87
(-0.68) (-0.64) (-0.72) (-0.64) (0.08)
Net interest income
share
-19.05 -21.44 -46.38
(-0.4) (-0.34) (-1.09)
Loan share 64.81 27.94 46.75
(0.55) (0.17) (0.43)
Tier 1 1590.76 1619.23 1561.38 1659.42 1293.94 1590.65
(3.93)*** (3.98)*** (3.85)*** (3.94)*** (2.28)** (4.21)***
Leverage -3873.50 -4011.01 -3927.47 -3941.20 -3859.52 -2727.96
(-7.62)*** (-7.68)*** (-7.75)*** (-7.57)*** (-5.27)*** (-5.56)***
Cost/income. 23.21 24.87 26.26 33.65 58.64 46.34
(1.13) (1.22) (1.28) (1.05) (1.37) (1.63)
LN(Size) -103.24 -106.82 -105,58 -97.00 -107.15 -83.19
(-7.16)*** (-7.13)*** (-7.38)*** (-4.94)*** (-3.95)*** (-4.56)***
Provisions/loans 8091.16 7769.14 8142.81 8047.84 9508.25 6085.71
(9.30)*** (9.03)*** (9.34)*** (9.21)*** (8.03)*** (7.71)***
Int. exp./liabilities -1413.73 -1594.25 -1291.56 -1413.00 -1109.37 -1520.91
(-1.7)* (-1.88)* (-1.56) (-1.69)* (-0.98) (-2.01)**
Liquid/assets -447.08 -394.92 -456.35 -500.41 -494.37 -414.19
(-1.02) (-0.89) (-1.04) (-1.11) (-0.82) (-1.03)
Constant 1578.72 1582.01 1605.26 1472.81 1601.03 1212.44
(7.74)*** (7.57)*** (7.91)*** (5.01)*** (3.95)*** (4.45)***
N 394 394 394 394 390 390
Prob>Chi2 0.00 0.00 0.00 0.00 0.00 0.00
R2 0.39 0.38 0.39 0.39 0.32
* p<0.1; ** p<0.05; *** p<0.01

62
The HH income diversification results are in line with the previously obtained results
using the normal income diversification method. The coefficient of the HH income
diversification is negative, financial institutions with higher functional diversification have
lower CDS spreads and credit risk. However, the coefficients and the economic impacts are
lower for the HH income diversification. The coefficient ranges between -10 and -12 for the 5
and 10-year maturities and -21 for the 1-year maturity. Using the -11 coefficient of the 5-year
maturity, an increase of HH income diversification from the first quartile of 0.390 to the third
quartile of 0.494 decreases CDS spreads by only 1.0 basis points. Furthermore, the coefficients
of HH income diversification are less significant than the regular income diversification
measure, only less than 0.1 p values can be obtained for the 5-year maturity coefficients. For
the 1 and 10-year maturities the significance is higher at below 0.01 and 0.05 levels respectively.
However, interpreting the Herfindahl-Hirschman index is less straightforward than the regular
income diversification measure, as the HH index uses the sum of squares of the net interest
income to total operating income and non-interest income to total operating income ratios. Thus
for economic impact the regular income diversification measure is primarily used and the HH
income diversification acts as a way to confirm that functional diversification reduces credit
risk. As with previous results the HH asset diversification coefficient is insignificant and the
null hypothesis can’t be rejected.
In Table XIII it is tested if the relationship between CDS spreads and the HH income
diversification measures are non-linear. The quadric terms of the HH income measures are
added to the regressions in Table XII.
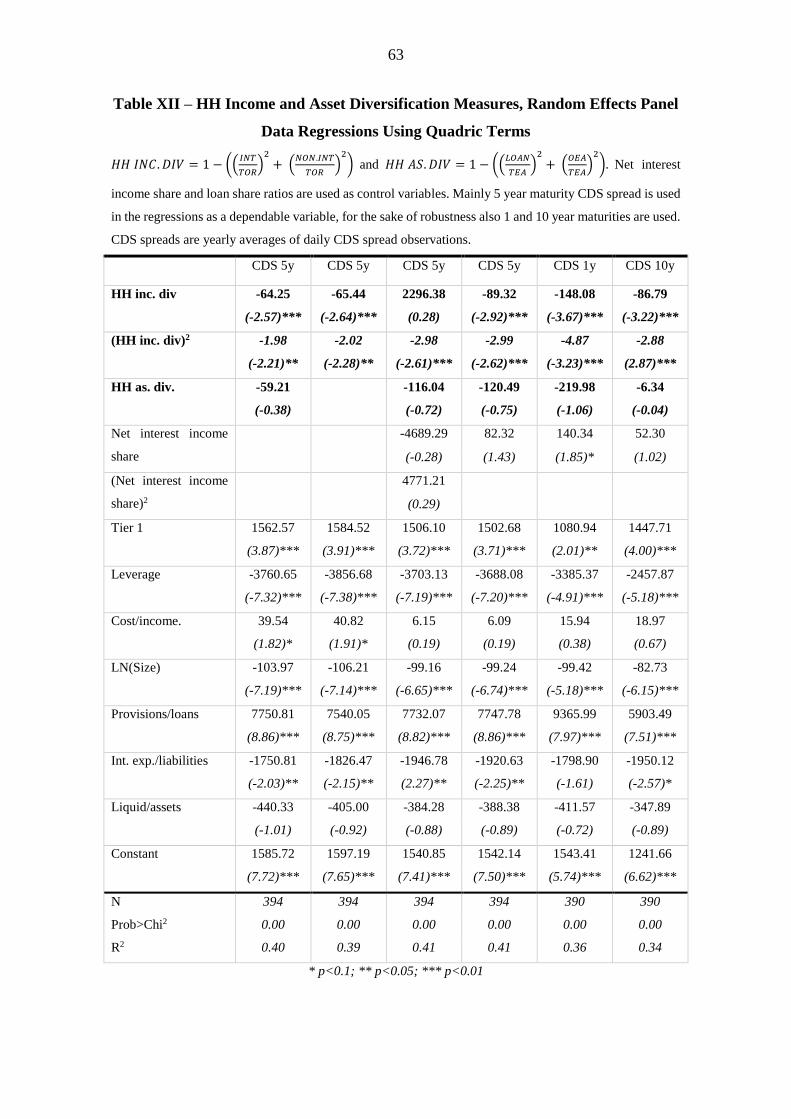
63
Table XII – HH Income and Asset Diversification Measures, Random Effects Panel
Data Regressions Using Quadric Terms
𝐻𝐻 𝐼𝑁𝐶. 𝐷𝐼𝑉 = 1 − ((𝐼𝑁𝑇
𝑇𝑂𝑅)
2
+ (𝑁𝑂𝑁.𝐼𝑁𝑇
𝑇𝑂𝑅)
2
) and 𝐻𝐻 𝐴𝑆. 𝐷𝐼𝑉 = 1 − ((𝐿𝑂𝐴𝑁
𝑇𝐸𝐴)
2
+ (𝑂𝐸𝐴
𝑇𝐸𝐴)
2
). Net interest
income share and loan share ratios are used as control variables. Mainly 5 year maturity CDS spread is used
in the regressions as a dependable variable, for the sake of robustness also 1 and 10 year maturities are used.
CDS spreads are yearly averages of daily CDS spread observations.
CDS 5y CDS 5y CDS 5y CDS 5y CDS 1y CDS 10y
HH inc. div -64.25 -65.44 2296.38 -89.32 -148.08 -86.79
(-2.57)*** (-2.64)*** (0.28) (-2.92)*** (-3.67)*** (-3.22)***
(HH inc. div)2 -1.98 -2.02 -2.98 -2.99 -4.87 -2.88
(-2.21)** (-2.28)** (-2.61)*** (-2.62)*** (-3.23)*** (2.87)***
HH as. div. -59.21 -116.04 -120.49 -219.98 -6.34
(-0.38) (-0.72) (-0.75) (-1.06) (-0.04)
Net interest income
share
-4689.29 82.32 140.34 52.30
(-0.28) (1.43) (1.85)* (1.02)
(Net interest income
share)2
4771.21
(0.29)
Tier 1 1562.57 1584.52 1506.10 1502.68 1080.94 1447.71
(3.87)*** (3.91)*** (3.72)*** (3.71)*** (2.01)** (4.00)***
Leverage -3760.65 -3856.68 -3703.13 -3688.08 -3385.37 -2457.87
(-7.32)*** (-7.38)*** (-7.19)*** (-7.20)*** (-4.91)*** (-5.18)***
Cost/income. 39.54 40.82 6.15 6.09 15.94 18.97
(1.82)* (1.91)* (0.19) (0.19) (0.38) (0.67)
LN(Size) -103.97 -106.21 -99.16 -99.24 -99.42 -82.73
(-7.19)*** (-7.14)*** (-6.65)*** (-6.74)*** (-5.18)*** (-6.15)***
Provisions/loans 7750.81 7540.05 7732.07 7747.78 9365.99 5903.49
(8.86)*** (8.75)*** (8.82)*** (8.86)*** (7.97)*** (7.51)***
Int. exp./liabilities -1750.81 -1826.47 -1946.78 -1920.63 -1798.90 -1950.12
(-2.03)** (-2.15)** (2.27)** (-2.25)** (-1.61) (-2.57)*
Liquid/assets -440.33 -405.00 -384.28 -388.38 -411.57 -347.89
(-1.01) (-0.92) (-0.88) (-0.89) (-0.72) (-0.89)
Constant 1585.72 1597.19 1540.85 1542.14 1543.41 1241.66
(7.72)*** (7.65)*** (7.41)*** (7.50)*** (5.74)*** (6.62)***
N 394 394 394 394 390 390
Prob>Chi2 0.00 0.00 0.00 0.00 0.00 0.00
R2 0.40 0.39 0.41 0.41 0.36 0.34
* p<0.1; ** p<0.05; *** p<0.01

64
Including the quadric term of the HH income diversification in the regressions increases
the significance of the linear HH income diversification. The linear term is now highly
significant with below 0.01 p values. Only when the quadric term of the net interest income
share is added as a control variable, the linear HH income diversification is insignificant
potentially due to multicollinearity. The quadric term of the HH income diversification is
significant below the 0.01 level only when the linear net interest income share is used as a
control variable. Also the economic impact increases as the coefficients are higher. When using
the coefficients of -89 for the linear HH income diversification and -3 for the quadric HH
income diversification, an increase of HH income diversification from the first quartile of 0.390
to the third quartile of 0.494 decreases CDS spreads by 9.5 basis points.
Table XIII describes the results using the difference between the financial institution level
CDS spreads and the banking sector CDS index as the dependable variable.

65
Table XIII – HH Income and Asset Diversification Measures, Random
Effects Panel Data Regressions Using Banking Sector CDS Index
Spread Differences
The difference between the 5 year maturity financial institution level CDS spread and the
5 year banking sector CDS index is used as the dependable variable. CDS spreads are
yearly averages of daily CDS spread observations.
CDS
difference 5y
CDS
difference 5y
CDS
difference 5y
CDS
difference 5y
HH inc. div -58.48 -12.18 3043.29 -65.71
(-2.69)*** (-2.36)** (0.41) (-2.46)**
(HH inc. div)2 -1.69 -1.98 -1.98
(-2.18)** (-1.99)** (-1.99)**
HH as. div. -128.67 -168.53 -139.55 -145.08
(-0.85) (-1.12) (-0.89) (-0.93)
Net interest income
share
-6193.95 24.13
(-0.42) (0.47)
(Net interest income
share)2
6217.83
(0.42)
Tier 1 541.66 562.20 527.04 524.75
(1.50) (1.55) (1.45) (1.44)
Leverage -2689.06 -2786.12 -2689 -2671.60
(-5.55)*** (-5.80)*** (-5.50) (-5.49)***
Cost/income. 36.50 22.60 26.40 26.45
(1.94)* (1.27) (0.92) (0.92)
LN(Size) -90.26 -89.66 -88.83 -88.93
(-6.24)*** (-6.24)*** (-5.95)*** (-6.03)***
Provisions/loans 5472.76 5754.72 5453.31 5472.06
(7.10)*** (7.50)*** (7.06)*** (7.09)***
Int. exp./liabilities -643.96 -420.16 -734.53 -707.80
(-0.84) (-0.55) (-0.94) (-0.91)
Liquid/assets -970.65 -964.22 -959.51 -956.38
(-2.44)** (-2.42)** (-2.40)** (-2.39)**
Constant 1304.96 1300.28 1291.44 1292.64
(6.45)*** (6.46)*** (6.26)*** (6.33)***
N 394 394 394 394
Prob>Chi2 0.00 0.00 0.00 0.00
R2 0.37 0.36 0.37 0.37
* p<0.1; ** p<0.05; *** p<0.01

66
The results are consistent with previous results, significance and the coefficients are
higher when the quadric HH income diversification measure is used with the linear term. The
HH income diversification results conclude that financial institutions with higher income
diversification have lower credit risk when comparing with the average credit risk in the
banking sector and that asset diversification does not impact credit risk.
6.4. Effect of the Financial Crisis
The time span of the data sample used in this study starts from 2007 and ends in 2014.
The outbreak of the financial crisis in 2008 could impact the results in this study, since
especially financial institutions were heavily affected by the crisis. When collecting the
financial statement data 2008 stood out, several financial institutions wrote off financial assets
and had negative net trading income. The conditions in 2008 also affected the functional
diversification and focus measures used in this study. As the trading income of the financial
institutions decreased and financial assets were written down in 2008, the net interest income
share of financial institution increased as income from investment banking decreased. Similarly
income diversification decreased as income from investment banking decreased relative to net
interest income. Thus in 2008 the functional focus and diversification measures used in this
study are not fully representative, as the financial crisis had a severe impact on them. Thus in
order to increase robustness the following regressions are developed in Table XIV without
using data from 2008.
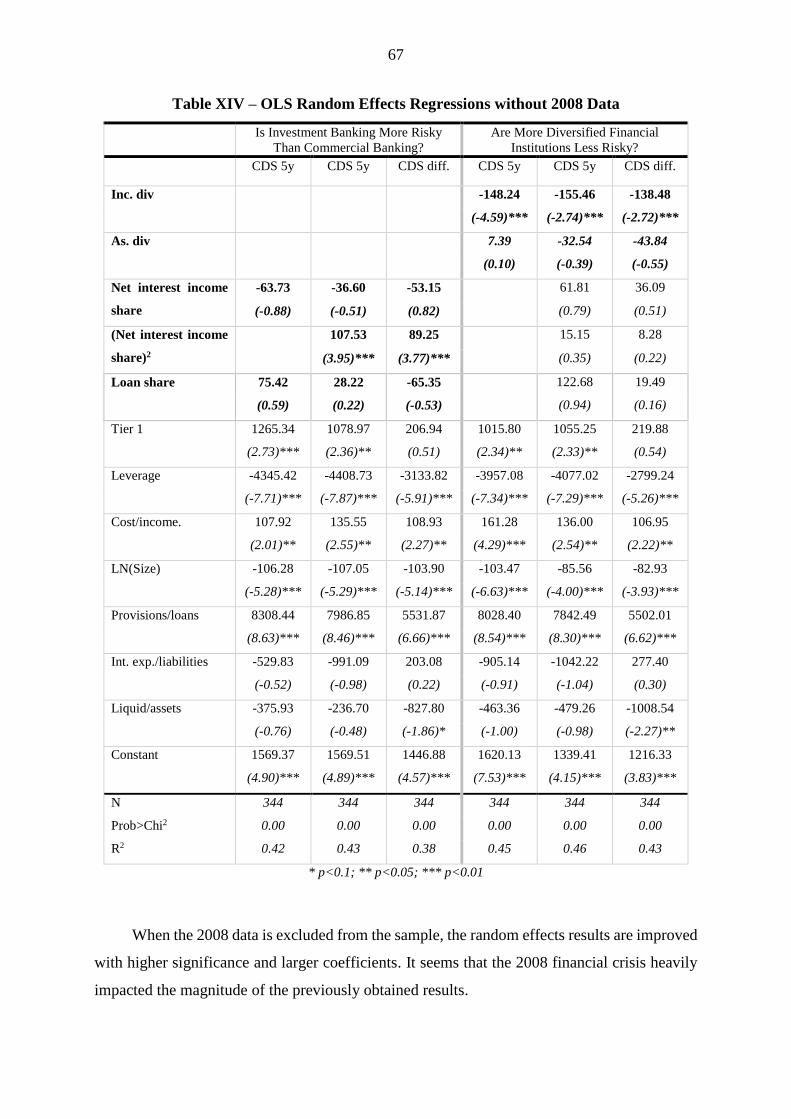
67
Table XIV – OLS Random Effects Regressions without 2008 Data
Is Investment Banking More Risky
Than Commercial Banking?
Are More Diversified Financial
Institutions Less Risky?
CDS 5y CDS 5y CDS diff. CDS 5y CDS 5y CDS diff.
Inc. div -148.24 -155.46 -138.48
(-4.59)*** (-2.74)*** (-2.72)***
As. div 7.39 -32.54 -43.84
(0.10) (-0.39) (-0.55)
Net interest income
share
-63.73 -36.60 -53.15 61.81 36.09
(-0.88) (-0.51) (0.82) (0.79) (0.51)
(Net interest income
share)2
107.53 89.25 15.15 8.28
(3.95)*** (3.77)*** (0.35) (0.22)
Loan share 75.42 28.22 -65.35 122.68 19.49
(0.59) (0.22) (-0.53) (0.94) (0.16)
Tier 1 1265.34 1078.97 206.94 1015.80 1055.25 219.88
(2.73)*** (2.36)** (0.51) (2.34)** (2.33)** (0.54)
Leverage -4345.42 -4408.73 -3133.82 -3957.08 -4077.02 -2799.24
(-7.71)*** (-7.87)*** (-5.91)*** (-7.34)*** (-7.29)*** (-5.26)***
Cost/income. 107.92 135.55 108.93 161.28 136.00 106.95
(2.01)** (2.55)** (2.27)** (4.29)*** (2.54)** (2.22)**
LN(Size) -106.28 -107.05 -103.90 -103.47 -85.56 -82.93
(-5.28)*** (-5.29)*** (-5.14)*** (-6.63)*** (-4.00)*** (-3.93)***
Provisions/loans 8308.44 7986.85 5531.87 8028.40 7842.49 5502.01
(8.63)*** (8.46)*** (6.66)*** (8.54)*** (8.30)*** (6.62)***
Int. exp./liabilities -529.83 -991.09 203.08 -905.14 -1042.22 277.40
(-0.52) (-0.98) (0.22) (-0.91) (-1.04) (0.30)
Liquid/assets -375.93 -236.70 -827.80 -463.36 -479.26 -1008.54
(-0.76) (-0.48) (-1.86)* (-1.00) (-0.98) (-2.27)**
Constant 1569.37 1569.51 1446.88 1620.13 1339.41 1216.33
(4.90)*** (4.89)*** (4.57)*** (7.53)*** (4.15)*** (3.83)***
N 344 344 344 344 344 344
Prob>Chi2 0.00 0.00 0.00 0.00 0.00 0.00
R2 0.42 0.43 0.38 0.45 0.46 0.43
* p<0.1; ** p<0.05; *** p<0.01
When the 2008 data is excluded from the sample, the random effects results are improved
with higher significance and larger coefficients. It seems that the 2008 financial crisis heavily
impacted the magnitude of the previously obtained results.

68
When measuring the functional focus of the financial institutions with the net interest
income share, the linear term is non-significant and the quadric term highly significant and
positive. The coefficient of the quadric term is much larger and has higher significance than in
random effects regressions with 2008 data. The results without 2008 data are confirmed with
fixed effects regressions that are presented in the appendix of this study at table XVII, where
coefficients are similar with similar significance as random effects without 2008 data. However,
since the linear term of the net interest income share is non-significant in all of the regressions
without 2008 data, no conclusions can be drawn that financial institutions focusing more in
investment banking would have higher credit risk. Moreover, the positive and significant
quadric net interest income share suggest that the functional diversification decreases credit risk,
not that the focus of the financial institution impacts credit risk. Furthermore, as seen in Table
XIV the significance of the quadric net interest income share disappears when income
diversification is added to the regressions, indicating that functional diversification drives CDS
spreads, not functional focus.
Since the coefficient of the income diversification is almost three times higher when the
2008 data is not used in the random effects regressions, the conclusion that functional
diversification decreases the credit risk of financial institutions is further enhanced. As the 2008
data is not fully representative, the reductions in credit risk due to functional diversification
seem to be much higher than previous results suggested. Using the -155 coefficient of the 5-
year maturity, an increase of income diversification from the first quartile of 0.532 to the third
quartile of 0.891 decreases CDS spreads by 56 basis points. When comparing with the mean 5-
year CDS spread of 236 basis points (without 2008 data) the decrease has a large economic
impact.
When fixed effects regressions with 2008 data were developed, the coefficients of income
diversification were larger than with random effects regressions with 2008 data. Fixed effects
regressions actually should not increase coefficients, leading to puzzling results. However,
since the fixed effect regressions controlled for time effects, they took into account the effect
of the non-representative 2008 data. Since the regressions without 2008 data have higher
coefficients, it actually was logical that fixed effects regressions with 2008 data had higher
coefficients than random effects regressions with 2008 data. Furthermore, in fixed effect
regressions without 2008 data (presented in the appendix of this study at table XVII) the
coefficients of income diversification are slightly smaller than in random effects regressions

69
without 2008 data (however still very significantly negative). Thus the 2008 data heavily
impacted the magnitude of the results.
During the years 2011, 2012 and 2013, the European debt crisis heavily influenced the
CDS spreads of the financial institutions. Several financial institutions in the sample had very
high CDS spreads during those years. To make sure that the European debt crisis has no effect
on the results, regressions are developed without the 2011-2013 data. Even with limiting the
amount of observations, the coefficients of income diversification remained negative and highly
significant, the coefficients have similar magnitude as in the main results. Regressions were
also developed without data from 2011-2013 and 2008, significantly negative coefficients were
gained with similar magnitude as in regressions in table XIV.
In the data sample of this study there is financial institutions from the US and Southern
European countries. Especially the Southern European financial institutions have been
negatively affected by the financial crisis and the Eurozone crisis during the time span of this
study, which could impact the results. Also the US financial institutions could have different
individual and institutional characteristics compared with European ones. To increase
robustness dummy variable regressions have been developed for US and Southern European14
financial institutions with and without 2008 data and regressions have been run without US and
Southern European financial institutions, with and without 2008 data. Exclusion of the US and
Southern European financial institutions and the dummy variables do not impact the results, the
relationship between functional diversification and CDS spreads remains significantly negative.
7. Limitations of the Study
The major limitations concerning this study mostly relate to the used data sample. The
number of financial institutions used in the study is limited by the availability and liquidity of
the CDS spreads of financial institutions. The sample consists of 51 financial institutions out of
which 9 are from the US and the rest from Europe, making the sample Europe focused. If more
liquid CDS spreads from the US could be obtained, further research could be conducted to
analyse if the impact of functional diversification differs between Europe and the US. Even
though only 51 financial institutions are in the sample, the used financial institutions are mostly
large financial institutions that are systemically important. The financial institutions mostly
14 Spanish, Portuguese, Italian and Greece financial institutions

70
facing pressure to separate investment banking and commercial banking are the global
systemically important financial institutions. Most of the US and European global systemically
important financial institutions are represented in the sample used in this study. Conventionally
using only 51 financial institutions in the sample makes generalizing results difficult. However,
since most of the US and European global systemically important financial institutions are
represented in the sample and they mostly face the regulatory pressure, the results of this study
can be generalized to them.
Also the time span of the sample could be longer. Similarly to the number of financial
institutions, the time span is restricted by the availability CDS spreads since the used CDS
spread data is only available from 2007 onwards. Furthermore, the financial crisis and the
European debt crisis took place during the time span of the sample. However, multiple methods
have been employed to control for their effects, including the use of CDS banking sector
indexes, dummy variables, time fixed effects and data without 2008 and 2011-2013
observations. The use of different robustness controls makes the results less dependent on the
crises. However, results can still be effected, since the crises had such a major effect on financial
institutions.
When measuring functional diversification only the mix between net interest income and
non-interest income is used. However, non-interest income consists of several different income
streams, like income from trading, advisory, underwriting and mutual fund services among
others. Most of the different income streams can be considered as sub-functions of investments
banking. By measuring the income mix in more detail with individual and more specific income
streams, better conclusions could be obtained. It could be determined if there are credit risk
differences between financial institutions that functionally diversify in different areas of
investment banking. Providing more conclusive evidence if there are some sub-functions of
investment banking that should not be combined with commercial banking.
Since in this study economies of scope are not directly measured, the negative relationship
between functional diversification and credit risk cannot be interpreted as proof that economies
of scope decrease credit risk in functionally diversified financial institutions. Furthermore, as
agency costs or conflicts of interest are not directly measured, the negative coefficient cannot
be interpreted that they do not exist, but so that the conflicts of interest and agency costs are not
large enough to produce a positive coefficient. The discovered negative coefficient points more
71
towards establishing that diversification decreases credit risk as according to the portfolio
theory (Markowitz 1952).
This study does not examine how functional diversification impacts the overall systemic
credit risk in the financial institutions market, but how individual financial institutions are
affected. Using models (Wagner 2010) show that functional diversification can decrease the
credit risk of individual financial institutions. However, functional diversification also makes
financial institutions more similar and more exposed to the same industry shocks, increasing
the possibility of systemic crisis in the financial institution market (Wagner 2010). More
research is called for, since it can be possible that functional diversification increases the
systemic credit risk in the financial institution market and the proposition of (Wagner 2010)
should be empirically tested.
8. Conclusion
The functional diversification of financial institutions has been much debated among
academics and no consensus has been achieved in determining whether financial institutions
should be allowed to combine investment and commercial banking. Current regulation in the
US and Europe allows financial institutions to combine the two functions. However, regulators
in Europe and the US are contemplating to once again separate commercial and investment
banking. The purpose of this study is to examine the relationship between functional
diversification and the credit risk of financial institutions from the regulative perspective. The
results of this study shed light on how the credit risk of financial institutions is affected by the
contemplated separation. Previous research on the effect of functional diversification on the
riskiness of financial institutions has used equity based risk measures. Measuring the impact of
functional diversification on credit risk is more appropriate to make regulatory conclusions,
since the objective of financial institution regulation is to mostly protect the overall economy
from the negative effects of financial institution defaults.
The aim of the first research question is to establish if financial institutions focusing more
on investment banking have higher credit risk than those focusing more on commercial banking.
When testing the relationship, the linear specification of the explanatory variable net interest
income share, measuring functional focus, did not receive significant coefficients, indicating
that there is no difference in credit risk between financial institutions focusing more on
investment banking or commercial banking. When the non-linear specification of the functional

72
focus measure is used, results gained significance. However, the non-linear specification does
not indicate difference in credit risk based on functional focus but potential credit risk decreases
from functional diversification. Thus based on the results no difference in credit risk between
financial institutions focusing more on investment banking or commercial banking was found.
The main focus of the study is to examine if financial institutions with higher functional
diversification have lower credit risk in the second research question. Based on the results,
functional diversification decreases the credit risk of financial institutions at the financial
institution credit risk level and compared with the average credit risk in the banking sector. The
results are consistent with the implementation of the portfolio theory (Markowitz 1952) to
functional diversification, which suggest that diversification should decrease credit risk. The
results are confirmed with multiple robustness tests by controlling for time effects, unobserved
heterogeneity, endogeneity, heteroscedasticity and using alternative functional diversification
measures. Robustness is also ensured by using different data samples, without data from years
affected by the financial crisis and without US and Southern European financial institutions.
Based on the results, if regulators implement new regulation separating investment
banking from commercial banking, the credit risk of currently functionally diversified financial
institutions would increase. The separation could have serious consequences, as the probability
of financial institution failures would increase. Especially since the regulators are mostly
interested in breaking up the largest and most complicated functionally diversified financial
institutions. As history suggests, large financial institutions failures can have grave
consequences on the economy. The current economic climate does not need a new Lehman
Brothers, regulators should aspire to decrease the credit risk of financial institutions, not
increase it.
73
9. References
Baele, L., De Jonghe, O. & Vander Vennet, R. 2007, "Does the stock market value bank
diversification?", Journal of Banking & Finance, vol. 31, no. 7, pp. 1999-2023.
Ber, H., Yafeh, Y. & Yosha, O. 2001, "Conflict of interest in universal banking: Bank lending,
stock underwriting, and fund management", Journal of Monetary Economics, vol. 47, no.
1, pp. 189-218.
Berger, A.N. & Humphrey, D.B. 1997, "Efficiency of financial institutions: International
survey and directions for future research", European Journal of Operational Research, vol.
98, no. 2, pp. 175-212.
Blanco, R., Brennan, S. & Marsh, I.W. 2005, "An empirical analysis of the dynamic relation
between investment-grade bonds and credit default swaps", Journal of Finance, vol. 60,
no. 5, pp. 2255-2281.
Chen, L., Lesmond, D. & Wei, J. 2007, "Corporate yield spreads and bond liquidity", Journal
of Finance, vol. 62, no. 1, pp. 119-149.
De Jonghe, O. 2010, "Back to the basics in banking? A micro-analysis of banking system
stability", Journal of Financial Intermediation, vol. 19, no. 3, pp. 387-417.
Demirgüç-Kunt, A. & Huizinga, H. 2010, "Bank activity and funding strategies: The impact on
risk and returns", Journal of Financial Economics, vol. 98, no. 3, pp. 626-650.
Demsetz, R.S. & trahan, P.E. 1997, "Diversification, Size, and Risk at Bank Holding
Companies", Journal of Money, Credit and Banking, vol. 29, no. 3, pp. 300.
DeYoung, R. & Roland, K.P. 2001, "Product Mix and Earnings Volatility at Commercial
Banks: Evidence from a Degree of Total Leverage Model", Journal of Financial
Intermediation, vol. 10, no. 1, pp. 54-84.
Diamond, D.W. 1991, "Monitoring and Reputation: The Choice between Bank Loans and
Directly Placed Debt", Journal of Political Economy, vol. 99, no. 4, pp. 689-721.
Drucker, S. & Puri, M. 2005, "On the Benefits of Concurrent Lending and Underwriting", The
Journal of Finance, vol. 60, no. 6, pp. 2763.
Elsas, R., Hackethal, A. & Holzhäuser, M. 2010, "The anatomy of bank diversification",
Journal of Banking & Finance, vol. 34, no. 6, pp. 1274-1287.
Fama, E.F. & French, K.R. 1993, "Common risk factors in the returns on stocks and bonds",
Journal of Financial Economics, vol. 33, no. 1, pp. 3-56.
Gande, A., Puri, M., Saunders, A. & Walter, I. 1997, "Bank underwriting of debt securities:
modern evidence", Review of Financial Studies, vol. 10, no. 4, pp. 1175.

74
Green, R.C. & Talmor, E. 1986, "Asset substitution and the agency costs of debt financing",
Journal of Banking & Finance, vol. 10, no. 3, pp. 391-399.
Jensen, M.C. & Meckling, W.H. 1976, "Theory of the firm: Managerial behavior, agency costs
and ownership structure", Journal of Financial Economics, vol. 3, no. 4, pp. 305-360.
Jorion, P. & Zhang, G. 2007, "Good and bad credit contagion: Evidence from credit default
swaps", Journal of Financial Economics, vol. 84, no. 3, pp. 860-883.
Kroszner, R.S. & Rajan, R.G. 1994, "Is the Glass-Steagall Act Justified? A Study of the U.S.
Experience with Universal Banking Before 1933", The American Economic Review, vol.
84, no. 4, pp. 810.
Laeven, L. & Levine, R. 2007, "Is there a diversification discount in financial conglomerates?",
Journal of Financial Economics, vol. 85, no. 2, pp. 331-367.
Longstaff, F.A., Mithal, S. & Neis, E. 2005, "Corporate Yield Spreads: Default Risk or
Liquidity? New Evidence from the Credit Default Swap Market.", The Journal of Finance,
vol. 60, no. 5, pp. 2213-2253.
Markowitz, H. 1952, "Portfolio Selection", The Journal of Finance, vol. 7, no. 1, pp. 77.
Mercieca, S., Schaeck, K. & Wolfe, S. 2007, "Small European banks: Benefits from
diversification?", Journal of Banking & Finance, vol. 31, no. 7, pp. 1975-1998.
O'Hara, M. & Shaw, W. 1990, "Deposit Insurance and Wealth Effects: The Value of Being
"Too Big to Fail"", The Journal of Finance, vol. 45, no. 5, pp. 1587-1600.
Puri, M. 1996, "Commercial banks in investment banking. Conflict of interest or certification
role?", Journal of Financial Economics, vol. 40, no. 3, pp. 373.
Rajan, R.G. 1992, "Insiders and Outsiders: The Choice between Informed and Arm's-Length
Debt", The Journal of Finance, vol. 47, no. 4, pp. 1367-1400.
Schenone, C. 2004, "The Effect of Banking Relationships on the Firm's IPO Underpricing",
The Journal of Finance, vol. 59, no. 6, pp. 2903-2958.
Schmid, M.M. & Walter, I. 2009, "Do financial conglomerates create or destroy economic
value?", Journal of Financial Intermediation, vol. 18, no. 2, pp. 193-216.
Stein, J.C. 2002, "Information production and capital allocation: Decentralized versus
hierarchical firms", vol. 57, no. 5, pp. 1891.
Stiroh, K.J. 2006, "A Portfolio View of Banking with Interest and Noninterest Activities",
Journal of Money, Credit, and Banking, vol. 38, no. 5, pp. 1351.
Stiroh, K.J. 2004, "Diversification in Banking: Is Noninterest Income the Answer?", Journal of
Money, Credit and Banking, vol. 36, no. 5, pp. 853.

75
Stiroh, K.J. & Rumble, A. 2006a, "The dark side of diversification: The case of US financial
holding companies", Journal of Banking & Finance, vol. 30, no. 8, pp. 2131-2161.
Sufi, A. 2004, Does joint production of lending and underwriting help or hurt firms? A fixed
effects approach, Mimeo. MIT, Department of Economics.
Vander Vennet, R. 2002, "Cost and Profit Efficiency of Financial Conglomerates and Universal
Banks in Europe", Journal of Money, Credit, and Banking, vol. 34, no. 1, pp. 254.
Vassalou, M. & Xing, Y. 2004, "Default Risk in Equity Returns", The Journal of Finance, vol.
59, no. 2, pp. 831-868.
Wagner, W. 2010, "Diversification at financial institutions and systemic crises", Journal of
Financial Intermediation, vol. 19, no. 3, pp. 373-386.

76
10. Appendix
Table XV – Net Interest Income Share and Loan Share, Financial Institution Fixed
Effects Regressions
𝑁𝑒𝑡 𝑖𝑛𝑡𝑒𝑟𝑒𝑠𝑡 𝑖𝑛𝑐𝑜𝑚𝑒 𝑠ℎ𝑎𝑟𝑒 = 𝐼𝑁𝑇
𝑇𝑂𝑅 and 𝐿𝑜𝑎𝑛 𝑠ℎ𝑎𝑟𝑒 =
𝐿𝑂𝐴𝑁
𝑇𝐸𝐴. In the regressions the unobserved financial
institution level heterogeneity is controlled for, by using dummy variables for the financial institutions. The
results for the financial institution dummy variables are omitted from the table. Mainly 5 year maturity CDS
spread is used in the regressions as a dependable variable, for the sake of robustness also 1 and 10 year
maturities are used. CDS spreads are yearly averages of daily CDS spread observations.
CDS 5y CDS 5y CDS 5y CDS 1y CDS 10y CDS diff.
Net interest income
share
-42.55 -130.20 -127.77 -134.27 -122.07 -121.96
(-0.88) (-2.38)** (-2.33)** (-1.78)* (-2.48)** (-2.60)***
(Net interest income
share)2
39.41 38.67 58.98 33.90 42.63
(3.10)*** (3.03)*** (3.35)*** (2.96)*** (3.90)***
Loan share -262.97 938.07 -479.32 -405.06 -446.09
(-1.00) (1.16) (1.33) (-1.72)* (-2.00)**
(Loan share)2 -1127.61
(-1.64)
Tier 1 2269.05 2409.79 2565.09 2082.47 2123.06 1046.63
(4.61)*** (4.92)*** (5.32)*** (3.04)*** (4.76)*** (2.49)**
Leverage -7575.71 -7781.86 -7799.69 -7298.82 -5169.88 -5528.42
(-9.11)*** (-9.46)*** (-9.55)*** (-5.92)*** (-6.43)*** (-7.84)
Cost/income. 52.75 70.87 70.69 85.19 68.60 61.60
(1.56) (2.10)** (2.10)** (1.83)* (2.26)** (2.13)**
LN(Size) -111.46 -121.25 -100.14 -211.93 -113.79 -182.84
(-1.78)* (-1.96)* (-1.71)* (-2.48)** (-2.04)** (-3.44)***
Provisions/loans 4820.77 4327.98 4706.60 5855.08 3758.04 2659.26
(5.06)*** (4.55)*** (5.03)*** (4.44)*** (4.37)*** (3.29)***
Int. exp./liabilities -2773.07 -2255.43 -2584.13 -1727.64 -2509.25 -1240.63
(-2.59)*** (-2.09)** (-2.45)** (-1.17) (-2.61)*** (-1.37)
Liquid/assets 219.32 -173.42 9.68 172.01 415.54 -833.64
(0.40) (0.32) (0.02) (0.23) (0.84) (-1.78)*
N 394 394 394 390 390 394
Prob>F 0.00 0.00 0.00 0.00 0.00 0.00
R2 0.64 0.65 0.65 0.57 0.59 0.68
* p<0.1; ** p<0.05; *** p<0.01
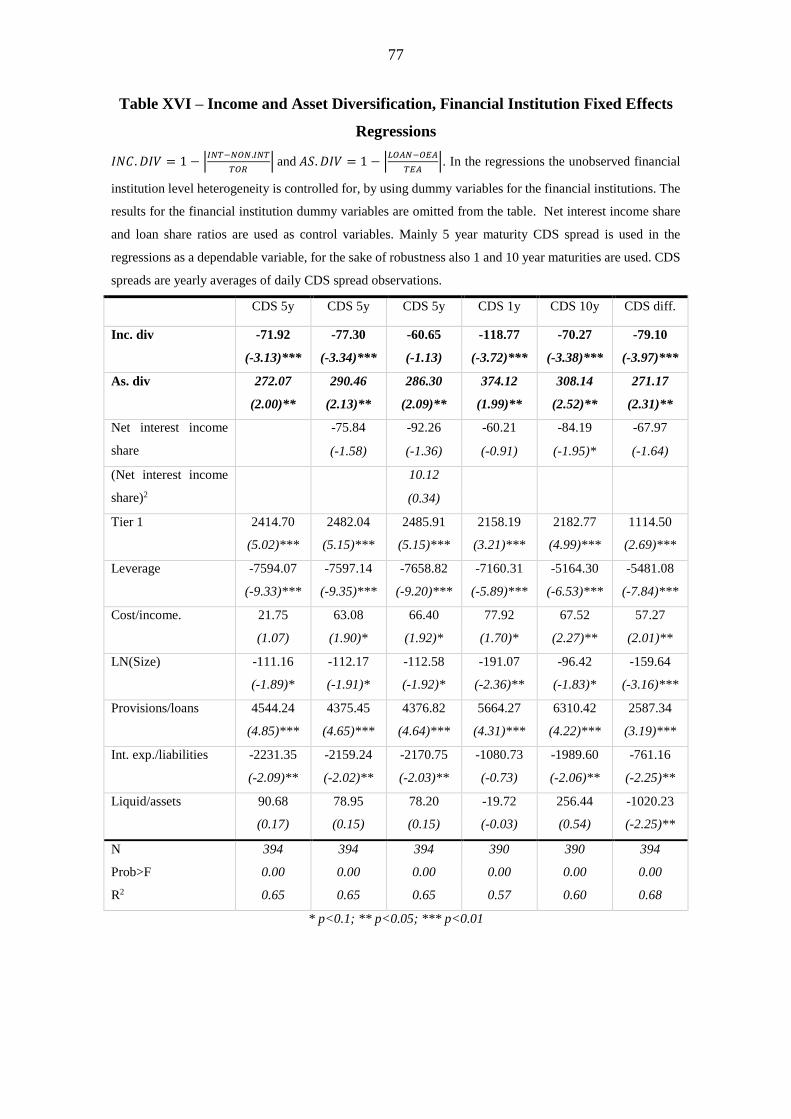
77
Table XVI – Income and Asset Diversification, Financial Institution Fixed Effects
Regressions
𝐼𝑁𝐶. 𝐷𝐼𝑉 = 1 − |𝐼𝑁𝑇−𝑁𝑂𝑁.𝐼𝑁𝑇
𝑇𝑂𝑅| and 𝐴𝑆. 𝐷𝐼𝑉 = 1 − |
𝐿𝑂𝐴𝑁−𝑂𝐸𝐴
𝑇𝐸𝐴|. In the regressions the unobserved financial
institution level heterogeneity is controlled for, by using dummy variables for the financial institutions. The
results for the financial institution dummy variables are omitted from the table. Net interest income share
and loan share ratios are used as control variables. Mainly 5 year maturity CDS spread is used in the
regressions as a dependable variable, for the sake of robustness also 1 and 10 year maturities are used. CDS
spreads are yearly averages of daily CDS spread observations.
CDS 5y CDS 5y CDS 5y CDS 1y CDS 10y CDS diff.
Inc. div -71.92 -77.30 -60.65 -118.77 -70.27 -79.10
(-3.13)*** (-3.34)*** (-1.13) (-3.72)*** (-3.38)*** (-3.97)***
As. div 272.07 290.46 286.30 374.12 308.14 271.17
(2.00)** (2.13)** (2.09)** (1.99)** (2.52)** (2.31)**
Net interest income
share
-75.84 -92.26 -60.21 -84.19 -67.97
(-1.58) (-1.36) (-0.91) (-1.95)* (-1.64)
(Net interest income
share)2
10.12
(0.34)
Tier 1 2414.70 2482.04 2485.91 2158.19 2182.77 1114.50
(5.02)*** (5.15)*** (5.15)*** (3.21)*** (4.99)*** (2.69)***
Leverage -7594.07 -7597.14 -7658.82 -7160.31 -5164.30 -5481.08
(-9.33)*** (-9.35)*** (-9.20)*** (-5.89)*** (-6.53)*** (-7.84)***
Cost/income. 21.75 63.08 66.40 77.92 67.52 57.27
(1.07) (1.90)* (1.92)* (1.70)* (2.27)** (2.01)**
LN(Size) -111.16 -112.17 -112.58 -191.07 -96.42 -159.64
(-1.89)* (-1.91)* (-1.92)* (-2.36)** (-1.83)* (-3.16)***
Provisions/loans 4544.24 4375.45 4376.82 5664.27 6310.42 2587.34
(4.85)*** (4.65)*** (4.64)*** (4.31)*** (4.22)*** (3.19)***
Int. exp./liabilities -2231.35 -2159.24 -2170.75 -1080.73 -1989.60 -761.16
(-2.09)** (-2.02)** (-2.03)** (-0.73) (-2.06)** (-2.25)**
Liquid/assets 90.68 78.95 78.20 -19.72 256.44 -1020.23
(0.17) (0.15) (0.15) (-0.03) (0.54) (-2.25)**
N 394 394 394 390 390 394
Prob>F 0.00 0.00 0.00 0.00 0.00 0.00
R2 0.65 0.65 0.65 0.57 0.60 0.68
* p<0.1; ** p<0.05; *** p<0.01
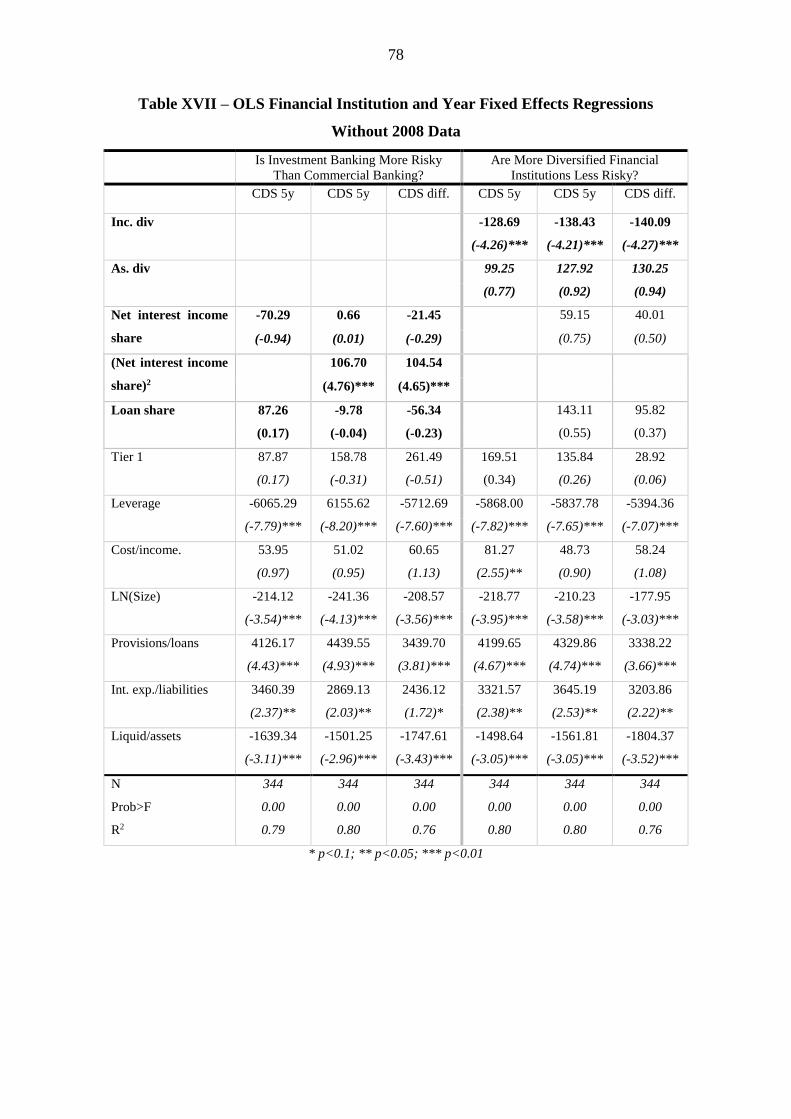
78
Table XVII – OLS Financial Institution and Year Fixed Effects Regressions
Without 2008 Data
Is Investment Banking More Risky
Than Commercial Banking?
Are More Diversified Financial
Institutions Less Risky?
CDS 5y CDS 5y CDS diff. CDS 5y CDS 5y CDS diff.
Inc. div -128.69 -138.43 -140.09
(-4.26)*** (-4.21)*** (-4.27)***
As. div 99.25 127.92 130.25
(0.77) (0.92) (0.94)
Net interest income
share
-70.29 0.66 -21.45 59.15 40.01
(-0.94) (0.01) (-0.29) (0.75) (0.50)
(Net interest income
share)2
106.70 104.54
(4.76)*** (4.65)***
Loan share 87.26 -9.78 -56.34 143.11 95.82
(0.17) (-0.04) (-0.23) (0.55) (0.37)
Tier 1 87.87 158.78 261.49 169.51 135.84 28.92
(0.17) (-0.31) (-0.51) (0.34) (0.26) (0.06)
Leverage -6065.29 6155.62 -5712.69 -5868.00 -5837.78 -5394.36
(-7.79)*** (-8.20)*** (-7.60)*** (-7.82)*** (-7.65)*** (-7.07)***
Cost/income. 53.95 51.02 60.65 81.27 48.73 58.24
(0.97) (0.95) (1.13) (2.55)** (0.90) (1.08)
LN(Size) -214.12 -241.36 -208.57 -218.77 -210.23 -177.95
(-3.54)*** (-4.13)*** (-3.56)*** (-3.95)*** (-3.58)*** (-3.03)***
Provisions/loans 4126.17 4439.55 3439.70 4199.65 4329.86 3338.22
(4.43)*** (4.93)*** (3.81)*** (4.67)*** (4.74)*** (3.66)***
Int. exp./liabilities 3460.39 2869.13 2436.12 3321.57 3645.19 3203.86
(2.37)** (2.03)** (1.72)* (2.38)** (2.53)** (2.22)**
Liquid/assets -1639.34 -1501.25 -1747.61 -1498.64 -1561.81 -1804.37
(-3.11)*** (-2.96)*** (-3.43)*** (-3.05)*** (-3.05)*** (-3.52)***
N 344 344 344 344 344 344
Prob>F 0.00 0.00 0.00 0.00 0.00 0.00
R2 0.79 0.80 0.76 0.80 0.80 0.76
* p<0.1; ** p<0.05; *** p<0.01