the effect of ovine and bovine to texture of iranian cheese
TRANSCRIPT

ORIGINALRESEARCH The effect of ovine and bovine milk on the textural
properties of Lighvan cheese during ripening
MEHRNAZ AMINIFAR,1 MANOUCHEHR HAMEDI,2 ZAHRA EMAM-DJOMEH2* and ALI MEHDINIA3
1Faculty of Food Industry and Agriculture, Department of Food Science & Technology, Standard Research Institute(SRI), PO Box 31745-139, Karaj, Iran, 2Transfer Phenomena Laboratory, Department of Food Science, Technologyand Engineering, Faculty of Agricultural Engineering and Technology, Agricultural Campus, University of Tehran,Karaj, 31587-11167, Iran, and 3Department of Marine Living Resources, Iranian National Institute forOceanography, Tehran, 14155-4781, Iran
The effect of milk origin on the physicochemical characteristics, microstructure and texture of Lighvancheese was investigated over a 90-day ripening period. Besides fat, other physicochemical propertiesof Lighvan cheese were affected by milk type. The moisture content of Lighvan cheese decreasedwhen half or all the ovine milk was substituted with bovine milk. The Lighvan cheese’s microstruc-tural properties and porosity were affected by type of milk and ripening time. Compaction of cheesesmanufactured from ovine and mixed ovine and bovine milk is similar, and more than that of bovineLighvan cheese. Ovine Lighvan cheese is harder and less brittle than bovine and mixed bovine andovine.
Keywords Lighvan cheese, Cheese microstructure, Hardness, Brittleness, Milk origin.
INTRODUCTION
Lighvan cheese, one of the most popular Ira-nian traditional cheeses, is a starter-free cheesefrom the Azerbaijan region, in the north-westof Iran, and manufactured from raw ewe’smilk. It ripens in 10 to 12% salt brine for 3 or4 months at an average temperature of10 ± 2 °C. In spite of the increasing popularityof Lighvan cheese, there are few studies on itschemical composition and microbial communi-ties (Abdi et al. 2006; Kafili et al. 2009;Aminifar et al. 2010).Lighvan cheese is traditionally produced from
ovine milk. Recently, Iranian researchers haveendeavoured to make it from bovine milk due tothe limitations of the seasonal production ofovine milk and short lactation period of smallruminants in Iran. Currently, some cheese tradi-tionally produced from ovine milk is industriallymanufactured using bovine milk; examplesinclude Urfa in Turkey (Atasoy and Turkoglu2008) and Belir Sir U Kriskama in the countriesof former Yugoslavia (Anifantakis and Moatsou2006).
Texture is one of the most important cheesecharacteristics for consumer acceptability. It isgreatly affected by factors such as milk type,processing technology, operation temperatureand ripening time (Pappas et al. 1996; Tsigkroset al. 2003). The texture of cheese made withbovine milk is significantly different from thatof ewe’s and goat’s milk cheese. Differenceshave been noted between industrial Halloumicheese (which has bovine milk as the majorconstituent) and the traditional product madewith mixture of sheep’s and goat’s milk (Papad-emas and Robinson 2000). Cheese ripening is acomplex process, consisting of a series of bio-chemical reactions (Singh et al. 2003) that con-vert rubbery bland curd to a mature cheese witha desirable texture (Fox et al. 1990). The textureof traditional Lighvan cheese changes signifi-cantly during ripening (Aminifar et al. 2010).The texture of cheese can be evaluated by
studying its mechanical properties using uniaxialforce compression (Hort et al. 1997; Awad2006). Moreover, studying the microscopicstructure of cheese provides beneficial informa-tion about its texture (Mckenna 2003). In the
*Author forcorrespondence. E-mail:[email protected]
© 2012 Society ofDairy Technology
Vol 66, No 1 February 2013 International Journal of Dairy Technology 45
doi: 10.1111/1471-0307.12009

present study, physicochemical, textural and microstructuralproperties of Lighvan cheese made with bovine milk and amixture of bovine and ovine milk were compared with thoseof traditional cheese made with ovine milk.
MATERIALS AND METHODS
Cheese making and samplingLighvan cheeses were prepared from raw bovine milk(3.6 ± 0.7% fat, 12.6 ± 1.1% total solids, 3.2 ± 0.3% pro-tein) and a 1:1 mixture of raw ovine milk (7.9 ± 0.8% fat,19.7 ± 0.9% total solids, 6.2 ± 0.5% protein) and bovinemilk (1:1 mixed milk composition: 5.8 ± 0.4% fat;16.2 ± 0.1% total solids and 4.7 ± 0.2% protein) accordingto a method previously described by Kafili et al. (2009).Production of cheese consisted of several steps:1 Coagulation of milk at 28–32 °C (depending on theseason) by adding lamb rennet.
2 Cutting the coagulum into walnut-sized pieces andtransferring them to rectangular cotton bags for wheydrainage.
3 Compressing the cotton bags with a four-kilogram massfor 2–4 h (depending on season) for better water drain-age.
4 Cutting the curd mass into 25 9 25 9 25 cm cubes andplacing the cubes in a 22% brine stream for 6 h.
5 Transferring the curd cubes to a basin, sprinklingsodium chloride crystals on their surfaces and storing for3–5 days. In this stage, the cubes were turned upsidedown between nine and 15 times for better wheyremoval.
6 Keeping the cubes in 12% salt brine for 3 months at anaverage temperature of 10 ± 2 °C.The fat content of prepared Lighvan cheese produced from
ovine, bovine milk and mixed milks were 6.5 ± 0.3 and10.9 ± 0.5%, respectively. The fat content of ovine Lighvancheese determined in a previous study (Aminifar et al. 2010)was 15.2 ± 0.31. Ten samples (25 9 25 9 25cm cubes)were collected on days 1, 30, 60 and 90 and analysed intriplicate.
Physicochemical analysisThe cheese samples were analysed for moisture contentaccording to the standard (4A) IDF (1982). Their salt con-tent was measured by Kirk and Sawyer’s method (1991).The pH of cheese samples was determined using a Knick766 calimatic pH-metre (Niels, Bohrweg, Utrecht, Nether-lands). Total nitrogen was determined according to theKjeldahl method (IDF 1993).Kuchroo and Fox’s method (1982) was used to determine
water-soluble nitrogen (WSN) as a proteolysis indicator.According to this method, 20 g cheese were homogenisedwith 40 g water in a stomacher for 10 min at 20 °C. Thesuspension was heated to 40 °C and held there for 1 h, then
centrifuged at 3000 9 g for 30 min. The supernatant wasthen filtered through glass wool and the WSN was measuredusing the Kjeldahl method (IDF 1993). All physicochemicalproperties (moisture content, salt, salt-in-moisture, totalnitrogen in dry matter (TN/DM), WSN in total nitrogen(WSN/TN), pH and acidity) were measured in triplicate,and SAS statistical software (version 8.2, SAS Institute Inc.,Cary, NC, USA) was applied for the statistical analysis ofthe experimental data. Multifactor analysis of variance (ANO-VA) with the least significant difference (LSD) test(P < 0.05) was used to evaluate the effect of time and typeof milk on the physicochemical characteristics of cheesesamples. Microsoft Excel 2007 was used for table drawing.
MicrostructurePreparation of cheese samples for scanning electron micros-copy (SEM) analysis after 1, 30 and 90 days of ripeningwas performed according to the method previouslydescribed by Drake et al. (1996), with modifications sug-gested by Madadlou et al. (2007). This method had beenused previously by Aminifar et al. (2010) to study themicrostructure of traditional Lighvan cheese. According tothis method, 5–6 mm3 cheese cubes were prepared by cut-ting the cheese blocks with a sharp razor. The cheese cubeswere immersed in 2.5% (w/w) gluteraldehyde fixative(Merck Chemical Ltd., Darmstadt, Germany) for 3 h, thenwashed in six changes of distilled water (1 min each). Thecubes were dehydrated in a graded (40, 55, 70, 85, 90 and96%) series of ethanol baths for 30 min at each grade anddefatted with three changes of chloroform (10 min each).The prepared cubes were covered with ethanol and refrig-
erated until SEM analysis. The cubes were freeze-fracturedin liquid nitrogen into approximately 1-mm pieces accordingto the method described by Sipahioglu et al. (1999). Afterthe cheese pieces had been dried to a critical point, a sput-ter-coater (Balzers, Type SCD 005; BalTec Inc., Pfäffikon,Switzerland) was used to apply gold coating for 6 min. Thesamples were examined with a scanning electron micro-scope (XL Series, model XL30; Philips, Eindhoven, theNetherlands) operated at 15.0 kV. Photomicrographs wererecorded at 500, 1000, 2000 and 4000 magnification levels.3D images were prepared with an interactive 3D surface
plot function from image analysis software (ImageJ; NationalInstitutes of Health, Bethesda, MD, USA). Appropriate 3Dimages were created with these settings: z-ratio: 0.18, smooth-ing: 12.0, lightening: 0.2, scale: 1.34 and grid size: 512. Thissoftware has been used previously in the analysis of cheesemicrostructure and SEM images (Aminifar et al. 2010).
Texture profile analysisThe fracturability, or brittleness, and hardness of cheesewere determined after 1, 30, 60 and 90 days of ripeningusing uniaxial force compression performed with a textureanalyser (Testometric M350-10CT, Lancashire, UK) fitted
46 © 2012 Society of Dairy Technology
Vol 66, No 1 February 2013

with a 0-50-kg load cell. Prior to analysis, the cheese cubesamples (20 9 20 9 20 mm) were tempered to 12 ± 5 °C.They were compressed to 70% of their initial height with aplunger, 40 mm in diameter, moving at 30 mm/min. Thefirst break of the compression curve was considered asfracturability (Fredrick et al. 1986). The force required tocompress the sample to 70% of its initial height determinedhardness (Szczesniak 1963). All samples were analysedusing three replications in each stage of ripening.
RESULTS AND DISCUSSION
Changes in the pH, moisture content, salt, salt-in-moisture,TN/DM and WSN/TN during the ripening period in cheesesmade from sheep’s, cow’s or mixed milk (1:1) are shown inTable 1.The pH of the cheese samples is affected by two main
factors: lactose fermentation and production of aminogroups by yeast and bacteria (Fox 1993). Regardless of thekind of milk, the pH of the samples did not change signifi-cantly in the 60 days of ripening. This could be related tothe balance between the two determinant pH factors.Because of the inhibitory effect of salt on yeast and proteo-lytic bacteria (Guinee and Fox 1993), the pH of bovine andmixed Lighvan cheeses, like that of ovine Lighvan cheese,decreased between the 60th and 90th days due to the pro-duction of lactic acid. Because the pH of cow’s and sheep’smilk does not differ significantly (Jenness et al. 1974), the
pH of the Lighvan cheese was not affected by the type ofmilk. As after 90 days lactobacilli were the dominant groupof bacteria in the Lighvan cheese (Kafili et al. 2009), thepH of all samples was around 4.45 due to lactose fermenta-tion.From the statistical analysis of the moisture content of
Lighvan cheeses made with the different kinds of milk atdifferent stages of ripening, a sharp decrease was observedbetween days 1 and 30. This depletion could be related tostorage of cheese cubes in 10–12% salt brine and the move-ment of water from cheese to brine due to the high osmoticpressure of NaCl (Zerfiridis 2001). As a result of equilib-rium between the adsorption and desorption of water, themoisture content was constant between 30 and 90 days.Adsorption of water could be related to the water-holdingability of proteolysis products (Creamer and Olson 1982).In all stages of ripening, bovine Lighvan cheese had highermoisture content than cheeses made from ewe’s or mixedmilk cheeses. This difference could be attributed to thehigher level of total solids in sheep’s milk in comparisonwith cow’s milk. Pappa et al. (2006) found that Telemecheese made from cow’s milk had higher moisture contentthan cheese made from ewe’s and goat’s milk. Similarresults were reported by Kehagias et al. (1995) for white-brined cheese. At day 1, the moisture content of cheesemade from mixed milk was higher than that of ovinecheese, but after 90 days the moisture content of both typeswas the same.
Table 1 Changes in physiochemical properties of Lighvan cheese made from sheep’s (Sd), cow’s (C) or mixed milk (M) during storage(mean ± SD of three trials)
Physicochemicalcharacteristics
Kindof milk
Ripening time (days)
1 30 60 90
pH S 5.45a1 ± 0.26 5.75a1 ± 0.29 5.69a1 ± 0.14 4.65b1 ± 0.34C 5.72a1 ± 0.36 5.70a1 ± 0.33 5.69a1 ± 0.23 4.43b1 ± 0.02M 5.36a1 ± 0.41 5.43a1 ± 0.13 5.54a1 ± 0.26 4.49b1 ± 0.21
Moisture content(%, w/w)
S 68.59a3 ± 0.48 61.37b2 ± 2.21 62.08b2 ± 0.29 61.63b2 ± 0.26C 73.15a1 ± 1.16 65.75b1 ± 0.66 65.18b1 ± 0.41 64.17b1 ± 0.31M 70.20a2 ± 0.15 62.15b2 ± 0.30 62.14b2 ± 0.26 62.15b2 ± 0.66
Salt (%, w/w) S 7.45b2 ± 0.19 13.13a2 ± 0.43 13.68a2 ± 0.23 13.61a2 ± 0.15C 8.10b1 ± 0.16 14.76a1 ± 0.45 14.60a1 ± 0.26 14.04a1 ± 0.16M 8.11b1 ± 0.08 14.26a1 ± 0.23 14.59a1 ± 0.20 14.05a1 ± 0.15
TN/DM (%, w/w) S 5.68a1 ± 0.16 5.44a1 ± 0.10 4.69b1 ± 0.25 4.54b1 ± 0.08C 5.18a2 ± 0.12 5.15a2 ± 0.09 4.14b2 ± 0.20 4.13b2 ± 0.11M 5.21a2 ± 0.15 5.23a2 ± 0.03 4.25a2 ± 0.09 4.21b2 ± 0.07
WSN/TN (%, w/w) S 13.01b1 ± 0.11 18.04a1 ± 0.19 19.03a1 ± 0.23 19.11a1 ± 0.19C 10.07b3 ± 0.11 14.38a3 ± 0.26 14.56a3 ± 0.20 14.80a3 ± 0.53M 12.13b2 ± 0.12 16.92a2 ± 0.71 16.75a2 ± 0.09 17.8a2 ± 0.15
a–dMeans of each parameter in the row with different letters are significantly different (P < 0.05).1–3Means of each parameter in the same column of the same day with different numbers are significantly different (P < 0.05).
Sd For better comparison, results from Lighvan cheese made from sheep’s milk were picked up from our previous research (Aminifar et al.
2010).
© 2012 Society of Dairy Technology 47
Vol 66, No 1 February 2013

Regardless of the kind of milk, the NaCl content of Ligh-van cheese increased significantly during the first month ofageing due to the difference in osmotic pressure betweenbrine and cheese water (Guinee and Fox 1986). Becauseequilibrium had been reached after 30 days, the salt contentdid not change from the 30th to the 90th day. Salt contentwas affected by the kind of milk used. Cheese made frombovine or mixed milk had higher salt content than cheesemade from ewe’s milk. Our results agreed with thosereported by Geurts et al. (1974), who found that the diffu-sion coefficient and the quantity of the salt absorbed byGouda-type cheeses during brine salting increased as themoisture content of the curd increased. Byers and Price(1937) reported similar results for brine-salted Brick cheese.Regardless of the type of milk, the percentage of TN/DM
decreased during ageing as a result of proteolysis and diffu-sion of soluble nitrogenous compounds into the brine (AbdEl-Salam et al. 1993). Because ovine milk has a higherlevel of protein (casein and whey) and other nonproteinnitrogenous compounds than bovine milk (Gil and SanchezMedina 1981), the percentage of TN/DM in ovine Lighvancheese was higher than in cheeses made from bovine ormixed milk. Blending of bovine milk with ovine milk didnot alter the percentage of TN/DM significantly.WSN/TN (%) values increased significantly in the first
month of ageing, regardless of the kind of milk. Thisincrease could be attributed to proteolytic activity of rawmilk proteases and microorganisms (Ardo 1999). Between30 and 90 days, due to the inhibitory effect of salt on prote-olysis, the ratio of WSN to total nitrogen in all samples didnot change significantly. The higher WSN/TN (%) values incheese produced from ovine milk compared with cheesesfrom bovine or mixed milk in all stages of ripening couldbe attributed to the composition of ewe’s milk. Lower levelsof WSN/TN (%) in Teleme cheese made from bovine milkin comparison with cheese produced from ovine milk at theage of 60–180 days was reported by Pappa et al. (2007).When bovine milk is mixed with ovine milk, its ratio ofWSN to total nitrogen changed significantly.
MicrostructureFigures 1, 2 and 3 show SEM micrographs of the Ligvancheese samples produced from sheep’s, cow’s and mixedmilk at 1, 30 and 90 days of ripening. For bettercomparison, SEM micrographs of ovine Lighvan cheesewere compiled from our previous study (Aminifar et al.2010). Tri-dimensional images of the cheese SEM micro-graphs are shown below the original 2D images. At day 1,while ovine Lighvan cheese had a compact protein matrixwith a few void spaces, the protein matrix of Lighvancheeses made from bovine or mixed milk packed less den-sely, with cavities filled with whey (Figure 1). The higherdensity of the ovine cheese structure relative to cow’s ormixed milk could be related to its lower moisture content.
A low-density casein network results in a high-moisturecheese (Kalab and Modler 1985); therefore, the SEM micro-graphs suggest that bovine and mixed Lighvan cheeses con-tain more moisture than sheep’s cheese. This was borne outby physicochemical analysis. Regardless of the type of milk,physical homogenous aggregation of casein produced poresin cheese texture after 30 days (Figure 2). Homogeneity inovine cheese was more pronounced than that of cow’s andmixed milk cheese during ripening (Figures 2 and 3). Thishomogeneity could be related to the higher salt content ofovine cheese than bovine and mixed cheese. Salt plays animportant role in the homogeneity of brined cheese. Chlo-ride anions produced from NaCl diffusion enhance hydro-phobic interactions, which increase casein linkages andresult in a more homogenous texture (Rowney et al. 2004).Pores were shown with white holes in 3D images. As Ligh-van cheeses are made from raw milk, microbial fermentationwas the main source of gas production and pore formationduring ripening. Due to the rearrangement of the casein net-work as a result of water expulsion during cheese ageing inbrine, cheese made with cow’s and mixed milk became den-ser after 30 days. Changes during brining in the microstruc-ture of Lighvan cheese manufactured from different kindsof milk could be attributed to curd synaeresis (Fox 1993).Regardless of the type of milk, a homogenous casein net-
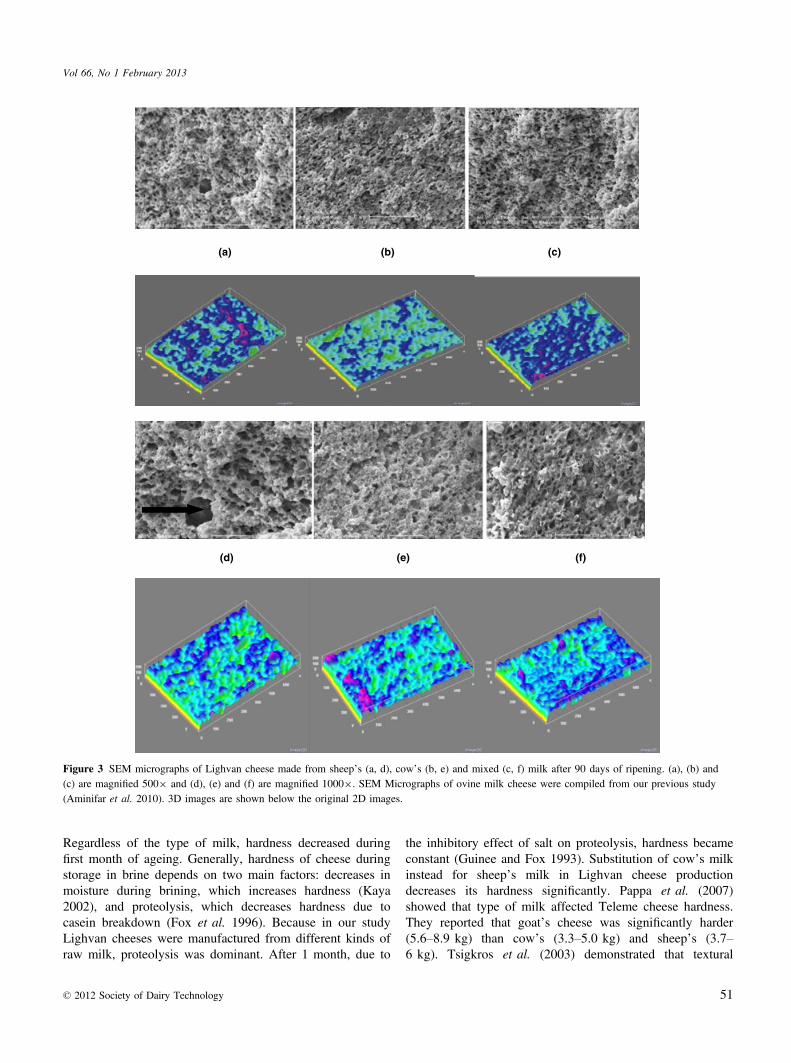
work surrounded a large number of holes in the cheese after90 days (Figure 3). Micrographs of ovine Lighvan cheeseshowed a large hole which was not found in bovine ormixed samples (marked in Figure 3a). This large cavitycould be attributed to a fingerprint of large fat globules thatwas removed by chloroform during sample preparation. Asovine Lighvan cheese had a higher fat content than cow’sor mixed milk cheeses, its fat globules were larger as aresult of clumping and coalescence. Guinee et al. (2000)demonstrated that when fat content of cheese increases,clumping and coalescence of the fat globules becomes pro-nounced. Disintegration of some fat globules from lipolysisduring cheese ripening increases serum release and thereforeraises protein matrix density. As a result of this process, theintact fat globules might join into one larger globule and actas a protein matrix breaker (Lopez et al. 2007).Figures 1–3 show a greater difference between the micro-
structures of cheeses made with different kinds of milk atthe start of ripening than at its end; brining could lessen thedifference. 3D images after 90 days (Figure 3) showed thatcompaction is similar between cheeses made with sheep’sand mixed milk, and greater than that of bovine cheese.This difference could be related to the higher moisture con-tent of Lighvan cheese made with cow’s milk relative to theother two kinds of cheese.
Texture profile analysisFigure 4 shows changes in the hardness of Lighvan cheesesmade with different kinds of milk during ripening.
48 © 2012 Society of Dairy Technology
Vol 66, No 1 February 2013

(a) (b) (c)
(d) (e) (f)
Figure 1 SEM micrographs of Lighvan cheese made from sheep’s (a, d), cow’s (b, e) and mixed (c, f) milk after 1 day of ripening. (a), (b) and (c)are magnified 500 9 and (d), (e) and (f) are magnified 10009. SEM Micrographs of ovine milk cheese were compiled from our previous study(Aminifar et al. 2010). 3D images are shown below the original 2D images.
© 2012 Society of Dairy Technology 49
Vol 66, No 1 February 2013

(a) (b) (c)
(d) (e) (f)
Figure 2 SEM micrographs of Lighvan cheese made from sheep’s (a, d), cow’s (b, e) and mixed (c, f) milk after 30 days of ripening. (a), (b) and(c) are magnified 500 9 and (d), (e) and (f) are magnified 10009. SEM Micrographs of ovine milk cheese were compiled from our previous study(Aminifar et al. 2010). 3D images are shown below the original 2D images.
50 © 2012 Society of Dairy Technology
Vol 66, No 1 February 2013
Regardless of the type of milk, hardness decreased duringfirst month of ageing. Generally, hardness of cheese duringstorage in brine depends on two main factors: decreases inmoisture during brining, which increases hardness (Kaya2002), and proteolysis, which decreases hardness due tocasein breakdown (Fox et al. 1996). Because in our studyLighvan cheeses were manufactured from different kinds ofraw milk, proteolysis was dominant. After 1 month, due to
the inhibitory effect of salt on proteolysis, hardness becameconstant (Guinee and Fox 1993). Substitution of cow’s milkinstead for sheep’s milk in Lighvan cheese productiondecreases its hardness significantly. Pappa et al. (2007)showed that type of milk affected Teleme cheese hardness.They reported that goat’s cheese was significantly harder(5.6–8.9 kg) than cow’s (3.3–5.0 kg) and sheep’s (3.7–6 kg). Tsigkros et al. (2003) demonstrated that textural
(a) (b) (c)
(d) (e) (f)
Figure 3 SEM micrographs of Lighvan cheese made from sheep’s (a, d), cow’s (b, e) and mixed (c, f) milk after 90 days of ripening. (a), (b) and(c) are magnified 5009 and (d), (e) and (f) are magnified 10009. SEM Micrographs of ovine milk cheese were compiled from our previous study(Aminifar et al. 2010). 3D images are shown below the original 2D images.
© 2012 Society of Dairy Technology 51
Vol 66, No 1 February 2013

properties of Feta cheese are affected by milk composition,and its hardness is increased when caprine milk is added toovine milk. Kalatzopoulos (1993) showed that differences intextural properties of cheese produced from different kindsmilk could be related to different casein structures or theirconcentration. In their study, when ovine milk was added tobovine milk in a 50:50 ratio, the hardness of bovine milkcheese increased significantly as result of an increase in itstotal solids. At the start of ripening, sheep’s milk cheesewas 12 N harder than mixed milk cheese, but at the end ofripening this value had fallen to 7 N. This phenomenoncould be related to their moisture contents, which were notsignificantly different at the end of ripening, in contrast tothe beginning.Figure 5 shows the effect of types of milk and ripening
time on Lighvan cheese brittleness. According to Larmond(1976), when the brittleness value of a cheese sample
decreases, it becomes more brittle. Regardless of type ofmilk, all types of Lighvan cheese became more brittle dur-ing the first month of ripening. This phenomenon could berelated to pore formation and decreases in moisture contentduring ripening. A similar trend for the elastic modulus ofHalloumi cheese made with bovine and ovine milk duringripening was reported by Raphaelides et al. (2006). It seemsthat migration of water, which could play a plasticising role,from the cheese into the brine reduced the elasticity of alltypes of Lighvan cheese. Raphaelides et al. (2006) showedthat migration of water into empty mashes of Halloumicheese reduced its matrix rigidity. The greater elasticity ofovine Lighvan cheese in comparison with the two otherkinds could be related to its fat content, which could alsoplay a plasticising role. The texture of mixed milk cheesebecame more elastic as a result of its increased fat content.
CONCLUSIONS
This study investigated the effect of substituting ovine milkwith bovine milk or mixed ovine and bovine milk in Lighvancheese production on physicochemical characteristics, micro-structure and textural properties of product during ripening.The physicochemical characteristics of Lighvan cheeses pro-duced from different kinds of milk showed significantchanges in fat content, moisture content, salt content, TN/DMand WSN/TN changes, also microstructure and porosity, par-ticularly in later stages of ripening, but the rate of thesechanges differed. Ovine Lighvan cheese was significantlyharder than bovine or mixed milk, and the hardness of bovineLighvan cheese increased when half of its milk was replacedwith ovine milk. Substitution of ovine milk with bovine ormixed milk led to a more brittle product.
REFERENCES
Abd El-Salam M H, Alichanidis E and Zerfiridis G K (1993) Domiatiand Feta-type cheese. In Cheese: Chemistry, Physics and Microbiol-ogy, pp 301–355. Fox P F, ed. London: Chapman and Hall.
Abdi R, Sheikh-Zeinoddin M and Soleimanian-Zad Z (2006) Identifica-tion of lactic acid bacteria. Pakistan Journal of Biological Science 999–103.
Aminifar M, Hamedi M, Emam Djomeh Z and Mehdinia A (2010)Microstructural, compositional and textural properties during ripeningof Lighvan cheese, a traditional raw sheep cheese. Journal of TextureStudies 41 579–593.
Anifantakis E M and Moatsou G (2006) Feta and other Balkan cheeses.In Brined Cheeses, pp 43–76. Tamime A Y, ed. Ayr: BlackwellPublishing.
Ardo Y (1999) Evaluation proteolysis by analyzing the N content ofcheese fractions. In Bulletin of the International Dairy Federation, pp4–9. Brussels: No 337.
Atasoy A F and Turkoglu H (2008) Changes of composition and freefatty acid contents of Urfa cheeses (a white-brined Turkish cheese)during ripening: effects of heat treatments and starter cultures. FoodChemistry 110 598–604.
0
5
10
15
20
25
30
35
40
45
50
0 30 60 90
Forc
e (N
)
Ripening time (days)
Sheep
Mixed
Cow
Figure 4 Effect of milk origin and ripening time on Lighvan cheesehardness. For better comparison, sheep’s milk Lighvan cheese data werecompiled from our previous study (Aminifar et al. 2010).
0
5
10
15
20
25
0 30 60 90
Forc
e (N
)
Ripening time (day)
Sheep
Mixed
Cow
Figure 5 Effect of milk origin and ripening time on Lighvan cheesebrittleness. For better comparison, sheep’s milk Lighvan cheese datawere compiled from our previous study (Aminifar et al. 2010).
52 © 2012 Society of Dairy Technology
Vol 66, No 1 February 2013

Awad S (2006) Texture and flavor development in Ras cheese madefrom raw and pasteurized milk. Food Chemistry 97 394–400.
Byers E L and Price W V (1937) Observations on the salting of brickcheese. Journal of Diry Science 20 307–318.
Creamer L K and Olson N F (1982) Rheological evaluation of maturingcheddar cheese. Journal of Food Science 47 631–636.
Drake M A, Herrett W, Boylston T D and Swanson B G (1996) Lecithinimproves texture of reduced fat cheeses. Journal of Food Science 47639–642.
Fox P F (1993) Cheese: an overview. In Cheese: Chemistry, Physics andMicrobiology, pp 1–36. Fox P F, ed. London: Chapman and Hall.
Fox P F, Lucey J A and Cogan T M (1990) Glycolysis and related reac-tions during cheese manufacture and ripening. Critical Reviews inFood Science and Nutrition 29 237–253.
Fox P F, O’connor T P, Mcsweeney P L H, Guinee T P and O’brien NM (1996) Cheese: physical, biochemical and nutritional aspects.Advances in Food Nutrition Research 39 163–328.
Fredrick I A, Atson J W, Nottingham S M and Dulley J (1986) Theeffect of neutral fungal protease in cheddar cheese ripening. NewZealand Journal of Dairy Science and Technology 43 35–39.
Geurts T J, Walstra P and Mulder H (1974) Brine composition and theprevention of the defect ‘soft rind’ in cheese. Netherlands Milk andDairy Journal 28 168–179.
Gil A and Sanchez Medina F (1981) Acid soluble nucleotides of cow’s,goat’s and sheep’s milks at different stages of lactations. Journal ofDairy Research 48 35–44.
Guinee T P and Fox P F (1986) Transport of sodium chloride and waterin Romano cheese slices during brining. Food Chemistry 19 49–64.
Guinee T P and Fox P F (1993) Salt in cheese: physical, chemical andbiological aspects. In Cheese: Chemistry, Physics and Microbiology,pp 257–302. Fox P F, ed. London: Chapman and Hall.
Guinee T P, Auty M A E and Fenelon M A (2000) The effect of fat contenton the rheology, microstructure and heat-induced functional character-istics of Cheddar cheese. International Dairy Journal 10 277–288.
Hort J, Grys G and Woodman J (1997) The relationships between thechemical, rheological and textural properties of Cheddar cheese. Lait77 587–600.
IDF (1982) FIL-IDF Standard 4A Cheese and processed cheese. Determi-nation of the total solids content (reference method). InternationalDairy Federation 4A 110–115.
IDF (1993) FIL-IDF Standard 20A Milk. Determination of nitrogen con-tent, protein-nitrogen content, and non-protein-nitrogen content (Kjel-dahl method). International Dairy Federation 20A 83–102.
Jenness R, Shipe W F and Sherbon J W (1974) Physical properties ofmilk. In Fundamentals of Dairy Chemistry, pp 402–412. Sebb B H,Johnson A H, Alford J A, eds. Westport: A. V. Publishing.
Kafili T, Razavi S H, Emam Djomeh Z, Naghavi M R, Alvarez-Martin Pand Mayo B (2009) Microbial characterization of Iranian traditionalLighvan cheese over manufacturing and ripening via culturing andPCR-DGGE analysis: identification and typing of dominant lactoba-cilli. European Food Research and Technology 229 83–92.
Kalab M and Modler H W (1985) Development of microstructure in acream cheese based on Queso blanco cheese. Food Microstructure 489–98.
Kalatzopoulos G C (1993) Cheeses from ewe’s and goat’s milk. InCheese: Chemistry, Physics and Microbiology, pp 507–553. Fox P F,ed. London: Chapman and Hall.
Kaya S (2002) Effect of salt on hardness and whiteness of Gaziantepcheese during short-term brining. Journal of Food Engineering 52155–159.
Kehagias C, Koulouris S, Samona A, Malliou S and Koumoutsis G(1995) Effect of various starters on the quality of cheese in brine.Food Microbiology 12 413–419.
Kirk R S and Sawyer R (1991) Pearson’s Composition and Analysis ofFoods, 9th edn. London: Longman Science and Technical.
Kuchroo C N and Fox P F (1982) Soluble nitrogen in cheddar cheese:comparison of extraction procedures. Milchwissenschaft 37 331–335.
Larmond E (1976) The texture profile. In Rheology and Texture in FoodQuality, pp 546–553. de Man J M, Voisey P W, Rasper V F, StanleyD W, eds. Westport: AVI Publishing.
Lopez C, Camier B and Gassi G Y (2007) Development of milk fatmicrostructure during the manufacture and ripening of Emmentalcheese observed by confocal laser scanning microscopy. InternationalDairy Journal 17 235–247.
Madadlou A, Khosrowshahi A, Mousavi M E, Emam-Djome Z andZargaran M (2007) The influence of brine concentration on chemicalcomposition and texture of Iranian white cheese. Journal of FoodEngineering 81 330–335.
Mckenna B M (2003) Texture in Food, Vol. 1.Boca Raton: CRC Press.Papademas P and Robinson R K (2000) A comparison of the chemical,
microbiological and sensory characteristics of different types ofHalloumi cheese. International Dairy Journal 10 761–768.
Pappa E C, Kandarakis I, Anifantakis E M and Zerfiridis G K (2006)Influence of types of milk and culture on the manufacturing practices,composition and sensory characteristics of Teleme cheese duringripening. Food Control 17 570–581.
Pappa E C, Kandarakis I and Mallatou H (2007) Effect of different typesof milks and cultures on the rheological characteristics of Telemecheese. Journal of Food Engineering 79 143–149.
Pappas C P, Kondyli L P and Mallatou H (1996) Effect of starter level,draining time and aging on the physicochemical, organoleptic andrheological properties of feta cheese. Journal of the Society of DairyTechnology 49 73–78.
Raphaelides S N, Antoniou K D, Vasilliadou S, Georgaki C and Gravan-is A (2006) Ripening effects on the rheological behaviour of Hallo-umi cheese. Journal of Food Engineering 76 321–326.
Rowney M K, Roupas P, Hickey MW and Everett D W (2004) Salt-inducedstructural changes in 1-day old mozzarella cheese and the impact uponfree oil formation. International Dairy Journal 14 809–816.
Singh T K, Drake M A and Cadwallader K R (2003) Flavor of cheddarcheese: a chemical and sensory perspective. Comprehensive Reviewsin Food Science and Food Safety 2 139–162.
Sipahioglu O, Alvarez V and Solano-Lopez C (1999) Structure, physico-chemical and sensory properties of feta cheese made with tapiocastarch and lecithin as fat mimetics. International Dairy Journal 9 738–789.
Szczesniak A S (1963) Classification of textural characteristics. Journalof Food Science 38 85–389.
Tsigkros D, Folland E, Moate R and Brennan C S (2003) Feta cheesetexture: the effect of caprine and ovine milk concentration. Interna-tional Journal of Dairy Technology 56 233–236.
Zerfiridis G K (2001) Soft cheeses. In Technology of Dairy Products, I:Cheese-making, pp 155–198. Zerfiridis G K, ed. Thessaloniki: Giaxo-udi-Giapouli.
© 2012 Society of Dairy Technology 53
Vol 66, No 1 February 2013