the effect of marketing mix strategies on sales
TRANSCRIPT
THE EFFECT OF MARKETING MIX STRATEGIES ON
SALES PERFORMANCE: IN CASE OF DEBERE
BIRHAN BREWERY FACTORIES, ETHIOIPIA
COLLEGE OF BUSINESS AND ECONOMICES
DEPARTMENT OF MANAGEMENT (MBA PROGRAM)
BY: MASRESHA ABATE
JUNE, 2020
DEBRE BREHAN, ETHIOPIA

COLLEGE OF BUSINESS AND ECONOMICS
DEPARTMENT OF MANAGEMENT (MBA PROGRAM)
THE EFFECT OF MARKETING MIX STRATEGIES ON SALES
PERFORMANCE : IN CASE OF DEBERE BEREHAN BERWERY
FACTORIES
BY: MASRESHA ABATE
ADVISOR: SHIFERA BEKELE (PhD)
A THESIS SUBMITTED TO THE SCHOOL OF GRADUATE STUDIES OF
DEBRE BREHAN UNIVERSITY DEPARTMENT OF MANAGEMENT IN
PARTIAL FULFILLMENT OF THE REQUIREMENT FOR THE AWARD
OF MASTER OF ARTS BUSINESS ADMINISTRATION (MBA)
JUNE, 2020
DEBRE BREHAN, ETHIOPIA
i
DEBRE BREHAN UNIVERSITY
SCHOOL OF GRADUATE STUDIES
APPROVAL OF THE THESIS
As members of Board examiners of the final MBA, Thesis open defense examination, we certify
that we have read and evaluated the thesis prepared by Masresha Abate entitled “Effect of
Marketing Mix Strategies on Sales Performance in case of Debere Berehan Brewery Factories”.
We recommend that thesis be accepted as fulfilling the thesis requirement for the degree of
masters of business administration.
Board of Examiners
External Examiner
________________________________________ ____________ ____________
Name Signature Date
Internal Examiner
________________________________________ ____________ ____________
Name Signature Date
Chair Person
________________________________________ ____________ ____________
Name Signature Date
ii
DECLARATION
I, the undersigned declare that, this research entitled “The Effect of Marketing Mix Strategies
on Sales Performance: In Case Of Debere Birhan Brewery factories in Debere Birhan City” is
the outcome of my own effort and study and that all sources of materials used for the study have
been duly acknowledged. I have produced it independently except for the guidance and
suggestion of the research advisor. This study has not been submitted for any degree in this
university or any other university. It is offered for the partial fulfillment of the degree of MBA
in Management Department .
Name: MASRESHA ABATE
Signature: _______________
Date: ___________________

iii
DEBRE BREHAN UNIVERSITY
SCHOOL OF GRADUATE STUDIES
LETTER OF TESTIMONY
As Thesis Research advisor, I hereby certify that I have read and evaluated this thesis prepared,
under my guidance, by Masresha Abate entitled “Effect of Marketing Mix Strategies on Sales
Performance: In Case of Debere Berehan Brewery Factories of Ethiopia”. I recommended that
it be submitted as fulfilling the thesis requirement for the degree of ‘masters of business
administration.
Name: SHIFERA BEKELE (PhD)
Signature: ____________________
Date: ________________________
iv
ACKNOWLEDGEMENTS
First of all, thanks to my Almighty God and St. Virgin Marry for making everything possible and
for their abundant blessings throughout my life. I could not be where I am right now without
their guidance and unfailing love.
Next, I am greatly indebted to thank my advisor Shifera Bekele (PhD) for his unreserved
attention to correct my thesis and advising me for the better improvement of this thesis.
A sincere appreciation and special thanks go to the respondents for their kind help and support
throughout the data collection process of this research.
I would like to thank also Debere Berehan brewery factories for allowing me to conduct this
research and for providing the effect of sales performance . Great appreciation is also extended
to friends and family who always gave a great support during this research.

v
TABLE OF CONTENTS
APPROVAL OF THE THESIS ....................................................................................................... i
DECLARATION ............................................................................................................................ ii
LETTER OF TESTIMONY .......................................................................................................... iii
ACKNOWLEDGEMENTS ........................................................................................................... iv
LIST OF TABLES ....................................................................................................................... viii
LIST OF FIGURES ....................................................................................................................... ix
ACRONYMS .................................................................................................................................. x
ABSTRACT ................................................................................................................................... xi
CHAPTER ONE ............................................................................................................................. 1
INTRODUCTION .......................................................................................................................... 1
1.1.Background of the Study ....................................................................................................... 1
1.2.Background of the Organization ........................................................................................... 4
1.3.Statement of the Problem ...................................................................................................... 5
1.4.Objective of the Study ........................................................................................................... 7
1.4.1. General Objective ..................................................................................................... 7
1.4.2. Specific Objectives ................................................................................................... 7
1.5. Research Questions .............................................................................................................. 7
1.6.Research Hypothesis ............................................................................................................. 8
1.7.Significance of the Study ...................................................................................................... 8
1.8.Scope of the Study................................................................................................................. 9
1.9.Limitation of the Study ......................................................................................................... 9
1.10.Definition of Key Terms ..................................................................................................... 9
1.11.Organization of the Study ................................................................................................. 10
CHAPTER TWO .......................................................................................................................... 12
LITERATURE REVIEW ............................................................................................................. 12
2.1.Introduction ......................................................................................................................... 12
2.2.Theoretical Foundation ....................................................................................................... 12
2.3.The Concept of Marketing Mix Strategies .......................................................................... 12
2.4.The Concept of Sales Performance ..................................................................................... 13

vi
2.5.Marketing Mix Strategies .................................................................................................... 13
2.5.1.Product Strategy ........................................................................................................... 14
2.5.2.Price Strategy ............................................................................................................... 16
2.5.3.Place Strategy ............................................................................................................... 17
2.5.4.Promotion Strategy ....................................................................................................... 19
2.6.Marketing Mix Strategies and Sales Performance .............................................................. 24
2.7.Empirical Review of Marketing Strategies ......................................................................... 24
2.8.Conceptual Framework ....................................................................................................... 26
CHAPTER THREE ...................................................................................................................... 27
RESEARCH METHODOLOGY.................................................................................................. 27
3.1.Introduction ......................................................................................................................... 27
3.2.Description of the Study Area ............................................................................................. 27
3.3.Research Design .................................................................................................................. 27
3.4.Research Approach ............................................................................................................. 28
3.5.Target Population of Study ................................................................................................. 28
3.6. Census Method ................................................................................................................... 29
3.7.Sources of Data ................................................................................................................... 29
3.8.Method of Data Collection .................................................................................................. 30
3.9.Method of Data Analysis..................................................................................................... 30
3.9.1.Descriptive Analysis ..................................................................................................... 31
3.9.2.Econometric Analysis ................................................................................................... 31
3.10.Model of Specification ..................................................................................................... 31
3.11.Description of Variables.................................................................................................... 32
3.12.Model Diagnostic Tests ..................................................................................................... 33
3.13.Validity and Reliability ..................................................................................................... 33
3.14.Ethical Considerations....................................................................................................... 35
CHAPTER FOUR ......................................................................................................................... 36
DATA ANALYSIS AND DISCUSSION OF RESULTS ............................................................ 36
4.1.Introduction ......................................................................................................................... 36

vii
4.2.Data Processing and Analysis ............................................................................................. 36
4.3.Data Reliability ................................................................................................................... 37
4.4.Demographic Characteristics of Respondents..................................................................... 38
4.5.Descriptive Statistics (Continuous Variables)..................................................................... 40
4.6.Correlation Analysis ............................................................................................................ 41
4.7.Econometric Analysis ......................................................................................................... 42
4.7.1.Model Diagnostic Tests (Test for CLRM Assumptions).............................................. 43
4.8.Regression Analysis ............................................................................................................ 46
4.9.Analysis of Variance (ANOVA) ......................................................................................... 48
4.10.Multiple Linear Regression Coefficients .......................................................................... 48
4.11.Testing Hypothesis ............................................................................................................ 51
CHAPTER FIVE .......................................................................................................................... 56
SUMMARY, CONCLUSIONS AND RECOMMENDATIONS................................................. 56
5.1. Introduction .................................................................................................................... 56
5.2. Summarys ....................................................................................................................... 56
5.3. Conclusions .................................................................................................................... 58
5.4. Recommendations .......................................................................................................... 59
5.4.1 Policy Implications ...................................................................................................... 61
5.4.2 Suggestion for further research..................................................................................... 61
REFERENCES ......................................................................................................................... 62
APPENDIX-I ................................................................................................................................ 70

viii
LIST OF TABLES
Table 3. 1: For the tareget population to the relevant departments.............................................. 29
Table 3 .2: Reliability Test Based on Pilot Survey Data .............................................................. 34
Table 4 .1: Response Rate ............................................................................................................. 36
Table 4 .2: Cronbach's Alpha for each category of the questionnaire ......................................... 37
Table 4 .3: Demographic Profiles of the Respondents ................................................................. 38
Table 4. 4: Summary Statistics on Continuous Variables............................................................. 40
Table 4. 5: Interpretation of (r) Value .......................................................................................... 41
Table 4. 6: Correlation Coefficient Result of Marketing Mix and Sales Performance................. 42
Table 4 .7: Multicollinearity Test Using Variance Inflation Factor (VIF) and Tolerance (ToL) . 45
Table 4. 8: Breusch-Pagan / Cook-Weisberg and White’s Test for Heterosedasticity ................. 46
Table 4 .9: Model Summary ......................................................................................................... 47
Table 4 .10: Analysis of Variance (ANOVA) of the Regression Result ...................................... 48
Table 4. 11: Multiple linear regression Coefficients .................................................................... 49
Table 4 12: Summary of Actual and Expected Sign Effect of Explanatory Variables ................ 53

ix
LIST OF FIGURES
Figure 2.1: Conceptual Framework ............................................................................................ 26
Figure 4 .1: Linearity Test ............................................................................................................ 43
Figure 4 .2: Normality Test .......................................................................................................... 44
x
ACRONYMS
4P’s Product, Price, Place and Promotion
DB Debre Berhan
DBBF Debre Berhan Brewery factories
ToL Tolerance
VIF Variance Inflation Factor

xi
ABSTRACT
Marketing mix, in any form of business, is an integral part of the policies that determine the
performance of that business. Sales, on the other hand, have a direct impact on the profits and
losses of a business. To investigate the effect of marketing mix strategies on sales performance:
in case of Debere Berehan brewery factories. The study applied explanatory research design and
quantitative research approach. To collect primary data, questionnaire was distributed to 127
respondents for two brewery factories by using a census method and 115 questionnaires were
found valid for analysis. The collected data was analyzed using STATA 13 statistical software.
The Pearson correlation coefficient showed that among the 4P’s promotion has very high
positive and significant effect on sales performance, whereas place and product have strong
positive and significant effect on sales performance and price has very low negative and
significant effect on sales performance. The multiple linear regression analysis was conducted to
address the major objective of the study. The regression result showed that promotion, place and
product have a positive and statistically significant effect on sales performance. But, price has
negative and statistically significant effect on sales performance. The study recommended that
brewery factories should improve product quality by upgrading their technology, Use price
promotion strategy such as uses price discounts, free samples, increase by number of
distributing and should be provided timely and rapid information to their customers. Finally, it
is recommended that to create on sales performance on the sales and introducing fast and
modernized technology brewery factories to need provide better product quality ,fair price value
and build the corporate brandy of sales performance.
Keywords: Marketing mix strategies , Product, Price, Place, Promotion and sales performance

1
CHAPTER ONE
INTRODUCTION
The background part of this paper will explain the meaning of marketing mix strategies in
general and specifically Sales performances in the Ethiopian context. It will also introduce role
players in this specific factories. This section address background of the study, Background of
the Organization, Statement of the problem, Objectives of the study, Research question,
Research hypothesis, Significance of the study, Scope of the study, Limitation of the study,
Definition of the key terms and Organization of the study.
1.1.Background of the Study
Sales is the quantity of goods sold in number or amount of units during the normal operating
times of a company (Ghazaleh & Haghighi, 2009). Sales performance can be evaluated using a
sales volume analysis, marketing cost analysis and profitability analysis whereby a sales volume
investigation is conducted by a careful study of an organization’s records of its profits and loss
statement on the product lines, territories and key accounts of the customers (Salleh and
Kamaruddin, 2011). Sales performance refers to the volume of offers accomplished inside a
predefined period contrasted with predetermined sales levels (Rotich, 2016). Sales Performance
is the efficiency of the sales team, both are individually and by way of a whole, in selling
activities. According to Caviusgi and Zou (2004), Sales performance is the abstracted to join
both the outcome and social measurements. Sales performance is the measurement of sales
activity against the goals defined in the sales plan. The simplest method of tracking sales
performance is to establish sales goals for your team and for individual team members and then
evaluate performance, either monthly or quarterly (Jason Aten, 2019).
The numbers of factors affecting sales performance are structured, these include the customers,
marketing channels, company size, practices of competitors. Successful sales performance is
critical to any run based on the organization. that consistently miss its sales goals may be forced
to reduce operations or even go out of business. For any stressed sales organizations to quickly
identify factors for poor sales performance and poor economic conditions.
2
According to kotler (2011), marketing is the science and art of exploring, creating and delivering
value to satisfy the needs of a target market at a profit. Marketing is the social procedure by
which individuals and groups find what they need and want through creating and exchanging
products and value with others,(kotler, 2010). According to Palmer (2010), marketing mix is a
conceptual framework that marketing managers used to come up with strategies that can use to
target their market and meet consumer’s needs. Marketing mix can also be used to develop long
term and short term goals. According to Kiprotich (2012), marketing mix is a set of marketing
tools that organizations blend to get the response it wants from its target market.
According to Gronroos (2010) upgrade the early version of marketing mix elements from the 4Ps
to 7Ps. This included people, physical evidence and process. The marketing mix is a mix of
strategies or variables that managers are able to control. Marketing mix strategies consists of 4Ps
which helps a manager’s come up with strategies, thus, define the direction in which their
marketing mix strategies will use in order to achieve and create a competitive advantage
(American Marketing Association, 2008). Marketing mix is grouped into four variables known
as the 4Ps such as, Product, price, place, and promotion. Marketing mix is one of the major
categories related to decisions and assessments of a firm’s marketing, because the marketing mix
or marketing strategies is a combination of elements necessary to plan and implement the entire
marketing mix strategies.
Product is refer to tangible physical products as well as services. Product is a physical
commodity or anything offered by an organization to provide customer satisfaction(Bell and
Vincze, 1988). Product has four important dimensions: width, length, depth, and consistency.
The width of product pertains to the number of different product lines that the iterms of sales.
The length of product mix relates to the number of total products or items in its product lines.
The depth of product connects to the total number of variations for each product. The variations
include size, formulation, and any other distinguishing characteristic. Consistency is the
accounting methods once adopted must be applied consistently in future and the quality of
always being the same, doing things in the same way, having the same standards.
Price is the amount of paid for a product, price means the monetary value of the product has
been fixed for exchange purpose (kotler, 1997). Price is typically the value of money exchanged

3
for good or service. The price determination depends primarily on the demand for the good or
service and the cost to the seller for that good or service.
Place is a combination of location and decision on distribution channels, in this case related to
how the delivery of services to consumers and where the strategic location (Lupiyoadi, 2013).
Place in the service industry contains the meaning of providing services at the right time in a
suitable and safe way. Promotions refers to modifying behavior and thoughts or to reinforce
existing behavior. promotions are a type of communication between the buyer and the seller.
The seller tries to persuade the buyer to purchase their good or services. It also helps in
marketing the people aware of a product, service or a company. This method of marketing mix
strategies , also create attention to the minds of buyers and also generate loyal customers.
Marketing mix and sales performance have grounded on marketing mix theory. Marketing mix
is the fundamental goal of increasing sales and achieving a sustainable competitive advantage
(Silva, 2006). Marketing mix includes all basic, short-term, and long-term activities in the field
of marketing that deal with the analysis of the strategic initial situation of a company and the
formulation, estimate and collection of market-oriented strategies and therefore contributing to
the goals of the firm and its marketing objectives. Sales performance has conceptualized to
include both the outcome and behavioral dimensions. Sales outcomes have always been seen by
performance oriented sales people as evidence to their behavioral performance and consequently
a positive effect has been found to exist between marketing mix strategies and sales
performance. This research investigated the effect of marketing mix and sales performance as
well as the moderating effects of marketing mix strategy on sales performance in case of brewery
factories in Debere Birhan city.
To identify which, mixture of marketing mix strategies the most effect on increasing the level of
sales performance. It also shows how marketing mix strategies to affect sales performance. It
should be mentioned that this article not only present the effect of marketing mix on sales
performance, but also the most effective factors of marketing mix on sales performance are
evaluated. The results specify that marketing mix has a significant relationship with the sales
performance. According to Abbas Keramati (2012), It means that all our hypotheses are
reinforced and there are association among, Product, price, promotion and place as marketing

4
mix with sales performance as an outcome of marketing strategies. Debere Birhan Brewery
factories are a brewery factories, engages in the production, sales, and distribution of beer in
Ethiopia. The factories headquarter is based in Addis Ababa, Ethiopia, and its brewery factories
located in the Debre Brehan city.
1.2.Background of the Organization
Debre Berhan was started through Emperor Zara Yaqob in response to a miraculous light that
was seen in the atmosphere at the time. Trusting this be located a sign from God showing his
approval for the death by stoning of a group of heretics 38 days before, the emperor ordered a
church built on the site, and future built a wide palace nearby, and a second church, dedicated to
Saint Cyriacus. Zara Yaqob consumed 12 of the last 14 years of his lifetime in Debre Berhan.
There are two main brewery factories in Deber Berehan city, such as Habesha and Dashen
brewery factories.
Habesha Brewery factory has founded in Amhara Region North Shwa zone Debre Berhan Town
established in (2006) E.C. At that time it holds 110 employees. Habesha Breweries was
established by 8,000 Ethiopian shareholders, including traditional associations like equips, Idris
and Ethiopians in the diaspora who contributed 4,000 pairs to 5 million pairs Habesha built its
beer manufacturing plant in Deber berhan city, 120 km north of Addis Ababa, and at the same
manner Dashen brewery factories has 120 km north of Addis Ababa. Its new plant will hire 220
permanent and 130 temporary workers.
According to DBSC Annual report (2004), Dashen Brewery is one of the Ethiopian beer
manufacturing industries. Dashen Brewery S.c was established as an endowment to assist the
overall development needs of the Amhara region in 2000 G.c. Dashen is a modern company
occupying an area of 8.5 hectares, was completed with an initial capital investment of over 340
million Birrs. The Brewery is located in the historical town Gondar which is annually visited by
more than 95,000 tourists. Dashen Brewery S.c has its new plant will hire 276 permanent and
224 temporary workers.
5
1.3.Statement of the Problem
The present globalization market has been made firms to see the internationalization of their
activities as a way to continue competing. Marketing is considered as a key element for any
successful business, regardless of its size, sector, the nature of its work and even its aim and
objectives (Akroush, 2003). Marketers can be able to adjust to the changing market condition
through the major controllable and tactical elements of marketing mix strategies, product, price,
place and promotion (Woldegebreil, 2011).
According to Cravens et al (1993), a factories needs to consider the competitors in its industry in
order to develop successful strategies. Strategies such as price competition, advertising battles,
sales promotion offers, new product introduction, and increased customer services are commonly
used to attract customers from competitors. In order to fully analyze the rivalry, it is important
to determine which firms are the major competitors and what are their annual sales, market
share, growth profile, and strengths and weaknesses. Marketing mix strategies are an important
tool globally for any business organizations to remain in the competition and stronger in a
marketing environment Lawal, (2012).
Marketing mix strategies implies that the analysis of the market and its environment, customer
buying behavior, competitive action and they have the capability of marketing intermediary
(Karimi,2015). Debere Berehan brewery factories at faces the challenges of fluctuating demand
and stiff competitions. The competitive environment in the brewery factories is widely
recognized as being complex, dynamic, and highly segmented which makes customer acquisition
difficult (Brewery Factories Annual Report, 2020).
There are some researchers who conducted their research on the effect of marketing mix
strategies on sales performance. Accordingly, Mwenda (2017) and Caroline (2017), conduct a
study on the effects of marketing mix on sales performance case of unga feeds limite and small
and medlum enterprises using a descriptive research design. But, as the title of the above studies
infers, to address the objective of the these studies an explanatory research design is advisable to
depict the cause and effect relationship between each marketing mix elements and sales
performance. In this regard, this study employed an exploratory research design to address its
major objective.

6
Additionally, Karimi (2015), undertake a study on the effects of marketing strategies on sales
performance of commercial banks in Kenya using a descriptive cross-sectional survey. The study
fails to measure the variables of interest involved in the study appropriately since, it merely
employed an interrogative questionnaire (yes or no question) to collect primary data. On the
other, the studies also failed to draw a concrete implication since it only employs a descriptive
analysis using frequency, percentage, mean and standard deviation. But, as the title of the
research to infer, address the correlation coefficients, model diagnostic tests and multiple linear
regression coefficients. Claude (2019), in case of tempo steels Uganda limited, the study used
both quantitative and qualitative research design, the study used both random and non-random
sampling techniques, data collection instruments, both primary and secondary data were
considered, data analysis was entered into the Statistical Package for Social Sciences (SPSS).
But, as the research title to infer, address the objective of the these studies an explanatory and
descriptive research design is advisable and also the research approach to address the qualitative
and quantitative research approaches to advisable.
Keramati (2012), in case of Steel private firms, data collection is primary data collected by
questionnaire, data analysis was used statistical package for social sciences (SPSS). For this
research, to address the research design and research approaches, for this purpose to show the
correlation analysis, assumption of regression tests and multiple linear regression coefficients. In
another study to advisable for this critic's used. Joyce Frank (2015), in case of
Telecommunication company in Tanzania, the study combined qualitative and quantitative
research approaches, the study is a systematical planning, research design, the study used
stratified sampling techniques, data collection was collected by questionnaire were closed ended
question. But, as the title of the above studies infers, to address the objective of the these studies
an explanatory research design to use qualitative and quantitative research approach is advisable.
In the above studies there is no implication, to address the correlation coefficient and multiple
linear regression coefficients to use more advisable.
In the above aforementioned studies focused on many of earlier studies have made to add their
own contribution to the concept of marketing mix strategies on sales performance. Most of these
studies were still carried out in developed countries. Whereas this study was conducted in
Ethiopian brewery factories context, this is because our perception and experience might be

7
different from studies done in developed countries. There is inconsistent variables finding, such
as, product, price and promotion. So ,that, further studies, regard to the effect of marketing mix
strategies on sales performance. There is a gap in the area or scope and methodology that is done
in Debere Berhan brewery factories regard to the effect of marketing mix strategies on sales
performance. But none have been done in Debere Berehan brewery factories.
Therefore, the study follows to address the research gap by focusing on the effect of marketing
mix strategies on sales performance in Debere Berhan Brewery Factories.
1.4.Objective of the Study
1.4.1. General Objective
The overall objective of the study is to examine the effect of marketing mix strategies on sales
performance in case of Debere Berehan brewery factories at Debere Berhan city.
1.4.2. Specific Objectives
The specific objectives of the study include:
1) To determines the effect of product considerations, strategies on sales performance in Debere
Berehan Brewery factories,
2) To determine the extent of price effect on sales performance in Debere Berehan Brewery
factories,
3) To determine the effect of promotional tools on sales performance in Debere Berehan
Brewery factories,
4) To determine the effect of place on the sales performance in Debere Berehan Brewery
factories,
1.5. Research Questions
In order to investigate the effect of marketing mix strategies on sales performance in Debre
Berhan, brewery factories the study is designed to answer the following questions
1) What is the effect of product considerations, strategy on sales performance in Debere Berehan
Brewery factories?
8
2) What is the effect of price on sales performance in Debere Berehan Brewery factories?
3) What is the effect of promotion on the sales performance in Debere Berehan Brewery
factories ?
4) What is the effect of place on sales performance in Debere Berehan Brewery factories ?
1.6.Research Hypothesis
The hypothesis states the anticipated answer to the problems in which it stated. In order to
achieve the purpose of this study the following hypotheses are considered to be tested by using
the null, or alternative hypothesis:
H1: Product has a positive and significant effect on sales performance in brewery factories.
H2: Price has a negative and significant effect on sales performance in brewery factories
H3: Promotion has a positive and significant effect on sales performance in brewery factories
H4: Place has a positive and significant effect on sales performance in brewery factories.
1.7.Significance of the Study
This study has been of significance to Debere Berehan Brewery factories. The study was focused
on how marketing mix strategies in order to enhance, maintain and attract customers and to
maximize performance .
The study will may assist or helpful in the management of the Brewery factories in their policy
formulating and decision makers to give due emphasis the effect of marketing mix strategies on
sales performance and devise different mechanisms in order to scale up and continuously
upgrade sales performance and to improve factory performance. The study areas will use as a
guideline to address problems and improve their understanding of the effect of marketing mix
strategies on sales performance at brewery factories and other brewery factories which have
similar problems can also extrapolate its findings. Since, making an idea about the effect of
marketing mix strategies on sales performance brewery factories, managers and owners, which
are the center of product quality a necessary adjustment in the delivery of the brewery factories
which is eventually led to improvement is product quality and it provides solutions for the

9
brewery factories quality, price problems and it may give an idea of where they are presented in
terms of their performance and what should do in the future.
Finally, it will serve as a reference for further researchers for those who have an interest in
relation to this area and it helps the researcher to acquire knowledge and skills and other
researchers who want to undertake studies at the effectiveness of marketing mix strategies on
sales performance in brewery factories at Debre Berhan city.
1.8.Scope of the Study
The study was limited to the effect of marketing mix strategies especially the 4Ps on sales
performance in case of brewery factories in Deber Berhan city which are fulfilled the standard
the brewery factories. Therefore, it cannot be considered as a typical of the whole brewery
factories in Ethiopia rather the generalization of study findings and conclusion drawn is limited
to the select brewery factories. The major focus was given to these selected effect and drawbacks
and challenges on sales performance. This was helped us see how they relate to each other and
combine to effect of the factories, located in North Shewa Zone, Debre Birhan city, from Addis
Ababa 120 km.
1.9.Limitation of the Study
This study on the effect of marketing mix strategies on sales performance in brewery factories.
Among the major limitation the study was conducted on the factories sides which uncover the
other brewery factories such as, government regulation on factories and this factor limited to the
outcome of the research. There was being lack of cooperation in some respondents and
management bodies during distributing the questionnaire and carelessly filling. In addition, the
researcher only included four marketing mix strategies; however, other variables may have effect
on sales performance.
1.10.Definition of Key Terms
Market : is one of the many varieties of system, institution, procedures, social relations and
infrastructures whereby parties engage in exchange. It is a regular gathering of people for the
purchase and sales of provisions and other commodities.
10
Marketing : is the activity, set of institution and procedures for making, communicating,
transporting and exchanging offerings that have value for customers, clients, associates and
society at large. It is the study and management of exchange relationships.
Strategy: is the generally involves setting goals, determining actions to achieve the goals and
mobilizing resources to execute the actions . It is a plan of action designed to achieve a long –
term or overall of economic strategy.
Sales performance: refers to the ability of a company’s sales professionals to “win” at each
stage of the customer’s buying process, and the speed at which each task in the sales process is
performed.
Marketing mix elements: the set of controllable tactical marketing tools product, price, place,
promotion and people that the firm blends to produce the response it wants in the target market.
Product: is anything that can be offered to a market for attention, acquisition, use, or
consumption hence satisfying customers want or need (Kotler and Armstrong, 2013).
Price : According to Kotler and Armstrong (2008) price is the sum of all the values that
customers give up to gain to the benefits of a product or service.
Accourding to Kanoga (2016), place is the process where organizations decide where to
locate their stock and how many supplies to have at the convenience of the customers .
Promotion: is all activities undertaken to communicate and promote products or services
to the target market (Armstrong, 2008).
Brewery factories : is a business that makes and sells beer.
1.11.Organization of the Study
The study was organized in five chapters. The first chapter introduces background, statement the
problem, objective and research question, hypothesis, significance, scope, limitation,
organization of the study and Definition of key terms. The second chapter was included different
reviews related literatures which consist of theoretical background, important empirical findings
and gaps presented to create depth understanding towards the subject under study. Chapter three

11
is concerned with the methodological part that was applied in the study was the research design,
population and, methods of data analysis.
Chapter four contained results ,analysis and discussions from the study supported with finging
from the research work. Chapter five focues on main findings, summary, conclusions and
recommendations of the study. Lastly the researcher attached the references and appendices
sections.

12
CHAPTER TWO
LITERATURE REVIEW
2.1.Introduction
This chapter gives an overview of literatures that are related to the research problem and it
introduces literature thought like concepts of marketing, marketing mix strategies and sales
performance. It also includes other empirical studies done with the conceptual framework
relating sales performance and marketing mix strategies.
2.2.Theoretical Foundation
Walker (2008) defined marketing is as a function of an organization with distinct process that
creates, communicate and also ensure that they deliver value for the customers and to manage the
Customer relationship in a way which are vital for the organization as well as the stakeholders.
Accourding to Palmer (2011) also defined the concept of marketing mix it’s the associated to a
number of developments in the history of marketing mix strategies .
2.3.The Concept of Marketing Mix Strategies
McCarthy (2011) defined strategies as a direction and scope for an organization in meeting long
term objectives by configuring its resources in the present dynamic business environment. The
American Marketing Association (2008) stated that marketing mix as a mix of controllable
marketing variables or tactics available to managers. According to Walker (2008) firms seek
competitive advantage and interaction through a well-integrated program of marketing mix
elements. A marketing mix model relates some measure of marketing performance such as sales,
market share and profitability to variables that describe in the marketing mix elements.
Accordingly, the importance of these strategies is critical to a firm, as it outlines the means of
achieving the organizational objectives. To achieve the objectives, the marketing mix has to be
constantly reviewed since the external environment is constantly changing. It can also change
due to change in customer preferences and taste, change in lifestyle, innovation and technology.
13
2.4.The Concept of Sales Performance
Sales performance is a direct inducement that offers an extra value or incentive for the product to
the sales force distributors or consumer with the primary objective of create an immediate sales
(Zhang and Tang,2010). Sale performance is increasing or at least monitoring sales volume, the
marketing department must appraise consumer desires and the marketing effort required to move
adequate and sufficient volume of products and services at adequate prices. Maintaining an
effective or appreciable presence in the marketplace through the market share which provides
management with a measure of the organization’s competitive positive in the marketplace, which
in turn is an indication of strength or weakness.
According to Jackson (2004), Sales performance is a degree of involvement of a company’s sales
functions to its corporate aims and objectives. Effective marketing requires strategic decisions
that successfully integrate the firms marketing program. Marketing strategies are plans and a
scheme which management hopes to get its products or services to consumers. Important
considerations in marketing strategies are marketing mix and target market. The marketing mix
consists of the product, price promotion and place (distribution). These virtually cover the whole
process of production from product designs to sale of the product.
2.5.Marketing Mix Strategies
McCarthy (2011)defines strategy as a direction and scope for an organization in meeting long
term objectives by configuring its resources in the present dynamic business environment.
According to Nagle & Holden (2012) strategy is an underlying concept in strategic management.
However, the marketing mix are a set of controllable or the tactical tools in marketing
which are used by an organization to meet the needs and demands in the target market.
That the target market positively influence their product demand. Firms who aspire to
meet the customer needs often have to focus on understanding the customers and
developing appropriate strategies to improve their performance. The following section
provides a discussion based on the 4Ps of marketing mix strategies.

14
2.5.1.Product Strategy
Kotler and Armstrong (2013) noted that product is anything that can be offered to a market for
attention, acquisition, use, or consumption hence satisfying customers want or need. According
to Ferrell (2005) assert that product is a marketing mix strategy in which organizations offer
consumers symbolic and experiential attributes to differentiate products from competitors.The
company’s product is the essential element in the marketing mix as it delivers the functional
elements that are established by the customer. The product itself will be one of the main drivers
on a consumer’s decision whether to purchase a certain vehicle and therefore has a major effect
on sales performance.
Product Quality
Product quality is the overall characteristics of a product that allow it to perform as expected in
satisfying customer needs (Jean F, 2004). Level of quality is the amount of quality possessed by
a product and consistency of quality is the degree to which a product is the same level of quality
overtime. It can also be likened across competing products. The group of features and
characteristics of a profitable good which determine its desirability and which can be controlled
by a producer to meet confident basic requirements. Most industries that produce goods for sales
have a product quality or declaration department that monitors outward products for consumer
acceptability.
Labeling
According to McDonald, (2004), label is a tag or transfer committed to a container or package
that provides information about the seller or the manufacture. Labeling performs several
functions:
To identifies the product or brand and might too score the product.
To take such information as who complete it, where it was complete, when it was made,
what it contains, how is it to be used, and how to use it safety . But one thing what we
have to know is that confusing information is prohibited action. So, careful labeling
should be necessary for the factory.
15
Product Packaging
Packaging is the activity of designing and producing the bottle or covering for a product
(McDonald, 2004:90). Later in new times, packaging has become a potential marketing tool, a
firm needs to plan the package for the safety of the product, to make the product identifiable, and
to make it more appealing so to increase profit. According to Ampuero and Vila (2006), product
package contains visual and sensual attributes which communicate to consume. A product
package is a container that has a direct contact with the product, protects, preserves and identifies
the product. Good package design requires knowledge of materials, their properties,
manufacturing methods and conversion process (Sehrawet and Kundu, 2007). Package design
not only rises the perceptibility of the product it also helps in easy recognition of the product. It
also improvements in product packaging revitalize brands leading to increase in sales (Immonen
2010 and Leong, 1998). Package designs has an effect on consumer belief about the products
and consumption beliefs leading to higher purchase decision and increase in sales volume
(Horsky and Honea, 2012).
Branding
According to American Marketing Association’s (2010), brand is a name, term, sign, symbol or
design, or a combination of name, term, sign, symbol or design to differentiate goods and
services from competitors. Green et al (2014) state that organizations use brands to tell who they
are, how they want people or market to perceive them and how the organization wants to be.
Brand is a name, a word, letter or a combination of all of these terms that are used to differentiate
organizational products from its competitors. According to Zhang (2015), brand identity
influences band equity thus creating customer appeal and visual image about a particular brand.
Brand is a name attached to a product or service. Deborah (2016) conducted a research on the
effect of branding on organizational performance in the retailing of pharmaceutical products, on
the mediating role of customers. It was revealed that findings, branding had a positive significant
effect on organizational performance. performance.
16
2.5.2.Price Strategy
According to Kotler (2007), price is a cost of producing, delivering and promoting the product
charged. According to Jain (2004), pricing is the process where an organization determines what
it will receive in exchange for its product after factoring in manufacturing costs, marketplace,
competition, market condition and quality of product . Price is the maximum sensitive element of
marketing mix and it needs of money that customers pay for distributed products. Pricing is the
only element in marketing mix that creates income whereas the other elements are costly.
This is partially because price might have an effect on sales volumes. Price is also high, and the
market is competitive, sales may be correspondingly cheap(Jean F, 2004). Definitely, many
economists would see price as the main determinants of sales volume. “On the other hand, many
of the most sophisticated marketers have found ways to reduce the impact of price. Therefore,
you need to balance the costs of producing a product with competition and the perception of your
target customers to select the right product price. That is the cause why pricing takes creativity,
time, research, good record trust and flexibility. This Price consists of themes such as Trade
Discount, Quantity Discount, Cash Discount, Seasonal Discount and Trade Allowances (Kotler
& Armstrong, 2010).
Trade Discount
Members of supplier’s distribution chain (for example retailers and wholesalers) will demand
and payment for their services (Kotler and Armstrong, 2010, pp. 29-30).
Quantity Discount
These who offer to buy larger quantities of the product or service are frequently given
incentives). Sellers use the quantity reduction to encourage buyers to purchase more. This in turn
can help the seller to reduce their own production costs, which can help reduce price for the
buyers (Kotler and Armstrong, 2010, .pp. 31).
17
Seasonal Discount
Suppliers to markets which are highly seasonal (such as holiday market) will often price their
product or service to match the day and with the highest prices at peak demand (Kotler and
Armstrong, 2010, pp. 35- 36).
Penetration Pricing
According to Nagle (2006), penetration strategy is the process of charging a low price to product
or services hence penetrate the market. Penetration pricing is the process of setting a price at a
lower price for new products or service hence breaking even the technique can also is used by
organizations to look for new market for an existing product. Accourding to Jim (2012) noted
that penetration pricing is used to support the launch of a new product, and when a product
enters a market with relatively little product differentiation and where demand is price
elastic.
According Lamb, Hair and McDaniel (2004), penetration pricing is a technique of setting a low
price on a new product hence attracting customers to try company’s products and services.
Penetration price is setting low price for new products hence reaching a wider mass market and
acquiring more market share. Penetration pricing is used when price of demanded product is at a
level that will enable an organization increase sales volume (Szymanski and Henard, 2001).
2.5.3.Place Strategy
Place is defined as a set of interdependent organizations involved in the process of making a
product or service available for consumption or use (Gorchels, West, and Marien, 2004).
Distribution channel can also include physical movement, warehousing, ownership of the
product, presale transaction, post-sale activities; order processing, credit and collections; and
other different types of support activities (Gorchels et al 2004).
Place is the process of making a product or service accessible for use or feeding by a consumer
or business user, by direct means, or by indirect means with intermediaries. According to
Schoviah (2012) conducted research on the effect of marketing distribution channel strategies on
a firm’s performance among Brewery factories in debere birehan. Findings revealed that

18
marketing distribution strategies increased sales, market share and profits. Place or distribution is
the set of interdependent organizations involved in the process of making a product available for
use or consumption by consumers (Kotler and Armstrong, 2006).
Channel of Distribution
Channel of distribution consists of a network of intermediaries those managers that manage the
flow of goods and services from the producer to the final customer. The distribution system
consists of channel intermediaries that provide a link between producers and final consumers.
The idea that marketing system uses channels that maximizes efficiency and effectiveness,
minimizes costs, and delivers the greatest customer satisfaction (Kotler and Armstrong, 2010:pp:
87). Merchant middlemen: include merchant wholesalers and retailers who take title to and resell
the goods.
Physical Distribution
Physical distribution includes planning, implementing, and controlling the physical movements
of resources and final goods from points of origin to points of used to happen customer needs at
a profit (Engle, 2009: pp. 196). The initial point for designing the physical delivery system is to
study what customers want and what competitors are offering. There are a number of decisions
that should be accepted by the marketing managers of an organization concerning physical
delivery that affect customer satisfaction. Physical distribution begins with a customer order. The
direction division makes multi duplicate invoice and dispatches them to various divisions. Items
out of stock are back ordered. Shipped items are attended by delivery and billing documents with
duplicates going to various divisions.
Ware Housing
It involves the physical facilities used primarily for storage of goods held in anticipation of sales
and transfers with in a distribution channel. Every firm has to store its goods while the gap to be
sold. A storage function is essential because production and consumption cycles infrequently
match. The firm must decide on a desirable number of stocking locations.
19
Transportation
Marketers need to take an interest in their company’s transportation decisions. The choice of
moving transporter will affect the pricing of the products, on-time delivery performance and the
situations of the goods when they reach all of which affect customer satisfaction (Palmer,
2000:405-410).
Geographic Location
According to Schiele (2008), geographic location has a significant influence on firm’s profit
margin and success. This might be due to availability and proximity of raw materials and labor,
proximity to customers and competitors, infrastructure and transportation costs. Nguyen,
McCracken, Casavant, and Jessup, (2011), conducted research on geographic location,
ownership and profitability of Washington log trucking companies.
2.5.4.Promotion Strategy
According to Brrassington and Pettitt (2000), promotion is a direct way in which companies
communicate their products or services to their target customers. Kotler and Armstrong (2008)
assert that promotion is all activities undertaken to communicate and promote products or
services to the target market. Promotional mix includes advertising, sales promotions, personal
selling and publicity. Accourdng to Kamba (2010) in his research on effectiveness of promotion
mix methods on sales in local pharmaceutical manufacturing companies in debere birehan city.
Promotion strategies are concerned with the planning, implementing and control of persuasive
communication with customers. Modern marketing calls for more than emerging a good
product, pricing it well and making it accessible. Companies must also communicate with
current and possible investors as well as the public. For most companies, question is not
whether to communicate but rather what to say, to whom, and how often.
Promotional Mixes
Each promotional instrument has its own unique features and prices. These strategies may be
designed around advertising, personal selling, sales promotion and publicity.
20
Advertising
According to Abiodium (2011), advertising is a non-personal paid form of “communication
about an organization or its product to a target audience through amass broadcast medium by an
identified sponsor. Advertising is a non-personal communication strategy that is directed at
target audience through various media in order to present and promotes products, services and
ideas. Advertising is a strategy used by organizations to inform, remind and persuade customers
to purchase a product. It is also used to present product, ideas and reach targeted customers.
Advertising is any paid form of non-personal communication about an organization, good,
service or idea by an identified sponsor (Berkowitz, Kerin, Hartley and Rudelius, 2000).
Brassington&Pettitt (2000) define advertising as any paid form of non-personal communication
directed towards target audience and transmitted through varies mass media to promote
product, services or idea. Firm methods of advertising (TV advertising) characteristically require
a large budget, whereas other forms (newspaper advertising) can be done on a minor budget. In
developing an advertising program, successful firms start by classifying the target market and
buyer motives.
Sales Promotion
According to Guiltian and Paul, (1982), Sales promotion is the economical and informational
motivations, which are offered by firms to buyers or distributors. According to Aham, (2008),
it has the emerged as a response by producers marketers, and marketing strategies alike to
find a short term solution to the problems of additional stock of goods which are available
in variables producers warehouses but are not demanded by consumers and organization . Sales
promotion offer three distinctive benefits:
Communication they gain consideration and usually deliver information that may lead
the consumer to the product.
Motivation they incorporate some concession or stimulus that gives worth to the
consumer
Invitation they include a distinct invitation to engage in the transaction now.
21
Sales promotion is a strategy that is used by companies to promote sales, usage or trial of a
product or service. Organizations use sales promotion along with advertising, public relations,
and personal selling (Schiffman and Kanuk, 2004). Sales promotion is also used by organizations
to achieve a competitive advantage and influence their target customers to purchase their
products .
Sales promotion is a media or non-media marketing strategy used by organizational for a specific
period of time to increase demand, productivity and influence product trial (Kotler and
Amstrong, 2010). Sales promotion is an uninterrupted incentive that offers an extra value or
incentive for the product to the sales force, distributor, or the final consumer with main objective
of creating an immediate sale.
Methods of Sales Promotion
There are many consumer sales promotional techniques available which are summarized as
follows.
Price promotions: Price promotions exist too commonly known as price discounting. These offer
either (1) A discount to the standard selling price of the product or (2) Additional of the product
at the standard price. Enlarged sales increased from price promotions are at the expense of
damage in profit-so these promotions must be used with care.
Coupons: Forms are another, very adaptable, way of offering a reduction. The key objective with
a token promotion is to exploit the redemption rate-this is the proportion of customers really
using the coupon. One problem with coupon is that it may simply encourage customers to buy
what they would have bought anyway
Sales promotional letters: Several companies utilize the medium of letters for sales promotion.
These letters serve different purposes. Sometimes they are used to giving information about the
company's products, at other times; they are used as reminders for the customers to continue to
buy a particular brand.
22
Customer service programs: At times, the company organizes and conducts customer service
programs or camps with the aim of providing service to the customers at different points of
purchase.
Demonstrations: Companies do product demonstrations for sales promotion, especially when
they are introducing a new product in the market. Demonstrations are usually used for low unit
price products like washing powder or high unit price products like washing machines and
vacuum cleaners. Demonstrations may be organized at the retail stores by the company salesmen
for the benefit of retailers as well as consumers.
Public Relations
According to Brassington&Pettitt (2000) the core of public relation is to look after the
nature and quality of relationship between the organization and its different public and to
create a mutual understanding. Public relation covers a range of activities, for example the
creation and maintenance of corporate identity and image; charitable involvement, such as
sponsorship and community initiatives, media relation for the diffusion of goods news as
well as for emergency management such as harm limitation.
According to Kotler (2004), public relation is building good relation with the company’s various
public by obtaining favorable publicity, building up a good corporate image, and handing or
heading of unfavorable rumors, stories and events. Public relation is used to promote products,
people, ideas, and activities, organizations and even nations. Public relation can have a strong
effect on public awareness at much minor cost than advertising container. The company does not
pay for the space and time in the media. Public relations or PR can become a significant topic
once you put physically in a location of public visibility. Ordinary people do not have this kind
of worries but for people such as celebrities, sports superstars, politicians and businessmen it is
an important consideration.
Direct Marketing
Direct marketing is a direct communication strategy used by organizations to target their
customers thus gets an immediate response. Direct marketing campaign accesses huge recorded
database to build profiles of potential customers and provide valuable marketing information for

23
effective direct targeting. It involves activities like direct mail, telemarketing, database
management, direct response advertisements through the direct mail, the internet and various
broadcast and print media (Belch, 2003, Hesse et al, 2007). Direct Marketing is divided into two
elements, namely building a quality database over a long period and cost monitoring and
controlling. The controlling elements indicate that there is much control given to the marketer as
opposed to Social Media which puts control in the hands of the consumers. Scholars suggest that
the main aim of direct marketing is to stimulate the targeted audience to take a no action, and
create an individualized customer relationship (Hesse, et al., 2007, Percy, 2008). A study by
Aliata et al. (2012) revealed that there was a positive relationship between promotional
strategies; direct marketing, sales promotion, personal selling, advertising and viral marketing on
expenditure and bank performance. Cheruiyot and Peter (2016) result study discovered that
direct marketing advertising, personal selling, sales promotion, and public relations enhance the
company's performance by enhancing customer attraction, customer loyalty, sales volumes,
branch expansion and reminding customers
Personal Selling
Brassington&Pettitt(2000) define personal selling to be a two-way communication tool
between a representative of an organization or individuals or group, with the intention to
inform, persuade or remind them, or sometimes serve them to take appropriate action.
Personal selling is a key element in promotion, one of the four Ps in the marketing
mixes. Personal selling has three distinctive qualities:
Personal confrontation it involves an immediate and interactive relationship between
two or more persons.
Cultivation it permits all kinds of relationships to spring up, ranging from a
matter-of-fact selling relationship to a deep personal friendship .
Response it makes the buyer feel under some obligation for having listened to the
sales talk.
The function of personal selling is to provide the specific inputs which advertising, or non
personal, cannot offer at the individual level. It should be remembered that advertising and

24
personal selling are complementary activities, and that their relative importance will vary
depending up on the nature of the product and the buying behavior associated with (Baker,
1996).
2.6.Marketing Mix Strategies and Sales Performance
According to Silva (2006), different marketing strategies have different effects on organizational
sales performance, product as anything that can be offered to a market for consideration, gaining,
usage, or consumption that capacity satisfy a want or need. They further defined a consumer
product as the product bought by the final consumer for personal consumption. Consumers buy
products. Marketing is a major issue in business performance and innovation with significant
influence on business strategy. Good marketing supports sales and expansion and contributes
significantly to the growth of market share in competitive markets (Marjanova & Stojanovski,
2012). Taiwo et al., (2010) found that strategic marketing practices have a significant impact on
performance variables and that they interact with the different components to facilitate
performance. Santos-Vijande et al., (2012) also analyzed the organizational antecedents of
marketing capabilities and their impact on business performance and established that marketing
capabilities exert a significant and positive effect on customers satisfaction and reliability, which
ultimately key to better organizational performance in terms of sales, profit, and market share.
2.7.Empirical Review of Marketing Strategies
In this part, the researcher wills try to analyze and discuss different findings or studies regarding
to the effect of marketing mix strategies on sales performance.
According to Mwenda Gituma(2017), conduct to study on the effects of marketing mix on sales
performance in case of unga feeds limited. Result of Product and place has positive and
insignificant effect on sales performance price has negative and insignificant effect on sales
performance. karimi (2015), which are the Product, and promotion has positive and significantly
. But price and place has negative and insignificantly effect on sales performance. Caroline
(2017, conduct on effects of Marketing Strategies on sales performance of small and medium
enterprises in Kenya. The rsearcher to conduct marketing mix, such as, product, price, place and
promotion have strong positive and statistically significantly effect on sales performance.
25
Neema omary seukindo (2012), to conduct the effect of marketing communication mix on sales
performance of soft drink companies in dar es salaam, Tanzania. The variables are difference
due to all are promotion mix elements.The study established the effect of marketing mix
strategies on sales performance. Joyce Frank (2015), the effect of marketing mix (4Ps) on sales
performance of Tigo Telecommunication company in Tanzania. There is no shown implication
of the finding based on correlation or regression coefficient. Ebitu (2016) researched on
marketing strategies and the performance of small and medium enterprise in AkwaIbom State
Nigeria. It was established that product quality strategy and relationship marketing strategy has a
positive and significant influence on sales performance.
Mokaya (2012) looked at the effect of market positioning on organizational performance in the
airlines industry in Kenya; case of Kenya airways. They used the research design called
explanatory design and they found the following. Within the general segmentation-targeting-
positioning Framework in a company and positioning plays a pivotal role in marketing strategy,
since it links market analysis, segment analysis and competitive analysis to internal corporate
analysis. The measures of performance that affect marketing positioning strategies at the
company include employee turnover, increase in assets, increase in products, increase in
revenue/profitability. Kiprotich (2013), conduct the study on effects of 4ps marketing mix
satrategies on sales performance of automotive fuels of selected service stations in Nakuru
town. The oil marketers‟ performance is significantly influenced by the 4 ps. Each of the
elements however carries a unique contribution to sales performance of automotive fuels in the
selected stations in Nakuru town. Abdul (2009), did a research on business strategy of
manufacturing firms in Malaysia he used the structured questionnaire method. The researcher
found out that innovative differentiation strategy which includes technological superiority of
items and new items improvement and use of advanced communication strategies is most
adopted by the SMEs exporters.
Generally, from above literature reviews, previous studies have established effect of marketing
mix strategies on sales performance; however each of independent variables (Marketing mix
Strategies) affected sales performance at different percentage rate.
26
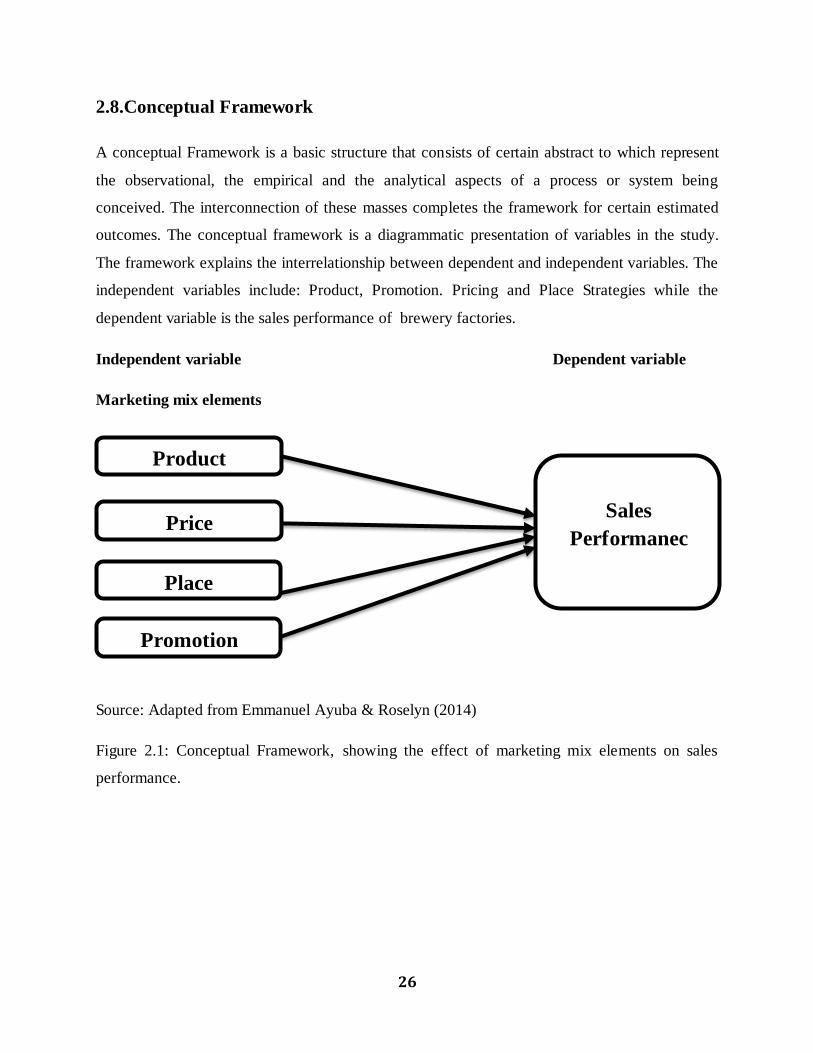
2.8.Conceptual Framework
A conceptual Framework is a basic structure that consists of certain abstract to which represent
the observational, the empirical and the analytical aspects of a process or system being
conceived. The interconnection of these masses completes the framework for certain estimated
outcomes. The conceptual framework is a diagrammatic presentation of variables in the study.
The framework explains the interrelationship between dependent and independent variables. The
independent variables include: Product, Promotion. Pricing and Place Strategies while the
dependent variable is the sales performance of brewery factories.
Independent variable Dependent variable
Marketing mix elements
Source: Adapted from Emmanuel Ayuba & Roselyn (2014)
Figure 2.1: Conceptual Framework, showing the effect of marketing mix elements on sales
performance.
Product
Price
Place
Promotion
Sales
Performanec

27
CHAPTER THREE
RESEARCH METHODOLOGY
3.1.Introduction
Research is simply the process of finding solutions to a problem a thorough study and analysis of
the situational factors (sekaran, p-19,2003). It is search for knowledge. One also defines research
as a scientific and systematic search related information on specific topic.
This part of the research deals with the overall approach of the research. And it includes,
Description of the study area, research design, research approach, target population, census
method, sources of data, method of data collection, method of data analysis, model of
specification, descriptive analysis, econometric analysis, description of variables, model
diagnostic test, validity, reliability, and ethical consideration.
3.2.Description of the Study Area
The study was focused on the effect of marketing mix strategies on sales performance in case
Debere Berehan brewery factories. This study mainly covers the 4Ps, marketing mix strategies
such as product, price, place and promotion. The study was conducted on the selected brewery
manufacturing factories in Deber Berhan city. This brewery factories creates job opportunity for
about 127 employees only sales, marketing and production daprtments in brewery factories.
3.3.Research Design
A research design is the arrangement of conditions for collection and analysis of data in a
manner that aims to combine relevance to the research purpose with economy in procedure
(Kothari, 2004). A research design is also a plan for study that provides specification of
procedures to be followed by the researcher in order to achieve the research objective as well as,
to test the hypothesis (McDaniel and Gates, 2006). Adi Bhat(2019), research design is the
background of research approaches and techniques selected by a researcher. For the purpose of
this study, Explanatory research design was employed to explain effect of independent variables,
(marketing mix strategies) on the dependent variable (sales performance).The reason for
28
selecting this design is it establishes causal relationship between variables, to answer research
questions, to measure the degree of association and to test research hypothesis .
3.4.Research Approach
According to Creswell (2009), there are three basic research approach; quantitative, qualitative
and mixed approach. Quantitative approach is an approach in which the researcher determines
what to study asks the respondent close ended questions and gather numeric data from the
respondent and analyze this numbers using statistics Creswell (2005). Quantitative method is a
study involving analysis of data and information that are descriptive in nature and qualified
(Sekaran, 2003). Quantitative research answers questions through a controlled logical process,
allowing for the collection of numerical data, the prediction, and the measurement of Variables.
In order to achieve study objective, this research employed quantitative research approach to
analyze data collect from Debre Berhan brwery factories by employees using close ended
questionnaire.
3.5.Target Population of Study
Population is the total collection of individuals to be study and from which is drawn (Sekaran,
2016). Therefore, the target populations for this study focus on sales, marketing and production
departments employees who perform sales in select brewery factories. According to Debre
Berhan brewery factories there are two brewery factories currently operating. Out of two
brewery factories selected by census methods. Due to this reason the researcher was force so as
to select brewery using census sampling technique. Accordingly, the target population of the
study was 127 employees select brewery factories. But, the targeted populations of the study are
permanent employees of sales, marketing and production departments only, because the study is
the effect of marketing mix strategies on sales performance at Debere Berehan brewery factories.
The purpoes of the study on the effect of marketing mix strategies on sales performances, the
researcher decided to take the whole populations of the sales and marketing departments at the
Debere Berehan brewery factories.
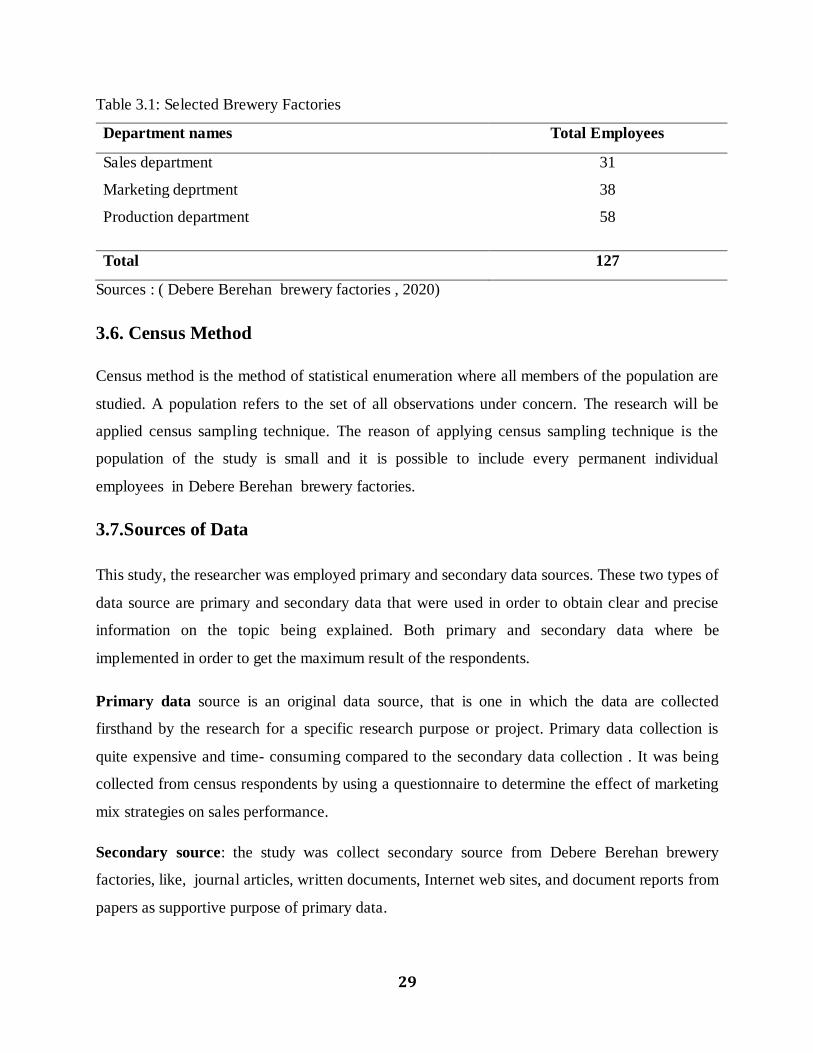
29
Table 3.1: Selected Brewery Factories
Department names Total Employees
Sales department 31
Marketing deprtment 38
Production department 58
Total 127
Sources : ( Debere Berehan brewery factories , 2020)
3.6. Census Method
Census method is the method of statistical enumeration where all members of the population are
studied. A population refers to the set of all observations under concern. The research will be
applied census sampling technique. The reason of applying census sampling technique is the
population of the study is small and it is possible to include every permanent individual
employees in Debere Berehan brewery factories.
3.7.Sources of Data
This study, the researcher was employed primary and secondary data sources. These two types of
data source are primary and secondary data that were used in order to obtain clear and precise
information on the topic being explained. Both primary and secondary data where be
implemented in order to get the maximum result of the respondents.
Primary data source is an original data source, that is one in which the data are collected
firsthand by the research for a specific research purpose or project. Primary data collection is
quite expensive and time- consuming compared to the secondary data collection . It was being
collected from census respondents by using a questionnaire to determine the effect of marketing
mix strategies on sales performance.
Secondary source: the study was collect secondary source from Debere Berehan brewery
factories, like, journal articles, written documents, Internet web sites, and document reports from
papers as supportive purpose of primary data.

30
3.8.Method of Data Collection
The study uses primary data. In this research is a primary sources of data was utilized through
questionnaires from the selected census of respondents/ employees at Debere Berehan brewery
factories. The primary data was collected through a questionnaire which is distributed to
employees of brewery factories. For the purpose of primary data collection, the researchers were
used to closed ended structured questionnaires.
A questionnaire is the necessary primary data would be though the use of questionnaire
transmitted to the respondents of the employees of Debere Berehan brewery factories. A research
instrument is a device for collecting relevant data or measuring the variable which are used for
answering the research question or testing study hypothesis (Dixon-Ogbechi,2002). The
questionnaire were consisted of three parts. One is preparing to gather general information about
the respondents like, gender, age, education, experience, marital status and job titles and part two
is preparing to ask respondents to answer the effect of marketing mix strategies on sales
performance. Part three would be assessed by using a five point lickert scale assign to measure
weighted to as follows:
1 = Strongly disagree, i.e, very unsatisfied with the case described, 2 = disagree, i.e, not satisfied
with the case described, 3 = Neutral, i.e. uncertain with the case , 4= agree, i.e, feeling satisfied
with the case described, 5=Strongly agree, i.e, very much supporting the case described. A
questionnaire was also sub-divided into five sections; demography, Product and sales
performance, price and sales performance, place and sales performance and promotion and sales
performance . The questionnaire design within adapted from mwenda, (2017).
3.9.Method of Data Analysis
The data collect from the respondents was analyze by using descriptive statistics such as mean,
percentage and standard deviation and inferential statistics such as Pearson correlation and
regression analysis. In order to know the strength of relationship between independent and
dependent variable correlation test was employed. Finally, to test the hypothesis, regression and
analysis of variance was employed. In order to determine the effect of marketing mix strategies
on sales performance at Debere Berehan brewery factories.

31
3.9.1.Descriptive Analysis
The descriptive statistical results will presented by the table, frequency distribution and
percentage to give a condensed picture of the data. This will achieve through summary of
statistics, which includes the means and standard deviation values which computed for each
variable in the above study. Additionally, a correlation analysis using Pearson correlation
coefficient was used to examine the effect marketing mix strategies on sales performance.
3.9.2.Econometric Analysis
Multiple linear regression analysis refers to the analysis concerning relationship between the
dependent and independent variables (Kothari, 2004). The accuracy and significance of the
model were determined by using the coefficient of determination, F- tests and the t-test. The tests
were done at a significance level of 5% and 1%. To concerning the effect of dependent and
independent variables, with the multiple regression equation describing the effect. This approach
was used in this study to analyze the effect of marketing mix strategies on sales performance.
3.10.Model of Specification
Model of specification is the process of determining which independent variables to include and
exclude from the regression equation. The model selection often begins when a researcher wants
to mathematically define the effect of independent variables and the dependent variable.The
researchers used more independent variable (sales performance) and independent variable
(marketing mix strategies - product, price, place and promotion ).
The basic objective of using regression equation on this study is to make the researcher more
effective at describing, understanding, forecasting, and controlling the specified variables.
Following, ordinary least square method regression model is specified as,
Where, SP = Sales Performance

32
PRD = Product
PR = Price
PL = Place
PRO = Promotion
β = Unknown Population Parameters (coefficients)
e = Error/Disturbance Term
i = 1, 2, 3, . . ., n
3.11.Description of Variables
Dependent Variable
Sales Performance: is the extent of the quantity of products sold or services sold in the regular
operations of an organization during a specified period,this is five items based on the
questionnaire .
Independent Variables
Product: Product is some goods or services that an organization or factories offer to the market
these are eight items based on the questionnaire.
Price: price is the most important basis for the customer when decided to buy certain products.
Therefore, companies should carefully plan their price because if the price is too high buyers will
avoid the product, as they will believe it to be too expensive, these are seven items based on the
questionnaire.
Place /Distribution: How factories will allocate the product or service, which they presenting to
the consumer is described as place strategy, these are seven items based on the questionnaire.
Promotions: Promotion can be considered as activities that communicate the overall product
which include advertising, sales promotion, personal selling, direct marketing, events and
involvement and public relations, these are eight items based on the questionnaire.
33
3.12.Model Diagnostic Tests
Linearity Test: linearity is the relationship between the dependent and independent variable
represented the degree to which the change in the dependent variable is associated with the
independent variable. In a simple sense, linear models predict values falling in a straight line by
having a constant unit change (slope) of the dependent variable for a constant unit change of the
independent variable (Hair, 1998).
Normality Test: Acourding to Malhotra (2007), normality is the terms of this assumption, a
check for normality of the error term is conducted by a visual examination of the normal
probability plots of the residuals. The offer that normal probability plots are often conducted as
an informal means of assessing the non-normality of a set of data.
Multicollinearity Test: Multicollinearity refers to the situation in which the
independent/predictor variables are highly correlated. The study tested the data to ensure that the
assumption of Multicollinearity is satisfied. According to Hair (1998), suggest use of the
Variance Inflation Factor (VIF) to ascertain multi- Collinearity. For acceptable levels, the VIF
should range between 1 and 10.
Heteroscedasticity Test: in a linear regression model and assumes that the error terms are
normally distributed. It tests whether the variances of the error terms from the regression is
dependent on the value of the independent variables have now the same finite variation of
variables . It is a X2 test.
3.13.Validity and Reliability
Patton (2002), states that validity and reliability are two factors which any researcher should be
concerned about though designing a study, examining results and arbitrating the quality of the
study.
Validity
Healy & Perry (2000), explain that validity determines whether the research really measures that
which it was planned to measure or how truthful the research results. Validity is the extent to
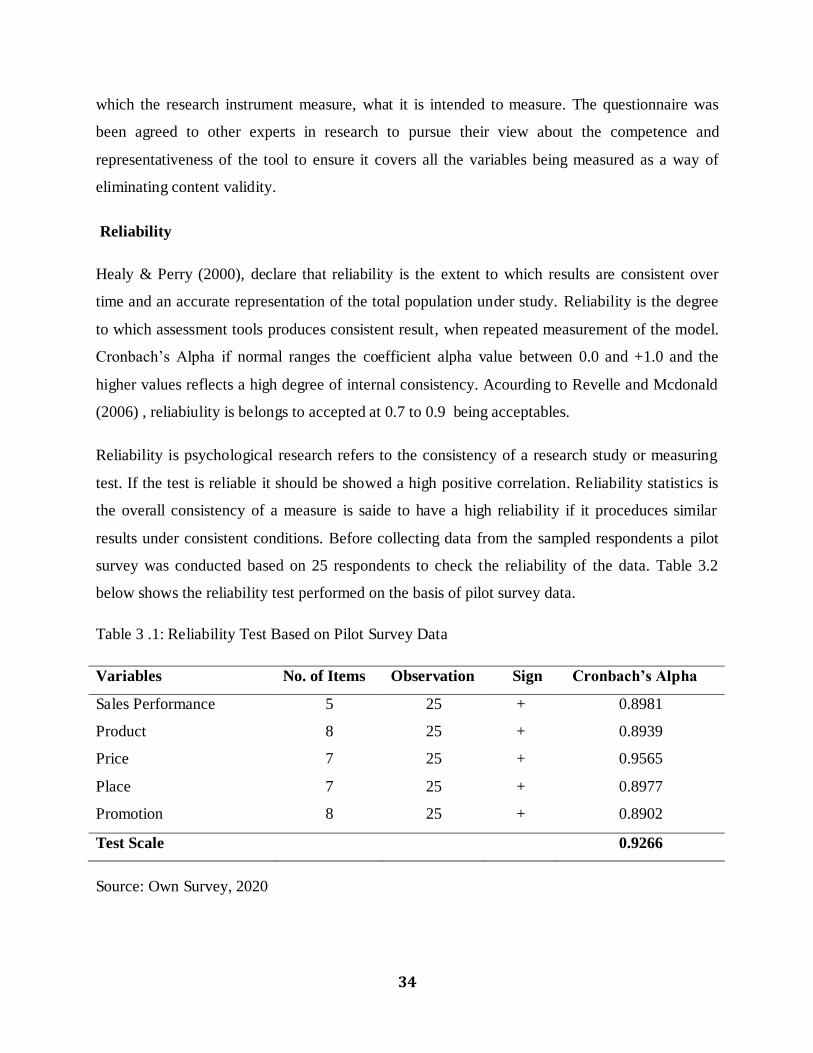
34
which the research instrument measure, what it is intended to measure. The questionnaire was
been agreed to other experts in research to pursue their view about the competence and
representativeness of the tool to ensure it covers all the variables being measured as a way of
eliminating content validity.
Reliability
Healy & Perry (2000), declare that reliability is the extent to which results are consistent over
time and an accurate representation of the total population under study. Reliability is the degree
to which assessment tools produces consistent result, when repeated measurement of the model.
Cronbach’s Alpha if normal ranges the coefficient alpha value between 0.0 and +1.0 and the
higher values reflects a high degree of internal consistency. Acourding to Revelle and Mcdonald
(2006) , reliabiulity is belongs to accepted at 0.7 to 0.9 being acceptables.
Reliability is psychological research refers to the consistency of a research study or measuring
test. If the test is reliable it should be showed a high positive correlation. Reliability statistics is
the overall consistency of a measure is saide to have a high reliability if it proceduces similar
results under consistent conditions. Before collecting data from the sampled respondents a pilot
survey was conducted based on 25 respondents to check the reliability of the data. Table 3.2
below shows the reliability test performed on the basis of pilot survey data.
Table 3 .1: Reliability Test Based on Pilot Survey Data
Variables No. of Items Observation Sign Cronbach’s Alpha
Sales Performance 5 25 + 0.8981
Product 8 25 + 0.8939
Price 7 25 + 0.9565
Place 7 25 + 0.8977
Promotion 8 25 + 0.8902
Test Scale 0.9266
Source: Own Survey, 2020
35
According to the test resut obtained in Table 3.2 above, the Cronbach’s alpha coefficient of each
variable involved in this study ranges between 0.8902 and 0.9565, implying that the items
employed to conduct this study are highly reliable. Therefore, the questionnaire that was
designed to collect the data from the sampled respondents is highly reliable.
3.14.Ethical Considerations
In the first place, the department were accepted the thesis research. In adding, the researcher
followed logical events in every phase of data collection procedures. In this research study,
issues relating to the ethical conduct of research, such as informed consent, confidentiality and
anonymity would be supported. According to Saunders et al, (2009), ethics are the norms or
standards of behavior that guide moral choices about our behavior and our relationships with
others. Participants and respondents was being given full information on the purpose and
objectives of the study in order for them to make informed decisions as to whether to partake or
not. Moreover, all information concerning the identity and personality of respondents was being
treated with utmost confidentiality. Additionally, all information gathered would be used for the
sole purpose of this research study.
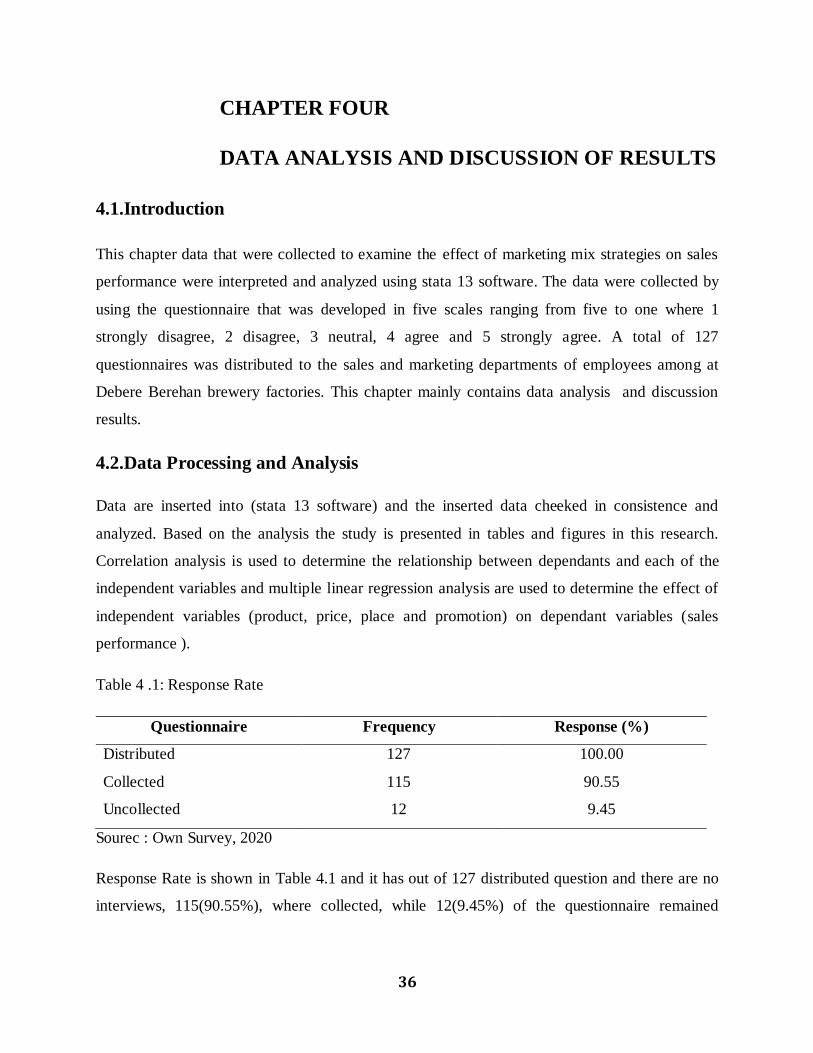
36
CHAPTER FOUR
DATA ANALYSIS AND DISCUSSION OF RESULTS
4.1.Introduction
This chapter data that were collected to examine the effect of marketing mix strategies on sales
performance were interpreted and analyzed using stata 13 software. The data were collected by
using the questionnaire that was developed in five scales ranging from five to one where 1
strongly disagree, 2 disagree, 3 neutral, 4 agree and 5 strongly agree. A total of 127
questionnaires was distributed to the sales and marketing departments of employees among at
Debere Berehan brewery factories. This chapter mainly contains data analysis and discussion
results.
4.2.Data Processing and Analysis
Data are inserted into (stata 13 software) and the inserted data cheeked in consistence and
analyzed. Based on the analysis the study is presented in tables and figures in this research.
Correlation analysis is used to determine the relationship between dependants and each of the
independent variables and multiple linear regression analysis are used to determine the effect of
independent variables (product, price, place and promotion) on dependant variables (sales
performance ).
Table 4 .1: Response Rate
Questionnaire Frequency Response (%)
Distributed 127 100.00
Collected 115 90.55
Uncollected 12 9.45
Sourec : Own Survey, 2020
Response Rate is shown in Table 4.1 and it has out of 127 distributed question and there are no
interviews, 115(90.55%), where collected, while 12(9.45%) of the questionnaire remained
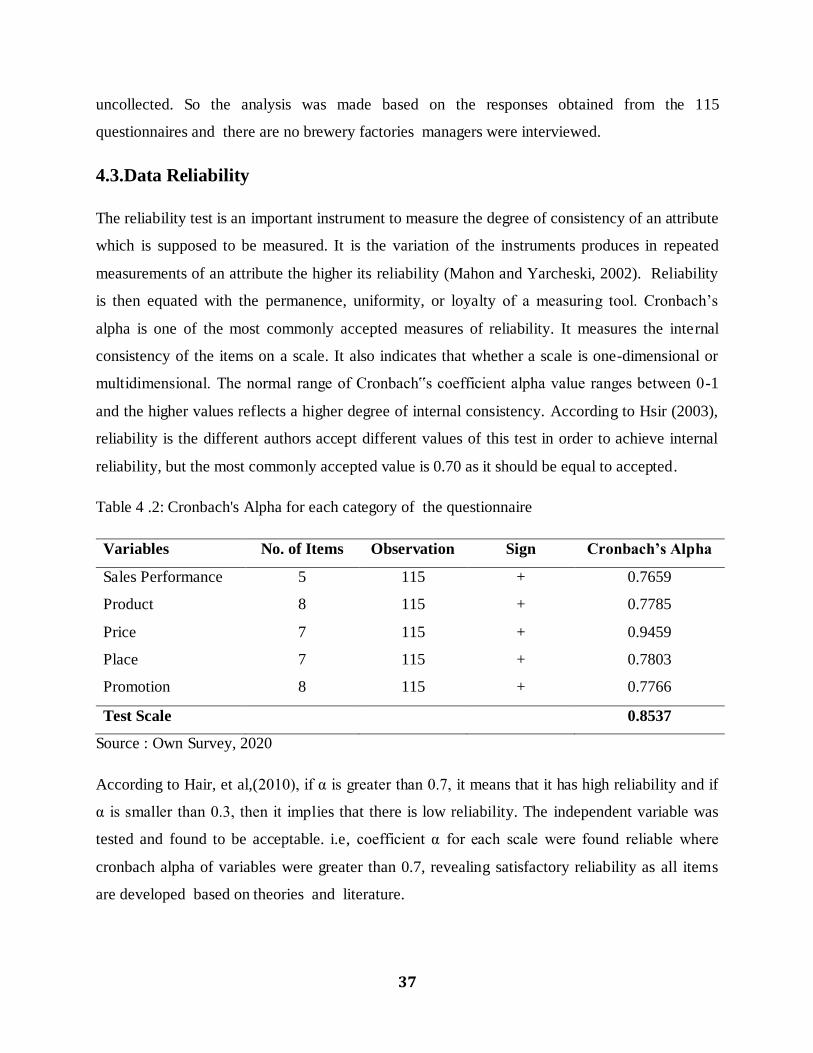
37
uncollected. So the analysis was made based on the responses obtained from the 115
questionnaires and there are no brewery factories managers were interviewed.
4.3.Data Reliability
The reliability test is an important instrument to measure the degree of consistency of an attribute
which is supposed to be measured. It is the variation of the instruments produces in repeated
measurements of an attribute the higher its reliability (Mahon and Yarcheski, 2002). Reliability
is then equated with the permanence, uniformity, or loyalty of a measuring tool. Cronbach’s
alpha is one of the most commonly accepted measures of reliability. It measures the internal
consistency of the items on a scale. It also indicates that whether a scale is one-dimensional or
multidimensional. The normal range of Cronbach‟s coefficient alpha value ranges between 0-1
and the higher values reflects a higher degree of internal consistency. According to Hsir (2003),
reliability is the different authors accept different values of this test in order to achieve internal
reliability, but the most commonly accepted value is 0.70 as it should be equal to accepted.
Table 4 .2: Cronbach's Alpha for each category of the questionnaire
Variables No. of Items Observation Sign Cronbach’s Alpha
Sales Performance 5 115 + 0.7659
Product 8 115 + 0.7785
Price 7 115 + 0.9459
Place 7 115 + 0.7803
Promotion 8 115 + 0.7766
Test Scale 0.8537
Source : Own Survey, 2020
According to Hair, et al,(2010), if α is greater than 0.7, it means that it has high reliability and if
α is smaller than 0.3, then it implies that there is low reliability. The independent variable was
tested and found to be acceptable. i.e, coefficient α for each scale were found reliable where
cronbach alpha of variables were greater than 0.7, revealing satisfactory reliability as all items
are developed based on theories and literature.

38
From the above Table 4.2 ,the effect of price on cronbach α is 0.9459 , therefore ,the reliability is
good. The next have product, place, promotion and sales performance the values of cronbach α is
0.7785, 0.7803, 0.7766 and 0.7659 to respectively. Therefore ,the reliability is acceptable. The
total test scale of cronbach α is 0.8537, for the entire questionnaire which indicates very good
reliability. So, based on the test, the results are reliable.
4.4.Demographic Characteristics of Respondents
This part commences with the analysis of the demographic data gathered from the respondents
using frequencies and percentages. Accordingly, the general respondents‟ characteristics,
including, sex, age, education, marital status, experience and job title.
Table 4 .3: Demographic Profiles of the Respondents
Respondents’ Characteristics Categories Frequency Percent
Sex
Male 84 73.04
Female 31 26.96
Total 115 100.00
Age
<=30 Years 38 33.04
31 – 35 Years 43 37.39
36 – 40 Years 22 19.13
>40 Years 12 10.43
Total 115 100.00
Education
Certificate 0 0.00
Diploma 3 2.61
Degree 96 83.48
Master and Above 16 13.91
Total 115 100.00
Marital Status
Single 22 19.13
Married 92 80.00
Divorced 1 0.97
Total 115 100.00

39
Work Experience
<=4 Years 30 26.09
5 – 7 Years 55 47.83
8 – 10 Years 17 14.78
>10 Years 13 11.30
Total 115 100.00
Job Title Manager 16 13.91
Non-Manager 99 86.09
Total 115 100.00
Source : Own Survey, 2020
From the above Table 4.3, based on demographic profile, the sex of the respondents was
(73.04%) of the respondents were male and the remaining (26.96 %) of the respondents were
female. This specified that out of 115 respondents around 84 were male and the remaining 31
were female. Therefore, the study comprises both male and female at Debere Berehan brewery
factories. Regarding the age of the respondents, most of (37.39 %), the respondents who
participated in this study are in between the age of 31-35 years. Moreover, 33.04% are from less
than equal to 30 years old. The remaining 19.13% are from 36-40 years and 10.43% are above 40
age respectively. Since, this shows that the majority of respondents’ age categories from 31-35
years to understand the questionnaires.
Regarding the educational level of the respondents, 83.48%, 13.91% and 2.61%, BA/ degree,
master, diploma, and 0% certificate respectively. From this, the respondents able to measure the
level of sales performance by the variable indicated in the questionnaire. And the marit00al
status of the respondents, 80.00% are married and 19.13% are single and the remaining 0.975 %
are divorced. Regarding the majority of the respondents worked experience in the organization
(5-7) years, which counts of 55 (47.83%) respondents, followed by 30 (26.09%) respondents
have been attached to the range of under 4 years, 17 (14.78%) respondents attached to the 8-10
years. However, only 13 (11.30%) of respondents have attached to DBBF for more than 10
years. Finally, to the job category of a majority of the respondents are in non-managerial
position, those are 99 (86.09%) respondents and the remaining 16 (13.91%) at the DBB.
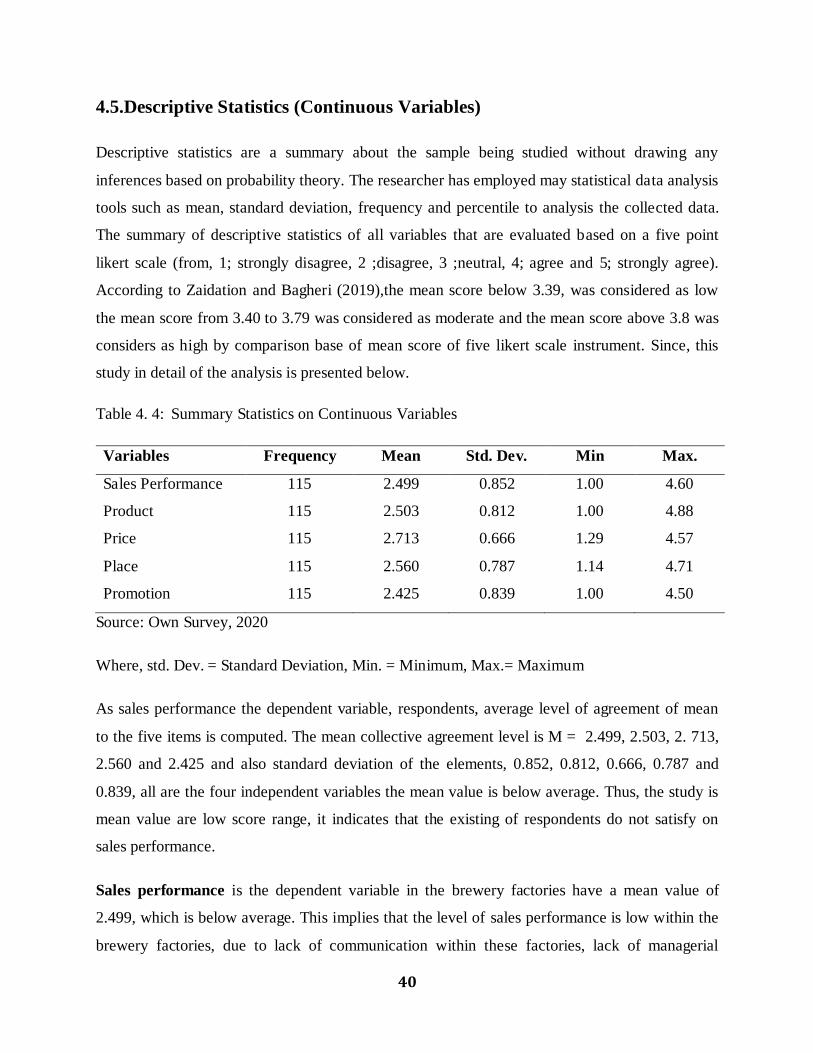
40
4.5.Descriptive Statistics (Continuous Variables)
Descriptive statistics are a summary about the sample being studied without drawing any
inferences based on probability theory. The researcher has employed may statistical data analysis
tools such as mean, standard deviation, frequency and percentile to analysis the collected data.
The summary of descriptive statistics of all variables that are evaluated based on a five point
likert scale (from, 1; strongly disagree, 2 ;disagree, 3 ;neutral, 4; agree and 5; strongly agree).
According to Zaidation and Bagheri (2019),the mean score below 3.39, was considered as low
the mean score from 3.40 to 3.79 was considered as moderate and the mean score above 3.8 was
considers as high by comparison base of mean score of five likert scale instrument. Since, this
study in detail of the analysis is presented below.
Table 4. 4: Summary Statistics on Continuous Variables
Variables Frequency Mean Std. Dev. Min Max.
Sales Performance 115 2.499 0.852 1.00 4.60
Product 115 2.503 0.812 1.00 4.88
Price 115 2.713 0.666 1.29 4.57
Place 115 2.560 0.787 1.14 4.71
Promotion 115 2.425 0.839 1.00 4.50
Source: Own Survey, 2020
Where, std. Dev. = Standard Deviation, Min. = Minimum, Max.= Maximum
As sales performance the dependent variable, respondents, average level of agreement of mean
to the five items is computed. The mean collective agreement level is M = 2.499, 2.503, 2. 713,
2.560 and 2.425 and also standard deviation of the elements, 0.852, 0.812, 0.666, 0.787 and
0.839, all are the four independent variables the mean value is below average. Thus, the study is
mean value are low score range, it indicates that the existing of respondents do not satisfy on
sales performance.
Sales performance is the dependent variable in the brewery factories have a mean value of
2.499, which is below average. This implies that the level of sales performance is low within the
brewery factories, due to lack of communication within these factories, lack of managerial

41
support, the least amount of pay, lack of acknowledgment for a sale. The standard deviation and
mean distribution summary statistics on continuous variables that are included in this study ,the
result indicates that all the variables, namely, sales performance, product, price, place and
promotion have low level of agreement as per the standard set by (Zaidation and Bagheri ,2019).
4.6.Correlation Analysis
Correlation analysis is concerned for expressing and measuring the closeness of variables. It does
not identify the cause and effect relationship between variables. The value of the coefficient (r)
ranges from -1 up to +1. The value of the coefficient of correlation (r) indicates both the strength
and direction of the relationship. If r = -1 there is perfect negative correlation between the
variable. If r = 0 there is no relationship between the variable and if r = +1 there is perfect a
positive relationship between the variables. For values of r between + and 0 or between 0 and -1,
different scholars have proposed different interpretation with slight difference. For this study
decision rule given by Bartz (1999) was used to describe the strength of association among the
variables as follows:
Table 4. 5: Interpretation of (r) Value
Value (r) Description
0.8 or Higer Very high
0.6 to 0.8 Strong
0.4 to 0.6 Moderate
0.2 to 0.4 Low
0.2 or Lower Very low
Soruces : Bartz, 1999
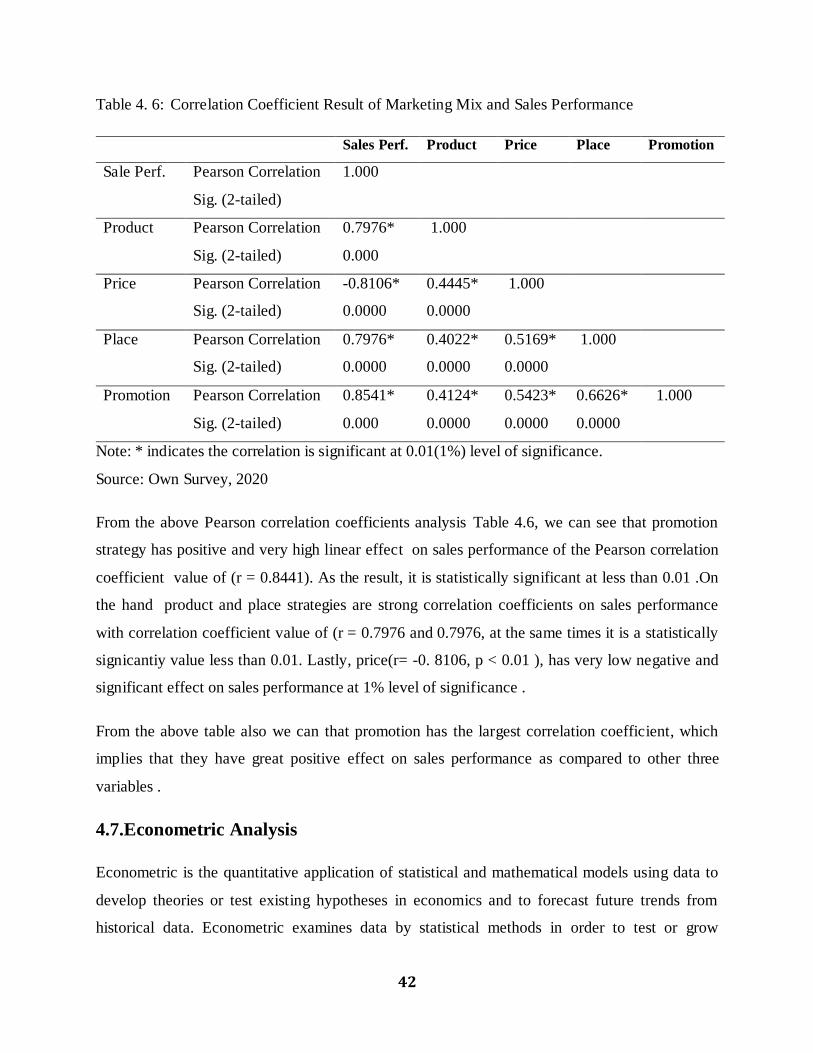
42
Table 4. 6: Correlation Coefficient Result of Marketing Mix and Sales Performance
Sales Perf. Product Price Place Promotion
Sale Perf. Pearson Correlation 1.000
Sig. (2-tailed)
Product Pearson Correlation 0.7976* 1.000
Sig. (2-tailed) 0.000
Price Pearson Correlation -0.8106* 0.4445* 1.000
Sig. (2-tailed) 0.0000 0.0000
Place Pearson Correlation 0.7976* 0.4022* 0.5169* 1.000
Sig. (2-tailed) 0.0000 0.0000 0.0000
Promotion Pearson Correlation 0.8541* 0.4124* 0.5423* 0.6626* 1.000
Sig. (2-tailed) 0.000 0.0000 0.0000 0.0000
Note: * indicates the correlation is significant at 0.01(1%) level of significance.
Source: Own Survey, 2020
From the above Pearson correlation coefficients analysis Table 4.6, we can see that promotion
strategy has positive and very high linear effect on sales performance of the Pearson correlation
coefficient value of (r = 0.8441). As the result, it is statistically significant at less than 0.01 .On
the hand product and place strategies are strong correlation coefficients on sales performance
with correlation coefficient value of (r = 0.7976 and 0.7976, at the same times it is a statistically
signicantiy value less than 0.01. Lastly, price(r= -0. 8106, p < 0.01 ), has very low negative and
significant effect on sales performance at 1% level of significance .
From the above table also we can that promotion has the largest correlation coefficient, which
implies that they have great positive effect on sales performance as compared to other three
variables .
4.7.Econometric Analysis
Econometric is the quantitative application of statistical and mathematical models using data to
develop theories or test existing hypotheses in economics and to forecast future trends from
historical data. Econometric examines data by statistical methods in order to test or grow
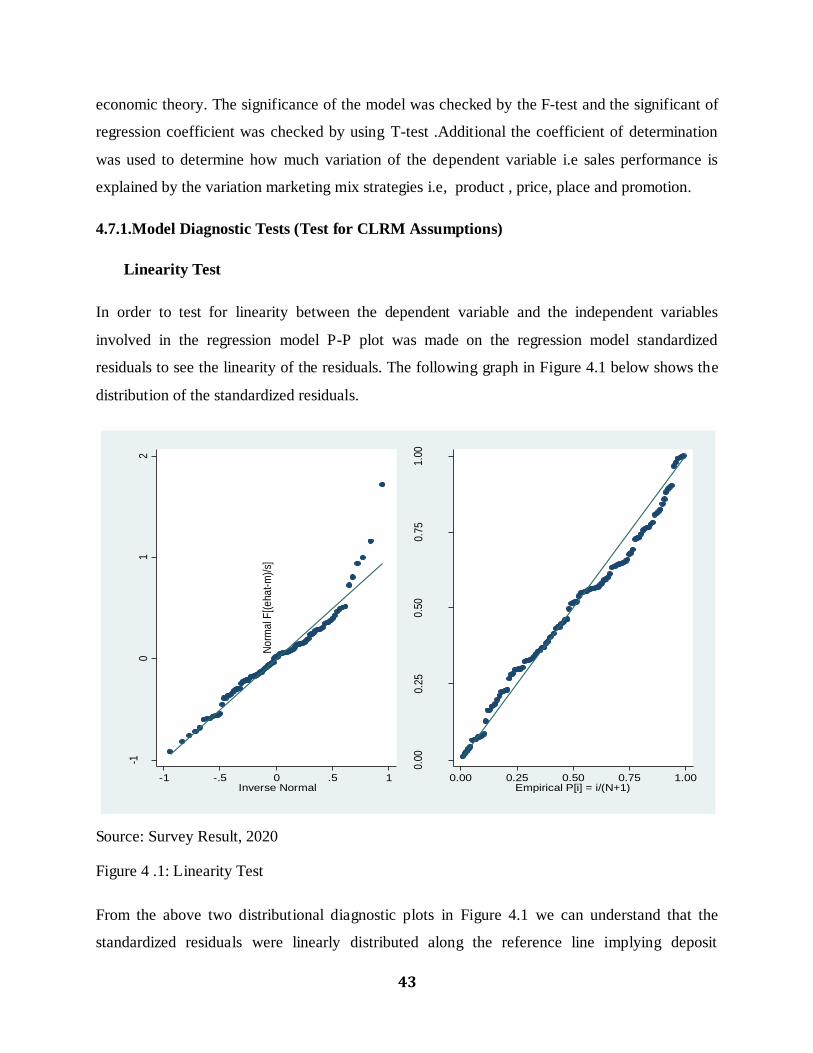
43
economic theory. The significance of the model was checked by the F-test and the significant of
regression coefficient was checked by using T-test .Additional the coefficient of determination
was used to determine how much variation of the dependent variable i.e sales performance is
explained by the variation marketing mix strategies i.e, product , price, place and promotion.
4.7.1.Model Diagnostic Tests (Test for CLRM Assumptions)
Linearity Test
In order to test for linearity between the dependent variable and the independent variables
involved in the regression model P-P plot was made on the regression model standardized
residuals to see the linearity of the residuals. The following graph in Figure 4.1 below shows the
distribution of the standardized residuals.
Source: Survey Result, 2020
Figure 4 .1: Linearity Test
From the above two distributional diagnostic plots in Figure 4.1 we can understand that the
standardized residuals were linearly distributed along the reference line implying deposit
-10
12
Re
sid
ua
ls
-1 -.5 0 .5 1Inverse Normal
0.0
00.2
50.5
00.7
51.0
0
No
rma
l F[(
eha
t-m
)/s]
0.00 0.25 0.50 0.75 1.00Empirical P[i] = i/(N+1)
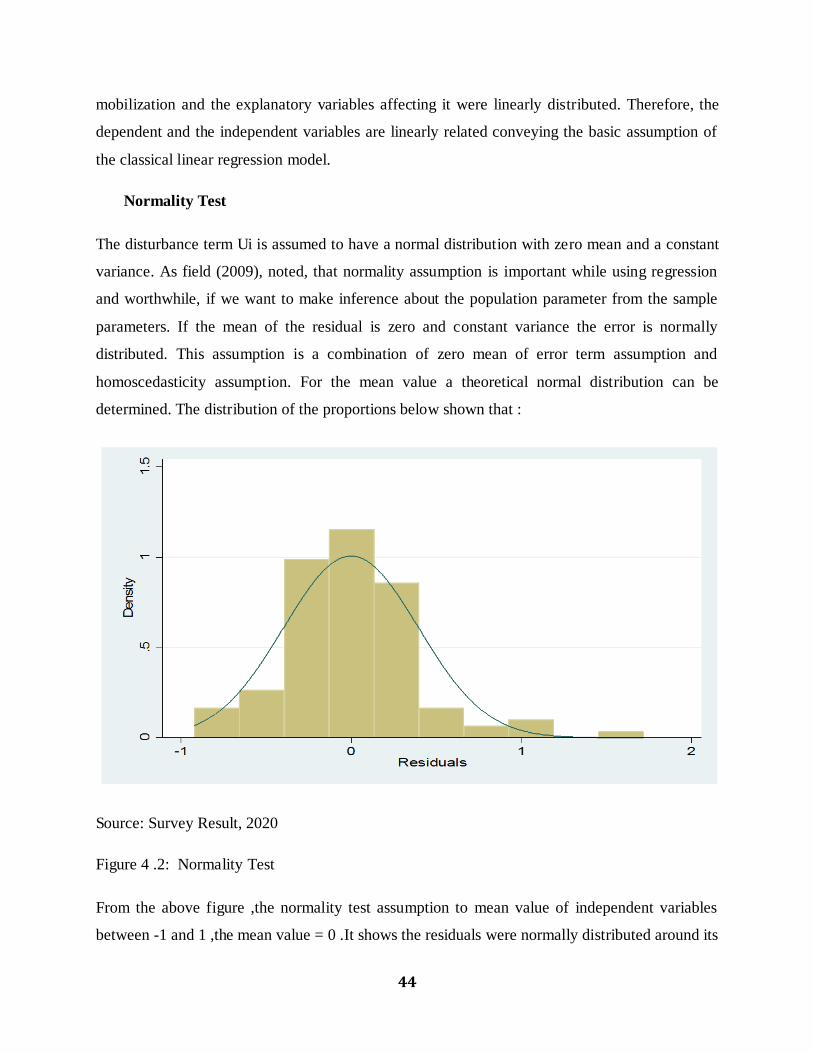
44
mobilization and the explanatory variables affecting it were linearly distributed. Therefore, the
dependent and the independent variables are linearly related conveying the basic assumption of
the classical linear regression model.
Normality Test
The disturbance term Ui is assumed to have a normal distribution with zero mean and a constant
variance. As field (2009), noted, that normality assumption is important while using regression
and worthwhile, if we want to make inference about the population parameter from the sample
parameters. If the mean of the residual is zero and constant variance the error is normally
distributed. This assumption is a combination of zero mean of error term assumption and
homoscedasticity assumption. For the mean value a theoretical normal distribution can be
determined. The distribution of the proportions below shown that :
Source: Survey Result, 2020
Figure 4 .2: Normality Test
From the above figure ,the normality test assumption to mean value of independent variables
between -1 and 1 ,the mean value = 0 .It shows the residuals were normally distributed around its
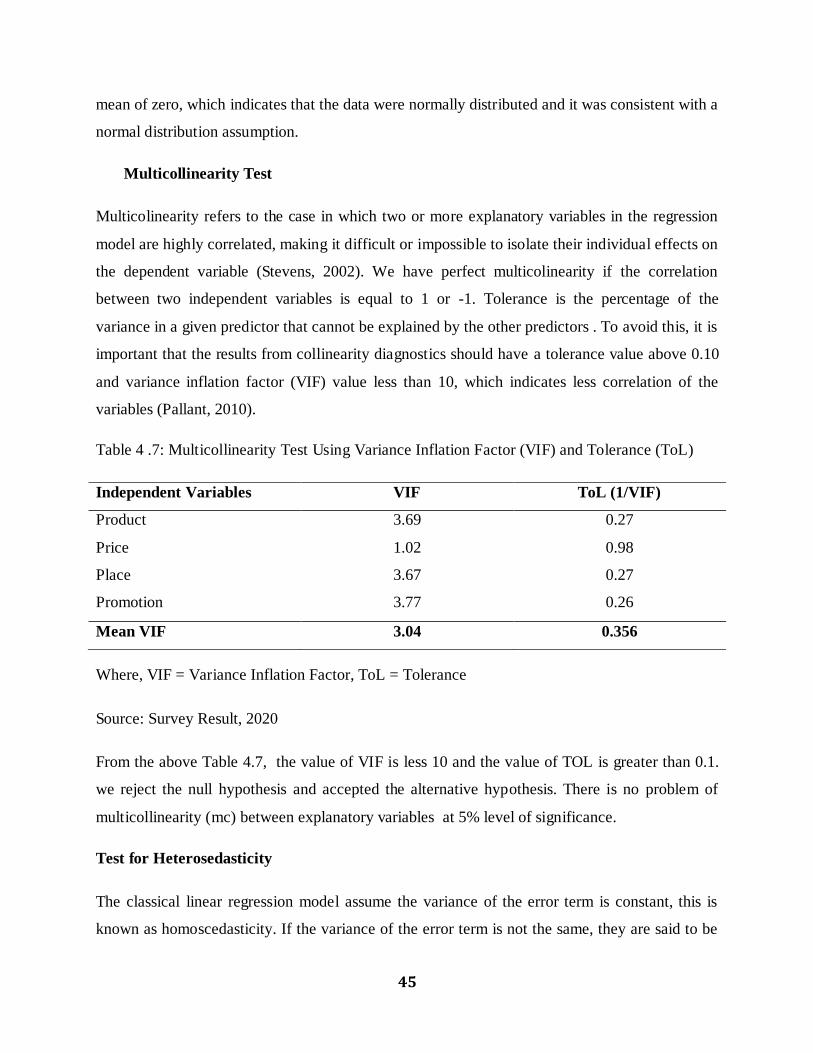
45
mean of zero, which indicates that the data were normally distributed and it was consistent with a
normal distribution assumption.
Multicollinearity Test
Multicolinearity refers to the case in which two or more explanatory variables in the regression
model are highly correlated, making it difficult or impossible to isolate their individual effects on
the dependent variable (Stevens, 2002). We have perfect multicolinearity if the correlation
between two independent variables is equal to 1 or -1. Tolerance is the percentage of the
variance in a given predictor that cannot be explained by the other predictors . To avoid this, it is
important that the results from collinearity diagnostics should have a tolerance value above 0.10
and variance inflation factor (VIF) value less than 10, which indicates less correlation of the
variables (Pallant, 2010).
Table 4 .7: Multicollinearity Test Using Variance Inflation Factor (VIF) and Tolerance (ToL)
Independent Variables VIF ToL (1/VIF)
Product 3.69 0.27
Price 1.02 0.98
Place 3.67 0.27
Promotion 3.77 0.26
Mean VIF 3.04 0.356
Where, VIF = Variance Inflation Factor, ToL = Tolerance
Source: Survey Result, 2020
From the above Table 4.7, the value of VIF is less 10 and the value of TOL is greater than 0.1.
we reject the null hypothesis and accepted the alternative hypothesis. There is no problem of
multicollinearity (mc) between explanatory variables at 5% level of significance.
Test for Heterosedasticity
The classical linear regression model assume the variance of the error term is constant, this is
known as homoscedasticity. If the variance of the error term is not the same, they are said to be
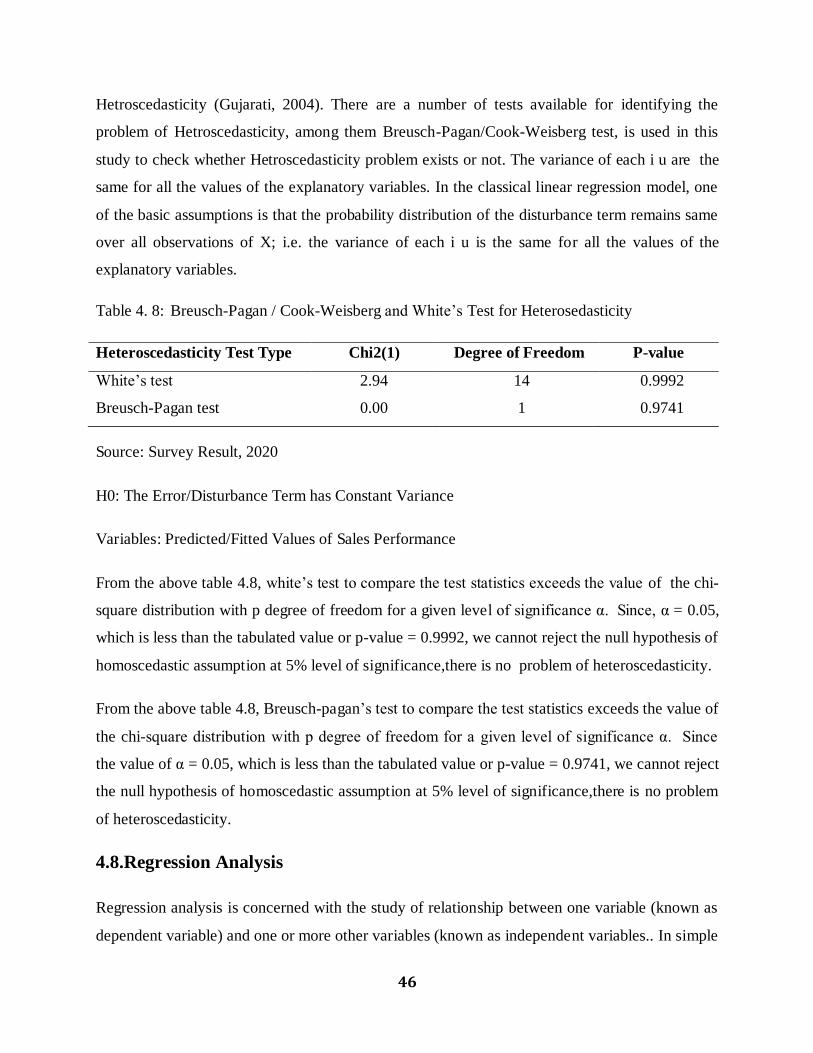
46
Hetroscedasticity (Gujarati, 2004). There are a number of tests available for identifying the
problem of Hetroscedasticity, among them Breusch-Pagan/Cook-Weisberg test, is used in this
study to check whether Hetroscedasticity problem exists or not. The variance of each i u are the
same for all the values of the explanatory variables. In the classical linear regression model, one
of the basic assumptions is that the probability distribution of the disturbance term remains same
over all observations of X; i.e. the variance of each i u is the same for all the values of the
explanatory variables.
Table 4. 8: Breusch-Pagan / Cook-Weisberg and White’s Test for Heterosedasticity
Heteroscedasticity Test Type Chi2(1) Degree of Freedom P-value
White’s test
Breusch-Pagan test
2.94
0.00
14
1
0.9992
0.9741
Source: Survey Result, 2020
H0: The Error/Disturbance Term has Constant Variance
Variables: Predicted/Fitted Values of Sales Performance
From the above table 4.8, white’s test to compare the test statistics exceeds the value of the chi-
square distribution with p degree of freedom for a given level of significance α. Since, α = 0.05,
which is less than the tabulated value or p-value = 0.9992, we cannot reject the null hypothesis of
homoscedastic assumption at 5% level of significance,there is no problem of heteroscedasticity.
From the above table 4.8, Breusch-pagan’s test to compare the test statistics exceeds the value of
the chi-square distribution with p degree of freedom for a given level of significance α. Since
the value of α = 0.05, which is less than the tabulated value or p-value = 0.9741, we cannot reject
the null hypothesis of homoscedastic assumption at 5% level of significance,there is no problem
of heteroscedasticity.
4.8.Regression Analysis
Regression analysis is concerned with the study of relationship between one variable (known as
dependent variable) and one or more other variables (known as independent variables.. In simple

47
terms, regression analysis is a quantitative. Technique used to test the nature of relations between
a dependent variable and one or more independent variables. The basic form of regression
models includes unknown parameters (β), independent variables (X), and the dependent variable
(Y). Regression model is the basical requires the relative of dependent variable (Y) to a function
mixture of independent variables (X) and unknown parameters (β).
Table 4 .9: Model Summary
Model R R Square Adjusted R Square Std. Error of the Estimate
1 0.8853 0.7838 0.7759 0.1268
Predictors: (Constant), Product, Price, Place and Promotion
Source: Own Survey, 2020
The regression results of the analysis indicated in model summary in Table 4.9, R = 0.8853
indicate the correlation of marketing mix strategies on the sales performance. The R- square is a
statistical measure that tells the proportion of the variance for a dependent variable that explained
by an independent variable to the regression model. The R- square also explains to what extent
the variance of one variable explains the variance of another variable . The R- square value range
from 0 to 1 and commonly stated as a percentage from 0% to 100%. The R- square of 100%
indicates that, dependent variable is completely by independent variables of the model.
The R- square is 0% shows the model explained none of the variability of the response data
around its mean. The value of R- square in this study was found to be 0.7839, this indicates that
78.38% of variation in sales performance is explained by explanatory variables and the
remaining is 21.62% of the variation on sales performance remained unexplained by other
factors which haven't included the model. The adjusted R – square is a modified version of R-
square that has been adjusted for the number of predictors in the model. Since, adjusted R-square
compares the explanatory power of regression model that contain different numbers of
predictors. The value of the adjusted R - square in this study found to be 0.7759, this implies
that, most of the independent variables included in the regression model are relevant in
explaining by sales performance, since it's different from an R - square is too small.
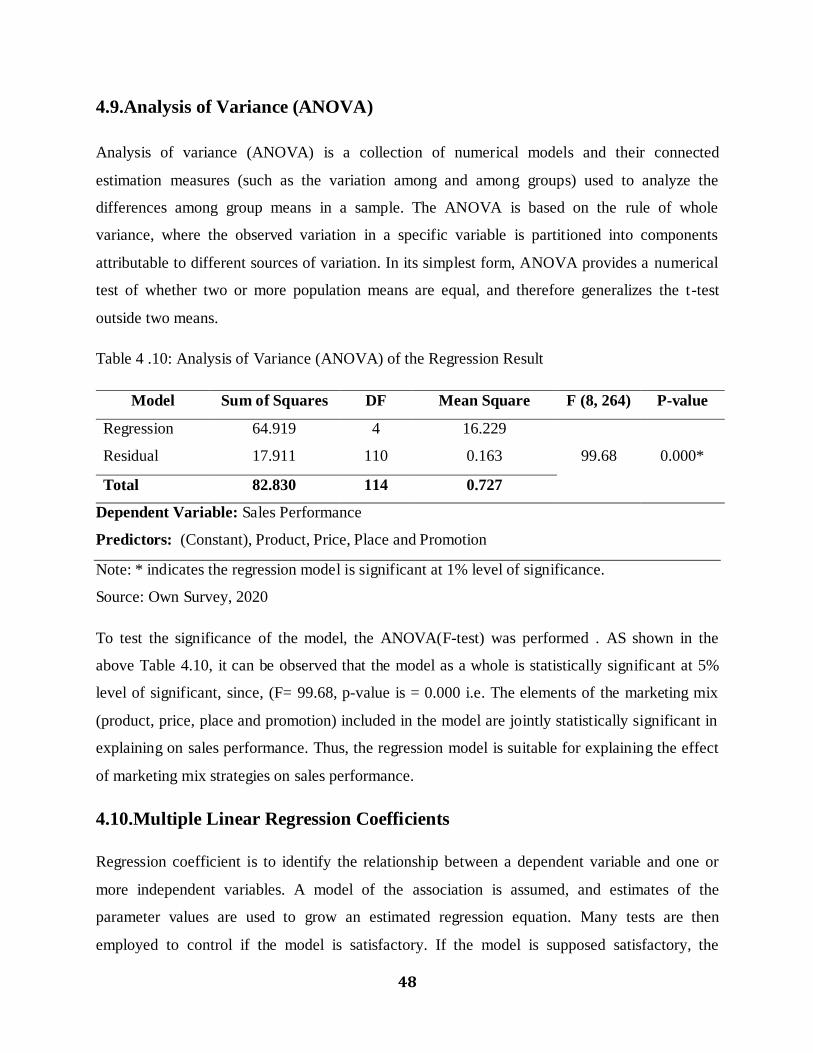
48
4.9.Analysis of Variance (ANOVA)
Analysis of variance (ANOVA) is a collection of numerical models and their connected
estimation measures (such as the variation among and among groups) used to analyze the
differences among group means in a sample. The ANOVA is based on the rule of whole
variance, where the observed variation in a specific variable is partitioned into components
attributable to different sources of variation. In its simplest form, ANOVA provides a numerical
test of whether two or more population means are equal, and therefore generalizes the t-test
outside two means.
Table 4 .10: Analysis of Variance (ANOVA) of the Regression Result
Model Sum of Squares DF Mean Square F (8, 264) P-value
Regression 64.919 4 16.229
99.68
0.000* Residual 17.911 110 0.163
Total 82.830 114 0.727
Dependent Variable: Sales Performance
Predictors: (Constant), Product, Price, Place and Promotion
Note: * indicates the regression model is significant at 1% level of significance.
Source: Own Survey, 2020
To test the significance of the model, the ANOVA(F-test) was performed . AS shown in the
above Table 4.10, it can be observed that the model as a whole is statistically significant at 5%
level of significant, since, (F= 99.68, p-value is = 0.000 i.e. The elements of the marketing mix
(product, price, place and promotion) included in the model are jointly statistically significant in
explaining on sales performance. Thus, the regression model is suitable for explaining the effect
of marketing mix strategies on sales performance.
4.10.Multiple Linear Regression Coefficients
Regression coefficient is to identify the relationship between a dependent variable and one or
more independent variables. A model of the association is assumed, and estimates of the
parameter values are used to grow an estimated regression equation. Many tests are then
employed to control if the model is satisfactory. If the model is supposed satisfactory, the

49
estimated regression equation can be used to predict the value of the dependent variable given
values for the independent variables.
Table 4. 11: Multiple linear regression Coefficients
Sales Perfomance Unstandardized Beta Coef tcal P-value Standard
Beta Coef Coef Std. Err
Constant -0.255 0.199 -1.27 0.206 -
Product 0.205 0.089 2.30 0.024 0.195
Price -0.135 0.057 -2.37 0.020 0.106
Place 0.217 0.092 2.36 0.020 0.201
Promotion 0.543 0.088 6.20 0.000 0.534
Note: * and ** indicates the regression coefficients are significant at 1% and 5% level of
significance respectively.
Source: Own Survey, 2020
For the above table 4.11, this part of the study the effect of dependent variable and independent
variable were discussed. The dependent variable was the sales performance, whereas
independent variables were, product, price, place and promotion. The regression model
standardized and unstandardized coefficients for the four independent variables, i.e, product,
price, place and promotion. The p-value of product, price, place and promotion is 0.024, 0.020,
0.020 and 0.000 respectively, which are less than 0.05(5%). This indicates the existence of a
significant effect of dependent and independent variables. The standardized coefficient is
indicated beta values in standard deviations. When we standardize our estimates the unit of
measurement is going to be a standard deviation regardless of the real measurement, which
enable as to compare variables measured by different units of measurement. Standardized
coefficient has no shows level of significant and constant terms. Nnstandardized coefficient is to
estimates the best for the interpretation and also it shows that level of significant and constant
term. The standardized beta coefficient column shows the contribution that an individual
variable make to the model. The significance value (p-value) implies that the statistical
significance of the effects. The constant term of the model indicates the value of sales
performance if all explanatory variables held constant.
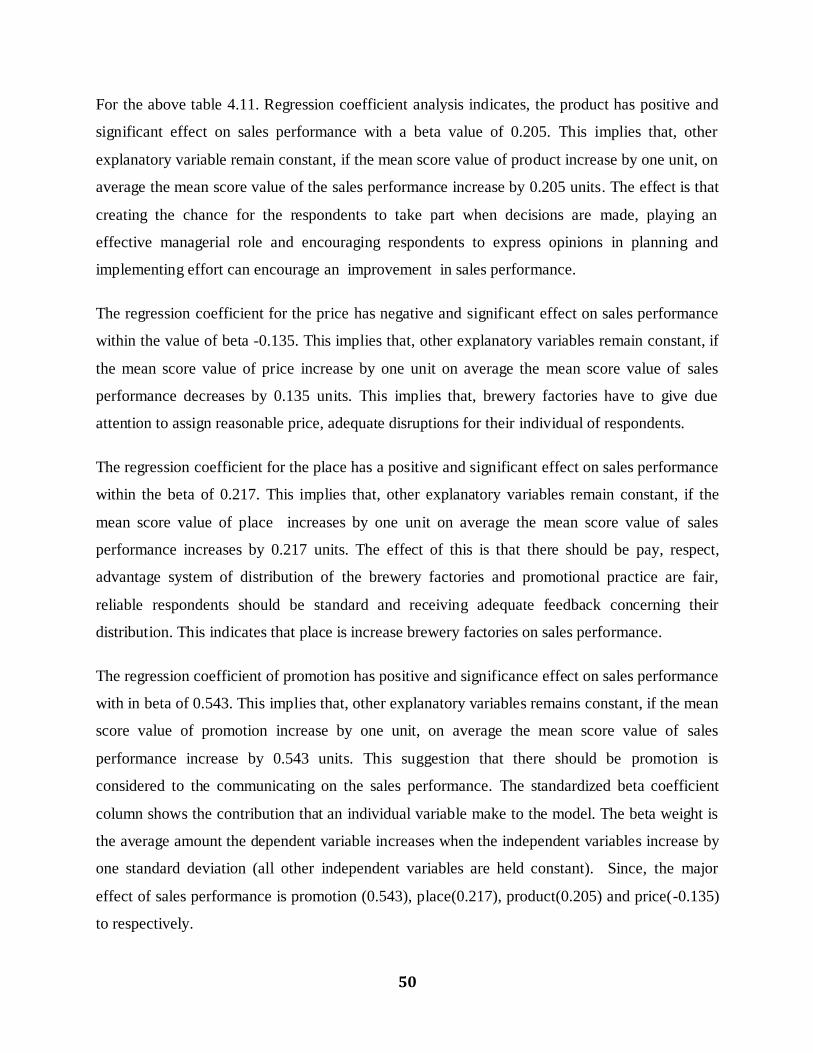
50
For the above table 4.11. Regression coefficient analysis indicates, the product has positive and
significant effect on sales performance with a beta value of 0.205. This implies that, other
explanatory variable remain constant, if the mean score value of product increase by one unit, on
average the mean score value of the sales performance increase by 0.205 units. The effect is that
creating the chance for the respondents to take part when decisions are made, playing an
effective managerial role and encouraging respondents to express opinions in planning and
implementing effort can encourage an improvement in sales performance.
The regression coefficient for the price has negative and significant effect on sales performance
within the value of beta -0.135. This implies that, other explanatory variables remain constant, if
the mean score value of price increase by one unit on average the mean score value of sales
performance decreases by 0.135 units. This implies that, brewery factories have to give due
attention to assign reasonable price, adequate disruptions for their individual of respondents.
The regression coefficient for the place has a positive and significant effect on sales performance
within the beta of 0.217. This implies that, other explanatory variables remain constant, if the
mean score value of place increases by one unit on average the mean score value of sales
performance increases by 0.217 units. The effect of this is that there should be pay, respect,
advantage system of distribution of the brewery factories and promotional practice are fair,
reliable respondents should be standard and receiving adequate feedback concerning their
distribution. This indicates that place is increase brewery factories on sales performance.
The regression coefficient of promotion has positive and significance effect on sales performance
with in beta of 0.543. This implies that, other explanatory variables remains constant, if the mean
score value of promotion increase by one unit, on average the mean score value of sales
performance increase by 0.543 units. This suggestion that there should be promotion is
considered to the communicating on the sales performance. The standardized beta coefficient
column shows the contribution that an individual variable make to the model. The beta weight is
the average amount the dependent variable increases when the independent variables increase by
one standard deviation (all other independent variables are held constant). Since, the major
effect of sales performance is promotion (0.543), place(0.217), product(0.205) and price(-0.135)
to respectively.
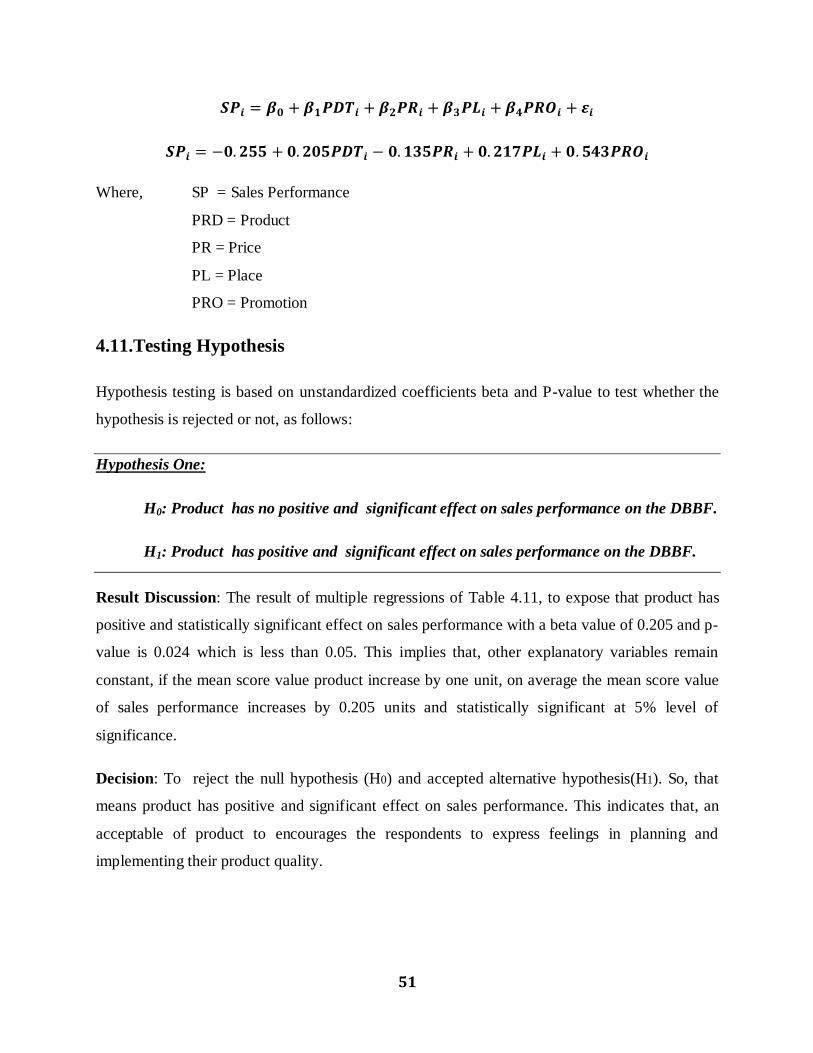
51
Where, SP = Sales Performance
PRD = Product
PR = Price
PL = Place
PRO = Promotion
4.11.Testing Hypothesis
Hypothesis testing is based on unstandardized coefficients beta and P-value to test whether the
hypothesis is rejected or not, as follows:
Hypothesis One:
H0: Product has no positive and significant effect on sales performance on the DBBF.
H1: Product has positive and significant effect on sales performance on the DBBF.
Result Discussion: The result of multiple regressions of Table 4.11, to expose that product has
positive and statistically significant effect on sales performance with a beta value of 0.205 and p-
value is 0.024 which is less than 0.05. This implies that, other explanatory variables remain
constant, if the mean score value product increase by one unit, on average the mean score value
of sales performance increases by 0.205 units and statistically significant at 5% level of
significance.
Decision: To reject the null hypothesis (H0) and accepted alternative hypothesis(H1). So, that
means product has positive and significant effect on sales performance. This indicates that, an
acceptable of product to encourages the respondents to express feelings in planning and
implementing their product quality.
52
Hypothesis Two:
H0: Price has no negative and significant effect on sales performance on the DBBF.
H1: Price has negative and significant effect on sales performance on the DBBF
Result Discussion: The result of multiple regressions of Table 4.11, to exposed that price has
negative and statistically significant effect on sales performance with a beta value of -0.135 and
p-value is 0.020 which is less than 0.05. This implies that, other explanatory variables remain
constant, if the mean score value price increase by one unit, on average the mean score value of
sales performance decrease by 0.135 unit and statistically significant at 5% level of significance.
Decision: To reject the null hypothesis (H0) and accepted alternative hypothesis(H1). So, that this
means price has negative and significant effect on sales performance.
Hypothesis Three:
H0: Place has no negative and significant effect on sales performance on the DBBF
H1: Place has positive and significant effect on sales performance on the DBBF
Results Discussion: the result of table 4.11, shown that, place has positive and statistically
significant effect on sales performance with a beta value of 0.217 and p-value of 0.020, which is
less than 5% level of significance. This shown that, other explanatory variables remain constant,
if the mean score value of place increases by one unit, on average the mean score value of the
sales performance increase by 0.217 units and the effect is statistically significance at 5% level
of significance at Debere Berehan brewery factories.
Decision: To reject the null hypotheses(H0) and accepted the alternative hypothesis(H1). Since,
place has positive and significant effect on sales performance.

53
Hypothesis Four:
H0: Promotion has no positive and significant effect on sales performance on the DBBF.
H1: Promotion has positive and significant effect on sales performance on the DBBF.
Results Discussion: the result of table 4.11, shown that, promotion has positive and statistically
significant effect on sales performance with a beta value of 0.543 and p-value of 0.000, which is
less than 1% level of significance. This is shown that, other explanatory variables remain
constant, if the mean score value of promotion increases by one unit, on average the mean score
value of the sales performance increase by 0.543 units and the effect is statistically significance
at 1% level of significance.
Decision: To reject the null hypotheses(H0) and accepted the alternative hypothesis(H1). Since,
promotion has positive and significant effect on sales performance
Table 4 12: Summary of Actual and Expected Sign Effect of Explanatory Variables
Explanatory Variables Expected Sign and Effect Actual Sign and Effect Remark
Product Positive and Significant Positive and Significant Accepted
Price negative and Significant negative and Significant Accepted
Place Positive and Significant Positive and Significant Accepted
Promotion Positive and Significant Positive and Significant Accepted
Source: Survey Result, 2020
4.12.Comparison of Findings with Previous Studies
In this part, a comparison is done between the findings of this study and previous empirical
evidence. The comparison between findings in this study and previous empirical evidence related
to marketing mix strategies and sales performance.
Based on the results of this study by the correlation coefficients the effect of marketing mix
strategies and sales performance, such as, promotion strategy has very high positive and

54
significant effect on sales performance of the Pearson correlation coefficient value of (r =
0.8441). As the result, it is statistical significant at less than 0.01. On the other hand product and
place strategies are strong correlation coefficients on sales performance with correlation
coefficient value of (r = 0.7976 and 0.7976, at the same times it is statistically significant p-value
less than 0.01. Lastly price has very low negative and significant effect on sales performance, at
5 % level of significance.
Regarding the results of this Study by the regression coefficients, marketing mix strategies such
as, Product, place and promotion have a positive and significant effect on sales performance. The
regression coefficient value of beta (0.205, 0.217 and 0.543 and the p-value (0.024, 0.020 and
0.000), which means it has statistically significant at the 5 % level of significance. But, price has
a negative and significant effect on sales performance, that is the value of beta (-0.8106, p-value
is 0.020), it is statistically significant at the 5 % level of significance.
Other researchers findings, Accordingly, Mwenda,(2017), conduct to study on the effects of
marketing mix on sales performance in case of unga feeds limited. The researcher has no shown
correlation coefficients the comparison are can not similarity. The regession value of the other
researcher, conduct to the results show that, Product and price has positive and insignificant
effect on sales performance. But, place has negative and insignificant effect on sales
performance. Finally, promotion has positive and significant effect on sales performance at 1%
and 5% level of significance, these are same to result of this study.
Caroline (2017), conduct on effects of Marketing Strategies on sales performance of small and
medlum enterprises in Kenya. The rsearcher to conduct marketing mix, such as, product, price,
place and promotion have strong positive and statist ically significantly effect on sales
performance at 5% level of significant based on correlation coefficient values. Based on
correlation coefficient value product and place has the similarity findings to this study. karimi
(2015), conduct on the effects of marketing strategies on sales performance of commercial banks
in Kenya. There is no shown implication to the finding based on correlation and regression
coefficient. This is only used frequency, percentage, mean and standard deviation .
Claude (2019), marketing strategies and sales performance of manufacturing firms in uganda:a
case study of tembo steels uganda limited. The result are product has negative and insignificanc

55
effect on sales performance. Promotion has positive and insignificant effect on sales
performance. Price and place has positive and significance effect on sales performance, but place
has similarity of this study. Joyce Frank (2015), the effect of marketing mix (4Ps) on sales
performance of Tigo Telecommunication company in Tanzania. There is no shown implication
of the finding based on correlation or regression coefficient. This is only used frequency,
percentage, mean and standard deviation.
Generally in the result of this findings, all independent variables like as, product , price , place
and promotion strategies used in the study had greatest effect on sales performance .
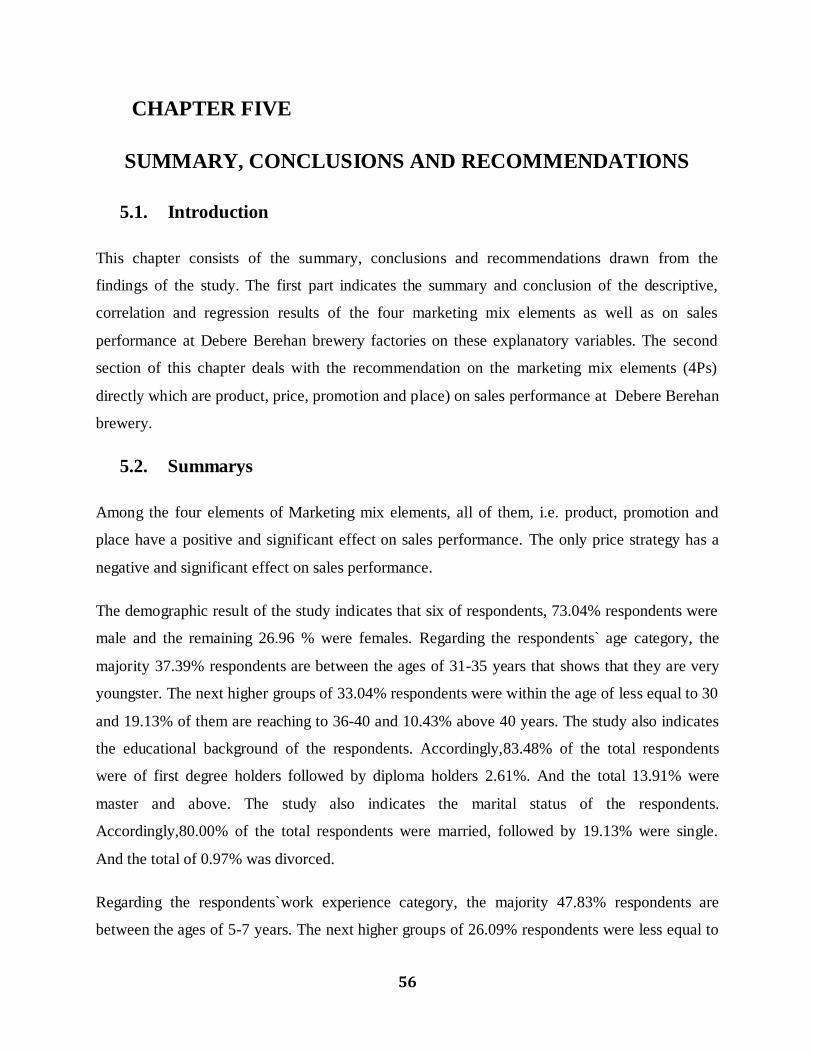
56
CHAPTER FIVE
SUMMARY, CONCLUSIONS AND RECOMMENDATIONS
5.1. Introduction
This chapter consists of the summary, conclusions and recommendations drawn from the
findings of the study. The first part indicates the summary and conclusion of the descriptive,
correlation and regression results of the four marketing mix elements as well as on sales
performance at Debere Berehan brewery factories on these explanatory variables. The second
section of this chapter deals with the recommendation on the marketing mix elements (4Ps)
directly which are product, price, promotion and place) on sales performance at Debere Berehan
brewery.
5.2. Summarys
Among the four elements of Marketing mix elements, all of them, i.e. product, promotion and
place have a positive and significant effect on sales performance. The only price strategy has a
negative and significant effect on sales performance.
The demographic result of the study indicates that six of respondents, 73.04% respondents were
male and the remaining 26.96 % were females. Regarding the respondents` age category, the
majority 37.39% respondents are between the ages of 31-35 years that shows that they are very
youngster. The next higher groups of 33.04% respondents were within the age of less equal to 30
and 19.13% of them are reaching to 36-40 and 10.43% above 40 years. The study also indicates
the educational background of the respondents. Accordingly,83.48% of the total respondents
were of first degree holders followed by diploma holders 2.61%. And the total 13.91% were
master and above. The study also indicates the marital status of the respondents.
Accordingly,80.00% of the total respondents were married, followed by 19.13% were single.
And the total of 0.97% was divorced.
Regarding the respondents`work experience category, the majority 47.83% respondents are
between the ages of 5-7 years. The next higher groups of 26.09% respondents were less equal to
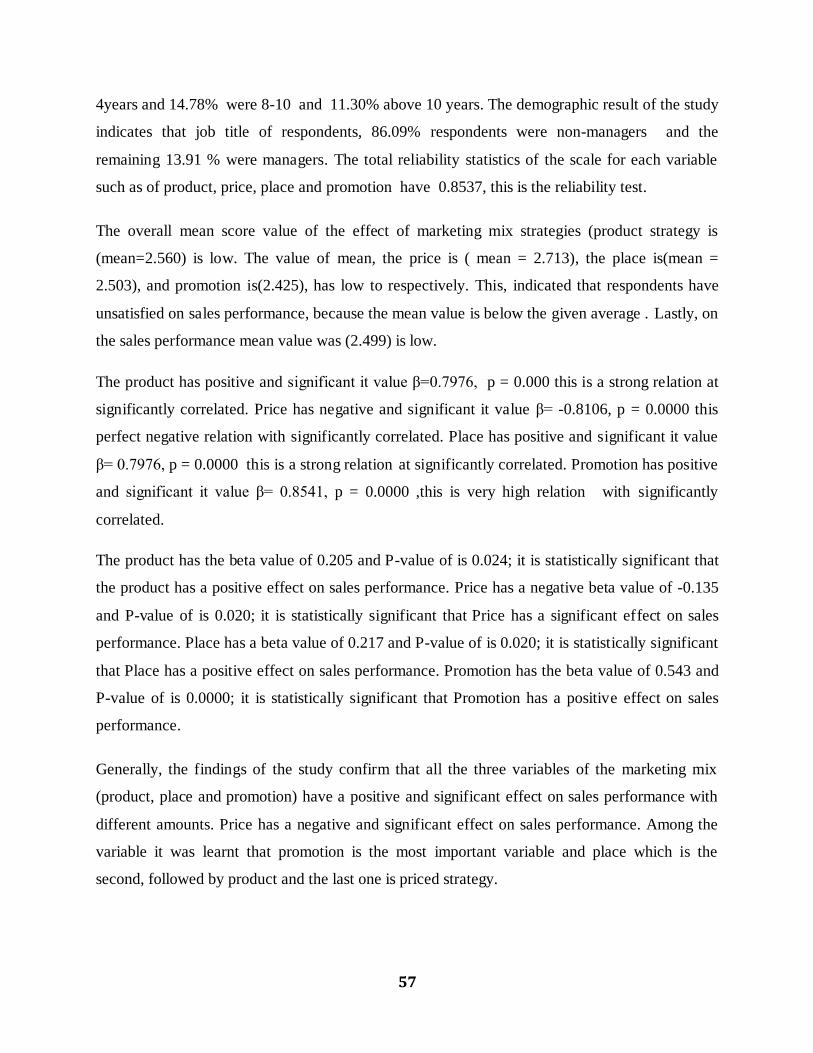
57
4years and 14.78% were 8-10 and 11.30% above 10 years. The demographic result of the study
indicates that job title of respondents, 86.09% respondents were non-managers and the
remaining 13.91 % were managers. The total reliability statistics of the scale for each variable
such as of product, price, place and promotion have 0.8537, this is the reliability test.
The overall mean score value of the effect of marketing mix strategies (product strategy is
(mean=2.560) is low. The value of mean, the price is ( mean = 2.713), the place is(mean =
2.503), and promotion is(2.425), has low to respectively. This, indicated that respondents have
unsatisfied on sales performance, because the mean value is below the given average . Lastly, on
the sales performance mean value was (2.499) is low.
The product has positive and significant it value β=0.7976, p = 0.000 this is a strong relation at
significantly correlated. Price has negative and significant it value β= -0.8106, p = 0.0000 this
perfect negative relation with significantly correlated. Place has positive and significant it value
β= 0.7976, p = 0.0000 this is a strong relation at significantly correlated. Promotion has positive
and significant it value β= 0.8541, p = 0.0000 ,this is very high relation with significantly
correlated.
The product has the beta value of 0.205 and P-value of is 0.024; it is statistically significant that
the product has a positive effect on sales performance. Price has a negative beta value of -0.135
and P-value of is 0.020; it is statistically significant that Price has a significant effect on sales
performance. Place has a beta value of 0.217 and P-value of is 0.020; it is statistically significant
that Place has a positive effect on sales performance. Promotion has the beta value of 0.543 and
P-value of is 0.0000; it is statistically significant that Promotion has a positive effect on sales
performance.
Generally, the findings of the study confirm that all the three variables of the marketing mix
(product, place and promotion) have a positive and significant effect on sales performance with
different amounts. Price has a negative and significant effect on sales performance. Among the
variable it was learnt that promotion is the most important variable and place which is the
second, followed by product and the last one is priced strategy.

58
5.3. Conclusions
Marketing mix strategies are one of the functional strategies of the factories, which collectively
make up an overall business strategy. The success of achieving sales performance is the turn grit
for maintaining competitive advantage. This study has been conducted to determine the effect of
marketing mix strategies on sales performance of the brewery factories. The findings of this
study suggests that all four variables marketing mix strategies (product, place and promotion
strategies have positive and significantly at 5% level of significance and p-value is less than
0.05. However, price has negative and significant effect on sales performance. From the
following conclusions that,
Based on the above findings, from the effect of marketing mix strategies such as, product,
price, place and promotion have the mean value of this element have low. Of the
respondents are unsatisfied to the brewery factories. They are some adjustment due to the
respondent of brewery factories, this is, to motivate the respondents by some, bonus
salary and over time, to learn about model technology and training for their respondents.
Based on the product strategy, due to this study by the correlation coefficient of the
product has a strong and significant effect on sales performance and also the regression
analysis of product has a positive and significant effect on sales performance of brewery
factories in Deber Bahrain city. Too used to describe the product, its use, product
visibility, and recognition and attract attention, brand image, and loyalty affects the
factories profitability.
Based on the price strategy has very low negative and significant effect on sales
performance based on the correlation coefficient results. Due to the regression analysis
piece has a negative and significant effect on sales performance of brewery factories. The
use of pricing strategy increases sales volume, price, promotion effects customer's
perception towards product quality, penetration pricing effects purchase intention.
Based on the place strategy, this study by the correlation coefficient result, the place has
strong positive and significantly effect on sales performance. Due to the regression
analysis, the place has a positive and significant effect on sales performance of brewery

59
factories. It is observed that distribution channels located in urban areas generate more
returns than those in rural areas, store design and use of attractive stimuli such as music
has effect has a positive effect on consumer purchase and sales volume, geographic
location has a significant effect on profitability and physical surrounding such as
finishing, good working environment, and aroma affects sales.
Based on the promotion strategy, Due to the correlation coefficient result, promotion has
very high positive and significant effect on sales performance and also the regression
analysis, promotion has a positive and significant effect on sales performance at brewery
factories. This implies, that to create interest, brand awareness and increase brand loyalty,
promotion has increased sales performance.
In general, it is possible to conclude that there is a positive and significant effect of the marketing
mix, such as, product, place and promotion strategy's effect on sales performance. However, the
price has a negative and significant effect on sales performance of brewery factories in Deber
Bahrain city. This study is supported by many theoretical and literatures, which show that
marketing mix strategies have statistically significant effects on sales performance.
5.4. Recommendations
This study to examine the effect of marketing mix strategies on sales performance in case of
Debere Berhan Brewery Factories. Based on the findings and conclusions reached by, this study,
below the following recommendations have forward on each marketing mix strategies, such as,
product, price, place and promotion strategies.
Based on product strategy, the study is a positive and significant effect on sales performance,
this research follow some recommendations on the product.
Introduce new products, or variety of goods, to apply the customer request specification,
in size and hiring the specialized staff for the sales service
To improve product quality by upgrading their technology used
To improve on their packaging design to increase product visibility and recognition
Improve on their branding strategy

60
Based on pricing strategy, this study is negative and significant effect on sales performance. This
study the following, recommendations, on price.
Factories need to decrease their cost to offer better price to the customers
To provided period of payment and discount offering to the customers
To produced quantity product near to the market by low /fair price to the customers.
To use price discounts, free samples, bonus packs to increase customer's intention to
purchase their products
Based on place, the study has a positive and significant effect on sales performance, at Deber
Berhan brewery factories, based these recommendations on the place.
Increase by number of distributes to local and foreign area
On time the delivery to the customers
To provide having safety stock
The factories should be responsive to complainants
To plan and identify the problems of sales, manage the procedure of sales and provide a
market system in selling
Based on promotion strategy, this study also positive and significant effect on sales performance,
the following recommendations are forward for the further improvement on this variable.
The factories should provide timely and rapid information to their customers
To practical direct marketing used by, the customers
To join the trade fair and educated sales staff
To use attractive stimuli's in their work environment and also during the promotion
In general, the overall of sales performance can be affected by marketing mix strategies factors
positive, strong and statistically significance. The brewery factories should focus more on the
four strategies which are product, place, promotion and to the effect of marketing mix, since
those strategies have a positive and significantly effect on the sales performance. However, the
other one strategy which is the price has negative and significantly effect of sales performance .

61
5.4.1 Policy Implications
The findings of this study result that, the most significant determinants of marketing mix
strategies to the brewery factories inside product, price, place and promotion. Since, in
developing policies and strategies for the brewery factories at significant attention should be
professional to enhance of marketing mix strategies and sales performance.
Therefore, in order to increase sales performance of the product of the management system of
Debere Berehan brewery factories, should use a strategy to undermine the attractive of the
competitors by contribution of lower prices or other motivations and this can be achieved by
minimizing the distributions of production and transaction cost.
5.4.2 Suggestion for further research
This study focused on the effect of marketing mix strategies on sales performance in case of
Deber Berhan brewery factories.The finding of this study may not represent the entire brwery
factories through Ethiopia. Therefore, using the finding of this research as a bench mark other
researchers needs to conduct research in this area. Beside on the researcher recommends that this
study only included four marketing mix strategies such as, product, price, place and promotion.
So, additional research, future study should increase the scope of this research in terms of the
number and type of brewery factories. Finally, for further researches, I suggest that to
investigating other components of marketing mix, which should be able to develop sales
performance. In addition, study on way of promotion and price has highly recommended and will
be useful under critical of competitive markets in brewery factories.
62
REFERENCES
Abiodium, T, (2011). Sales relationship between advertising for selected companies operating in
Nigeria. Journal of administration, university of Nigeria, Nsukka.
Adi Bhat(2019) , Marketing Capability, Strategy and Business Performance in Emerging
Markets of Pakistan. Journal of Social Sciences and Humanities, 7(2), 88- 102.
Aliata, L, (2012). Influence of Promotional Strategies on Banks Performance. International
Journal of Business, Humanities, and Technology, 2 (5), 169 - 178.
American Marketing Association (2008). Definition of Marketing and Expected Product Journal
of Consumer Research, 16 (December), 344–355
American Marketing Association (2010). Definition of Marketing and Expected Product Journal
of Consumer Research, 18 (December), 367–386.
Ampuero, O, & Vila, N. (2006). "Consumer Perceptions of Product Packaging". Journal of
Consumer Marketing, 23 (2), pp 100-112.
Baker,(1996), Effects of Sales Promotion on Purchasing Decision of Customer: A Case Study of
Baskin Robbins Ice–Cream Franchise Thailand. Unpublished Thesis Submitted to
Bangkok University.
Bartz, A.E. (1999). Basic statistical concepts, Upper Saddle River, NJ: Prentice-Hall
Belch ,(2003), Influence of Promotional Strategies on Banks Performance. International Journal
of Business, Humanities and Technology, 2 (5), 169 - 178
Berkowitz, Kerin, Hartley and Rudelius(2000), Advertising is any paid form of non-personal
communication about an organization, good, service or idea by an identified sponsor.
Brassington, F., & Pettitt, S. (2000). Principles of Marketing. 2nd Ed. Harlow Pearson Education
Caroline (2017),to conduct the effect of Marketing Strategies on sales performance of small and
medlum enterprises in keny

63
Cavusgil & Zou, (2004). Mixed methods designs. Educational research: Planning, conducting,
and evaluating quantitative and qualitative research, 509-529.
Cheruiyot, (2016), The Effects of Capital Structure on Firm ’ s Profitability : Evidence from
Kenya ’ s Banking Sector. Research Journal of Finance and Accounting
claude (2019), marketing strategies and sales performance of manufacturing firms in uganda:a
case study of tembo steels uganda limited.
Creswell, J. W. (2005). Mixed methods designs. Educational research: Planning, conducting, and
evaluating quantitative and qualitative research, 509-529.
Cravens et al ,(1993) a factories needs to consider the competitors in its industry in order to
develop successful strategies.
Deborah, I., L. (2016). The effect of branding on organizational performance in the retailing of
pharmaceutical products, the mediating role of customer Service. Kwame Nkrumah
University.
Dixon-Ogbechi,(2002), measuring the variable which are used for answering research question
or testing study hypothesis
Djamba, (2002), Social Research Methods: Qualitative and Quantitative Approaches. Teaching
Sociology. https://doi.org/10.2307/3211488
Emmanuel Ayuba & Roselyn ,(2014) .Investigating the impact of marketing mix elements
on consumer loyalty: An empirical study on Nigerian Breweries Plc.Interdisciplinary
Journal Of Contemporary Research In Business. 4 (11), 485 –496.
Engle,(2009),Physical distribution is a planning, implementing, and controlling the physical
flows of materials and final goods from points,pp:196.
Ferrell ,(2005) ,product is a marketing mix strategy in which organizations offers consumers
symbolic and experiential attributes to differentiate products
Field, A. (2009). Discovering statistics using SPSS age publications.
64
Ghazaleh & Haghighi, (2009). The Effect of Selling Strategies on Sales Performance. Business
Strategy Series, 10 (5), 266-282.
Gorchels, L., Marien, E., & West, C. (2004). The Manager's Guide to Distribution Channels.
USA, USA: McGraw-Hill.
Green, K, (2014). “Total JIT (T-JIT) and its impact on supply chain competency and
organizational performance”, International Journal of Production Economics, 147 (1), pp.
125-135
Gronroos (2010) up grade the early version of marketing mix elements from the 4Ps to 7Ps.
Guiltian&paul(1982),Sales promotion is the economical and informational incentives, which are
existing by companies to buyers or suppliers
Gujarat, D. (2004). Basic Econometric, 4th ed. USA, McGraw Hill.
Hair and McDaniel ,(2004). Penetration price is setting low price for new products hence
reaching a wider mass market
Hair, E.T,(1998). Multivariate data analysis, 5th ed. Upper Saddle River, NJ: Prentice-Hall
Healy & Perry (2000), declare that reliability is the extent to which results are consistent over
time and an accurate representation of the total population under study
Hesse,(2007) ,percy(20080),direct marketing is the main aim of direct marketing is to stimulate
the targeted audience to take a now action.
Horsky, S. & Honea,(2012). "The power of plain: intensifying product experience with neutral
aesthetic context", Marketing Letters, 23 (1), pp. 223-235
Hsir,(2003),reliability is the different authors accept different values of this test in order to
achieve internal reliability.
Immonen, L, (2010). Package Cues and Their Influence on the Perception of Premium Quality of
Premium Private Label Products. Unpublished Thesis Submitted to Aalto University.

65
Jain, S., C. (2004). Marketing Strategy: Planning: Implementation and Control. 7th Ed. Mason,
Ohio: Thomson Custom Publishing.
Jason Aten ,(2019), The Strategy and Tactics of Pricing: A Guide to Profitable Decision Making,
second ed. Prentice-Hall, Inc., Englewood Cliffs, NJ
Jean F ,(2004),Product quality is the overall characteristics of a product that allow it to perform
as expected in Satisfying customer
Jim. R. (2012). Pricing strategies-penetration pricing. Retrieved on 14th October 2017 form
http://www.tutor2u.net/business/marketing/pricing_strategy_penetration.asp.
Johnston (2009),public relations is a proactive and reactive management function used to assess
public attitudes.
Joyce Frank (2015), the effect of marketing mix (4Ps) on sales performance of Tigo
Telecommunication company in Tanzania.
Kamba (2010) in his research on effectiveness of promotion mix methods on sales in local
pharmaceutical manufacturing companies
Kanogal ,(2016), process where organizations decide where to locate their stock and how many
supplies of price
karimi (2015) to conduct on the effects of marketing strategies on sales performance of
commercial banks in kenya
Keramati,(2012) Relationship between marketing mix and sales performance in the context of
the Iranian Steel private firms.
Kiprotich, L. K. (2013).Effects of 4ps Marketing Mix on Sales Performance of Automotive Fuels
of Selected Service Stations in NakuruTown(Doctoral dissertation
Kolter, (2000), Marketing Management” Prentice Hall, New Jersey. Guinness Nigeria
(Kotler,2007). Pricing is the process where an organization determines what it will
receiveMarketing management, 12th edition, prentice Hall Inc,
66
Kothari, C. R. (2004). Research Methodology: Methods and Techniques. 2nd Ed. USA, USA.
New Age International Publisher
Kotler (2010) Marketing Management Analysis Implementation and Control 10th Edition New
York Pretience Hall.
Kotler (2011) Marketing Management Analysis Implementation and Control 10th Edition
Kotler, And Armstrong, (2010) “Principles of Marketing” Eleventh edition), prentices Hall, New
Hersee to marketing strategy
Kotler. P, & Armstrong, (2008). Principles of Marketing. International Edition. New York, USA:
Pearson Hall.
Kotler. P, & Armstrong, (2012). Principles of Marketing.14thEd.USA, USA: Pearson Hall.
Kotler. P, & Armstrong, (2013). Principles of Marketing. International Edition. New York, USA:
Lawal,(2012), Marketing mix strategies is an important tool globally for any business
organizations to remain in competitive
Leong, S. P. (1998). The impact of product packaging on consumer attitude and moderating the
effect of involvement. Unpublished Thesis Submitted to University of Putra, Malaysia.
Lupiyoadi, (2013), distribution channels, in this case related to how the delivery of services to
consumers and where the strategic location
Mahon and Yarcheski,(2002), the less variation of the instruments produces in repeated
measurements of an attribute the higher its reliability.
Malhotra, (2007), Marketing Research an Applied Orientation. 5th ed. New Jersey Prentice- Hall
Inc, Upple Saddle River
Marjanova & Stojanovski, (2012), marketing supports sales and expansion and contributes
significantly to the growth of market share in competitive markets.
McCarthy, (2004). The marketing plan around the habits, desires and psychology of the targe,
Managerial Approach(2nd ed.). Richard D.IRWIN, INC
67
McDaniel, C., and Gates, R. (2006). Marketing Research Essentials . New Jersey: John Wiley
and Sons Inc. ((5th Ed. ed.).
McCarthy, E.J. (2011) Basic Marketing: A Managerial Approach, Homewood, IL: Richard
mwenda (2017), who study on the effects of marketing mix on sales performance in case of unga
feeds limited
Mullin, R., & Cummins, J. (2008). Sales Promotion: How to Create, Implement & Integrate
Campaigns That Really Work, 4th Edition, , London, , London: Kogan Page Ltd.
Nagel, S & Singlton., J., Kenneth (2011). Estimation and Evaluation of Conditional Asset
Pricing Models. Journal of Finance, 66 (3), pp. 873-909.
Nagle &Holden,(2012),marketing mix are a set of controllable or the tactical tools in
marketing which are used by an organization
Negle, T,(2006).The Strategy and Tactics of Pricing: A Guide to Growing More Profitably.5th
Ed. Upper Saddle River, New Jersey: Prentice Hall.
Nguyen, McCracken, Casavant, and Jessup,(2011), Geographic location, ownership and
profitability of Washington log trucking businesses.
Pallant, (2010), diagnostics should have tolerance value and variance inflation factor (VIF) value
indicates less correlation of the variables .
Palmer, (2000), the conditions of the goods when they arrive all of which affect customer
satisfaction:405-410.
Palmer, (2011).Principles of Services marketing (3rd
),UK: McGraw-Hill Publishing Company
Patton (2002), Marketing strategy: Taxonomy and frameworks‟, European Business Review,
18, pp. 266–293.
Revelle and Mcdonald (2006),measures the inter correlations among test items, with a measure
of being higher in terms of internal consistency and reliability
68
Rotich,(2016), Sales Performance is the efficiency of the sales side, together separately and by
way of a methods
Salleh & Kamaruddin, (2011). The Effect of Personal Factors on Sales Performance of Takaful
Islamic insurance) Agents in Malaysia.
Santos-Vijande et al,(2012),also analyzed the organizational antecedents of marketing
capabilities and their impact on business performance
Saunders et al, (2009), ethics is the norms or standards of behavior that guide moral choices
about our behavior and our relationships with others
Sekaran, R (2003). Research Methods for Business: A Skill-Building Approach. 6thEd.
Sekaran, U., & Bougie, R. (2016). Research methods for business:. Askill building approach. (
6th edition ed.). John Wiley & Sons.
Schiele, (2008),availability and proximity of raw materials and labor, proximity to customers
Schoviah ,(2012),Findings revealed that marketing distribution strategies increased sales
Sehrawet, M.& Kundu,(2007), Buying behavior of rural and urban consumers in India: the
impact of packaging, International Journal of Consumer Studies, 31 (6), pp. 630- 63
Sekaran, U. (2003). Research Methods for Business: A Skill-Building Approach. ( 4th Edition
ed.). John Wiley & Sons, New York
Silva, (2006). Marketing strategy is the fundamental goal of increasing sales and achieving a
sustainable competitive advantage
(Stevens, (2002), Marketing Planning and Strategy.5th edition .South Western College pblishing.
Szymanski and Henard(2001),Penetration pricing is used when price of demanded product is at a
level that will enable an organization increase sales
Taiwo et al,2010), “Beyond the Many Faces of Price: An Integration of Pricing Strategies”.
Journal of Marketing, Vol. 50, October, pp. 146160
69
Theodros Solomonthe(2019) Younger onset dementia: a literature review Woollongong,
Australia: Australian Health Service Research Institute.
Walker, O,(2008). Marketing Strategy: A Decision-Focused Approach.(6th Edition).Publisher
McGraw- Hill Irwin
Woldegeberi ,(2011), Pricing for Retail Banking: Scope for boosting customer satisfaction and
profitability. Current Issues Global Financial Market. Deutsche Bank AG. Germany
Zaidation and Bagheri (2019), Business and educational management methodology. South
westrn college pub.ISBN 10, 032536620, university of florida.
Zhang and Tang ,(2010), Research Methods for Business: A Skill-Building Approach. ( 4th
Edition ed.). John Wiley & Sons, New York.
Zhang,(2015). Business Research Methods. Published by South-Western College. International
Journal of Academic Research in Accounting, Finance and Management Sciences,
(2015), Vol. 4, No.1.
70
APPENDIX-I
College of Business and Economics Department of Management
This questionnaire is designed for collecting data for a research to be conducted on the
effect of marketing mix strategies on sales performance in case of Debere Berehan Brewery
factories, at Debere Berehan city .
Dear Respondents :
I am conducting a research on “The effect of marketing mix strategies on sales performance
in case of Debere Berehan Brewery factories in Debere Birehan city in partial fulfillment of
the requirements for masters of business administration,(MBA) at Debere Berhan University.
Your information is vital for the accomplishment of the study, it is intended for academic
purpose only and it will be kept confidential.
Prepared By : Masresha Abate
Phone number +251974156355
E-mail : [email protected]
General Instructions:
There is no need for writing your name.
Please put a [✔] mark in the box of your choice.
Part I : General Information.
1. Sex of the respondents:
Male Female

71
2.Age of the respondent :
<= 30 31-35
36-40 > 40
3. Education status :
Certificate diploma First degree master &a bove
4 . Marital status :
Single married
Widowed divorced
5. Years of experience :
<= 4 5-7
8-10 >40
6. Job title:
1 . Managers 2.Non-managers
Part II : Related to marketing mix strategies :
Instruction: Please read each statement and indicate your level of agreement (on the
response Scale: 1 to 5) by taking from the options provided as strongly agree, agree, neutral,
disagree, and strongly disagree. (Tick one from the given five scales.)
Response scale:
1 = strongly disagree, 2 = disagree
3= neutral 4 = agree
5 = strongly agree
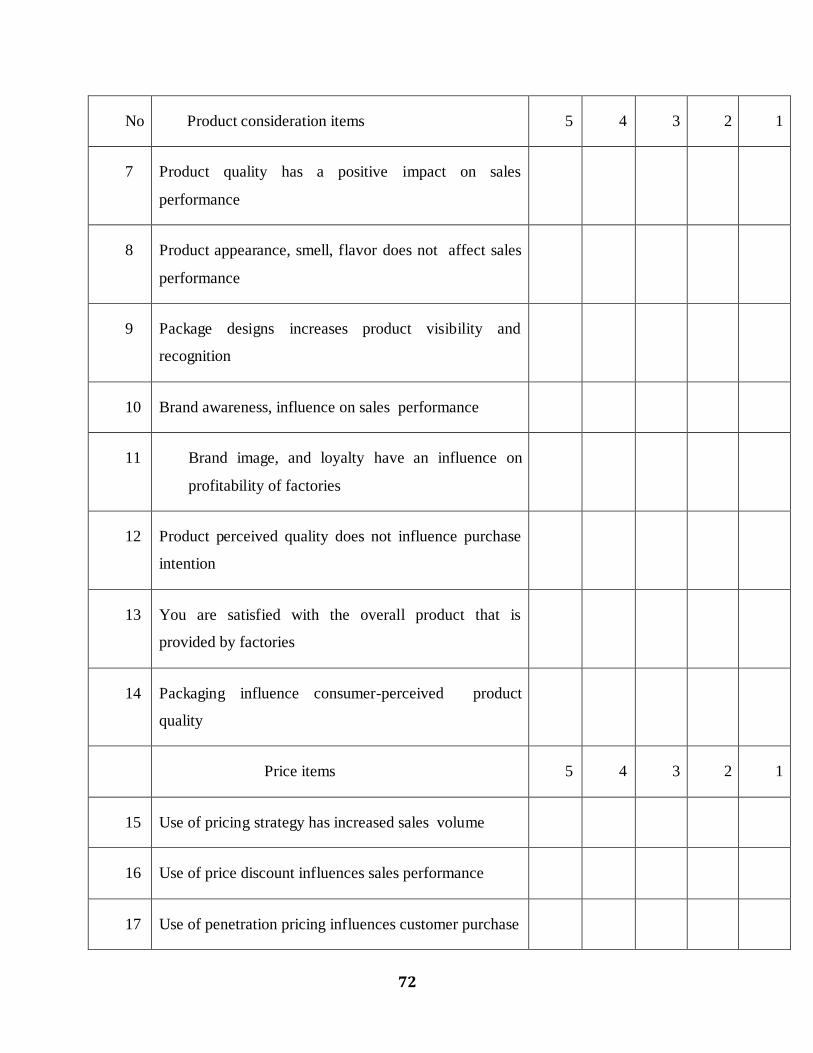
72
No Product consideration items 5 4 3 2 1
7 Product quality has a positive impact on sales
performance
8 Product appearance, smell, flavor does not affect sales
performance
9 Package designs increases product visibility and
recognition
10 Brand awareness, influence on sales performance
11 Brand image, and loyalty have an influence on
profitability of factories
12 Product perceived quality does not influence purchase
intention
13 You are satisfied with the overall product that is
provided by factories
14 Packaging influence consumer-perceived product
quality
Price items 5 4 3 2 1
15 Use of pricing strategy has increased sales volume
16 Use of price discount influences sales performance
17 Use of penetration pricing influences customer purchase

73
18 Factories suggestions products in lower price
market segments
19 Price has a significant impact on sales performance
20 Price promotion strategies does not affect sales
performance
21 Value-based pricing has a positive impact on
profitability
Place items 5 4 3 2 1
22 The use of distribution channels influences sales
and profit
23 The delivers products at the right time
24 Store design has a positive effect on consumer
purchase and sales performance
25 Close location of organizations selling similar
products affects performance
26 Use of attractive stimuli such as music has an
influence on customers
27 Location of retail stores far from customers has a
negative effect on their purchase intention
28 Geographic location has a significant influence on
profitability

74
Promotional tools 5 4 3 2 1
29 Sales promotions influence sales performance
30 Use of sales promotion has increased brand loyalty
at the brewery factories
31 Factories proposals price discounts and coupons
32 Advertising has increased sales at the brewery
factories
33 Use of sales promotion creates interest and brand
awareness
34 Use of direct marketing at factories has led to an
increase in profit
35 Uses of personal selling and publicity to promote
their products
36 Promotion of products gives factories a
competitive advantage
Sales performance 5 4 3 2 1
37 Product mix leads to increase sales performance
38 Price strategy increases sales performance
39 Promotional mix of the factories increase sales
performance

75
40 The factories use effective place and it leads to
increase sales performance
41 In general, the factories marketing mix strategies
increase sales performance
Source: Adapted from Mwenda Gituma(2017).