the effect of deliberate aluminium additions on the ... · the effect of deliberate aluminium...
TRANSCRIPT

The Effect of Deliberate Aluminium Additions on the Microstructure of Rolled
Steel Plate characterized using EBSD
Y. Palizdar1, R. C. Cochrane
1, R. Brydson
1, D. Crowther
2, D. San Martin
3 and A. J.
Scott1
Tel and Fax: +441133432552
1Institute for Materials Research, SPEME, University of Leeds, Leeds LS2 9JT UK
2Corus Group, Swinden Technology Centre, Rotherham, S60 3AR UK
3MATERALIA group, Department of Physical Metallurgy, (CENIM-CSIC), Centro
Nacional de Investigaciones Metalúrgicas Av. Gregorio del Amo 8, 20040 Madrid,
Spain.
Key words: low carbon steel, aluminium, ferrite grain size, EBSD
The use of aluminium as a deliberate alloying addition in steels has attracted
increased attention recently as a possible replacement for Si in Transformation
Induced Plasticity (TRIP) steels. In addition, some authors have suggested that it
offers beneficial effects as a solid solution strengthener as well as galvanizability. In
this work three low carbon (0.02 wt%) manganese (1.4 wt%) steels have been alloyed
with very different aluminium contents (0.02, 0.48 and 0.94 wt%) in order to study
the effect of this alloying element on the final ferritic microstructure. Two different

rolling schedules have been applied to these steels and the final microstructures have
been characterized extensively by EBSD measurements. The results indicate that
aluminium additions have a profound influence on ferrite grain size and the grain
boundary misorientation distribution functions.
1. Introduction
Traditionally, aluminium has been used in steels mainly as a deoxidising or grain
refining element (combined with nitrogen it forms AlN precipitates that inhibit
austenite grain growth) in amounts rarely exceeding 0.01 to 0.07 wt%, except in
specialized steels for nitriding or forging applications. At present there is a great
commercial interest in Al additions, of the order of 0.5-2 wt%, to low carbon, high
strength strip steels to produce a highly desirable multi-phase microstructure
containing retained austenite for cold forming applications for which a coarse grained
ferritic structure is preferred. These steels rely on conventional strip mill processing to
produce a microstructure composed of ferrite, austenite, bainite and martensite which
possesses a combination of high strength and ductility. Such good properties originate
from the so-called transformation-induced plasticity (TRIP) effect, which arises due
to the transformation of austenite to martensite during plastic deformation [1-3].
However, inappropriate processing of such steels is known to produce a
ferrite/martensite microstructure with very poor formability behaviour and toughness.
In addition, recently Mintz [4] has shown that Al additions can be used as a solid
solution strengthener.

Apart from the effect of additional Al on the mechanical properties of TRIP steels and
also the effect of AlN on steel microstructure, there is very little detailed literature
concerning the effect of aluminium in amounts higher than 0.1 wt% on steel
microstructure. Aaronson and co-workers [5] showed that additional aluminium in
amounts of 1.5 wt% increases the Ae3 temperature (austenite to ferrite transition
temperature). Also, Mabuchi et al. have shown that the addition of aluminium can
change the steel microstructure [6, 7] from mostly fine ferrite to coarse upper bainite
in a Mn-Mo steel. Nakamaya [8] has studied the effect of aluminium on the grain size
of a magnetic steel and Jeong [9] has investigated the role of aluminium in an ultra
low carbon steel. Both studies indicated that aluminium has a pronounced effect on
the ferrite grain size present in the final microstructure. Thus, although there has been
some work on the effect of aluminium in steel microstructures, it is believed that there
has been no comprehensive study about the effect of free aluminium in steel,
particularly in amounts ranging between 0.1 wt% and 1.5 wt%, on the final ferritic
microstructures and ferrite transformation kinetics.
Following our previous work [10, 11] on the effect of Al in steels with the same base
composition (0.02 C wt% - 1.5 Mn wt%) and different aluminium contents (0.02, 0.48
and 0.94 wt%), in this work the ferritic microstructures obtained in these steels,
following two different rolling schedules, is characterized extensively. The average
ferrite grain size, ferrite grain size distribution and misorientation distribution
function have been analyzed in the mid-thickness, central region of rolled plates using
electron backscattered electron diffraction (EBSD). This technique has allowed us to
obtain detailed microstructural information that would either not be obtainable or

would take a significantly longer time using other techniques such as XRD, TEM
and/or optical microscopy.
2. Materials and Methods
To investigate the influence of aluminium on steel microstructure, three low carbon
steels with a range of aluminium additions (0.02, 0.48, 0.96 wt% Al) were prepared in
a laboratory vacuum melt furnace as 50kg casts. Table 1 shows the chemical
compositions for each steel. As can be seen, the level of nitrogen was kept as low as
possible so as to avoid the formation of aluminium nitride precipitates (which would
complicate any analysis of the effect of free aluminium on microstructure). Besides
the composition, Table 1 also shows the expected amount of free Al in solid solution,
assuming that all the nitrogen in the steel is combined with aluminium, forming AlN
precipitates. The amount of free Al can be estimated using the following equation[7]:
Al (free) = total Al – 27/14 N (in wt%) (1)
To investigate the size and quantity of AlN precipitates, carbon replicas were
extracted and analyzed by transmission electron microscopy (TEM) using a Philips
CM20 TEM operated at 200 kV
Two different schedules were used to study the effect of rolling on the final ferritic
microstructure (Table 2). These schedules were based on previous experience of
laboratory rolling of C-Mn-Nb steels and, as such, were not expected to be optimal for
these low carbon steels. The first rolling schedule, hot rolling (HR), consisted of
rolling the plate from 1250 oC continuously down to a finish rolling temperature
(FRT) of ~1090 oC; this contrasts with the second schedule, controlled rolling (CR),
which used the same reductions per pass but with an intermediate hold at 42 mm plate
thickness during which time the temperature dropped from ~1180 oC to ~1050
oC,
rolling then continued (with the same reductions per pass) down to a lower FRT of
950 oC. Surface temperatures at the start and end of rolling were measured by a
pyrometer approximately 1 m above the exit of the rolling stand and are not
considered particularly reliable; the temperatures quoted here are based on implanted
thermocouple measurement on the rolling mill at Corus STC Rotherham and backed
up by computer modelling of the time/temperature profile for plates of similar
dimensions rolled on the same mill [12].
The metallography specimens were polished and etched with 2% nital. The specimens
were examined using a Nikon Optiphot reflected light microscope. Images were
captured from the centre of specimens using a CCD camera and Zeiss Axiovision
software.
To assess the average ferrite grain size and ferrite grain size distribution for each
steel, EBSD measurements were employed. Samples were prepared by polishing on a
Buehler Vibromat vibratory polisher using non-crystallising colloidal silica. EBSD
measurements were carried out using a Carl Zeiss SMT Leo 1530 FEG-SEM operated
at 30 kV with patterns detected and analysed in real time using an Oxford Instruments
camera and associated INCA software. EBSD maps were collected for each sample
from the middle of each plate using a step size of approximately 1 µm and a 5 degree
misorientation cut off was applied for the purposes of identifying individual grains.
To enhance the reliability of the results, EBSD measurements were performed at low

magnification in order to include a sufficient number of grains (in general, more than
600 grains).
3. Results
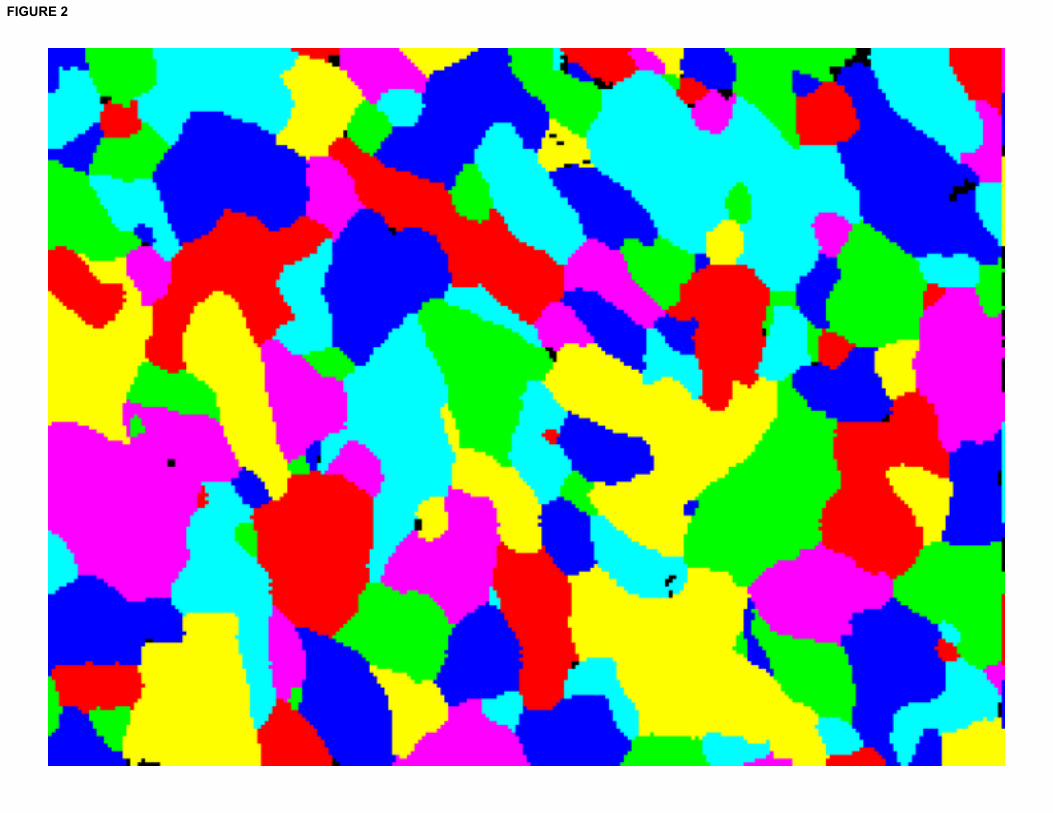
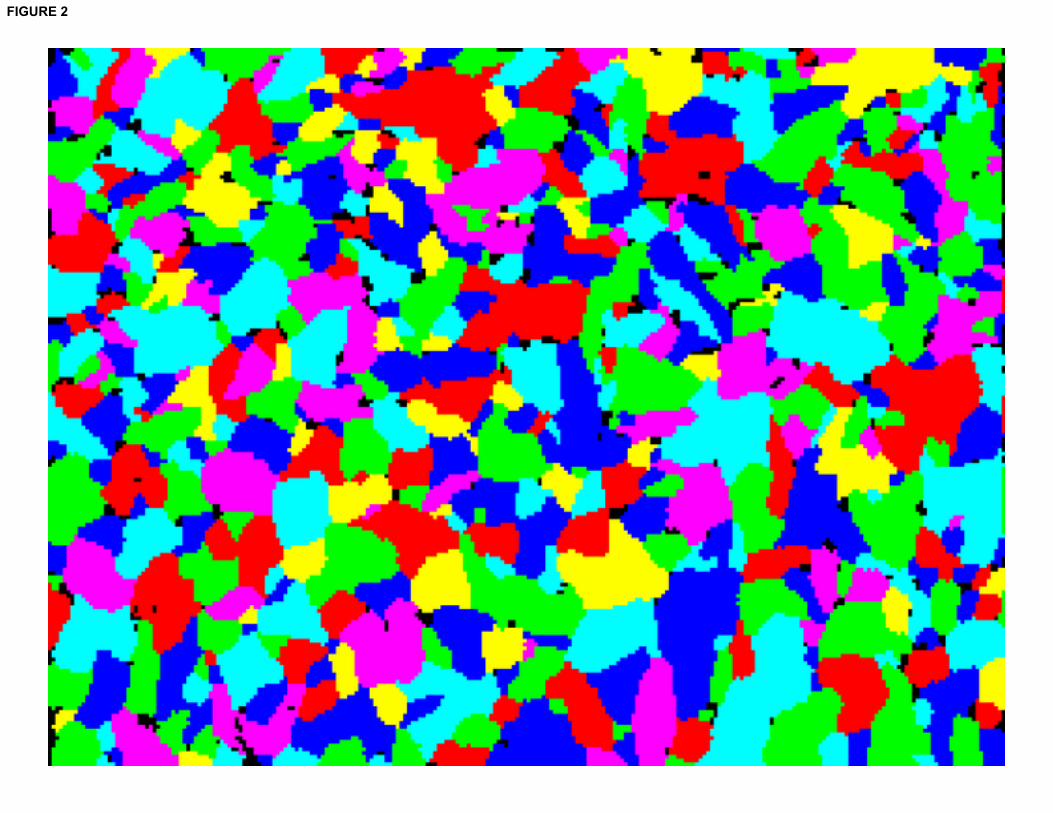
The metallography images of samples E, F, G (HR) and L, M (CR) are shown in
Figure 1. Figure 2 shows the EBSD grain orientation maps for each sample. Table 3
shows the average ferrite grain size obtained by EBSD. The mean linear intercept
values were calculated from the ASTM numbers determined by the EBSD software.
As can be seen, for the same rolling schedule (HR or CR), increasing Al content leads
to a finer ferritic microstructure. As has been reported previously [10], the additional
Al in the HR condition does not cause a significant change in ferritic microstructure
when present in amounts less than 0.5 wt%, however, the present study on the CR
condition shows that a change in ferrite grain size is apparent in this condition when
Al is present at levels of ~0.5 wt%. Although a finer grain structure was expected in
the CR as opposed to the HR condition, comparison between steels E and L (both
containing 0.02 wt% Al) shows no appreciable difference. However, in Al treated
steels (F and M both containing 0.48 wt% Al) a considerable reduction in ferrite grain
size can be observed for the CR condition.
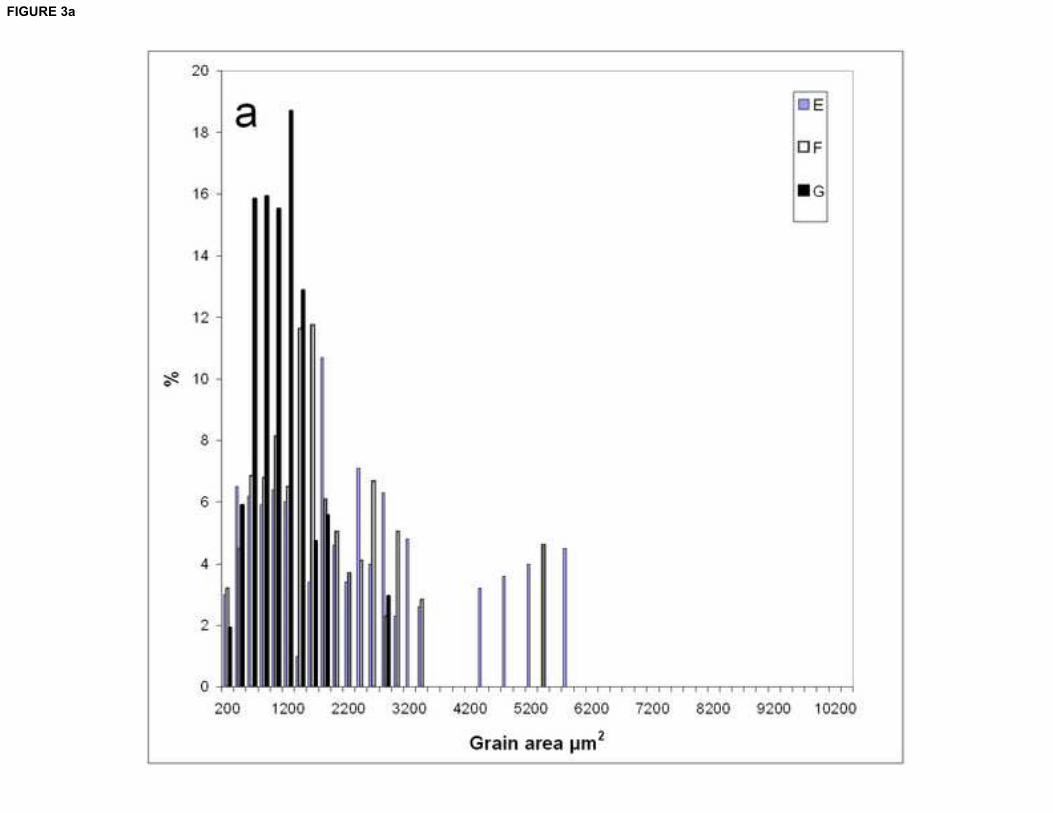
Figure 3 compares the ferrite grain area distributions for the investigated steels. As
explained recently [10], comparison of the ferrite grain area distribution (FGAD) for
steels E and F shows little change while the FGAD for composition G shows a
narrower and tighter distribution. Apparently, there are finer ferrite grains present in
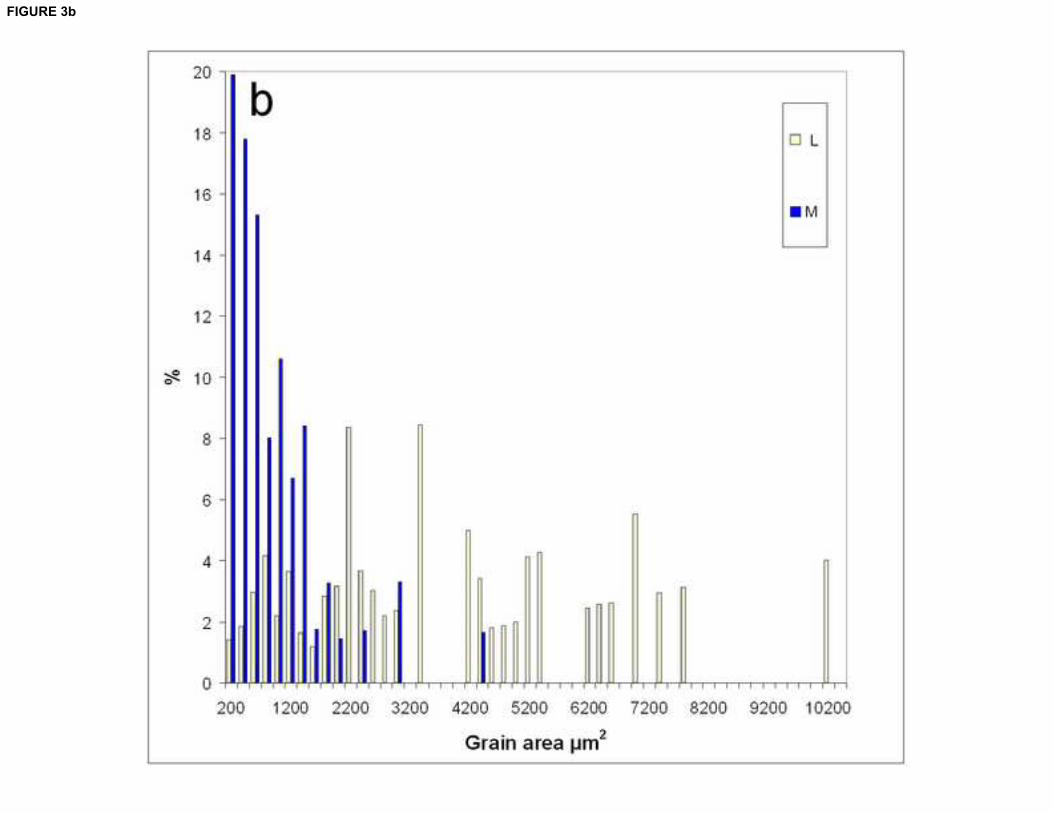
G and the additional Al has eliminated all grains coarser than 3200 μm2. Figure 3b

shows the influence of additional Al in the CR condition. The FGAD for M shows a
much higher number of small ferrite grains. For instance, for steel M in Figure. 3b,
45% of the grains are less than 600 μm2 in area while there is a much wider range of
grain areas for steel L. In contrast, the FGAD of steel L shows a long tail of large
grains, hence there is a greater percentage of the overall area fraction in the form of
grains coarser than 4400 μm2. A comparison of steels F and M (Figure 3a and 3b)
indicates that in the CR condition, as expected, much finer grains can be observed and
coarse grains are scarce.
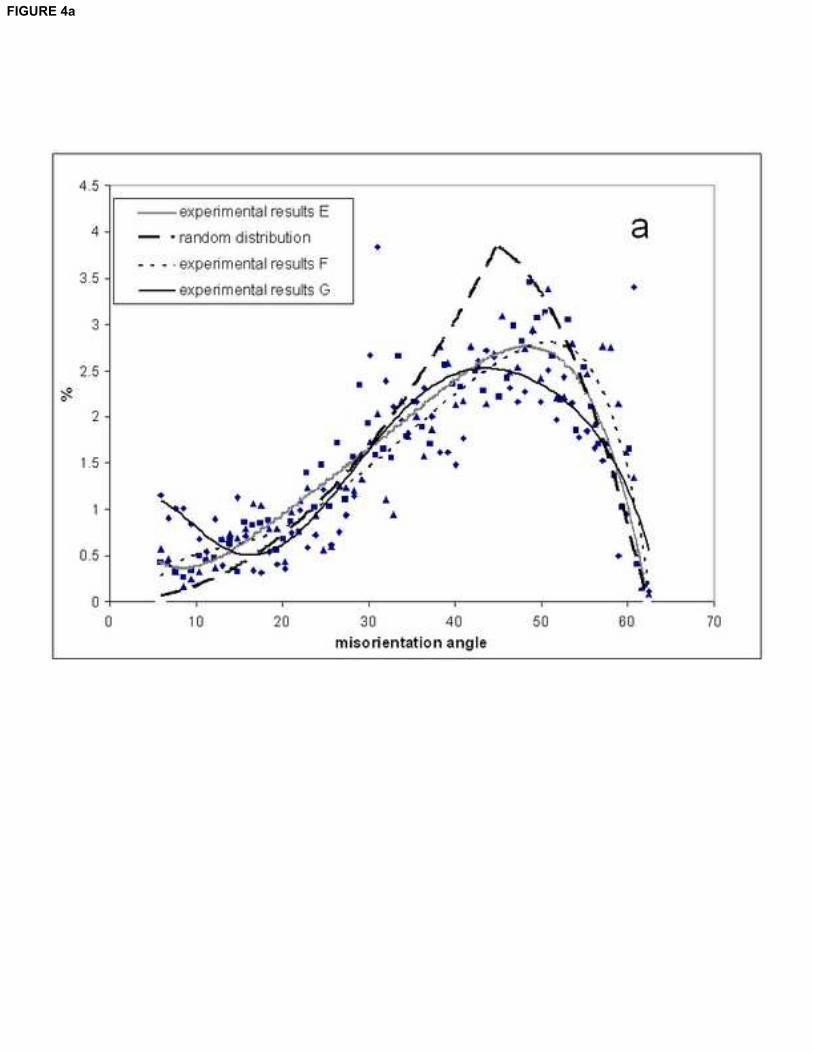
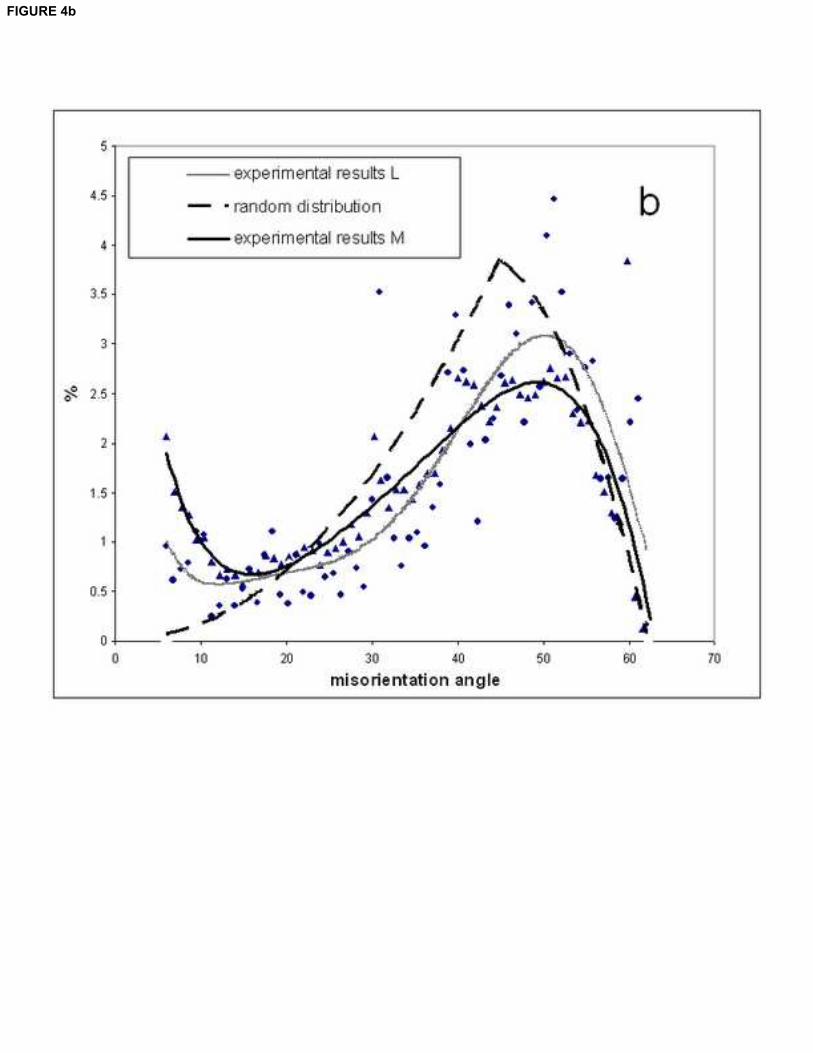
The previous grain misorientation distributions results (HR) [10] have been compared
with the results from CR condition in Figures 4a and 4b. The dashed line shows the
theoretical distribution for randomly oriented grains provided by Mackenzie [13].
Although the grain misorientation distributions for steels E and F (Figure 4a) are
qualitatively similar to that predicted for a completely random orientation of grains,
the results do reveal that there is a high proportion of low angle misorientations,
particularly for the Al-containing steels G (0.94 wt% Al and HR) and control rolled
steels.
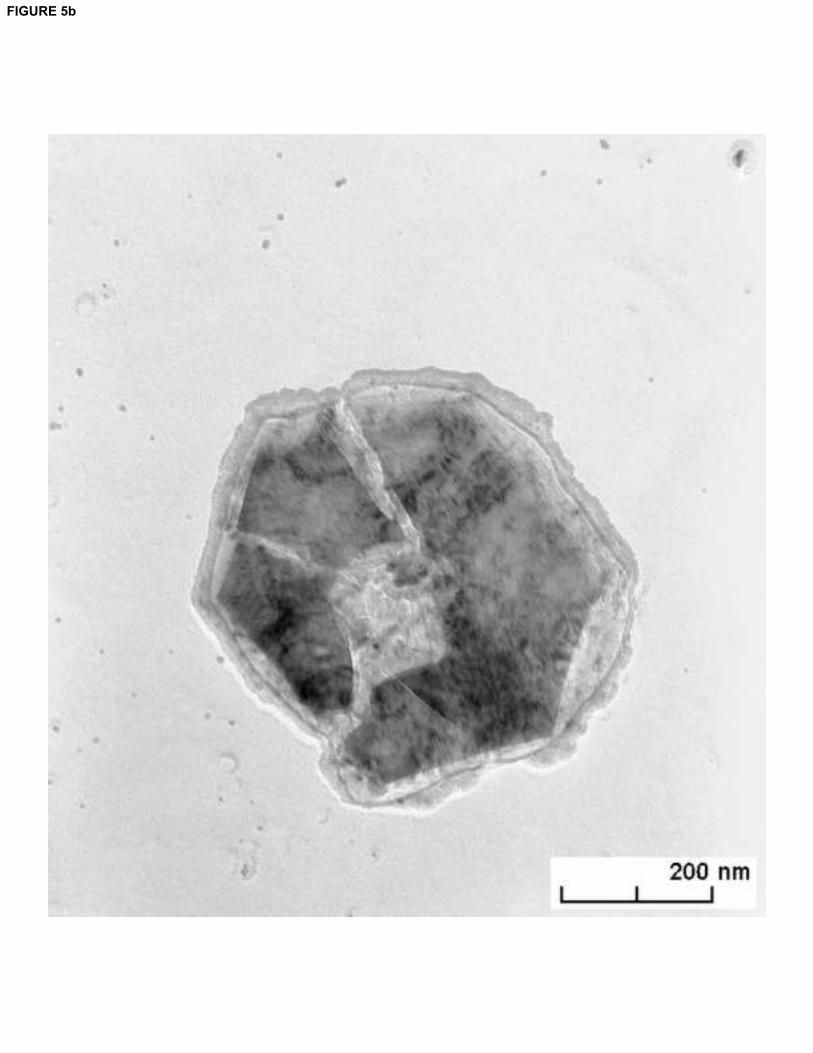
The presence of any AlN particles, which could lead to grain refinement, was
determined via TEM for both Al treated, hot rolled samples (F and G). TEM results
show that the AlN particle size extracted by the carbon replica technique to be
approximately 500 nm (Figures 5a and 5b).

4. Discussion:
4.1 Ferrite grain size
As mentioned before, there is little in the literature concerning the effect of Al as a
solute element on ferrite grain size. However, there is some work concerning the
effect of additional Al up to 0.3-0.4 wt %, mostly in high Si magnetic steels. In these
afore-mentioned studies, attempts were made to reveal the effect of Al in the range of
0.001-0.4 wt% on ferrite grain size. These studies concluded that the effect of Al on
ferrite grain size can be categorized as follows:
1) The effect of Al in amounts between 0.01-0.07 wt%; here, the effect of Al as a
grain refiner element has been well established [14]. It is well known that Al can form
AlN and inhibit both austenite and ferrite grain growth. This means that by adding Al
to a nitrogen containing steel (commercial steels normally contain between 0.002 and
0.008 wt% N) a finer ferrite grain size can be obtained.
2) The effect of Al at higher amounts (> 0.07 wt%); there is little in the literature
concerning Al additions above 0.07 wt % which is expected since there is no desire by
steel makers to produce high Al steels owing to the fact that high Al content can cause
lower castability with problems such as nozzle blocking. Also, since Al has not been
recognized as a solid solution strengthener there was no reason for steel makers to use
Al as a deliberate addition to steels except as noted in the introduction. However,
information about the effect of additional Al in amounts between 0.1-0.4 wt% can be
found [8, 9, 15, 16]. Nakamaya and Hojou have shown that by adding 0.07 wt% Al,
ferrite grains become finer while the addition of more than 0.1 wt% Al leads to

slightly coarser ferrite grains as compared with the Al free steel [8]. They attributed
this phenomenon to the effect of additional Al on the size of AlN particles. As they
reported, adding more Al to the steel makes the AlN particles coarser. For instance, in
a 0.05 wt %Al steel the average AlN particle size observed was 50 nm while in a 0.3
wt % Al steel AlN particles up to 1.2 μm were seen. It is well established in the
literature [14] that by increasing the size of AlN, these particles lose their efficiency
in contributing to the grain boundary pinning process.
In addition to the role of AlN in controlling ferrite grain size in Al-treated steels (in
amounts higher than 0.1 wt%), there are two more factors which need to be
considered. These are the effect of Al on the prior austenite grain size, not only as a
result of the presence of AlN particles but also, more directly, Al segregation to
austenite grain boundaries causing solute drag, and the influence of Al on critical
transformation temperature (Ae1, Ae3 ). It is believed that in steels with high Al
contents, for example 0.5 wt% or more, these two latter factors play important roles.
However, these parameters have been ignored in the mentioned studies.
Concerning the role of AlN in the investigated steels, our TEM results (Figure. 5) are
consistent with the previous results of Nakamaya and Saxena [8, 16]. As can be seen,
AlN particles in steels F and G are observed to be around 500 nm in size. This,
together with the fact that there is no significant difference in the volume fraction of
AlN in steels E, F and G, due to the very low levels of N, it is believed that the limited
number of relatively large AlN particles do not play a significant role in the
determination of the final ferrite grain size.

Alternative interpretations for the appearance of finer ferrite grains in Al containing
steels may be associated with the effect of Al on the Ae3 temperature and also on the
accumulated strain prior to the austenite to ferrite transformation. The critical
transformation temperatures for the investigated steels were determined by using
dilatometry and reported in a previous paper [10]. However, the authors believe that
the application of a very low heating rate enables Al atoms to partition into ferrite
which would automatically raise the measured Ae3. It is considered that
transformation during rolling would take place rapidly at relatively fast cooling rates
and therefore there is little prospect for Al partitioning to transforming ferrite
austenite interfaces. Calculation of transformation non-partition temperatures using
MTData [17] was performed to obtain a better understanding of the results. Table 4
shows the Ae1 and Ae3 temperatures predicted by MTData for steels E, F and G; it
can be assumed temperatures Ae1 and Ae3 for steels L, M are the same as those
predicted for steels E and F. Many studies of controlled rolling have shown that the
amount of retained strain in austenite plays a significant role in the determination of
the final ferrite grain size that is observed at the end of rolling [18]. The MTData
results show that additional Al can raise the Ae3 temperature and hence the FRT
moves closer to Ae3 in the Al treated steels (F and G). In addition, increasing the Ae3
leads to there being less time for austenite grain growth after finishing the rolling.
Therefore, during the cooling after rolling in the higher Al content steels, austenite
grains will have less time to recrystallize and grow before commencing the austenite
to ferrite phase transformation and therefore the ferrite grain size can be expected to
be smaller for steel G as compared to steels F or E. A combination of all these
phenomena would lead to a finer ferrite grain structure. However, more structured
rolling studies would be needed in order to fully understand the whole process.
In addition, the CR samples show a more pronounced effect of additional Al on ferrite
grain size in comparison with the HR samples. However, changes in the rolling
schedule do not appear to have the same influence for the 0.02 wt% and 0.5 wt% Al
containing steels. The results show that control rolling of the 0.02 wt % Al steel leads
to a slightly coarser average ferrite grain size and also promotes the presence of very
large ferrite grains (Figure 3b). A likely explanation for the reason why steel L was
coarser grained after an apparently more ‘controlled’ rolling schedule (compare with
steel E) lies in the rolling schedule used. As already mentioned, the particular rolling
schedule used here for CR had not been optimized for the controlled rolling of steels
with such low C contents (being based on studies of Nb steels with carbon contents
from 0.05 to 0.15 wt%). During the early development of controlled rolling practices,
it has been well documented that the controlled rolling process would not lead to a
desirable microstructure unless austenite recrystallisation is properly controlled before
the plate temperature falls into the partial recrystallisation region [19, 20]. It is highly
probable that in the absence of any effective pinning particle such as AlN, the growth
rate of austenite grains would become extremely high. Therefore, holding the material
at 1180 ºC and allowing it to fall to 1050 ºC allows the development of some coarse
austenite grains which subsequently give rise to coarse grains of ferrite. The
appearance of ferrite grains greater than ~5000 μm2
(Figure 3b) is consistent with this
interpretation.
As mentioned above, the effect of additional Al on ferrite grain size is considerably
more in the CR condition (steel M). The interpretation of more pronounced grain
refinement in the CR condition could be due to the lower FRT (in comparison with

steel F) which results in higher retained strain and less time for growth and also the
effect of Al on prior austenite grain size which could lead to noticeable grain refining.
4.2 Ferrite grain misorientation distribution (GMOD)
Regarding the change in the grain misorientation distribution (GMOD) it should be
noticed that there appears to be a correlation between a higher number of low angle
misorientations and the levels of additional Al in the steel and also controlled rolling (
Figures 4a and 4b, respectively). The presence of excess low angle grain boundaries
i.e. < 15º has been reported in some cases [21, 22]. Priestner and Ibraheem [21] have
shown that warm rolling of a Nb steel results in an excess of low angle grain
boundaries which are representative of substructure. Table 5 and Figure 6 show
considerable correlation between the amount of low angle grain boundaries and
difference between Ae3 and FRT for each steel. In the case of our investigated steels it
is believed that when Ae3 becomes close to the finishing rolling temperature (FRT)
the amount of low angle grain boundaries raises. For instance, a comparison among E,
F and G shows that the steel which has the higher Ae3 has a higher excess of low
angle misorientations. Also, a similar effect is seen for the CR condition. However, it
should be noted that comparison between HR and CR grain boundary misorientation
distribution (GBMD) results shows that in general CR steels have a greater proportion
of low angle boundaries which can be interpreted as a consequence of lower FRT for
this specific type of rolling schedule or in other words, a lower difference between
Ae3 and FRT.

Generally, the CR results are consistent with our previous observations on the HR
steels and also with those of Priestner and Ibraheem [21]. However, it should be noted
that they observed a higher proportion of low angle grain boundaries owing to the
specific type of rolling schedule.
5. Conclusion
The results presented here show the strong effect of significant Al additions to ultra-
low carbon and nitrogen steels on ferrite grain size. Both the level of nitrogen present
in the steels plus TEM observations, lead us to believe that this can not arise as a
consequence of AlN formation. We suggest that this grain refinement should be
considered to be mainly an effect of aluminium on the Ae3 temperature and,
consequently, the amount of retained strain in austenite. The other interesting result
which needs further consideration is the presence of low grain misorientation angles
in Al-containing steels. These results show that the existence of excess low angle
grain boundaries not only in Al treated steels but also high levels in those Al
containing steels which had undergone controlled rolling. Also, these results can be
interpreted as an influence of Al on Ae3 which leads to a smaller difference between
the FRT and Ae3.

Reference:
[1] S. C. Baik, S. H. Park, H. Kwon, D. I. Kim, K. H. Oh, Effects of nitrogen on the
mechanical properties of cold rolled TRIP-aided steel sheets, ISIJ Int. 46 (2006) 599-
605.
[2] E. Girault, A. Mertens, P. Jacques, Y. Houbaert, B. Verlinden, J. Van Humbeeck,
Comparison of the effects of silicon and aluminium on the tensile behaviour of
multiphase TRIP-assisted steels, Scr. Mater. 44 (2001) 885-892
[3] O. Grassel, L. Kruger, G. Frommeyer, L. W. Meyer, High strength Fe-Mn-(Al, Si)
TRIP/TWIP steels development - properties – application, Int. J. Plast. 16 (2000)
1391-1409.
[4] B. Mintz, W. D. Gunawardana, H. Su, Al as a solid solution hardener in Steels,
Mater. Sci. and Technol. 24 (2008) 596-601.
[5] K. R. Kinsman, H. I. Aaronson, Influence of aluminum, cobalt, and silicon upon
the kinetics of the proeutectoid ferrite reaction, Metall. Trans. 4 (1973) 959-967.
[6] H. Mabuchi, H. Nakao, The Effects of Excess Aluminum on Low-temperature
Toughness in A302C Steels, ISIJ Int. 7 (1981) 495-501.
[7] H. Mabuchi, H. Nakao, The Effects of Excess Aluminum on Mechanical
Properties of Mn-Mo, Mn-Mo-Ni and Mn-Mo-Ni-Cr Steels with Regard to Solute
Interactions, ISIJ Int. 6 (1983) 504-512.
[8] T. Nakayama, N. Honjou, Effect of aluminum and nitrogen on the magnetic
properties of non-oriented semi-processed electrical steel sheet, J. Magn. Magn.
Mater. 213 (2000) 87-95.
[9] W. C. Jeong, Role of aluminum in hot-rolled ultra-low-carbon Nb-interstitial-free
steels, Metall. and Mater. Trans. A 37 (2006) 3737-3739.
[10] Y. Palizdar, A. J. Scott, R. C. Cochrane, R. Brydson, Understanding the effect of
aluminium on microstructure in low level nitrogen steels, Mater. Sci. Technol. 25
(2009) 1243-1248.
[11] Y. Palizdar, R. C. Cochrane, R. Brydson, F. Bygrave, A. J. Scott, Understanding
the role of aluminium in low level nitrogen steels via microstructural characterisation
, Journal of Physics: Conference Series 126 (2008) 012019.
[12] R. C. Cochrane, unpublished research, Corus, UK.
[13] J. K. Mackenzie, 2nd Paper on Statistics Associated with the Random
Disorientation of Cubes, Biometrika 45 (1958) 229-240.
[14] F. G. Wilson, T. Gladman, Aluminum Nitride in Steel, Int. Mater. Rev. 33 (1988)
221-288.
[15] A. Saxena, S. K. Chaudhuri, Correlating the aluminum content with ferrite grain
size and core loss in non-oriented electrical steel, ISIJ Int. 44 (2004) 1273-1275.
[16] A. Saxena, A. Sengupta, S. K. Chaudhuri, Effect of absorbed nitrogen on the
microstructure and core loss property of non-oriented electrical steel, ISIJ Int. 45
(2005) 299-301.
[17] MTDATA, The NPL Software tool for the calculation of phase equilibria and
thermodynamic properties, National Physical Laboratory, UK.
[18] R. Bengochea, B. Lopez, I. Gutierrez, Influence of the prior austenite
microstructure on the transformation products obtained for C-Mn-Nb steels after
continuous cooling, ISIJ Int. 39 (1999) 583-591.
[19] W. B. C. Morrison, J. A., Controlled rolling, in: Br. Steel Corp., Open [Rep.], Br.
Steel, Sheffield (1975) 20-29.
[20] F. Vodopivec, M. Gabrovsek, M. Kmetic, A. Rodic, Interpass Recrystallization
of Austenite in Some Steels During Rolling, Met. Technol. 11 (1984) 481-488.

[21] R. Priestner, A. K. Ibraheem, Processing of steel for ultrafine ferrite grain
structures, in: Materials Congress 2000, I O M Communications Ltd Inst Materials,
Cirencester, England, 2000, pp. 1267-1272.
[22] B. Eghbali, EBSD study on the formation of fine ferrite grains in plain carbon
steel during warm deformation, Mater. Lett. 61 (2007) 4006-4010.

Table 1 Steel compositions (wt%), excess Al based on equation (1) and rolling
treatments
Steel sample C Si Mn P S Al N
Aluminium
(free)
Rolling
schedules
E 0.028 0.28 1.41 0.001 0.001 0.02 0.001 0.018
HR F 0.019 0.28 1.41 0.001 0.001 0.48 0.001 0.478
G 0.022 0.29 1.41 0.001 0.001 0.94 0.001 0.938
L 0.028 0.28 1.41 0.001 0.001 0.02 0.001 0.018 CR
M 0.019 0.28 1.41 0.001 0.001 0.48 0.001 0.478
Table(s)
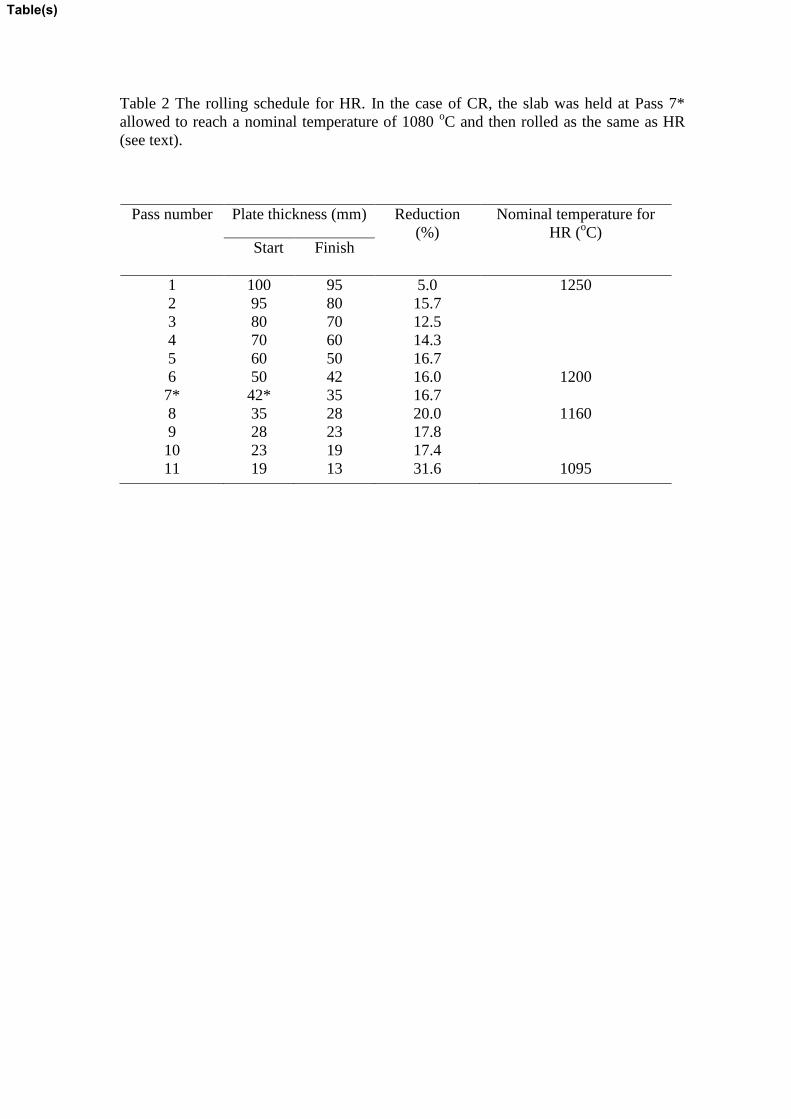
Table 2 The rolling schedule for HR. In the case of CR, the slab was held at Pass 7*
allowed to reach a nominal temperature of 1080 oC and then rolled as the same as HR
(see text).
Pass number Plate thickness (mm) Reduction
(%)
Nominal temperature for
HR (oC)
Start
Finish
1 100 95 5.0 1250
2 95 80 15.7
3 80 70 12.5
4 70 60 14.3
5 60 50 16.7
6 50 42 16.0 1200
7* 42* 35 16.7
8 35 28 20.0 1160
9 28 23 17.8
10 23 19 17.4
11 19 13 31.6 1095
Table(s)

Table 3 Ferrite grain size determined by EBSD.
Rolling
schedule
Steel ASTM
number
Mean linear Intercept
(µm)
HR
E 7.1 27.1
F 7.2 26.5
G 8.4 17.3
CR
L 6.4 35.5
M 9.5 11.8
Table(s)

Table 4. Critical no-partition transformation temperatures Ae1, Ae3 as predicted by
MTData thermodynamic software
Steel Ae1
(ºC)
Ae3
(ºC)
E 679 859
F 691 923
G 709 1053
Table(s)

Table 5 Correlation between the amount of low angle grain boundaries and difference
between Ae3 and FRT for each steel
Steel
Difference
between Ae3 and
FRT (ºC)
The amounts of low angle
grain boundaries below 15º
(%)
E 240 5.7
F 177 5.8
G 50 10
L 90 8.9
M 27 12.4
Table(s)