the effect of conventional and minimum tillage practices
TRANSCRIPT

The Effect of Conventional and Minimum Tillage Practices on some Soil Properties in a Dryland Vineyard* L. VAN HUYSSTEEN and H. W. WEBER
Respectively from the Oenological and Viticultural Research Institute, Private Bag X5026, Stellenbosch 7600 and the Department of Soil and Agricultural Water Science, Faculty of Agriculture, University of Stellenbosch, Stellenbosch 7600
*Extract from a M.Sc. (Agric.)-thesis by the first author, University of Stellenbosch, 1977.
ABSTRACT
Preliminary results of a long-term viticultural tillage experiment comprising two groups of treatments, are reported. These groups are (i) a group of "minimum" tillage practices having received no mechanical soil tillage at all, and (ii) a group of "conventional" tillage treatments according to long-established local practices by disc-harrow. The "minimum" group consists of:
(a) a permanent straw mulch cover, (b) chemical weed control, and ( c) a permanent cover of indigenous weeds frequently
cut by a bush-cutter. The "conventional" group consists of: (a) deep and (b) shallow trench furrow systems, and (c) the locally customary "clean cultivation" system. A comprehensive investigation into the changes of
sleeted soil properties after a period of eight years revealed significant differences between properties of the soil under minimum tillage (group (i)) and under clean cultivation (group (ii)).
Soil parameters, such as pore volume distribution, compaction indices, activity of micro-organisms and availability of plant nutrients, were found to be more favourable in some minimum tillage treatments than on the conventionally tilled plots.
INTRODUCTION
Soil physical conditions exert a major influence on plant growth because they dominate the environment in which roots develop and function. Soil tillage is an effort to create optimal physical soil conditions and, additionally, to control weeds efficiently. Therefore, well-adjusted tillage practices are considered to be the foundation of any branch of agriculture. Practical farmers have deep-rooted and strong convictions about tillage. In viticulture, too, and under mediterranean climatic conditions, it is not only a pragmatic belief but firmly accepted knowledge that the production potential of a given vineyard, with respect to yield and quality of the grape harvest, cannot be fully exploited unless a tillage practice is applied that is best adapted to the prevailing soil-climate-crop situation.
However, with energy for traction of tillage implements as well as labour becoming progressively more expensive and, accordingly, the scope for yield and quality improvement through costly conventional tillage practices declin-
ing, the necessity to investigate the suitability of new soil management methods increases. Recently, new trends have appeared in this field aiming at the minimization of these expenses by careful withdrawal of tillage, provided equal or even higher yields and quality are obtained. The main objective for the minimization and even omission of tillage--especially in viticulture-is the rationalization of the production process depending on the ecological conditions and crop requirements, the latter being the decisive factor for the scope of rationalization (Butorac, Lackovic & Bestac, 1976).
There are also apparently well-founded claims of important improvements in physical soil conditions by means of minimum tillage (Huglin, 1960; Baeumer & Bakermans, 1973; Ehlers, 1973; Perret & Koblet, 1973) which, if they were to be verified, could be a decisive aid for the soils in the W estem Cape carrying old-established as well as new vineyards. In many cases these soils are being threatened to an increasing extent by inherent dangers of physical decline, in spite, or perhaps in direct consequence, of the continual conventional tillage practices (Weber, 1970, Krynauw, 1977). These dangers spell debilitation, deterioration and even the possibility of destruction of soil productivity, if their symptoms are not recognized in time and active steps taken to avert them. They are mainly centered in soil compaction following the loss of soil structure because, in contrast to the traditionally accepted beliefs, conventional tillage is apt to promote in the long run, especially under dry-warm climatic conditions, the disintegration of soil structure (Hyam, 1950; Greacen, 1958; Smika & Greb, 1975).
One of the justifications for the introduction of minimum tillage practices in viticulture is the establishment of a more stable equilibrium between physical, biological and chemical soil conditions which would retard the decay of soil structure (Turelle & McCalla, 1961; Hood, 1965; Harrold, Triplett & Edwards, 1970; Blevins, Cook, Phillips & Phillips, 1971 ). Because the results of this overseas research work claim great successes, the practical importance of minimum or even no-tillage methods for the vineyard soils in the W estem Cape can be expected to increase. Therefore, and because of the realization of extended local compaction problems in these soils, a long-term soil cultivation field trial was started in 1968.
In the vineyards of the coastal region of the W estem Cape, clean cultivation is generally maintained, consisting of the following: In autumn a cover crop such as oats
S. Afr. J. Enol. Vitic., Vol. 1. No. 1. 1980
35

36 Conventional-Minimum Tillage Practices
(Avena spp. ), barley (Hordeum spp.) or rye (Lolium spp.) is sown in alternate rows. During June/July, a moderately deep furrow or trench (150-300 mm) is ploughed using a trenching plough in the rows without a cover crop. Vine prunings and manure are ploughed under, and at the same time the cover crop is disced in. The strip remaining underneath the vines is then ploughed with a special plough, while the surviving weeds are hoed by hand towards the middle of the row. Thus, a clean hard soil surface underneath and between the vines is obtained. The inter-row spaces are disced two to four times during the growing season to keep the vineyard free of weeds. Depending on the depth of the trenches, this system of cultivation is referred to as the deep (250-300 mm) or shallow (150-200 mm) trench furrow system. In cases where a trench furrow is not ploughed, all inter-row spaces are sown to a cover crop which is disced into the soil before bud-burst after which one to three additional cultivations may be necessary.
Since this old-established tillage practice could not prevent the physical state of the soils from deteriorating, comparative investigations using other management systems were imperative. However, the change of soil management from old to new methods does not cause immediately discernible effects in the soil itself. The alteration of physical soil conditions is a slow process, and it may take even a human generation before the effects of different soil cultivation practices become evident. The results of such investigations as presented in this paper should, therefore, be regarded as being merely the first interim attempt to assess the preliminary relative value of several tillage or no-tillage practices, in respect of the creation of conditions under which favourable soil physical properties may develop in the given pedological and climatic environment. The measurements were taken during the last two to three years of the first eight-year period of this experiment, which is to be continued for many years to come.
MATERIALS AND METHODS
Experimental site, soil and design: The field plots are located on the Nietvoorbij Experimental Farm of the Oenological and Viticultural Research Institute (OVRI), Stellenbosch, and are situated on a southwestern slope of 12%. A preceding comprehensive soil survey disclosed a very homogeneous soil of the Clovelly form, Southwold series, according to the Binomial Soil Classification System for South Africa (MacVicar & Soil Survey Staff, DATS/RSA, 1977), which is correlated to the Hapla-to Eutr-ustox of the USDA-System (Soil Survey Staff, 1960) and to the Ochric Ferralsol of the FAO-System (Dudal, 1968). Geologically, the soil developed from Malmesbury shales, and varied insignificantly in texture both in the horizontal and vertical directions. The clay content of the fine sandy loam topsoil varied between 11 and 19%, increasing to a maximum of 25,8% in the fine sandy clay loam layer between 300-500 mm depth, and finally decreased again to about 21-23% in the deepest layer of the same texture (500-900 mm). Right through the profile, a high fine sand fraction of ca. 50% was observed. Of the total sand fraction per se, fine sand comprises about 75%, which gives rise to an extreme compaction hazard in these soils.
After delve-ploughing the soil to 600 mm depth, Chenin blanc vines grafted on 101-14 Mgt. rootstocks were planted 1,5 m x 3,0 m during 1968, and trellised accord-
ing to the locally customary "Extended Double Perold" system (Zeeman, 1978). The vineyard was maintained under dryland conditions, i.e. after a few water applications for better establishment of the young vines during the first season (latest in January 1969), no irrigation was subsequently applied.
The lay-out of the trial was a randomized block design accommodating six cultivation treatments replicated three times. The dimensions of the plots were 12 x 37 m, each carrying 140 vines, of which 20 were data vines flanked by two border rows on each side.
The vineyard was fertilized annually as a whole with 5 t/ha compost broadcast during autumn onto alternating row-interspaces, and with a standard 3:1:5 (38) fertilizer at 170 kg/ha given in two applications, one during autumn and the other during the early budding stage. An additional top-dressing of limestone ammonium nitrate (30%) at 75 kg/ha/a was applied six weeks after bud-burst.
Application of treatments: During 1969 the trial was clean cultivated as a whole to achieve even establishment of the vines. Since 1970, six different treatments were applied, comprising a "minimum" and a "conventional" tillage group. In this study only four representative treatments (B3, B4, B5 and B6) were sampled to investigate changes of selected soil properties. Full details of the trial were reported by Van Huyssteen (1977).
The treatments were as follows: (i) B3: Annual application of a straw mulch during
August, to cover the surface of the plots completely. In the first two seasons (1969/70 and 1970/ 71), 20 t/ha/a straw were applied but in the subsequent years, 7 ,5 t/ha/a were considered sufficient for this purpose. No mechanical tillage whatsoever was applied. Common weeds like the volunteer wild oats (Avenafatua) were sprayed with paraquat at the end of winter when necessary.
(ii) B4: Chemical weed control was effected by spraying with a paraquat, diquat and simazine mixture at the end of August each year. No mechanical tillage was applied at all but a cover crop sown in March which was killed in spring by the herbicides and left on the surface. Only one herbicide spraying sufficed to eliminate weeds for the summer.
(iii) B5: Clean cultivation was done by disc-harrow. A cover crop was sown in autumn in all rowinterspaces and tilled into the soil at the end of August. Plots were disc-cultivated two to three times during the growing season to control weeds.
(iv) B6: The naturally occurring weed population (mainly Lolium spp., Poa annua and Medicago spp. ) was left. It was cut during early spring and thereafter twice during summer, using a bush cutter. Surviving weeds on the ridges were cut with sickles. A cover crop was sown each year, but without success. No mechanical cultivation was applied so that this treatment may be considered as having a permanent "sward".
In all treatments where a cover crop was sown, barley (Hordeum vulgare) was used in all seasons, except 1972/ 73 and 1974/75 when lupins (Lupinus angustifolia) and wimmera (Lolium multifiorum) were sown, respectively.
Analytical procedure: Representative soil samples ( <2,0 mm) from the different treatment plots were subjected to a
S. Afr. J. Enol. Vitic., Vol. 1. No. 1. 1980

Conventional-Minimum Tillage Practices 37
comprehensive chemical analysis according to standard methods used by the 0. V.R. I., which included the following determinations: pH, exchangeable cations, CEC, citric acid soluble P and K, extractable Al and total organic matter. The following physical, mechanical and biological soil properties were considered more important in view of this research project, and were determined on representative plots of treatments B3, B4, B5 and B6:
(i) Soil texture. The particle size analysis was executed hydrometrically (Van der Watt, 1966).
(ii) Particle density. The pycnometer method according to Blake (1965a) was used.
(iii) Bulk density. This property was determined in triplicate in situ employing the Volumeasure apparatus (SOILTEST, INC. Cat. No. CN-980M, 1974) according to Blake (1965b).
(iv) Total porosity. From the results of determinations (ii) and (iii), the porosity of each layer was calculated using the following equation (Vomocil, 1965):
E= (1 - I blf d) 100 where E= total porosity(%)
lb= bulk density (kg x m-3 )
J d= particle density (kg x m-3 )
(v) Pore size fraction distribution. Brass cylinders of 66,667 cm3 internal volume were used to take undisturbed soil cores in their natural state of aggregation. These were saturated and equilibrated in pressure membrane and pressure plate extractors at 1 500, 100, 33,3, 6,0 and 2,5 kPa, representing the limits of the very fine, fine, medium, slowly draining coarse, fast draining coarse, and very fast draining coarse pores, according to the method of W ourtsakis ( 1971 ).
(vi) Maximum compaction of the soil at increasing moisture contents. This property was determined following the method described by Lambe (1951). The compaction apparatus (SOIL TEST, INC. Cat. No. CN-435, 1974, Harvard compaction unit) was set to give a force per unit area of I 000 kPa, on a number of sieved soil samples that were prewetted to have different moisture contents after allowing them to equilibrate.
(vii) Shear strength of the surface soil layer. A homemade shear strength apparatus was employed, consisting of four steel fins at right angles covered by a steel disc and mounted on a torque wrench equipped with an automatic registering device. The steel fins were 30 mm deep, and the disc on which they were welded had a diameter of I 00 mm. The fins were pressed into the soil and, by rotational motion of the torque wrench, the resistance of the soil at its point of sliding was determined. The torque wrench had a measuring accuracy of two per cent. All determinations were done at the same moisture tension of the soil.
(viii) Penetrometer measurements. A "Constant Speed Double Cone Pentrometer'' (Carter, 1967) as described by Barley & Greacen (1967), but having a mechanical registering device, was used. This instrument measures and simultaneously registers on graph paper the fluctuations of the force necessary to penetrate the soil layers down to 900 mm depth at a constant penetration speed.
(ix) Counts of soil bacteria and fungi present in the top 200 mm layer were done in Triptose Soy Agar medium, and the fungi in Czapek Dox Agar medium.
(x) Nematode infestation evaluations were done by the W oostenbrink Elutriator Cotton wool Filter method (Southey, 1970) on all plots.
Infiltration rate measurements, as well as other investigations concerning the soil moisture balance sheet, are reported by Van Huyssteen & Weber (1980a). Results of several yield parameters and other physiological determinations are dealt with in another paper (Van Huyssteen & Weber, l 980b ).
RESULTS AND DISCUSSION
Chemical soil analysis: The results of the chemical analysis of the soil are given in Table I, and demonstrate that the soil is mesotrophic. It had a generally low pH, varying between 4, I and 5,0, the higher values occurring in the top layers of treatments B4 and B6. The K+ -content of the soil of the straw mulch (B3) treatment was found, as a rule, to be higher than that of the other treatments except for the 0-100 mm depth of the B6 treatment (permanent sward), which was apparently due to K+-ions being released with the mineralization of the straw mulch and the dead grass, respectively. The calcium status of the B3 treatment was lower than that of the others, which is in accordance with its low pH. The exchangeable Al+++ was relatively high on all four plots as a result of their low pH values. Although the P-content was low it is interesting to note that a sharp drop occurred with the transition from the top (0-100 mm) to the second (100-200 mm) layer on the straw mulch (B3) and herbicide treated plots (B4 ). This may have been caused by the fact that the P applied with fertilizers did not move from the surface downwards in these profiles. On the clean cultivation plot (B5), however, the P was mixed with the soil of the disced layer, whilst in the permanent sward (B6) profiles the P was carried down by the roots of the weeds. No large differences in the organic matter content were indicated, except for the top 100 mm layer of the straw mulch (B3) treatment. This phenomenon is very likely due to the effect of the local climate (winter rainfall with hot and dry summers) because organic matter is oxidised very rapidly under such conditions. Therefore, only very little or no humification of organic matter is possible and accordingly, no humus can accumulate in this soil.
Soil texture and particle density: The results of these determinations are not discussed here as they are unalterable properties of the constituents of any soil. Soil texture is, however, briefly outlined under Materials and Methods.
Soil densities and related parameters: The suspected dangerous extent of the compaction problem present in this soil was affirmed by determining the dry bulk density, after applying equal pressures at increasing water contents on disturbed soil samples drawn from the first four layers of a representative spot of the clean cultivation treatment (B5). Fig. I depicts these curves, the form of which is indicative of a very high susceptibility to compaction in the 10-12% water content range. Apparently, this inherent soil property is due to the high percentage of the fine sand fraction (Moolman & Weber, 1978). Values of up to I 962 kg x m-3 at 11,7% water content (top layer), I 995 kg x
S. Afr. J. Enol. Vitic., Vol. 1. No. 1. 1980

38 Conventional-Minimum Tillage Practices
TABLE]
Soil chemical analyses of the sieved soil samples from different tillage treatments
I% Citric acid Treatment Depth Extractable cations (me % ) C.E.C. S-Value soluble pH Ar+++ Org. mat.
plot (mm) (me%) me/100 g (KC!) (me%) (%) Na+ K+ ca++ Mg++
B3 0/100 sp 0,47 1,86 0,75 3,36 100/200 sp 0,32 0,63 0,25 1,82
(Straw 200/300 sp 0,30 0,39 0,15 1,56 mulch) 300/500 sp 0,29 0,36 0,13 1,67
500/700 sp 0,30 0,68 0,19 1,87 700/900 sp 0,17 0,92 0,29 1,77
B4 0/100 sp 0,46 2,12 0,44 3,15 100/200 sp 0,21 1,13 0,31 1,92
(Weed killer) 200/300 sp 0,18 1,06 0,33 1,87 300/500 sp 0,11 1,11 0,35 2,07 500/700 0,011 0,062 1,17 0,63 2,02 700/900 0,054 0,078 1,11 1,00 2,13
B5 0/100 sp 0,41 1,58 0,44 2,54 100/200 sp 0,28 1,33 0,31 1,97
(Clean cul- 200/300 sp 0,26 1,63 0,25 2,18 tivation) 300/500 sp 0,20 1,26 0,19 1,77
500/700 sp 0,12 0,86 0,19 1,36 700/900 sp 0,071 0,76 0,25 1,51
B6 0/100 sp 0,55 2,17 0,48 3,05 100/200 sp 0,33 1,61 0,38 2,33
(Sward) 200/300 sp 0,23 1,59 0,27 2,23 300/500 0,076 0,16 1,08 0,19 1,97 500/700 sp 0,081 1,02 0,27 1,67 700/900 sp 0,096 0,92 0,58 1,72
m-3 at 10,8% (2nd layer), 1 983 kg x m-3 at 11,6% (3rd layer) and 1 964 kg x m-3 at 11,7% (4th layer), reflecting as low total porosities as 26,04, 25,38, 25,88 and 26,58%, respectively, were obtained by applying forces per unit area which are more or less equal to the forces exerted by
2000
1950
1900
1850 x-- - -- x 0 -100 mm
100 - 200 mm
p (ppm) K+ (ppm)
27,67 35 183 4,55 0,083 2,50 6,24 8 138 4,35 0,31 0,99 4,40 7 123 4,15 0,44 0,85 3,78 10 118 4,10 0,50 0,63 5,25 3 110 4,25 0,22 0,38 6,42 3 68 4,40 0,11 0,23
17,06 32 178 5,00 0,00 1,36 7,08 9 90 4,45 0,083 0,68 6,82 6 63 4,35 0,110 0,64 6,09 3 48 4,40 0,083 0,46 5,31 3 28 4,45 0,028 0,35
10,11 3 25 4,75 0,00 0,22
10,51 20 163 4,60 0,083 1,62 10,32 13 118 4,70 0,056 0,95 12,00 31 103 4,75 0,028 0,92 7,68 14 78 4,45 0,14 0,76 5,61 3 48 4,25 0,18 0,29 4,32 3 33 4,20 0,17 0,22
16,51 23 205 5,00 0,056 1,55 12,27 25 115 4,65 0,056 0,99 9,91 29 93 4,75 0,072 0,96 5,60 7 63 4,30 0,31 0,55 6,64 3 33 4,25 0,18 0,32 8,88 3 30 4,45 0,083 0,23
standard tractors and tillage implements. If, furthermore, it is kept in mind that the water contents (10,8 to 11, 7%) at which these excessive degrees of compaction occurred were not far from the field water capacities of the layers sampled (17,11%, 14,54%, 14,22% and 14,62%, respect-
"' A-1-1-1-A 200 - 300 mm
300 - 500 mm I
E ><:
~ ~
~ al z ~ i:i ::<1 ...:i ~ ~
;,... i:i:; i:i
1800
1750
1700
1650
1600
1550
1500 0 1 2 3 4 5 6 7 8 9
MOISTURE CONTENT (%)
FIG. 1
10 11 12 13 14 15
Maximum compaction (bulk density) at different moisture contents of soil from different depths of the clean cultivation treatment.
S. Afr. J. Enol. Vitic., Vol. 1. No. 1. 1980

Conventional-Minimum Tillage Practices 39
ively), and are to be found when the farmers prefer to work their soil, the anticipation of total collapse of the soil structure with time is not unrealistic.
The reduced compactibility past the point of maximum compaction at higher water contents, reflects the effect of saturation when all voids are filled with water, which must be squeezed out of the pores when further compaction occurs. On the other hand, the points of minimum compaction suggest that this pressure-sensitive soil should be worked only when nearly dry, if it can be worked at all in this condition, because of the enormous traction power demand. Similar points of minimum compaction have been reported for several other soil types by Richards, Weeks & Warneke (1960).
On the experimental plots, marked and lasting differences in dry bulk density resulted from the cultivation treatments only at certain depths. This is demonstrated by the results of bulk density determinations presented in Table 2 but, perhaps, even more obvious, by the calculated values of "relative compaction" presented in Table 3.
the effect of different compactibilities of different soils and of different treatments. The percentages in Table 3 are based on the values of Table 2 and the compaction values used to construct the curves in Fig. 1. An RC of 50% could be the lowest possible and 100% the highest possible value of this range, the latter being a consolidated mineral matter having no pore volume at all, i.e. a stone.
Both tables indicate that the top 100 mm layers of the minimum cultivated treatments (B3, B4 and B6) had rather high bulk densities compared to that of the clean cultivation treatment (B5), which was due to underconsolidation of this layer because of regular tillage. The J b-values of these plots do not appear very high in themselves; actually, they could be accepted as being quite normal for a sandy loam consisting of about 70% sand. However, the RCpercentages of 80,0, 78,2 and 77,8 are by no means low values. They indicate the tendency of this soil to recompact when left alone, because of the afore-mentioned disproportion of the sand subtractions, even at the top of the soil profile. However, the much more detrimental
TABLE 2 Bulk density (fb) as affected by different tillage treatments in a cultivation trial
f b (kg.m-3 ) of the different treatments Depth (mm) 83 84 85 86
Straw mulch Weed killer Clean cult. Sward
0/100 1 571,2 1 534,9 1 328,6 1 526,4 100/200 1 687,0 1 539,8 1 640,2 1 659,5 200/300 1 590,5 1 371,0 1 703,6 1 541,7 300/500 1 543,6 1 424,0 1 562,4 1 410,2 500/700 1 752,0 1 806,3 1 643,5 1 543,2 700/900 1 830,6 1 860,3 1 769,5 1 774,2
Average for 100/300 1 638,8 1 455,4 1 671,9 1 600,6
Coefficient of variation = 4,23%
TABLE 3 Relative compaction (%) of soils on the different treatment plots as induced by eight years of different cultivation practices
Treatments Depth (mm) 83 84 85 86
Straw mulch Weed killer Clean cult. Sward
0-100 80,04 100-200 84,58 200-300 80,22 300-500 78,61
The latter term needs some explaining. Although dry bulk density in itself is generally accepted to be a quite serviceable indicator for the degree of packing of soil particles, it has a limited usefulness as a standard for judging the comparative magnitude of changes of soil structural conditions against the maximum possible compaction. An alternative is to express this property in terms of "degree of compaction" or "relative compaction" (RC), applying the equation:
RC% = dry bulk density x lOO, maximum dry bulk density (proctor)
where "maximum dry bulk density" is determined by compacting a disturbed soil sample in the laboratory. This parameter thus indicates the extent to which a soil is already compacted under field conditions. According to Soane (1972) it has the advantage of largely eliminating
78,20 67,69 77,76 77,20 82,23 83,20 69,15 85,92 77,76 72,52 79,57 71,82
effect of continuous tillage operations on the subsoil strata, by which a so-called plough-sole or tillage-pan is induced, is aptly demonstrated by the extremely high bulk density of 1 704 kg x m-3 and a corresponding RC-value of almost 86%, in the third layer (200-300 mm) of the clean cultivation treatment. On the other hand, the highly active soil fauna, especially many earthworms, in the same layer of the herbicide (B4) plot, appears to be the main cause for its comparatively low degree of compaction (1 371 kg x m-3 and 69,2% ). This biologically caused loosening showed its initial effects even in the second layer, as is clear from the relatively low RC-value (77,20%), in contrast to the RC-percentages in the corresponding layer (200-300 mm) of the other treatments, and continued to proceed down to the fourth layer. Also, on the B6-plot (sward), the roots of grasses and indigenous weeds were apparently the sole cause for the comparatively low degree
S. Afr. J. Enol. Vitic., Vol. 1. No. 1. 1980
40 Conventional-Minimum Tillage Practices
of compaction in the third and fourth layers. Thus, the vigorous subsoil life induced by the no-tillage treatments is actually counteracting the recompaction tendency of this soil. The latter inclination is verified by the enhanced bulk density and RC- values of the second layers of the straw mulch (B3), clean cultivation (BS) and sward (B6) treatments, as well as those of the third layers of the straw mulch (B3) and clean cultivation treatments. The sharp increases in bulk density below the SOO Illill depth boundary on all treatment plots could also be taken as proof of this inherent compaction tendency, which seems to be a consequence of the basic structural pattern this soil '' inherited" from its Malmesbury shale parent material.
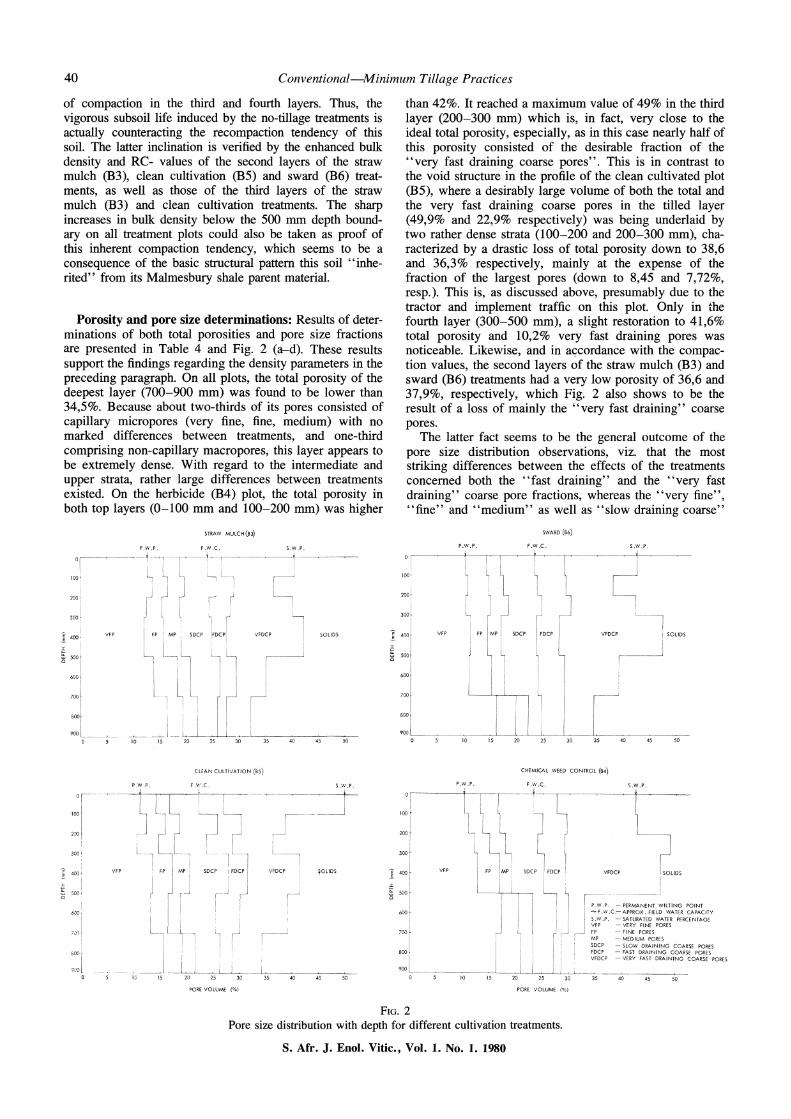
Porosity and pore size determinations: Results of determinations of both total porosities and pore size fractions are presented in Table 4 and Fig. 2 (a-d). These results support the findings regarding the density parameters in the preceding paragraph. On all plots, the total porosity of the deepest layer (700-900 mm) was found to be lower than 34,So/o. Because about two-thirds of its pores consisted of capillary micropores (very fine, fine, medium) with no marked differences between treatments, and one-third comprising non-capillary macropores, this layer appears to be extremely dense. With regard to the intermediate and upper strata, rather large differences between treatments existed. On the herbicide (B4) plot, the total porosity in both top layers (0-100 mm and 100-200 mm) was higher
STRAW MULCH (B3)
100·
200
300·
400 VFP
F.W.C. SW P _l _, _______ t ' --~ '-, LI ,---
j I J r ~ J --1
FP I MP ' SDCP iFDCPI VFDCP SOLIDS
500· ____ _J
600"
700
600
900 L, __ Lj_ -------'---~
10 15 2-:J 30 35 40 45 so
CLEAN CULTIVATION (ss)
P.W.P. F.'A'.C. S.W.P
---1--~~-- 'f----1
L" L" L, L _ I
,------__J
l_J
' 4QQ; FP MP SDCP 1 FDCP VFDCP SOLIDS
6JJ·
L__
' ~I
)(, 15 25
PORE VOLUME 1%)
than 42%. It reached a maximum value of 49% in the third layer (200-300 Illlll) which is, in fact, very close to the ideal total porosity, especially, as in this case nearly half of this porosity consisted of the desirable fraction of the "very fast draining coarse pores". This is in contrast to the void structure in the profile of the clean cultivated plot (BS), where a desirably large volume of both the total and the very fast draining coarse pores in the tilled layer (49,9% and 22,9% respectively) was being underlaid by two rather dense strata (100-200 and 200-300 Illlll), characterized by a drastic loss of total porosity down to 38,6 and 36,3% respectively, mainly at the expense of the fraction of the largest pores (down to 8,4S and 7,72%, resp.). This is, as discussed above, presumably due to the tractor and implement traffic on this plot. Only in the fourth layer (300-SOO mm), a slight restoration to 41,6% total porosity and 10,2% very fast draining pores was noticeable. Likewise, and in ac;cordance with the compaction values, the second layers of the straw mulch (B3) and sward (B6) treatments had a very low porosity of 36,6 and 37,9%, respectively, which Fig. 2 also shows to be the result of a loss of mainly the "very fast draining" coarse pores.
The latter fact seems to be the general outcome of the pore size distribution observations, viz. that the most striking differences between the effects of the treatments concerned both the "fast draining" and the "very fast draining" coarse pore fractions, whereas the "very fine'', "fine" and "medium" as well as "slow draining coarse"
100-
200-
Joor
4001 VFP
! 500'
J 7001
600l 900 ---
SWARD (86)
P.W.P. F.W .C.
~
1_
L ~ FP MP i SDCP
L
1 I I
I : I
---"---~ 1 I
I ' I I
~_J 10 15 20 25 30
S.W.P.
------+-----
VFDCP SOLIDS
__ J
35 40 45 50
CHEMICAL WEED CONTROL (84)
P.W.P. F.W.C. S.W.P.
0 :----------------*- --- --,------· -
t_I 100
600,r
iOOr
800 ! I
~ l
l ' 1'
~ L, I , I ,
FP iMPI
i I
"i __ .
SDCPI FDCP VFDCP
J
r SOLIDS
!
I P .W .P - PERM.ANENT WILTING POINT ......,. F .W .C :--APPROX. FJELD WATER CAPACITY
' ~· S.W.P. -SATURATED WATER PERCENTAGE VFP - VERY FINE PORES
J FP --FINE POP.ES /,t,p - MEDIUM PORES SDCP - SLOW DRAINING COARSE PORES FDCP - FAST DRAINING COARSE PORES
L YFDCP - VEP.Y FAST DRAINING COARSE PORES
10 15 20 25 30~-c'c35--4-0--4-5 -~,,
PORE VOLUME (%)
FIG. 2 Pore size distribution with depth for different cultivation treatments.
S. Afr. J. Enol. Vitic., Vol. 1. No. 1. 1980

Conventional-Minimum Tillage Practices 41
TABLE 4 Variations of total porosities (E) with depth on four plots
Total porosity (%) Depth (mm) B3 B4 BS B6
Straw mulch Weed killer Clean cult. Sward
0/100 40,43 100/200 36,55 200/300 40,06 300/500 42,24 500/700 35,09 700/900 32,23
pore volumes remained more or less unaffected. This is in accordance with the observation of Czeratzki (1966) who found a progressive decrease of pore volumes below the depth of ploughing in three soils during a six year period, as a result of annual tilling operations. From these facts it can safely be concluded that the effect of different tillage practices is mainly limited to the two coarsest pore size fractions. Changes in these two fractions are, therefore, the most sensitive indicator for incipient or progressed compaction and may, in addition, also serve as a useful, if crude, indicator of the aeration status of a soil.
Shear strength and penetrometer resistance determinations in situ: The results of relative shear strength determinations (no absolute values were measured) at the surface and at 100 mm depth on three differently treated plots (B3, B4, B5) are presented in Fig. 3. The columns
120 a B3 Straw Mulch
110 ~ B4 Chemical weed
42,36 49,92 42,42 42,56 38,65 37,87 48,86 36,32 42,26 47,03 41,58 47,35 32,90 39,05 39,05 31,21 34,49 34,34
depicting the kPa-values of the B4 (herbicide) treatment indicate a very hard surface crust, having a statistically much higher shear strength than those of the B3 and B5 treatments within the vine-rows and, of course much more so, between the rows on the wheel tracks of the tractor and spraying machine. The crusts on B4 were measured to be 10 to 20 mm thick. In addition to the inherent crust forming tendency of the soil, and the absence of plant growth in summer, their development could possibly be ascribed to the presence of the chemicals used for spraying. It is known that paraquat, diquat and simazine are tenaciously bound to clay surfaces by ionic bonds, and that they are essentially immobile, so that they will remain at the soil surface and not be leached (Weber & Weed, 1968; Weed & Weber, 1968; Weber, Meek & Weed, 1969; Wauchope, 1978).
control
100 I B5 Clean cultivation
90
80
ro 70 p.. e, ::r:: 60 £,--<
-0 z ~ 50 0:: £,--< rn
40 0:: <t: ~
30 ::r:: rn
20
10
0 Omm 100 mm Av. Omm 100 mm Av.
(i) On the vine row (ii) On the tractor track
FIG. 3 Shear strengths of the soil on different tillage treatment plots at two positions and two depths.
S. Afr. J. Enol. Vitic., Vol. 1. No. 1. 1980

42 Conventional-Minimum Tillage Practices
The cone penetrometer merely provides an empirical indication of soil strength, because the mode of failure is not defined properly (Soane, 1972). In spite of this disadvantage, this instrument, when used with caution, can provide good evidence of differences in soil behaviour, as incipient compaction causes an immediate increase in soil strength. Changes in this property may, therefore, be used to indicate the extent of compaction, and may also have value in the determination of the relative resistance plant roots may encounter under different tillage treatments. They may, however, also indicate the occurrence of desirably structured subsoil layers having a considerable strength in spite of their large pore volumes because their highly water-stable and well biocemented aggregates may have a low degree of displaceability. These aggregates may, therefore, deflect plant roots because they are too strong to be penetrated (Dexter, 1978).
Cone penetrometer readings expressed as mechanical resistance values are presented in Fig. 4. Strong resistances to vertical penetration were encountered under the minimum tillage treatments, which increased in the order B3, B6 and B4. These three treatments showed little variation in resistance with depth, except in the top SO mm soil layer of B6, where a sharp increase of more than 1 000 kPa from 2S to SO mm depth was noticed. However, unlike the minimum tillage profiles, the resistances in the clean cultivated soil (BS) were very weak in the top SO mm soil layer but increased steadily with depth to relatively excessive values. The highest resistances, varying between 3 630 and 4 3SO kPa, were obtained in the herbicide (B4) profile, indicating a high stability and low displaceability of the aggregates formed by the active soil life, which were capable of resisting any mechanical disintegrating forces. The sward (B6) treatment also had a high resistance of between 2 9SO kPa and 3 8SO kPa but had a softer top-soil layer of ca. 2S mm thickness in comparison to B4. Although the individual aggregates in the deeper strata of this B6 treatment were not weaker than those of the B4 treatment, the generally lower kPa values under sward (B6) were due to the numerous larger hollow spaces, viz. horizontal tunnels of moles and vertical channels of decayed roots which were found abundantly in this profile. Similar soil biological conditions existed under the straw mulch cover (B3 ), with the top 2S mm layer being soft, due to its water-stable but friable crumb structure, which did not differ much in strength from the deeper layers. The resistance values varied from 1 670 to 2 700 kPa in the main root zone, and increased to 3 6SO kPa only in lower depths. Shaw, Haise & Farnsworth (1942), found that a higher resistance to mechanical penetration generally existed in soil profiles under zero cultivation than in the same soils under continual tillage. This was confirmed by the resistance measured in the clean cultivation (BS) plots which gave the lowest resistance readings (0-1 960 kPa) of all treatments for the first 0-100 mm depth. Below 100 mm depth, however, the relatively high resistance values of 2 760 kPa and 2 670 kPa revealed the existence of a compact layer (tillage pan); they were even higher than those of the straw mulch (B3 ), and just a little lower than those of the sward (B6) treatments, at the same depths. However, in contrast with the minimum tillage treatments, these high resistances in the BS plots were caused by the much tighter packing of mineral particles in a dispersed mass of soil to form a structureless-massive (apedal) hori-
zon. This is reflected by the increase of solids and decrease of total pore volume, as was already shown in Fig. 2. The low values in the top 100 mm of this (BS) treatment mentioned above, indicate a highly unstable condition of soil crumbs which are in a consistently "incipient" development stage because of their frequent disturbance by tillage operations.
MECHANICAL RESISTANCE (kPa • !02)
10 20 30 40 50 60 70
°'-·~-·-·-·-.. 9~-- ~---0 ;< '·,. I >,
100 '"'•,,.e >{
'•\ '"',, \') .
200 ,. El~
'\ _,_.1'
\ ~, 0 ..:. ; I ' ;
300 ~ 0 . -. ' I I i ; • 0
e 400 x . 0 ~ g I
~\
:i: \ !;: 0~'·,,, ,'
"' Q •._, I
500 6\;_i ··~ '>, .,
600 c>--0 B3 (straw mulch) ....
lll- -- - -· B4 (cbemtcal weed control) .t.-•-•-1-~ B5 (clean cultivation) l- - - -z B6 (bush cutter)
700
FIG. 4 Changes in mechanical resistance with depth, as determined by
the cone penetrometer on differently treated field plots.
Microbiological and soil fauna investigations: Fig. S presents the results of soil bacteria and fungi counts in soil samples taken from the 0-200 mm layer of treatments B3, B4 and B5. Samples from the straw mulch (B3) and clean cultivation (B5) treatments contained nearly equal numbers of bacteria, with no significant differences between them in both seasons, but compared to those of the herbicide treatment (B4 ), significant differences are apparent. The bacteria population of the B4 treatment was smaller than that of B3 and BS, probably in consequence of the weaker aeration caused by the dense surface crust. Concerning the number of fungi, similar relationships were found, viz. that the B4 treatment gave the lowest, and B3 the highest counts, with B5 only insignificantly higher than B4. However, relatively much larger differences between the B3 and B4, and not as large ones between the B4 and B5 treatments, than in the case of bacteria, emerged. This was especially marked during the "wet" 1976/77 season. Whereas in this season the bacteria population on B3 (straw mulch) was only 49,0 per cent higher than on B4 (herbicide), the fungi counts on B3 were 117,60 per cent higher than on B4. Apparently due to the favourable soil miosture conditions in this season, the activity of fungi was also much higher than in the preceding (1975/76) growth season-on the straw mulch plots (B3) their number more than quadrupled from 17,90 x 10⁴ during 197S/ 76 to 85,56 x 10⁴/g during 1976/77.
S. Afr. J. Enol. Vitic., Vol. 1. No. 1. 1980

Conventional-Minimum Tillage Practices 43
90
80
70 ..:I
~ 60 bl
.........
'°o 50 ... " 40 < s llii 30 E-4
~ 20 CQ
..:I
~ 10
0 1975/76 1976/77
SOIL BACTERIA
§ B3 Straw Mulch
~ B 4 Chemical weed control
I Clean cultivation
Av. 1975/76 197~/77
FUNGI FIG. 5
Av.
Number of soil organisms in the top layers of three different cultivation treatments.
As fungi play an important role in the stabilization of severe restriction of microbial activity in aggregates of fine soil structure (Russell, 1973 ), it may be concluded that by sandy loam by sterilization or extreme dryness increased their activity (e.g. the production of bonding substances) the effect of physical disruption associated with intermitstable aggregates were formed, which explain the more tent wetting and drying, and simulated cultivation. favourable structural state in the top 150 mm of the straw The results of an investigation into the density of the mulch (B3) and sward (B6)* treatments. In support of this eelworm population are summarized in Table 5 (a). The observation, Tisdall, Cockroft & Uren (1978) found that number of Meloidogyne spp. (root knot nematode) was
TABLE 5 (a)
Nematode counts in soil samples from the different treatment plots
Nematode B3
Straw mulch
Meloidogyne larvae ................ 810 Pratylenchus ...................... 250 Trichodorus ...................... -Hoplolaiminae .................... 140 Saprofage ........................ 980
Total ........................ 2 180
TABLE 5 (b)
Number of nematodes in the soil around the vine and weed roots in the sward (B6) plots
Nematode Vine roots Weed roots
Meloidogyne larvae ......... 1 300 3 440 Pratylenchus . . .. . . . .. . .. . . . 50 380 Trichodorus ................ - 70 Hoplolaiminae .............. 120 80 Saprofage ..... ····· ....... 940 2 720
Total ................. 2 410 6 690
Nematode counts
B4 BS B6 Weed killer Clean cult Sward
930 1260 830 - 50 550 - 40 -
- - 10 1 050 770 I 170
I 980 2 120 2 560
high in all instances. The most striking difference between treatments concerned the high number of Pratylenchus spp. (lesion nematode) on the sward (B6) plot, compared to the other plots (Table 5 ( b) ). The majority of nematodes in the soil around the roots, as shown in Table 5 (b), was concentrated around the weed roots, as they are probably better host plants than the vines .
*Soil fungi were not counted in B6, but as the grass roots and cuttings created similar conditions as prevailed in B3 (straw mulch), this conclusion might be valid for B6, too.
S. Afr. J. Enol. Vitic., Vol. 1. No. 1. 1980

44 Conventional-Minimum Tillage Practices
SUMMARY AND CONCLUSION
Results of a preliminary investigation into the effects of conventional and minimum tillage practices on soil conditions, after eight years of a long-term vineyard soil management experiment, are reported. The soil of the experimental site is characterized by an inherent compaction tendency, apparently caused by both its very high fine sand fraction and its basic structural pattern (platy) inherited from its shale parent material. Consequently, this soil is very pressure-sensitive, especially at water contents a little lower than its field water capacity, at which it is preferably worked by farmers. It was found that almost every important soil property was affected by the type of soil management applied. Briefly summarized, the changes in those properties comprised the following:
(i) A prominent subsoil tillage pan of considerable density and relative strength was formed by the action of the harrow discs operating on the same depth (150 mm) several times per year, and year after year, on the clean cultivated plot, whereas such a pan was conspicuously absent in the profiles of the minimum tillage plots.
(ii) Minimum tillage treatments caused a counteracting effect to the natural recompaction tendency of this soil by inducing the development of a far richer fauna and microflora in the undisturbed subsoil layers than was found under clean cultivation.
(iii) Greater percentages as well as higher stabilities of valuable macropore volumes, especially their fast and very fast draining fractions, were obtained profile-downwards under minimum, mainly herbicide treatments, whereas with clean cultivation a desirably large but easily destructible, macro-pore volume was found only in the plough layer above the tillage pan.
(iv) The application of herbicides caused the forming of a hard and rather dense surface crust, which partly impeded air circulation with an accompanying slightly adverse effect on the numbers of soil bacteria and a grave injurious effect on the numbers of soil fungi immediately underneath the crust. However, in deeper strata, no detrimental influence of either chemicals or impeded air circulation on the subsoil life was discernible.
The net result of this preliminary investigation seems to be that clean cultivation influenced the physical and biological soil properties under consideration disadvantageously, whilst the herbicide, straw mulch and sward treatments produced mainly favourable effects.
REFERENCES
BAEUMER, K. & BAKERMANS, W. A. P., 1973. Zero-tillage. Adv. Agron. 25, 77-123.
BARLEY, K. P. & GREACEN, E. L. 1967. Mechanical resistance as a soil factor influencing the growth of roots and undergound shoots. Adv. Agron. 19, 1-43.
BLAKE, G. R., 1965(a). Particle density. In: Methods of Soil Analysis, Part I. (Ed. in Chief: C. A. Black). Amer. Soc. Agron. Monogr. 9, Wisconsin.
BLAKE, G. R., 1965(b). Billk density. In: Methods of Soil Analysis, Part I. (Ed. in Chief: C. A. Black). Amer. Soc. Agron. Monogr. 9, Wisconsin.
BLEVINS, R. L., COOK, D., PHILLIPS, S. H. & PHILLIPS, R. E., 1970. Influence of no-tillage on soil moisture. Agron. J. 63, 593-596.
BUTORAC, A., LACKOVIC, L. & BESTAC, T., 1976. Comparative studies of different ways of seedbed preparation for mays (Zea mays L.) in combination with mineral fertilizers. Proc. 7th Conf. Intemat. Soil Tillage Res. Organiz. (ISTRO) 45, 5.1-5. 7. Uppsala, Sweden.
CARTER, L. M., 1967. Portable recording penetrometer measure soil strength profiles. Agr. Eng. 48, 348-349.
CZERATZKI, W., 1966. Characterization of tillage-induced soil properties for plant growth. Grundforbiittring 19(1), 89-93.
DEXTER, A. R., 1978. A stochastic model for the growth of roots in tilled soil. J. Soil Sci. 29, 102-116.
DUDAL, R., 1968. Definitions of soil units for the soil map of the world. World Soil Resources Report No. 33. Rome: World Soil Resources Office, FAO.
EHLERS, W., 1973. Gesamtporenvolumen und Porengri.issen-Verteilung im unbearbeiteten und bearbeiteten Li.issboden. Z. f Pfianzenern. u. Bodenkde. 134, 193-207.
GREACEN, E. L., 1958. The soil structure profile under pastures. Aust. J. Agric. Res .. 9, 129-137.
HARROLD, L. L., TRIPLETT, G. B. Jr. & EDWARDS, W. M., 1970. No-tillage com-characteristics of the system. Agr. Eng. 51, 128-131.
HOOD, A. E. M., 1965. Ploughless farming using 'gramoxone'. Out!. Agric. 4, 286-294.
HUGLIN, P., 1960 Les desherbants chimiques en viticulture. Phytoma 12(114), 7-13.
HY AM, G., 1950. The crumb structure of the soil. Farming in S. Afr. 25, 119.
KRYNAUW, J. N., 1977. Landboukundige aspekte van grondverdigting. 'n Literatuuroorsig. Tydskr. Natuurwetsk. SA. Akad. Wetensk. Kuns 17(2), 2-27.
LAMBE, W., 1951. Soil testing for Engineers. The Massachusetts Institute of Technology. John Wiley & Sons, Inc. New York.
MACVICAR, C. N. & SOIL SURVEY STAFF, 1977. Soil classification-A binomial system for South Africa. Dept. Agricult.-Techn. Serv., Pretoria, R.S.A.
MOOLMAN, J. H. & WEBER, H. W., 1978. 'n Ondersoek na die bydrae van die fynsandfraksie tot die verdigbaarheid van fynsandgronde in Suid-Kaapland. Agrochemophysica IO, 39-45.
PERRET, P. & KOBLET, W., 1973. Ergebnisse von Bodenpflege-Versuchen im Weinbau. J. Obst. u. Weinbau !09, 116-128, 151-161.
RICHARDS, S. J., WEEKS, L. V. & WARNEKE, J. E., 1 960. Compacted bulk density and hydraulic conductivity for indicating the structural status of soils. 7th Intemat. Cong. Soil Sci. Trans. (Madison, Wis.) pp. 249-255.
RUSSEL, E. W., 1973. Soil conditions and plant growth. P. 496, 10th edition. Longman Group Limited, London.
SHAW, B. T., RAISE, H. R. & FARNSWORTH, R. B., 1942. Four years experience with a soil penetrometer. Soil Sci. Soc. Amer. Proc. 7, 48-55.
SMIKA, D. E. & GREB, B. W., 1975. Non-erodible aggregates and concentration of fats, waxes and oils in soils as related to wheat straw mulch. Soil Sci. Soc. Amer. Proc. 39, 104.
SOANE, B. D., 1972. Studies on some soil physical properties in relation to cultivation and traffic. Paper presented to A.D.A.S. Conference "Soil Physical Conditions and Crop production". London, January, 1972.
SOIL SUR VEY STAFF, 1960. Soil classification-A comprehensive system (7th Approximation). US Dept. Agric. Washington: US Govt. Printing Office.
SOUTHEY, J. F., Ed., 1970. Laboratory methods for work with plant and soil nematodes. 148 pp. Min. of Agric., Fish & Food Techn. Bull. No. 2, London, H.M.S.O.
TISDALL, J. M., COCKROFT, B. & UREN, N. C., 1978. The stability of soil aggregates as affected by organic materials, microbial activity and physical disruption. Aust. J. Soil Res. 16, 9-17.
S. Afr. J. Enol. Vitic., Vol. 1. No. 1. 1980

Conventional-Minimum Tillage Practices 45
TURELLE, J. W. & MCCALLA, T. M., 1961. Photomicrographic study of soil aggregates and micro-organisms as influenced by stubble mulching and plowing. Soil. Sci. Soc. Amer. Proc. 25, 487-490.
VAN DER WATT, H. v. H., 1966. Improved tables and a simplified procedure for soil particle analysis by the hydrometer method. S. Afr. J. Agric. Sci. 9, 911-916.
VAN HUYSSTEEN, L., 1977. 'n Vergelykende ondersoek na die effektiwiteit van verskillende konvensionele en minimum grondbewerkingspraktyke in die wingerdbou ten opsigte van grondvogbewaring en antler fisiese eienskappe. M.Sc. (Agric.)-thesis, Univ. Stellenbosch, 1977.
VAN HUYSSTEEN, L. & WEBER, H. W., 1980a. Soil moisture conservation in dryland viticulture as effected by conventional and different minimum tillage practices. S. Afr. J. Enol. Vitic. 1(2), (in press).
VAN HUYSSTEEN, L. & WEBER, H. W., 1980b. The effect of selected minimum and conventional tillage practices in vineyard cultivation on vine performance. S. Afr. J. Eno!. Vitic. 1(2), (in press).
VOMOCIL, J. A., 1965. Porosity. In: Methods of soil analyses, Part I. (Ed. in chief: C. A. Black). Amer. Soc. Agron. Monogr. 9, Wisconsin.
W AUCHOPE, R. D., 1978. The pesticide content of surface water draining from agricultural fields-A review. J. Environm. Qua!. 7(4), 459-472.
WEBER, J. B., MEEK, R. C. & WEED, S. B., 1969. The effect of cation-exchange capacity on the retention of diquat and paraquat by three-layer-type clay minerals. II. Plant availability. Soil Sci. Soc. Amer. Proc. 33, 383-385.
WEBER, J. B. & WEED, S. B., 1968. Adsorption and desorption of diquat, paraquat, and prometone by montmorillonitic and kaolinitic clay minerals. Soil Sci. Soc. Amer. Proc. 32, 485-487.
WEBER, H. W., 1970. Soil compaction, water holding capacity, and related problems. The Deciduous Fruit Grower 20(6), 132-139.
WEED, S. B. & WEBER, J. B., 1969. The effect of cation exchange capacity on the retention of diquat and paraquat by three-layer-type clay minerals: I. Adsorption and release. Soil Sci. Soc. Amer. Proc. 33, 379-382.
WOURTSAKIS, A., 1971. Der Einftuss des Tieftockems und Tiefpliigens auf die physikalischen Eigenschaften und den Wasserhaushalt verschiedener Boden Hessens. Dissertation zur Erlangung des Doktorgrades. Justus LiebigUniversitiit, Giessen.
ZEEMAN, A. S., 1978. Effect of rootstocks on the performance of Chenin blanc under various environmental conditions. Proc. S. Afr. Soc. Enol. Vitic. 71-86.
S. Afr. J. Eno!. Vitic., Vol. 1. No. 1. 1980