the effect of conceptual change …etd.lib.metu.edu.tr/upload/1260322/index.pdf · the effect of...
TRANSCRIPT
THE EFFECT OF CONCEPTUAL CHANGE INSTRUCTION ONUNDERSTANDING OF ECOLOGY CONCEPTS
A THESIS SUBMITTED TOTHE GRADUATE SCHOOL OF NATURAL AND APPLIED SCIENCES
OFTHE MIDDLE EAST TECHICAL UNIVERSITY
BY
GÜLCAN ÇET�N
IN PARTIAL FULFILLMENT OF THE REQUIREMENTS FOR THE DEGREE OFDOCTOR OF PHILOSOPHY
INTHE DEPARTMENT OF SECONDARY SCIENCE AND MATHEMATICS
EDUCATION
DECEMBER 2003


iii
ABSTRACT
THE EFFECT OF CONCEPTUAL CHANGE INSTRUCTION ON
UNDERSTANDING OF ECOLOGY CONCEPTS
Çetin, Gülcan
Ph.D., Department of Secondary Science and Mathematics Education
Supervisor: Prof. Dr. Hamide ERTEPINAR
Co-supervisor: Assist. Prof. Dr. Canan NAK�BO�LU
December 2003, 257 pages
The purpose of this study was to investigate the effects of conceptual
change text oriented instruction accompanied by demonstrations in small groups
(CCTI) on ninth grade students’ achievement and understanding levels of
ecology, attitudes towards biology, and attitudes towards environment.
The instruments used in this study were the Test of Ecological Concepts
(TEC), the Attitude Scale towards Biology (ASB), the Attitude Scale towards
Environment (ASE), and the Test of Logical Thinking (TOLT). All data were
collected from the public high school in Balıkesir in the Spring Semester of 2001-
iv
2002. 88 students from four classes and two teachers were included in this study.
Two of the classes were called control group and two of them were called
experimental group. While the TEC, ASE and ASB were administered to all of
the students as pre- and post-tests, the TOLT were conducted as pre-test.
Data related to the TEC, ASB, and ASE were analyzed by multivariate
analysis of covariance (MANCOVA). The results of the MANCOVA showed that
there was significant effect of the treatment which was the conceptual change
texts oriented instruction accompanied by demonstrations in small groups on the
TEC, while there were no significant effect of the treatment on the attitudes
towards biology and attitudes towards environment.
Keywords: Ecology, Conceptual Change Oriented Instruction, Conceptual Change
Text, Demonstration, Small Group Work, Attitude towards Biology, Attitude
towards Environment, and Logical Thinking Ability.

v
ÖZ
KAVRAM DE���T�RME �RET�M�N�N EKOLOJ� KAVRAMLARINI
ANLAMA ÜZER�NE ETK�S�
Çetin, Gülcan
Doktora, Ortaö�retim Fen ve Matematik Alanları E�itimi Bölümü
Tez Yöneticisi: Prof. Dr. Hamide ERTEPINAR
Ortak Tez Yöneticisi: Yard. Doç. Dr. Canan NAK�BO�LU
Aralık 2003, 257 sayfa
Bu çalı�manın amacı, küçük gruplarda demonstrasyon destekli kavramsal
de�i�im metinlerine dayalı ö�retimin (KDMÖ), dokuzuncu sınıf ö�rencilerinin
ekoloji ba�arıları ve anlama düzeylerine, biyolojiye kar�ı tutumlarına ve çevreye
kar�ı tutumlarına etkilerini incelemektedir.
Bu çalı�mada, Ekoloji Kavramları Testi (EKT), Biyoloji Tutum Ölçe�i
(BTÖ), Çevre Tutum Ölçe�i (ÇTÖ) ve Mantıksal Dü�ünme Yetenek Testi
(MDYT) kullanılmı�tır. Tüm veriler, 2001-2002 Bahar Döneminde Balıkesir’ de
vi
bulunan bir devlet lisesinden toplanmı�tır. Bu çalı�maya dört sınıftan 88 ö�renci
ve iki ö�retmen katılmı�tır. Sınıflardan ikisi kontrol grubu ve di�er ikisi de
deneysel grup olarak adlandırılmı�tır. EKT, BTÖ ve ÇTÖ tüm gruplara öntest ve
sontest olarak verilirken, MDYT ise öntest olarak uygulanmı�tır.
EKT, BTÖ, ve ÇTÖ verileri Ortak De�i�kenli Çok Yönlü Varyans Analizi
ile analiz edilmi�tir. Bu analiz sonuçları, küçük gruplarda demonstrasyon destekli
kavramsal de�i�tirme metinlerine dayalı ö�retimin EKT üzerine etkisinin anlamlı
oldu�unu gösterirken, ö�rencilerin biyolojiye kar�ı tutumları ve çevreye kar�ı
tutumları üzerine etkisinin anlamlı olmadı�ını göstermektedir.
Anahtar Kelimeler: Ekoloji, Kavram De�i�tirme Ö�retimi, Kavram De�i�tirme
Metni, Demonstrasyon, Küçük Grup Çalı�ması, Biyolojiye Kar�ı Tutum, Çevreye
Kar�ı Tutum ve Mantıksal Dü�ünme Yetene�i.

vii
To My Family

viii
ACKNOWLEDGEMENTS
I would like to express my deep gratitude to my supervisor Prof. Dr.
Hamide ERTEPINAR for confidence in me. She patiently and lovingly
encouraged me to do my best for my academic carrier. I would like to thank my
co-supervisor Assist. Prof. Dr. Canan NAK�BO�LU for her encouragement and
confidence in me for my works. I wish to thank to Prof. Dr. Ömer GEBAN for his
guidance and support.
Appreciation is extended to the students and the teachers, Sibel ÖZATLI
and Füsun BAYDAR, at the high school in Balıkesir for their valuable
cooperation. I wish to thank to the administrators and other teachers at the high
school in Balıkesir for creating a friendly environment for my study.
I am indebted to my parent, my grand mother, and my sisters. I would like
to thank them for their support, encouragement, prayers, and belief in me. Their
love and encouragement made all that things possible.
I would like to thank to my close friend, Celil EK�C� who encourages and
trusts on me by his open minded and friendly personality. I would like to thank to
Ay�en for her encouragement and ability to keep touching my heart. I am grateful
to Assoc. Prof. Dr. Safure BULUT, Assist. Prof. Dr. Ali ERYILMAZ, Assist.
Prof. Dr. Ceren TEKKAYA, Assist. Prof. Dr. Jale ÇAKIRO�LU, Betül YAYAN,
A. Ela KÖKSAL, Özlem DO�AN, Zuhal A�ÇI AKDA�, Özlem HARDAL,

ix
Ye�im KANTA�, Fatma AKPINAR, Serap ÖZ AYDIN, Nihal BULDU, and
Özgür ÇELEB� for their support and encouragement. I would like to thank to the
Academic Writing Centre for editing my thesis. Also, I would like to extend my
gratitude to Hatice GÜNE� and Cemal ESENDEM�R. Your guidance,
encouragement, and belief in me gave strength to my spirit to keep continue.
This research was funded by the BAP-2003-05-06-03.

x
TABLE OF CONTENTS
ABSTRACT .......................................................................................................iii
ÖZ ....................................................................................................................... v
ACKNOWLEDGEMENTS ..............................................................................viii
TABLE OF CONTENTS………………………………………………………….x
LIST OF TABLES............................................................................................ xvi
LIST OF FIGURES ........................................................................................xviii
LIST OF SYMBOLS ......................................................................................... xx
CHAPTERS
1. INTRODUCTION ........................................................................................... 1
Significance of the Study ................................................................................. 9
2. REVIEW OF RELATED LITERATURE ...................................................... 11
2.1 Misconceptions ........................................................................................ 11
2.2 Misconceptions Related to Ecology.......................................................... 14
2.3.Conceptual Change Approach .................................................................. 21
2.4 Instructional Tools for Conceptual Change............................................... 27

xi
2.4.1 Concept Maps ................................................................................... 27
2.4.2 Conceptual Change Texts ...................................................................... 29
2.4.3 Refutational Texts ............................................................................. 31
2.4.4 Other Instructional Tools for Conceptual Change Approach .............. 32
2.4.5 Demonstrations ................................................................................. 35
2.4.6 Small Group Work ............................................................................ 36
2.5 Science Achievement, Attitude towards Science, and Attitude towards
Environment .................................................................................................. 40
2.6 Science Achievement, Gender Differences, and Attitude towards Science
and Environment............................................................................................ 43
2.7 Science Achievement and Logical Thinking Ability ................................. 46
3. PROBLEMS AND HYPOTHESES ............................................................... 47
3.1 The Main Problem and Sub-problems ...................................................... 47
3.1.1 The Main Problem............................................................................. 47
3.1.2 The Sub-problems ............................................................................. 47
3.2 Hypotheses............................................................................................... 51
3.2.1 Null Hypothesis 1.............................................................................. 51
3.2.2 Null Hypothesis 2.............................................................................. 52
3.2.3 Null Hypothesis 3.............................................................................. 52
3.2.4 Null Hypothesis 4.............................................................................. 52
3.2.5 Null Hypothesis 5.............................................................................. 53
3.2.6 Null Hypothesis 6.............................................................................. 53
3.2.7 Null Hypothesis 7.............................................................................. 53
xii
3.2.8 Null Hypothesis 8.............................................................................. 54
3.2.9 Null Hypothesis 9.............................................................................. 54
3.2.10 Null Hypothesis 10 .......................................................................... 54
3.2.11 Null Hypothesis 11 .......................................................................... 55
3.2.12 Null Hypothesis 12 .......................................................................... 55
4. METHODS.................................................................................................... 56
4.1 Population and Sample............................................................................. 56
4.2 Variables.................................................................................................. 57
4.2.1 Dependent Variables ......................................................................... 58
4.2.2 Independent Variables ....................................................................... 59
4.3 Measuring Tools ...................................................................................... 59
4.3.1 The Classroom Observations ............................................................. 60
4.3.2 The Interview Scales ......................................................................... 60
4.3.2.1 Pilot Interviews........................................................................... 60
4.3.2.2 Core Interviews .......................................................................... 61
4.3.3 The Test of Ecological Concepts ....................................................... 62
4.3.3.1 Pilot Test of Ecological Concepts ............................................... 62
4.3.3.2 Core Test of Ecological Concepts ............................................... 63
4.3.4 The Attitude Scale towards Biology .................................................. 64
4.3.5 The Attitude Scale towards Environment........................................... 65
4.3.6 The Test of Logical Thinking ............................................................ 66
4.4 Conceptual Change Texts......................................................................... 66
4.5 Treatment................................................................................................. 68

xiii
4.6 Data Analysis........................................................................................... 71
4.6.1 Analysis of the Classroom Observation Data ..................................... 72
4.6.2 Analysis of the Interview Data........................................................... 72
4.6.3 Missing Data Analysis....................................................................... 73
4.6.4 Analysis of Descriptive and Inferential Data Statistics ....................... 75
4.6.5 Analysis of Students’ Levels of Understanding of Ecology................ 77
4.7 Assumptions of the Study......................................................................... 79
4.8 Limitations of the Study ........................................................................... 81
5. RESULTS...................................................................................................... 82
5.1 The Classroom Observations .................................................................... 82
5.2 The Interviews ......................................................................................... 85
5.2.1 Interviews with the Teachers ............................................................. 85
5.2.2 Interviews with the Students .............................................................. 92
5.3 Descriptive Statistics ................................................................................ 93
5.4 Inferential Statistics.................................................................................. 99
5.4.1 Determination of Covariates .............................................................. 99
5.4.2 Assumptions of Multivariate Analysis of Covariance (MANCOVA)101
5.4.3 Multivariate Analysis of Covariance (MANCOVA) Model ................. 104
5.4.4 Results of Null Hypotheses Testing ................................................. 105
5.4.4.1 Null Hypothesis 1 ..................................................................... 105
5.4.4.2 Null Hypothesis 2 ..................................................................... 110
5.4.4.3 Null Hypothesis 3 ..................................................................... 110
5.4.4.4 Null Hypothesis 4 ..................................................................... 111

xiv
5.4.4.5 Null Hypothesis 5 ..................................................................... 111
5.4.4.6 Null Hypothesis 6 ..................................................................... 112
5.4.4.7 Null Hypothesis 7 ..................................................................... 112
5.4.4.8 Null Hypothesis 8 ..................................................................... 113
5.4.4.9 Null Hypothesis 9 ..................................................................... 113
5.4.4.10 Null Hypothesis 10 ................................................................. 114
5.4.4.11 Null Hypothesis 11 ................................................................. 115
5.4.4.12 Null Hypothesis 12 ................................................................. 115
5.4.5 Students’ Levels of Understanding of Ecological Concepts ............. 116
5.4.5.1 Students’ Levels of Overall Understanding of Ecology ............. 117
5.4.5.2 Students’ Levels of Understanding of Biotic and Abiotic Factors
............................................................................................................. 120
5.4.5.3 Students’ Levels of Understanding of Food Chain .................... 125
5.4.5.4 Students’ Levels of Understanding of Biological Organization . 130
5.4.5.5 Students’ Understanding Levels of Cycles of Materials............. 134
5.4.5.6 Students’ Levels of Understanding of Environmental Pollution. 137
5.5 Power Analysis ...................................................................................... 141
5.6 Summary of the Results of the Study...................................................... 142
6. CONCLUSION, DISCUSSION, AND IMPLICATIONS............................. 147
6.1 Conclusion ............................................................................................. 147
6.2 Discussion of the Results........................................................................ 149
6.3 Internal Validity of the Study ................................................................. 160
6.4 External Validity of the Study ................................................................ 163

xv
6.5 Implications of the Study........................................................................ 164
6.6 Recommendations for Further Research ................................................. 169
REFERENCES ................................................................................................ 173
APPENDICES
A. THE OBJECTIVE LIST OF ECOLOGY UNIT………………………........195
B. THE TEST OF ECOLOGICAL CONCEPTS…………………….................198
C. THE ATTITUDE SCALE TOWARDS BIOLOGY…………………….......206
D. THE ATTITUDE SCALE TOWARDS ENVIRONMENT…………………208
E. THE TEST OF LOGICAL THINKING……………………..........................210
F. THE LIST OF MISUNDERSTANDINGS ABOUT ECOLOGICAL
CONCEPTS USED IN THE CONCEPTUAL CHANGE TEXTS 1-3………...217
G. THE SAMPLES OF THE CONCEPTUAL CHANGE TEXT-1 AND
WORKSHEETS 1-5…………………….......……………………......................224
H. SOME PICTURES FROM THE EXPERIMENTAL GROUP……………..253
I. CORRESPONDENCE…………………….......……………………..............256
VITA…………………….......……………………..............…………………...257

xvi
LIST OF TABLES
TABLE
4.1. Characteristics of the Variables ............................................................... 58
4.2. Research Design of the Study.................................................................. 68
4.3. Missing Pre-tests Data Versus Variables ................................................. 75
4.4 MANCOVA Variable Set Composition and Statistical Model Entry Order
...................................................................................................................... 76
5.1 Basic Descriptive Statistics Related to the Test of Ecological Concepts
(TEC), the Attitude Scale towards Biology (ASB), the Attitude Scale towards
Environment (ASE), and the Test of Logical Thinking (TOLT) ..................... 94
5.2 Significance Test of Correlations between the Dependent and Independent
Variables...................................................................................................... 100
5.3 Significance Test of Correlations among Covariates............................... 100
5.4 Results of the Multiple Regression Analysis of Homogeneity of Regression
.................................................................................................................... 102
5.5 Box’s Test of Equality of Covariance Matrices....................................... 103
5.6 Levene’s Test of Equality of Error Variances ......................................... 103
5.7 Multivariate Analysis of Covariance Test Results#
................................. 105
5.8 Follow-up Univariate Analysis of Covariance Test Results .................... 107
5.9 Means and Adjusted Means of the Control and the Experimental Groups116

xvii
5.10 Summary of Students’ Levels of Understanding and their Types of
Responses to “Biotic and Abiotic Factors” in the Experimental and the Control
Groups during the Treatment........................................................................ 123
5.11 Summary of Students’ Levels of Understanding and their Types of
Responses to “Energy Pyramid” in the Experimental and the Control Groups
during the Treatment.................................................................................... 128
5.12 Summary of Levels of Students’ Understanding and their Types of
Responses to “Symbiotic Relationships” in the Experimental and the Control
Groups during the Treatment........................................................................ 132
5.13 Summary of Students’ Levels of Understanding and their Types of
Responses to “Phosphorus Cycle” in the Experimental and the Control Groups
during the Treatment.................................................................................... 136
5.14 Summary of Students’ Levels of Understanding and their Types of
Responses to “Water Pollution” in the Experimental and the Control Groups
during the Treatment.................................................................................... 140

xviii
LIST OF FIGURES
FIGURE
5.1. Histograms with Normal Curves Related to the post-TEC in the
Experimental and the Control Groups ............................................................ 97
5.2. Histograms with Normal Curves Related to the post-ASB in the
Experimental and the Control Groups ............................................................ 97
5.3. Histograms with Normal Curves Related to the post-ASE in the
Experimental and the Control Groups ............................................................ 98
5.4 The Whole Picture of Students’ Levels of Understanding of Ecological
Concepts in the Experimental and the Control Groups.................................. 118
5.5 Students’ Misunderstandings on Five Concept Areas of Ecology in the
Experimental and the Control Groups .......................................................... 119
5.6 Students’ Levels of Understanding of Biotic and Abiotic Factors in the
Experimental and the Control Groups .......................................................... 121
5.7 Students’ Levels of Understanding of Food Chain in the Experimental and
the Control Groups....................................................................................... 125
5.8 Students’ Levels of Understanding of Biological Organization in the
Experimental and the Control Groups .......................................................... 130
5.9 Students’ Levels of Understanding of Cycles of Materials in the
Experimental and the Control Groups .......................................................... 134

xix
5.10 Students’ Levels of Understanding on Environmental Pollution in the
Experimental and the Control Groups .......................................................... 138

xx
LIST OF SYMBOLS
SYMBOLS
TEC : Test of Ecological Concepts
ASB : Attitude Scale towards Biology
ASE : Attitude Scale towards Environment
pre-TEC : Students’ Ecological Concepts Pre-test
pre-ASB : Students’ Biology Attitude Pre-test
pre-ASE : Students’ Environmental Attitude Pre-test
post-TEC : Students’ Ecological Concepts Post-test
post-ASB : Students’ Biology Attitude Post-test
post-ASE : Students’ Environmental Attitude Post-test
SAB : Students’ Average Grades of Two Biology Midterm
Exams
TOLT : Test of Logical Thinking
TRE : Treatment

xxi
TI : Traditionally Designed Teaching Instruction
CCTI : Conceptual Change Text Oriented Instruction
Accompanied by Demonstrations in Small Groups
EG : Experimental Group
CG : Control Group
PrEG : pre-TEC in the Experimental Group
PsEG : post-TEC in the Experimental Group
PrCG : pre-TEC in the Control Group
PsCG : post-TEC in the Control Group
MANCOVA : Multivariate Analysis of Covariance
ANCOVA : Analysis of Covariance
MRC : Multiple Regression Correlation
N/n : Sample Size
F : F Statistic
df : Degree of Freedom
p : Significance Value
SU : Sound Understanding
PU : Partial Understanding
PUM : Partial Understanding Which Includes Misunderstanding

xxii
MS : Misunderstanding
NU : No Understanding
NR : No Response
1
CHAPTER 1
INTRODUCTION
Students’ minds are not empty; they are full of prior knowledge and have
several ideas before coming to science classes. They may have some alternative
conceptions and scientifically acceptable conceptions in the same content area in
science (Palmer, 1999). Students’ alternative ideas can be referred to as alternative
frameworks or misconceptions in the literature. They are considered as fairly
different from scientific views. They are resistant to change with scientific ones
and students may reject accepting new ideas. In other words, misconceptions are
obstacles for students in learning and meaningful understanding of some concepts
in science. Students’ alternative conceptions in science can be originated from
different sources; such as school experiences, social practices, daily life
experiences, instruction, prior knowledge, teacher, peer interaction, and textbooks,
etc.
When students enter the classroom with informal ideas (alternative
conceptions) about scientific phenomena; these alternative ideas would affect how
the corresponding scientific explanations are learned (Hewson and Hewson, 1983;
Driver, Squires, Rushworth, and Wood-Robinson, 1994). Therefore, students’

2
alternative conceptions in science can be a problem for teachers. Students’
alternative ideas can influence science achievement and they should be overcome
through instruction (Beeth, 1998). In recent years many studies of students’
conceptions have been carried out in different disciplines (science, biology,
physics, and chemistry) at different levels from elementary school to colleges
(Gilbert and Watts, 1983; Driver et al., 1994; Gil-Perez and Carrascosa, 1990) for
example, energy and processes of change (Stylianidou, 1997), pre-service
elementary teachers’ self-efficacy beliefs and their conceptions of photosynthesis
and inheritance (Çakıro�lu and Boone, 2002), and high school students’
understanding of resistance in simple series electric circuits (Mullet, 2002), etc.
In short, students have still some problems in science concepts and
specifically the concept of ecology. Students’ misconceptions cannot be
eliminated easily by traditional methods. Traditional instruction does not help to
encourage students to work together, to share ideas and information freely with
each other. Traditional methods mainly use lecture strategy rather than several
instruments to extend students’ intellectual capabilities and have not brought more
successful results for expected aims of science education. One possible solution
for this problem is to make students more active learners in science classrooms.
Students should be able to apply what they learn in school to their daily life
situations. Weaver (1998) pointed out that students found topics more interesting
when they have some relevance to their daily lives or experience.
One alternative way is to change the instruction from teacher-centered to
student-centered using a constructivist approach. Constructivism is mainly linked

3
to students’ alternative conceptions and their own experience. In constructivist
perspective, students’ alternative conceptions are interpreted. Students enter the
classroom with their own ideas and experiences and they shape their formal
knowledge based on their existing ideas and experiences at school. Their
preconceptions can be valid, invalid, or incomplete. When the new information or
experiences are presented to the students in the classroom, they will either reject
or reformulate their existing cognitive structures whether their knowledge and
experiences are connected to their background information. Finally, students’ own
perceptions and new ideas should be integrated as a useful part of their memory.
In contrast, the memorized facts or information that do not depend upon
students’ existing experiences will be forgotten easily. Therefore, the new ideas or
concepts should be attached to students’ old experiences accordingly. In that case,
it will help students construct the meaningful information in their existing mental
framework (Hanley, 1994).
A lesson in a ‘constructivist approach’ differs greatly from the traditional
teacher-as-lecturer class type. The focus is on the acquisition of understanding,
not on rote memorization. The teacher is not mostly active in the class as in
traditional classrooms and the activities are student-centered. The role of the
teacher has changed, and the teacher can be considered as a guide. Teacher should
help the students in budding new insights and connecting them with their prior
knowledge. S/he should organize information around conceptual clusters of
problems, questions in order to engage student interest on a topic that has a broad
concept. Ideas should be given as broad concepts first, and then they should be

4
broken down into parts. Students should be supported to ask questions, carry out
experiments, and come to their own conclusions (Hanley, 1994).
The constructivist strategies are consistent with inquiry approach,
discovery approach, cooperative learning, and discrepant events. Those
instructional approaches can be effective classroom tools and facilitate conceptual
change (Chang and Mao, 1999a; Chang and Mao, 1999b). To provide conceptual
change and meaningful learning of science concepts, there is a need for using
effective techniques for overcoming those misconceptions in science. One of the
most effective strategies for eliminating students’ misconceptions in science is
‘conceptual change approach’. In conceptual change approach, students should be
dissatisfied with their existing ideas first of all. Then, students presented new
concepts and it is explained that these concepts should be parallel to the
knowledge in other areas. Finally, they should be led to new insights (Posner et
al., 1982).
To overcome students’ alternative conceptions, large amount of researches
have explored the effects of conceptual change approaches and several
instructional tools in science such as; concept maps (Novak, 1990; Wallace and
Mintzes, 1990; Jegede et al., 1990), conceptual change texts (Chambers and
Andre, 1997; Mirjamaija, 2001; Yürük and Geban, 2001; Çakır et al., 2001; Çakır
et al., 2002), refutational texts (Hynd, Mcwhorter, Phares, and Suttles, 1994),
analogy (Stavy, 1991), cooperative learning strategy (Lonning, 1993; Jansen and
Finley, 1995; Lazarowitz et al., 1994; Chang and Mao, 1999a); story telling

5
(Banister and Ryan, 2001), portfolio (Valdez, 2001), teaching experiments (Niaz,
2002).
Conceptual change texts are assumed as one of the effective conceptual
change tools in science education. Each conceptual change text starts with a
question. Later some common students’ alternative conceptions in science are
presented. Then, scientifically correct statements are given. Chambers and Andre
(1997) proved that the conceptual change texts led to better conceptual
understanding of electrical concepts than the traditional didactic text. Sungur
(2000) used conceptual change texts and concept maps together in her study, and
she stressed that this instruction was significantly effective to students’
understanding of human circulatory system than the traditional methods.
On the other hand, refutational texts are used for eliminating students’
common misconceptions in science education. Palmer (2003) stated that both
refutational texts and conceptual change texts were able to induce accommodation
in a large proportion of the students about the concept of ecological role in nature.
Students may find that some biological concepts such as genetics,
photosynthesis, and food web are abstract, difficult, confusing, and complicated.
Thus, students have some common misconceptions about biological concepts.
They are obstacles for students realizing biological concepts. Therefore, students
may not construct meaningful learning in biology. Some research studies based on
misconceptions about the biological concepts are; about the concepts of cellular
respiration (Çakır et al., 2001), amino acids and translation (Fisher, 1985), human
circulatory system (Sungur, 2000), natural selection (Anderson, Fisher, and

6
Norman, 2002), evolution (Jensen, and Finley, 1995), photosynthesis and
respiration (Çapa, 2000), photosynthesis and inheritance (Çakıro�lu and Boone,
2002), genetics and ecology (Okebukola, 1990; Bahar et al., 1999b), ecosystem
and ecology (Okeke and Wood-Robinson, 1980; Griffiths and Grant, 1985),
nutrient cycling in ecosystems (Hogan and Fisherkeller, 1996), and food chain
and food web (Web and Bolt, 1990).
Ecology takes an important place in these studies. The concepts of food
chain, food web, and decomposition can be considered as three essential
ecological concepts. Researchers determined that many students have
misconceptions in ecological concepts (Adeneyi, 1985; Hellden, 1992a; Gallegos,
Jerezano, and Flores, 1994; Khatete, 1995; Leach, 1995; Eyster and Tashiro,
1997; Çetin, 1998).
Adeyini (1985) studied students’ alternative conceptions on food chain,
decomposition, energy flow, energy pyramid, and the carbon cycle with junior
secondary school students. The findings of the study showed that a few of them
still appeared after the instruction. Similarly, the results of the studies of Helden
(1992b) and Khatete (1995) revealed that students have still some misconceptions
about decomposition even after the instruction. Çetin (1998) also indicated that
English and Turkish students have some common misconceptions about food
chain, food web, and decomposition.
Though many researchers used different instructional materials such as
analogy, fieldwork and project work for ecology teaching in order to remove
students’ misconceptions, there are fewer studies which involve conceptual

7
change texts. Conceptual change texts can be used to both emphasize students’
misconceptions and remove them later. Özkan (2001) found out that the
conceptual change texts based instruction was more effective in remediation of
seventh grade students’ misconceptions about ecology than the traditionally
designed instruction.
Venville and Treagust (1998) explored conceptual change in genetics
using a multidimensional interpretive framework. They collected the data by
student worksheets, observations of lessons, videotape, audiotape to classroom
discourse and detailed student interviews. The results of the study provided
evidence that the conceptual change approach for the concept of the gene were
less effective than it was expected.
Besides the conceptual change text, several additional methods could be
used such as laboratory work, demonstration, small group work, and hands-on
activities.
Worksheets that are parts of the conceptual change texts can include some
demonstrations and then students discuss some questions in small groups if the
class size is small. The teacher could do some demonstrations, and then s/he could
guide a whole class discussion. That is, it would be better to support conceptual
change texts with some demonstrations in small groups, instead of only presenting
some misconceptions to students and then giving the scientifically correct
statements in conceptual change texts. Hence, conceptual change texts supported
by demonstrations in small group oriented instruction was used in this study.
8
In Turkey, students learn ecological concepts at fourth, seventh, and ninth
grades. Ecological concepts are given gradually to teach those concepts, and
students are expected to apply them to their everyday life. However, students’
misconceptions are main obstacles for realizing ecological concepts, getting a
better understanding, and achievement of ecological concepts.
Alternative ideas affect science achievement, as do several factors such as
gender differences (Sungur and Tekkaya, 2003), logical thinking ability, attitude
towards science (George, 2000; Willson, Ackerman, and Malave, 2000), teachers’
expectations, students’ expectations, and classroom environment.
Sungur and Tekkaya (2003) examined the effects of gender and reasoning
ability on the human circulatory system concepts for the students’ achievement
and attitudes towards biology. They found that there was a statistically significant
mean difference between concrete students and formal students for students’
achievement and students’ attitudes towards biology, although there was no
statistically significant mean difference between boys and girls for students’
achievement and attitude towards biology.
George (2000) stressed that the students’ attitudes towards science
generally deteriorated over the middle and high school years and science self-
concept was the strongest predictor of attitude towards science. Willson,
Ackerman and Malave (2000) also found a positive relationship between the
interactive model of conceptual understanding and achievement in college
freshman physics. However, they did not find any positive relationship between
students’ achievement and students’ attitudes towards science.

9
The purpose of this study was to investigate the effects of the conceptual
change approach based instruction over traditional instruction and gender at ninth
graders’ achievement and understanding levels of ecology, and attitudes towards
biology and environment. The contributions of students’ logical thinking abilities
to their ecology achievement and levels of understanding of ecology, and attitudes
toward biology and environment would be examined.
Significance of the Study
There are many researches on students’ common misconceptions and their
remediation in science by different conceptual change methodologies such as
conceptual change texts, concept maps, analogy, and preparing portfolio, etc.
Conceptual change texts are one of the powerful tools in science education.
Conceptual change texts include some common misconceptions and related
corrected scientific conceptions about science concepts. Many studies showed that
conceptual change text oriented instruction increased the students’ science
achievement (Chambers and Andre, 1997; Sharon, and Chambers, 1997;
Mirjamaija, 2001; Sungur, Tekkaya and Geban, 2001; Çakır et al., 2002).
While there is a lot of literature on students’ common misconceptions and
their remediation in ecology by several conceptual change instructional tools, the
conceptual change oriented texts on ecology are used rarely as instructional tools.
Therefore, there are some gaps in using of conceptual change texts about ecology
in the literature. On the other hand, there was not any study investigating the
effects of the conceptual change text oriented instruction accompanied by
demonstrations in small groups (CCTI) on students’ achievement and

10
understanding levels of ecology, attitudes towards biology and environment in the
ninth level in the literature. However, some ecological terms are abstract and
students have some misconceptions about ecology. To use some instructional
tools with conceptual change texts in this study can bring more successful results
than would only conceptual change text oriented instruction do. Then, the
researcher preferred to conduct a study using the conceptual change text oriented
instruction accompanied by demonstrations in small groups in this study.
The results of this study will provide insight into the effects of CCTI on
students’ ecology achievement, attitudes towards biology and environment. Also,
this study would present an example for incorporating a CCTI to ecology unit for
teachers, students, curriculum designers, curriculum developers, and other
researchers.
The findings of the study will give some information to science teachers,
particularly biology teachers about how students understand ecological concepts.
Actually, this study will provide some information about the CCTI; how it can be
conducted on ecology topics, how it affects students’ achievement and
understanding levels of ecology, attitudes towards biology and environment. It is
hoped that the results of the study will guide the future studies about the
implementation of the CCTI in the other science areas.

11
CHAPTER 2
REVIEW OF RELATED LITERATURE
Alternative ideas of students have an impact on science achievement.
Other factors such as; gender, attitude, and logical thinking ability can also
influence students’ performance in science. This overview will cover some
relevant literature on alternative ideas in science, conceptual change approaches in
science, science achievement, students’ attitude towards science, especially
students’ attitudes towards biology and environment. This chapter will also
provide a theoretical and practical background for the current study.
2.1 Misconceptions
Students learn from their environment and at school. They have several
alternative conceptions about everyday contexts, scientific knowledge, and facts.
Students’ alternative conceptions can be referred to as alternative ideas,
alternative frameworks, children’s science, or misconceptions.
Driver (1981) indicated that a main source for studying children’s ideas is
generally Piaget’s work. Children’s ideas are assumed as quite different from
scientific views. The main characteristic of students’ alternative ideas is that these

12
are resistant to change with scientific ideas. Students may reject new ideas even
after the teaching process.
Students’ misconceptions seemed to reflect an inadequacy of the
curriculum or instruction, or both. Misconceptions may originate from several
reasons such as previous learning, teacher expectations, everyday life experiences,
and school activities. Çapa (2000) found that social practices and school
experiences caused ninth graders’ misconceptions about photosynthesis and
respiration in plants. Misconceptions may also occur because of teacher’s
misconceptions in science topics and misconceptions in the textbooks (Storey,
1989; Duit, 1991; Storey, 1992; Gauld, 1997; Galley, 2001).
Storey (1992) studied textbook errors and misconceptions in cell
physiology about enzyme catalyzed reactions, RNA as a catalyst, protein levels in
cells, amino acids, organic acids, glucose and fructose, gluconeogenesis, fatty
acids and ketone bodies, diffusion, and transport across membranes.
Science teachers and curriculum designers need to know which alternative
framework is specifically found in science. If students’ misconceptions or
misunderstandings in certain science concepts were known beforehand, it would
be helpful for teachers. Thus, a teacher can prepare a teaching scheme to remove
those kinds of misconceptions and improve students’ understanding of those
science concepts (Griffiths and Grant, 1985; O-Saki and Samiroden, 1990;
BouJaoude, 1992).

13
There are many studies specifically investigating children’s understanding
of several biological concepts. Research studies on students’ conceptions or
misconceptions in biology focused on mainly the concepts of human circulatory
system (Sungur et al., 2001), diffusion and osmosis (Christianson and Fisher,
1999; Odom and Barrow, 1995), osmosis (Westbrook and Marek, 1991), genetics
(Wood-Robinson, Lewis and Leach., 2000), cellular respiration (Çakır et al.,
2001), photosynthesis and respiration (Çapa, 2000), genetics and ecosystem
(Bahar et al., 1999a), nutrient cycling in ecosystems (Okeke and Wood-Robinson,
1980), nutrient cycling (Hogan and Fisherkeller, 1996), and natural selection
(Anderson, Fisher, and Norman, 2002).
Finley et al. (1982) asked biology teachers to rate important and difficult
concepts. Photosynthesis, mitosis/meiosis and cellular respiration were considered
as the top three important and difficult concepts among 15 biological concepts for
the students. The teachers perceived the concept of food chain/food web as
important, but not a difficult concept among biological concepts. Odom and
Barrow (1995) investigated college biology students’ understanding of diffusion
and osmosis after the instruction. They developed a two-tier diagnostic test
relating student misconceptions. The first tier examined content knowledge and
the second tier examined understanding of that knowledge. Wood-Robinson et al.
(2000) pointed out that the students (15-16 years) have many confusion over the
nature of genetic information in cell, and the mechanism of transferring genetic
information from one cell to another and between generations.

14
2.2 Misconceptions Related to Ecology
Students’ understanding and misconceptions concerning the key concept
of ecology have been the subject of considerable research recently. McComas
(2002) summarized the misconceptions about ecology. The food chain, food web,
and decomposition can be considered as three main and abstract concepts among
the ecological concepts (Griffiths and Grant, 1985; Webb and Bolt, 1990;
Hellden, 1992b; Khatete, 1995; Leach, 1995; Çetin, 1998; Khalid, 1999).
Griffiths and Grant (1985) studied the high school students’ understanding
of food webs using pre-test and post-test design with accompanying reasoning
items. They reported the following common misconceptions held by students:
1. In a food web, a change in one population will only affect another
population if they are directly related as predator and prey.
2. A population located higher on a given food chain within a food web is
a predator of all populations located below it in the chain.
3. A change in the size of a prey population would have no effect on its
predator population.
4. If the size of one population in a food web is altered, all other
populations in the web will be altered in the same way.
Barman, Griffiths, and Okebukola (1995) examined the views of high
school students from the USA, Australia, and Canada with regard to food chains
and food webs. They found that most of the students from the three countries had

15
some difficulties about food chains and food webs. This study resulted in similar
findings by Griffiths and Grant (1985) with regard to the Canadian students’
understanding of food webs. However, they determined one more additional
misconception that was not identified by Griffiths and Grant (1985) such as; “a
change in the population of a first order consumer would affect one or more
producer populations”.
Webb and Bolt (1990) identified the students’ ability to respond to
questions based on relationships in food chains and food webs. They reported that
students aged 15-17 could not predict likely outcomes when the effects of a
change in one population in a community expended in many directions.
Furthermore, from the data provided by student groups at different ages, they
suggested that if the pupils do not conceptualize clearly the concept of food web
in early school years, the students will have a tendency to resist change to their
ideas even at university level.
Gallegos et al. (1994) examined the students’ misconceptions about food
chain and they found that:
1. Animals are carnivorous if they are big and ferocious.
2. Animals are herbivorous if they are passive or smaller than the
carnivorous animals.
On the other hand, Khatete (1995) studied decomposition, food spoilage,
and the scientific basis of food preservation with Kenyan children in everyday life
contexts. He examined how these ideas changed through year 5 to 12. He
identified that students still had some misconceptions about decomposition at 12.

16
Helden (1992b) studied the pupils’ understanding of ecological processes and
found out some students’ misconceptions about decomposition. Several students
perceived decomposition as a process in which no organisms took part. This study
resulted in showing that the teaching had not challenged the pupils’ notions
sufficiently to create a change in the understanding of ecological concepts.
Some researchers analyzed students’ responses under some categories.
Westbrook and Marek (1991) explored seventh grade life science students’, tenth
grade biology students’, and college zoology students’ understanding of the
concept of diffusion. All responses were evaluated according to six categories;
complete understanding, sound understanding, partial understanding, partial
understanding with specific misconception, specific understanding, and no
understanding. The study claimed that there was no significant difference in
understanding of the concept of diffusion among seventh graders, tenth graders
and college zoology students.
Similarly, Simpson and Marek (1988), Keng, (1997), and Çetin, (1998)
analyzed students’ responses under four levels of understanding: sound
understanding, partial understanding, misunderstanding, and no understanding.
Çetin (1998) investigated English and Turkish eighth graders’ understanding
levels and misconceptions related to food chain, food web, and decomposition. An
ecology test was constructed for this study. It consisted of two parts: multiple-
choice part and reasoning part for each item. She used the following categories for
the students’ levels of understanding of ecology:

17
1. Sound Understanding: If the students’ responses included the
scientifically acceptable explanations about a concept, they were
considered to have sound understanding.
2. Partial Understanding: If the students’ responses were partly correct
and did not include the full range of the scientifically acceptable
explanations about a concept, they were considered to have partial
understanding.
3. Misunderstanding: If the students’ responses did not include
acceptable explanations, it implied that the students have some
misinterpretations or misjudgments of a concept. Some students’
responses, which were also clearly different from the scientific view,
were grouped as misunderstandings.
4. No Understanding: If the students could not give an explanation from
the scientific point of view for the response made in the multiple
choice questions nor could give proper answers to the open-ended
questions, they were considered to have no understanding at all. The
category ‘No Understanding’ contained those responses below:
- Nonsense responses: Irrelevant responses or responses which could not
be coded meaningfully.
- Rewrite responses: Responses that restated the instruction or question.
- No responses: Cases where the space was left empty or with the
response “I don’t know”.

18
Çetin (1998) found that the students’ understanding of ecological concepts
at eighth grade level are:
1. Students had difficulty in explaining the origin of flow of energy in a
food chain.
2. Students explained the concepts of producer and food web well.
3. Students were familiar with the decay of apples and oranges at home
or in nature, and the decomposition of the tin cans in nature.
4. Some students considered the producer or consumer responsible for
the decay in an ecosystem.
Adeyini (1985) reported the students’ common misconceptions on food
chain, energy flow, energy pyramid, and carbon cycle. He observed that the
teachers in the classroom, took notes about them, and audio taped lessons. He
developed an interview protocol to assess students’ knowledge about ecology. He
also concluded that although some of these misconceptions might have existed
before the instruction, a few of them appeared after the instruction, and their prior
misconceptions tended to block the understanding of new concepts and
generalizations.
Rueter and Perrin (1999) used a simulation technique to teach food web
dynamics as group work. Using the simulation software in the non-biology
majors, especially in grade C was significantly effective on the open-ended essay
questions and the group discussions probably enhanced students’ learning as
much as technology.

19
Carlsson (2002a) described the structure and general features of the
phenomenon of ecological understanding and demonstrated different ways of
experiencing the cycling of matter and flow of energy in the context of
ecosystems. The results indicated that the idea of transformation was the key to
development of ecological understanding. The structure of ecological
understanding was expressed to be hierarchical, that is, it has more complex ways
of thinking.
In addition, Carlsson (2002b) explored the functional aspects of the
ecosystem taking photosynthesis, recycling, and energy as the units of analysis.
She interviewed ten student teachers. According to the results of the study, the
idea of transformation was crucial to more complex ways of understanding of
photosynthesis and this idea divided the categories into a consumptional and a
transformational group. The categories were thought as hierarchical, that is, they
were required complex ways of thinking.
There is an increasing concern for environmental issues. There are some
studies about radioactivity (Ronneau, 1990), greenhouse effect (Koulaidis and
Christidou, 1999), ozone layer (Potts et al., 1996), greenhouse effect, ozone layer
depletion, and acid rain (Khalid, 1999). Khalid (1999) studied pre-service
elementary teachers’ alternative conceptions regarding three ecological issues:
greenhouse effect, ozone layer depletion, and acid rain. The results demonstrated
that the majority of pre-service elementary teachers held a group of incorrect ideas
about the causes and effects of the greenhouse effect, ozone layer depletion, and
acid rain.

20
Boyes et al. (1999) explored Greek students’ ideas (aged 11-16) on ozone
layer. Greek students had a good understanding of the position and the purpose of
the ozone layer related to the protection from harmful ultraviolet rays. However,
some students held misconceptions about the ozone layer that helps keeping the
world warm or protects it from acid rain. Students seemed aware that ozone layer
is in danger because of different pollutions. They also thought that further ozone
layer depletion might cause different problems, e.g. skin cancer or eye cataract. In
contrast to the UK curriculum, the Greek curriculum did not include the ozone
layer, green house effect, and radioactivity. Greek students’ knowledge came from
the media, family, and peer-group discussion. Although the UK students showed
better understanding about the causes of ozone layer depletion, some of them had
confusion about the ozone layer depletion with greenhouse effect.
Koulaidis and Christidou (1999) studied the primary school students’
(aged 11 and 12) for their conceptions about greenhouse effect by interviewing.
As they found, the students’ alternative conceptions were about:
1. The concept of uniform diffusion of atmospheric gases,
2. Conceptual distinction between ultraviolet and other forms of solar
radiation,
3. Conceptual distinction between sunlight and terrestrial radiation,
4. Conceptual distinction between the roles of the ozone layer and
greenhouse gases in the atmosphere,
5. Greenhouse effect seen as atmospheric pollution.

21
2.3.Conceptual Change Approach
Like misconceptions, several factors such as pre-existing conceptions,
prior achievement, prior attitude, post attitude, motivation, and logical thinking
ability, etc. can affect students’ science understanding and achievement. Barnett
and Morran (2002) addressed the students’ pre-existing ideas in her study of
“children’s alternative frameworks of the Moon’s phases and eclipses”. The study
focused on supporting students in identifying their own existing understanding
and reflecting on how their understanding evolves over time rather than directly
addressing students’ alternative frameworks. The results of the study suggested
that elementary school students could develop complex understandings of
astronomy concepts and the direct engagement of students’ alternative
frameworks might not be necessary if the students were covered by learning
activities that provided students opportunities to examine and reflect on their
understanding.
Gilbert, Osborne, and Fensham (1982) suggested that students brought
their views to science lessons. These are logical to students and have a
considerable influence on how and what they learn from their classroom
experiences.
For meaningful learning, one alternative way is to change the instruction
from teacher-centered to student-centered using a constructivist approach. Current
reforms in education in many countries generally suggest a move away from
traditional, teacher-centered, direct instruction, where students are passive,

22
towards more student-centered understanding based teaching (constructivism) that
focuses on exploration and experimentation (Smerdon and Burkam, 1999).
Students need assistance to constructing new information or interpretation
relevant to students’ prior knowledge and experiences (Appleton, 1993).
Constructivist approach can help students to gain meaningful learning.
In order to improve students’ science achievement, several teaching
strategies like investigative-oriented laboratory approach (Ertepınar and Geban,
1996), lecture and lab combined format (McCormick, MacKinnon, and Jones,
1999), case-based method (Çakır, 2002), hands-on instruction (Pyle and Akins-
Moffatt, 1999; Hardal, 2003), or multiple intelligence-based instruction (Furnham,
Reeves, and Budhani, S., 2002; A�cı, 2003; Chan, 2003; Lewicki, 2003; Nolen,
2003) are used. For instance, Pyle and Akins-Moffatt (1999) examined the effects
of visually enhanced instructional environments on students’ conceptual growth.
The results showed that the use of visual enhancements was an effective extension
strategy for hands-on learning. Christianson and Fisher (1999) compared the
university students’ learning about diffusion and osmosis in constructivist and
traditional classrooms. They found that students understood diffusion and osmosis
most deeply in the small discussion/laboratory course.
A�cı (2003) investigated the effects of multiple intelligence-based
instruction at on ecology achievement, attitudes towards ecology, and multiple
intelligences. She found that multiple intelligence-based instruction was effective
in increasing students’ achievement in ecology and multiple intelligences.

23
However, it did not show a significant increase in students’ attitudes towards
ecology.
Furthermore, some researchers suggested using mixed methodologies in
science teaching. McCormick, MacKinnon, and Jones (1999) recommended using
lecture and lab combined format for the effectiveness and feasibility of teaching
introductory biology. The results of this study may contribute to the development
of a model for student-centered science instruction from elementary to graduate
levels.
If teachers are familiar with constructivist ideas and those ideas fit in their
value system, and constructivist ideas can be taught to students at school context
(Duit, 1991). Based on the constructivist research’s suggestion that no matter
what is on the list of critical content, students will not learn unless teaching
practices are designed to promote learning. Yager and Lutz (1994) pointed out the
importance of appropriate teaching and giving more importance to how we teach
than what we teach.
Duschl and Gitomer (1991) indicated that the constructivist instruction in
science emphasizes knowledge formation including learning cycle, conceptual
change teaching model, generative model, and using of analogies, etc.
There can be several constructivist formats to use in science classrooms.
For example, Lord (1994) preferred to use the ‘5E’ constructivist model that
involved engage, explore, explain, elaborate, and evaluate phases in a lesson on
cell division. He stated that cooperative group learning has a crucial role in
constructivism. The teacher role has changed from ‘presenter’ to ‘facilitator’.

24
Teacher plans the activities that challenge and promote the students work
collaboratively. According to Lord (1994), the constructivist model encourages
students to remain on task to be accountable for their learning, and to retain the
information longer than they would in traditionally taught classes. He added that
students enjoy their classes taught using constructivism more than lectures.
Constructivist teaching requires different approaches. A constructivist
teacher will
- encourage and accept student autonomy, initiation, and leadership,
- allow student thinking to shift content and instructional strategy based
on student responses,
- ask students to elaborate on their responses,
- allow wait time when asking questions,
- encourage students to interact with each other and with the teacher,
- ask thoughtful and open-ended questions,
- encourage students to reflect on experiences and predict future
outcomes,
- ask students to articulate their theories about concepts before the
teacher presents his/her understanding of the concepts,
- look for students’ alternative conceptions and design lessons to address
any misconceptions (Yager and Luts, 1994).

25
In order to help to overcome students’ alternative ideas or difficulties in
science and to provide meaningful learning in science, one of the most effective
strategies is the conceptual change approach. This strategy originated from
constructivist framework in general. Thus, the conceptual change approach is
mainly used for removing students’ misconceptions in science and increasing
students’ understanding of science.
Posner et al. (1982) developed a model of conceptual change and Hewson
and Hewson (1983) elaborated it. Posner et al. (1982) presented four conditions
for conceptual change: dissatisfaction, intelligibility, plausability, and fruitfulness.
That is, students are dissatisfied with their own existing ideas first of all. Then,
new conception should be intelligible. Students are presented new concepts and
they are given some explanations (intelligibility). However, these new concepts
should correspond to the knowledge in other areas (plausability). Finally, they
should be fruitful. They should guide to new insights (fruitfulness). If students use
their existing concepts to deal with new phenomena, it is the first phase of
conceptual change and it is named as assimilation. However, if students’ current
concepts are inadequate to accomplish new conceptions, in that case students
should replace or reorganize their existing ideas. That is they accommodate their
ideas with the existing ones.
Hewson and Hewson (1983) used the conceptual change model to examine
the effects of the students’ prior knowledge and conceptual change strategies on
science learning. In this work, pre- and post-tests relating the concepts of mass,
volume and density were used to assess the conceptual change of students. They

26
reported that the experimental group students showed significant improvement in
the acquisition of scientific conceptions.
Hewson and Thorley (1989) indicated that a model of conceptual change
includes two major components; the conditions and the person’s conceptual
ecology. In order to experience a person’s conceptual change, the conditions
should be satisfied. On the other hand, a person’s conceptual ecology supplies the
context as to arise conceptual change. They also stressed that change in the status
of conceptions play a central role in the model of conceptual change. They stated
that ‘discrepant event’ demonstrations or anomalies are mainly used in conceptual
change teaching but teachers should pay attention to two other things, diagnose
the conceptions and monitor the status of old and new conceptions that occur in
students’ mind.
Stofflett (1994) applied the conceptual change constructs to teacher
education. The results revealed that the new strategies made teacher candidates
dissatisfied with their pre-existing ideas. Teacher candidates expressed that new
strategies were intelligible, plausible, and fruitful.
Eryılmaz (2002) investigated the effects of conceptual assignments and
conceptual change discussions on students’ misconceptions and achievement
regarding force and motion. The treatment time period of the study was 8-weeks.
The study involved 6 physics teachers and their 18 classes, consisting of 396 high
school physics students. All students were administered the Force Misconception
and Force Achievement Tests as pre-test and post-test. The results of the study
indicated that the conceptual change discussion was an effective tool for reducing

27
the number of misconceptions students held about force and motion. Additionally,
the conceptual change discussion was found significantly effective in improving
students’ achievement in force and motion.
2.4 Instructional Tools for Conceptual Change
In the conceptual change based instruction, several instructional tools or
strategies can be used frequently for eliminating misconceptions in science such
as concept maps (Lehman et al., 1985; Wallace and Mintzes, 1990; Jegede et al.,
1990; Okebukola, 1990), conceptual change texts (Sharon and Chambers, 1997),
refutational texts (Hynd et al., 1994; Sönmez, 2002), story telling (Banister and
Ryan, 2001), analogy (Stavy, 1991), word association tests and grid questions
(Bahar et al., 2000), diagnostic trees (Bahar, 2003a), portfolio (Valdez, 2001), and
cooperative learning strategy (Lonning, 1993; Lazarowitz et al., 1994), etc.
2.4.1 Concept Maps
A concept map may have several concepts related to each other. Concept
map is an educational tool used for exploring prior knowledge and
misconceptions, encouraging meaningful learning to improve students’
achievement, and measure the understanding of the concept.
Concept maps can be used in four areas: as a learning strategy, as an
instructional strategy, as a strategy for planning curriculum, and to students’
understanding of science concepts (Novak, 1990). For example, concept maps
were used as an assessment of student learning in science classrooms (Rice, Ryan
and Samson, 1998; McClure, Sonak and Suen, 1999). Wallace and Mintzes

28
(1990) used the concept maps for exploring conceptual change in biology. Sungur
et al. (2001) used the concept maps for recognizing and modifying students’
misconceptions. Binzat (2000) also reported that the concept mapping contributed
significantly to the better understanding of human excretory system. Moreover,
using the concept mapping or other metacognitive tools in teacher education
programs may be useful because;
1. these tools may help in-service teachers to have more meaningful
practices and then their students may form a conceptual understanding
of the subject.
2. teachers may become skillful by using metacognitive tools including
computer-mediated tools. Then they can help their students learn how
to use computers (Novak, 1990).
Songer and Mintzes (1994) explored understanding of cellular respiration
for the first and last year biology students. They used concept maps and clinical
interviews to examine the conceptual change of the students. Study was conducted
before and after the instruction of cellular respiration for first year students. A
wide range of conceptual difficulties were found in first year biology students,
and similar difficulties were found in last year students too. Okebukola (1990)
conducted a study attaining meaningful learning of concepts in genetics and
ecology and used concept mapping with 138 pre-degree biology students. The
experimental group who employed the concept mapping technique showed
significantly better results than the control group.
29
2.4.2 Conceptual Change Texts
Conceptual change texts are also used to improve students’ science
achievement. Each conceptual change text starts with a question relating a science
concept to students. After the first question, some common misconceptions
regarding this question are presented to students at first. Then, students are
introduced to scientifically correct explanations of the given concept in the text.
After that, the first question is answered. The text continues with the second
question. The aim of the conceptual change text is to make students realize the
scientifically wrong statements and changing them with the scientifically correct
ones.
Tianyu and Thomas (1991) investigated the effects of the conceptual
change texts and the application questions in 139 college students’ learning
electricity concepts. According to the results of the study, the conceptual change
texts and the application questions improved the acquisition of qualitative
concepts of the students. Erdmann (2001) examined the effect of conceptual
change text design on fifth grade learners’ comprehension of photosynthesis. The
study found that the children who studied the conceptual change text design
performed statistically better than the traditional ones in eliminating common
misconceptions about photosynthesis and improving understanding of
photosynthesis.
Similarly, Sharon and Chambers (1997) explored relationships between
gender, interest and experience in electricity, and the conceptual change text

30
manipulations on learning basic direct current concepts. The conceptual change
text provided a better conceptual understanding of electrical concepts than the
traditional didactic text. This finding supports the hypothesis that prior interest
level, experience, and knowledge mediate apparent gender differences in learning
about electricity. This suggests that the conceptual change text manipulations are
likely to be effective in both males and females.
Çakır et al. (2001) examined the effectiveness of the conceptual change
text oriented instruction on the students’ understanding of cellular respiration
concepts. The study consisted of 84 eleventh grade students from the four classes
of a high school. Two of the classes were randomly assigned as the control group
and they were instructed by the traditional instruction. The other two classes were
randomly assigned as the experimental group and they were taught using the
conceptual change text oriented instruction. The results of the study indicated that
students exposed to the conceptual change text oriented instruction had better
understanding of cellular respiration concepts than those exposed to the traditional
instruction. However, the students in the experimental and the control groups
showed similar attitude towards biology.
Özkan (2001) conducted a research on remediation of the seventh grade
students’ misconceptions related to ecological concepts and students’
environmental attitudes through the conceptual change approach. In the study,
conceptual change texts were used. This study indicated that the experimental
group achieved significantly better than the control group. Furthermore, no
significant difference was found between the experimental and the control groups

31
related to their attitudes towards environment. The misconceptions were identified
through an Test of Ecological Concept related to the concepts of the environment,
ecosystem, decomposer, population, energy resources in ecosystems, food chain,
and food web.
2.4.3 Refutational Texts
Refutational texts are also conceptual change oriented instructional tools
and used to improve students’ science achievement. Basically, refutational texts
have same logic with conceptual change texts. Refutational texts also include one
or more questions. Each text starts with a question and then some common
misconceptions are refuted in the text immediately. Students are expected to be
confused with those refutations at first. Later, some scientifically correct
explanations are given to the students. Finally, the question asked in the beginning
of the text is responded. Text continues with the second question, if there is one.
The aim of refutational texts is to make students refute the misconceptions and
change them with the scientifically correct ones.
Hynd et al. (1994) examined the role of instructional variables (a variety
of demonstrations and discussions) in conceptual change in high school physics
(Newton’s laws of motion). In this study, the refutational texts were used and they
contained Newton’s ideas regarding motion and unrelated ideas about atoms.
Treatment involved pre-test, instruction and post-test. According to the study
outcomes, it was confirmed that the refutational texts were effective for
instruction.

32
Similarly, Sönmez (2002) found that the instruction of refutational texts
supported with discussion webs about electric current was more successful for
eliminating misconceptions and improving the students’ understanding than the
traditional methods.
2.4.4 Other Instructional Tools for Conceptual Change Approach
To support conceptual change texts oriented instruction with other tool(s)
may bring more successful results to the study. Some researchers used a mixed
conceptual change methodology in their studies. For instance, Çakır et al. (2002)
compared the effectiveness of the concept mapping based instruction, conceptual
change texts oriented instruction, and conventional methods based instruction on
tenth grade students’ understanding of acid and base concepts. This study
involved 110 students from six classes of a chemistry course taught using the
same teacher and these classes were assigned as four experimental group classes
and two control group classes. While two experimental group classes were
instructed with the concept mapping instruction, the other two experimental group
classes were taught using the conceptual change text instruction. The other two
classes were assigned as control group and they were instructed with the
traditional instruction. All students were administered the Acids and Bases
Concept Pre-test and Post-test. According to the results of this study, both the
concept mapping based instruction and conceptual change texts oriented
instruction caused a significantly better acquisition of scientific conceptions
related to acid and base concepts than the conventional methods based instruction.
33
In addition, the study showed that gender difference had no effect on the
understanding of acid and base concepts.
Similarly, Sungur et al. (2001) explored the contribution of the conceptual
change text accompanied by concept mapping instruction to the tenth grade
students’ understanding of the human circulatory system. While 26 students in the
experimental group were taught using the conceptual change texts accompanied
by concept mapping, 23 students in the control group were taught using the
traditional instruction. Besides treatment, other independent variables of the study
were their previous learning in biology and science process skills. For statistical
analysis, Multiple Regression Correlation analysis was used. It showed that the
treatment, science process skill, and previous learning in biology each made a
statistically significant contribution to the variation in the students’ understanding
of the human circulatory system. Additionally, it was found that the conceptual
change texts accompanied by concept mapping instruction produced a positive
effect on students’ understanding of concepts. The mean scores of the
experimental group performed better than the control group with respect to the
human circulatory system. In this study, 59.8 % of the experimental group and
51.6 % of the control group performed well after the treatment.
Another strategy for conceptual change in science is story telling. Banister
and Ryan (2001) proposed story telling as an exciting way to develop student’s
science ideas and to use their emotions, feelings and attitudes to make their
science learning more memorable. They studied development of science concepts
of water cycle through story telling in a primary classroom (aged 9-10). The study

34
showed that students’ ideas changed and they developed more scientifically
correct ideas.
Valdez (2001) suggested that portfolio project can be used as an
alternative assessment tool because it has improved student performance. During
portfolio project, students are encouraged to foster their creativity and to further
their understanding about science concepts through additional reading and
writing.
Additionally, analogy can be used to change students’ misconceptions
about science concepts, (Stavy, 1991; Glynn and Takahashi, 1998). Stavy (1991)
used analogy to overcome misconceptions about conservation of matter. The
study gave positive outcomes in respect to analogy. Similarly, Glynn and
Takahashi (1998) used the analogy-enhanced science text at sixth and eighth
grades. The study indicated that analogy played as mediator between the students’
existing ideas and the new knowledge in the analogy-enhanced text. As a result,
the target concept of animal cell was more understandable and memorable by the
analogy of a factory.
In order to overcome misconceptions about ecology, project or fieldwork
can be used to make change in students’ ideas. Manzanal, Barreiro, and Jiménez
(1999) investigated the relationship between ecology fieldwork and Spanish
secondary school students’ attitudes (aged 14-16) towards environmental
protection. According to the explanatory study and the experimental study results,
fieldwork contributed to the students’ understanding of ecological concepts and to
their positive attitudes towards the protection of the ecosystem.

35
Niaz (2002) constructed a teaching strategy that could facilitate conceptual
change in freshman students’ understanding of electrochemistry. The study was
intended to provide students with the correct response along with alternative
responses (teaching experiments) creating a conflicting situation. According to the
results of the study, there was a statistically significant difference in the
performance of electrochemistry between the experimental and control groups.
The teaching experiments facilitated students’ understanding of electrochemistry.
Han (2002) used deductive reasoning to promote the change of students’
conceptions about force and motion. Students participated in the study almost
found the direction of force correctly by using deduction. The results showed that
deductive reasoning was utilized by making scientific explanations and
predictions to help middle school students change their prior conceptions about
force and motion.
2.4.5 Demonstrations
Demonstrations illustrate and reveal a science process or a principle. Not
only is demonstration a strategy used as a teacher performing an experiment to the
students, but also it may be used as a teacher showing something under
microscope, demonstrating a model, poster, film, slides, plants, and animals, etc.
to the students. Thus, demonstrations can be interest arousing, entertaining,
motivating, and they can cause one to wonder about the science concepts being
presented.

36
Teachers may mostly prefer to perform demonstrations instead of
laboratory work, in particular in big classes in conditions when laboratory
equipments are insufficient. It may save time, money, materials and efforts.
Sometimes a student or a group of students may perform demonstrations in a
class. In that case, the teacher should guide the demonstration process.
Demonstrations can be used as teaching and learning aids in science
education. They can be used for several purposes such as to start or support the
teaching of practical science concepts, to help communicate ideas in science, or as
a means of measuring student learning by instructors. For example, they can be
used in demonstration-based assessment activities to enhance students’ conceptual
understanding of chemistry (Bowen and Phelps, 1997).
2.4.6 Small Group Work
Cooperative learning is a structured, systematic instructional strategy. In
cooperative learning, students work together towards a general goal in a small
group. The best known types of cooperative learning, from the more teacher-
centered to more student-centered approaches, are student teams achievement
division, jigsaw, constructive controversy (structured debate), and group
investigation (Cooper, Robinson, and McKinney, 1994). Small group instruction
may involve several instructional strategies such as demonstrations, worksheets,
and small group discussions.
Many researchers have conducted a research on the effectiveness and
efficiency of cooperative learning on groups of students. Cooperative learning is a

37
teaching strategy where students work together in small teams and use a number
of activities to achieve academic objectives and improve their understanding of
subject matters.
Cooperative learning strategy may help conceptual change oriented
instruction. Cooperative learning is an effective learning method and it can bring
more science achievement. Previous studies give some evidences that cooperative
learning is an effective learning strategy (Watson, 1991; Basili and Sanford, 1991;
Lonning, 1993; Lazarowitz et al., 1994, Jensen and Finley, 1995; Weaver, 1998;
Jofili, Geraldo, and Watts, 1999; Bahar, 2003b). For instance, Weaver (1998)
found that the students favored laboratory or hands-on activities and this type of
activities could promote conceptual change when combined with discussion and
reflection.
Small group discussion sessions can be used in large size classes to
complement the lecture. It can also be used in small size classes as a mixed
strategy of the lecture and discussion format. Discussions can be guided by the
teacher (teacher-centred) or by the students (student-centred). In any case,
discussions are more dynamic if students are provided with prerequisites.
Alexopoulou and Driver (1996) studied a small-group discussion in
physics focusing on peer interaction modes in pairs and in fours. Their study
revealed that the students progressed significantly more in their physics reasoning
in four people group than the pairs.
Schmidt, De Volder, De Grave, Moust, and Patel (1989) assessed the
effects of prior knowledge activation through small-group discussion. Subjects
38
were asked to elaborate on possible explanations of natural phenomena about
blood cell and osmosis. The results of the study suggested that such activation of
prior knowledge could be a successful instructional strategy.
Basili and Sanford (1991) examined the effectiveness of the conceptual
change based instruction in small cooperative groups over traditionally designed
instruction on the concepts of the laws of conservation of matter and energy and
aspects of the particle nature of gases, liquids, and solids. The study provided that
cooperative groups had more success in overcoming misconceptions in chemistry
than the control group. Lonning (1993) investigated the effects of conceptual
change instructional model with cooperative learning on students’ verbal
interaction patterns and achievement in tenth grade general science. These
conceptual change instructional models on particle model of solids, liquids, and
gases include; orientation, elicitation, restructuring, modification and extension,
and application. The study demonstrated that cooperative learning strategy helped
conceptual change instruction.
The results of the study that Jensen and Finley (1995) did, demonstrated
that using historical materials in combination with a conceptual change strategy in
small group setting was promising to teach Darwinian evolution to students
enrolled in Principles of Biology. This study was conducted in only experimental
groups. Treatment involved lecture and small group activities. According to the
findings of the study after the treatment, there was an overall increase in students’
ability to answer questions about evolution in Darwinian terms. Wood-Robinson
et al. (2000) used small group discussions on cellular genetics. The discussion

39
task was on the chromosomes in different cells in the body of an organism. The
results revealed that while 11/35 students had the correct number of chromosomes
in each cell of the series in overall, only six students of thirty-five students
differentiated the correct number and color relating cellular genetics.
Nussbaum (2002) examined introverts versus extroverts approach in small
group argumentative discussions. The results showed that the more extrovert
students made significantly more contradictions during small group discussions
with other extroverts, while the more introvert students worked with one another
collaboratively to develop creative solutions.
Additionally, Bahar (2003b) investigated the effects of the traditionally
designed instruction and the discussion-based group technique on the students’
achievement. He also examined the relationship between the instructional
techniques and the cognitive styles of the students. In the control group, proteins
were instructed by the teacher-based lecture. However, students in the
experimental group were randomly grouped as five firstly. Then, one of the
students became a chairman and other four students in each group were given four
different information sheets about proteins. Students then responded individually
to the questions about their topics on the information sheet, and the group
members shared their ideas with each other. Finally, all students were given
general questions about proteins to discuss altogether. He determined that the
students who took the discussion-based group technique showed higher
performance than the students in the control group. Furthermore, the study proved
that the traditionally designed instruction was more successful for the field

40
independent students than the field dependent students, whereas the discussion-
based group technique was successful in both group of the students.
Small group work can also be used with conceptual change approach.
Gedik (2001) investigated the effectiveness of the demonstration method based on
conceptual change approach on the students’ understanding of electrochemistry
concept and attitudes towards chemistry at 11th level. Students’ science process
skill was measured by the Science Process Skills Test at the beginning of the
study. According to t-test and ANCOVA, the students who used the
demonstration method based on conceptual change approach had significantly
higher electrochemistry scores and higher positive attitudes towards chemistry
than the students who were taught using the traditionally designed chemistry
instruction. Students’ science process skills were found to be a strong predictor
for the students’ electrochemistry achievement.
Gayford (1993) found that the discussion-based group work carried out
with 15-year-old science students in England about the environmental issues was
an effective method of providing students with the opportunity to develop
learning skills and improving motivation.
2.5 Science Achievement, Attitude towards Science, and Attitude towards
Environment
As explained above, there are several conceptual change instructional tools
used for eliminating misconceptions of science concepts and increasing students’
science achievement, especially in ecology. However, like students’ alternative

41
ideas or misconceptions, attitude can be another factor affecting students’ science
achievement.
Many researchers focused on the relationships among instruction,
achievement, and attitude in their studies and they supported the idea that there
exists a positive relationship among instruction, achievement, and attitude (Duit,
1991; Greenfield, 1996; George, 2000; Papanastasiou and Zembylas, 2002;
Kesamang and Taiwo, 2002; Dahindsa, Chung, and Bolkiah, 2003). Greenfield
(1996) indicated that the students in grades 3-12 in the USA showed the most
positive attitudes towards science and the most positive perceptions of their own
science ability and achievement.
George (2000) investigated the change in the students’ attitudes towards
science over the middle and high school years using data from the Longitudinal
Study of American Youth. The results of the study showed that students’ attitudes
towards science generally decreased over the middle and high school years. While
teacher encouragement of science and peer attitudes are also significant predictors
of students’ attitudes, the effects of the parents were found to be quite small and
statistically non-significant, with the exception of the seventh grade in the study.
Jaus (1982) examined the effect of the environmental education instruction
on the students’ attitudes towards environment. The experimental group exhibited
more favorable attitudes towards environment in the study than the control group.
Ignatiuk (1978) examined whether a relationship existed among eleventh
grade biology students’ attitudes towards science, their experiences of field trip
activities, and environmental concepts or not. She observed such a relationship

42
and found statistically significant differences in the students’ attitudes after the
varying amounts of fieldwork during the 15-week study period. Similarly,
Fernández Manzanal et al. (1999) found a relationship between the ecology
fieldwork and the students’ (aged 14-16) attitudes towards environmental
protection. The results showed that the fieldwork helped to clarify ecological
concepts and mediate directly in the development of more favorable attitudes
towards the defense of the ecosystem.
However, there were some studies that did not support the positive
relationships among instruction, achievement, and attitude. The study of
Papanastasiou and Zembylas (2002) showed that science achievement and science
attitudes could have differential effects on each other depending on the
characteristics of the educational systems of the country.
Kesamang and Taiwo (2002) found that among Botswana junior
secondary school students there were significant negative relationships between
their attitudes towards science and their science achievement, although they were
found to be positively willing towards school science in general. Berbero�lu, et al.
(2003) examined the factors affecting achievement level of Turkish students in the
third international mathematics and science study (TIMSS). In this study,
perception of success and socio-economic status were determined as predicting
factors in achievement in mathematics and science. The study showed that as
classroom activities increased such as project works, classroom discussions, and
group work, students’ achievement decreased.

43
2.6 Science Achievement, Gender Differences, and Attitude towards Science and
Environment
There is an interest and debate on whether students’ gender differences
have significant influence on their science achievement. The study of Pearsall et
al. (1997) proved that gender was effective on their science achievement. They
explored the introductory, college-level biology students’ successive and
progressive changes regarding the structural complexity of knowledge. They also
studied how the students’ primary learning and gender affected those changes. In
this study, students prepared their concept maps in 4-weeks throughout the term
and these maps were evaluated by researchers for structural complexity and
changes based on the literature. They found significant relationships among
knowledge restructuring, predominant learning, and gender of students. The study
showed that the females were more successful than the males. However, Zhang
(1999) demonstrated that males had more confidence and positive attitude towards
mathematics and science than their female peers.
Jones, Howe, and Rua (2000) conducted a survey study on 437sixth grade
students’ gender differences concerning students’ experiences, interests, and
attitudes toward science and scientists. According to the results of the study, there
was a significant gender difference as regards science experiences, attitudes,
perceptions of science courses, and careers. It was also reported that female
students found science more difficult subject than males, while more males

44
reported that science was destructive and dangerous, as well as more suitable for
boys than girls.
Gentry, Gable, and Rizza (2002) investigated whether differences existed
between the perceptions of class activities for students in grade 3-8 and genders.
The study showed that the middle school students found their classroom activities
less frequently interesting and enjoyable than the elementary school students. The
important result of the study was that girls were significantly more interested in
class activities than the boys.
Dahindsa, Chung, and Bolkiah (2003) showed that there were significant
differences in male and female students’ science achievement and attitudes
towards science in single-sex schools and coeducational schools. The girls
achieved moderately better in science than the boys despite the fact that girls’
attitudes were only marginally better than the boys in single-sex schools, although
there were no gender differences in students’ science achievement and attitudes
towards science in coeducational schools.
Pell and Jarvis (2001) demonstrated that both boys’ and girls’ (from 5-11
years) enthusiasm for science declines progressively with age alongside a similar
decline in their perception that science was difficult. Similarly, Norman, R. (2003)
studied the attitudes and perceptions of Scottish girls and boys towards physics
over the age range of 10-18 years old. The results revealed that students’ attitudes
towards science are very positive at the end of primary school. However, those
positive attitudes have declined quite markedly, and there was a significant
decline of girls’ attitudes towards science when compared to boys’ attitudes

45
towards science by the end of the second year of secondary school. The positive
attitudes of boys and girls towards the Standard Grade Physics Course were
observed again in ages 14-16. This increase of students’ positive attitudes towards
physics was in favor of girls. Although over 90 per cent of the observed fourth
year pupils wanted to continue their studies in physics, a noticeable decline in
attitude towards the Higher Grade course, especially for boys was observed.
On the contrary, Çakır et al. (2002) emphasized that gender difference was
not effective in students’ achievement in chemistry concepts. Similarly, Sungur
and Tekkaya (2003) made a research to see whether students’ gender and
reasoning abilities have effects on their achievement in human circulatory system
concepts and students’ attitudes towards biology. The results of the study showed
that there was not a statistically significant mean difference between the boys and
girls regarding students’ achievement in human circulatory system concepts and
attitudes towards biology. Tinklin (2003) found that there was no relationship
between their social status and school achievement of boys and girls (aged16 and
18). She demonstrated that cultural factors affected boys and girls equally in all
schools.
Worsley and Skrzypiec (1998) studied the environmental attitudes of
senior secondary school students in South Australia. In their study, the
Questionnaire of Environmental Beliefs was applied to 958 senior secondary
students, from a stratified sample across 32 country and metropolitan schools,
aged 15-18 years. The results of the study were interpreted according to students’
regions, gender, and socioeconomic status. In general, students from both rural

46
and urban regions were quite concerned but they were pessimistic about
environmental issues. Girls were less optimistic and less supportive in finding
solutions to environmental problems than the boys. Students who have lower
socioeconomic status tend to be a more supportive to environmental development
and science solutions than other students.
2.7 Science Achievement and Logical Thinking Ability
Students’ logical thinking ability can also be an affecting factor in science
achievement. The Test of Logical Thinking (TOLT) can be used to determine and
control students’ logical thinking abilities on the students’ science achievement
and science attitude at the beginning of the treatment (Çakır, 2002; Sönmez,
2002). Sönmez (2002) carried out a research based on explorations of the
refutational text supported with discussion webs in overcoming difficulties with
electric current concepts of sixth grade students in her study. She reported that the
refutational texts increased the students’ understanding of electric current. She
also indicated that the students’ logical thinking abilities contributed to students’
science achievement.

47
CHAPTER 3
PROBLEMS AND HYPOTHESES
3.1 The Main Problem and Sub-problems
3.1.1 The Main Problem
The main problem of this study:
What are the effects of conceptual change texts oriented instruction
accompanied by demonstrations within small groups and gender on ninth grade
students’ achievement and levels of understanding of ecology, attitudes towards
biology, and attitudes towards environment?
3.1.2 The Sub-problems
In this study the following 13 sub-problems have been stated:
1. Is there any significant effect of the treatment (conceptual change
approach versus traditional approach) on the population means of the
collective dependent variables of ecological concepts post-test scores,
biology attitude post-test scores, and environmental attitude post-test
scores when the effects of students’ average grades of two biology
midterm exams, test of logical thinking scores, ecological concepts
48
pre-test scores, biology attitude pre-test scores, and environmental
attitude pre-test scores are controlled?
2. Is there any significant effect of gender (males and females) on the
population means of the collective dependent variables of ecological
concepts post-test scores, biology attitude post-test scores, and
environmental attitude post-test scores when the effects of students’
average grades of two biology midterm exams, test of logical thinking
scores, ecological concepts pre-test scores, biology attitude pre-test
scores, and environmental attitude pre-test scores are controlled?
3. Is there any significant effect of the interaction between the treatment
(conceptual change approach versus traditional approach) and gender
(males and females) on the population means of the collective
dependent variables of ecological concepts post-test scores, biology
attitude post-test scores, and environmental attitude post-test scores
when the effects of students’ average grades of two biology midterm
exams, test of logical thinking scores, ecological concepts pre-test
scores, biology attitude pre-test scores, and environmental attitude pre-
test scores are controlled?
4. Is there any significant effect of the treatment (conceptual change
approach versus traditional approach) on the population means of the
ecological concepts post-test scores when the effects of students’
average grades of two biology midterm exams, test of logical thinking

49
scores, ecological concepts pre-test scores, biology attitude pre-test
scores, and environmental attitude pre-test scores are controlled?
5. Is there any significant effect of gender (males and females) on the
population means of the ecological concepts post-test scores when the
effects of students’ average grades of two biology midterm exams, test
of logical thinking scores, ecological concepts pre-test scores, biology
attitude pre-test scores, and environmental attitude pre-test scores are
controlled?
6. Is there any significant effect of the treatment (conceptual change
approach versus traditional approach) on the population means of the
biology attitude post-test scores when the effects of students’ average
grades of two biology midterm exams, test of logical thinking scores,
ecological concepts pre-test scores, biology attitude pre-test scores,
and environmental attitude pre-test scores are controlled?
7. Is there any significant effect of gender (males and females) on the
population means of the biology attitude post-test scores when the
effects of students’ average grades of two biology midterm exams, test
of logical thinking scores, ecological concepts pre-test scores, biology
attitude pre-test scores, and environmental attitude pre-test scores are
controlled?
8. Is there any significant effect of the treatment (conceptual change
approach versus traditional approach) on the population means of the
environmental attitude post-test scores when the effects of students’

50
average grades of two biology midterm exams, test of logical thinking
scores, ecological concepts pre-test scores, biology attitude pre-test
scores, and environmental attitude pre-test scores are controlled?
9. Is there any significant effect of gender (males and females) on the
population means of the environmental attitude post-test scores when
the effects of students’ average grades of two biology midterm exams,
test of logical thinking scores, ecological concepts pre-test scores,
biology attitude pre-test scores, and environmental attitude pre-test
scores are controlled?
10. Is there any significant effect of the interaction between the treatment
(conceptual change approach versus traditional approach) and gender
(males and females) on the population means of the ecological
concepts post-test scores when the effects of students’ average grades
of two biology midterm exams, test of logical thinking scores,
ecological concepts pre-test scores, biology attitude pre-test scores,
and environmental attitude pre-test scores are controlled?
11. Is there any significant effect of interaction between the treatment
(conceptual change approach versus traditional approach) and gender
(males and females) on the population means of the biology attitude
post-test scores when the effects of students’ average grades of two
biology midterm exams, test of logical thinking scores, ecological
concepts pre-test scores, biology attitude pre-test scores, and
environmental attitude pre-test scores are controlled?

51
12. Is there any significant effect of interaction between the treatment
(conceptual change approach versus traditional approach) and gender
(males and females) on the population means of the environmental
attitude post-test scores when the effects of students’ average grades of
two biology midterm exams, test of logical thinking scores, ecological
concepts pre-test scores, biology attitude pre-test scores, and
environmental attitude pre-test scores are controlled?
13. What types of responses emerged from students’ alternative ideas that
reflect the students’ levels of understanding of ecological concepts
before and after the treatment?
3.2 Hypotheses
The following 12 hypotheses have been stated above to test first 12 sub-
problems. All hypotheses were written as null hypotheses.
3.2.1 Null Hypothesis 1
There is no significant effect of the treatment (conceptual change approach
versus traditional approach) on the population means of the collective dependent
variables of ecological concepts post-test scores, biology attitude post-test scores,
and environmental attitude post-test scores when the effects of students’ average
grades of two biology midterm exams, test of logical thinking scores, ecological
concepts pre-test scores, biology attitude pre-test scores, and environmental
attitude pre-test scores are controlled.

52
3.2.2 Null Hypothesis 2
There is no significant effect of gender (males and females) on the
population means of the collective dependent variables of ecological concepts
post-test scores, biology attitude post-test scores, and environmental attitude post-
test scores when the effects of students’ average grades of two biology midterm
exams, test of logical thinking scores, ecological concepts pre-test scores, biology
attitude pre-test scores, and environmental attitude pre-test scores are controlled.
3.2.3 Null Hypothesis 3
There is no significant effect of the interaction between the treatment
(conceptual change approach versus traditional approach) and gender (males and
females) on the population means of the collective dependent variables of
ecological concepts post-test scores, biology attitude post-test scores, and
environmental attitude post-test scores when the effects of students’ average
grades of two biology midterm exams, test of logical thinking scores, ecological
concepts pre-test scores, biology attitude pre-test scores, and environmental
attitude pre-test scores are controlled.
3.2.4 Null Hypothesis 4
There is no significant effect of the treatment (conceptual change approach
versus traditional approach) on the population means of the ecological concepts
post-test scores when the effects of students’ average grades of two biology
midterm exams, test of logical thinking scores, ecological concepts pre-test

53
scores, biology attitude pre-test scores, and environmental attitude pre-test scores
are controlled.
3.2.5 Null Hypothesis 5
There is no significant effect of gender (males and females) on the
population means of the ecological concepts post-test scores when the effects of
students’ average grades of two biology midterm exams, test of logical thinking
scores, ecological concepts pre-test scores, biology attitude pre-test scores, and
environmental attitude pre-test scores are controlled.
3.2.6 Null Hypothesis 6
There is no significant effect of the treatment (conceptual change approach
versus traditional approach) on the population means of the biology attitude post-
test scores when the effects of students’ average grades of two biology midterm
exams, test of logical thinking scores, ecological concepts pre-test scores, biology
attitude pre-test scores, and environmental attitude pre-test scores are controlled.
3.2.7 Null Hypothesis 7
There is no significant effect of gender (males and females) on the
population means of the biology attitude post-test scores when the effects of
students’ average grades of two biology midterm exams, test of logical thinking
scores, ecological concepts pre-test scores, biology attitude pre-test scores, and
environmental attitude pre-test scores are controlled.

54
3.2.8 Null Hypothesis 8
There is no significant effect of the treatment (conceptual change approach
versus traditional approach) on the population means of the environmental attitude
post-test scores when the effects of students’ average grades of two biology
midterm exams, test of logical thinking scores, ecological concepts pre-test
scores, biology attitude pre-test scores, and environmental attitude pre-test scores
are controlled.
3.2.9 Null Hypothesis 9
There is no significant effect of gender (males and females) on the
population means of the environmental attitude post-test scores when the effects
of students’ average grades of two biology midterm exams, test of logical thinking
scores, ecological concepts pre-test scores, biology attitude pre-test scores, and
environmental attitude pre-test scores are controlled.
3.2.10 Null Hypothesis 10
There is no significant effect of the interaction between the treatment
(conceptual change approach versus traditional approach) and gender (males and
females) on the population means of the ecological concepts post-test scores when
the effects of students’ average grades of two biology midterm exams, test of
logical thinking scores, ecological concepts pre-test scores, biology attitude pre-
test scores, and environmental attitude pre-test scores are controlled.

55
3.2.11 Null Hypothesis 11
There is no significant effect of the interaction between the treatment
(conceptual change approach versus traditional approach) and gender (males and
females) on the population means of the biology attitude post-test scores when the
effects of students’ average grades of two biology midterm exams, test of logical
thinking scores, ecological concepts pre-test scores, biology attitude pre-test
scores, and environmental attitude pre-test scores are controlled.
3.2.12 Null Hypothesis 12
There is no significant effect of the interaction between the treatment
(conceptual change approach versus traditional approach) and gender (males and
females) on the population means of the environmental attitude post-test scores
when the effects of students’ average grades of two biology midterm exams, test
of logical thinking scores, ecological concepts pre-test scores, biology attitude
pre-test scores, and environmental attitude pre-test scores are controlled.

56
CHAPTER 4
METHODS
This chapter presents the following parts: population and sample,
description of variables, development of measuring tools, conceptual change texts,
treatment, methods for data analyses, power analysis, assumptions of the study,
and limitations of the study.
4.1 Population and Sample
The target population of the study is all ninth grade high school students
enrolled in a biology course in Turkey. The accessible population contains all
ninth grade students at one public high school in Balıkesir, Turkey. The results of
the study would be generalized to the accessible population and the target
population.
This study was a quasi-experimental study. The sample was chosen from
the classes at the public high school by a convenience sampling. The subjects of
this study included 82 ninth grade students from four classes of two teachers in
the Spring Semester of 2001-2002. There were 26 female students and 56 male
students. Students’ ages ranged from 15 to 16. Each teacher had two classes: one
experimental class and one control class. Two teaching methods were randomly

57
assigned to one class of each teacher. The experimental group was taught using
conceptual change text oriented instruction accompanied by demonstrations
within small group work while the control group was taught using traditional
methods. There were 37 students in the control group and 45 students in the
experimental group. Both teachers allowed the researcher to observe the
experimental and the control groups during the treatment.
Prior to the treatment, pilot Test of Ecological Concepts and pilot
interviews were conducted. The sample of the TEC was chosen according to
stratified and convenience sampling. The pilot TEC was administered to 165 ninth
grade students from eight high schools in the Spring Semester of 2000-2001.
After the pilot test, convenience sampling was used to conduct the pilot
interviews with the teachers and the students. In order to maximize the variability
of the data, three students were selected from eight high schools according to
students’ average grades of two biology midterm exams; one from high achievers,
one from medium achievers, and low achievers) and pilot TEC achievement.
While five teachers who instructed the ecology unit at five high schools were
interviewed, 24 students were interviewed from eight high schools.
4.2 Variables
This current study included ten variables. Three of them were dependent
variables (DVs) and seven of them were independent variables (Ivs). The three
independent variables were determined as covariates. Characteristics of the
variables have been shown in Table 4.1.

58
Table 4.1. Characteristics of the Variables
TYPE OF
VARIABLE
NAME TYPE OF
VALUE
TYPE OF
SCALE
DV post-TEC Continuous Interval
DV post-ASB Continuous Interval
DV post-ASE Continuous Interval
IV pre-TEC Continuous Interval
IV pre-ASB Continuous Interval
IV pre-ASE Continuous Interval
IV SAB Continuous Interval
IV TOLT Continuous Interval
IV TRE Discrete Nominal
IV Gender Discrete Nominal
4.2.1 Dependent Variables
In this study, three variables were dependent variables: students’
ecological concepts post-test scores (post-TEC), students’ biology attitude post-
test scores (post-ASB), and students’ environmental attitude post-test scores (post-
ASE). Post-TEC and post-ASB were measured by the Test of Ecological
Concepts (TEC) and the Attitude Scale towards Biology (ASB), respectively.
Post-ASE was also measured by the Attitude Scale towards Environment (ASE).

59
Students’ scores on those test ranged as follows: possible range was 0-51; for
post-TEC; 0-75 for post-ASB, and 0-110 for post-ASE, respectively.
4.2.2 Independent Variables
In this study, there were seven independent variables: students’ ecological
concepts pre-test scores (pre-TEC), students’ biology attitude pre-test scores (pre-
ASB), students’ environmental attitude pre-test scores (pre-ASE), students’ test of
logical thinking scores (TOLT), students’ average grades of two biology midterm
exams (SAB), treatment (conceptual change approach oriented instruction over
traditional approach based instruction), and gender. pre-TEC, pre-ASB, pre-ASE,
TOLT, and SAB were considered as continuous variables and they were measured
on interval scale. Students’ SAB scores were coded as 0-5. Treatment and gender
were considered as discrete variables and these were measured on nominal scale.
Treatment was named as 0 for the control group and 1 for the experimental group.
Students’ gender was coded as 1 for female and 2 for male students.
4.3 Measuring Tools
Data was collected by six means. These were the Test of Ecological
Concepts (TEC), the Attitude Scale towards Biology (ATB), the Attitude Scale
towards Environment (ATE), and the Test of Logical Thinking (TOLT). While
group interviews were conducted with the students in the experimental group,
semi-structured interviews were conducted with the teachers. Non-systematic
classroom observations carried out in the experimental and the control groups by
the researcher.

60
4.3.1 The Classroom Observations
The researcher observed the treatment process in the experimental and the
control groups and took notes as much as possible. The main purpose of the
observation was to determine how the conceptual change text based instruction
and traditional instruction in four groups were presented. The second purpose was
to determine the interactions between the teacher and students in four classes. The
teaching and learning environment was observed during the lessons with a
naturalistic approach (non-systematic approach).
4.3.2 The Interview Scales
4.3.2.1 Pilot Interviews
In this study, pilot semi-structured interview technique was used to gather
information about the ninth grade students’ and biology teachers’ ideas as well as
misconceptions about the ecological concepts. After administering the pilot test to
students, pilot interview scales for the teachers and the students were developed
and implemented.
The pilot teacher interview sessions were performed with five teachers at
five high schools in Balıkesir in the Spring Semester of 1999-2000. Three types of
teacher interview schedules were used. In the first type, the main aim was to
obtain teachers’ opinions about the biology course and their students’ opinions
about biology course in general, particularly the ecology lessons. In the second
type, teachers’ opinions about their students’ commonly held misconceptions of
ecological concepts determined from the pilot test were asked. In the third type,
teachers were asked about their own teaching styles in the ecology lessons.
61
Three students from eight high schools (total 24) in Balıkesir in the Spring
Semester of 1999-2000 were selected for the pilot interviews. These three students
were chosen according to the students’ average grades of two biology midterm
exams; one from high achievers, one from medium achievers, and low achievers).
Two types of student interview schedules were used. In the first, the main aim was
to get students’ ideas about biology courses in general and ecology lessons in
particular. In the second, the main aim was to get students’ opinions about
commonly held misconceptions related to ecological concepts obtained from the
results’ of the pilot TEC. During the pilot interview sessions, notes were taken
and a tape recorder was used as much as possible.
4.3.2.2 Core Interviews
After the treatment and administering the post-tests to the all students
participated in this study, two teachers and many students in the experimental
group were interviewed. Semi-structured interview technique for teacher
interviews was used to get some more evidences regarding the treatment. Two
teachers responded with their opinions about the students’ common
misconceptions and effectiveness of the conceptual change text oriented
instruction in their classes. The researcher developed semi-structured interview
questions for the teachers. Follow-up questions naturally emerged during the
interview, with the participants. Each interview session took nearly one hour.
Notes were taken and a tape recorder was used.
A group interviewing technique was used with the students in the
experimental group in two classes. These group interviews were interactive and
62
were not in a structured form. The researcher conducted group interviews with
students by posing appropriate questions to keep the focus. The focus was to get
the students’ opinion about the effectiveness of the conceptual change text
oriented instruction in their classes. Each interview session took nearly 45 minutes
and notes were taken.
4.3.3 The Test of Ecological Concepts
4.3.3.1 Pilot Test of Ecological Concepts
In this study, pilot Test of Ecological Concepts (Appendix B) developed
by the researcher was used. The aim of the pilot TEC was to identify
misconceptions and students’ levels of understanding of ecology, and to measure
students’ ecology achievement before and after the treatment. The content of
ecology unit covered biotic and abiotic factors of environment, producer,
consumer and decomposer relationships in matter and energy flow, symbiotic
relationships, food chain and food web, cycles of materials, population,
community, ecosystem, environmental pollution, environmental conservation, and
erosion.
During the development of the pilot TEC, the researcher examined the
ninth grade biology curriculum proposed by the Turkish Ministry of Education
and its instructional objectives related to ecology unit at first (See Appendix A).
To make a list of ecological concepts, the ninth grade biology curriculum and the
ninth grade biology textbook approved by the Turkish Ministry of Education
(Börü et al., 2000) were also examined. The questions in the TEC developed by
Çetin (1998) at eighth grade were revised and some questions were added during

63
the development of the questions in the TEC. Other sources used to write the
questions were: varieties of secondary science textbooks, ninth grade biology
textbooks, university ecology textbooks, questions asked in the University
Entrance Exam and related literature about ecology. Initially, the TEC had 25
questions. The TEC was piloted to 165 ninth grade students at eight high schools
in Balıkesir in the Spring Semester of 1999-2000.
4.3.3.2 Core Test of Ecological Concepts
After the piloting of the TEC, the format and items in the test were
examined by the science teachers and a group of experts in science education to
check whether the items were appropriate for the purpose of the study. Then, the
TEC was administered as pre-test and post-test to the ninth grade students in the
experimental and the control groups in this study.
The TEC consisted of ten multiple-choice questions requiring explanations
and seven open-ended questions. The final version of the TEC was provided in
Appendix B. Multiple-choice questions were scored between 0 and 3. If the
student responded to the multiple-choice part correctly and provided an
explanation with sound understanding, then the score “3” was given to the student
for that item. If the student responded the multiple-choice part correctly and
provided an explanation with partial understanding, then the score “2” was given.
When the student made a correct choice in the multiple-choice part and provided
no explanation for that item, the score “1” was coded. The score “1” was also
used if the student made a correct choice in the first part and provided an
explanation that showed partial understanding which includes misunderstanding.

64
If the student responded to the multiple-choice part correctly and provided an
explanation with misunderstanding, then the score “0” was given. When the
student responded to the multiple-choice part wrongly, the score “0” was given
without accounting for the response provided in the second part. If the student
gave no response to both parts for the item asked, then the score “0” was used.
Open-ended questions were coded between 0 and 3. If the students gave
full explanations with sound understanding for the open-ended questions, the
score “3” was used. If the student responded the open-ended questions with partial
understanding, then the score “2” was given. The score “1” was used if the student
provided an explanation that showed partial understanding which includes
misunderstanding. If the student provided an explanation with misunderstanding,
then the score “0” was given. If the student gave no response to open-ended
questions, the score “0” was also used.
As a result, students’ TEC scores ranged from 0 to 51. Time duration of
the TEC was approximately one hour. The internal reliabilities were calculated as
.51 for the pre-TEC and .69 for the post-TEC.
4.3.4 The Attitude Scale towards Biology
In this study, the Attitude Scale towards Biology (ASB) was used to
determine students’ attitude towards biology (Appendix C). Geban et al. (1994)
developed the Attitude Scale towards Science. It was adapted to biology by Binzat
and its reliability was found as .93 (Binzat, 2000).

65
The ASB has 15 items with a 5-point likert type scale: strongly agree,
agree, neutral, disagree, and strongly disagree. It covered both positive and
negative statements. When scoring the negative statements, they were translated
to the scores of positive statements. Total possible ASB scores could range from
15-75. While higher scores showed positive attitudes towards biology, lower
scores showed negative attitudes towards biology. The ASB took approximately
10-15 minutes to complete for students. The ASB was administered as pre-test
and post-test to all subjects in this study. In this current study, reliability was
found as .91 for the pre-ASB and .90 for post-ASB.
4.3.5 The Attitude Scale towards Environment
In this study, the Attitude Scale towards Environment (ASE) was used to
determine students’ attitude towards environment (Appendix D). The ASE was
developed by Özkan and its reliability was found as .79 (Özkan, 2001).
The ASE has 22 items with a 5-point likert type scale: strongly agree,
agree, neutral, disagree, and strongly disagree. It included both positive and
negative statements. When scoring negative statements, they were translated to
scores of positive statements. The ASE was scored from 5 to 1. Total possible
ASE scores could range from 22-110, with higher scores showing positive
attitudes towards environment, and lower scores showing negative attitudes
towards environment. For the students spent approximately 10-15 minutes to
complete the ASE. The ASE time completion by students was approximately 10-
15 minutes. It was administered as pre-test and post-test to all subjects in this
66
study. The internal reliabilities were calculated as .80 for the pre-ASE and .83 for
the post-ASE.
4.3.6 The Test of Logical Thinking
The Test of Logical Thinking (TOLT) was developed by Tobin and Capie
(1981). This test was translated and adapted into Turkish by Geban, A�kar, and
Özkan (1992). The TOLT was administered to all students to determine and
control their reasoning abilities before the treatment. The TOLT contains 10 items
with 5 sub-scales: identifying and controlling variables, proportional,
correlational, probabilistic, and combinational reasoning (See Appendix E). Its
reliability was found as .81.
4.4 Conceptual Change Texts
While the CCTI was used in the experimental group, the TI was used in
the control group. The conceptual change texts and worksheets were used in the
CCTI. Moreover, some demonstrations were performed by the teacher and
teacher-guided discussions were conducted.
The main aim of designing conceptual change texts prepared by the
researcher was to help students to overcome their misconceptions about ecological
concepts, to gain experience in grasping the ecological concepts, and improve
students’ understanding of ecology at ninth grade. Four conceptual change texts
were designed on living organisms and their environment, nutrient cycles, and
environment pollution (Appendix G). Some worksheets related to the conceptual
change texts were also designed as supporting instructional materials to the

67
conceptual change texts. In the development of the conceptual change texts,
Posner’s (1982) four conditions for a conceptual change to occur were taken into
consideration: intelligibility, plausibility, fruitfulness, and dissatisfaction. A
sequence of each conceptual change text prepared for this study as follows:
Each conceptual change text started with a question firstly. Then, it
continued with some misconceptions about the current ecological concepts. It was
expected that students were dissatisfied with their existing conceptions by giving
some misconceptions on specific ecology concepts. Later, it went on by directing
students to start the discussion. Finally, some scientific explanations and
corrections of the misconceptions were presented in the conceptual change text.
In discussion sessions, some worksheets were administered to the students
separately from the conceptual change texts and the teacher made demonstrations
with specific phenomenon teacher such as; showing some posters, some dead
plant and animals, some models and watching slide projector, and so on. After
performing some demonstrations, students were asked to discussed the questions
in the worksheets among small groups. These questions were related to the
demonstrations. Questions in the worksheets and information in the conceptual
change text were discussed among small group work. Finally, the teacher
performed a whole class discussion after small group work.
In short, it was expected that the CCTI would activate students’
misconceptions by presenting examples and questions, present descriptive
evidence in text about these misconceptions were incorrect, and provide a

68
scientifically correct explanation of the situation. Thus, the students would accept
the new concepts instead of the old ones.
4.5 Treatment
In this study, the high school was chosen according to convenience
sampling. This study used a quasi-experimental design since there was no
possibility of assigning the students to classes randomly. A total of 88 students
from four biology classes were involved in the study. Class size was 20-25 for
each class. In this study, there were two teachers and four classes. Two classes
were called the control group and other two classes were called the experimental
group. The research design of the current study is presented in Table 4.2.
Table 4.2. Research Design of the Study
Group Before Treatment Treatment After Treatment
EG TEC, ASB, ASE,
TOLT
CCTI TEC, ASB, ASE
CG TEC, ASB, ASE,
TOLT
TI TEC, ASB, ASE
In Table 4.2, while CG represents the control group, EG represents the
experimental group. Traditional instruction (TI) was given to the control group,
and conceptual change text oriented instruction accompanied by demonstrations
among small groups (CCTI) was given to the experimental group. While the
control group took TI that involved direct lecturing and questioning, the
experimental group took conceptual change text oriented instruction accompanied

69
by demonstrations among small groups. The CG used a textbook, the EG used
conceptual change texts including worksheets.
TEC is the Test of Ecological Concepts, ASB is the Attitude Scale towards
Biology, ASE is the Attitude Scale towards Environment, and TOLT abbreviates
the Test of Logical Thinking. To investigate the effect of the treatment on
students’ understanding levels of ecology, attitudes towards biology and attitudes
towards environment, the TEC, ASB, and ASE were administered to all subjects
as pre- and post-tests. Moreover, the TOLT was given to all subjects only before
the treatment.
Treatment duration was five weeks. Each classroom instruction was two
45-minute sessions per week. Before the treatment, the teachers were informed
what the conceptual change text was and how the conceptual change text oriented
instruction accompanied by demonstrations could be used among small groups.
While the control group took ecology lessons in their class, the experimental
group took ecology lessons in the biology laboratory. Before the first ecology
lesson, the sitting plan of the student groups in the laboratory was arranged by one
of the teachers and the researcher. In the beginning of the treatment, students were
divided into four or five groups according to their average mean of biology two
middle exams and the class teachers’ opinions. Thus, students would work
together in small groups and they would discuss the topics given in the
worksheets.
At the beginning of the treatment all students in four classes were given
the pre-TEC, pre-ASB, pre-ASE, and TOLT as pre-tests. Then, the treatment

70
started. The experimental group was administered the conceptual change texts
including worksheets. Three conceptual change texts were designed: living
organisms and their environment, nutrient cycles, and environmental pollution.
The first conceptual change text was distributed to the experimental group 2-3
days before of the treatment. Later, the students in the experimental group were
informed about the new instruction, the nature of the conceptual change texts and
the small group discussions, what was expected from them during the courses,
how they could use the conceptual change texts, and the worksheets for discussing
the ecology topics. Students were asked to read the text before the class hour and
bring them to the class. It was crucial because they could see what the common
misconceptions were, and to think whether they had any misconception or not,
and to see the correct scientific explanations about the ecological concepts. Thus,
it was assumed that they could be more active in the small group discussions.
Worksheets were given to the students in the discussion period, and
students were expected to write the discussion results on the worksheets.
Discussions could provide interaction among students; and teacher and students.
Discussions were the important part of the conceptual change text based
instruction. They were designed as the teacher-guided discussions. For example,
when the food chain and food web text was taught, students discussed food web
topic with some questions written in the worksheet given. Then, teacher made a
demonstration about decomposers such as fungus under the microscope and then
students would discuss about fungus. Afterwards, the teacher showed and
explained an energy pyramid model showed some pictures and explained relating

71
food chains to students by slide projector. In an other lesson: cycles of matter, the
posters of carbon, water, oxygen, carbon dioxide, phosphorus, nitrogen cycles
were shown and explained by the teacher. Later, the teacher initiated a discussion
on questions in the worksheet and students tried to answer all questions in the first
activity altogether. Then, the teacher asked to answer each question from one of
the student in each small group.
After the demonstrations, students would answer the questions in the
worksheets by discussing the questions in small groups. When answering the
questions in the worksheets, students used the conceptual change texts and their
textbooks though rarely. After following the sequence in the conceptual change
text, students were expected to respond the same question which had been asked
at the beginning in the conceptual change text comparing with their previous
answers. Worksheets were distributed to the students during the course and
discussions were made on them. Students’ misconceptions by contrasting their
preconceptions with specific phenomenon through questions in discussion
environment. During the discussion sessions, sometimes teacher explained the
abstract concepts or made corrections about some common mistakes.
After completion of the instruction of ecology unit in the control and the
experimental groups, both groups were administered the post-TEC, post-ASB, and
post-ASE.
4.6 Data Analysis
The data analysis consisted of six parts. In section one, the data analysis of
classroom observation in the control and the experimental groups were performed.

72
In section two, the data analysis of interview with the teacher and the students
were performed. In section three, missing data analysis was done before the
statistical analysis of data. The statistical data analysis was calculated and
presented in section four. The statistical data analysis included descriptive and
inferential statistics data analyses. In section five, the data of the TEC were
identified and categorized according to the students’ levels of understanding of
ecology. Finally, in section six, power analysis of the study was performed.
4.6.1 Analysis of the Classroom Observation Data
To validate the data gathered from the study, the researcher conducted
non-systematic classroom observations during the ecology lessons in the control
and the experimental groups. During the observations, the researcher took some
notes concerning the applications of teaching methods in both groups. In order to
analyze the data related to the classroom observations in the control and the
experimental groups, one observation question was determined, and analyses of
the classroom observations were performed the researcher’s notes based on the
question.
4.6.2 Analysis of the Interview Data
To support the data gathered through the study, the researcher examined
the data of semi-structured interviews with two teachers and the data of group
interviews with the students in the experimental group. Semi-structured interviews
had some open-ended questions and the group interviews had an unstructured
form with no preset questions. As regards group interviews, the researcher asked

73
some spontaneous questions related to the conceptual change approach used in the
experimental classes to all students. In both interviews, some notes were taken.
Apart from that, tape recorder was used for interviewing one of the teachers.
Interview tapes and interview notes were useful for analyzing the data of both
interviews. In order to analyze the data of both interviews, some interview
questions were determined, and interview analyses were performed the responses
of teachers and the students based on these questions.
4.6.3 Missing Data Analysis
Before analyzing the data of the TEC, data list was composed and then
analyzed in the SPSS program. A data list involved students’ gender, SAB, pre-
TEC scores, post-TEC scores, pre-ASB scores, post-ASB scores, pre-ASE scores,
post-ASE scores, TOLT scores, and TRE. While columns presented variables and
rows presented student numbers in the study.
At the beginning of the study, there were 88 students in four classes at the
high school. The pre-tests were administered to all students in four classes. While
the experimental group was taught according to the CCTI, the control group was
taught according to the TI. At the end of the treatment, the post-tests were
administered to all subjects in four classes.
Before the descriptive and the inferential statistics, the missing data
analysis was performed. There were missing students (6 of 88) for the post-tests:
one of the six students left the school and five of them were absent on the date of
post-tests. Therefore, data which belonged to six students were excluded from the
study completely. In short, whole data was accepted as 82 any more in the study

74
and analyses were performed on them. Four out of 82 students were not present
on the date when the pre-tests were held. There were four missing data related to
the independent variables of students’ ecology concepts pre-test scores (pre-TEC),
students’ attitude towards biology test scores (pre-ASB), students’ environmental
attitude scale scores (pre-EASE), and students’ test of logical thinking scores
(TOLT). The percentage of missing data of pre-tests in this study was 4.8 % as
shown in Table 4.3. Since it was less than 5 % of the whole data , the missing data
were directly replaced with the series mean of the entire subjects (SMEAN)
according to Cohen and Cohen (1983).
There were some missing items in all tests because some students did not
answer some items in the tests, probably they might not have known the answer or
unwilling to answer these questions. The missing questions in the pre-TEC and
post-TEC were accepted as ‘No answer’ and coded as 0. On the other hand, the
missing items in the pre-ASB, pre-ASE, post-ASB, post-ASE, and TOLT were
directly replaced with the series mean of the entire subjects (SMEAN). In short,
the missing data were directly replaced with the series mean of the entire subjects
(SMEAN) according to Cohen and Cohen (1983) because 4.8 % was less than 5
% of the whole data.

75
Table 4.3. Missing Pre-tests Data Versus Variables
Resultant
Variable
Missing Values
Replaced
Valid Case Missing
Percentage
Creating
Functions
pre-TEC 4 82 4.87 SMEAN
(pre-TEC)
pre-ASB 1 82 1.21 SMEAN
(pre-ASB)
pre-ASE 1 82 1.21 SMEAN
(pre-ASE)
TOLT 2 82 2.43 SMEAN
(TOLT)
4.6.4 Analysis of Descriptive and Inferential Data Statistics
Each student was assigned with an identification number before the
analyses of the test results. For the data related to the control and the experimental
groups, the descriptive statistics, that is, mean, standard deviation, skewness,
kurtosis, range, maximum, minimum values, and histograms were performed
using the statistical program for social science (SPSS) in this study.
The inferential statistical computations were also performed in the SPSS. In
order to test the null hypotheses of the study, the multivariate analysis of
covariance (MANCOVA) model was used because there were three dependent
variables in this study (Fraenkel and Wallen, 1996). Table 4.4 shows all variables
and variable set entry order that were used in the MANCOVA.

76
Table 4.4 MANCOVA Variable Set Composition and Statistical Model Entry
Order
Variable Set Entry Order Variable Name
A
(covariates)
1st X1=SAB
X2=TOLT
X3=pre-TEC
X4=pre-ASB
X5=pre-ASE
B
(group memberships)
2nd X6=TRE
X7=Gender
C
A*B
(covariates*group
interactions)
(A*B)*A
(covariates*group
memberships
interactions)*covariates
3rd X8=X1*X6
X9=X2*X6
X10=X3*X6
X11=X4*X6
X12=X5*X6
X13=X1*X7
X14=X2*X7
X15=X3*X7
X16=X4*X7
X17=X5*X7
X18=(X6*X7)*X1
X19=(X6*X7)*X2
X20=(X6*X7)*X3
X21=(X6*X7)*X4
X22=(X6*X7)*X5

77
Firstly, Set A (covariates) was entered into the MANCOVA model. Then,
Set B and Set C were entered into the model respectively. In the model, the
significant values of A*B (covariates*group memberships interactions) and
(A*B)*A [(covariates*group memberships interactions)*covariates] should be
non-significant in order to have valid values (p>.05). The significant values of
A*B and (A*B)*A showed non-significant values for the MANCOVA model.
Sets of A*B and (A*B)*A was removed from the model. Thus, inferential
statistics in MANCOVA was performed with covariates and independent
variables of the study.
4.6.5 Analysis of Students’ Levels of Understanding of Ecology
The TEC had two parts: the multiple-choice part required with reasoning
and an open-ended part. Students’ responses for each item in the TEC were also
analyzed according to the students’ levels of understanding of ecological
concepts. Students’ responses for the reasoning of the multiple-choice and the
open-ended questions might contain one or more than one group of ideas linked
together. As a guide, acceptable scientific explanations were written for each
question by the experts and the researcher. Extended lists of ideas in response to
each question were set as much as possible in mutually exclusive categories.
Thus, the coding schemes were developed and the students’ ideas were coded.
Students’ responses were classified under six categories: sound
understanding, partial understanding, partial understanding which includes
misunderstanding, misunderstanding, no understanding, and no response. Similar
classifications for similar aims were used in other studies (Simpson and Marek,

78
1988; Westbrook and Marek, 1991; Keng, 1997; Çetin, 1998). Tables were
formed the summary of students’ understanding and frequencies of response
categories for the questions. It should be emphasized that a students’ responses for
each question might fall into one or more than one category.
Categories of the students’ responses can be indicated as follows:
A. Sound understanding: If the students’ responses include the
scientifically acceptable explanations about the questions, they are
considered having sound understanding.
B. Partial understanding: If the students’ responses are partly correct and
do not include the full range of the scientifically acceptable explanations
about the questions, they will be considered having partial understanding.
C. Partial understanding which includes misunderstanding: If the
students’ responses are partly correct and do not include the full range of
the scientifically acceptable explanations about the questions with some
misunderstanding, they will be considered having partial understanding
which includes misunderstanding.
D. Misunderstanding: If the students’ responses do not include acceptable
explanations, it implies that the students have some misinterpretations or
misjudgments about the questions. Some responses of the students will be
grouped as misunderstandings if they are clearly different from the
scientific view.

79
E. No understanding: If the students cannot make proper explanation(s)
from the scientific point of view or restate questions for the multiple-
choice questions and the open-ended questions, they will be considered to
have no understanding at all. In short, this broad category will contain
these responses:
- Rewrite responses: Responses that restate the questions.
- Non-sense or irrelevant responses: Responses cannot be coded
meaningfully.
F. No response: Cases where the space was left empty or with the
response, “I don’t know”.
4.7 Assumptions of the Study
In the study, the researcher has assumed the followings:
1. Students were expected to have some conceptions, which differ from
acceptable scientific views on ecology.
2. The TEC, ASB, ASE, and the TOLT were administered under standard
conditions.
3. The classroom observations were performed under standard
conditions.
4. Interviews the with teachers and the students were conducted under
standard conditions.

80
5. There were no interaction between the students in the control and the
experimental groups. Students did not share the questions of the TEC,
ASB, and ASE before and during the application of the instruments.
6. Level of the questions in the tests is appropriate for the ninth grade
students. Therefore, each student was considered having the same
capacity to answer the questions in measuring instruments because
they were all ninth grade students. However, a student’s ability to
answer the questions successfully depended upon the student’s
previous knowledge, skills, and experience (Germann and Aram,
1996).
7. All students answered the questions of measuring instruments (the
questions of the tests and the questions of the interviews) seriously and
sincerely.
8. Both teachers answered the interview questions seriously and
sincerely.
9. Both teachers followed the researcher’s instructions and were not
biased during the treatment.
10. While both teachers only used the conceptual change approach in the
experimental group and the traditional approach in the control group to
teach ecology.
11. There were no interaction between the students in the experimental and
the control groups during the treatment.

81
4.8 Limitations of the Study
In this study, the following limitations were taken into consideration:
1. The subject of the study was limited to 82 ninth grade students at a
public high school in Balıkesir during the Spring Semester of 2001-
2002.
2. This study was limited to the “Ecology: World and Environment
Media” unit at ninth grade biology. It is also limited to the objectives
of ecology lessons and the ecological concepts found in the Turkish
ninth grade curriculum proposed by the Ministry of Education.
3. As sample was not selected randomly and sample size is small,
generalizations of the results of this quasi-experimental study was
limited. However, same conclusions could be arrived at samples that
will show same conditions with this study.

82
CHAPTER 5
RESULTS
In this chapter, the results of the study were presented in six sections. In
the section one, the results of classroom observations for the control group and the
experimental groups were demonstrated. In section two, the results of interview
with teachers and students in the experimental group were presented. In section
three, the results of the descriptive statistics related to the students’ Test of
Ecological Concepts, Attitude Scale towards Biology, and Attitude Scale towards
Environment as pre- and post-tests scores were given. Section four presented the
results related to the inferential statistics of testing 12 null hypotheses. In section
five, the results of students’ levels of understanding of ecology were explained. A
brief summary of the findings of the study was given in section six.
5.1 The Classroom Observations
In this study, the experimental and the control groups were observed to
reveal “how the treatment was implemented in the experimental and the control
groups”.
The treatment was conducted in four classes at a public high school in
Balıkesir. The researcher observed ten hours for the experimental and the control

83
classrooms during the treatment. The researcher sat silently at the corner of each
classroom and took some notes during the observations.
Both teachers completed all ecology topics in ten class hours over five
weeks and they had similar teaching styles in the experimental and the control
groups. While the traditional approach was conducted in the control classrooms,
the conceptual change approach was performed in the experimental classrooms.
The teachers used direct lecturing, questioning methods, and gave examples from
everyday life in the control group. However, the teachers used conceptual change
texts and performed some demonstrations like showing posters, plants, and dead
animals in small groups in the experimental group. Since the teachers and the
students experienced small group work and discussion for the first time, both the
teachers and the students had some difficulties during the ecology lessons in the
experimental classrooms. The teachers had more management problems such as
noise and lack of interest in their classrooms, when the students were discussing
the ecology topics than the control classrooms. In order to avoid these problems,
the teachers sometimes warned them to keep quite and the students warned each
other about the noise. In addition, some of the students did not like their group-
mates and they preferred not to interact with each other when completing their
worksheets.
The teachers and the students in the experimental group found the texts
and the discussion activities too long. Therefore, the students lost their motivation
towards the end of these activities. In general, it was observed that most students
came to classes without reading the given text, although each text was given to

84
them in advance. On the other hand, the students seemed to enjoy these activities,
but on the other hand, they seemed to be bored with these activities because of the
length of the texts and activities. In addition to this, students showed interest in
the teaching materials employed in the classrooms even in the breaks. The teacher
guided and monitored small group discussions (See Appendix H). It was observed
that the teachers made more efforts in the experimental classrooms when
compared to the control classrooms.
Base on the observation results, it could be assumed that both teachers
conducted the ecology lessons by using the conceptual change text oriented
instruction accompanied by demonstrations in small groups in the experimental
group, and they followed the textbook by using direct lecturing, questioning
methods, and giving examples from everyday life in the control group as it was
planned.
The students in the experimental group were more noisy but more active
than the students in the control group. As a result of observations, it can be
concluded that the CCTI was a more effective learning method in the
experimental classes than the TI in the control classes.

85
5.2 The Interviews
Interview sessions were conducted with two teachers and several students
(group interviewing) in the experimental group. In the following parts, the results
of them were given.
5.2.1 Interviews with the Teachers
In this study, two teachers were interviewed individually to reveal the
reasons behind the students’ misconceptions, and to take teachers’ opinions about
the conceptual change instruction after the treatment. The examples of excerpts
from the interviews conducted with two teachers are presented below:
Q1. What are the reasons behind the students’ misconceptions considering
the items in the Test of Ecological Concepts?
Interviewer: Do you think your students answered the questions in the Test
of Ecological Concepts properly?
Teacher 1: My students would respond to them properly, but if they cannot
respond to the questions, the reasons might be lack of their knowledge about the
concepts related to the question or inappropriate teaching of the subject.
Teacher 2: My students could answer the questions but I believe that some
misconceptions would appear. Also the students might give wrong explanations
even though they answered correctly to the multiple-choice test items.
Interviewer: What do you think about how the students’ misconceptions on
ecology occurred?

86
Teacher 1: Students’ misconceptions could occur because of students’
expectations about their future aims and graduation plans. Their only aim is to
graduate from high school, therefore, they do not take science courses seriously.
Teacher 2: Students could have misconceptions because some students are
not interested in the subject. There are several reasons for that:
- In the national curriculum, teaching of the ecology subject is planned
to be covered at the end of the semester. Therefore the students lost
their interest at the end of the term.
- Students are affected by the predetermined misconceptions given in the
texts [conceptual change texts] during the lessons.
- Being at the ninth grade, the students have not decided their tracks yet.
So, some students in class do not have interest in Science and
Mathematics.
Teacher 1 was confident about her teaching and she thought that her
students would be successful in the TEC, but if the students could not the answer
them, it could be caused by the students’ attitudes towards science or the teaching
style of the teacher. On the other hand, Teacher 2 believed that her students would
answer the questions, but some misconceptions would appear. Teacher 1 stressed
that students’ misconceptions could be originated by their expectations about the
school and about their future plans. Teacher 2 indicated that it was caused by the
time of the teaching and students’ lack of interest in the lessons, and the
predetermined misconceptions given in the conceptual change texts. Also, this

87
teacher reported that students have not decided on their tracks yet as they were
ninth grade students.
Q2. What are the opinions of the teachers about the instruction used in the
experimental group?
Interviewer: What do you think about teaching ecology with this new
method (conceptual change text oriented instruction accompanied by
demonstrations in small groups)?
Teacher 1: It was a difficult and different method for me. Students were
not accustomed to this instruction and it made me tired. The students did not
want to read the textbook and were not willing to read the texts [conceptual
change texts], then, misconceptions given in the texts [conceptual change texts]
might not be useful. It would be better to give the truths in the texts [conceptual
change texts], teach the topics, and give the worksheets.
Teacher 2: Biology course at the ninth grade is a two hour per week
course. To conduct this instruction has lasted more than two hours per week. In
this system, it is hard to apply this method because students focus on the
university entrance examination and want to get higher grades rather than learn
ecology. Students are not used to such methods so, there are some difficulties in
applying such methods. If all the biology topics were taught using this method, it
would be easier to follow the lessons for the students. In this method, the class
size should be kept small for the group work and class management.
Interviewer: Which parts of the new method did you like most and which
parts of the new method did you dislike most?

88
Teacher 1: I liked worksheets at most. I could apply small group work in
teaching. In the future on some occasions I want to design worksheets in
accordance with small group work, but preparing materials is time consuming.
We do not have diagrams, and posters in our school. However, I can ask students
to prepare diagrams and posters, then, we can produce our materials
[demonstration materials].
Teacher 2: At the beginning of the text [conceptual change text], it is not
good to give the students some misconceptions related to ecology. Attention span
of the students are generally 20 minutes, this can even last a shorter time for some
students. Students may learn misconceptions as if they are correct and they could
miss the following parts. In addition, the answers of the questions should not be
given in the provided texts. Students should note the answers after investigating
them. However, it is nice to give the students some texts to get them ready for the
classes and they may arouse their interest towards ecology topics.
Interviewer: What were the main problems that occurred when conducting
the new instruction?
Teacher 1: Student came to the class without reading the texts [conceptual
change texts]. The instruction was held on at the end of the semester. Students
took all examinations until then, and they knew whether they passed or failed from
the biology course. The experimental group was unwilling to participate in the
new instruction, students have just brought the conceptual change texts to the
class, and they utilized from the textbook less. While we use questioning method in
the control group, the discussion method was used in the experimental group. This

89
instruction is time consuming. The instruction time should be 3 hours per week
and one of these hours should be allocated for either small group work or
laboratory experiments.
Although the class size was ideal compared to other high schools [25
students in a class], it was hard to manage and control the class in this method
since some students prefer to think aloud, and the students in the groups did not
listen to each other enough. In my opinion, this method is effective for high
achievers because:
- the topics were not understood well,
- the groups did not listen to each other [in the whole class discussion],
- there were noisy students,
- most students did not read the predetermined conceptual change texts,
- students were bored of the long texts [conceptual change texts],
- the level of students were low and they had lack of interest in the
lessons,
- students’ prior knowledge was low according to their pre-test results
[their TEC results],
- there was lack of communication among the group students,
- they were unwilling to be involved in group work.
Teacher 2: The problems were:

90
- time was not sufficient,
- the ecology topics were instructed at the end of the semester,
- the teachers and the students encountered this method for the first
time,
- texts were too long. They could have less explanations and they should
attract students attention more,
- students were not ready for group work and discussion environment,
- students were coming to class unprepared.
Interviewer: How should the conceptual change texts be designed for your
instruction?
Teacher 1: This method was not interesting enough for the students.
Worksheets should contain color pictures [instead of black and white]. Water
cycle should be itemized instead of full paragraph texts. I itemize everything and
draw figures.
Teacher 2: Texts were uninteresting for the students and they can be
shortened. It is good to give the prepared texts in the previous lesson to the
students.
Interviewer: Were the texts sufficiently informative?
Teacher 1: Yes, they were.
Teacher 2: Yes, there was enough information, but it would be better to
present more interesting information, puzzles, and more pictorial explanations.

91
Interviewer: Were the materials used for the demonstrations enough?
Teacher 1: It was good and enough. It was helpful for students’ learning.
Materials [Demonstration materials] attracted students’ attention. The more the
material there are the better it is. Also if needed, some materials could be hanged
on the wall beforehand.
Teacher 2: The teaching materials [demonstration materials] used in this
method were interesting for the students, and these materials made students to be
interested in the subject. When the students found the materials interesting, they
asked some questions related to them even in the breaks and I believe that
students gained some knowledge with the given responses. In this method, visual
tools attract students’ attention a lot when they were used in the experimental
classes.
The teachers did not like to give misconceptions at the beginning of the
texts. They believed that students would be confused and they were afraid of not
being able to change these misconceptions. They suggested that it is better not to
give misconceptions at all. They liked the visual tools used in the experimental
classes. However, they found the conceptual change texts were too long, and they
stressed that they should be shortened and enriched with pictures and puzzles etc.
Both teachers had some difficulties to teach ecology with this method because it
was a new experience for them and their students. Students were noisy and class
management was rather difficult during the discussions in small groups.

92
5.2.2 Interviews with the Students
In this study, the students were interviewed to take their opinions about the
conceptual change oriented instruction after the treatment. The interviews were
conducted as group interviews regarding an interview question. The question was:
“What are the opinions of the students about the instruction used in the
experimental group?” Students’ responses to the question in these interview
sessions were not presented individually, and they were summarized briefly as
follows:
Interviewer: What do you think about learning the ecology with the new
method?
The students found this method interesting. They felt free to talk and
discuss the ecology topics with their classmates during the discussions in small
groups. Expressing what they thought as a group was not something they
experienced before. Seeing an energy pyramid model and other demonstration
materials in their classrooms made them think about the ecology concepts. Several
students expressed that they wished the other classes also had used this method.
Interviewer: Which parts of the new method did you like and dislike?
Some students mentioned that they liked group work. However, few
students stated that they did not like this method at all and they stressed that they
preferred the lecture method. Most students also complained about the length of
the conceptual change texts and the time needed to complete the activities in the
worksheets. Although they liked the activities in the worksheets, they said that the

93
number of activities in the worksheets was too much and they were getting bored.
They expressed that they also found the worksheets long. Additionally, most
students mentioned that they like to response the questions in the worksheets
during the whole class discussion. Otherwise, only some certain students
responded to teachers’ questions asked in other biology lessons during the lecture
teaching.
Interviewer: What problems you have experienced in learning ecology
with this method?
Most students indicated that there was too much noise during the activities
in the worksheets and then, it was hard to concentrate on the topic. In general,
students liked this new method. Although the majority of students liked the
demonstration materials and activities in the worksheets, it was hard to focus on
the long conceptual change texts and the long activities in the worksheets for
them.
5.3 Descriptive Statistics
Descriptive statistics related to the students’ ecology concepts pre-test
scores, ecology concepts post-test scores, biology attitudes pre-test scores, biology
attitudes post-test scores, environmental attitudes pre-test scores, environmental
attitudes post-test scores, and test of logical thinking in the control and the
experimental groups were performed. The results were shown in Table 5.1.


95
Students’ test of ecological concepts scores range from 0 to 51. The higher
scores mean the greater success in ecology. In Table 5.1, the mean of the pre-TEC
is 13.59 and the post-TEC is 22.02 in the experimental group. On the other hand,
the mean of the pre-TEC is 15.06 and the post-TEC is 19.51 in the control group.
In that case, the experimental group showed a mean score increase of 8.43 and the
control group performed a mean score increase of 4.45 on the TEC. It can be seen
that the mean score increase in the experimental group was higher than in the
control group. The experimental group’ students have achieved higher ecology
success than the control group’ students.
Students’ attitudes scale towards biology scores range from 0 to 75.
Greater scores mean more positive attitudes towards to biology. As seen in Table
5.1, the mean of the Biology Attitude Pre-test is 56.54 and the Biology Attitude
Post-test is 57.21 in the experimental group. There could be seen that there is a
slight mean score increase (0.67) regarding experimental group’ students attitudes
towards biology. The mean of the Biology Attitude Pre-test is 58.40 and the
Biology Attitude Post-test is 58.50 in the control group. There is a slight increase
in mean scores (0.10) in control group’ attitude towards biology.
Students’ attitudes scale towards environment scores range from 0 to 110
with higher scores mean more positive attitudes towards environment. As seen in
the Table 5.1, the mean of the Environmental Attitude Pre-test is 89.66 and the
Environmental Attitude Post-test is 90.42 in the experimental group with a change
of mean scores of 0.76. In the control group, the mean of the Environmental
Attitude Pre-test is 85.58 and the Environmental Attitude Post-test is 88.51 with a
change of mean scores of 2.93.

96
Students’ test of logical thinking scores range from 0 to 10 and higher
scores represent better logical thinking. As shown in Table 5.1, the mean of TOLT
is .7 in the experimental and the control groups.
The Table 5.1 also shows some other basic descriptive statistics like range,
minimum, maximum, standard deviation, skewness, and kurtosis values. The
skewness of the pre-TEC was -.22 and the post-TEC was -.61 in the experimental
group. The skewness of the pre-TEC was -.58 and the post-TEC was -.13 in the
control group. The skewness of the pre-ASB was -.57 and changed to -.49 in the
experimental group. The value of pre-ASB was –1.17 and changed to -.29 in
control group. On the other hand, in the experimental group, the value of the pre-
ASE was –1.74 and changed to -.51. For control group, the value of skewness of
the pre-ASE was -.81 and changed to -.35. The kurtosis values are also displayed
in Table 5.1. The skewness and kurtosis values in this study can be accepted as
approximately normal.
Three histograms with normal curves related to the post-TEC, post-ASB,
and post-ASE in the experimental and control groups are given in Figure 5.1,
Figure 5.2, and Figure 5.3.These are also evidence for the normal distribution of
these six variables.

97
35,030,025,020,015,010,05,0
Control Group
Ecology Concepts Post-test Score
Fre
qu
en
cy 14
12
10
8
6
4
2
0
Std. Dev = 6,34
Mean = 19,5
N = 37,00 32,5
30,0
27,5
25,0
22,5
20,0
17,5
15,0
12,5
10,0
7,5
Experimental Group
Ecology Concepts Post-test Score
Fre
qu
en
cy 16
14
12
10
8
6
4
2
0
Std. Dev = 5,19
Mean = 22,0
N = 45,00
Figure 5.1. Histograms with Normal Curves Related to the post-TEC in the
Experimental and the Control Groups
75,070,065,060,055,050,045,040,035,030,0
Control Group
Biology Attitude Post-test Score
Fre
quency 16
14
12
10
8
6
4
2
0
Std. Dev = 10,00
Mean = 57,2
N = 45,00
75,070,065,060,055,050,045,040,0
Experimental Group
Biology Attitude Post-test Score
Fre
qu
en
cy 8
6
4
2
0
Std. Dev = 10,31
Mean = 58,5
N = 37,00
Figure 5.2. Histograms with Normal Curves Related to the post-ASB in the
Experimental and the Control Groups

98
110,0
105,0
100,0
95,0
90,0
85,0
80,0
75,0
70,0
65,0
60,0
55,0
Control Group
Environmental Attitude Post-test Score
Fre
quency 12
10
8
6
4
2
0
Std. Dev = 10,9
Mean = 90,4
N = 45,00
105,0
100,0
95,0
90,0
85,0
80,0
75,0
70,0
65,0
Experimental Group
Environmental Attitude Post-test Score
Fre
quency 8
6
4
2
0
Std. Dev = 10,60
Mean = 88,5
N = 37,00
Figure 5.3. Histograms with Normal Curves Related to the post-ASE in the
Experimental and the Control Groups
Figure 5.1 shows that the students’ post-TEC mean score in the control
group was 19.5, while the students’ post-TEC mean score in the experimental
group was 22.0. As it is seen from this histogram, students’ post-TEC mean scores
were higher, in favor of the experimental group. Students’ post-ASB mean score
in the control group was 57.2, while the students’ post-ASB mean score in the
experimental group is 58.2. As seen in the Figure 5.2, students’ post-ASB mean
scores were nearly similar in the control and experimental groups. Students’ post-
ASE mean score in the control group was 90.4, while the students’ post-ASE
mean score in the experimental group was 88.5. The Figure 5.3 shows that
students’ post-ASE mean scores were higher, in favor of the control group.

99
5.4 Inferential Statistics
This part included the following sections: determination of the covariates,
assumptions of the Multivariate Analysis of Covariance (MANCOVA), the
statistical model of MANCOVA, the analyses of the hypotheses, and the follow-
up analysis.
5.4.1 Determination of Covariates
There were three dependent variables; the post-ecological concepts test,
post-attitude scale towards biology, and post-attitude scale towards environment
scores in this study. In order to statistically equalize the differences between the
experimental and the control groups, five variables of the study; the students’
average grades of two biology midterm exams, test of logical thinking ability, pre-
ecological concepts test, pre-attitude towards biology, and pre-attitude towards
environment scores were pre-determined as potential covariates.
In order to designate a variable as a covariate, that variable should
demonstrate a significant correlation with at least one of the dependent variables.
Table 5.2 presents the results of these correlations and their levels of significance.
As seen from Table 5.2, the values of correlation coefficients of five pre-
determined variables showed significant correlations with at least one of the
dependent variables of the post-TEC, post-ASB, and post-ASE. The students’
SAB, TOLT, pre-TEC, pre-ASB, and pre-ASE were assumed as covariates for
analyzing data in the MANCOVA.

100
Table 5.2 Significance Test of Correlations between the Dependent and
Independent Variables
Variables post-TEC post-ASB post-ASE
SAB .628* .418* .271*
TOLT .128 .189 .230*
pre-TEC .413* .125 .113
pre-ASB .335* .676* .465*
pre-ASE .286* .521* .596*
*Correlation is significant at the .05 level (2-tailed).
Moreover, these covariates should also show no significant correlation
among them. Table 5.3 displays correlations among covariates. This table shows
that the correlations among covariates were not higher than .80. It can be said that
there was no multicollinearity among those covariates. Hence, SAB, TOLT, pre-
TEC, pre-ASB, and pre-ASE were determined as covariates in this study.
Table 5.3 Significance Test of Correlations among Covariates
Variables SAB TOLT pre-TEC pre-ASB pre-ASE
SAB .076 .349 .328 .207
TOLT -.006 .091 .149
pre-TEC .062 .065
pre-ASB .507
pre-ASE

101
5.4.2 Assumptions of Multivariate Analysis of Covariance (MANCOVA)
Before starting data analyses in the MANCOVA, all the variables were
tested for five assumptions of MANCOVA; normality, homogeneity of
regression, equality of variances, multicollinearity, and independency of
observations.
For the normality assumption, skewness and kurtosis values calculated
using descriptive statistics. The skewness and kurtosis values of post-TEC, post-
ASB, and post-ASE were given in the Table 5.1. The skewness and kurtosis
values of TEC and ASB, and ASE were approximetely in an acceptable range for
a normal distribution.
Homogeneity of regression assumption means that the slope of regression
of a dependent variable on covariates must be constant over different values of
group membership. Table 5.4 indicates the results of Multiple Regression
Correlation (MRC) for homogeneity of regression.
For the MRC analysis, fifteen new interaction terms were also formed.
They were obtained by multiplying group memberships with the covariates
separately. In other words, these interaction terms were prepared by multiplying
the group memberships (treatment and gender) with covariates of SAB, TOLT,
pre-TEC, pre-ASB, and pre-ASE. In this table, Block A included covariates,
Block B included group memberships, and Block C contained interaction terms.
The MRC analysis was run in order to test the significance of R2
change for three
dependent variables of the post-TEC, post-ASB, and post-ASE using enter
method. In Table 5.4, the contribution of Block C was not found significant for

102
post-TEC (F(15, 59) = 1.840, p= .052). Also, the contribution of Block C was not
found significant for post-ASB (F(15, 59)=.568, p=.888). Similarly, for post-ASE,
the contribution of Block C is not also significant (F(15, 59)=1.034, p=.435).
As a result, no significant interaction between the covariates and group
memberships for dependent variables in Block Cs was found. In other words,
homogeneity of regression was validated for the MANCOVA model.
Table 5.4 Results of the Multiple Regression Analysis of Homogeneity of
Regression
Model Change Statistics
post-TEC R Square
Change
F Change df1 df2 Sig.
F Change
Block A .474 13.722 5 76 .000
Block B .063 5.011 2 74 .009
Block C .148 1.840 15 59 .052
post-ASB
Block A .548 18.457 5 76 .000
Block B .006 .488 2 74 .616
Block C .056 .568 15 59 .888
post-ASE
Block A .422 11.081 5 76 .000
Block B .005 .331 2 74 .719
Block C .119 1.034 15 59 .435

103
Table 5.5 displays the Box’s Test of Equality of Covariance Matrices. In
this table, it was clearly seen that the observed covariance matrices of the
dependent variables were equal across groups since p=.507 >.05.
Table 5.5 Box’s Test of Equality of Covariance Matrices
Box’s M 19,163
F .958
Df1 18
Df2 3523
Sig. .507
Table 5.6 shows the Levene’s Test of Equality of Error Variances. The
error variances of the selected dependent variables across groups were equal in
Table 5.6. The significant levels of post-TEC, post-ASB, and post-ASE were
.205, .205, and .559, respectively. Since these p values were higher than .05, the
equality of variance assumption was validated for this model.
Table 5.6 Levene’s Test of Equality of Error Variances
F df1 df2 Sig.
Post-TEC 1.563 3 78 .205
post-ASB 1.565 3 78 .205
post-ASE .693 3 78 .559

104
Additionally, there were significant correlations among covariates (SAB,
pre-TEC, pre-ASB, and pre-ASE), but the correlation values were smaller than
.80. Hence, the assumption of multicollinearity was also provided according to
Table 5.3.
Lastly, the assumption of independency of observations was provided for
this model. This assumption was met with the observations of the control and
experimental groups by the researcher. According to the findings of the
observations, all students completed their tests themselves.
5.4.3 Multivariate Analysis of Covariance (MANCOVA) Model
According to the results of the validation of the MANCOVA assumptions,
it was determined that post-TEC, post-ASB, and post-ASE are dependent
variables. TRE and Gender are independent variables of the study. The SAB,
TOLT, pre-TEC, pre-ASB, and pre-ASE are covariates of the study. Table 5.7
displays the results of MANCOVA. As Table 5.7 indicates, TRE explained 15 %
variance of model for the collective dependent variables of post-TEC, post-ASB,
and post-ASE. From the table, it can be also seen that covariates of the SAB, pre-
TEC, and pre-ASB, and pre-ASE showed significant effect on the dependent
variables of the post-TEC, post-ASB, and post-ASE. However, the TOLT did not
show any significant effect on the dependent variables. While the treatment had
significant effect on the model, gender did not show any significant effect on
dependent variables. TRE*GENDER (interaction between the treatment and
gender) also did not show any significant effect on the model.

105
Table 5.7 Multivariate Analysis of Covariance Test Results#
Effect Value FHypothesis
df
Error
df
P
Sig.
Eta
Squared
Observed
Power
Intercept .833 4.756 3 71 .004 .167 .884
SAB .702 10.034 3 71 .000 .298 .997
TOLT .954 1.132 3 71 .342 .046 .293
pre-TEC .876 3.340 3 71 .024 .124 .736
pre-ASB .750 7.892 3 71 .000 .250 .987
pre-ASE .803 5.793 3 71 .001 .197 .941
TRE .864 3.716 3 71 .015 .136 .785
GENDER .979 .517 3 71 .672 .021 .151
TRE*
GENDER.980 .494 3 71 .688 .020 .145
#All values in the MANCOVA above were given according to Wilks’ Lambda.
5.4.4 Results of Null Hypotheses Testing
In this study, 12 null hypotheses mentioned in the Chapter 3 were
analyzed by the MANCOVA and 12 hypotheses were tested at a significance level
of .05.
5.4.4.1 Null Hypothesis 1
The first hypothesis was; “there was no significant effect of the treatment
(conceptual change approach versus traditional approach) on the population
means of the collective dependent variables of ecological concepts post-test
scores, biology attitude post-test scores, and environmental attitude post-test

106
scores when the effects of students’ average grades of two biology midterm
exams, test of logical thinking scores, ecological concepts pre-test scores, biology
attitude pre-test scores, and environmental attitude pre-test scores were
controlled”.
The MANCOVA was conducted to determine the effect of the treatment
on the collective dependent variables of the post-TEC, post-ASB, and post-ASE.
As Table 5.7 indicates, the first null hypothesis was rejected (λ=.864, p=.015).
Significant differences were found between the conceptual change text oriented
instruction and the traditional instruction on the collective dependent variables of
the post-TEC, post-ASB, and post-ASE.
In order to test the effect of the treatment on each dependent variable, an
analysis of covariance (ANCOVA) was performed as follow-up tests to the
MANCOVA. Table 5.8 presents the results of the ANCOVA.


110
5.4.4.2 Null Hypothesis 2
The second hypothesis was; “there was no significant effect of gender
(males and females) on the population means of the collective dependent variables
of ecological concepts post-test scores, biology attitude post-test scores, and
environmental attitude post-test scores when the effects of students’ average
grades of two biology midterm exams, test of logical thinking scores, ecological
concepts pre-test scores, biology attitude pre-test scores, and environmental
attitude pre-test scores were controlled”.
The MANCOVA was conducted to determine the effect of gender on the
collective dependent variables of the post-TEC, post-ASB, and post-ASE. As
Table 5.7 indicates, the second null hypothesis was not rejected (λ=.979, p=.672).
Significant differences were not found between males and females on the
collective dependent variables of the post-TEC, post-ASB, and post-ASE.
5.4.4.3 Null Hypothesis 3
The third hypothesis was; “there was no significant effect of interaction
between the treatment (conceptual change approach versus traditional approach)
and gender (males and females) on the population means of the collective
dependent variables of ecological concepts post-test scores, biology attitude post-
test scores, and environmental attitude post-test scores when the effects of
students’ average grades of two biology midterm exams, test of logical thinking
scores, ecological concepts pre-test scores, biology attitude pre-test scores, and
environmental attitude pre-test scores were controlled”.

111
The MANCOVA was conducted to determine the effect of interaction
between the treatment and gender on the collective dependent variables of the
post-TEC, post-ASB, and post-ASE. According to Table 5.7, the third null
hypothesis was not rejected (λ=.980, p=.688), there was no significant effect of
interaction between the treatment and gender on the collective dependent
variables of the post-TEC, post-ASB, and post-ASE.
5.4.4.4 Null Hypothesis 4
The fourth hypothesis was; “there was no significant effect of the
treatment (conceptual change approach versus traditional approach) on the
population means of the ecological concepts post-test scores when the effects of
students’ average grades of two biology midterm exams, test of logical thinking
scores, ecological concepts pre-test scores, biology attitude pre-test scores, and
environmental attitude pre-test scores were controlled”.
As it can be seen from Table 5.8, the fourth null hypothesis was rejected
(F(1, 73)=10.912, p=.001). That is; the conceptual change text oriented instruction
was more effective in improving students’ post-TEC scores than the traditional
instruction. Students were taught using the conceptual change oriented instruction
had higher ecology achievement scores than the students were taught using the
traditional instruction.
5.4.4.5 Null Hypothesis 5
The fifth hypothesis was; “there was no significant effect of gender (males
and females) on the population means of the ecological concepts post-test scores
when the effects of students’ average grades of two biology midterm exams, test

112
of logical thinking scores, ecological concepts pre-test scores, biology attitude
pre-test scores, and environmental attitude pre-test scores were controlled”.
According to Table 5.8, the fifth null hypothesis was not rejected (F(1,
73)=.206, p=.651). That is; there was no significant difference in the means of the
post-TEC between males and females when the effects of the covariates have been
controlled. Gender difference was not effective in improving students’ post-TEC
scores.
5.4.4.6 Null Hypothesis 6
The sixth hypothesis was; “there was no significant effect of the treatment
(conceptual change approach versus traditional approach) on the population
means of the biology attitude post-test scores when the effects of students’
average grades of two biology midterm exams, test of logical thinking scores,
ecological concepts pre-test scores, biology attitude pre-test scores, and
environmental attitude pre-test scores were controlled”.
As seen in Table 5.8, the sixth null hypothesis is not rejected (F(1,
73)=.169, p=.682). This statistics did not provide support for this null hypothesis.
That is; there is no significant difference in the means of the post-ASB between
the experimental and control groups when the effects of the covariates have been
controlled. The conceptual change oriented instruction was not effective in
increasing positive attitude towards biology more than the traditional instruction.
5.4.4.7 Null Hypothesis 7
The seventh hypothesis was; “there was no significant effect of gender
(males and females) on the population means of the biology attitude post-test

113
scores when the effects of students’ average grades of two biology midterm
exams, test of logical thinking scores, ecological concepts pre-test scores, biology
attitude pre-test scores, and environmental attitude pre-test scores were
controlled”.
As seen in Table 5.8, the seventh null hypothesis is not rejected (F(1,
73=.451, p=.504). That is; there is no significant difference in the means of the
post-ASB between males and females when the effects of the covariates have
been controlled. Gender difference was not effective in increasing positive
attitudes towards biology.
5.4.4.8 Null Hypothesis 8
The eighth hypothesis was; “there was no significant effect of the
treatment (conceptual change approach versus traditional approach) on the
population means of the environmental attitude post-test scores when the effects
of students’ average grades of two biology midterm exams, test of logical thinking
scores, ecological concepts pre-test scores, biology attitude pre-test scores, and
environmental attitude pre-test scores were controlled”.
As seen in Table 5.8, the eighth null hypothesis was not rejected
(F(1,73)=.080, p=.778). That is, the conceptual change approach was not effective
in improving positive attitude towards environment more than the traditional
approach.
5.4.4.9 Null Hypothesis 9
The ninth hypothesis was; “there was no significant effect of gender
(males and females) on the population means of the environmental attitude post-

114
test scores when the effects of students’ average grades of two biology midterm
exams, test of logical thinking scores, ecological concepts pre-test scores, biology
attitude pre-test scores, and environmental attitude pre-test scores were
controlled”.
According to Table 5.8, the ninth null hypothesis was not rejected
(F(1,73)=.388, p=.535). This statistics did not provide support for this null
hypothesis. Therefore, gender difference was not effective in increasing positive
attitude towards environment.
5.4.4.10 Null Hypothesis 10
The tenth hypothesis was; “there was no significant effect of interaction
between the treatment (conceptual change approach versus traditional approach)
and gender (males and females) on the population means of the ecological
concepts post-test scores when the effects of students’ average grades of two
biology midterm exams, test of logical thinking scores, ecological concepts pre-
test scores, biology attitude pre-test scores, and environmental attitude pre-test
scores were controlled”.
As it can be seen from Table 5.8, the tenth null hypothesis was not rejected
(F(1, 73)=1.094, p=.299). The p value was higher than .05. The interaction
between the treatment and gender was not effective in improving students’ post-
TEC. This statistics therefore did not provide support for this null hypothesis and
the tenth null hypothesis was not rejected.

115
5.4.4.11 Null Hypothesis 11
The tenth hypothesis was; “there was no significant effect of interaction
between the treatment (conceptual change approach versus traditional approach)
and gender (males and females) on the population means of the biology attitude
post-test scores when the effects of students’ average grades of two biology
midterm exams, test of logical thinking scores, ecological concepts pre-test
scores, biology attitude pre-test scores, and environmental attitude pre-test scores
were controlled”.
The MANCOVA was conducted to determine whether there was no
significant difference of interaction between the treatment and gender on the
population means of the post-ASB. As it can be seen from Table 5.8, the eleventh
null hypothesis was not rejected (F(1, 73)= .566, p=.454). The p value was higher
than .05. The interaction between the treatment and gender was not effective in
improving students’ post-ASB scores. This statistics therefore did not provide
support for this null hypothesis and the eleventh null hypothesis was not rejected.
5.4.4.12 Null Hypothesis 12
The twelfth hypothesis was; “there was no significant effect of interaction
between the treatment (conceptual change approach versus traditional approach)
and gender (males and females) on the population means of the environmental
attitude post-test scores when the effects of students’ average grades of two
biology midterm exams, test of logical thinking scores, ecological concepts pre-
test scores, biology attitude pre-test scores, and environmental attitude pre-test
scores were controlled”.

116
As it can be seen from Table 5.8, the eleventh null hypothesis was not
rejected (F(1, 73)=.123, p=.727). The p value was higher than .05. Therefore, the
interaction between the treatment and gender was not effective in improving
students’ post-ASE scores.
Furthermore, adjusted means of the control and experimental groups for
dependent variables were obtained in the MANCOVA. Table 5.9 shows adjusted
means of the experimental and the control groups for the dependent variables of
the post-TEC, post-ASB, and post-ASE and independent variables of the TRE.
When the adjusted means were compared with the prior means, it was seen that
controlling the effects of covariates on post-TEC scores results in a change of
mean differences in favor of experimental group.
Table 5.9 Means and Adjusted Means of the Control and the Experimental Groups
Dependent Variable Treatment Mean Adjusted Mean
post-TEC Control Group 19.51 18.73
Experimental Group 22.02 22.35
5.4.5 Students’ Levels of Understanding of Ecological Concepts
The thirteenth research question investigated was:
“What types of responses emerged from students’ alternative ideas that
reflect the students’ levels of understanding of ecological concepts before and
after the treatment?”
To determine students’ levels of understanding of ecological concepts, the
students’ responses were closely examined on each of the 17 questions in the Test

117
of Ecological Concepts as pre- and post-test. The test had two parts: multiple-
choice part with its reasoning, and open-ended part. The content analysis of
students’ emerging ideas from the Test of Ecological Concepts was performed
and coded related to the students’ responses in the reasoning and the open-ended
parts. According to the content analysis of students’ responses in the TEC, the
students had several degrees of understanding of ecological concepts asked in the
TEC. The students’ responses were classified under six categories: five levels of
understanding of ecology and no response categories. Five levels of students’
understanding of ecological concepts were sound understanding, partial
understanding, partial understanding which includes misunderstanding,
misunderstanding, and no understanding. The category of “No understanding”
included two sub-categories: nonsense and rewrite. The category of “No
response” contained the ‘I do not know’ or zero response to the questions in the
TEC. The category of misunderstanding for the multiple-choice questions in the
TEC was divided into two subcategories: misunderstanding despite choice of the
correct response for only multiple-choice questions and misunderstanding despite
choice of the incorrect response for only multiple-choice questions. However,
there were no subcategories for misunderstanding in the open-ended questions.
5.4.5.1 Students’ Levels of Overall Understanding of Ecology
The Figure 5.4 shows the whole results of students’ levels of
understanding in the experimental and the control groups considering the Test of
Ecological Concepts.

118
0
50
100
150
200
250
300
SU PU PUM MU NU NR
PrEGPsEGPrCGPsCG
Figure 5.4 The Whole Picture of Students’ Levels of Understanding of Ecological
Concepts in the Experimental and the Control Groups
The Figure 5.4 shows that students’ sound understanding increased in the
experimental and the control groups after the treatment. There was a noticeable
increase in students’ partial understanding in the experimental and the control
groups after the treatment. There was a slight increase in the experimental group
students’ partial understanding which includes misunderstanding, but a slight
decrease in the control group after the treatment. Students’ misunderstanding
decreased in the experimental and the control groups after the treatment, but this
decrease was more for the students in the experimental group than in the control
group. The students’ no-understanding increased in the experimental and the
control groups after the treatment. The number of non-responding students
decreased in the experimental and the control groups after the treatment.
The questions in the TEC were re-organized according to five key concept
areas of ecology. These key concept areas were; biotic and abiotic factors, food

119
chain, biological organization, cycles of materials, and environmental pollution.
The changes in students’ misunderstanding after the treatment in these key
concept areas have been presented in the Figure 5.5 below.
Misunderstanding
0
5
10
15
20
25
30
35
40
45
50
BioticAbiotic
Food Chain Bio Org Cycles Env Poll
PrEGPsEGPrCGPsCG
Figure 5.5 Students’ Misunderstandings on Five Concept Areas of Ecology in the
Experimental and the Control Groups
The results from the Figure 5.5 shows that there was a decrease in the
students’ level of misunderstanding in the control and the experimental groups
regarding the key concept areas of biotic and abiotic factors, biological
organization, and cycles of materials after the treatment. While there was no
change in the experimental group regarding the key concept area of food chain,

120
there was a slight decrease in the control group after the treatment. However, there
was a slight decrease in the students’ level of misunderstanding in the
experimental groups regarding the key concept areas of environmental pollution,
there was an increase in the control group.
In the following sections, five figures and five tables were prepared to
show the students’ levels of understanding of each key concept area in the TEC in
the experimental and the control groups. Each figure displays the students’
understanding levels related to each key concept area in the experimental and the
control groups. Each table shows the students’ levels of understanding and the
number of their responses to a question representing each key concept area. These
tables display the students’ ideas related to the representing question only when
students gave a correct response. Students’ explanations for the correct response
were further categorized as SU, PU, PUM, NU, and NR for either the multiple-
choice question or the open-ended question. Moreover, when the student made a
correct choice for the multiple-choice question, and the provided explanation was
wrong it has been assumed as misunderstanding (MU). They were classified as
sub-sections of misunderstanding despite the choice of the correct response for
only multiple-choice questions, and again misunderstanding for the choice of the
incorrect response for multiple-choice questions. When the student made an
alternative for the open-ended question, it has been assumed as misunderstanding
if the provided explanation was wrong.
5.4.5.2 Students’ Levels of Understanding of Biotic and Abiotic Factors
Four questions (1, 2, 3 and 4) in the Test of Ecological Concepts were on
the key concept area of biotic and abiotic factors. This key concept area included

121
the key concepts of the biotic abiotic factors and symbiotic relationships. The
Figure 5.6 displays the students’ levels of understanding indicated by their
responses to the key concept area of biotic and abiotic factors.
Biotic Abiotic Factors
0
10
20
30
40
50
60
70
SU PU PUM MU NU NR
PrEGPsEGPrCGPsCG
Figure 5.6 Students’ Levels of Understanding of Biotic and Abiotic Factors in the
Experimental and the Control Groups
The results from the Figure 5.6 shows that there was a slight increase in
the students’ sound understanding in the experimental group while there was a
slight decrease in the control group after the treatment. Students’ partial
understanding increased in the experimental and the control groups after the
treatment. Students’ partial understanding which includes misunderstanding
decreased in the experimental and the control groups after the treatment. This
decrease was more for the control group students. Students’ misunderstanding
decreased in the experimental and the control groups’ students after the treatment,
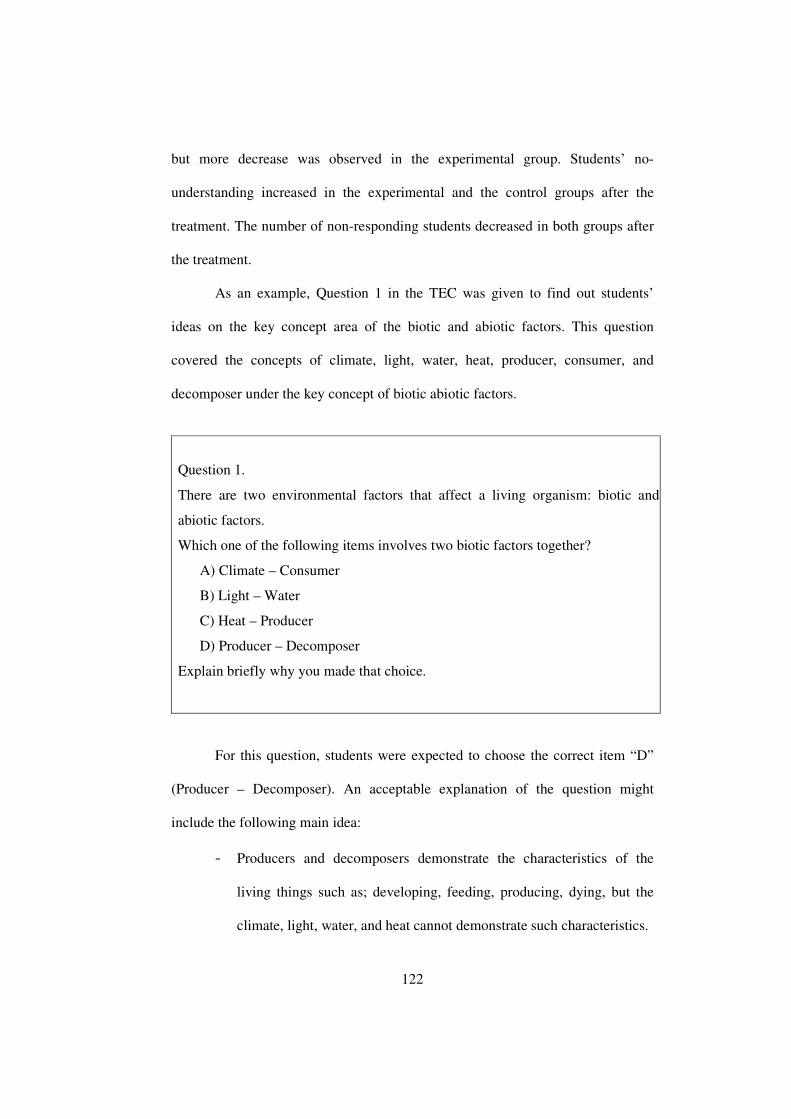
122
but more decrease was observed in the experimental group. Students’ no-
understanding increased in the experimental and the control groups after the
treatment. The number of non-responding students decreased in both groups after
the treatment.
As an example, Question 1 in the TEC was given to find out students’
ideas on the key concept area of the biotic and abiotic factors. This question
covered the concepts of climate, light, water, heat, producer, consumer, and
decomposer under the key concept of biotic abiotic factors.
Question 1.
There are two environmental factors that affect a living organism: biotic and
abiotic factors.
Which one of the following items involves two biotic factors together?
A) Climate – Consumer
B) Light – Water
C) Heat – Producer
D) Producer – Decomposer
Explain briefly why you made that choice.
For this question, students were expected to choose the correct item “D”
(Producer – Decomposer). An acceptable explanation of the question might
include the following main idea:
- Producers and decomposers demonstrate the characteristics of the
living things such as; developing, feeding, producing, dying, but the
climate, light, water, and heat cannot demonstrate such characteristics.

123
Students gave various responses to the question, and those responses were
categorized according to the their levels of understanding as shown in the
following Table 5.10.
Table 5.10 Summary of Students’ Levels of Understanding and their Types of
Responses to “Biotic and Abiotic Factors” in the Experimental and the Control
Groups during the Treatment
Types of ResponseNumber ofResponses
(n=45 for EG,n=37 for CG)
PrEG
PrCG
PsEG
PsCG
Sound Understanding 0 0 1 0They have the characteristics of adapting to the environment: birth,growth, and death, etc.
1
Partial Understanding 3 0 7 4Producers are plants (tree is a producer), however decomposers arebacteria/fungi, and etc.
2 1 3
Producers are the living things producing their own food. Decomposersmix the cell of the dead organisms in the soil.
1
Green plants are producers. Decomposers destroy them. They keep thebalance in nature.
1
Both of them live, show activity/for being able to move. 2Producers are plants or grasses, however decomposers are the livingthings in the soil.
1 1
Both are living things, but the others either they are non-living or one ofthem is living.
1
Producers are the organisms that make their food themselves. They areautotrophic organisms.
1
Partial Understanding Which Includes Misunderstanding 4 4 3 0Producers are living organisms and decomposers are non-livingorganisms.
2
While producers are plants/human/animal/environment, decomposersare bacteria/viruses.
1 2
Producers take food materials directly and decomposers decay them. 1Producers produce food. Decomposer decays bacteria on the deadorganisms.
1
Producers produce and decay. 1Producers produce its own foods. Decomposers are human and, theydecay what they eat.
1
There is a producer for reproduction. Something cannot be decayed byitself; there must be a decomposer organism for decaying it.
1
Living thing produces when it is eaten, whereas decomposer decayswhat it eats.
1

124
Table 5.11 (continued)
Types of ResponseNumber ofResponses
(n=45 for EG,n=37 for CG)
PrEG
PrCG
PsEG
PsCG
Misunderstanding 14 9 4 4
Misunderstanding despite the choice of the correct responsefor the multiple-choice question 3 3 4 2
Both are human and, human is living organism/Human isproducer/consumer/decomposer.
2 3 1
There is a person or a living organism that produces or decomposes. 1Producers always produce. Decomposers determine the types of theproducers.
1
Producers are living organisms because they are the reproduction ofsomebody.
1
Producers are green plants. Decomposers mix dead plants and animalsin soil by decaying them.
1
Other alternatives are non-living or abiotic organisms. 2Misunderstanding for the choice of the incorrect response
for the multiple-choice question 11 6 0 2
No Understanding 10 7 21 9Non-sense 7 5 5 3Rewrite 3 2 16 6
No Response 13 13 7 9
Additionally, students gave alternative responses to the question. They
chose A, B, or C which were all incorrect. Although students’ responses contained
correct idea in corresponding alternatives, they were assumed to be
‘misunderstanding’. For example, some students who chose “A” (Climate-
Consumer) gave several responses such as; “Climate can always change and most
consumers make use of this” and “If the climate is lend itself, fruits and
vegetables grow and people consume them”.
Also, some students who chose “B” (Light-Water) made several
explanations like; “Plants make photosynthesis with light and water”, “Light is

125
needed to see something”, “Light and water are needed for plants to sprout”, “The
whole environment is needed for living things to survive”, “If there is no water
and light, the organisms die”, and “While light is non-living, water is living”.
Furthermore, some students chose “C” (Heat-Producer), and one of their
alternative ideas was “While heat is non-living thing, producer is a living thing”.
5.4.5.3 Students’ Levels of Understanding of Food Chain
Questions 5, 6, and 14 in the Test of Ecological Concepts were on the key
concept area of food chain. Food chain included the key concepts of food chain,
food web, and energy pyramid. The Figure 5.7 displays the students’ levels of
understanding indicated by their responses to the key concept area of food chain.
Food Chain
0102030405060708090
SU PU PUM MU NU NR
PrEGPsEGPrCGPsCG
Figure 5.7 Students’ Levels of Understanding of Food Chain in the Experimental
and the Control Groups

126
The results from the Figure 5.7 shows that students’ sound understanding
and partial understanding increased in the experimental and the control groups
after the treatment. Students’ partial understanding which includes
misunderstanding disappeared in the experimental group, while it showed a slight
increase in the control group after the treatment. There was almost no change in
the students’ misunderstanding in the experimental group after the treatment,
while there was a slight decrease in the control group. The students’ no-
understanding increased in the experimental and the control groups after the
treatment. The number of non-responding students decreased in both groups after
the treatment.
As an example, Question 5 in the TEC was given to show students’ ideas
on the key concept area of food chain. This question is related to the concepts of
producer, primary consumer, secondary consumer, and tertiary consumer under
the key concept of energy pyramid.

127
Question 5. The following figure shows an energy pyramid in an ecosystem.
According to this energy pyramid, which one of the followings is correct?
A) Secondary consumers feed on producers.
B) Tertiary consumers come first in the food chain.
C) Food produced by producers is first taken by tertiary consumers.
D) Tertiary consumers have the least energy among all consumers.
Explain briefly the reason for your choice.
For this question, students were expected to choose the correct item “D”
(Tertiary consumers have the least energy among all consumers) and an
acceptable explanation of the question might include this main idea:
- Availability of energy decreases as one progresses from producers to
consumers.
Students gave various responses to the question, and these responses were
categorized according to the their levels of understanding as shown in the
following Table 5.11.

128
Table 5.11 Summary of Students’ Levels of Understanding and their Types of
Responses to “Energy Pyramid” in the Experimental and the Control Groups
during the Treatment
Types of Response
Number ofResponses
(n=45 for EG,n=37 for CG)
PreEG
PreCG
PstEG
PstCG
Sound Understanding 0 0 2 3The one who has the most energy are producers. Then, primary,secondary and tertiary consumers come.
1
When producers (plants) are making food, energy releases. Thesecondary consumers use whatever left from this energy and energydecreases. This energy reaches to the tertiary consumer at the leastamount.
1
When going to the upper steps, energy decreases, number of individualsdecreases, and the size of the organisms gets bigger.
1
When energy is being used from down to up, some of it spread out tothe environment/Primary consumers feed on producer and they spendsome of the energy that they took as heat. The secondary consumersfeed on the first consumers and spend energy similarly. The tertiaryconsumers take the least energy because they feed on the secondaryconsumers.
2
Partial Understanding 5 6 8 8They spent energy when they kill the secondary consumers. 1 5 2The tertiary consumers get their food from secondary consumers. 1There is a producer. They have more food. Their foods decrease asgoing through the primary, secondary and tertiary consumers in thisenergy pyramid.
1
The tertiary consumers get their foods from other organisms or eatleftovers from the nature or other animals.
2
It is the farthest, very far, from producer/The tertiary consumers are thegroup take the least food made by producers.
1 1
Producers produce food. The primary consumers eat the most, thesecondary consumers eat more and the tertiary consumers eat the least.
2 1 2
Energy pyramid is getting smaller/The figure shows like that/It has thesmallest place to cover/It is at the very low/Tertiary consumers areless/They are at the top of the energy pyramid.
2 2 3
They do not need to produce. 1Partial Understanding Which Includes Misunderstanding 1 0 0 2
The tertiary consumers are the last group that feed on the secondaryconsumers. Lion, leopard, cheetah, and big snakes are found in thisgroup.
1
10 % of the energy is received from the soil and water. 1The consumers that have the most energy are producers. Food chainbegins via producers.
1

129
Table 5.11 (continued)
Types of Response
Number ofResponses
(n=45 for EG,n=37 for CG)
PreEG
PreCG
PstEG
PstCG
Misunderstanding 3 6 0 6Misunderstanding despite the choice of the correct response
for the multiple-choice question 0 1 0 2
The tertiary consumer takes its food from producers. 1The primary and secondary consumers take food from producers as thetertiary consumers get food from consumers.
1
Secondary consumers feed on the tertiary consumers. 1Misunderstanding for the choice of the incorrect response
for the multiple-choice question 3 5 0 4
No Understanding 1 2 6 7Non-sense 2 1Rewrite 1 2 4 6
No Response 31 19 27 9
In addition, students gave alternative responses A and B in the question in
the TEC, and they provided some explanations for their alternatives. Some
students who chose the alternative “A” (Secondary consumers feed on producers)
made several explanations such as; “Producers pass their food on primary
consumers”, “Consumers take the food made by producers”, “Deer eat the green
plants which are producers. Jaguars as secondary consumers eat the deer”, and
“Secondary consumers are the first chain for providing food. It is a chain in which
they both consume and provide food resource”. Furthermore, some students chose
the alternative “B” (Tertiary consumers come first in the food chain) and one of
their ideas for that alternative was: “I see tertiary consumers on the top (and they
are carnivorous)”.

130
5.4.5.4 Students’ Levels of Understanding of Biological Organization
Questions 4, 10, 11 and 12 in the Test of Ecological Concepts were on the
key concept area of biological organization. Biological organization included the
key concepts of species, pollution, community, ecosystem, biosphere, mutualism,
commensalisms, and parasitism. The Figure 5.8 shows the students’ levels of
understanding indicated by their responses to the key concept area of biological
organization.
Biological Organization
0
10
20
30
40
50
60
70
SU PU PUM MU NU NR
PrEGPsEGPrCGPsCG
Figure 5.8 Students’ Levels of Understanding of Biological Organization in the
Experimental and the Control Groups
The results from the Figure 5.8 show that there was an increase in the
students’ level of sound understanding in the experimental and the control groups
after the treatment. There was an apparent increase in the experimental group
students’ partial understanding, but there was an obvious decrease in the control

131
group students’ partial understanding after the treatment. Students’ partial
understanding which includes misunderstanding increased slightly for the
experimental group and small number of partial understanding which includes
misunderstanding in the control group students disappeared after the treatment.
Students’ misunderstanding decreased in the experimental and the control groups
after the treatment. Students’ no-understanding decreased in the experimental and
the control groups after the treatment. There was an obvious decrease in the
number of non-responding students in both groups after the treatment.
Question 4.
Some living organisms always need other organisms in order to survive. While
these organisms feed on other living organisms, actually they harm other
organisms. This symbiotic relationship is an example of;
A) Commensalisms
B) Mutualism
C) Parasitism
D) None
Explain briefly the reasoning behind your choice.
As an example, Question 4 in the TEC was given to display students’ ideas
on the key concept area of biological organization. This question was about
symbiotic relationship. For this question, the correct answer is “C” (Parasitism)
and an acceptable explanation of the question might be:
- Parasite organisms lack an enzyme system for digestion system, they
feed on other organisms to survive, and they give harm to other
organisms.

132
Students gave various responses to this question, and these responses were
categorized according to the their levels of understanding as shown in the
following Table 5.12.
Table 5.12 Summary of Levels of Students’ Understanding and their Types of
Responses to “Symbiotic Relationships” in the Experimental and the Control
Groups during the Treatment
Types of Response
Number ofResponses
(n=45 for EG,n=37 for CG)
PreEG
PreCG
PstEG
PstCG
Sound Understanding 9 14 10 12Two species of the groups living together feed on intestine or outside.This group is called parasitism/parasites. They injure other organismswhen living on them.
8 8 8 9
Parasites take their foods as ready from people and living things, whilethey are living on other organisms/Parasites live on organisms and feedon them and multiply.
1 4 1 1
Parasitic animals are small, they either feed on an animal by sticking orfeeding on belly/head of humans/Parasites like louse and flea causedamage since they live by sucking our blood/Louse lives as parasite onthe skin of animal tissues/Organisms such as louse, flea, and tick taketheir required food from the organism that they live on as ready in orderto survive.
2 2
There are some dangerous bacteria in human body. When these bacteriaare taking their foods, they harm human beings.
1
Partial Understanding 2 0 5 0It is parasite/It lives as parasitic/They are parasitic bacteria. 2 4I remember from pinworm. 1
Partial Understanding Which Includes Misunderstanding 3 3 0 2Parasitism is a consumer animal. 0 3 1Some parasites eat food that is taken by human and cause disease byentering human body. On the other hand, some of them are useful.
1
Parasitic organisms have no digestive enzymes, they injure digestionsystem of the organisms on which they live.
1
Digestion enzymes of parasitic organisms are not well developed. Theyuse the enzymes of host organisms and cause damage to them.
1
Parasites usually live on human and animals, they cause damage tothem and they live by sucking their blood.
1

133
Table 5.12 (continued)
Types of Response
Number ofResponses
(n=45 for EG,n=37 for CG)
PreEG
PreCG
PstEG
PstCG
Misunderstanding 3 2 3 4
Misunderstanding despite choice of the correct response forthe multiple-choice question
0 0 1 2
Organisms help each other in parasitism/They cause damage to eachother.
2
These animals attack another animal and eat it in order to survive. Forexample, they live as parasites e.g. flycatcher.
1
Misunderstanding for the choice of the incorrect responsefor the multiple-choice question
3 2 2 2
No Understanding 2 1 15 11Non-sense 1 1 1 4Rewrite 1 14 7
No Response 23 17 15 5
Moreover, students gave some alternatives to the question and they chose
the alternatives A, B, or D. They provided some explanations for their incorrect
choices. Some examples of the students’ responses for the alternative “A”
(Commensalisms) were: “Commensalisms; to destroy” and “Nature is in balance.
If snakes do not eat mice, mice multiply. Therefore, snakes have to eat mice”. On
the other hand, students who chose the alternative “B” (Mutualism) stated “They
live eating the leftovers of other organisms”. Also, some students chose the
alternative “D” (None), and one of the examples of their reasoning was: “In order
to survive, they kill”.

134
5.4.5.5 Students’ Understanding Levels of Cycles of Materials
Questions 7, 8, and 9 in the Test of Ecological Concepts were on the key
concept area of cycles of materials. The cycles of materials contained the key
concepts of oxygen, carbon, nitrogen, and phosphorus cycles. The Figure 5.9
shows the students’ levels of understanding indicated by their responses to the key
concept area of cycles of materials.
Cycles of Materials
0
10
20
30
40
50
60
70
80
90
100
SU PU PUM MU NU NR
PrEGPsEGPrCGPsCG
Figure 5.9 Students’ Levels of Understanding of Cycles of Materials in the
Experimental and the Control Groups
The results from the Figure 5.9 shows that students’ sound understanding
were low and stayed the same in the experimental and the control groups after the
treatment. There was an increase in the experimental and the control group
students’ partial understanding after the treatment. Students’ partial understanding

135
which includes misunderstanding was not observed in the experimental and the
control groups before the treatment. However, there was a slight increase in
students’ partial understanding which includes misunderstanding in the
experimental and the control group after the treatment. There was a decrease in
students’ misunderstanding in the experimental and the control groups after the
treatment. Students’ no-understanding increased in the experimental and the
control groups after the treatment. Students’ non-response decreased in the
experimental and the control groups after the treatment.
As an example of the key concept area of cycles of materials, Question 9
in the TEC was given. This question was about the key concept of phosphorus
cycle.
Question 9.
Related to the phosphorus cycle, which one of the followings is correct?
A) The source of phosphorus cycle is phosphorus found in the atmosphere.
B) Phosphorus is first taken from the soil by animals and then, the
phosphorus cycle starts.
C) Phosphorus cycle starts when rocks included phosphorus erode and pass
the phosphorus through the water.
D) Phosphorus cycle starts with fishes in the sea.
Explain briefly why you made that choice.
For this question, students were expected to choose the correct answer “C”
(Phosphorus cycle starts when rocks that included phosphorus erode and pass the
phosphorus to the water). An acceptable explanation of the question might be:

136
- The source of phosphorus cycle is rocks. Phosphorus occurs by the
erosion of the rocks then, it passes from soil to sea in time, e.g. through
rain.
The types of students’ responses are displayed below in Table 5.13
according to various students’ levels of understanding of phosphorus cycle.
Table 5.13 Summary of Students’ Levels of Understanding and their Types of
Responses to “Phosphorus Cycle” in the Experimental and the Control Groups
during the Treatment
Types of ResponseNumber ofResponses
(n=45 for EG,n=37 for CG)
PreEG
PreCG
PstEG
PstCG
Sound Understanding 0 0 0 0Partial Understanding 0 0 3 2
As phosphorus is formed in rocks, water erodes the rocks and it starts.Living organisms in water take this phosphorus. Animals eat fish andphosphorus cycle continue like that.
1
The source of phosphorus cycle is rocks/Rocks include phosphorus. 1 1Water plants take phosphorus and animals eat these plants. 1Phosphorus cycle occurs from land to the sea. 1
Partial Understanding Which Includes Misunderstanding 0 0 0 0Misunderstanding 3 3 2 3
Misunderstanding despite choice of the correct response forthe multiple-choice question
1 0 1 0
Phosphorus pass to the water, then it evaporate and goes to the clouds,and comes back again to the water.
1
Phosphorus cycle continues with fishes in sea. 1Misunderstanding for the choice of the incorrect response
for the multiple-choice question2 3 1 3
No Understanding 4 7 9 12Non-sense 1 1 2Rewrite 4 6 8 10
No Response 35 27 29 19

137
Some students also gave alternative responses (A, B, or D) to the question.
One of the examples of the students’ responses for the alternative “A” (The source
of phosphorus cycle is phosphorus found in the atmosphere) was: “Phosphorus is
substance that is found less in atmosphere layers”. Some of the students who
chose the alternative “B” (Phosphorus is first taken from the soil by animals and
then, the phosphorus cycle starts) stated “Phosphorus cycle starts with animals in
land first, and it starts with animals in sea” and “After animals take phosphorus,
they leave phosphorus as dung to nature and plants use it. Then, animals eat plants
again”.
Furthermore, some students made the wrong choice “D” (Phosphorus
cycle starts with fishes in the sea). One of their ideas for that alternative was:
“Phosphorus is found in different kinds of animals. They transform inorganic
phosphorus into organic phosphorus. While human beings eat these fishes,
phosphorus passes through to them”.
5.4.5.6 Students’ Levels of Understanding of Environmental Pollution
Questions 13, 14, 15, 16, and 17 in the TEC were on the key concept area
of environmental pollution. Environmental pollution contained the key concepts
of water and soil cycle, radiation, and erosion. The Figure 5.10 displays the
students’ levels of understanding indicated by their responses to the key concept
area of environmental pollution.

138
Environmental Pollution
020406080
100120140160180200
SU PU PUM MU NU NR
PrEGPsEGPrCGPsCG
Figure 5.10 Students’ Levels of Understanding on Environmental Pollution in the
Experimental and the Control Groups
The results from the Figure 5.10 shows that students’ sound and partial
understanding increased in the experimental and the control groups after the
treatment. While students’ partial understanding which includes misunderstanding
stayed almost same in the experimental group after the treatment, it decreased
slightly in the control group after the treatment. Students’ misunderstanding
slightly decreased in the experimental group after the treatment, but increased in
the control group. There was a slight increase in students’ no-understanding in the
experimental and the control groups after the treatment. However, students’ non-
response decreased in both groups after the treatment.

139
As an example, question 13 in the TEC was give to show the students’
levels of understanding of the key concept area of environmental pollution. This
question was about the key concept of water pollution.
Question 13.
In some rivers and lakes the color of water looks turbid and sometimes bad smell
spreads out to the environment.
Explain why.
For this question, an acceptable explanation might include this main idea:
- Algae accumulation can cause to turbidity. Increasing number of
bacteria and their decomposition process can be a reason for bad smell.
Students gave several responses to the question, and these responses were
categorized according to the their levels of understanding of water cycle as shown
in the following Table 5.14.

140
Table 5.14 Summary of Students’ Levels of Understanding and their Types of
Responses to “Water Pollution” in the Experimental and the Control Groups
during the Treatment
Types of ResponseNumber ofResponses
(n=45 for EG,n=37 for CG)
PreEG
PreCG
PstEG
PstCG
Sound Understanding 26 38 61 49Algae in water and thickness of algae layer. 2 2 2 2There are bacteria or viruses. 1Dirty poisonous factory (industrial) leftovers. 3 4 20 10Throwing (harmful) dirt or garbage. 13 12 21 20Sewage. 1 15 4 12(Poisonous or dirty) Wastes/Environmental wastes/Chemical wastes. 7 4 14 5
Partial Understanding 13 9 15 11Water pollution. 4 1 8 5Environmental pollution. 2 4 4 3There is no flow in the lakes. 5 1 1 1No water recycling itself. 1As organisms that live and die in water. 1 1 1People. 1 2Air pollution/Air pollution, water pollution, and soil pollution. 1 1
Partial Understanding Which Includes MisunderstandingMisunderstanding 5 3 2 2
Water looks like turbid since lakes are muddy. 1 1As turbid sand flow into water. 1 1Water is seen as the bottom of the lake/Reflection of shadow of thetrees near the lakes.
1 1
There are animals living in the streams or swamp under lakes. Theymade turbid in lakes and then bad smell spreads.
1 1
Erosion. 1Fossil fuel. 1Algae occur by feces of frogs. 1
As decomposers decrease. 1
No Understanding 2 1 2 1Non-sense 2 1 2 1Rewrite 0 0 0 0
No Response 7 2 0 1

141
5.5 Power Analysis
In this study, there were 82 ninth graders and ten variables: two
independent variables (treatment and gender): three dependent variables (post-
TEC, post-ASB, and post-ASE), and five covariates (pre-TEC, pre-ASB, pre-
ASE, SABG, and TOLT). According to the MANCOVA results, the treatment
showed statistically significant value with only post-TEC in this study. Gender did
not show any statistically significant value with post-TEC, post-ASB, and post-
ASE. Furthermore, the interaction of the treatment and gender did not show any
statistically significant value with post-TEC, post-ASB, and post-ASE (See Table
5.7).
In order to calculate power of the post-TEC, effect size of the post-TEC
should be calculated. The probability of rejecting true null hypothesis was set to
.05. At the beginning of the study, effect size was set as medium size effect (.15).
The observed value of effect size was again calculated using formula f2 = R2 / (1-
R2) for the post-TEC at the end of the study. R2 was found as .109 for the post-
TEC in the MANCOVA as seen in the Table 5.7. The value of f2 was found to be
.13. We might say that there is a slight decrease in the second value and the
practical significance of this study (.13) is lower than the expected one (.15).
However, this study could be applied for the Test of Ecological Concepts
practically.
Then, the power of post-TEC for the sample of 82 students and medium
effect size was calculated. The value of power was set to .05 before null
hypotheses testing. For power calculation, the formula used was n= L / f2 + K+1.

142
The values used were n=82, f2 =.15 and K=21 (3 dependents * 7 independents
including covariates and grouping variables).
At the beginning of the study, pre-calculated power of this study was
found as 9. This value corresponds to 78 % power using Cohen and Cohen’s
Table (Cohen and Cohen, 1983). At the end of this study, power was found as
84.2 % for the post-TEC from Table 5.7. The value of power increased after the
treatment.
5.6 Summary of the Results of the Study
All students in four classes were administered the pre-TEC, pre-ASB, pre-
ASE, and TOLT as pre-tests at the beginning of the treatment, and they were
administered the post-TEC, post-ASB, and post-ASE at the end of the treatment.
The data were analyzed by the MANCOVA.
In the light of the findings obtained by the statistical analyses, the
following results could be summarized as follows:
1. The dependent and the independent variables of this study showed the
following correlations; there were positive significant correlations
between the SAB and the post-TEC, between the SAB and the pre-
ASB, between the SAB and the post-ASB, and between the SAB and
the post-ASE. However, no significant correlation was found between
the SAB and the pre-ASE. There was also no significant correlation
between the SAB and the TOLT. The TOLT showed a positive
significant correlation with only the post-ASE. Moreover, a positive
significant correlation between the SAB and the pre-TEC was found.

143
2. There was a positive significant correlation between pre-TEC and the
post-TEC. There was a positive significant correlation between pre-
ASB and the post-ASB. A positive significant correlation was found
between the pre-ASE and post-ASE.
3. There was no significant correlation between the pre-TEC and the
post-ASB, similarly, between the pre-TEC and the post-ASE, and also
a positive significant correlation was found between the pre-ASB and
the post-TEC. Similarly, there was a positive significant correlation
between the pre-ASB and the post-ASE.
4. Statistical results showed that there was a significant correlation
between the pre-ASE and the post-TEC. Similarly, a positive
significant correlation between the pre-ASE and the post-ASB was
found.
5. While there were positive significant correlations among the
independent dependents of the SAB, the pre-TEC, the pre-ASB, and
the pre-ASE, the independent variable of the TOLT did not show any
correlation with them. As a result, the SAB, the pre-TEC, the pre-ASB,
and the pre-ASE were determined as possible covariates.
6. In Multiple Regression Analysis, the independent variable of the pre-
ASB, the SAB, the pre-TEC, and the pre-ASE did show significant
values. Then, they were determined as covariates of the study.
7. The conceptual change text oriented instruction in the experimental
group was more effective in improving the students’ ecology

144
achievement and to remediate their misconceptions about ecology than
did the traditional instruction in the control group. A statistically
significant difference between the experimental and the control
groups’ ecology achievement was found. Additionally, the CCTI
increased the students’ ecology achievement and decreased the
students’ misconceptions about ecology more than did the traditional
method.
8. There was there was a slight difference between the mean of the ASB
scores of the experimental and the control groups from pre-test to post-
test.. According to the MANCOVA, the results of the pre-ASB and
post-ASB indicated that there was no statistically significant difference
between the experimental and the control groups’ attitudes towards
biology. That is, the CCTI did not increase the students’ attitudes
towards biology more than did the traditional methods. Furthermore,
using the CCTI did not cause a more significant increase in the
students’ attitudes towards biology and environment.
9. Similarly, there was a slight difference between the mean of the ASE
scores of the experimental and the control groups from pre-test to post-
test. There was no significant difference found between the
experimental and the control groups’ attitudes towards environment.
The CCTI did not increase the students’ attitudes towards environment
more than the traditional method.
10. There was no statistically significant difference between males’ and
females’ post-TEC, post-ASB, and post-ASE scores. Gender was not

145
effective in improving students’ post-TEC, post-ASB, and post-ASE
scores.
11. The interaction between the treatment and gender did not cause a
significant difference on the population means of the post-TEC, the
post-ASB, and the post-ASE scores as the p value of interaction
between the treatment and gender was higher than .05. Thus, it can be
stated that the interaction between the treatment and gender was not
effective in improving students’ post-TEC, post-ASB, and post-ASE
scores.
12. The results of the content analysis related to the Test of Ecological
Concepts showed that students had five levels of understanding: sound
understanding, partial understanding, partial understanding which
includes misunderstanding, misunderstanding, and no understanding.
The category of “No understanding” also included two sub-categories:
nonsense and rewrite. Furthermore, the treatment caused some positive
differences in students’ five levels of understanding when examining
overall results of the Ecology Concepts Test. The overall results
showed that the students’ sound understanding increased in the
experimental and the control groups after the treatment. There was an
increase in the students’ partial understanding in the experimental and
the control groups after the treatment. There was a slight increase in
the experimental group students’ partial understanding which includes
misunderstanding, and a slight decrease in the control group students
after the treatment. The students’ misunderstanding decreased in the

146
experimental and the control groups after the treatment, but the
decrease was more in the students in the experimental group. The
students’ no-understanding increased in the experimental and the
control groups after the treatment. The number of non-responding
students decreased in the experimental and the control groups after the
treatment.
13. In the ecological concepts related to “Biotic and Abiotic Factors”, the
students’ misunderstanding decreased in the experimental and the
control groups after the treatment. The decrease was more in the
experimental group. In the concepts related to “Food Chain”, the
students’ misunderstanding stayed the same in the experimental group,
but there was a slight decrease in the control group. In the concepts
related to “Biological Organization” there was a remarkable decrease
in the experimental group than the decrease in the control group in the
students’ misunderstanding after the treatment. In “Cycles of
Materials” concepts, there was a decrease in the students’
misunderstanding in the experimental and the control groups after the
treatment. In “Environmental Pollution” concepts, there was a decrease
in students’ misunderstanding in the experimental group, but an
increase in the control group after the treatment.

147
CHAPTER 6
CONCLUSION, DISCUSSION, AND IMPLICATIONS
The purpose of this study was to investigate the influences of conceptual
change texts oriented instruction accompanied by demonstrations within small
groups on ninth grade students’ understanding, achievement, attitudes towards
biology, and attitudes towards environment about ecological concepts. This
chapter includes five sections: conclusions, discussion of the results, internal and
external validity of the study, implications of the study, and recommendations for
further studies.
6.1 Conclusion
In this study, convenience sampling was used, and the sample was chosen
from the accessible population as mentioned previously in Chapter 4. Thus, there
is a limitation about generalization of the findings of the study. The results can
only be generalized to the accessible population and to similar populations in
Turkey. That is, the conclusions drawn from the results of the study below can be
applied to a broader population of similar public high school students in Balıkesir.

148
The following conclusions can be drawn from the results of the study:
• The conceptual change texts oriented instruction accompanied by
demonstrations in small groups was an effective tool in eliminating
students’ common misconceptions, and in improving the students’
understanding of ecology and achievement. In contrast to the
traditional instruction, the students’ ecology achievement increased
more with the conceptual change texts oriented instruction
accompanied by demonstrations in small groups. However, it was not
effective in increasing the experimental and the control group students’
attitudes towards biology and environment. Therefore, it did not
improve both group students’ attitudes towards biology and
environment more than the traditional instruction.
• Students’ gender difference did not cause any significant increase in
the experimental and the control group students’ ecology achievement,
and attitudes towards biology and attitudes towards environment. That
is, it did not improve both group students’ ecology achievement, and
attitudes towards biology and environment.
• The interaction between the treatment and gender difference did not
cause any significant increase in the experimental and the control
group students’ ecology achievement, and attitudes towards biology
and environment. Hence, it did not improve both group students’
ecology achievement, and attitudes towards biology and environment.
• The overall results of content analysis of the Test of Ecological
Concepts showed that the students’ sound understanding and the

149
partial understanding increased in the experimental and the control
groups after the treatment. There was a slight increase in the
experimental group students’ partial understanding which includes
misunderstanding, and a slight decrease in the control group after the
treatment. Students’ misunderstanding decreased in the experimental
and the control groups after the treatment, but the decrease was more
in the students in the experimental group. While the students’ no-
understanding increased in the experimental and the control groups
after the treatment, the number of non-responding students decreased
in the experimental and the control groups after the treatment.
6.2 Discussion of the Results
As can be seen from the results of the study, this study supports the
findings of some previous studies particularly in the area of science achievement.
In other words, the results of the study present that there were significant
differences of ecology understanding and achievement between the CCTI and the
traditional method, in favor of the students in the experimental group. However,
both gender, and the interaction between the treatment and gender did not cause
any statistically significant increase in students’ ecology understanding and
achievement, and attitudes towards biology and environment. The results of
content analysis of the Test of Ecological Concepts showed that students’ levels
of understanding had changed similarly in each five level in the experimental and
the control groups after the treatment except for the students’ partial
understanding which includes misunderstanding. In the students’ partial
understandings, there was an increase in the experimental group and a decrease in

150
the control group after the treatment. Students’ misunderstandings decreased more
in the experimental group students after the treatment.
The findings of this study also supported the claim that conceptual change
approach is one of the most effective strategies improving students’ understanding
in science. Although attitude have potential to affect science achievement, the
findings of this study did not show attitude as a significant factor on students’
ecology achievement.
The findings of this current study are in agreement with those of Chambers
and Andre (1997), Özkan (2001), Sungur (2000), Eryılmaz (2002), Ye�ilyurt
(2002), and Graham (2003). Chambers and Andre (1997) demonstrated that the
conceptual change text led to better conceptual understanding of electrical
concepts than the traditional didactic text. Özkan (2001) found that students who
were taught using the conceptual change texts oriented instruction had
significantly higher scores of ecology achievement than those students who were
instructed by traditional method. Also, she reported that there were no significant
differences in students’ attitudes towards environment between the experimental
and the control groups. Sungur et al. (2001) showed that the conceptual change
texts accompanied by concept mapping instruction produced a positive effect on
tenth grade students’ understanding of the human circulatory system. The mean
scores of the experimental group performed better than the control group with
respect to the human circulatory system. While the experimental group performed
59.8 %, the traditional group performed 51.6 % after the treatment.
Eryılmaz (2002) showed that the conceptual change discussion was an
effective means of reducing the number of misconceptions students held about

151
force and motion. The conceptual change discussion was found significantly
effective in improving students’ achievement in force and motion. All those
results mentioned above were similar to our findings. This current study
demonstrated that the conceptual change based instruction was effective than the
conventional instruction. However, there was not any significant mean difference
among the treatment, and attitude towards biology and environment.
Ye�ilyurt (2002) found that the conceptual change text oriented instruction
on overcoming students’ misconceptions on fluid force at seventh grade level
showed better scientific conceptions and elimination of misconceptions than the
traditional methods based instruction. Furthermore, Graham (2003) demonstrated
that the student-centered instruction with conceptual support had a significant
effect on the students’ misconceptions and achievement, but it was not effective
on the students’ attitudes towards science.
There are some other studies that used refutational texts as conceptual
instructional tools. These studies displayed similar results like conceptual change
texts. Palmer (2003) investigated the relationship between the refutational text and
the conceptual change text and indicated that both texts were able to stimulate
accommodation in a large quantity of the students about the concept of ecological
role in nature. Sönmez (2002) found that the students who were instructed by the
refutational text supported with discussion web had better scientific conceptions
related to electric current and elimination of misconceptions than did the students
who were taught using traditional methods.
Furthermore, the results of this current research are parallel to the findings
of some other recent studies in science education. For example, Hardal (2003)

152
used quasi-experimental design in her research. She found that hands-on activity
based instruction was significantly effective to improve ninth grade students’
achievement of physics (simple electric circuits), but, there was no significant
mean difference of students’ physics attitudes between the students in the
experimental and the control groups. A�cı (2003) used quasi-experimental design
in her study too. She revealed that the multiple intelligences based instruction was
significantly effective in the students’ ecology achievement and their multiple
intelligences, whereas the instruction was not significantly effective in the
students’ attitudes towards ecology.
Çakır (2002) also found that there was a significant difference between
case-based instruction on students’ performance skills and academic knowledge.
The case-based instruction did not improve students’ attitudes towards biology
and higher order thinking skills. Students’ learning styles and gender difference
was also not effective in students’ performance skills, attitudes towards biology,
higher order thinking skills, and academic knowledge.
However, there are some studies showing conceptual change based
instruction was effective in students’ attitudes towards science (Sinclair, 1994;
Greenfield, 1996). They are not concurrent with our findings. Sinclair (1994)
supported the prediction activities were effective in learning genetic concepts in
high school biology, and attitudes towards science. Greenfield (1996) indicated
that students in grades 3-12 in the USA showed the most positive attitudes
towards science and the most positive perceptions of their own science ability and
achievement.

153
Logical thinking abilities can also affect students’ science achievement. In
literature, there are some studies like those of Ye�ilyurt (2002) and Sönmez
(2002) with their results supporting this view. Ye�ilyurt (2002) indicated that
students’ logical thinking abilities were significant predictors in the understanding
of fluid force concepts. Sönmez (2002) reported that conceptual change texts
based instruction and students’ logical thinking abilities increased students’
achievement in chemistry. Those results are not concurrent with our findings
showing there was no statistically significant difference of students’ logical
thinking abilities on students’ ecology achievement, and attitudes towards biology
and environment.
Additionally, gender difference can be one of the key factors affecting
science achievement. Students’ gender difference in science achievement
generates much attention and debate. Gentry et al. (2002) reported that the
elementary school students were more interested in classroom activities than the
middle school students. The girls were also more interested in classroom activities
and they enjoyed more than the boys. However, the data from this current study
showed that gender, and the interaction between the treatment and gender, were
not effective in the students’ ecology achievement, and attitudes towards biology
and environment. This is consistent with the works of Çakır et al. (2002) and
Sungur and Tekkaya (2003).
Çakır et al. (2002) found that the concept mapping based instruction and
the conceptual change texts based instruction caused significantly better
acquisitions of scientific conceptions related to acid and base concepts than the
traditional instruction. However, no significant gender difference was found on

154
understanding of acid and base concepts between the experimental group and the
control groups. Sungur and Tekkaya (2003) found that there was a statistically
significant mean difference between the concrete and formal students in the
students’ achievement on the human circulatory system, and attitudes towards
biology. There was no statistically significant mean difference between boys and
girls in the students’ achievement on the human circulatory system, and attitudes
towards biology.
In this study, the conceptual change oriented instruction was performed in
small groups, and it was effective in improving the students’ understanding of
ecology and achievement. Our findings have been consistent with previous
studies, which reported improved science achievement. For instance, Jensen and
Finley (1995) used historical materials in conjunction with a conceptual change
strategy involving lecture and small group activities. According to the findings of
the study, there was an overall increase in the students’ understanding of
evolution in Darwinian terms after the treatment.
Rueter and Perrin (1999) found that using the simulation software in the
non-biology majors, especially in grade C was significantly effective on the open-
ended essay question. Also, the group discussions probably enhanced students’
learning as much as technology. Chang and Mao (1999a) also found that the
students in the inquiry-group had significantly higher achievement scores and
attitude scores about earth science than the students in the control group. The
results of the study supported that cooperative learning promoted higher
achievement than competitive and individualistic structures. They recommended

155
that students should learn science through direct observation, hands-on activities,
and collaborative participation.
The conceptual change oriented instruction explicitly dealt with students’
misconceptions, while the traditional instruction did not in this current study.
Also, CCTI is an alternative methodology for improving students’ ecology
achievement. In this study, the conceptual change texts and worksheets included
daily life examples and experiences. Everyday examples and experiences are
helpful for students to imagine easily the ecological contexts. Students may find
easy to grasp some ecological concepts in the school context, and those concepts
can become concrete and meaningful for the students.
As a result of the TEC, the students’ ideas were analyzed in five levels of
understanding categories: sound understanding, partial understanding, partial
understanding which includes misunderstanding, misunderstanding, and no
understanding. Jensen and Finley (1995) also used the same analyses in their
study about evolution. They defined four categories: best understanding,
functional misconception, correct/incomplete, and worst understanding.
According to their pre-and post-test trace analyses, students showed 98 % increase
in the best understanding.
In this current study, the whole results of students’ levels of understanding
in the experimental and the control groups showed that the students’ sound
understanding and partial understanding increased in both groups after the
treatment. There was a slight increase in the experimental group students’ partial
understanding which includes misunderstanding, and a slight decrease in the
control group students after the treatment. There was a decrease in students’ level

156
of misunderstanding in the experimental and the control groups. The students’ no-
understanding increased in both groups after the treatment. However, these results
showed that students’ non-response decreased in both groups after the treatment.
According to the results of the students’ misunderstanding on five concept
areas of ecology in the experimental and control groups, a decrease was found in
the students’ level of misunderstanding of the key concept areas of biotic-abiotic
factors, biological organization, and cycles of materials. While a slight decrease
was found in the control group students’ level of misunderstanding of the key
concept area of food chain, there was no change in the experimental group
students’ level of misunderstanding of the key concept area of food chain after the
treatment. Furthermore, a slight decrease was found in the experimental group
students’ level of misunderstanding of the key concept area of environmental
pollution, an increase was found in the control group students’ level of
misunderstanding of the key concept area of environmental pollution after the
treatment.
Çetin (1998) also reported similar conclusions in her study. She studied
English and Turkish eighth grade students’ understanding of some selected
ecological concepts. Many students from both countries had similar
misconceptions and difficulties about the concepts of food chain, food web, food
pyramid, and decomposition.
To reveal the reasons behind the conceptual difficulties and
misconceptions about ecological concepts, core interview sessions were
performed with two teachers, who conducted the treatment in this study. One
teacher believed that their students would respond to the TEC questions properly,

157
but if they could not respond to these questions, the reasons might be either the
lack of students’ knowledge about the ecological concepts related to the questions,
or teacher’s inappropriate teaching style of ecology. Also, she indicated that most
students only wished to graduate from the high school and they did not plan to go
to university and therefore, did not paid attention to science courses at that high
school. These explanations can also bring reasoning to why students’ attitude
towards biology did not increase by the CCTI.
On the other hand, the CCTI did not improve students’ attitudes towards
biology and environment. According to the findings of the MANCOVA, there
were no significant difference between the CCTI and the TI on students’ attitudes
towards biology and environment. As the teachers mentioned in the interviews
above, most students do not have the intention to continue with their school life,
and as a result their general attitudes towards science courses are not high. In
short, the results of the teacher interviews provide a proof for the MANCOVA.
First of all, the first attitude to consider is the attitude towards biology.
The CCTI did not show any significant difference of attitudes towards biology.
The students in the control and the experimental groups had medium level of
attitudes towards biology before and after the treatment according to the
descriptive data analyses in this study. Students’ average mean of attitude towards
biology changed from 58.40 to 58.50 in the control group, while it changed from
56.54 to57.21 in the experimental group, which proves our initial statement about
the results of study “There were no significant difference of students’ attitudes
towards biology between the CCTI and the TI according to the MANCOVA”.

158
It is a commonly accepted notion that the time between pre-tests and post-
tests should be three weeks at least, it is a fact that a period of at least three weeks
is needed in order to observe a change in students’ attitudes towards a subject.
Therefore, the reason why there is no difference can be attributed to the
inadequate treatment duration. It was observed that even the treatment period of
five weeks was not probably sufficient time period to observe a difference in the
students’ attitudes towards biology. It can be concluded that to cause any change
in students’ attitudes towards science, longer time may be needed.
The study of Hardal (2003) supports our findings about the relationship
between the treatment duration and attitude change. Hardal (2003) found there
was no significant difference of students’ attitudes towards physics between the
hands-on activity based instruction and the conventional instruction. She gave
some possible causes about the results of attitude in her study. She mentioned that
a three week treatment time period was not enough to show the values of one
teaching method over another. Additionally, the treatment was conducted in the
last three weeks of the semester. Thus, causing boredom and a decrease in
students’ attitudes towards simple electric circuits.
Similarly, after five weeks’ study duration no change in students’ attitudes
towards environment was observed as was observed in the study related to attitude
towards biology. Then, it became obvious that inadequate treatment problem is
valid for this study, and more time is needed for better results. Another reason
behind this fact might be the treatment time (end of the semester). Thus, at that
time students felt exhausted and they might not performed well.

159
Moreover, students find some biology and ecological concepts abstract. In
addition, they have some difficulties in understanding and learning biology
concepts because biology contains many terms originated from Latin language.
To conceptualize those terms is not easy for them.
The second attitude to take up is the attitude towards environment. The
students in the control and the experimental groups already had a higher mean
average of attitude towards environment before the treatment. It changed from
85.58 to 88.51 in the control group, while it changed from 89.66 to 90.42 in the
experimental group. There was not significant difference between the CCTI and
the TI for the students’ attitudes towards environment. They already had some
ideas about the ecological phenomena around them which were acquired either
from their own experiences, or observations as well as from formal sources.
Hence, they are highly aware of the environmental problems around them.
Another reason for the results about students’ attitudes toward biology and
environment might be the sample size of the study (82 students). If this study
were conducted in a bigger sample, the results of the attitude towards biology and
environment might have been higher. The conclusion we can derive out of the
study is that it is better to replicate this study with a bigger sample. Sinclair (1994)
also supports our view by stating that if those kinds of studies were conducted in
bigger samples, similar results as well as a positively changing attitude towards
science might be reached.
Similarly, gender difference, and the interaction between the treatment and
gender were not effective in students’ ecology achievement, and attitudes towards
biology and environment. If gender difference, and the interaction between the

160
treatment and gender were investigated in a bigger sample, the results of the study
would differ. In this study, the students’ logical thinking abilities did not
contribute to students’ ecology achievement, and attitudes toward biology and
environment. Again, if this study replicated with a bigger and different school
students, the results of the logical thinking ability of students might be different.
Finally, it can be said that though there is a limitation about generalization
of the results of this current study to other populations. The conclusion drawn
from the results of the study can be applied to a bigger population of similar
public high school students.
As described at the end of Chapter 4, medium size treatment effect was
expected in our study (.15). At the end of the study, the effect size for post-TEC
was found as .13. Pre-calculated power of this study was found as 9.45 for the
post-TEC. This value indicates 78 % power using Cohen and Cohen’s Table
(Cohen and Cohen, 1983). The power was calculated at the end of this study again
and it was pound as 84.2 % for the post-TEC. Then, the first value of power
increased at the end of the treatment. It can be said that the TEC could be applied
to further studies practically as well.
6.3 Internal Validity of the Study
Possible threads of internal validity and the methods were discussed in this
section. Those following possible internal threads were considered and desired to
control during this study: the subject characteristics, data collector, data collector
bias, history, location, mortality, and implementation effect so on.
In this study, a convenience sampling was used to choose the high school
and the classes to conduct the treatment. Each student in the classes has different

161
subject characteristics such as gender, previous biology course grades, ecology
concepts pre-test scores, biology attitude pre-test scores, environmental attitude
pre-test scores, logical thinking abilities, and so on. They might affect students’
ecology concepts post-test scores, biology attitude post-test scores, environmental
attitude post-test scores, and logical thinking abilities. Hence, the variables of the
SAB, pre-TEC, pre-ASB, pre-ASE, and TOLT were considered as covariates in
this study (Table 5.2).
To administer the pre- and post-test to all groups approximately at the
same time provide to control history and location threats. Student classes were
similar characteristics such as same size, same setting, etc. Therefore, exam
conditions for both groups were similar. To control the mortality thread in the
study, missing data analysis was done. Since there were six of 88 missing students
in the post-tests: one of the six students left the school and five of them were
absent on the date of post-test, six students were excluded from the study
completely. However, 4 of 82 students were not present on the date of the pre-
tests. Thus, there were missing data for the independent variables of students’
ecology concepts pre-test scores (pre-TEC), students’ attitudes towards biology
test scores (pre-ASB), students’ attitudes towards environment test scores (pre-
ASE), and students’ test of logical thinking scores (TOLT). The percentage of
missing data of pre-tests (4.8%) was less than 5 % of whole data. The missing
data were directly replaced with the series mean of the entire subjects (SMEAN).
There were two data collectors; two teachers, and they conducted the
treatment. Data collector characteristics and data collector bias were expected to
control. Therefore, they were trained about the study aims, conceptual change

162
texts, misconceptions, small group work, using conceptual change texts and
demonstration materials during the instruction in the experimental and the control
groups. They were also explained when and how the tests administered to the
students. In short, the main aim of the training of the teachers was to ensure that
data would be collected under standard conditions in teachers’ classrooms.
Additionally, the researcher made some observations during the instructions in the
experimental and the control groups to see the conditions and the treatment
applications in the classrooms as intended. However, the pre-tests application
might affect the students’ achievement in the post-tests after the treatment, it is
supposed that effect could be ignored because as all groups would be affected
from the pre-tests equally. Moreover, it is expected that the time between a pre-
and a post-test should be at least three weeks. In this study, the treatment duration
was five weeks. It seems that this time period was enough for pre-TEC and post-
TEC, but five weeks might not be enough time for changing the students’ attitudes
towards biology and environment.
The other internal thread is the confidentiality thread. In this study, it
would be not a problem because students were informed about their names would
only be used in the statistical analyses. Finally, another internal thread in this
study might be Hawthorne effect. It is too difficult to control this thread. To
prevent it, researcher paid attention to the suggested rules of conducting an
interview as much as possible (Fraenkel, and Wallen, 1996).

163
6.4 External Validity of the Study
An external validity of a study can contain population generalizibility and
ecological generalizibility. The population generalizability is related to which
degree the sample of a study represents its population (Fraenkel and Wallen,
1996). In this study, the accessible population was all ninth grade students at a
public high school in Balıkesir and the sample of the study was 82 ninth grade
students of two biology teachers from the same public high school. The subjects
were not randomly chosen from the accessible population and the subjects were
selected using non-random sample of convenience. Thus, it limited the
generalizability of this study’ results. As mentioned in Chapter 4, the students
enrolled to this public high school were mostly from middle class socio-economic
status living in urban or in the center of Balıkesir. However, the conclusions
drawn in the study might be generalized to a broader population of similar public
high school students in Balıkesir and Turkey.
The ecological generalizability refers to which degree the findings of the
study could be extended to the other settings (Fraenkel and Wallen, 1996). In this
study, testing procedures in the experimental and the control groups were
conducted in their ordinary classrooms during the regular class time. While the
control group was instructed in their ordinary classrooms during the regular class
time, the experimental group was given the treatment in their biology laboratory
during the regular class time. Therefore, the findings might be generalized to
similar settings or conditions at similar public high schools in Turkey.
164
6.5 Implications of the Study
In the light of the findings of the study and related previous work about
ecology and conceptual change approach in the literature, the following
implications could be offered:
1. There is no methodology that can be used for all topics in science.
However, well-designed conceptual change approach based instruction
in science represents an alternative instruction approach to encourage
students to modify misconceptions in science. Hence, conceptual
change approach based instruction is a powerful methodology for
science classes. Science educators, teachers and curriculum developers
should take into consideration the student’ misconceptions or
alternative ideas about science topics. They are faced with the
challenge of changing students’ alternative ideas to scientifically
accurate understandings. They can consider the students’ existing
conceptions or misconceptions in biology/science in order to select and
organize students’ intended learning outcomes in biology/science.
Therefore, they can design biology/science instruction or
biology/science teaching curricula regarding students’ common
misconceptions and conceptual change strategies in biology/science. If
students’ alternative ideas are known beforehand, the content of a
curriculum might be designed according to the findings or the teacher
can prepare a teaching scheme to remove those kinds of

165
misconceptions with his/her class (Griffiths and Grant, 1985; Adeniyi,
1985; O-Saki and Samiroden, 1990; BouJaoude, 1992).
2. According to the results of post-TEC, the CCTI explicitly dealt with
the students’ ecology misconceptions, while the traditional method did
not. Student’ misconceptions or alternative ideas on ecological
concepts found in this study can be taken into consideration by science
and biology teachers. The remediation techniques for ecological
concepts can be re-designed according to the some factors such as
class size, class level, and availability of teaching materials. The
teachers and the students should be informed about importance and
usage of conceptual change texts in science/biology classes. Then, the
teachers could plan their instructional activities accordingly.
3. Teachers and curriculum developers can also consider the use of the
CCTI as a regular part of biology/science instruction for the
remediation of the students’ misconceptions.
4. This research supported to use the conceptual change text oriented
instruction at ninth grade students’ achievement of ecology, though it
did not provide any significant evidence in increasing the students’
attitudes towards biology. Therefore, teachers can use safely the CCTI
on ecology to improve the students’ understanding ecological concepts
at ninth grade at high school.
5. However, teachers should consider some factors such as class size,
teaching materials, and students’ pre-knowledge, and grade level can

166
affect ecology teaching before applying the CCTI to ecology topics. If
necessary, the teacher should revise the CCTI, for example the
conceptual change texts can be shortened or different teaching
materials can be used in ecology instruction.
6. Conceptual change approach is a powerful methodology for science
classrooms. This methodology can be applied to some other
science/biology concepts at different grade levels in order to improve
students’ understanding of ecology. Teachers and researchers can also
apply the CCTI used in this research to other sciences like chemistry,
physics, and mathematics at different grade levels.
7. In this study, the CCTI was designed for small size classes. Therefore,
it is advised to use in small size classrooms by teachers and it can be
included in the curriculum as a teaching methodology for small size
classes. However, the conceptual change texts oriented instruction
accompanied by demonstrations among small groups can also be
applied in big size classes. In that case, the conceptual change texts
should be revised and worksheets should be arranged regarding whole
class discussion guided by the teacher.
8. In their classrooms, the teachers can identify students’ misconceptions
and preconceptions with some measurement techniques such as; quiz
involving some questions about misconceptions, misconception
diagnosis test, and interview before and after instruction. Teacher
should focus mainly higher order thinking skills in teaching and asking
questions avoiding knowledge level questions.

167
9. Teachers in a school need time to plan and collaborate with one
another to develop materials, and to try new instructional methods.
Later, they need to meet to reflect upon their teaching processes.
Teachers can develop and apply the conceptual change approach in
their classes. While teachers can apply conceptual change approach
requiring demonstrations in small groups in their class, they should
find some misconceptions about ecology. Then, they should think
carefully how to improve students’ learning of ecology with this new
method. Additionally, teachers should know or learn how to teach
ecology students in small groups.
10. The developed conceptual change texts have several pages and they
should be photocopied to hand the students. Sometimes, to find or
prepare demonstration materials for biology laboratory class can be too
costly. Hence, the teachers should cooperate with their administers in
the school to take their support and encouragement in order to perform
conceptual change approach requiring demonstrations in small groups.
On the other hand, administrators of schools should also explore the
possibilities of using the conceptual change approach requiring
demonstrations in small groups and they need to support this kind of
new methods to improve both teachers and students.
11. In order to facilitate student learning of biology/science at high school,
teachers need to learn different biology/science teaching methods, to
learn how to use different methods, and develop different activities for
their classes. For this reason, some arrangements such as workshops or

168
in-service education courses in effective teaching methods in
biology/science could be designed and presented for primary and
secondary school teachers. Thus, they can plan more carefully their
instructional activities accordingly. As one of the most effective
teaching methods is conceptual change approach, teachers should be
also informed about importance and usage of conceptual change texts.
The conceptual change texts provide students to realize students’
common misconceptions on ecology and the correction of these
misconceptions. Since the conceptual change texts including
worksheets used in this current study were clear and easy to follow by
the teachers and the students, they can also be used for science and
biology classrooms.
12. The CCTI can be combined with other teaching methods such as
traditional methods, field study, or project work according to the
appropriateness of the science topics and teachers can apply it to
science classrooms at several levels. Therefore, the mixed
methodology would be more powerful methodology for science
classrooms.
13. All implications related to ecology at high school mentioned above
can also be applied to ecology classes at elementary level. The CCTI
present some hints for the graduate levels ecology teaching and it can
be also conducted in ecology topics at university level. Thus, it will
help to the biology instructors for designing an instruction of ecology
as students’ previous ecology learning at higher education. In other

169
words, the conceptual change approach requiring demonstrations in
small groups can be performed on ecology topics regarding the
students’ levels.
6.6 Recommendations for Further Research
Based on the results of the study, related literature review about ecology
and conceptual change, and consideration some problems encountered during the
testing, and the treatment processes, the following recommendations can be
offered for future studies:
1. Further research can be carried out in increasing the reliability of this
study.
2. The sample size of this study was 82, and the sample size can be
increased to obtain more valid and reliable results. Therefore, future
research can replicate this current study in a big sample of population,
and the results of the study can be generalized to a big population. In
addition, this study showed that there were found that both the CCTI
and gender difference were not effective in improving students’
attitudes towards biology and environment. If future research can
replicate this study in a big sample of population, it can give different
results.
3. Future research can replicate this current study for a longer time
period, since longer time might affect the students’ attitude towards
biology and students’ attitude towards environment positively.

170
4. There is no methodology or techniques that can be used for all topics
in science however, conceptual change approach is known as an
effective methodology for science classrooms. Future research can
investigate the effects of the conceptual change approach requiring
demonstrations in small groups in improving students’ achievement,
and attitudes towards different biology topics, different science
concepts, and different grade levels.
5. Researchers could make a longitudinal study of ecology from
elementary to university level to comprehend development of students
about ecological concepts.
6. The effect of different variables such as students’ science process
skills, motivation, learning styles, and cognitive styles with the CCTI
on students’ performance in any science topic can be investigated. For
instance, students’ cognitive styles can affect students’ performance in
any topic. It is no methodology suits every student in the class.
Therefore, by preparing the instructional materials according to
students’ cognitive styles, teachers can minimize the effect of
cognitive style on students’ performance in a topic (Bahar, 2003b).
7. In this current study, two teachers carried out the treatment in the
experimental and the control groups. However, the researcher, two
teachers, and students have not experienced conceptual change
approach earlier. On the other hand, using this methodology in small
groups was also a little bit time consuming. Therefore, it would be
better that further studies can make a trial study of the conceptual

171
change approach in one of the previous units of the ecology unit. It
would give an experience to the researcher, the teacher, and the
students. For instance, it would help to the researcher to plan and
conduct more carefully the CCTI on ecology unit. If the teacher and
students were provided a trial study about the CCTI on a science unit,
they would be accustomed to use the CCTI in small groups.
8. If the researcher, teacher, and students have not experienced
beforehand the methodology to be used in a biology/science research,
it is better that the researcher make a trial study before conducting it in
this biology/science topic.
9. Future research can shorten the conceptual change texts and
worksheets used in this current. In this current study, two teachers and
the students taught that the conceptual change texts and worksheets
were too long and time consuming for the instruction, small group
discussions, and whole class discussions. On the other hand, ecology
unit duration in the Turkish biology curriculum should be made longer
in effective instruction of ecology.
10. Further research could use the conceptual change approach with other
instructional methods such as traditional methods, hands-on activities,
and field study in the remediation of students’ misconceptions and
increasing students’ understanding of ecology. For example, if there is
an opportunity to teach ecology lessons outside, the researcher could
plan a mixed instruction to teach ecology. This can be an advantage to
students’ for examining most of the ecology topics in nature and it will

172
help to students’ understanding the abstract ecological concepts such
as food web and population.
11. Future research could use another assessment techniques in the
conceptual change approach to identify students’ common
misconceptions and to measure students’ levels of understanding such
as performance assessment, worksheets assessment, peer assessment,
field study, project work, portfolios, semi-structured interviews, and
systematic observation checklists to collect data.

173
REFERENCES
Adeniyi, E.O. (1985). Misconceptions of selected ecological concepts held by
some Nigerian students. Journal of Biological Education, 19(4), 311-316.
Alexopoulou, E., & Driver, R. (1996). Small-group discussion in physics: Peer
interaction modes in pairs and fours. Journal of Research in Science
Teaching, 33(10), 1099-1114.
Anderson, B., & Wallin, A. (2000). Students’ understanding of the greenhouse
effect, the societal consequences of reducing CO2 emissions and the
problem of ozone layer depletion. Journal of Research in Science
Teaching, 37, 1096-1111.
Anderson, D.L., Fisher, K.M., & Norman, G.J. (2002). Development and
evaluation of the conceptual inventory of natural selection. Journal of
Research in Science Teaching, 39, 952-978.
Appleton, K. (1999). Using theory to guide practice: Teaching science from a
constructivist perspective. School Science and Mathematics, 93(5), 269-
275.
A�cı, Z. (2003). The effects of multiple intelligences based instruction on ninth
graders’ ecology achievement, attitudes toward ecology and multiple

174
intelligences. Unpublished Master Thesis, The Middle East Technical
University, Ankara.
Bahar, M. (2003a). Misconceptions in biology education and conceptual change
strategies. Kuram ve Uygulamada E�itim Bilimleri, 3(1), 55-64.
Bahar, M. (2003b). The effect of instructional methods on the performance of the
students having different cognitive styles. Hacettepe Üniversitesi, E�itim
Fakültesi Dergisi, 24, 26-32.
Bahar, M., & Hansell, M.H. (2000). The relationship between some psychological
factors and their effect on the performance of grid questions and word
association tests. Educational Psychology, 20(3),249-364.
Bahar, M., Johnstone, A.H., & Hansell, M. (1999a). Revisiting learning
difficulties in biology. Journal of Biological Education, 33(2), 84-86.
Bahar, M., Johnstone, A.H., & Sutcliffe, R.G. (1999b). Investigation of students’
cognitive structure in elementary genetics through word association tests.
Journal of Biological Education, 33(3), 134-142.
Banister, F., & Ryan, C. (2001). Developing science concepts through story-
telling. School Science Review, 83(302), 75-83.
Barman, C.R. Griffiths, A.K., & Okebukola, P.A.O. (1995). High school students’
concepts regarding food chains and food webs: A multinational study.
International Journal of Science Education, 17(6), 775-782.

175
Barnett, M., & Morran, J. (2002). Addressing children’s alternative frameworks of
the moon’s phases and eclipses. International Journal of Science
Education, 24(8), 859.
Basili, P. A., & Sanford, J. P. (1991). Conceptual change strategies and
cooperative group work in chemistry. Journal of Research in Science
Teaching, 28, 293-304.
Beeth, M.E. (1998). Teaching for conceptual change: Using status as a
metacognitive tool. Science. Education, 82, 343-356.
Berbero�lu, G., Özgür, Ç., Özdemir, Ö., Uysal, E., & Yayan, B. (2003). Factors
effecting achievement level of Turkish students in the third international
mathematics and science study (TIMSS). E�itim Bilimleri ve Uygulama
Dergisi. 2(3), 1-14.
Binzat, O. (2000). The effects of concept mapping and some other variables on
learning of human excretory system. Unpublished Master Thesis, The
Middle East Technical University, Ankara.
Börü, S., Öztürk, E., & Cavak, �. (2000). Lise biyoloji 1. �stanbul: Milli E�itim
Basımevi.
BouJaoude, S.B. (1992). The relationship between students’ strategies and the
change in their misunderstandings during a high school chemistry course.
Journal of Research in Science Teaching, 29(7), 687-699.

176
Bowen, C.W., & Phelps, A.J. (1997). Demonstration-based cooperative testing in
general chemistry: A broader assessment-of-learning Technique. Journal
of Chemical Education, 74(6), 715-720.
Carlsson, B. (2002a). Ecological understanding 2: Transformation-- a key to
ecological understanding. International Journal of Science Education,
24(7), 701-715.
Carlsson, B. (2002b). Ecological understanding 1: Ways of experiencing
photosynthesis. International Journal of Science Education, 24(7), 681-
699.
Chambers, S.K., & Andre, T. (1997). Gender, prior knowledge, interest, and
experience in electricity and conceptual change text manipulations in
learning about direct current. Journal of Research in Science Teaching, 34,
107-123.
Chan, D.W. (2003). Multiple intelligences and perceived self-efficacy among
chinese secondary school teachers in Hong Kong. Educational
Psychology, 23(5), 521-534.
Chang, C.Y., & Mao, S.L. (1999a). Comparisons of Taiwan science students’
outcomes with inquiry-group versus traditional instruction. The Journal of
Educational Research. 92(6), 340-347.
Chang, C.Y., & Mao, S.L. (1999b). The effects on students’ cognitive
achievement when using the cooperative learning methods in earth science
classrooms. School Science and Mathematics, 99(7), 374-379.

177
Christianson, R.G., & Fisher, K.M. (1999). Comparison of student learning about
diffusion and osmosis in constructivist and traditional classrooms.
International Journal of Science Education, 21(6), 687– 698.
Cohen, J., & Cohen, P. (1983). Applied multiple regression/correlation analysis
for the behavioral sciences. (2nd ed.). Hills, NJ: Lawrence Erlbaum.
Cooper, J.L., Robinson, P. & McKinney, M. (1994). Cooperative learning in the
classroom. In D.F. Halpern and Associates. (Eds.) Changing College
Classrooms (pp. 74-92). San Francisco: Jossey Bass.
Çakır, Ö. S., Uzuntiryaki, E., & Geban, Ö. (2002). Contribution of conceptual
change texts and concept mapping to students’ understanding of acids and
bases. Paper presented at The Annual Meeting of the National Association
for Research in Science Teaching, New Orleans, LA.
Çakır, Ö.S. (2002). The development, implementation and evaluation of a case-
based method in science education. Unpublished Doctoral Thesis, The
Middle East Technical University, Ankara.
Çakır, Ö.S., Yürük, N., & Geban, Ö. (2001). Effectiveness of conceptual change
text oriented instruction on students’ understanding of cellular respiration
concepts, Paper presented at The Annual Meeting of the National
Association for Research in Science Teaching, St. Louis, Minnesota.
Çakıro�lu, J., & Boone, W. (2002). Preservice elementary teachers’ self-efficacy
beliefs and their conceptions of photosynthesis and inheritance. Journal of
Elementary Science Education, 14(1), 1-14.

178
Çapa, Y. (2000). An analysis of ninth grade students’ misconceptions concerning
photosynthesis and respiration in plants. Unpublished Master Thesis, The
Middle East Technical University, Ankara.
Çetin, G. (1998). A comparison of some English and Turkish students'
understanding of selected ecological concepts. Unpublished Master
Thesis, University of Leeds, Leeds.
Dahindsa, H.S., & Chung, G. (2003). Attitudes and achievement of Bruneian
science students. Journal of Research in Science Teaching, 25(8), 907-922.
Driver, R. (1981). Pupils’ alternative frameworks in science. European Journal of
Science Education, 3(1), 93-101.
Driver, R., Squires, A., Rushworth, P., & Wood-Robinson, V. (1994). Making
sense of secondary science: Research into students’ ideas. London, U.K.:
Routledge.
Duit, R. (1991). Bibliography: Research on students’ alternative frameworks in
science-topics, theoretical frameworks, consequences for science teaching.
Kiel, Germany, IPN.
Duschl, R.A., & Gitomer, D.H. (1991). Epistemological perspective on
conceptual change: Implications for educational practice. Journal of
Research in Science Teaching, 28(9), 839-858.

179
Ertepınar, H., & Geban, Ö. (1996). Effect of instruction supplied with the
investigative-oriented laboratory approach on achievement in a science
course. Educational Research, 38(3), 333-340.
Eryılmaz, A. (2002). Effects of conceptual assignments and conceptual change
discussions on students’ misconceptions and achievement regarding force
and motion. Journal of Research in Science Teaching, 39(10), 1001-15.
Eyster, L.S., & Tashiro, J.S. (1997). Using manipulatives to teach quantitative
concepts in ecology. American Biology Teacher, 59(6), 360-64.
Fernández-Manzanal, R., Rodríguez-Barreiro, L.M., & Casal, M. (1999).
Relationship between ecology fieldwork and student attitudes toward
environmental protection. Journal of Research in Science Teaching, 36,
431-453.
Finley, F. N., Stewart, J., & Yarroch, W. L. (1982). Teachers’ perceptions of
important and difficult science content. Science Education, 66(4), 531-
538.
Fisher, K. M.(1985). A misconception in biology: Amino acids and translation.
Journal of Research in Science Teaching, 22(1), 53-62.
Fraenkel, J. R., & Wallen, N. E. (1996). How to design and evaluate research in
education (3rd ed.). New York: McGraw-Hill.
Furnham, A., Reeves, E., & Budhani, S. (2002). Parents think their sons are
brighter than their daughters: Sex differences in parental self-examinations

180
and estimations of their children’s multiple intelligences. Journal of
Genetic Psychology, 163(1), 24-40.
Gallegos, L., Jerezano, M. E., & Flores, F. (1994). Preconceptions and relations
used by students in the construction of food chains. Journal of Research in
Science Teaching, 31, 259-272.
Galley, M. (2001). Middle School Science Texts Full of Errors, Review Finds.
Education Week, 20(19), 6.
Gauld, C. (1997). It must be true—it’s in the textbook! Australian Science
Teachers Journal, 43(2), 21-27.
Gayford, C. (1993). Discussion-based group work related to environmental issues
in science classes with 15-year-old pupils in England. International Journal
of Science Education, 15(5), 521-529.
Geban, Ö., A�kar, P., & Özkan, �. (1992). Effects of computer simulated
experiment and problem solving approaches on students learning outcomes
at the high school level. Journal of Educational Research, 86(1), 5-10.
Geban, Ö., Ertepınar, H., Yılmaz, G., Altın, A., & �ahbaz, F. (1994). Bilgisayar
destekli e�itimin ö�rencilerin fen bilgisi ba�arılarına ve fen Bilgisi
ilgilerine etkisi [The effect of computer aided instruction to students’
achievements and attitudes towards science]. I. Ulusal Fen Bilimleri
E�itimi Sempozyumu, Bildiri Özetleri Kitabı (pp.1-2). 9 Eylül
Üniversitesi, �zmir.

181
Gedik, E. (2001). The effect of demonstration method based on conceptual change
approach on students’ understanding of electrochemistry concept.
Unpublished Master Thesis, The Middle East Technical University,
Ankara.
Gentry, M., Gable, R.K., & Rizza, M.G. (2002). Students’ perceptions of
classroom activities: Are there grade-level and gender differences? Journal
of Educational Psychology, 94(3), 539-544.
George, R. (2000). Measuring change in students’ attitudes toward science over
time: an application of latent variable growth modeling. Journal of Science
Education and Technology, 9(3), 213-225.
Germann, P.J., & Aram, R.J. (1996). Students’ performances on the science
processes of recording data, analyzing data, drawing conclusions, and
providing evidence. Journal of Research in Science Teaching, 33(7), 773-
798.
Gilbert, J.K., & Watts, D.M. (1983). Concepts, misconceptions and alternative
conceptions: changing perspectives in science education. Studies in
Science Education, 10, 61-98.
Gilbert, J.K., Osborne, R.J., & Fensham, P.J. (1982). Students’ science and its
consequences for teaching. Science Education, 66(4), 623-633.
Gil-Perez, D., & Carrascosa, J. (1990). What to do about science
“misconceptions”. Science Education, 74(5), 531-540.

182
Glynn, S.M., & Takahashi, T. (1998). Learning from analogy-enhanced science
text. Journal of Research in Science Teaching, 35(10), 1129-1149.
Graham, G.R. (2003). The effect of students-centred instruction with and without
conceptual advocacy on biology students’ misconceptions, achievement,
attitudes towards science, and cognitive retention. Retrieved May 24,
2003, http://wwwlib.umi.com/dissertations/fullcit/3067506.
Greenfield, T.A. (1996). Gender, ethnicity, science achievement, and attitudes.
Journal of Research in Science Teaching, 33, 901-933.
Griffiths, A.K., & Grant, B.A.C. (1985). High school students' understanding of
food webs: Identification of a learning hierarchy and related
misconceptions. Journal of Research in Science Teaching, 22(5), 421-436.
Han, S. (2002). Using deductive reasoning to promote the change of students'
conceptions about force and motion. Journal of Research in Science
Teaching. 24(6), 593-610.
Hanley, S. (1994). On constructivism. Retrieved July 11, 2003, from
http://www.towson.edu/csme/mctp/Essays/Constructivism.txt.
Hardal, Ö. (2003). The effects of hands-on activities on ninth grade students’
achievement and attitudes towards physics, Unpublished Master Thesis,
The Middle East Technical University, Ankara.

183
Hellden, G. (1992a). Pupils’ understanding of ecological process. (The LISMA
group learning in science and mathematics Report No. 3). Kristianstad
University College, Sweden.
Hellden, G. (1992b). Pupils’ understanding of ecological process. (The LISMA
group learning in science and mathematics Report No. 2). Kristianstad
University College, Sweden.
Hewson, M.G., & Hewson, P.W. (1983). Effects of instruction using students’
prior knowledge and conceptual change strategies on science learning.
Journal of Research in Science Teaching, 20(8), 731-743.
Hewson, P.W., & Thorley, N.R. (1989). The conditions of conceptual change in
the classroom. Journal of Research in Science Teaching, 1, 541-553.
Hogan, K., & Fisherkeller, J. (1996). Representing students’ thinking about
nutrient cycling in ecosystems: biodimential coding of a complex topic.
Journal of Research in Science Teaching, 33(9), 941-970.
Hynd, C.R., Mcwhorter, J.Y., Phares, V.L., & Suttles, C.W. (1994). The role of
instructional variables in conceptual change in high school physics topics.
Journal of Research in Science Teaching, 31(9), 933-946.
Ignatiuk, G.T. (1978). Influence of the amount of time spent in field trip Activities
on student attitude toward science and the environment. S.S.T.A. Research
Centre Report No. 49, Saskatchewan School Trustees Association, Regina.
(ERIC Document Reproduction Service No. ED180758)

184
Jaus, H. (1982). The effect of environmental education instruction on children’s
attitudes in elementary school students. Science Education, 66(5), 690-
692.
Jegede, O. J., Alaiyemola, F. F., & Okebukola, P. A. O. (1990). The effect of
concept mapping on students' anxiety and achievement in biology. Journal
of Research in Science Teaching, 27(10), 951-960.
Jensen, M., & Finley, F. (1995). Teaching evolution using historical arguments in
a conceptual change strategy. Science Education 79, 147-166.
Jofili, Z., Geraldo, A., & Watts, D.M. (1999). A course for critical constructivism
through action research: a case study. Journal for Research in Science and
Technology Education, 17(1), 5-17.
Jones, M.G., Howe, A., & Rua, M.J. (2000). Gender differences in students’
experiences, interests, and attitudes toward science and scientists. Science
Education, 84, 180-192.
Keng, G.K. (1997). Students’ understanding of photosynthesis, learning
approaches and attitudes towards science across grade levels. Unpublished
Ph.D. thesis, Leeds University, Leeds.
Kesamang, M.E.E., & Taiwo, A.A. (2002). The correlates of the socio-cultural
background of Botswana junior secondary school students with their
attitude towards and achievements in science. International Journal of
Science Education, 24(9), 919–940.
185
Khalid, T. (1999). Pre-service teachers’ alternative conceptions regarding three
ecological issues. Paper presented at the annual meeting of the national
association for research in science teaching, Boston, Massachusetts.
Khatete, D.W. (1995). Students’ understanding of decomposition and its
importance in nature among some Kenyan Students. Unpublished Doctoral
Thesis, University of Leeds, Leeds.
Koulaides, V., & Christidou, V. (1999). Models of students’ thinking concerning
the greenhouse effect and teaching implications. Science Education, 83(5),
559-576.
Lazarowitz, R., Hertz-Lazarowitz, R., & Baird, J. H. (1994). Learning science in a
cooperative setting: Academic achievement and affective outcomes.
Journal of Research in Science Teaching, 31, 1121-1131.
Leach, J. (1995). Progression in understanding of some ecological concepts,
students aged 5 to 16. Unpublished Doctoral Thesis, University of Leeds,
Leeds.
Lehman, J.D., Carter, C., & Butler, J.K. (1985) Concept mapping and
achievement. Journal of Research in Science Teaching, 22(7), 663-673.
Lewicki, K. (2002). Satisfying Multiple Intelligences and Diverse Talents through
Musical Theater. Middle School Journal. 34(2), 39-44.

186
Lonning, R.A. (1993). Effect of cooperative learning strategies on student verbal
interactions and achievement during conceptual change instruction in 10th
grade science. Journal of Research in Science Teaching, 30, 1087-1101.
Lord, T. (1994). Using constructivism to enhance student learning in college
biology. Journal of College Science Teaching, 23(6), 346-48.
Manzanal, R.F., Rodriguez Barreiro, L.M., & Casal Jimenez M. (1999).
Relationship between ecology fieldwork and student attitudes toward
environmental protection. International Journal of Science Education,
36(4), 431–454.
McClure, J.R., Sonak, B., & Suen, H.K. (1999). Concept map assessment of
classroom learning: reliability, validity, and logistical practicality. Journal
of Research in Science Teaching, 36(4), 475-492.
McComas, W. F. (2002). The ideal environmental science curriculum: I. History,
rationales, misconceptions and standards. American Biology Teacher,
64(9), 665-672.
McCormick, B., MacKinnon, C., & Jones, E.R.L. (1999). Evaluation of attitude,
achievement, and classroom environment in a learner-centered
introductory biology class. Presented to the National Association of
Research in Science Teaching Annual Meeting in Boston, MA.
Mirjamaija, M. (2001). Improving conceptual change concerning photosynthesis
through text design. Learning and Instruction, 11, 241-257.

187
Mullet, E. (2002). High school students’ understanding of resistance in simple
series electric circuits. International Journal of Science Education, 24(6),
551-564.
Niaz, M. (2002). Facilitating conceptual change in students’ understanding of
electrochemistry. Journal of Research in Science Teaching, 24(4), 425-
530.
Nolen, J.L. (2003). Multiple intelligences in the classroom. Education, 124(1),
120.
Norman, R. (2003). Gender and physics. International Journal of Science
Education, 25(4), 509-536.
Novak, J.D. (1990). Concept mapping: A useful tool for science education.
Journal of Research in Science Teaching, 27(10), 937-949.
Nussbaum, E.M. (2002). How introverts versus extroverts approach small-group
argumentative discussions. The Elementary School Journal, 102(3), 183-
197.
Odom, A.L., & Barrow, L.H. (1995). Development and application of a two-tier
diagnostic test measuring college biology students’ understanding of
diffusion and osmosis after a course of instruction. Journal of Research in
Science Teaching, 32(1), 45-61.
Okebukola, P.A. (1990). Attaining meaningful learning of concepts in genetics
and ecology: An examination of the potency of the concept-mapping
technique, Journal of Research in Science Teaching, 27(5), 493-504.

188
Okeke, E.A.C., & Wood-Robinson, C. (1980). A study of Nigerian pupils’
understanding of selected biological concepts. Journal of Biological
Education, 14(4), 329-338.
O-saki, K.M., & Samiroden, W.D. (1990), Students’ conceptions of ‘Living’ and
‘Dead’. Journal of Biological Education, 24(3), 199-207.
Özkan, Ö. (2001). Remediation of seventh grade students’ misconceptions related
to ecological concepts through conceptual change approach. Unpublished
Master Thesis, The Middle East Technical University, Ankara.
Palmer, D.H. (1999). Exploring the link between students’ scientific and
nonscientific conceptions. Science Education, 83, 639-653.
Palmer, D.H. (2003). Investigating the relationship between refutational text and
conceptual change. Science Education, 87, 663-684.
Papanastasiou, E.C., & Zembylas, M. (2002). The effect of attitudes on science
achievement: A study conducted among high school pupils in Cyprus.
International Review of Education, 48(6), 469-484.
Pearsall, N. R., Skipper, J., & Mintzes, J. (1997). Knowledge restructuring in the
life sciences: A longitudinal study of conceptual change in biology.
Science Education,81(2), 193-215.
Pell, T., & Jarvis, T. (2001). Developing attitude to science scales for use with
students of ages from five to eleven years. International Journal of Science
Education, 23(8), 1847–1862.
189
Posner, G.J., Strike, K.A., Hewson, P.W., & Gertzog, W.A. (1982).
Accommodation of a scientific conception: Toward a theory of conceptual
change. Science Education, 66(2), 211-227.
Potts, A., Stanisstreet, M., & Boyes, E. (1996). Children’s ideas about the ozone
layer and opportunities for physics teaching. School Science Review, 78,
57-62.
Pyle, E.J., & Akins-Moffatt, J. (1999). The Effects of Visually-Enhanced
Instructional Environments on Students' Conceptual Growth. East
Lansing, MI: National Center for Research on Teacher Learning. (ERIC
Document Reproduction Service No. EJ651157).
Rice, D., Ryan, J., & Samson, S. (1998). Using concept maps to assess student
learning in the science classroom: Must different methods compete?”
Journal of Research in Science Teaching, 35(10), 1103-1127.
Ronneau, C. (1990). Radioactivity: A natural Phenomenon. Journal of Chemical
Education, 67(9), 736-37.
Rueter, J.G., & Perrin, N.A. (1999). Using a simulation to teach food web
dynamics. The American Biology Teacher, 61(2), 116-123.
Schmidt, H.G., De Volder, M.L., De Grave, W.S., Moust, J.H.C., & Patel, V.L.
(1989). Explanatory models in the processing of science text: The role of
prior knowledge activation through small-group discussion. Journal of
Educational Psychology, 81(4) 610-619.

190
Sharon, K., & Chambers, T.A. (1997). Gender, prior knowledge, interest, and
experience in electricity and conceptual change text manipulations in
learning about direct current. Journal of Research in Science Teaching.
34(2), 107-123.
Simpson, W.D., & Marek, E. (1988). Understanding and misconceptions of
biology concepts held by students attending small high schools and
students attending large high schools. Journal of Research in Science
Teaching, 25(5), 361-374.
Sinclair, A. S. (1994). Prediction making as an instructional strategy: implications
of teacher effects on learning, attitude toward science, and classroom
participation. Journal of Research and Development in Education, 27(3),
153-61.
Smerdon, B.A., & Burkam, D.T. (1999). Access to constructivist and didactic
teaching: Who gets it? Where is it practiced? Teacher College Record,
101(1), 1-23.
Songer, C.J., & Mintzes, J.J. (1994). Understanding cellular respiration: An
analysis of conceptual change in cell biology. Journal of Research in
Science Teaching, 31(6), 621-637.
Sönmez, G. (2002). The role of refutational text supported with discussion web in
overcoming difficulties with electric current concepts of 6th grade students.
Unpublished Master Thesis, The Middle East Technical University,
Ankara.

191
Stavy, R. (1991). Using analogy to overcome misconceptions about conservation
of matter. Journal of Research in Science Teaching, 28(4), 305-313.
Stofflett, R.T. (1994). The accommodation of science pedagogical knowledge:
The application of conceptual change constructs to teacher education.
Journal of Research in Science Teaching, 31(8), 787-810.
Storey, R.D. (1989). Textbook errors and misconceptions in biology:
Photosynthesis. American Biology Teacher, 51(5), 271-74.
Storey, R.D. (1992). Textbook Errors and Misconceptions in Biology: Cell
Physiology. American Biology Teacher, 54(4), 200-203.
Stylianidou, F. (1997). Students’ learning about energy and processes of change.
School Science Review, 78(286), 91-97.
Sungur, S. (2000). The contribution of conceptual change texts accompanied by
concept mapping to students’ understanding of circulatory system.
Unpublished Master Thesis, The Middle East Technical University,
Ankara.
Sungur, S., & Tekkaya, C. (2003). Students’ achievements in human circulatory
system unit: The effect of reasoning ability and gender. Journal of Science
Education and Technology, 12(1), 59-64.
Sungur, S., Tekkaya, C., & Geban, Ö. (2001). The contribution of conceptual
change text accompanied by concept mapping instruction on 10th grade
192
students’ understanding of the human circulatory system. School Science
and Mathematics, 101(2), 91-102.
Tianyu, W., & Thomas, A. (1991). Conceptual change text versus traditional text
and application questions versus no questions in learning about electricity.
Contemporary Educational Psychology, 16(2), 103-16.
Tinklin, T. (2003). Gender differences and high attainment. British Educational
Research Journal, 29(3), 307-326.
Tobin, K., & Capie, W. (1981). Development and validation of a group test of
logical thinking. Educational and Psychological Measurement, 4l(2), 4l3-
424.
Valdez, P.S. (November 2001). A monthly portfolio project improves student
performance. The Science Teacher, 41-43.
Venville, G.J., & Treagust, D.F. (1998). Exploring conceptual change in genetics
using a multidimentional interpretive framework. Journal of Research in
Science Teaching, 35(9), 1031-1055.
Wallace, J. D., & Mintzes, J. J. (1990). The concept map as a research tool:
Exploring conceptual change in biology. Journal of Research in Science
Teaching, 27(10), 1033-1052.
Watson, J. (Dec-Jan 1991). Cooperative learning and computers: One way to
address student differences. The Computing Teacher, 9-12

193
Weaver, G.C. (1998). Strategies in K-12 science instruction to promote
conceptual change. Science Education. 82, 455-472.
Webb, P., & Boltt, G. (1990). The food chain to food web: A natural progression?
Journal of Biological Education, 24(3), 187-197.
Westbrook, S.L., & Marek, E.A. (1991). A cross-age study of student
understanding of the concept of diffusion. Journal of Research in Science
Teaching, 28(8), 649-660.
Willson, V.L., Ackerman, C., & Malave, C. (2000). Cross-time attitudes, concept
formation, and achievement in college freshman physics. Journal of
Research in Science Teaching, 37(10), 1112-1120.
Wood-Robinson, C., Lewis, J., & Leach, J. (2000). Young people’s understanding
of the nature of genetic information in the cells of an organism. Journal of
Biological Education. 35(1), 29-36.
Yager, R.E., & Luts, M.V. (1994). Integrated science: The importance of “how”
versus “what”. School Science and Mathematics, 94(7), 338-347.
Ye�ilyurt, H. (2002). Effectiveness of conceptual change instruction on
overcoming students’ misconceptions of fluid force at seventh grade level.
Unpublished Master Thesis, The Middle East Technical University,
Ankara.
Yürük, N., & Geban, Ö. (2001). Conceptual change text: A supplementary
material to facilitate conceptual change in electrochemical cell concepts.

194
Paper presented at The Annual Meeting of the National Association for
Research in Science Teaching. St. Louis, Minnesota.
Zhang, Y. (1999). Gender differences in mathematics and science achievement.
Applied Research Branch Strategic Policy Human Resources
Development Canada. (R-99-18E.a, ISBN: 0-662-28428-3. Cat. No.:
MP32-29/99-18E. 1-41).

195
APPENDIX A
THE OBJECTIVE LIST OF ECOLOGY UNIT
EKOLOJ� ÜN�TES� HEDEFLER L�STES�
HEDEF 1. Ekoloji bilgisi.
DAVRANI�LAR
1. Organizmaların birbirleri ve çevreleriyle olan ili�kilerini inceleyen bilime
ekoloji denildi�ini söyleme / yazma.
2. Çevreyi etkileyen canlı ve cansız etmenleri söyleme / yazma.
3. Canlılar arasındaki simbiyotik ili�kileri; mutualizm, kommensalizm ve
parazitizmin olu�turdu�unu söyleme / yazma.
4. Do�adaki süreklili�in madde döngüleri ile sa�landı�ını söyleme / yazma.
5. Madde döngülerinin; su, karbon, oksijen, azot ve fosfor döngüleri
oldu�unu söyleme / yazma.
6. Biyosferdeki ya�ama birliklerinin populasyon, komünite ve ekosistem
oldu�unu söyleme / yazma.
7. Su, toprak, hava, ses ve radyasyon gibi kirliliklerin oldu�unu söyleme /
yazma.
8. Erozyona sebep olan etmenleri söyleme / yazma.

196
HEDEF 2. Ekolojiyi kavrayabilme.
DAVRANI�LAR
1. Cansız etmenlerden ı�ık, sıcaklık, iklim, mineral, su ve pH’ın canlılar
üzerindeki etkilerini açıklama.
2. Üretici, tüketici ve ayrı�tırıcıların çevreye etkilerini açıklama.
3. Ayrı�tırıcı bakterilerin ekolojik yönden önemini açıklama.
4. Do�ada kirlenmeye neden olabilecek etmenleri açıklama.
5. Sera etkisi, asit ya�murları, ozon tabakasındaki incelme gibi
etmenlerin biyosfer üzerindeki etkilerini açıklama.
6. Populasyonun büyümesini etkileyen etmenleri açıklama.
7. �nsanın çevre üzerindeki etkisini açıklama.
8. Populasyon, komünite ve ekosistem arasındaki ili�kiyi açıklama.
9. Madde döngülerinin özelliklerini açıklama.
10. Üretici, tüketici ve ayri�tırıcılardan herhangi birinin yok olması
halinde do�acak sonuçlarını açıklama.
HEDEF 3. Canlılar arasındaki ili�kileri kavrayabilme.
DAVRANI�LAR
1. Simbiyotik ili�kileri örnek vererek açıklama.
2. Canlılar arasındaki beslenme ili�kilerinin farklılıklarını açıklama.
3. Ekosistemdeki enerji akı�ını açıklama.
HEDEF 4. Ekolojinin günlük hayattaki önemini kavrayabilme.
DAVRANI�LAR
1. Belirlenen bir çevre kirlili�inin yol açabilece�i olumsuzlukları söyleme
/ yazma.
2. Populasyon büyüklü�ü ile çevrenin ta�ıma kapasitesi arasındaki ili�kiyi
açıklama.
197
3. Çevre kirlili�ini önlemek için alınabilecek önlemleri, örnek vererek
açık-lama.
4. Erozyonun önlenmesi için alınabilecek önlemleri, örnek vererek
açıklama.
5. Çevresel Etki De�erlendirmesi’nin (ÇED) amaçlarını açıklama.
HEDEF 5. Ekoloji ile ilgili bilgileri uygulayabilme.
DAVRANI�LAR
1.Verilen canlı türlerinden besin zinciri olu�turma.
2.Do�adaki madde döngülerini �ema halinde gösterme.
3.Verilen bir madde döngüsü �emasında bo� bırakılan basamakları tamam-
ama.
4.Canlı ve cansız etmenleri kullanarak bir ekosistem modeli olu�turma.
HEDEF 6. Do�al dengeyi korumanın canlılar için önemini takdir edi�.
DAVRANI�LAR
1.Ülkemizde erozyonu önlemenin önemini belirten yazılar yazma.
2.Do�al dengenin korunması için yapılabilecek çalı�malara aktif olarak
katılma.
3.Do�al dengeyi bozmayacak �ekilde bilinçli bir üretici ve tüketici
olmanın önemini belirten yazılar yazma.
4.Ya�adı�ı çevre ve do�al dengeyi koruyucu geli�meleri izleme.
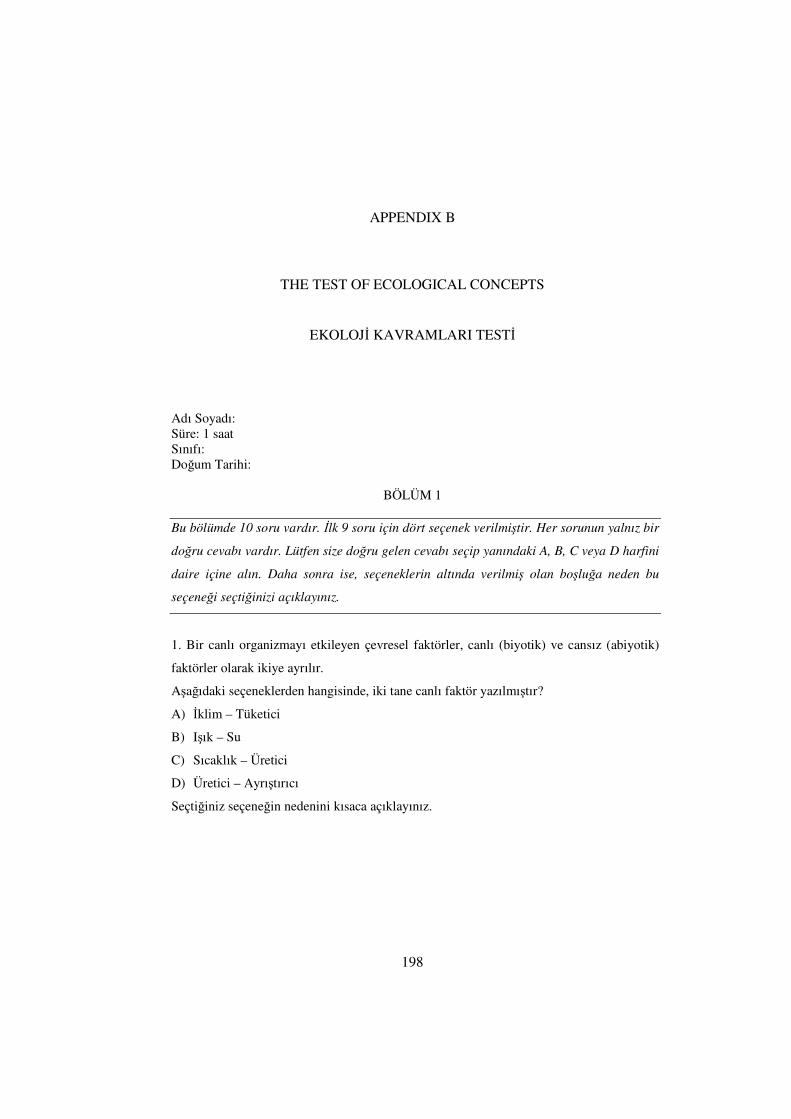
198
APPENDIX B
THE TEST OF ECOLOGICAL CONCEPTS
EKOLOJ� KAVRAMLARI TEST�
Adı Soyadı:Süre: 1 saatSınıfı:Do�um Tarihi:
BÖLÜM 1
Bu bölümde 10 soru vardır. �lk 9 soru için dört seçenek verilmi�tir. Her sorunun yalnız bir
do�ru cevabı vardır. Lütfen size do�ru gelen cevabı seçip yanındaki A, B, C veya D harfini
daire içine alın. Daha sonra ise, seçeneklerin altında verilmi� olan bo�lu�a neden bu
seçene�i seçti�inizi açıklayınız.
1. Bir canlı organizmayı etkileyen çevresel faktörler, canlı (biyotik) ve cansız (abiyotik)
faktörler olarak ikiye ayrılır.
A�a�ıdaki seçeneklerden hangisinde, iki tane canlı faktör yazılmı�tır?
A) �klim – Tüketici
B) I�ık – Su
C) Sıcaklık – Üretici
D) Üretici – Ayrı�tırıcı
Seçti�iniz seçene�in nedenini kısaca açıklayınız.

199
2. Canlı ve cansızların bir arada bulundu�u ve birbirleriyle etkile�im halinde oldukları
sisteme ekosistem denir. Örne�in, Balıkesir’de bulunan De�irmenbo�azı A�açlandırma ve
Piknik alanı bir ekosistemdir.
A�a�ıdaki canlılardan hangisi bir ekosistemde kendi besinini üretir?
A) Su yılanı
B) Sinek
C) Çam a�acı
D) Serçe
Seçti�iniz seçene�in nedenini kısaca açıklayınız
3. Sinekkapan gibi bazı bitkiler için böcekyiyen yada böcekçil bitki denmektedir. Bununla
ilgili olarak a�a�ıdakilerden hangisi do�rudur?
A) Bu bitkiler ve böcekler birlikte ya�arlar
B) Bu bitkiler ve böceklerin her ikisi de tüketicidir.
C) Böcekler bu bitkilere parazit olarak ya�arlar.
D) Bu bitkiler, hem üretici hem tüketicidirler.
Seçti�iniz seçene�in nedenini kısaca açıklayınız
4. Bazı canlılar ya�amlarını sürdürebilmek için sürekli ba�ka canlılara gereksinim
duyarlar. Bu canlılar, besinlerini di�er canlılardan sa�larken, aslında o canlılara da zarar
vermi� olurlar. Bu durum hangi ortak ya�am �ekline örnektir?
A) Kommensalizm
B) Mutualizm
C) Parazitizm
D) Hiçbiri
Seçti�iniz seçene�in nedenini kısaca açıklayınız.

200
5. A�a�ıdaki �ekil bir ekosistemdeki enerji piramidini göstermektedir.
Bu enerji piramidine göre, a�a�ıdakilerden hangisi do�rudur?
A) �kincil tüketiciler, üreticilerden besin sa�lar.
B) Üçüncül tüketiciler, besin zincirinde ilk halkayı olu�tururlar.
C) Üreticiler tarafından olu�turulan besinler, ilk önce üçüncül tüketiciler
tarafından alınır.
D) Üçüncül tüketiciler, tüketiciler arasında en az enerjiye sahip olan gruptur.
Seçti�iniz seçene�in nedenini kısaca açıklayınız

201
6. A�a�ıdaki �ekil bir kara ekosistemindeki besin a�ını göstermektedir.
�ekle göre, a�a�ıdakilerden hangisi yanlı�tır?
A) Geyik, bitki ile beslenirler.
B) Yılan, sincapla beslenir.
C) Yılan ve �ahin, fare ile beslenir.
D) Jaguar, geyik ve ikincil tüketicilerle beslenir.
Seçti�iniz seçene�in nedenini kısaca açıklayınız

202
7. Oksijen ve karbon döngüsü ile ilgili olarak a�a�ıda verilen cümlelerden hangisi
do�rudur?
A) Oksijen döngüsünde, oksijenin kayna�ı fotosentez ile olu�an oksijendir.
B) Oksijen döngüsünde, solunumla hidrojen açı�a çıkar.
C) Karbon döngüsünde, bitkilerin fotosentezi sonucunda, besin ve
karbondioksit üretilir.
D) Karbon döngüsünde, bitkiler atmosferdeki karbondioksiti kullanırlar.
Seçti�iniz seçene�in nedenini kısaca açıklayınız
8. Bezelye ve fasulye gibi bitkiler baklagiller denilen bitki grubundandır. Bitkiler,
baklagiller ve azot döngüsü ile ilgili olarak a�a�ıdakilerden hangisi do�rudur?
A) Azot döngüsünde, baklagiller yer almaz.
B) Azot döngüsünde, bitkiler atmosferdeki azot gazını do�rudan almazlar.
C) Azot döngüsünde, mantarlar rol oynar.
D) Azot döngüsünde, herhangi bir bakteri türü rol oynayabilir.
Seçti�iniz seçene�in nedenini kısaca açıklayınız
9. Fosfor döngüsü ile ilgili olarak a�a�ıdakilerden hangisi do�rudur?
A) Fosforun döngüsünün kayna�ı atmosferdeki fosfordur.
B) Fosfor döngüsü, karalarda fosforun önce hayvanlar tarafından alınmasıyla
ba�lar.
C) Fosfor döngüsü, fosfatlı kayaçların a�ınmasıyla ve fosforun suya geçmesiyle
ba�lar.
D) Fosfor döngüsü denizlerdeki balıklarla ba�lar.
Seçti�iniz seçene�in nedenini kısaca açıklayınız.

203
10. A�a�ıda ekoloji ile ilgili be� kavram verilmi�tir. Bunları küçükten büyü�e do�ru
sıralayınız.
Tür Biyosfer Komunite Ekosistem Populasyon
EN BÜYÜK
EN KÜÇÜK
BÖLÜM 2
Bu bölümde 7 kısa cevaplı soru bulunmaktadır. Lütfen soruları mümkün oldu�unca
cevaplamaya çalı�ınız.
11. Bazı Afrika ülkelerinde, örne�in Etiyopya’da insanlar açlık, hastalık ve ölümle
mücadele etmektedir.
Burada ya�ayan insan populasyonu dengede midir? Dü�üncelerinizi açıklayınız?
204
12. Bir ormanlık alanda türlerin zaman içinde birbirlerinin yerini alarak ormanlık alana
baskın olması söz konusudur.
Ormanlık alanlarda bulunan çimen, çalı ve a�açtan hangisi baskın tür konumundadır?
Neden? Açıklayınız.
13. Bazı dere ve göllerde suyun rengi bulanık görünür, ayrıca bazen buralardan kötü
kokular da çevreye yayılır.
Bunlar neden kaynaklanmaktadır? Bu konuda ne dü�ünüyorsunuz?
14. Bazen TV haberlerinde, bir deniz, göl yada nehirdeki pek çok balı�ın ölmü� olarak
karaya vurdu�unu görmekteyiz. Ayrıca, yetkililer o yöredeki di�er balıkların neslinin de
tehlikede oldu�unu belirtmektedirler.
Bu durumun nedeni ne olabilir?
15. Güzel bir pazar günü pikni�i dönü�ünde, pek çok yerde oraya buraya atılmı� gazete
ka�ıtları, plastik �i�eler, metal içecek kutuları veya meyva sebze artıkları görebiliriz.
Tüm bu artıklar do�ada ne olur? Dü�üncelerinizi belirtiniz.

205
16. II. Dünya sava�ı sırasında atılan atom bombaları ve Çernobil kazası ile ortaya çıkan
radyoaktif maddeler, insanlar ve çevre üzerinde olumsuz etkiler yapmaktadır.
Radyoaktif maddelerin insan ve çevreye olan olumsuz etkisi nasıl olu�ur, kısaca
açıklayınız.
17. Türkiye Erozyonla Mücadele Vakfı (TEMA)’nın söylemlerinden biri de ‘Türkiye Çöl
Olmasın’ dır. Türkiye gerçekten çölle�mekte midir? E�er çölle�mektedir diyorsanız bunun
nedenleri ve sonuçları hakkında ne dü�ünüyor sunuz?

206
APPENDIX C
THE ATTITUDE SCALE TOWARDS BIOLOGY
B�YOLOJ� TUTUM ÖLÇE��
Adı Soyadı :…………………………..Numarası :…………………………..Do�um Tarihi : ………………………….Sınıfı :………………….…….
Açıklama
Bu ölçekte Biyoloji dersine olan tutumu yansıtan cümleler verilmi�tir. Her cümleninkar�ısına tamamen katılıyorum, katılıyorum, kararsızım, katılmıyorum, hiç katılmıyorumolmak üzere be� seçenek verilmi�tir. Her cümleyi dikkatle okuduktan sonra kendinizeuygun seçene�i i�aretleyiniz.
Tam
amen
katıl
ıyor
um
Kat
ılıyo
rum
Kar
arsı
zım
Kat
ılmıy
orum
Hiç
katıl
mıy
orum
1. Biyoloji çok sevdi�im bir alandır. O O O O O
2. Biyoloji ile ilgili kitapları okumaktan ho�lanırım. O O O O O
3. Biyolojinin günlük hayatta çok önemli yeri yoktur. O O O O O
4. Biyoloji ile ilgili ders problemlerini çözmektenho�lanırım. O O O O O
5. Biyoloji konuları ile ilgili daha çok �ey ö�renmekisterim. O O O O O
6. Biyoloji dersine girerken sıkıntı duyarım. O O O O O

207
7. Biyoloji derslerine zevkle girerim. O O O O O
8. Biyoloji dersine ayrılan ders saatinin daha çokolmasını isterim. O O O O O
9. Biyoloji dersine çalı�ırken canım sıkılır. O O O O O
10. Biyoloji konularını ilgilendiren günlük olaylarhakkında daha fazla bilgi edinmek isterim. O O O O O
11. Dü�ünce sistyemimizi geli�tirmede biyoloji ö�retimiönemlidir. O O O O O
12. Biyoloji çevremizdeki do�al olayların daha iyianla�ılmasında önemlidir. O O O O O
13. Dersler içinde biyoloji dersi sevimsiz gelir. O O O O O
14. Biyoloji konuları ile ilgili tartı�maya girmek banacazip gelmez. O O O O O
15. Çalı�ma zamanımın önemli bir kısmını biyolojidersine ayırmak isterim. O O O O O

208
APPENDIX D
THE ATTITUDE SCALE TOWARDS ENVIRONMENT
ÇEVRE TUTUM ÖLÇE��
Bu ölçek sizlerin çevreye yönelik tutumlarınızı belirlemek üzere hazırlanmı�tır. Bu amaçlasizlere çevre ile ilgili çe�itli ifadeler verilmi�tir. Herbir ifadenin kar�ısında TamamenKatılıyorum, Katılıyorum, Kararsızım, Katılmıyorum, ve Hiç Katılmıyorum seçenekleribulunmaktadır. Verilen ifadeye ne derecede katıldı�ınızı, size uygun gelen seçene�e“çarpı” (X) i�areti koyarak belirtiniz. Do�ru seçenek size en uygun seçenektir. Lütfen hercümleyi dikkatle okuyunuz, bo� bırakmamaya özen gösteriniz.
Adı Soyadı :………………………….
Cinsiyeti : ………………………….
Sınıfı :………………………….
Biyoloji Notu : ………………………….
Tam
amen
Kat
ılıyo
rum
Kat
ılıyo
rum
Kar
arsı
zım
Kat
ılmıy
orum
Hiç
Kat
ılmıy
orum
1. Çevre konusunda bir�eyler ö�renmek ho�uma gider. O O O O O
2. Çevre ile ilgili sorunların çözümüne katkıdabulunmak isterim. O O O O O
3. “Çevre korunması” sözünü duymaktan bıktım. O O O O O
4. �nsanın çevre kirlili�inde en önemli faktör oldu�unainanıyorum. O O O O O
5. Çevre konusunda yayımlanan yazıları okurum. O O O O O
6. Çevreye zarar vermeyen ürünleri satın almayı tercihederim. O O O O O
7. Çevre sorunlarının, en önce çözümlenmesi gerekensorunlar oldu�una inanıyorum. O O O O O
8. Plastik �i�ede satılan ürünleri kullanmayı tercihetmem. O O O O O

209
9. Orman yangınları beni çok üzer. O O O O O
10. “Ozon Tabakası” konusu beni ilgilendirmiyor. O O O O O
11. �nsanların attı�ı çöplerin dünyaya zarar vermedi�ineinanıyorum. O O O O O
12. Hava kirlili�inin çevreye zarar verdi�ineinanıyorum. O O O O O
13. Avcılı�ın yasaklanması gereken bir u�ra� oldu�unainanıyorum. O O O O O
14. Do�adaki en önemli sorunun, çevre kirlili�ioldu�una inanıyorum. O O O O O
15. Kullanılmı� gazete ve ka�ıtları geri dönü�ümkutularına atmaya özen gösteririm. O O O O O
16. Çevreye kar�ı daha bilinçli olmam için, okulda çevreile ilgili derslerin daha fazla olmasını isterim. O O O O O
17. Çevre ile ilgili projelerde gönüllü olarak çalı�makisterim. O O O O O
18. Ya�adı�ım yerin yakınlarında bir nükleer santralbulunması beni rahatsız etmez. O O O O O
19. Ormanların azalmasıyla bitkilerin yok edilmesininsadece a�aç kesmek de�il, orada ya�ayan hayvanları vetüm çevreyi yok etmek oldu�una inanırım.
O O O O O
20. Nüfus artı�ının bir çevre sorunu oldu�una inanırım. O O O O O
21. Çevre kirlili�inin do�a için en önemli faktöroldu�una inanırım. O O O O O
22. Biyoloji dersinin ekoloji ve çevre konuları çokilgimi çeker. O O O O O


217
APPENDIX F
THE LIST OF MISUNDERSTANDINGS ABOUT ECOLOGICAL CONCEPTS
USED IN THE CONCEPTUAL CHANGE TEXTS 1-3
KAVRAMSAL DE����M MET�NLER� 1-3’TE KULLANILAN EKOLOJ�
KAVRAMLARI �LE �LG�L� YANLI� ANLAMALAR/KAVRAM
YANILGILARI
B�OT�K AB�YOT�K FAKTÖRLER
Biyotik Abiyotik Faktörler:
• I�ık ve su canlı faktördür, çünkü susuz ya�am olmaz; ı�ıksız bir ortamda
ya�am olmaz; onlar maddenin geli�mesini sa�lar; insanın ya�amı için ı�ık
ve suyun olması gerekir veya ı�ıksız ortamda bitkiler büyüyemez, su
içindeki maddeler canlıları etkiler,
• I�ık cansız ama, su canlı faktördür,
• �klim ve tüketiciler, çevreyi etkileyen canlı faktördür,
• Üretici ve ayrı�tırıcının her ikisi de insan olabilir,
• Üretici ve ayrı�tırıcı faktörler bitki ve hayvan oldu�undan canlıdır.
Tüketiciler:
Tüketiciler yok olunca;
• bir �ey olmaz., ekosistem kendini devam ettirirdi,
• üreticiler üretme görevini yerine getiremezdi,
• tüm a�açlar yok oldu�undan besin üretilmeyecek/besin üretimi olmayacak
böylece pek çok canlı yok olacak/çevredeki (stoktaki) besinler biter. Besin

218
üretimi durdu�u için tüm canlılar ölür/canlıların beslenme �ansı azalacaktı.
Dünya çöl olabilirdi,
• böylece, pek çok canlı yok olacak, oksijen üretimi ve besin yapımı durur,
• üreticiler, üretecekleri gerekli maddeleri bulamazlardı,
• tüketiciler her �ey daha fazla olur,
• iyi olmaz çünkü do�ada bir hayvan ölse bunu tüketiciler yok eder,
• tüm canlılar ölür/ya�am olmazdı.
Ayrı�tırıcılar:
• Ayrı�tırıcılar yok olunca ölen canlılar ayrı�tırılamaz ve ekosistemde zararlı
bakteriler (mikroorganizmalar) ço�alırdı/ekosistem mikroplardan
korunamaz ve çökerdi.• Ayrı�tırıcılar yok olunca,artıklar ve inorganik maddeler ayrı�tırılamaz.
• Ekosistemde ayrı�tırıcılar olarak a�açlar yer alır. Bunlar olmasaydı
canlılar ya�ayamazdı,
• Ayrı�tırma i�leminden ayrı�tırıcılar sorumludur çünkü, onlar besin üretirler
• Ayrı�tırmadan toprak sorumludur. Çünkü, toprak do�al olan her �eyi
ayrı�tırır
• Ayrı�tırmadan toprak sorumludur. Çünkü, toprak vitamin ve minerallerce
zengindir.
Mutualizm:
Mutualizmde;
• Alg ve mantarı her ikisi de yarar görür çünkü; liken kommensal olarak
ya�ar; birisi yarar birisi zarar görür; biri fotosentez biri besin yapar; liken
bir bitkidir oksijen ve besin üretir mantar tüketicidir karbondioksit ve su
üretir,
• Alg mantara parazit ya�ar çünkü, liken alg ve mantara parazir ya�ar; alg
mantarlara kar�ı hazır yiyen canlılardır; mantarlar a�aç ve ye�illik alanda
yeti�ti�i için.

219
Böcekçil (Et yiyen) Bitkiler:
• Bu bitkiler ve böceklerin her ikisi de hem ot hem et yer çünkü her ikisi de
kendi besinini üretemez, heterotroftur.
• Bu bitkiler ve böcekler birlikte ya�adıkları için birbirlerini yiyerek
beslenirler.
• Böcekler, bitkiler üzerinde parazit olarak ya�arlar.
• Böcek, bitkinin üzerine parazit olarak yerle�mi�tir. Bitki de böcekler gibi
böceklerle beslenir.
• Bu bitkiler, hem ototrof hem heterotrofturlar bunlar hem böceklerle hem
de ba�ka bitkilerle beslenir yada besin yapmak için uygun �artlar
olmadı�ında böceklerle beslenirler.
Besin Zinciri:
• Besin zincirindeki bitkiler topraktan besinlerini alır.
• Bitkilerin geli�mek için atmosferik gazlara ihtiyacı vardır.
• Besin zincirinin enerji kayna�ı;
• Me�e a�acı yapraklarıdır,
• Topraktaki minerallerdir,
• Topraktaki sudur.
Besin A�ı:
Bu besin a�ında; (Besin a�ı ile ilgili bir soru ile ilgili olarak)
• ton balı�ı ringa balı�ı ile beslenmez,
• plankton küçük oldu�u için mavi balina küçük plankton balı�ı ile beslenir
ya da besinini çevreden alır,
• erkek balina hem ton balı�ı hem de ringa balı�ı ile beslenir,
• erkek balina otoburdur yani plankton da yiyebilir yada her çe�it canlıyla
beslenebilir,
• erkek balina ton balı�ını yemez çünkü onlar aynı soydan gelir,
• kısa boyunlu martı, yılan balı�ı yanında karadan da beslenir,
• yılan balı�ı kısa boyunlu martı ile beslenir.

220
Enerji Piramidi:
• �kincil tüketiciler, hayvanlar ve insanlardır, bunlar besinlerini üreticilerden
sa�larlar,
• Birincil ve ikincil tüketiciler, besin üretemezler ve besinlerini üreticilerden
sa�larlar,
• �kincil tüketiciler, hem üreticilerden hem de birincil tüketicilerden besin
sa�larlar.
• Piramidin en tepesinde bulunanlar piramidin ilk halkasını olu�turur,
• Piramitte az sayıda canlı çok sayıda madde ayrı�tırabilir bunlar
ayrı�tırıcıdır,
• Üçüncül tüketiciler fazla olursa üreticiler azalır ve denge bozulur.
B�YOLOJ�K ORGAN�ZASYON �LE �LG�L� YANLI� ANLAMALAR/YANLI�
KAVRAMLAR
Biyolojik Organizasyon:
• Biyosfer-Ekosistem-Populasyon-Komünite-Tür
• Biyosfer-Ekosistem-Tür-Komünite-Populasyon
• Biyosfer-Komünite-Populasyon-Ekosistem-Tür
• Biyosfer-Komünite-Populasyon--------------Tür
• Biyosfer-Tür-Populasyon-Komünite-Ekosistem
• Biyosfer-Ekosistem-Populasyon-Komünite-----
• Biyosfer-Komünite-Ekosistem-Populasyon-Tür
• Biyosfer-Populasyon-Komünite-Ekosistem-Tür
• Biyosferekosistem-Komünite-Tür-Populasyon
• Biyosfer-Populasyon-Komünite-Populasyon-Tür
• Biyosfer-Ekosistem-Tür-Populasyon-Komünite
• Biyosfer-Populasyon-Ekosistem-Komünite-Tür
• Biyosfer-Ekosistem-Populasyon-Biyosfer-Tür
• Ekosistem-Populasyon-Tür-Biyosfer-Komünite
• Biyosfer-Ekosistem-Populasyon-Tür-Komünite
• Biyosfer-Komünite-Tür-Populasyon-Ekosistem
221
• Biyosfer-Komünite-Tür-Ekosistem-Populasyon
• Biyosfer-Tür-Komünite-Ekosistem-Populasyon
• Biyosfer-Ekosistem-Ekosistem-Komünite-Tür
• Biyosfer-Tür-Ekosistem-Populasyon-Komünite
Baskın Tür:
• A�aç veya çalı baskındır.
• Çalı baskındır çünkü; çalı çok yeti�ir; çalı, baskındır çünkü; çalı
kendili�inden çıkar. A�acı ekersen çıkar. Ekmedi�inde kendili�inden
çıkmasından emin de�ilim; çalı fazla a�aç dikilmedi�i için ve
a�açlandırma yapılmadı�ı için çimen üzerinde kendili�inden olu�ur; çalı
baskındır çünkü, ormanda göze çarpan çalıdır. A�açlar, yetkililerin
bakması sonucu meydana çıkar.
• Çalı baskındır çünkü, çalının olu�abilmesi için a�aç ve çimenin olu�ması
kadar su gerekmez.
• Çalı baskındır çünkü, tohumsuz üredi�i için her sene kurusada çıkar.
• Çalı baskındır çünkü çalılar yeti�tikçe ve orasını ye�ertmeye ba�ladıkça
a�aç çe�idi artacak ve orman olu�umunda etkili olacaktır.
• Çimen baskındır çünkü, çalılar büyüyor ve a�aç oluyor.
• Çimen baskındır çünkü, önce yosun ve algler sonra çimen, çalı ve en son
olarakta a�açlar meydana gelir.
• Çimen çünkü ormanda en çok çimen bulunur. Çimen daha çok ve sıktır.
Her ormanda çimen vardır; orman olu�turuldu�u için ilk önce a�açlar ve
çalılar azdır yada küçüktür ve çimenler daha çok yer kaplar.• Çimen baskındır çünkü, çimen çalılar a�açların arasında yaygındır.
A�açlar ise di�erlerine göre daha azdır. Çimen yeti�mesi a�aç ve çalıya
göre daha kolaydır (çimen çabuk ürer); çimen baskındır çünkü, bunlar
daha küçük ve ya�amaları kolay oldudu�u için her yerde ya�ayabilirler.
Do�al bir ortamda kendili�inden üreyebilir; çimen miktar olarak fazladır.
Az yer kaplar. Çimen en küçük yerde çakılı gibidir.

222
MADDE DÖNGÜSÜ �LE �LG�L� YANLI� ANLAMALAR/YANLI�
KAVRAMLAR
Karbon Döngüsü:
• Oksijen, fotosentezde kullanılırken, CO2 solunumda kullanılır.
• Solunumda karbon kullanılır ve oksijen verilir/Solunumda oksijen ve
karbondioksit kullanılır.
• Solunumda organik maddeler karbondioksitle parçalanırlar çünkü, enerji,
fotosentez sonuncunda ortaya çıkar.
Oksijen Döngüsü:
• Oksijen, fotosentezde kullanılırken, karbondioksit solunumda kullanılır.
• Solunumda karbon kullanılır ve oksijen verilir/Solunumda oksijen ve
karbondioksit kullanılır.
• Solunumda organik maddedeler karbondioksitle parçalanırlar çünkü,
enerji, fotosentez sonuncunda ortaya çıkar.
Azot Döngüsü:
• Azot döngüsünde baklagiller yer almaz.
• Baklagiller azotu do�rudan kullnabilirler.
• Azot, bezelye, fasulye gibi baklagillerde yer alır.
• Nitrifikasyon bakterileri nitratı nitrite dönü�türürler.
Fosfor Döngüsü:
• Fosforun kayna�ı atmosferdir.
• Fosfor döngüsü karalarda fosforun önce hayvanlar tarafından alınmasıyla
ba�lar.
• Fosfor döngüsü denizlerde fosforun bitkiler tarafından alınmasıyla ba�lar.

223
ÇEVRESEL K�RL�L�K �LE �LG�L� YANLI� ANLAMALAR/YANLI�
KAVRAMLAR
Su Kirlili�i:
• Balıkların ölmesinin nedeni deniz kirletilerek balıkların fotosentez
olaylarının gerçekle�memesidir.
• Hiç TV’de böyle bir �ey görmedim. Görsemde inanmam.
Toprak Kirlili�i:
• Do�a bunları yok eder; bunlar kendi kendilerine yok olabilirler.
• Hepsi ayrı�tırıcılarla ayrı�tırılırlar.
• Do�ada yok olmaz öylece yüzyıllarca dururlar;
• Do�a bu artıkları parçalayamaz.
• Plastikler do�ada yok olmaz çevre kirlili�ine yol açarlar; Plastik �i�eler,
naylon po�etler veya metal kutular ayrı�tırılmadan toprakta durular.
• Metal kutuların do�ada kendili�inden yok olması yüzyıllar sürer.
• Hepsi ayrı�tırıcılarla ayrı�tırılırlar.
• Meyve sebze artıkları (belki) do�ada yok olabilir.
• Topra�ın bunları yok etmesi uzun sürer.
• Meyve sebze artıkları kısa sürede topra�a karı�tı�ından tehlikeli de�ildir.
• Plastikler metal kutular yok olmazlar bunlar geri dönü�ümle
de�erlendirilebilirler.
• Plastik �i�eler ve metal kutular do�aya tekrar geri dönmezler.
• Toprak tarafından ayrı�tırılırlar.
• Toprak altına girer ve canlılara zarar verir.
• Çürür ve mikroplar kötü kokulara sebeb olur.
• Ka�ıtlar, gazeteler blli bir süre sonra yok olabilirler ama cam parçalar,
metal kutular ve naylonlar yok olmazlar.
Erozyon:
• Orman yangınları, ozon tabakasının incelmesi ve etkisini
sürdürememesinden kaynaklanmaktadır.

224
APPENDIX G
THE SAMPLES OF THE CONCEPTUAL CHANGE TEXT-1 AND
WORKSHEETS 1-5
KAVRAMSAL DE����M METN� 1 VE ÇALI�MA KA�ITLARI 1-5
YÖNERGE
Bilimsel ara�tırmalar, ö�rencilerin kafasında okula gelmeden önce kavramlar hakkında
bazı fikirlerin olu�tu�unu göstermektedir. Bu kavramların bazıları do�ru, bazıları ise
yanlı�lıklar içerebilmektedir. Ö�rencilerin kendilerinin edindi�i ve bilimsel gerçeklere
uygunluk göstermeyen fikirleri yanlı� kavramlara yol açar. Bunlara “kavram yanılgısı”
denilmektedir. Ö�rencilerde olu�an bu kavram yanılgılarının giderilmesi için önerilen
yöntemlerden birisi de derslerde “Kavramsal De�i�im Metinlerinin” kullanılmasıdır. Bu
nedenle, Ekoloji “Dünya ve Çevre Ortamı” ünitesinin ö�retimi sırasında, sizlerde de
varolabilecek bazı kavram yanılgılarının giderilmesine yönelik olarak bu ünite ile ilgili üç
kavramsal de�i�im metini hazırlanmı�tır. Bunlar, 1. Canlılar ve çevre, 2. Madde
döngüleri, populasyon ve biyosferdeki ya�ama birlikleri ve 3. Çevre kirlili�idir. Her bir
kavram de�i�tirme metninde; önce sizlere sorular yöneltilmi�, ardından varsa bazı
ö�rencilerin konu ile ilgili kavram yanılgıları verilmi�, daha sonra tartı�ma bölümlerine
geçilmi� ve son olarak ta ilk ba�ta verilen sorularla ilgili cevaplar verilmi�tir. Kavramsal
de�i�im metinlerinin amacına ula�ması için sizden beklenen, metinlerde verilen her bir
sorunun cevabını dü�ündükten sonra, size verilen metindeki ilgili tüm açıklamaları
okumanız ve tartı�ma bölümlerini uygulamanızdır. Daha sonra da, sorunun cevabını
tekrar dü�ünrek bunu ilk cevabınızla kar�ıla�tırarak do�ru cevaba karar vermenizdir.

225
KAVRAMSAL DE����M METN� 1. CANLILAR VE ÇEVRE
Soru 1. Çevrenin canlı ve cansız etmenleri nelerdir?
Canlı ve cansızlar arasında kesin bir ayrım yapmak zordur. Varlıkları neye göre
canlı ve cansız diye sınıflandırırız? Toprak üzerinde duran bir ta� parçası ve bir
böce�e bakıp biri hareket ediyor di�eri hareket etmiyor diye dü�ünüp, hareket
eden böce�e canlı, hareket etmeyen ta�a da cansız mı deriz? Canlı varlıklar,
canlılarla oldu�u kadar çevrelerindeki cansız varlıklarla da ileti�im halindedirler.
TARTI�MA: Canlı ve cansız konusunu daha iyi kavrayabilmek için Çalı�ma
Yapra�ı 1’i inceleyelim. Bakınız Çalı�ma Yapra�ı 1. “Canlı ve Cansız Çevremiz”.
Ekoloji, canlıların birbirleriyle ve cansız çevreleriyle olan ili�kisini
inceleyen bilim dalıdır. Ekoloji, biyolojinin alt dallarından biridir.
Do�ada ya�am belirtileri gösteren, do�an, büyüyen, hareket eden, solunum yapan,
tepki veren, beslenen, üreyen, iç dengesi (homeostasis) olan, ölen vb. faaliyetler
gösteren varlıklara canlı, bu özellikleri göstermeyen varlıklara da cansız
diyebiliriz. Bu canlı bireyin ya�amını sürdürdü�ü dı� ortama çevre diyebiliriz.
Do�ada canlılar ve onların etrafındaki cansızlar ileti�im halindedir.
Soru 2. Bir canlı organizmayı etkileyen di�er canlı ve cansız faktörler nelerdir?
Bazı ö�renciler, çevrenin canlı ve cansız etmenleri soruldu�unda �u �ekilde
dü�ünmektedirler:
� ı�ık ve su canlı faktördür, çünkü susuz ya�am olmaz; ı�ıksız bir ortamda
ya�am olmaz; onlar maddenin geli�mesini sa�lar; insanın ya�amı için ı�ık ve
suyun olması gerekir veya ı�ıksız ortamda bitkiler büyüyemez, su içindeki
maddeler canlıları etkiler,
� ı�ık cansız ama, su canlı faktördür,
� iklim ve tüketiciler, çevreyi etkileyen canlı faktördür,
� üretici ve ayrı�tırıcının her ikisi de insan olabilir,
� üretici ve ayrı�tırıcı faktörler bitki ve hayvan oldu�undan canlıdır.
�

226
Tüm bu ö�rencilerin dü�ünceleri yanlı�tır.
TARTI�MA: Bu konuda açıklama yapmadan önce yine Çalı�ma Yapra�ı 1’e
bakalım. Bakınız Çalı�ma yapra�ı 1. “Canlı ve Cansız Çevremiz”.
�imdi yukarıda örnek verilen ö�rencilere ait fikirlerdeki yanlı� yerleri bulmaya
çalı�alım.
Canlı organizmalarla cansız etmenler bir arada bulunurlar. Bunların bir
arada bulundu�u sisteme ekosistem denir. Bir ekosistemdeki canlı ve
cansız etmenler arasında nasıl bir ili�ki vardır? Canlı organizmalar, birbirleriyle ve
aynı zamanda ya�adıkları ortamla etkile�im halindedirler. Her organizmanın
kendine özgü bir ya�am çevresi vardır. Nasıl biz tuzlu su içemezsek, tatlı su
balı�ının da tuzlu sularda ya�aması zordur. Çünkü tatlı su balı�ının ekosistemi
tatlı suların bulundu�u göl ve nehirlerdir. Ancak, bazı organizmalar belirli çevre
ko�ullarında daha iyi ya�ama ve daha iyi uyum sa�lama yetene�ine sahiptirler.
Buna da, adaptasyon (ortama uyum yetene�i) denir. Bazı canlıların adaptasyon
yetene�i yüksek, bazılarınınki de dü�ük olabilmektedir.
Canlıları, ya�adıkları ortamda etkileyen di�er canlılara çevrenin canlı
(biyotik) faktörleri denir. Bunlar, üreticiler, tüketiciler ve ayrı�tırıcılar
olarak üçe ayrılır. Biz canlıları daha sonra canlıların beslenmesi ile ilgili kısımda
detaylı olarak görece�iz. Canlıları ya�adıkları çevrede etkileyen canlı olmayan
varlıklara da çevrenin cansız (abiyotik) faktörleri denir. Cansız faktörleri biz altı
grupta toplayabiliriz: ı�ık, sıcaklık, iklim, toprak ve mineral maddeler, su ve pH.
� Bazı ö�renciler iklim, ı�ık, ve su için canlı demektedirler ancak, bunlar
görülece�i gibi cansız faktörlerdir. Ayrıca, üreticiler fotosentez yapar. Ancak,
insan fotosentez yapamaz bu nedenle insan üretici de�ildir. Hayvanlar ve insanlar
besinlerini dı�ardan hazır alırlar, yani tüketicidirler ve ayrı�tırıcı de�ildirler.
Ayrı�tırıcılar, bazı bakteri ve mantarlardan olu�ur. Bunlar, ölmü� bitki, hayvan ve
insanları ayrı�tırırlar.
�
�

227
Soru 3. Canlılarda besleme �ekilleri nelerdir?
Ö�rencilere bir ormanlık alandaki ekosistemde bulunan üretici, tüketici ve
ayrı�tırıcılarla ilgili bir soru soruldu�unda ö�rencilerin üreticiler ile ilgili fazla
yanlı� kavramlara sahip olmadıkları gözlenmi�tir. Ama, bunun yanında
ö�rencilerin tüketici ve ayrı�tırıcı ile ilgili bazı kavram yanılgılarına sahip
oldukları tespit edilmi�tir.
Bazı ö�renciler, tüketicilerle ilgili olarak �unları söylemektedirler:
Tüketiciler yok olunca;
� bir �ey olmaz., ekosistem kendini devam ettirirdi,
� üreticiler üretme görevini yerine getiremezdi,
� tüm a�açlar yok oldu�undan besin üretilmeyecek/besin üretimi olmayacak
böylece pek çok canlı yok olacak/çevredeki (stoktaki) besinler biter. Besin üretimi
durdu�u için tüm canlılar ölür/canlıların beslenme �ansı azalacaktı. Dünya çöl
olabilirdi,
� böylece, pek çok canlı yok olacak, oksijen üretimi ve besin yapımı durur,
� üreticiler, üretecekleri gerekli maddeleri bulamazlardı,
tüketiciler her �ey daha fazla olur,
� iyi olmaz çünkü do�ada bir hayvan ölse bunu tüketiciler yok eder,
� tüm canlılar ölür/ya�am olmazdı.
Bazı ö�renciler de, ayrı�tırıcılarla ilgili olarak �unları söylemektedirler:
� Ayrı�tırıcılar yok olunca, ölen canlılar ayrı�tırılamaz ve ekosistemde zararlı
bakteriler (mikroorganizmalar) ço�alırdı/ekosistem mikroplardan korunamaz ve
çökerdi.
� Ayrı�tırıcılar yok olunca , artıklar ve inorganik maddeler ayrı�tırılamaz.
� Ekosistemde ayrı�tırıcılar olarak a�açlar yer alır. Bunlar olmasaydı canlılar
ya�ayamazdı,
� Ayrı�tırma i�leminden ayrı�tırıcılar sorumludur çünkü, onlar besin üretirler
� Ayrı�tırmadan toprak sorumludur. Çünkü, toprak do�al olan her �eyi ayrı�tırır

228
� Ayrı�tırmadan toprak sorumludur. Çünkü, toprak vitamin ve minerallerce
zengindir.
Tüm bu ö�rencilerin tüketiciler ve ayrı�tırıcılarla ilgili belirttikleri dü�ünceler
yanlı�tır. Peki yanlı�lık nerededir?
TARTI�MA: Önce bu konu ile ilgili bir çalı�ma yapalım. Bakınız
Çalı�maYapra�ı 2.“Canlılarda Beslenme”.
Bir ekosistemde canlıların (üretici, tüketici ve ayrı�tırıcılar) yanında
onların içinde bulundu�u cansız çevreleri de vardır. Canlılar, ya�amlarını
devam ettirebilmek, enerji ve yapı maddelerini sa�layabilmek için beslenmek
zorundadırlar. Canlılar arasında bir beslenme ili�kisi vardır. Canlıları beslenme
ili�kileri bakımından iki ana grupta toplayabiliriz: Üreticiler ve tüketiciler.
Üreticiler (ototroflar), kendi besinlerini fotosentez yoluyla kendileri
üretirler. Örne�in, bitkiler üretici canlılardır. Üreticiler, ürettikleri
besinin bir kısmını bitkinin hayatını devam ettirmesi için kullanılırken, bir kısmını
da ni�asta olarak depo ederler. Ototrof canlılar, fotosentetik ototrof ve
kemosentetik ototrof olarak ikiye ayırabiliriz. E�er ototrof bir canlı, güne� enerjisi
kullanarak fotosentezle kendi besinlerini sentezlerse buna fotosentetik ototrof
canlı denir. Bitkiler ve bazı bakteriler bu gruba girerler. Bazı canlılar da, kendi
besinlerini güne� enerjisi yerine kimyasal enerji kullanarak sentezlerler. Buna,
kemosentez denir. Bunu yapan canlılara, kemosentetik ototrof canlılar denir.
Örne�in nitrit ve nitrat bakterileri kemosentez yaparlar.
Tüketiciler (heteretroflar) ise, kendi besinini yapamayan,. do�rudan ya
da dolaylı yollardan besinini dı�ardan hazır alan canlılardır. Örne�in,
protistalar, hayvanlar, insanlar ile mantarların ve bakterilerin bir kısmı besinlerini
hazır alırlar. Heterotroflar, beslenmeleri açısından üç grupta toplanabilir:
Holozoik beslenme, saprofit ya�am ve ortak ya�am (simbiyoz ya�am). Holozoik
beslenen canlılar, besinlerini katı parçalar halinde alırlar. Holozoik beslenen
hayvanlar üçe ayrılır: otçul hayvanlar, etçil hayvanlar, ve hem otçul hem etçil
hayvanlar. Bazı hayvanlar, fotosentez yapan bitkilerle beslenirler. Kısaca, ot ile
beslenen hayvanlara otçul (otobur, herbivor) hayvan denir. Örne�in koyun, keçi,
�
�
�

229
inek, geyik, böcekler ve tav�an gibi. Etçiller (etoburlar; karnivorlar) ise, etle
beslenen hayvanlardır. Bunlar otla beslenen ya da etle beslenen hayvanları
avlayarak besinlerini sa�larlar. Örne�in aslan, kartal, tilki, bayku�, yılan ve timsah
gibi. Bazı hayvanlar ise hem ot hem de etle beslenirler ve bunlara hem etçil hem
otçul (hem otobur hem etobur; omnivor) hayvan denir. Bu tür beslenen canlılara
insan, ayı ve balık örnek olarak verilebilir.
� Bazı ö�renciler, “Tüketiciler yok olunca bir �ey olmaz., ekosistem kendini
devam ettirirdi” demektedirler. Ancak, bu ifade yanlı�tır. Aslında, tüketiciler yok
olunca ekosistemin i�leyi�i de bozulacaktır. Yine, bazı ö�renciler “Tüketiciler yok
olursa dünyanın dengesi bozulur, tüm canlılar ölür/ya�am olmazdı” demi�lerdir.
Burada dünyanın dengesi bozulur kısmı do�rudur. Ancak, tüketiciler olmadan
üreticiler ve ayrı�tırıcılar uzunca bir süre daha ya�amaya devam ederler. Çünkü,
tüketicilerin yok olması ile canlıların beslenme �ansı azalmayacaktır. Canlıları,
üretici, tüketici ve ayrı�tırıcı olarak sınıflandırmı�tık. Tüketiciler yok oldu�unda,
bitkiler fotosentez yapmaya ve ayrı�tırıcılar da ölen bitkileri ayrı�tırmaya devam
edecektir. �ki canlı da uzunca bir süre ölmeyecektir. Ayrıca, tüketiciler bitkileri
tüketmedi�inden besin fazlalılı�ı olacak ve çölle�me olmayacaktır. Kısaca,
üretilenler tüketilmeyecek ve dünyada a�ırı besin artı�ı olacaktır. Üretimin fazla
olmasıyla ayrı�tırma i�lemi bu hıza yeti�emeyecek ve yeni bitkilerin büyümesi
için yer problemi olacaktır. Sonunda ekosistemin, dünyanın dengesi giderek
bozulacaktır.
� Yukarıdaki açıklamalar ı�ı�ı altında bazı ö�rencilerin belirtti�i “Tüketiciler
yok olunca tüm a�açlar yok oldu�undan besin üretilmeyecek/besin üretimi
olmayacak böylece pek çok canlı yok olacak/çevredeki (stoktaki) besinler biter.
Besin üretimi durdu�u için tüm canlılar ölür/canlıların beslenme �ansı azalacaktı.
Dünya çöl olabilirdi/böylece, pek çok canlı yok olacak, oksijen üretimi ve besin
yapımı durur” ifadelerinin de yanlı� oldu�u görülmektedir. Bazı ö�renciler
“Tüketiciler yok oldu�unda, tüketiciler her �ey daha fazla olur” demektedirler. Bu
ifade yanlı�tır. Tüketiciler yok olunca, tüketicilerin fazla olması söz konusu
olamaz.
230
� Di�er taraftan, tüketiciler ayrı�tırıcı olmadıkları için “Tüketiciler yok olunca
iyi olmaz çünkü do�ada bir hayvan ölse bunu tüketiciler yok eder” ve “Tüketiciler
yok oldu�unda, üreticiler üretecekleri gerekli maddeleri bulamazlardı” cümleleri
de yanlı�tır. Do�ada ölen canlılar ayrı�tırıcılar tarafından parçalanırlar, bunu
tüketiciler yapamazlar. Ölü organizmaladaki inorganik maddele ayrı�tırılınca
inorganik madeler haline dönü�ürler. Bunlar da yine ba�ka bitlier tarafından
kullanılırlar.
� Bunların dı�ında yukarıdaki ö�rencilerin ayrı�tırıcılar hakkında da kavram
yanılgıları oldu�unu belirtmi�tik. Örne�in, bazı ö�renciler, a�açların, ekosistemde
ayrı�tırıcı oldu�unu söylemektedirler.Bu dü�ünce yanlı�tır çünkü, a�açlar
üreticidirler. Bazı ö�renciler, ayrı�tırma i�leminden toprak sorumludur
demektedirler. Bu yanlı�tır çünkü, bundan ayrı�tırıcı canlılar sorumludur. Bazı
ö�renciler de “Ayrı�tırma i�leminden ayrı�tırıcılar sorumludur çünkü, onlar besin
üretirler” demektedirler. Bu ifade tam olarak do�ru de�ildir. Ayrı�tırma i�lemi
ayrı�tırıcılar tarafından gerçekle�tirilir ancak, ayrı�tırıcılar besin üretmezler, bunu
üreticiler yapar.
Aslında, ayrı�tırıcılar beslenme bakımından kendi besinlerini yapamazlar
ve dı�ardan hazır olarak alırlar yani bunlar tüketici organizmalardır.
Ayrı�tırıcılara, saprofitler veya çürükçül canlılar da denilmektedir. Ayrı�tırıcılara
örnek olarak bazı bakteriler, küf mantarları ve �apkalı mantarlar verilebilir.
Saprofitler, azotlu ve karbonlu besin ihtiyaçlarını, ölen organizmalardan veya
canlı artık ve salgılarından sa�larlar. Bazı ö�rencilerin belirtti�i ayrı�tırıcılar yok
olunca, artıklar ve inorganik maddelere ayrı�tırılamaz cümlesi yanlı�tır. Çünkü,
ölü canlılardaki organik maddeler inorganik maddelere parçalanıp, ayrı�arak
topra�a karı�ır. Ayrıca, topraktaki madensel tuz oranı da artmı� olur. Böylece ölü
bitkilerdeki organik maddeler inorganik hale dönü�mü� olur. �norganik maddeler
de, tekrar ba�ka bitkilerce kullanılabilirler. Böylece, bitkiler üretecekleri inorganik
maddeleri bulurlar. �norganik maddeler de, tekrar ba�ka bitkilerce kullanılabilirler.
Ayrı�tırma i�leminde saprofitler, önce salgıladıkları enzimlerle besinleri
sindirir, canlı artıklarını parçalarlar ve suda çözünen küçük molekülleri
�
�

231
emerek beslenirler ve daha sonra ve vücutlarına bunları dahil ederler. Bu �ekildeki
beslenmeye saprofit (çürükçül) beslenme denir. Kısaca, çürükçül canlılar, ölü
organizmaları do�adan temizleyerek aynı zamanda kendilerine besin elde ederler.
� Bazı ö�renciler, “Ayrı�tırıcılar yok olunca, ölen canlılar ayrı�tırılamaz ve
ekosistemde zararlı bakteriler (mikroorganizmalar) ço�alırdı/ekosistem
mikroplardan korunamaz ve çökerdi” demektedirler. Bu da do�ru de�ildir. Çünkü,
bazı mikroorganizmalar ayrı�tırıcıdır, ayrı�tırıcılar yok olunca da bu
mikroorganizmalarda (mikroplarda) yok olacaktır. Bu nedenle, ekosistemde
mikroplar ço�almayacak, mikroplar yok olacaktır. Ancak, burada ekosistem
çökerdi cümlesi do�rudur. Çünkü, ortamda sadece üretici ve tüketici kalacaktır.
Üreticiler, besin üretince bunları tüketiciler tüketecek, ama ölü organizmalar
ayrı�mayacak ve bunlar ortamda birikecektir. Ayrı�ma olmayınca da bitkilerin
büyümesi için gerekli inorganik maddeler ortamda olmayacak ve bitkiler yeterince
geli�emeyecek. Bir süre sonra da ekosistem çökecektir.
Soru 4. Canlılarda ortak ya�am nasıl olmaktadır?
Ö�rencilere mutualizm ilgili soru soruldu�unda bazı yanlı� kavramlara sahip
oldukları gözlenmi�tir. Bunlardan bazıları �öyledir:
Bu ya�am �eklinde;
� Alg ve mantarı her ikisi de yarar görür çünkü; liken kommensal olarak ya�ar;
birisi yarar birisi zarar görür; biri fotosentez biri besin yapar; liken bir bitkidir
oksijen ve besin üretir mantar tüketicidir karbondioksit ve su üretir,
� Alg mantara parazit ya�ar çünkü, liken alg ve mantara parazir ya�ar; alg
mantarlara kar�ı hazır yiyen canlılardır; mantarlar a�aç ve ye�illik alanda yeti�ti�i
için.
Tüm bu ö�rencilerin dü�ünceleri yanlı�tır. Yanlı�lıkları bulmadan önce ortak
ya�amla ilgili bir tartı�ma yapalım.
TARTI�MA: Bakınız Çalı�ma yapra�ı 3. “Ortak Ya�am”.

232
Bazı canlılar ya�amak için bir di�er canlı organizmaya ihtiyaç
duyabilirler. Ya�amak için iki canlı birlikteli�inde canlılar arasında
pozitif veya negatif ili�kiler de bulunabilir. �ki canlının birlikteli�ine simbiyoz
ya�am (ortak ya�am) denir. Bunlardan en yaygın olarak bilinenleri: mutualizm,
kommensalizm ve parasitizmdir.
Mutualizmde, birlikte ya�ayan canlıların her ikisi de bu ortaklıktan fayda
sa�lar (++). Ancak, bu iki canlıdan biri di�eri olmadan ya�ayamaz.
Örne�in likenler bu gruba girerler. Di�er bir oratk ya�am �ekli kommansalizmdir.
Beraber ya�ayan iki canlıdan biri, bu birliktelikten fayda yada zarar görmez di�eri
ise fayda görürse böyle beslenme ili�kisine kommensalizm (+0) denir. Örne�in,
köpek balı�ının etrafından dola�an ve onun artıklarıyla beslenen küçük balıklar
kommensal olarak ya�arlar. Di�er taraftan, e�er bir canlı ya�amak için sürekli
di�erini besin kayna�ı olarak kullanıyor ve bundan fayda sa�lıyorsa bu canlıya
parazit canlı denir. Böyle bir beslenme ili�kisine de parazitizim (asalak ya�am)
denir. Parazit olan canlının sindirim enzimleri iyi geli�memi�tir. Bu nedenle
parazit canlı, di�er bir canlıdan beslenirken ona zarar verm� olur. Örne�in,
hayvanlar ve insanda hastalık yapan bakteriler parazittir. Parazitler, vücut içinde
ve vücut dı�ında ya�amalarına göre ikiye ayrılırlar: iç parazit (endoparazit) ve dı�
parazit (ektoparazit). Örne�in, ba�ırsak solucanı, tenya, kıl kurdu ve bazı
bakteriler iç parazittken, sivrisinek, bit, pire, kene ve tahta kurusu ise dı�
parazittir. Bakınız Resim 1. Bakteri (�ç parazit) ve Sivrisinek (Dı� parazit). Bazı
bitkiler de parazit olarak ya�ar ve üzerinde ya�adıkları bitkilere de zarar verirler.
Örne�in klorofili olmayan ökse otu, cin saçı, yılan yastı�ı gibi bitkiler, üzerinde
ya�adıkları bitkilerin iletim demetlerine köksü yapılar uzatır ve buradan
beslenirler.
�
�

233
� Ö�rencilere ortak ya�amla ilgili bir liken sorusu soruldu�unda ö�rencilerin
yanlı� ifadelerde bulundu�unu belirtmi�tik. Bu soru mutualizm (kar�ılıklı yarar)
ile ilgilidir. Bazı ö�renciler algler mantara parazit ya�ar. Çünkü liken, alg ve
mantara parazit ya�ar demektedir. Ancak, likenler parazit ya�amazlar onlarda
mutualizm görülür. Yine, bazı ö�renciler alg mantara parazit ya�ar çünkü alg
mantarlara kar�ı hazır yiyen canlılardır demektedirler. Bu da yanlı� bir ifadedir.
Çünkü, alg üreticidir besinini kendi yapar hazır yer cümlesi tüketiciler için
kullanılabilir. Yine bazı ö�renciler algler mantara parazit ya�ar çünkü mantarlar
a�aç ve ye�illik alanda yeti�ti�i için demektedirler. Bu da yanlı�tır zaten, liken
mikroskobik yapıdaki alg ve mantarları içerir. Bunlardaki alg ve mantar gözle
görülmez. Likenler, mutualizme örnektirler. Likenler, alg ve mantarlardan olu�an
bir bitki grubudur. Alg ve mantar bir arada bulunur, bunların etrafı mantardan
olu�an bir kabuk tabakasıyla sarılmı�tır. Likenler, alg ve mantardan morfolojik,
fiziksel ve kimyasal açıdan farklılık gösterirler. Liken birli�inde, mantarın
klorofili yoktur ve fotosentez yapamaz. Mantar, algi yo�un güne� ı�ı�ı ve
kurumadan korurlar ayrıca, alge gerekli su ve mineral maddeleri sa�larlar. Alg de,
mantara fotosentezle olu�an besin sa�lar.
� Bazı ö�renciler ise, liken ya�am birli�inde, alg ve mantarın her ikisinin de
yarar gördü�ünü söylemeleri do�rudur. Ancak, bu ö�rencilerin açıklamaları
Resim 1. Bakteri (�ç parazit) ve Sivrisinek (Dı� parazit)

234
yanlı�tır. Örne�in, bununla ilgili açıklamalardan birinde likenin kommensal olarak
ya�adı�ı belirtilmi�tir, ancak, likenler mutualizme örnektir. Di�er bir açıklamada
liken birli�inde, birisi yarar birisi zarar görür denilmektedir, ancak bu birliktelikte
alg ve mantar da yarar görür. Ba�ka bir açıklamada bazı ö�renciler, biri fotosentez
biri besin yapar demektedirler. Ancak, fotosentez sonucunda besin üretilir ve bunu
da alg yapar, mantar ondan besin alır. Yine bununla ilgili açıklamada,
ö�rencilerden bazıları liken bir bitkidir oksijen ve besin üretir mantar tüketicidir
karbondioksit ve su üretir demektedirler. Burada algin rolü verilmemi�tir. Belki
de, ö�renciler liken ve mantarı birlikte ortak ya�ayan canlılar olarak
dü�ünmektedirler. Ancak, alg ve mantar ortak ya�ayarak liken denilen canlıyı
olu�tururlar.
Öte yandan, ö�rencilere bitkilerin böceklerle beslenmeleri hakkında bir soru
soruldu�unda, onların bazı yanlı� kavramalara sahip oldukları gözlenmi�tir.
Bunlardan bazıları �öyledir:
� Bitkiler ve böceklerin her ikisi de hem ot hem et yer çünkü her ikisi de kendi
besinini üretemez, heterotroftur.
� Bu bitkiler ve böcekler birlikte ya�adıkları için birbirlerini yiyerek beslenirler.
� Böcekler, bitkiler üzerinde parazit olarak ya�arlar.
� Böcek, bitkinin üzerine parazit olarak yerle�mi�tir. Bitki de böcekler gibi
böceklerle beslenir.
� Bu bitkiler hem ototrof hem heterotrofturlar bunlar hem böceklerle hem de
ba�ka bitkilerle beslenir yada besin yapmak için uygun �artlar olmadı�ında
böceklerle beslenirler demektedirler.
Bu dü�üncelerin hepsi yanlı�tır.
Do�ada bazı canlılar vardır ki buları beslenme bakımından
sınıflandırmak zordur. Bitki (üretici; ototrof) olup aynı zamanda
böcekleri sindirebilen canlılar vardır (tüketici; heterotrof). Bunlara hem üretici
hem tüketici canlılar denir. Bunlara böcek yiyen veya böcekçil bitkiler denir.
�

235
Gerçektende bir bitki böcek yer mi diyebilirsiniz? Bunlar arasında
parazit ya�am yoktur veya bunlar birbirlerini yiyerek beslenmezler.
Böcekler heterotrofturlar ancak, bu bitkiler ye�il yaprakları ile fotosentez
yaptıklerı için hem üreticdirler (ototrofturlar) hem de böceklerle beslendiklerinden
heterotrofturlar. Yani, azot bakımından fakir yerlerde yeti�tikleri için bitki azot
ihtiyacını kar�ılamak için böcek yer. �brik otu ve Sinekkapan bu tip bitkilerdir.
�brik otu’nun yaprakları ibrik �eklinde ve Sinekkapan’ın yaprakları da kapan
�eklindedir. Bu bitkiler renk ve kokularıyla böcekleri çeker. Bu yapraklara böcek
de�di�inde yapraklar uyarılıp kapanır ve böcek içerde kalır. Bitkinin tuza�ına
dü�en böcek, bitkinin salgıladı�ı enzimle ölür ve bitki hücresi içine alınmadan
yaprakta sindirilir. Daha donra böcekten elde edilen amino asitler, bitki
hücrelerine alınır ve kullanılır. Bakınız Resim 2. Sinekkapan bitkisi.
Soru 5. Besin zinciri ve besin a�ı nedir?
� Ö�rencilere, besin zincirindeki bitkiler neyle beslenir diye soruldu�unda pek
ço�u bitkiler, topraktan besinlerini alır demi�lerdir. Az sayıda ö�renci bitkilerin
geli�mek için atmosferik gazlara ihtiyacı oldu�unu belirtmi�, ancak hiç bir ö�renci
bitki geli�mesi için bu gazların kaynak olarak rol oynadı�ını belirtmemi�tir.
Ö�rencilere “Besin zincirinin kayna�ı nedir?” diye soruldu�unda ise, bazı
ö�rencilerin �u yanlı� kavramalara sahip oldu�u gözlenmi�tir:
�
Resim 2. Sinekkapan bitkisi
236
Besin zincirinin enerji kayna�ı;
� me�e a�acı yapraklarıdır,
� topraktaki minerallerdir,
� topraktaki sudur.
TARTI�MA: �imdi gelin bu konuyu daha iyi anlamak için bir besin zincirini
tartı�alım. Bakınız Çalı�ma yapra�ı .4 “Besin Zinciri”.
Yeryüzündeki canlılar arasında beslenme ili�kileri vardır. Canlılar
arasındaki zincir �eklindeki besin ili�kisine besin zinciri denilebilir.
Canlılar arasındaki bu ili�kiler, bir halkadan di�erine sürekli olarak devam eder.
Besin zincirinin kayna�ı güne�tir. Bitkilerin fotosentezle besin maddelerinde
depoladı�ı enerji besin zinciri ile di�er organizmalara aktarılır. Karada ya�ayan
üreticiler (bitkiler) güne� ı�ınlarıyla, havadaki karbondioksitle ve kökleriyle
aldıkları suyla fotosentez yaparlar. Sonuçta organik maddeler (besin) ve oksijen
açı�a çıkar. Böylece, karalarda besin zinciri bitkilerle (çimen ve a�aç gibi) ba�lar.
Ye�il bitkilerin üretmi� oldu�u besin maddesi di�er canlılar tarafından yenir ve
enerji di�er canlılara geçmi� olur. Karada bitkilerle yani üreticilerle ba�layan bu
besin zinciri, bu bitkilerle beslenen hayvanlarla yani birincil tüketicilerle devam
eder. Daha sonra, etçil hayvanlar (ikincil tüketiciler) otla beslen hayvanları yer
yani etçiller otçullarla beslenir. Üçüncül tüketiciler de, ikincil tüketicilerle
beslenirler. Kısaca, bir besin zincirinde üreticiler, tüketiciler ve ayrı�tırıcılar
bulunur.
Üreticiler � Birincil tüketiciler� �kincil tüketiciler � Üçüncül tüketiciler �
Ayrı�tırıcılar
� Di�er taraftan ö�rencilere bir kara ekosistemindeki besin a�ı soruldu�unda
ö�rencilerde bazı yanlı� kavramalara rastlanmı�tır. Çocuklardan bazıları besin
a�ındaki okların yönünü ters yorumlamı�tır. Bu oklar, besin a�ındaki canlıların
beslenme yönlerini gösterir. Bu besin a�ına göre, yılanlar farelerle
�

237
beslenmektedir. Çocuklara “Bu besin a�ındaki yılanlar azalırsa ne olaca�ını
beklersiniz?” diye soruldu�unda, bazı çocuklar fare populasyonu dü�er derken,
bazıları fare populasyonu aynı kalır demi�lerdir. Bu ifade yanlı�tır. Çünkü yılanlar
azalırsa fareler tüketilmeyee�inden sayıca artar yani fare populasyonu artacaktır.
Daha önce, bir ekosistemdeki beslenme ili�kilerini anlamak için besin
zincirini gördük. Besin zinciri bir yöndeki ili�kiler �eklinde gösterilir.
Ancak, do�ada ili�kiler karma�ıktır. Ekosistemde besin ili�kileri bir çok besin
zincirinin bir araya gelmesiyle daha karma�ık olur. Birden fazla besin zincirinin
bulundu�u beslenme ili�kilerine besin a�ı denir.
Ö�rencilere bir su ekosistemindeki besin a�ı ile ilgili bir soru soruldu�unda,
onlarda verilen besin a�ı �eklini yorumlamada bazı problemler belirlenmi�tir .
Bunlardan bazıları �öyledir:
Bu besin a�ında;
� ton balı�ı ringa balı�ı ile beslenmez,
� plankton küçük oldu�u için mavi balina küçük plankton balı�ı ile beslenir ya
da besinini çevreden alır,
� erkek balina hem ton balı�ı hem de ringa balı�ı ile beslenir,
� erkek balina otoburdur yani plankton da yiyebilir yada her çe�it canlıyla
beslenebilir,
� erkek balina ton balı�ını yemez çünkü onlar aynı soydan gelir,
� kısa boyunlu martı, yılan balı�ı yanında karadan da beslenir,
� yılan balı�ı kısa boyunlu martı ile beslenir.
Tüm bu ö�rencilerin dü�ünceleri yanlı�tır.
TARTI�MA: �imdi bir kara ekosistemindeki besin a�ı ile ilgili bir çalı�ma
yapalım. Bakınız Çalı�ma yapra�ı 5. “Besin A�ı ve Enerji Piramidi”.
Su ekosistemini ele alırsak, burada ya�ayan mikroskobik alg ve
hayvanlara plankton denir. Bitkisel olanlara, fitoplankton, hayvansal
olanlara ise zooplankton denir. Sudaki besin zinciri, mikroskobik algler veya
fotosentetik bakterilerle ba�lar. Bunları zooplanktonlar yer. Küçük balıklar
�
�

238
planktonlarla beslenir. Büyük balıklarda küçük balıkları yer. Zincirde en son
ayrı�tırıcılar bulunur.
� Yukarıda bahsedilen soruya verilen ifadelerde, bazı ö�renciler verilen
�ekildeki canlıların beslenmesini gösteren okların yönlerini yanlı�
yorumlamı�lardır. Çünkü, bu su ekosisteminde erkek balina ringa balı�ı ile
beslenir. Ton balı�ı, ringa balı�ı ile beslenir. Ringa balı�ı da planktonla beslenir.
Kısa boyunlu martı ise, yılan balı�ı ile beslenir. Mavi balina da, planktonla
beslenir.
Soru 6. Enerji piramidi nedir?
Ö�rencilere bir enerji piramidindeki canlılarla ile ilgili bir soru sorulmu� ve bazı
ö�rencilerin bu soru ile ilgili yanlı� kavramaları oldu�u belirlenmi�tir. Bunlar �u
�ekildedir:
� ikincil tüketiciler hayvanlar ve insanlardır, bunlar besinlerini üreticilerden
sa�larlar,
� birincil ve ikincil tüketiciler besin üretemezler ve besinlerini üreticilerden
sa�larlar,
� ikincil tüketiciler hem üreticilerden hem de birincil tüketicilerden besin
sa�larlar.
� piramidin en tepesinde bulunanlar piramidin ilk halkasını olu�turur,
� piramitte az sayıda canlı çok sayıda madde ayrı�tırabilir bunlar ayrı�tırıcıdır,
� üçüncül tüketiciler fazla olursa üreticiler azalır ve denge bozulur.
Bu ö�rencilerin hepsinin dü�ünceleri yanlı�tır.
TARTI�MA: �imdi bu konu ile ilgili bir tartı�ma yapıp sonra konuya geçelim.
“Besin Zinciri ve Enerji Piramidi” ba�lıklı Çalı�ma yapra�ı 5’e yeniden bakalım.
Bir besin zincirinde hangi canlının neyle beslendi�ini gösteren piramit
�eklindeki yapıya energy piramidi denilebilir. Canlıların besin zincirinde
beslendikleri canlıdan elde ettikleri enerjinin piramit �eklinde gösterilmesine
�

239
enerji piramidi denilebilir. Bu bir besin zincirinde hangi canlının bir sonraki
basamakta kime enerjisini aktardı�ını gösterir ( a�a�ıdaki �ekilde görüldü�ü gibi).
�ekil 1. Bir kara ekosisteminde enerji piramidi
Besin zincirinde üretici, tüketici ve ayrı�tırıcı bulunur. Enerji
piramidinde de onlar bulunur. Pirmidin tabanında, en altta üreticiler,
ondan sonra birincil tüketiciler (otçullar), onlardan sonra da, ikincil tüketiciler
(etçiller), en sonra da üçüncül tüketiciler (burada etçiller veya hem otçul hem
etçiller bulunbilir) bulunur. Ayrı�tırıcılar, piramit kenarı boyunca yer alabilir.
Piramitte bitkiler en çok sayıya sahiptir. Piramidin ikinci basama�ındaki
otçulların sayısı bitkilerden daha azdır. Çünkü bitkilerden arta kalan
enerjiyi alan otçulların sayısı bitkilerden az olur. Tüketici olan otçullar bitkileri
yerler. Böylece bitkilerden gelen enerji otçullara geçmi� olur. Otçullar kazanmı�
oldukları bu enerjinin büyük kısmını kendileri kullanır. Artan enerji ise etçiller
tarafından kullanıldı�ı için piramitte etçillerin sayısı en az olan grup olur. Enerji
piramidi gittikçe daralır çünkü her basamakta enerji kaybı olur. Bu ısı enerjisine
dönü�erek çevreye verilir. Piramitte yukarı do�ru gidildikçe bireylerin kütlesi
artarken, bireylerin sayısında azalma görülür.
Pirmitte enerji her basamakta %90 azalarak zincirin ilk halkasından son
halkasına do�ru çıkmaktadır. Örnek verecek olursak ye�il bitkilerden
(piramidin ilk basama�ı) sonra gelen basamakta, otla beslenen inek ve tav�an gibi
canlılar bulunur. Bu otçul canlılar, birinci basamaktaki bitkileri yiyerek
beslenirler. Otçul bir canlının bir bitkiyi yemesiyle, bitkideki enerji %90 oranında
azalarak otçullara geçer. Daha sonraki basamaklarda ise enerji de giderek azalır.
�
�
�
240
� Ö�rencilerin “�kincil tüketiciler hayvanlar ve insanlardır, bunlar besinlerini
üreticilerden sa�larlar”, “Birincil ve ikincil tüketiciler besin üretemezler ve
besinlerini üreticilerden sa�larlar” ve“�kincil tüketiciler hem üreticilerden hem de
birincil tüketicilerden besin sa�larlar” ifadeleri yanlı�tır. Çünkü, her canlı grubu
bir alt basamaktaki canlılar ile beslenir. Piramidin en tepesinde bulunanlar
piramidin ilk halkasını de�il son halkasını olu�tururlar. Piramitte az sayıda canlı
çok sayıda madde ayrı�tırabilir bunlar ayrı�tırıcıdır ifadesi yanlı�tır. Çünkü az
sayıda olan canlılar üçüncül tüketicilerdir ve bunlar ayrı�tırma yapamazlar.
Ayrı�tırıcılar da, ölü canlıları parçalarlar. Bazı ö�renciler üçüncül tüketiciler fazla
olursa üreticiler azalır ve denge bozulur demektedirler bu do�ru de�ildir çünkü
üçüncül tüketiciler ikincil tüketicilerle beslenirler bunlar üretiileri etkilemezler.

241
ÇALI�MA YAPRA�I 1. CANLI VE CANSIZ ÇEVREM�Z
Soru 1. Do�ada pek çok canlı ve cansız varlık bulunmaktadır. Siz canlı ve cansız
denilince ne anlıyorsunuz? A�a�ıya yazınız.
1. Grubunuzun dü�üncesi:
Canlı:
Cansız:
1. Sınıfın genel dü�üncesi:
Canlı:
Cansız:
Soru 2. A�a�ıda verilen varlıkları canlı yada cansız olarak sınıflayınız.
Ta�, toprak, su, elma a�acı, yumurta, ku�, ı�ık, oksijen, masa, bakteri, sıcaklık, fosfat.
2. Grubunuzun dü�üncesi:
Canlı Cansız
2. Sınıfın genel dü�üncesi:
Canlı Cansız

242
Soru 3. Sizin ya�adı�ınız çevredeki di�er canlı ve cansızlara ait örnekler veriniz.
3. Grubunuzun dü�üncesi:
Canlı Cansız
3. Sınıfın genel dü�üncesi:
Canlı Cansız
Soru 4. Genel olarak canlıları etkileyen di�er canlı ve cansızlar çevresel etmenler
nelerdir, yazınız.
Grubunuzun dü�üncesi:
Canlı Cansız
Sınıfın genel dü�üncesi:
Canlı Cansız

243
ÇALI�MA YAPRA�I 2. CANLILARDA BESLENME
Soru 1: Çevremizde pek çok canlı organizma bulunmaktadır. A�a�ıda bazı bitki ve
hayvan resimleri verilmi�tir. Bu resimlerdeki canlılar nasıl beslenir, kısaca belirtiniz?

244
Grubunuzun dü�üncesi:
Bitki:
Keçi:
Yılan:
Aslan:
Ayı:
�nsan:
Sınıfın genel dü�üncesi:
Bitki:
Keçi:
Yılan:
Aslan:
Ayı:
�nsan:

245
Soru 2: Do�ada ya�ayan bazı bakteri ve mantarları mikroskopta gördükten sonra, bakteri
ve mantarların do�adaki görevleri hakkında bildiklerinizi yazınız.
2. Grubunuzun genel dü�üncesi
Bakteriler ve mantarlar:
2. Sınıfın genel dü�üncesi
Bakteriler ve mantarlar:

246
ÇALI�MA YAPRA�I 3. ORTAK YA�AM
Bir ki�i her sabah arabasıyla i�e giderken bir arkada�ını da kendi arabasıyla onu i�
yerine bırakıyor. Bir bayan ve bir erkek evlenerek aynı evde ya�amaya ba�larlar. �ki
karde�ten bir sürekli di�erinden borç alıyor ve geri ödemiyor.
Soru 1. Bu örneklerdeki ki�iler arasında nasıl ili�kiler vardır? Bu ili�kilerin fayda ve
zararlarını tartı�ınız.
1. Grubunuzun genel dü�üncesi: 1. Sınıfın genel dü�üncesi:
Soru 2. A�a�ıdaki ortak ya�am �ekillerini yazınız.
a) Bir canlı sürekli di�erinin besin artıklarıyla besleniyorsa,buna....................................denir .
b) �ki canlı sürekli birbirine destek oluyorsa, buna.....................................denir.
c) Bir canlı sürekli di�erinden besleniyorsa, buna..................................denir.
2. Grubunuzun genel dü�üncesi:
a)
b)
c)
2. Sınıfın genel dü�üncesi:
a)
b)
c)

247
Soru 3: A�a�ıda kabuksu ve yapraksı likenlere ait bir resim ve bir likenin
mikroskopta enine kesiti verilmi�tir. Bunları inceledikten sonra likenler nasıl
canlılardır? Açıklayınız.
Kabuksu ve Yapraksı Likenler
Liken enine kesitinin ı�ık mikroskobunda görünümü: 1.
Üst kabuk tabakası, 2. Alg tabakası, 3. Medulla (mantar
tabakası), 4. Alt kabuk tabakası ve 5. Rizin (Mantardan
yapılmı� tutunma organı).

248
3. Grubunuzun genel dü�üncesi: 3. Sınıfın genel dü�üncesi:

249
ÇALI�MA YAPRA�I 4. BES�N Z�NC�R�
Soru 1. �imdi do�ada ya�ayan bazı canlıların resimlerini görelim. Hangi canlı neyle
besleniyor dikkat edin ve gördü�ünüz resimlere ait bir besin zinciri örne�i yazınız.
1. Grubunuzun dü�üncesi: 1. Sınıfın genel dü�üncesi:
Soru 2. Besin zinciri canlıların beslenme ili�kisini görmemize yardımcı olur. Kurba�a,
yılan, �ahin, çimen ve çekirge arasında beslenme ili�kisi vardır. Bu canlılara ait besin
zinciri �emasını çiziniz.
2. Grubunuzun �eması: 2. Sınıfın genel �eması:

250
Soru 3. Bu canlılardan hangisi üreticidir? Neden?
Soru 4. Bunlardan hangisi birincil tüketicidir? Neden?
Soru 5. Bunlardan hangisi ikincil tüketicidir? Neden?
Soru 6. Bunlardan hangisi üçüncül tüketicidir? Neden?
Soru 7. Bunlardan hangisi dördüncül tüketicidir? Neden?
Grubunuzun dü�üncesi:
3
4.
5.
6.
7.
Sınıfın genel dü�üncesi:
3
4.
5.
6.
7.

251
ÇALI�MA YAPRA�I 5. BES�N A�I VE ENERJ� P�RAM�T�
Bir kara ekosisteminde çimen, fare, tavuk, yılan, koyun, insan, geyik, aslan, kartal
bulunur.
Soru 1. Bu besin a�ında hangi canlı, hangi canlı/canlılar ile beslenmektedir? Yazınız
Soru 2: Yukarıda verilen canlılara ili�kin besin a�ı �eması çiziniz.
Soru 3. Bu kara ekosistemine ait enerji piramidini çiziniz ve açıklayınız.
252
Grubunuzun dü�üncesi:
1.
2.
3.
Açıklama:
Sınıfın genel dü�üncesi:
1.
2.
3.
Açıklama:

253
APPENDIX H
SOME PICTURES FROM THE EXPERIMENTAL GROUP
DENEYSEL GRUPLA �LG�L� BAZI RES�MLER

254

255


257
VITA
Gülcan Çetin was born in Karacabey, Bursa on May 05, 1968. She received her
B.Sc. degree from Biology Department of Ege University in 1989. She worked as
a research assistant in the Secondary Science and Mathematics Education
Department of Balıkesir University from 1990-1996 and 1998-2000. She had
M.Sc. degree from Uluda� University in 1992 and M.Ed. degree from University
of Leeds in 1998. She has been working as a research assistant in the Secondary
Science and Mathematics Education Department of Middle East Technical
University (METU) since 2001. Her main areas of interest are ecology education,
misconceptions in biology, conceptual change approaches, conceptual change text
design, and teacher education. She will work in the Secondary Science and
Mathematics Education Department of Balıkesir University after completing
Ph.D. program at METU.