the effect of brand awareness and quality perception of
TRANSCRIPT
Business and Economic Research
ISSN 2162-4860
2019, Vol. 9, No. 4
http://ber.macrothink.org 210
The Effect of Brand Awareness and Quality Perception
of Customer Satisfaction through Purchasing Decisions
Honda and Yamaha Motors (Case study of Maros
Muslim University Students)
Muh. Alam Nasyrah Hanafi
Faculty of Economics and Business, Maros Muslim University, Indonesia
Jeni Kamase
Faculty of Economics, Indonesian Muslim University, Indonesia
Asdar Djamereng
Faculty of Economics, Indonesian Muslim University, Indonesia
Serling Serang
Faculty of Economics, Indonesian Muslim University, Indonesia
Received: October 3, 2019 Accepted: October 30, 2019 Published: November 13, 2019
doi:10.5296/ber.v9i4.15561 URL: https://doi.org/10.5296/ber.v9i4.15561
Abstract
This research was conducted with the aim to: (1) test and analyze the effect of brand
awareness on consumer satisfaction through purchasing decisions; (2) test and analyze the
effect of perceived quality on consumer satisfaction through purchasing decisions. The
population of this study was all of Management Bachelor degree students of the Faculty of
Economics, Maros Muslim University using 239 Honda and Yamaha motorcycles consumer.
The number of samples in this study were 150 people using the Slovin formula with a
confidence level of 95% with a value of e = 5%, the distribution of samples was based on
Honda and Yamaha consumer, namely samples for Honda users were 72 people and Yamaha
users were 78 people using the Stratified Random formula Sampling, the survey was
Business and Economic Research
ISSN 2162-4860
2019, Vol. 9, No. 4
http://ber.macrothink.org 211
conducted from November to April 2019. Data were analyzed using the Structural Equation
Modeling (SEM) program. The results of this study indicate that: (1) brand awareness cannot
directly affect customer satisfaction. This is because respondents stated that brand awareness
does not guarantee consumers will be satisfied only by knowing and remembering Honda and
Yamaha motorcycle brands. (2) Perceived quality has a significant effect on purchasing
decisions. This shows that the higher the consumer's perception of product quality, the higher
the consumer's purchasing decisions, and vice versa. Therefore, respondents stated that the
perception of quality really guarantees consumers will be satisfied just by seeing and
remembering the model of the motor
Keywords: Brand awareness, Quality, Purchasing decisions, Consumer satisfaction
1. Background
The development of increasingly advanced technology has a major influence on the
automotive industry; one of the industrial sectors that are currently experiencing quite rapid
growth in the automotive industry is the motorcycle. The development of the motorcycle
industry in Indonesia is influenced by factors of human needs because at this time humans are
required to be able to implement efficiency and effectiveness in all their activities, as well as
in terms of mobility from one place to another, this will certainly affect the choice of
transportation to be used , in the current condition of all means of transportation, motorbikes
are the choice of the community because they are considered the most effective and efficient,
aside from being free of traffic jams, motorbikes are also more efficient in the use of fuel,
more efficient in travel time and easy to obtain a motorcycle through scattered dealers. In the
field of transportation, we may already know motorbikes as a means of transportation
commonly used by Indonesian residents. This is because in addition to being practical and
economical when compared to paying the cost of public transportation, another reason that
affects the development of motorcycles in Indonesia is to speed up someone when they are
about to make a move from one place to another. That is the reason why the growth of
motorbike users in this country is increasing every year even when the economic crisis that
shook the country a few years ago the growth of motorcycles actually increased.
Over time and the increasing need for transportation equipment brings fresh air to automotive
companies, especially in the field of motorcycles, which are needed by many people in
addition to being affordable and also easy to maintain. Nowadays, there are many motorcycle
brands, such as Honda and Yamaha, as the main players in the motorcycle market in this
country that are always competing to win the interest of consumers to buy their motorcycle
products. Because to attract consumers 'buying interest is very difficult, it requires hard effort
and planned innovation from the time of each company to attract consumers' buying interest.
The vast Indonesian motorcycle market has made several Honda and Yamaha companies
always competing to produce products that can meet the needs of their consumers.
Distribution data of motorcycle production from the five members of Indonesian motorcycle
industry association (AISI) in 2016 and 2017 (quoted from TMCBlog.com ):

Business and Economic Research
ISSN 2162-4860
2019, Vol. 9, No. 4
http://ber.macrothink.org 212
Table 1. Indonesian motorcycle production 2016
Brand Total Market Share
Honda 4,380,888 units 73.86%
Yamaha 1,394,078 units 23.5%
Kawasaki 97,622 units 1.65%
Suzuki 56,824 units 0.96%
TVS 1,873 units 0.03%
Total 5,931,285 units 100%
AISI Motorcycle Distribution Data for 2017, Honda is still the Leader and Yamaha number 2.
Quoted from DetikOto that the number of wholesale distribution (from factory to dealer)
motorcycles from the five AISI members (Honda, Yamaha, Suzuki, Kawasaki, and TVS)
during the month January to December 2017 amounted to 5,886,103 units and decreased by
45,182 units or 0.76% compared to the distribution in 2016. The following is a comparison of
Motorcycle Distribution Data from the five AISI members in both 2016 and 2017.
Table 2. Indonesia motorcycle production 2017
Brand Total Market Share
Honda 4,385,888 units 74.51%
Yamaha 1,348,211 units 22.90%
Kawasaki 78,637 units 1.34%
Suzuki 72,191 units 1.23%
TVS 1,176 units 0.02%
Distribution Amount 5,886,103 units 100%
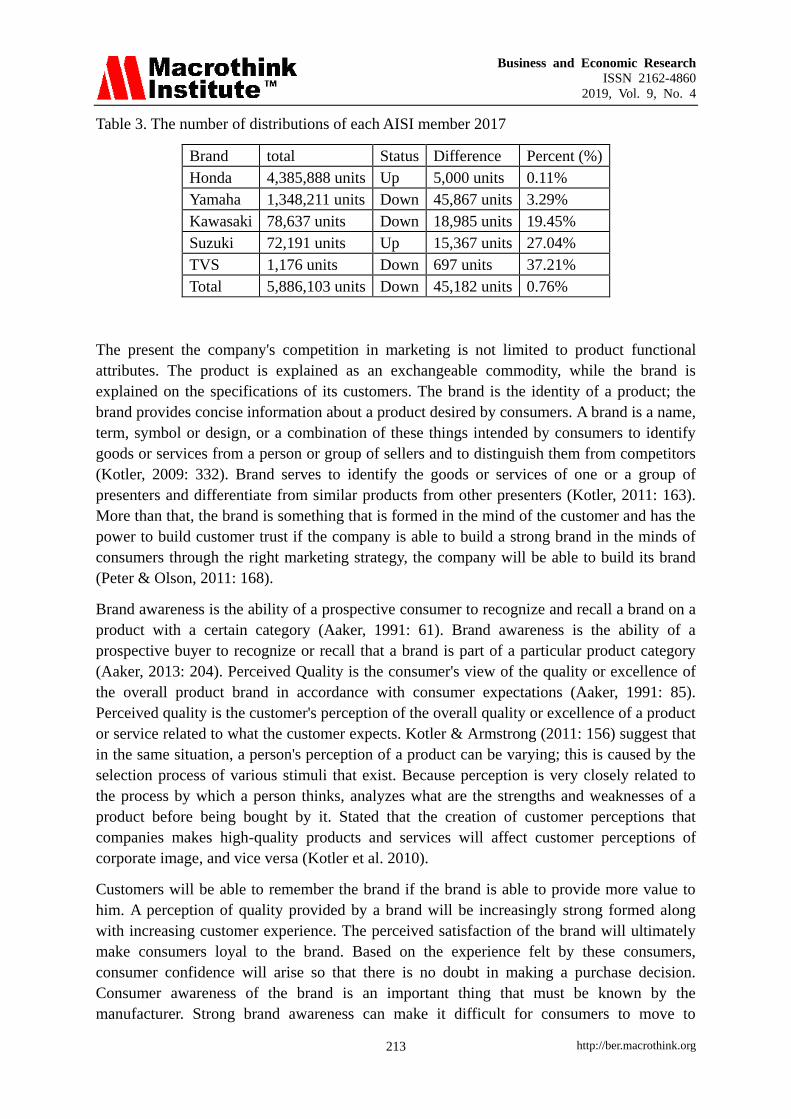
The table it can be seen that based on Yamaha numbers the most has decreased by 45,867
units or 3.29%. However, when viewed based on a percentage, TVS experienced the largest
decline, namely 37.21% or 697 units in numbers. Only Honda experienced a slight increase,
which was 5,000 units or 0.11%. Suzuki also experienced an increase of 15,367 units or
27.04% and then Kawasaki experienced a decrease of 18,985 units or 19.45% from the
previous year. According to the Indonesian Motorcycle Industry Association (AISI) from
2012-2016 Honda has always been the leader of the motorcycle market, while Yamaha has
always been number 2 (two) after Honda. Even though their sales always show positive
results, this means that positive trends in increasing Yamaha motorcycle sales have not been
able to beat Honda motorcycle sales as the leader of the motorcycle market in Indonesia.
Business and Economic Research
ISSN 2162-4860
2019, Vol. 9, No. 4
http://ber.macrothink.org 213
Table 3. The number of distributions of each AISI member 2017
Brand total Status Difference Percent (%)
Honda 4,385,888 units Up 5,000 units 0.11%
Yamaha 1,348,211 units Down 45,867 units 3.29%
Kawasaki 78,637 units Down 18,985 units 19.45%
Suzuki 72,191 units Up 15,367 units 27.04%
TVS 1,176 units Down 697 units 37.21%
Total 5,886,103 units Down 45,182 units 0.76%
The present the company's competition in marketing is not limited to product functional
attributes. The product is explained as an exchangeable commodity, while the brand is
explained on the specifications of its customers. The brand is the identity of a product; the
brand provides concise information about a product desired by consumers. A brand is a name,
term, symbol or design, or a combination of these things intended by consumers to identify
goods or services from a person or group of sellers and to distinguish them from competitors
(Kotler, 2009: 332). Brand serves to identify the goods or services of one or a group of
presenters and differentiate from similar products from other presenters (Kotler, 2011: 163).
More than that, the brand is something that is formed in the mind of the customer and has the
power to build customer trust if the company is able to build a strong brand in the minds of
consumers through the right marketing strategy, the company will be able to build its brand
(Peter & Olson, 2011: 168).
Brand awareness is the ability of a prospective consumer to recognize and recall a brand on a
product with a certain category (Aaker, 1991: 61). Brand awareness is the ability of a
prospective buyer to recognize or recall that a brand is part of a particular product category
(Aaker, 2013: 204). Perceived Quality is the consumer's view of the quality or excellence of
the overall product brand in accordance with consumer expectations (Aaker, 1991: 85).
Perceived quality is the customer's perception of the overall quality or excellence of a product
or service related to what the customer expects. Kotler & Armstrong (2011: 156) suggest that
in the same situation, a person's perception of a product can be varying; this is caused by the
selection process of various stimuli that exist. Because perception is very closely related to
the process by which a person thinks, analyzes what are the strengths and weaknesses of a
product before being bought by it. Stated that the creation of customer perceptions that
companies makes high-quality products and services will affect customer perceptions of
corporate image, and vice versa (Kotler et al. 2010).
Customers will be able to remember the brand if the brand is able to provide more value to
him. A perception of quality provided by a brand will be increasingly strong formed along
with increasing customer experience. The perceived satisfaction of the brand will ultimately
make consumers loyal to the brand. Based on the experience felt by these consumers,
consumer confidence will arise so that there is no doubt in making a purchase decision.
Consumer awareness of the brand is an important thing that must be known by the
manufacturer. Strong brand awareness can make it difficult for consumers to move to

Business and Economic Research
ISSN 2162-4860
2019, Vol. 9, No. 4
http://ber.macrothink.org 214
remember other brands. Companies can use brands to expand products, so that brands will be
increasingly remembered by consumers.
The motorcycle product category is always trying to expand and increase market share, which
will affect the brand equity of its products in the market. With strong brand equity,
distribution channels can develop so that more and more sales outlets will ultimately increase
the value or volume of sales of these products and enhance market share acquisition and
increase consumer purchasing decision confidence. A motorcycle is a two-wheeled vehicle
created to support mobility and human activities. Traffic congestion in urban areas is getting
higher, transportation costs are more expensive, and fuel consumption is limited by the
government causing motorbikes to be an alternative means of transportation because it is
more efficient, faster and cheaper than four-wheeled vehicles, especially for people who have
high levels of middle to lower welfare.
The rapid growth of motorbikes in Indonesia is influenced by the entry of a number of
motorcycle manufacturers from abroad, which mostly come from Japan, China, Europe and
India. But until now, Japanese-made motorcycles remain the main choice for the people of
Indonesia because of its various advantages. In Indonesia there are four big players in the
motorcycle industry including PT. Astra Honda Motor, PT. Yamaha Motor Indonesia
Manufacturing, PT. Suzuki Indomobil Motor, and PT. Kawasaki Motor Indonesia but what
were discussed in this study was two motorcycle industry companies, namely PT. Astra
Honda Motor and PT. Yamaha Motor Indonesia Manufacturing (Haming et al. 2017).
2. Literature Review
2.1 Brand Awareness
Brand awareness is a measure of how many potential customers know a brand. A common
strategy in marketing and advertising is to enhance brand awareness (Simamora, 2007: 439).
Brand awareness is the ability of a prospective buyer to recognize or recall that a brand is part
of a particular product category (Surachman, 2008: 7; Razak et al., 2019).
2.2 Perceived Quality
Having a strong brand is a vital aspect for every company, because the advantages that can be
obtained are diverse, starting from the perception of better quality and greater brand loyalty.
These advantages can be in the form of value for customers (functional and expressive
excellence) and value for owner’s brand (financial, strategic and managerial superiority).
Perceived quality is a consumer's assessment of the overall superiority or superiority of the
product. Brand equity items that reflected three main dimensions: brand loyalty, trust quality,
and brand awareness/association. This study also shows that perceived quality is the most
important factor for American and Korean consumers (Tjiptono, 2011: 131; Basir et al., 2015;
Mokhtar & Sjahruddin, 2019).
2.3 Consumer Satisfaction
Consumer satisfaction is the level of one's feelings after comparing the perceived
performance or results compared to his expectations (Kotler & Armstrong, 2009: 137).

Business and Economic Research
ISSN 2162-4860
2019, Vol. 9, No. 4
http://ber.macrothink.org 215
Consumers can experience one of three general levels of satisfaction, namely if the
performance is below expectations, consumers will feel disappointed but if the performance
is in line with customer expectations will feel satisfied and if the performance can exceed
expectations, the customer will feel very satisfied happy or happy. Satisfaction is a feeling of
pleasure or disappointment someone who arises because of comparing the perceived
performance of products or results against their expectations (Kotler & Armstrong, 2009:
138). Consumer expectations can be known from their own experiences when using these
products, information from other people, and information obtained from other advertisements
or promotions (Kotler, 2013: 181)
2.4 Purchasing Decisions
The purchase decision is a consumer decision that is influenced by the financial economy,
technology, politics, culture, products, prices, location, promotion, physical evidence, people
and, process (Buchari Alma, 2013: 96). Purchasing decisions namely Consumer behavior is
the study of how individuals, groups, and organizations select, buy, use, and dispose of goods,
services, ideas, or experiences to satisfy their needs and wants. Which means purchasing
decisions are part of consumer behavior consumer behavior, namely the study of how
individuals, groups, and organizations choose, buy, use, and how goods, services, ideas or
experiences to satisfy their needs and desires. Purchasing decisions are inseparable from the
nature of a consumer (consumer behavior) so that each consumer has different habits in
making purchases (Kotler et al., 2016: 177).
3. Methods
The number of samples in this study were 150 Management Bachelor degree students of the
Faculty of Economics, Maros Muslim University using the Slovin formula with a confidence
level of 95% with a value of e = 5%. The data were analyses using Structural Equation
Modeling (SEM) through support analysis of moment structures (AMOS) Ver. 20
4. Results
A. Measurement Model Testing (Honda Motor customers)
Testing of measurement models in each construct consists of several stages, namely (1)
measurement model specifications, (2) goodness of fit testing of measurement models, (3)
construct validity test and (4) construct reliability test. The construct validity can be done by
looking at the loading factor value of each indicator in the construct. In this test the indicator
is declared valid if it has a Loading factor value > 0.5, while the construct reliability test is
performed by calculating the AVE and C.R values of the construct, the construct is declared
reliable if the AVE model > 0.5 and the C.R model> 0.7.
1) Brand awareness construct
Brand awareness variables are measured by 5 indicators. The following is a specification of the
brand awareness construct measurement model and its estimation results. All of indicators in
the brand awareness construct have loading factors > 0.5 and the model has a good of fit model,
so the model has been used to test the validity and reliability of the brand awareness construct.
Business and Economic Research
ISSN 2162-4860
2019, Vol. 9, No. 4
http://ber.macrothink.org 216
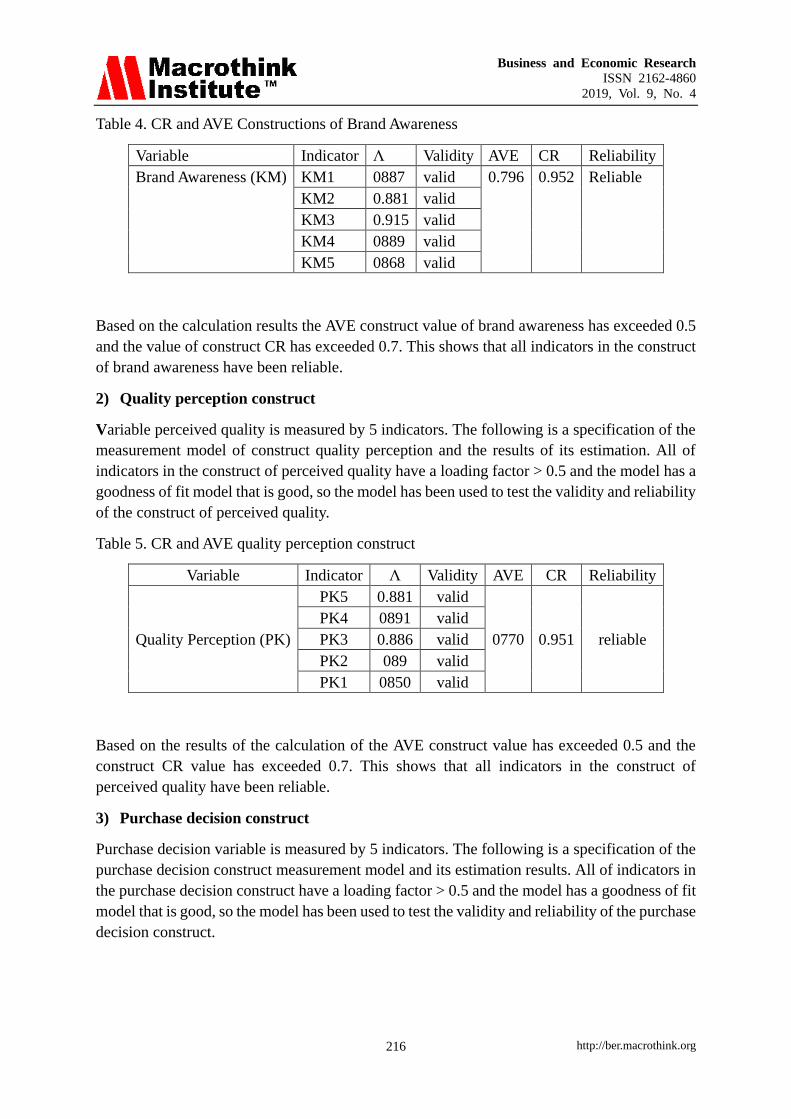
Table 4. CR and AVE Constructions of Brand Awareness
Variable Indicator Λ Validity AVE CR Reliability
Brand Awareness (KM) KM1 0887 valid 0.796 0.952 Reliable
KM2 0.881 valid
KM3 0.915 valid
KM4 0889 valid
KM5 0868 valid
Based on the calculation results the AVE construct value of brand awareness has exceeded 0.5
and the value of construct CR has exceeded 0.7. This shows that all indicators in the construct
of brand awareness have been reliable.
2) Quality perception construct
Variable perceived quality is measured by 5 indicators. The following is a specification of the
measurement model of construct quality perception and the results of its estimation. All of
indicators in the construct of perceived quality have a loading factor > 0.5 and the model has a
goodness of fit model that is good, so the model has been used to test the validity and reliability
of the construct of perceived quality.
Table 5. CR and AVE quality perception construct
Variable Indicator Λ Validity AVE CR Reliability
Quality Perception (PK)
PK5 0.881 valid
0770 0.951 reliable
PK4 0891 valid
PK3 0.886 valid
PK2 089 valid
PK1 0850 valid
Based on the results of the calculation of the AVE construct value has exceeded 0.5 and the
construct CR value has exceeded 0.7. This shows that all indicators in the construct of
perceived quality have been reliable.
3) Purchase decision construct
Purchase decision variable is measured by 5 indicators. The following is a specification of the
purchase decision construct measurement model and its estimation results. All of indicators in
the purchase decision construct have a loading factor > 0.5 and the model has a goodness of fit
model that is good, so the model has been used to test the validity and reliability of the purchase
decision construct.

Business and Economic Research
ISSN 2162-4860
2019, Vol. 9, No. 4
http://ber.macrothink.org 217
Table 6. CR and AVE purchase decisions construct
Variable Indicator Λ Validity AVE CR Reliability
Purchase Decision (KP)
KP1 0.922 valid
0837 0.954 reliable
KP2 0.920 valid
KP3 0895 valid
KP4 0.922 valid
KP5 0.914 valid
Based on the calculation results the AVE construct value of purchasing decisions has
exceeded 0.5 and the value of construct CR has exceeded 0.7. This shows that all indicators
in the construct of purchasing decisions have been reliable.
4) Consumer satisfaction construct
Customer satisfaction is measured by five indicators. The following is a specification of the
measurement model of customer satisfaction construct and the results of its estimation. All of
indicators in the construct of consumer satisfaction have a loading factor > 0.5 and the model
has a goodness of fit model that is good, so the model has been used to test the validity and
reliability of the consumer satisfaction construct.
Table 7. CR and AVE Consumer satisfaction construct
Variable Indicator Λ Validity AVE CR Reliability
Consumer Satisfaction (KK)
KP1 0887 valid
0.802 0.952 reliable
KP2 0.927 valid
KP3 0.917 valid
KP4 0.913 valid
KP5 0839 valid
Based on the calculation results the AVE construct value of customer satisfaction has exceeded
0.5 and the value of construct CR has exceeded 0.7. This shows that all indicators in the
construct of consumer satisfaction have been reliable.
5) Test Prerequisites SEM Analysis
Some of the requirements that must be fulfilled in SEM analysis include the requirements for
the number of samples, there are no outlier data in the model, normal distributed data both
univariate and multivariate and there is no multicollinearity in the model.
a) Outlier
Outliers are observations that arise with extreme values both univariate and multivariate that
arise because of the combination of unique characteristics they have and look very much

Business and Economic Research
ISSN 2162-4860
2019, Vol. 9, No. 4
http://ber.macrothink.org 218
different from other observations. In SEM analysis, outliers can be detected by looking at the
mahalonobis distance, in that table the data is referred to as outliers if the Mahalanobis
d-squared value exceeds 61.098, that is the Chi Square value at 31 degrees of freedom (because
there are 31 valid indicators analyzed) and a significant level of 0.001 . Outlier detection results
in the following table show that of the 205 analyzed data there are no data that have an
expensive aerobic distance above 61.098.
b) Normality test
Evaluation of normality is done by looking at the value of c.r skewness or kurtosis both
univariate, the data are said to be normally distributed if the value of c.r skewness or c.r
kurtosis is below the absolute price of 2.58 (Ghozali, 2016), the value of multivariate c.r at
below 8 can still be accepted and the analysis can continue as long as all indicators have c.r
kurtosis values < vulnerable -2.58 < Z < 2.58 (Ferdinand, 2006).
The results of the normality test showed that the research data were normally distributed
because the univariate kurtosis values of all indicators were in the interval -2.58 <z <2.58 as
well as the multivariate c.r value of -1.340 indicating that the multivariate c.r had been in the -2
interval, 58 < Z < 2.58, this shows that the data to be analyzed has normal distribution both
univariate and multivariate.
The following are the results of normality test data on the model:
Table 8. Assessment of normality
Variable Min max skew cr kurtosis cr
KK5 1,000 5,000 -1,021 -5,106 .779 1,949
KK4 1,000 5,000 -690 -3,452 -.127 -.319
KK3 1,000 5,000 -878 -4,391 .471 1,177
KK2 1,000 5,000 -800 -4,002 .281 703
KK1 1,000 5,000 -854 -4,269 .300 .750
KP5 1,000 5,000 -814 -4,071 .003 .008
KP4 1,000 5,000 -658 -3,289 -.070 -174
KP3 1,000 5,000 -675 -3,376 -.075 -.187
KP2 1,000 5,000 -656 -3,279 -.114 -.286
KP1 1,000 5,000 -.752 -3,760 -185 -.462
PK1 1,000 5,000 -699 -3,497 .431 1,078
PK2 1,000 5,000 -743 -3,714 .438 1,095
PK3 1,000 5,000 -806 -4,031 496 1,239
PK4 1,000 5,000 -690 -3,450 .238 594
PK5 1,000 5,000 -768 -3,838 .403 1,008
KM5 1,000 5,000 -.705 -3,527 -.035 -.088
KM4 1,000 5,000 -700 -3.501 .242 604
KM3 1,000 5,000 -760 -3,800 .316 .791
Business and Economic Research
ISSN 2162-4860
2019, Vol. 9, No. 4
http://ber.macrothink.org 219
Variable Min max skew cr kurtosis cr
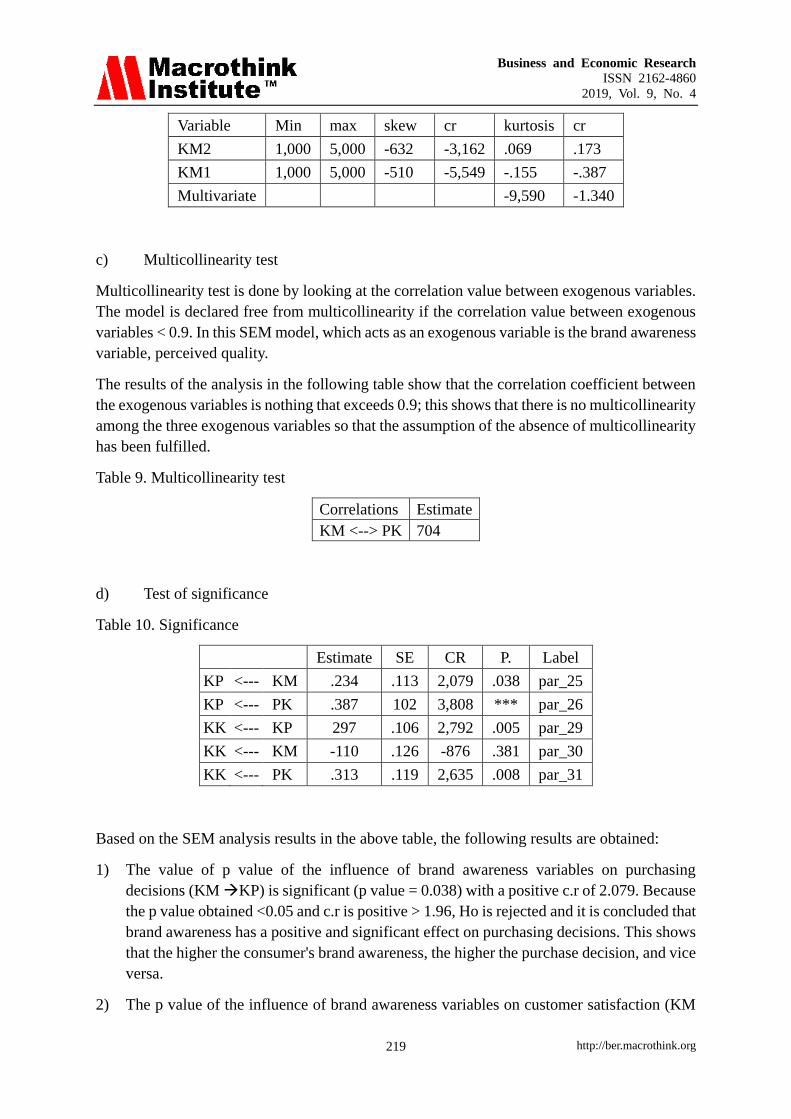
KM2 1,000 5,000 -632 -3,162 .069 .173
KM1 1,000 5,000 -510 -5,549 -.155 -.387
Multivariate -9,590 -1.340
c) Multicollinearity test
Multicollinearity test is done by looking at the correlation value between exogenous variables.
The model is declared free from multicollinearity if the correlation value between exogenous
variables < 0.9. In this SEM model, which acts as an exogenous variable is the brand awareness
variable, perceived quality.
The results of the analysis in the following table show that the correlation coefficient between
the exogenous variables is nothing that exceeds 0.9; this shows that there is no multicollinearity
among the three exogenous variables so that the assumption of the absence of multicollinearity
has been fulfilled.
Table 9. Multicollinearity test
Correlations Estimate
KM <--> PK 704
d) Test of significance
Table 10. Significance
Estimate SE CR P. Label
KP <--- KM .234 .113 2,079 .038 par_25
KP <--- PK .387 102 3,808 *** par_26
KK <--- KP 297 .106 2,792 .005 par_29
KK <--- KM -110 .126 -876 .381 par_30
KK <--- PK .313 .119 2,635 .008 par_31
Based on the SEM analysis results in the above table, the following results are obtained:
1) The value of p value of the influence of brand awareness variables on purchasing
decisions (KM KP) is significant (p value = 0.038) with a positive c.r of 2.079. Because
the p value obtained <0.05 and c.r is positive > 1.96, Ho is rejected and it is concluded that
brand awareness has a positive and significant effect on purchasing decisions. This shows
that the higher the consumer's brand awareness, the higher the purchase decision, and vice
versa.
2) The p value of the influence of brand awareness variables on customer satisfaction (KM
Business and Economic Research
ISSN 2162-4860
2019, Vol. 9, No. 4
http://ber.macrothink.org 220
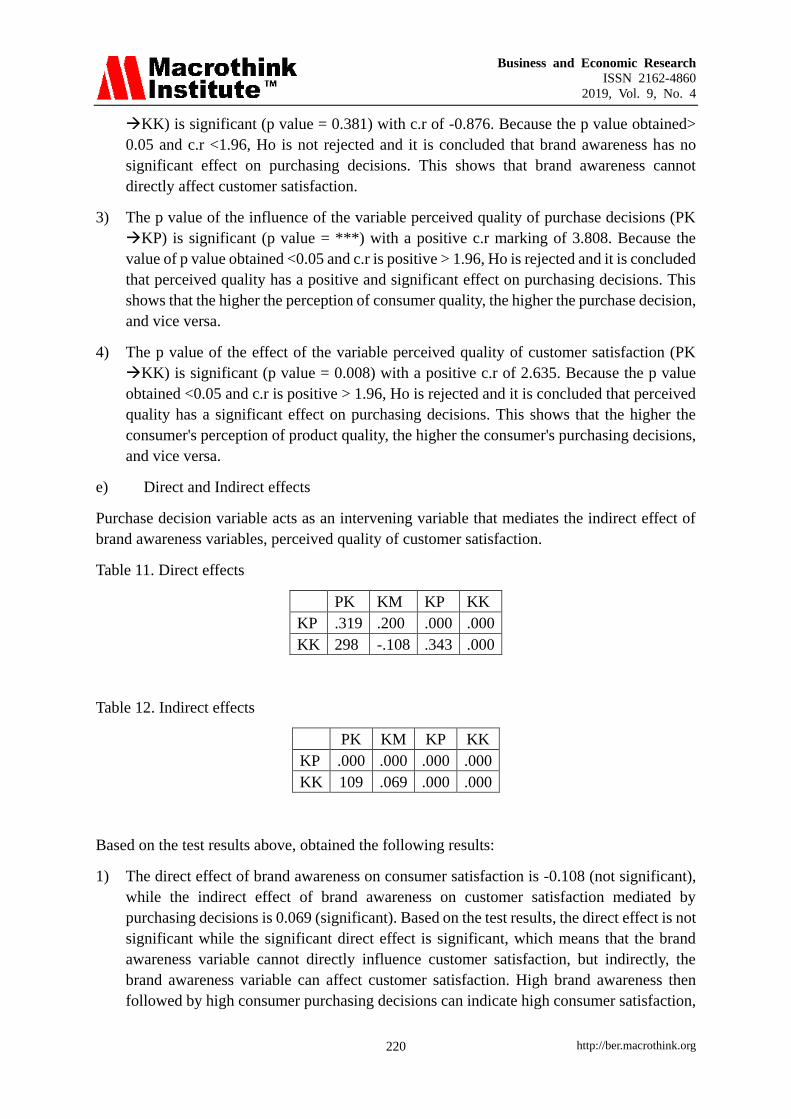
KK) is significant (p value = 0.381) with c.r of -0.876. Because the p value obtained>
0.05 and c.r <1.96, Ho is not rejected and it is concluded that brand awareness has no
significant effect on purchasing decisions. This shows that brand awareness cannot
directly affect customer satisfaction.
3) The p value of the influence of the variable perceived quality of purchase decisions (PK
KP) is significant (p value = ***) with a positive c.r marking of 3.808. Because the
value of p value obtained <0.05 and c.r is positive > 1.96, Ho is rejected and it is concluded
that perceived quality has a positive and significant effect on purchasing decisions. This
shows that the higher the perception of consumer quality, the higher the purchase decision,
and vice versa.
4) The p value of the effect of the variable perceived quality of customer satisfaction (PK
KK) is significant (p value = 0.008) with a positive c.r of 2.635. Because the p value
obtained <0.05 and c.r is positive > 1.96, Ho is rejected and it is concluded that perceived
quality has a significant effect on purchasing decisions. This shows that the higher the
consumer's perception of product quality, the higher the consumer's purchasing decisions,
and vice versa.
e) Direct and Indirect effects
Purchase decision variable acts as an intervening variable that mediates the indirect effect of
brand awareness variables, perceived quality of customer satisfaction.
Table 11. Direct effects
PK KM KP KK
KP .319 .200 .000 .000
KK 298 -.108 .343 .000
Table 12. Indirect effects
PK KM KP KK
KP .000 .000 .000 .000
KK 109 .069 .000 .000
Based on the test results above, obtained the following results:
1) The direct effect of brand awareness on consumer satisfaction is -0.108 (not significant),
while the indirect effect of brand awareness on customer satisfaction mediated by
purchasing decisions is 0.069 (significant). Based on the test results, the direct effect is not
significant while the significant direct effect is significant, which means that the brand
awareness variable cannot directly influence customer satisfaction, but indirectly, the
brand awareness variable can affect customer satisfaction. High brand awareness then
followed by high consumer purchasing decisions can indicate high consumer satisfaction,

Business and Economic Research
ISSN 2162-4860
2019, Vol. 9, No. 4
http://ber.macrothink.org 221
while high brand awareness without being followed by consumer purchasing decisions
cannot indicate high or low customer satisfaction.
2) The magnitude of the direct effect of perceived quality on consumer satisfaction is 0.298
(significant), while the indirect effect of perceived quality on consumer satisfaction
mediated by purchasing decisions is 0.109 (significant). Based on the test results, the
significant direct effect is significant as well as the significant direct effect which means
that the variable perceived quality can affect customer satisfaction both directly and
indirectly.
f) Hypothesis testing
Hypothesis testing with the aim to find out the relationship between the hypothesized variable
and the level of significance of causality between the variables shown in the following table:
Table 13. Hypothesis Testing of Honda Motor custumers
Variable P-value Direct
Effect
Indirect
Effect
Total
Effect Exogenous Intervening Endogenous
KM - KK 0.381 -0.108 0.069 -0,039
PK - KK 0.008 0.298 0.109 0.407
KM - KP 0.038 0.200 0,000 0.200
PK - KP *** 0.319 0,000 0.319
KM KP KK 0.09585 0.200 0.069 0.269
PK KP KK 0.0242 0.319 0.109 0.419
KP - KK 0.005 0.343 0,000 0.343
Testing the hypothesis and the value of the path coefficient of direct and indirect influence,
shows that there are nine models of relationships or direct effects and four relationships or
indirect effects produced are as follows:
1) Brand awareness has a p-value of 0.381> 0.05. Thus brand awareness has a positive but
not significant effect on customer satisfaction. Accordingly, the first hypothesis of this
study was rejected.
2) Quality perception has a p-value of 0.008 <0.05. Thus the perception of quality has a
positive and significant effect on customer satisfaction. Accordingly, the second
hypothesis of this study was accepted at the 95% confidence level.
3) Brand awareness has a p-value of 0.038 <0.05. Thus brand awareness has a positive and
significant effect on purchasing decisions. Accordingly, the fifth hypothesis of this study
was accepted at the 95% confidence level.
4) Quality perception has a p-value of 0,000 <0.05. Thus the perception of quality has a
positive and significant effect on purchasing decisions. Accordingly, the sixth hypothesis
of this study was accepted at the 95% confidence level.

Business and Economic Research
ISSN 2162-4860
2019, Vol. 9, No. 4
http://ber.macrothink.org 222
5) Brand awareness through purchasing decisions has a p-value of 0.09585> 0.05. Thus
brand awareness has an indirect, positive but not significant effect on customer
satisfaction. Accordingly, the ninth hypothesis of this study was rejected.
6) Perception of quality through purchasing decisions has a p-value of 0.0242 <0.05. Thus
the perception of quality has an indirect, positive and significant effect on customer
satisfaction. Accordingly, the tenth hypothesis of this study was accepted at the 95%
confidence level.
7) The purchase decision has a p-value of 0.005 <0.05. Thus the purchase decision has a
positive and significant effect on customer satisfaction. Accordingly, the thirteenth
hypothesis of this study was accepted at the 95% confidence level.
B. Measurement Model Testing (Yamaha Motor customers)
The construct validity can be done by looking at the loading factor value of each indicator in
the construct. In this test the indicator is declared valid if it has a Loading factor value > 0.5,
while the construct reliability test is performed by calculating the AVE and CR values of the
construct, the construct is declared reliable if the AVE > 0.5 and the CR > 0.7.
1) Brand Awareness construct
In this study, brand awareness variables are measured by 5 indicators. The following is
a specification of the brand awareness construct measurement model and its estimation results.
All of indicators in the brand awareness construct have loading factors> 0.5 and the model has
a good of fit model, so the model has been used to test the validity and reliability of the brand
awareness construct.
Table 14. CR and AVE of Brand awareness construct
Variable Indicator λ Validity AVE CR Reliability
Brand Awareness (KM)
KM1 0.902 valid
0.797 0.952 reliable
KM2 0.886 Valid
KM3 0.915 Valid
KM4 0894 Valid
KM5 0867 Valid
Based on the calculation results the AVE construct value of brand awareness has exceeded 0.5
and the value of construct CR has exceeded 0.7. This shows that all indicators in the construct
of brand awareness have been reliable.
2) Quality perception construct
Perceived quality is measured by 5 indicators. The following is a specification of the
measurement model of construct quality perception and the results of its estimation. All of
indicators in the construct of perceived quality have a loading factor > 0.5 and the model has a
goodness of fit model that is good, so the model has been used to test the validity and reliability
Business and Economic Research
ISSN 2162-4860
2019, Vol. 9, No. 4
http://ber.macrothink.org 223
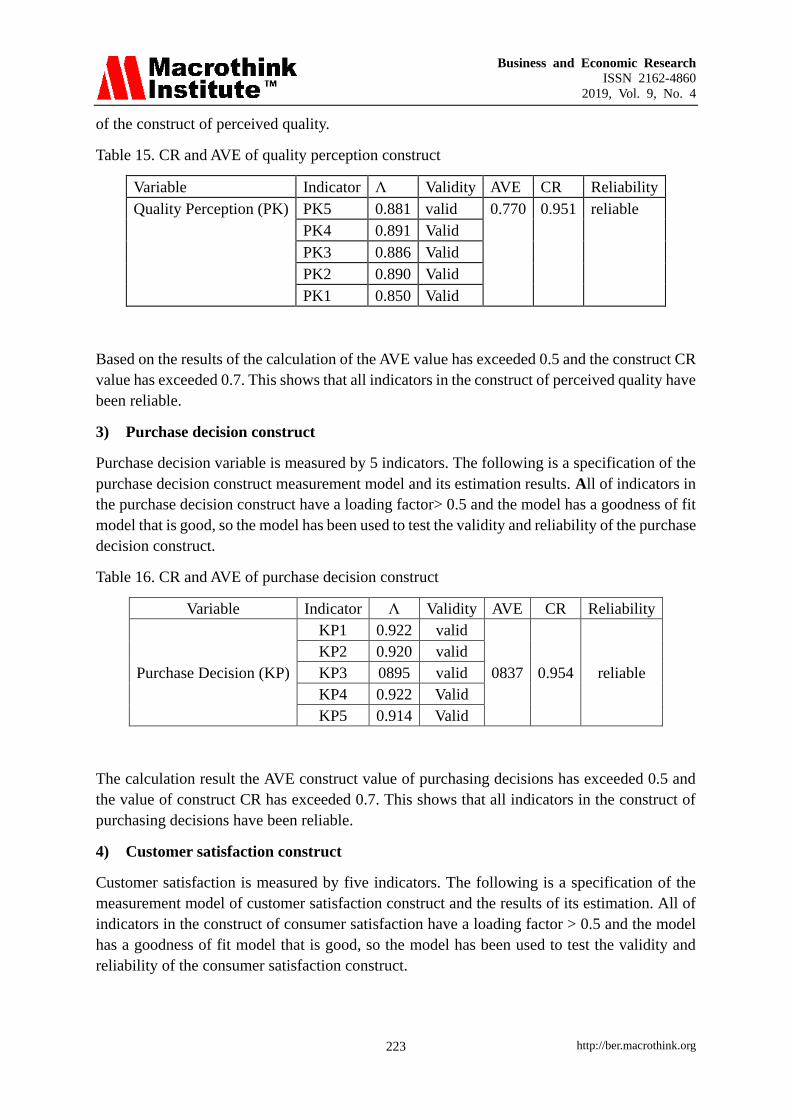
of the construct of perceived quality.
Table 15. CR and AVE of quality perception construct
Variable Indicator Λ Validity AVE CR Reliability
Quality Perception (PK) PK5 0.881 valid 0.770 0.951 reliable
PK4 0.891 Valid
PK3 0.886 Valid
PK2 0.890 Valid
PK1 0.850 Valid
Based on the results of the calculation of the AVE value has exceeded 0.5 and the construct CR
value has exceeded 0.7. This shows that all indicators in the construct of perceived quality have
been reliable.
3) Purchase decision construct
Purchase decision variable is measured by 5 indicators. The following is a specification of the
purchase decision construct measurement model and its estimation results. All of indicators in
the purchase decision construct have a loading factor> 0.5 and the model has a goodness of fit
model that is good, so the model has been used to test the validity and reliability of the purchase
decision construct.
Table 16. CR and AVE of purchase decision construct
Variable Indicator Λ Validity AVE CR Reliability
Purchase Decision (KP)
KP1 0.922 valid
0837 0.954 reliable
KP2 0.920 valid
KP3 0895 valid
KP4 0.922 Valid
KP5 0.914 Valid
The calculation result the AVE construct value of purchasing decisions has exceeded 0.5 and
the value of construct CR has exceeded 0.7. This shows that all indicators in the construct of
purchasing decisions have been reliable.
4) Customer satisfaction construct
Customer satisfaction is measured by five indicators. The following is a specification of the
measurement model of customer satisfaction construct and the results of its estimation. All of
indicators in the construct of consumer satisfaction have a loading factor > 0.5 and the model
has a goodness of fit model that is good, so the model has been used to test the validity and
reliability of the consumer satisfaction construct.
Business and Economic Research
ISSN 2162-4860
2019, Vol. 9, No. 4
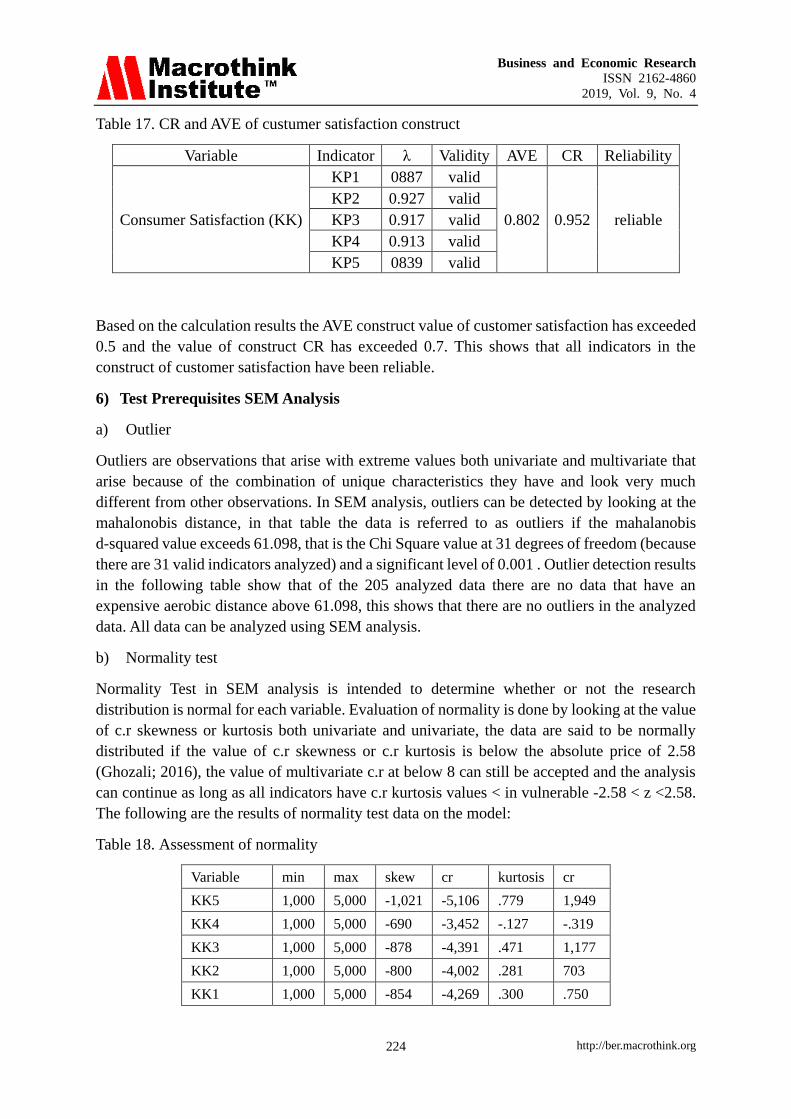
http://ber.macrothink.org 224
Table 17. CR and AVE of custumer satisfaction construct
Variable Indicator λ Validity AVE CR Reliability
Consumer Satisfaction (KK)
KP1 0887 valid
0.802 0.952 reliable
KP2 0.927 valid
KP3 0.917 valid
KP4 0.913 valid
KP5 0839 valid
Based on the calculation results the AVE construct value of customer satisfaction has exceeded
0.5 and the value of construct CR has exceeded 0.7. This shows that all indicators in the
construct of customer satisfaction have been reliable.
6) Test Prerequisites SEM Analysis
a) Outlier
Outliers are observations that arise with extreme values both univariate and multivariate that
arise because of the combination of unique characteristics they have and look very much
different from other observations. In SEM analysis, outliers can be detected by looking at the
mahalonobis distance, in that table the data is referred to as outliers if the mahalanobis
d-squared value exceeds 61.098, that is the Chi Square value at 31 degrees of freedom (because
there are 31 valid indicators analyzed) and a significant level of 0.001 . Outlier detection results
in the following table show that of the 205 analyzed data there are no data that have an
expensive aerobic distance above 61.098, this shows that there are no outliers in the analyzed
data. All data can be analyzed using SEM analysis.
b) Normality test
Normality Test in SEM analysis is intended to determine whether or not the research
distribution is normal for each variable. Evaluation of normality is done by looking at the value
of c.r skewness or kurtosis both univariate and univariate, the data are said to be normally
distributed if the value of c.r skewness or c.r kurtosis is below the absolute price of 2.58
(Ghozali; 2016), the value of multivariate c.r at below 8 can still be accepted and the analysis
can continue as long as all indicators have c.r kurtosis values < in vulnerable -2.58 < z <2.58.
The following are the results of normality test data on the model:
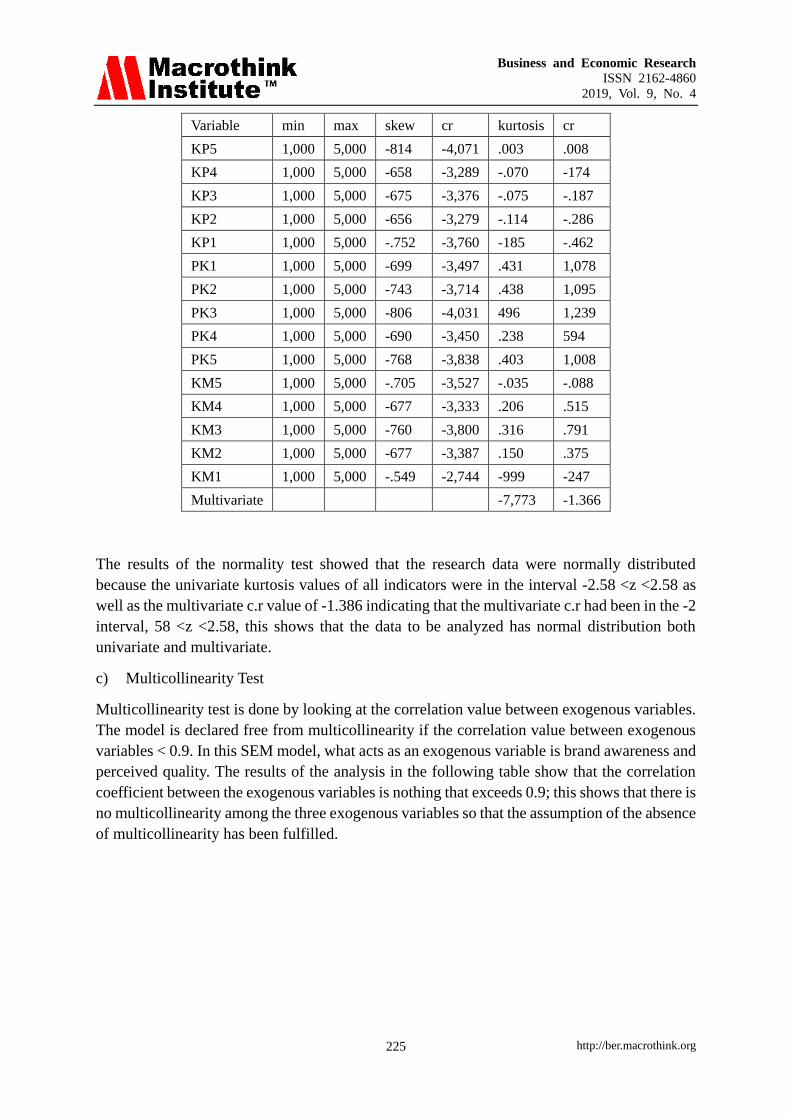
Table 18. Assessment of normality
Variable min max skew cr kurtosis cr
KK5 1,000 5,000 -1,021 -5,106 .779 1,949
KK4 1,000 5,000 -690 -3,452 -.127 -.319
KK3 1,000 5,000 -878 -4,391 .471 1,177
KK2 1,000 5,000 -800 -4,002 .281 703
KK1 1,000 5,000 -854 -4,269 .300 .750
Business and Economic Research
ISSN 2162-4860
2019, Vol. 9, No. 4
http://ber.macrothink.org 225
Variable min max skew cr kurtosis cr
KP5 1,000 5,000 -814 -4,071 .003 .008
KP4 1,000 5,000 -658 -3,289 -.070 -174
KP3 1,000 5,000 -675 -3,376 -.075 -.187
KP2 1,000 5,000 -656 -3,279 -.114 -.286
KP1 1,000 5,000 -.752 -3,760 -185 -.462
PK1 1,000 5,000 -699 -3,497 .431 1,078
PK2 1,000 5,000 -743 -3,714 .438 1,095
PK3 1,000 5,000 -806 -4,031 496 1,239
PK4 1,000 5,000 -690 -3,450 .238 594
PK5 1,000 5,000 -768 -3,838 .403 1,008
KM5 1,000 5,000 -.705 -3,527 -.035 -.088
KM4 1,000 5,000 -677 -3,333 .206 .515
KM3 1,000 5,000 -760 -3,800 .316 .791
KM2 1,000 5,000 -677 -3,387 .150 .375
KM1 1,000 5,000 -.549 -2,744 -999 -247
Multivariate -7,773 -1.366
The results of the normality test showed that the research data were normally distributed
because the univariate kurtosis values of all indicators were in the interval -2.58 <z <2.58 as
well as the multivariate c.r value of -1.386 indicating that the multivariate c.r had been in the -2
interval, 58 <z <2.58, this shows that the data to be analyzed has normal distribution both
univariate and multivariate.
c) Multicollinearity Test
Multicollinearity test is done by looking at the correlation value between exogenous variables.
The model is declared free from multicollinearity if the correlation value between exogenous
variables < 0.9. In this SEM model, what acts as an exogenous variable is brand awareness and
perceived quality. The results of the analysis in the following table show that the correlation
coefficient between the exogenous variables is nothing that exceeds 0.9; this shows that there is
no multicollinearity among the three exogenous variables so that the assumption of the absence
of multicollinearity has been fulfilled.

Business and Economic Research
ISSN 2162-4860
2019, Vol. 9, No. 4
http://ber.macrothink.org 226
Table 19. Multicollinearity test
Estimate
KM <--> PK 704
d) Test of significance
The significance test aims to examine whether there is a significant influence of exogenous
variables on endogenous variables.
Table 19. Regression Weights
Estimate SE CR P. Label
KP<---KM .232 .111 2,100 .036 par_25
KP<---PK .386 102 3,800 *** par_26
KK<---KP 296 .106 2,783 .005 par_29
KK<---KM 102 .123 .829 .407 par_30
KK<---PK .312 .119 2,625 .009 par_31
Based on the SEM analysis results in the table, the following results are obtained:
1) The value of p value of the influence of brand awareness variables on purchasing
decisions (KM KP) is significant (p value = 0.036) with c.r positive sign of 2.100.
Because the p value obtained <0.05 and c.r is positive> 1.96, Ho is rejected and it is
concluded that brand awareness has a positive and significant effect on purchasing
decisions. This shows that the higher the consumer's brand awareness, the higher the
purchase decision, and vice versa.
2) The p value of the influence of brand awareness variables on customer satisfaction (KM
KK) is significant (p value = 0.407) with c.r of 0.829. Because the p value obtained >
0.05 and c.r <1.96, Ho is not rejected and it is concluded that brand awareness has no
significant effect on purchasing decisions. This shows that brand awareness cannot
directly affect customer satisfaction.
3) The p value of the influence of the variable perceived quality of purchase decisions (PK
KP) is significant (p value = ***) with a positive c.r marking of 3,800. Because the
value of p value obtained <0.05 and c.r is positive> 1.96, Ho is rejected and it is concluded
that perceived quality has a positive and significant effect on purchasing decisions. This
shows that the higher the perception of consumer quality, the higher the purchase decision,
and vice versa.
4) The p value of the influence of the variable perceived quality of customer satisfaction (PK
KK) is significant (p value = 0.009) with c.r having a positive sign of 2.625. Because the
p value obtained <0.05 and c.r is positive> 1.96, Ho is rejected and it is concluded that

Business and Economic Research
ISSN 2162-4860
2019, Vol. 9, No. 4
http://ber.macrothink.org 227
perceived quality has a significant effect on purchasing decisions. This shows that the
higher the consumer's perception of product quality, the higher the consumer's purchasing
decisions, and vice versa.
5) The p value of the effect of the brand loyalty variable on consumer satisfaction (PK KK)
is significant (p value = 0.009) with c.r having a positive sign of 2.625. Because the p
value obtained <0.05 and c.r is positive > 1.96, Ho is rejected and it is concluded that
brand loyalty has a significant effect on purchasing decisions. This shows that the higher
the consumer's brand loyalty, the higher the consumer's purchasing decisions, and vice
versa.
e) Direct and indirect effects
The purchase decision variable acts as an intervening variable that mediates the indirect effect
of brand awareness variables, perceived quality, brand loyalty and brand associations on
consumer satisfaction.
Table 20. Direct and indirect effects
PK KM KP KK
KP .318 .202 .000 .000
KK 297 102 342 .000
Table 21. Standardized indirect effects
PK KM KP KK
KP .000 .000 .000 .000
KK 109 .069 .000 .000
Based on the test results above, obtained the following results:
1) The direct effect of brand awareness on consumer satisfaction is 0.108 (not significant),
while the indirect effect of brand awareness on consumer satisfaction mediated by
purchasing decisions is 0.071 (significant). Based on the test results, the direct effect is not
significant while the significant direct effect is significant, which means that the brand
awareness variable cannot directly influence customer satisfaction, but indirectly, the brand
awareness variable can affect customer satisfaction. High brand awareness then followed
by high consumer purchasing decisions can indicate high consumer satisfaction, while high
brand awareness without being followed by consumer purchasing decisions cannot indicate
high or low customer satisfaction.
2) The magnitude of the direct effect of perceived quality on consumer satisfaction is 0.297
(significant), while the indirect effect of perceived quality on consumer satisfaction
mediated by purchasing decisions is 0.109 (significant). Based on the test results, the
significant direct effect is significant as well as the significant direct effect which means

Business and Economic Research
ISSN 2162-4860
2019, Vol. 9, No. 4
http://ber.macrothink.org 228
that the variable perceived quality can affect customer satisfaction both directly and
indirectly.
f) Hypothesis testing
Hypothesis testing with the aim to find out the relationship between the hypothesized variable
and the level of significance of causality between the variables shown in the following table:
Table 22. Hypothesis Testing (Yamaha motorbike)
Variable P-value Direct
Effect
Indirect
Effect
Total
Effect Exogenous Intervening Endogenous
KM - KK 0.407 0.102 0.069 0.171
PK - KK 0.009 0.297 0.109 0.406
KM - KP 0.036 0.202 0,000 0.202
PK - KP *** 0.318 0,000 0.318
KM KP KK 0.09427 0.202 0.069 0.271
PK KP KK 0.02464 0.318 0.109 0.427
KP - KK 0.005 0.342 0,000 0.342
The hypothesis testing and the value of the path coefficient of direct and indirect influence,
show that there are nine models of relationships or direct effects and four relationships or
indirect effects produced are as follows:
1) Brand awareness has a p-value of 0.407 > 0.05. Thus brand awareness has a positive but not
significant effect on customer satisfaction. Accordingly, the first hypothesis of this study
was rejected.
2) Quality perception has a p-value of 0.009 <0.05. Thus the perception of quality has a
positive and significant effect on customer satisfaction. Accordingly, the second hypothesis
of this study was accepted at the 95% confidence level.
3) Brand awareness has a p-value of 0.036 <0.05. Thus brand awareness has a positive and
significant effect on purchasing decisions. Accordingly, the fifth hypothesis of this study
was accepted at the 95% confidence level.
4) Quality perception has a p-value of 0,000 <0.05. Thus the perception of quality has a
positive and significant effect on purchasing decisions. Accordingly, the sixth hypothesis
of this study was accepted at the 95% confidence level.
5) Brand awareness through purchasing decisions has a p-value of 0.09427> 0.05. Thus brand
awareness has an indirect, positive but not significant effect on customer satisfaction.
Accordingly, the ninth hypothesis of this study was rejected.
6) Quality perception through purchasing decisions has a p-value of 0.02464 <0.05. Thus the
perception of quality has an indirect, positive and significant effect on customer
satisfaction. Accordingly, the tenth hypothesis of this study was accepted at the 95%

Business and Economic Research
ISSN 2162-4860
2019, Vol. 9, No. 4
http://ber.macrothink.org 229
confidence level.
7) The purchase decision has a p-value of 0.005 <0.05. Thus the purchase decision has a
positive and significant effect on customer satisfaction. Accordingly, the thirteenth
hypothesis of this study was accepted at the 95% confidence level.
5. Conclusion
1. Honda Motorcycle Products
a) Brand awareness directly cannot significantly influence customer satisfaction on
Honda motorbike products. This is because respondents stated that brand awareness
on Honda motorcycles does not guarantee consumers will be satisfied just by knowing
and remembering the brand of the motorbike.
b) Quality perception has a significant effect on purchasing decisions. This shows that
the higher the consumer's perception of product quality, the higher the consumer's
purchasing decisions, and vice versa. Therefore, the respondents stated that the
perception of quality in the Honda motorbike highly ensures the consumer will be
satisfied just by looking at and considering the motor model.
2. Yamaha Motorcycle Products
a) Brand awareness does not significantly influence the purchase decision. This shows
that brand awareness can’t directly affect consumer satisfaction with Yamaha
motorcycle products. This is because respondents stated that brand awareness on
Yamaha motorcycles does not guarantee consumers will be satisfied just by knowing
and remembering the brand of the motorbike.
b) Quality perception significantly influences the purchase decision. This shows that the
higher the consumer's perception of product quality, the higher the consumer's
purchasing decisions, and vice versa. Therefore, the respondent stated that the
perception of quality on Yamaha motorbikes would guarantee consumers would be
satisfied just by seeing and remembering the model of the motorbike.
References
Aaker, D. A. (1991). Brand Equity Management, utilizing the value of a brand. Jakarta: Main
Partners
Aaker, D. A. (2013). Marketing Management Strategy. Eighth Edition. Salemba Four.
Jakarta.
Basir, M., Modding, B., Kamase, J., & Hasan, S. (2015). Effect of Service Quality,
Orientation Services, and Pricing on Loyalty and Customer Satisfaction on Marine
Transportation Services. International Journal of Humanities and Social Science
Invention, 4(6), 1-6.
Buchari, A. (2013). Marketing Management and Marketing Services. Revised Edition.
Bandung. CV Alfabeta

Business and Economic Research
ISSN 2162-4860
2019, Vol. 9, No. 4
http://ber.macrothink.org 230
Ferdinand, A. (2006). Management Research Methods. Semarang: Agency. Diponegoro
University Publisher.
Ghozali, I. (2016). Multivariete Analysis Application with the IBM SPSS 23 Program (Issue
8). Prints to eighth. Semarang: Diponegoro University Publisher Agency.
Haming, Murdifin., Ramlawati & Mangkona, Suriyanti., (2017). Operation Research
Optimal Decision-Making Techniques. Publisher Earth Characters
Kotler, P., & Armstrong, G. (2009). Marketing Principles. Issue 12, Volume 2, Jakarta:
Erlangga
Kotler, P., & Gary, A. (2010). Principles of Marketing. 13th Edition.Prentice-Hall, Inc. New
Jersey
Kotler, P., & Keller, K. L. (2016). Marketing Management, 15th Edition, Pearson Education,
Inc.
Kotler, P. (2009). Marketing Management. Jakarta: Erlangga.
Kotler, P. (2011). Marketing Management in Indonesia: Analysis, Planning,. Implementation
and Control. Jakarta: Salemba Empat Publisher.
Kotler, P. (2013). Marketing Management. Volume 2, Publisher: Jakarta, Erlangga
Kotler. P. (2011). Marketing Management. Volume 2. Earth Literacy. Jakarta.
Mokhtar, S., & Sjahruddin, H. (2019). An examination of the relationships between customer
relationship management quality, service quality, customer satisfaction and customer loyalty:
The case of five star hotels. Advances in Social Sciences Research Journal, 6(2), 524-540.
https://doi.org/10.14738/assrj.62.6202
Peter, J. P., & Olson, J. C. (2008). Consumer behavior and marketing strategy (8th ed.).
Singapore: McGraw-Hill.
Razak, N., Themba, O. S., & Sjahruddin, H. (2019). Brand awareness as predictors of
repurchase intention: Brand attitude as a moderator. Advances in Social Sciences Research
Journal, 6(2). https://doi.org/10.14738/assrj.62.6264
Surachman (2008). Fundamentals of Brand Management (Marketing Tools to Win
Competition). Malang: Bayumedia Publishing
Tjiptono, F. (2011). Service Management Realizing Prime Service. Edition 2. Yogyakarta:
Andi.
Copyright Disclaimer
Copyright for this article is retained by the author(s), with first publication rights granted to
the journal.
This is an open-access article distributed under the terms and conditions of the Creative
Commons Attribution license (http://creativecommons.org/licenses/by/3.0/).